Notebookcheck Logo

GMK NucBox K6 mini PC recension: Lika kraftfull som de senaste bärbara Intel Core Ultra-datorerna
Passar perfekt för AMD Zen 4.

Minidatorn levereras med 16 GB RAM-minne, 1 TB lagringsutrymme och en kraftfull Ryzen 7 7840HS för under 500 USD för att vara ett attraktivt alternativ till Intel NUC. Det finns säkert några nackdelar, men de bleknar i jämförelse med den längre listan över styrkor.
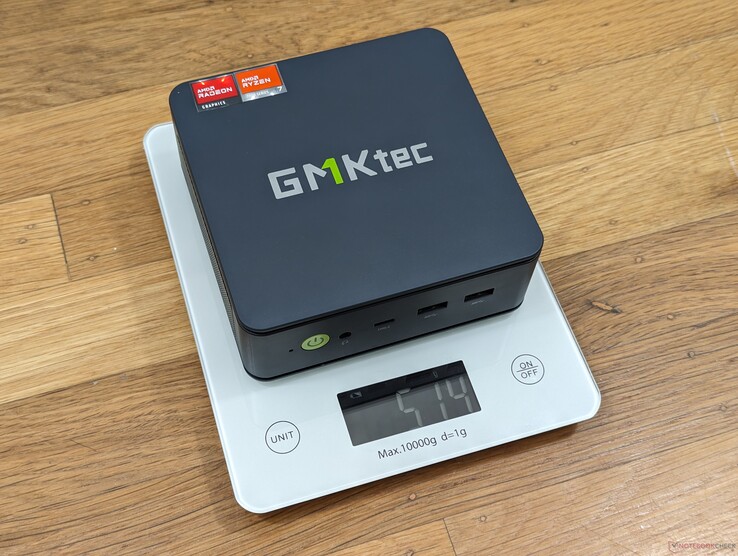
GMKtec NucBox K6 mini-PC

GMK NucBox K6 är en av företagets nyaste minidatorer för multimedia och streaming i hemmet. Den konkurrerar direkt med Intel NUC och Beelink minidatorer i prisklassen 500 USD.

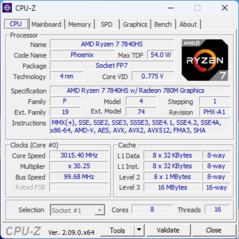
Alla nuvarande konfigurationer levereras med AMD Ryzen 7 7840HS Zen 4 CPU med integrerad Radeon 780M-grafik. Barebone SKU:er finns tillgängliga från $400 upp till $730 om de konfigureras med 32 GB RAM, 1 TB lagringsutrymme och Windows 11 Pro förinstallerat. Alternativ till NucBox K6 inkluderar Intel NUC 13 Pro, Beelink SER5eller Geekom A7.

Fler recensioner av GMKtec:

GMK NucBox K6
Processor
AMD Ryzen 7 7840HS 8 x 3.8 - 5.1 GHz, 54 W PL2 / Short Burst, 52 W PL1 / Sustained, Phoenix-HS (Zen 4)
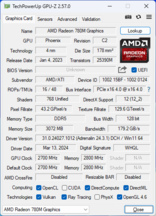
Grafikkort
AMD Radeon 780M, Kärna: 2700 MHz, Minne: 2800 MHz, DDR5, 31.0.24027.1012
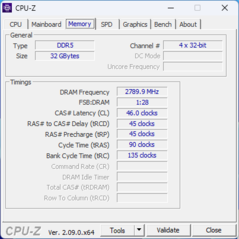
Minne
32 GB 
, DDR5-5600, 46-45-45-90, Dual-Channel
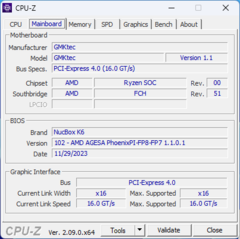
Moderkort
AMD Promontory/Bixby FCH
Hårddisk
MasonSemi 1TB MC7000, 1024 GB 
Ljudkort
AMD Zen - Audio Processor - HD Audio Controller
Anslutningar
1 USB 2.0, 2 USB 3.0, 1 USB 3.1 Gen2, 1 USB 4.0 40 Gbps, 1 Thunderbolt, 1 HDMI, 2 DisplayPort, 1 Kensingtonlås, Ljudanslutningar: 3.5 mm headset
Nätverk
Realtek RTL8125 2.5GBe Family Ethernet Controller (10/100/1000/2500MBit/s), MediaTek RZ616 (a/b/g/n = Wi-Fi 4/ac = Wi-Fi 5/ax = Wi-Fi 6/ Wi-Fi 6E 6 GHz), Bluetooth 5.3
Storlek
höjd x bredd x djup (i mm) 47 x 128 x 126
Operativsystem
Microsoft Windows 11 Pro
Övrigt
VESA bracket, screws, HDMI cable, 12 Månader Garanti
Vikt
514 g, Strömförsörjning: 502 g
Pris
580 USD
Note: The manufacturer may use components from different suppliers including display panels, drives or memory sticks with similar specifications.


Potentiella konkurrenter i jämförelse

Rating
Date
Model
Weight
Height
Size
Resolution
Price
83.6 %
v7 (old)
04/2024
GMK NucBox K6
R7 7840HS, Radeon 780M
514 g47 mmx
82.8 %
v7 (old)
10/2023
GMK NucBox K3 Pro
i7-12650H, UHD Graphics 64EUs
396 g43.2 mmx
83.1 %
v7 (old)
08/2023
Intel NUC 13 Pro Desk Edition Kit
i7-1360P, Iris Xe G7 96EUs
558 g37 mmx
82.1 %
v7 (old)
11/2023
Beelink SER5
R5 5560U, Vega 6
439 g42 mmx
85.2 %
v7 (old)
04/2024
AcePC Wizbox AI
Ultra 7 155H, Arc 8-Core
840 g55.55 mmx
82.6 %
v7 (old)
03/2024
Geekom A7
R9 7940HS, Radeon 780M
417 g38 mmx

Fall

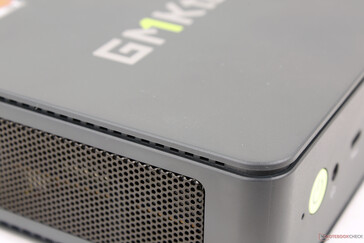
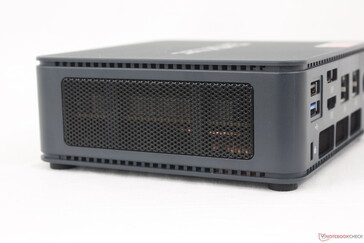
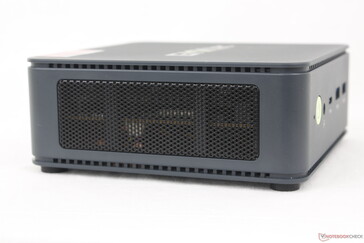
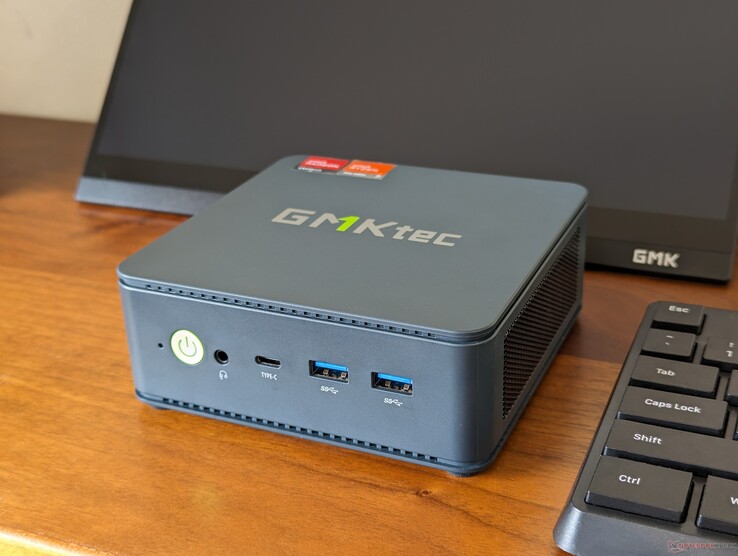
Chassit består av plast för topp och botten med metall för sidorna eller ytorna ungefär som på tidigare generationers modeller. Nytt för i år är dock ventilationsöppningarna längs sidorna, vilket framgår av bilden nedan. Detta tillvägagångssätt gör att toppen är hålfri och mer synligt tilltalande utan att minska luftflödet eller kylningen.

Den totala storleken och vikten är något större respektive lättare än Intel NUC 13 Pro. Det tunnare chassit använder mindre metall än en Intel NUC, vilket gör NucBox K6 något mer känslig för skador. Detta är dock inget problem, eftersom vi inte ser många köpare som hanterar minidatorn som om den vore en bärbar resedator.

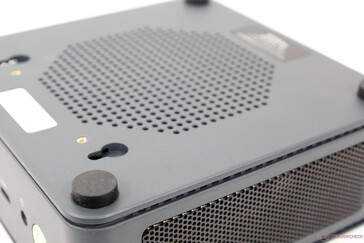
Ventilationsöppningar längs omkretsen på ovansidan och undersidan
VESA-monteringsstöd på bottenplattan
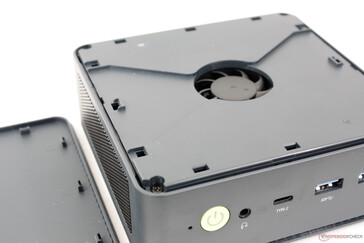
Topplattan kan enkelt tas bort för att exponera toppfläkten
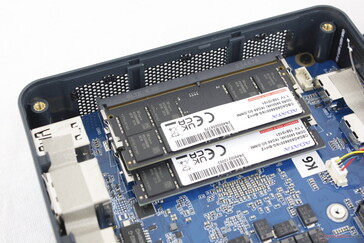
Löstagbara 2x RAM-moduler

Storleksjämförelse

147 mm 147 mm 55.55 mm 840 g128 mm 126 mm 47 mm 514 g126 mm 113 mm 42 mm 439 g123 mm 112 mm 43.2 mm 396 g117 mm 112 mm 37 mm 558 g112 mm 112 mm 38 mm 417 g210 mm 148 mm 1 mm 2.9 g

Anslutningsmöjligheter

Portalternativen är varierande beroende på preferenser. Jämfört med Intel NUC 13 Pro, till exempel, har GMK fler RJ-45-portar och en DisplayPort i full storlek. Å andra sidan har den bara en enda USB-C-port medan Intel-modellen har två.

Thunderbolt-enheter stöds via USB-C 4-porten. Det är också möjligt att driva minidatorn med USB-C AC-adaptrar från tredje part istället för att förlita sig på den egna fatadaptern; vår 135 W USB-C AC-adapter från Lenovo skulle fungera utan problem.

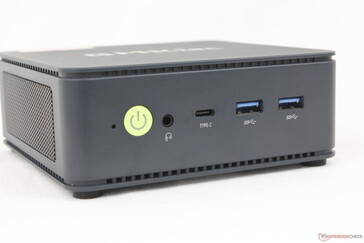
Framsida: Strömknapp, 3,5 mm headset, USB-C 4.0 m/ Power Delivery + DisplayPort, 2x USB-A 3.2 Gen. 2
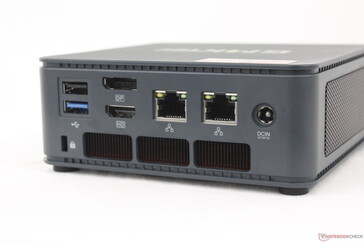
Bakre: USB-A 2.0, USB-A 3.2 Gen. 1, DisplayPort (4K60), HDMI 2.0 (4K60), 2x RJ-45 (2,5 Gbps), nätadapter, Kensingtonlås
Rätt: Inga portar
Rätt: Inga portar
Vänster: Inga portar

Kommunikation

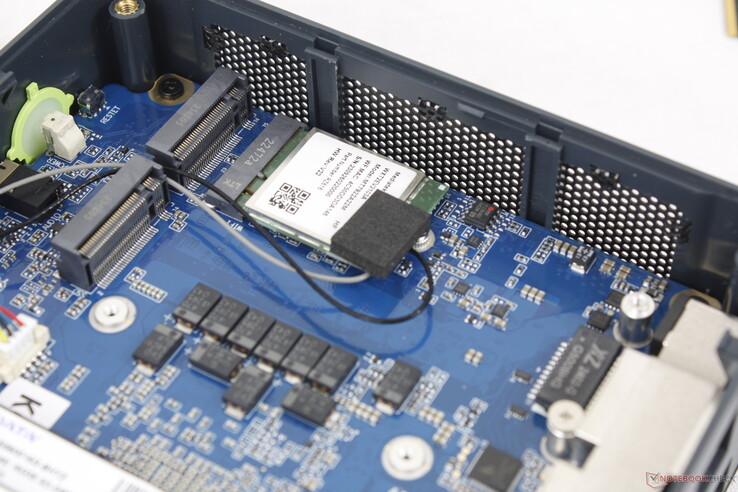
Den AMD-exklusiva maskinen levereras med MediaTek RZ616 istället för den vanliga Intel AX-lösningen för Wi-Fi 6E och Bluetooth 5.3-anslutning. Prestandan är stabil och pålitlig, om än med långsammare överföringshastigheter.

Avtagbar WLAN-modul
Avtagbar WLAN-modul
Networking
iperf3 transmit AXE11000
Intel NUC 13 Pro Desk Edition Kit
Intel Wi-Fi 6E AX211
1301 (514min - 1422max) MBit/s +105%
Beelink SER5
Intel Wi-Fi 6 AX200
1278 (649min - 1345max) MBit/s +102%
GMK NucBox K3 Pro
Intel Wi-Fi 6 AX201
1171 (923min - 1342max) MBit/s +85%
AcePC Wizbox AI
Intel Wi-Fi 7 BE200 320MHz
892 (728min - 980max) MBit/s +41%
Geekom A7
MediaTek Wi-Fi 6E MT7922 160MHz Wireless LAN Card
831 (755min - 940max) MBit/s +31%
GMK NucBox K6
MediaTek RZ616
634 (574min - 685max) MBit/s
iperf3 receive AXE11000
Beelink SER5
Intel Wi-Fi 6 AX200
1411 (1230min - 1580max) MBit/s +15%
GMK NucBox K3 Pro
Intel Wi-Fi 6 AX201
1297 (1164min - 1393max) MBit/s +6%
GMK NucBox K6
MediaTek RZ616
1222 (1074min - 1368max) MBit/s
Intel NUC 13 Pro Desk Edition Kit
Intel Wi-Fi 6E AX211
1117 (884min - 1368max) MBit/s -9%
AcePC Wizbox AI
Intel Wi-Fi 7 BE200 320MHz
963 (950min - 971max) MBit/s -21%
Geekom A7
MediaTek Wi-Fi 6E MT7922 160MHz Wireless LAN Card
858 (827min - 886max) MBit/s -30%
iperf3 transmit AXE11000 6GHz
AcePC Wizbox AI
Intel Wi-Fi 7 BE200 320MHz
1646 (1280min - 1762max) MBit/s +281%
Intel NUC 13 Pro Desk Edition Kit
Intel Wi-Fi 6E AX211
1511 (1451min - 1552max) MBit/s +250%
Geekom A7
MediaTek Wi-Fi 6E MT7922 160MHz Wireless LAN Card
1367 (1268min - 1443max) MBit/s +216%
GMK NucBox K6
MediaTek RZ616
432 (212min - 471max) MBit/s
iperf3 receive AXE11000 6GHz
AcePC Wizbox AI
Intel Wi-Fi 7 BE200 320MHz
1634 (750min - 1729max) MBit/s +66%
Intel NUC 13 Pro Desk Edition Kit
Intel Wi-Fi 6E AX211
1448 (1357min - 1490max) MBit/s +47%
Geekom A7
MediaTek Wi-Fi 6E MT7922 160MHz Wireless LAN Card
1375 (688min - 1438max) MBit/s +40%
GMK NucBox K6
MediaTek RZ616
984 (937min - 1048max) MBit/s
05010015020025030035040045050055060065070075080085090095010001050110011501200125013001350Tooltip
GMK NucBox K6; iperf3 transmit AXE11000; iperf 3.1.3: Ø633 (574-685)
GMK NucBox K6; iperf3 receive AXE11000; iperf 3.1.3: Ø1221 (1074-1368)

Underhåll

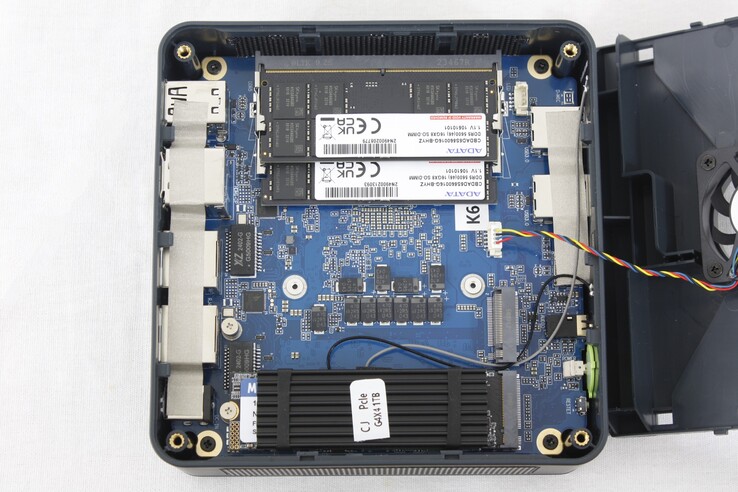
Uppgraderbara komponenter är åtkomliga från ovansidan men inte från undersidan till skillnad från de flesta andra mini-PC. Medan det yttre locket kan tas bort utan verktyg, kräver fläktkåpan undertill fortfarande en skruvmejsel.

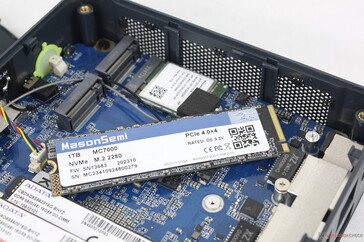
Användare har direkt tillgång till två SODIMM RAM-kortplatser, WLAN-modul och två M.2 PCIe4 x4 2280 SSD-kortplatser, vilket framgår av bilden nedan. Det finns inget stöd för 2,5-tums SATA III. För att komma åt kylningslösningen, processorn och den sekundära fläkten måste moderkortet vändas.

Moderkort med yttre plåt och fläktkåpa borttagna

Tillbehör och garanti

Förpackningen innehåller en HDMI-kabel och ett löstagbart VESA-fäste med skruvar. Den ettåriga begränsade standardgarantin från tillverkaren gäller vid köp i USA.

Prestanda - AMD Zen 4 är fortfarande mycket kraftfull


Villkor för testning

Vi ställde in Windows på prestandaläge innan vi körde riktmärkena nedan. Det finns inga förinstallerade applikationer för en ren Windows-användarupplevelse.

Processor

Ryzen 7 Ryzen 7 7840HS går bra utan några större problem med strypning, inte ens vid stresstestning. Det är fortfarande en av de snabbaste processorerna för minidatorer i NUC-storlek. Övergripande prestanda är jämförbar med den dyrare Ryzen 9 7940HS och konkurrerande Core i7-13700H i Lenovo IdeaCentre Mini.

Cinebench R15 Multi Loop

0135270405540675810945108012151350148516201755189020252160229524302565Tooltip
GMK NucBox K6 AMD Ryzen 7 7840HS: Ø2520 (2510.2-2537.27)
GMK NucBox K3 Pro Intel Core i7-12650H: Ø1420 (1391.69-1691.83)
Intel NUC 13 Pro Desk Edition Kit Intel Core i7-1360P: Ø1753 (1686.77-2083.33)
Beelink SER5 AMD Ryzen 5 5560U: Ø1274 (1263.74-1280.29)
AcePC Wizbox AI Intel Core Ultra 7 155H: Ø2303 (2192.5-2638.35)
Geekom A7 AMD Ryzen 9 7940HS: Ø2410 (2285.58-2581.81)
Cinebench R23: Multi Core | Single Core
Cinebench R20: CPU (Multi Core) | CPU (Single Core)
Cinebench R15: CPU Multi 64Bit | CPU Single 64Bit
Blender: v2.79 BMW27 CPU
7-Zip 18.03: 7z b 4 | 7z b 4 -mmt1
Geekbench 6.3: Multi-Core | Single-Core
Geekbench 5.5: Multi-Core | Single-Core
HWBOT x265 Benchmark v2.2: 4k Preset
LibreOffice : 20 Documents To PDF
R Benchmark 2.5: Overall mean
Cinebench R23 / Multi Core
Average AMD Ryzen 7 7840HS
  (15515 - 17214, n=17)
16414 Points +3%
AcePC Wizbox AI
Intel Core Ultra 7 155H
16352 Points +3%
GMK NucBox K6
AMD Ryzen 7 7840HS
15947 (9378.75min - 15947.3max) Points
Geekom A7
AMD Ryzen 9 7940HS
15556 Points -2%
Lenovo IdeaCentre Mini 01IRH8
Intel Core i7-13700H
14465 (9293.64min - 14465.4max) Points -9%
Geekom Mini IT13
Intel Core i9-13900H
13846 (12336.6min - 13845.9max) Points -13%
Geekom Mini IT13
Intel Core i9-13900H
13817 (12209.7min - 13817.2max) Points -13%
Geekom Mini IT13
Intel Core i9-13900H
13811 Points -13%
Aoostar GOD77
AMD Ryzen 7 7735HS
13034 Points -18%
Intel NUC 13 Pro Desk Edition Kit
Intel Core i7-1360P
12155 Points -24%
Beelink GTR6
AMD Ryzen 9 6900HX
11862 (11361.7min - 11862.4max) Points -26%
Beelink SER6 Pro
AMD Ryzen 7 6800H
11481 (10813.7min - 11481.3max) Points -28%
GMK NucBox M4
Intel Core i9-11900H
11135 (10740.5min - 11134.5max) Points -30%
GMK NucBox K3 Pro
Intel Core i7-12650H
10691 (9260.68min - 10691.5max) Points -33%
Beelink SER5
AMD Ryzen 5 5560U
7667 (7546.82min - 7667.18max) Points -52%
GMK NucBox M3
Intel Core i5-12450H
7662 (7500.47min - 7661.93max) Points -52%
Acemagic Tank03
Intel Core i9-12900H
7359 Points -54%
Cinebench R23 / Single Core
Lenovo IdeaCentre Mini 01IRH8
Intel Core i7-13700H
1898 Points +7%
Intel NUC 13 Pro Desk Edition Kit
Intel Core i7-1360P
1878 Points +6%
AcePC Wizbox AI
Intel Core Ultra 7 155H
1801 Points +2%
GMK NucBox K3 Pro
Intel Core i7-12650H
1792 Points +1%
GMK NucBox K6
AMD Ryzen 7 7840HS
1770 Points
Average AMD Ryzen 7 7840HS
  (1718 - 1812, n=17)
1768 Points 0%
Geekom A7
AMD Ryzen 9 7940HS
1747 Points -1%
Geekom Mini IT13
Intel Core i9-13900H
1737 Points -2%
GMK NucBox M3
Intel Core i5-12450H
1688 Points -5%
Acemagic Tank03
Intel Core i9-12900H
1634 Points -8%
Beelink GTR6
AMD Ryzen 9 6900HX
1608 Points -9%
GMK NucBox M4
Intel Core i9-11900H
1605 Points -9%
Aoostar GOD77
AMD Ryzen 7 7735HS
1557 Points -12%
Beelink SER6 Pro
AMD Ryzen 7 6800H
1506 Points -15%
Beelink SER5
AMD Ryzen 5 5560U
1260 Points -29%
Cinebench R20 / CPU (Multi Core)
Average AMD Ryzen 7 7840HS
  (6061 - 6744, n=17)
6414 Points +3%
Geekom A7
AMD Ryzen 9 7940HS
6277 Points 0%
GMK NucBox K6
AMD Ryzen 7 7840HS
6250 Points
AcePC Wizbox AI
Intel Core Ultra 7 155H
6033 Points -3%
Lenovo IdeaCentre Mini 01IRH8
Intel Core i7-13700H
5800 Points -7%
Geekom Mini IT13
Intel Core i9-13900H
5308 Points -15%
Aoostar GOD77
AMD Ryzen 7 7735HS
5078 Points -19%
Intel NUC 13 Pro Desk Edition Kit
Intel Core i7-1360P
4687 Points -25%
Beelink GTR6
AMD Ryzen 9 6900HX
4619 Points -26%
Beelink SER6 Pro
AMD Ryzen 7 6800H
4460 Points -29%
GMK NucBox M4
Intel Core i9-11900H
4324 Points -31%
GMK NucBox K3 Pro
Intel Core i7-12650H
4058 Points -35%
Beelink SER5
AMD Ryzen 5 5560U
3019 Points -52%
GMK NucBox M3
Intel Core i5-12450H
2952 Points -53%
Acemagic Tank03
Intel Core i9-12900H
2681 Points -57%
Cinebench R20 / CPU (Single Core)
Intel NUC 13 Pro Desk Edition Kit
Intel Core i7-1360P
723 Points +5%
Lenovo IdeaCentre Mini 01IRH8
Intel Core i7-13700H
721 Points +5%
Geekom A7
AMD Ryzen 9 7940HS
692 Points +1%
GMK NucBox K3 Pro
Intel Core i7-12650H
691 Points 0%
GMK NucBox K6
AMD Ryzen 7 7840HS
688 Points
Average AMD Ryzen 7 7840HS
  (661 - 705, n=17)
686 Points 0%
AcePC Wizbox AI
Intel Core Ultra 7 155H
681 Points -1%
Geekom Mini IT13
Intel Core i9-13900H
664 Points -3%
GMK NucBox M3
Intel Core i5-12450H
646 Points -6%
Beelink GTR6
AMD Ryzen 9 6900HX
631 Points -8%
Acemagic Tank03
Intel Core i9-12900H
624 Points -9%
GMK NucBox M4
Intel Core i9-11900H
615 Points -11%
Aoostar GOD77
AMD Ryzen 7 7735HS
599 Points -13%
Beelink SER6 Pro
AMD Ryzen 7 6800H
584 Points -15%
Beelink SER5
AMD Ryzen 5 5560U
498 Points -28%
Cinebench R15 / CPU Multi 64Bit
AcePC Wizbox AI
Intel Core Ultra 7 155H
2638 (2192.5min - 2638.35max) Points +4%
Average AMD Ryzen 7 7840HS
  (2473 - 2729, n=17)
2598 Points +2%
GMK NucBox K6
AMD Ryzen 7 7840HS
2537 (2510.2min - 2537.27max) Points
Geekom Mini IT13
Intel Core i9-13900H
2531 Points 0%
Geekom Mini IT13
Intel Core i9-13900H
2061 (1694.13min - 2060.69max) Points -19%
Geekom A7
AMD Ryzen 9 7940HS
2470 Points -3%
Lenovo IdeaCentre Mini 01IRH8
Intel Core i7-13700H
2240 (1862.02min - 2240.14max) Points -12%
Aoostar GOD77
AMD Ryzen 7 7735HS
2077 Points -18%
Intel NUC 13 Pro Desk Edition Kit
Intel Core i7-1360P
1990 Points -22%
Beelink GTR6
AMD Ryzen 9 6900HX
1969 (1894.3min - 1968.5max) Points -22%
Beelink SER6 Pro
AMD Ryzen 7 6800H
1931 (1821.83min - 1930.5max) Points -24%
GMK NucBox M4
Intel Core i9-11900H
1770 (1710.13min - 1769.75max) Points -30%
GMK NucBox K3 Pro
Intel Core i7-12650H
1692 (1391.69min - 1691.83max) Points -33%
Acemagic Tank03
Intel Core i9-12900H
1395 Points -45%
Beelink SER5
AMD Ryzen 5 5560U
1280 (1263.74min - 1280.29max) Points -50%
GMK NucBox M3
Intel Core i5-12450H
1150 (1101.32min - 1149.92max) Points -55%
Cinebench R15 / CPU Single 64Bit
GMK NucBox K6
AMD Ryzen 7 7840HS
280 Points
Geekom A7
AMD Ryzen 9 7940HS
278 Points -1%
Average AMD Ryzen 7 7840HS
  (270 - 286, n=17)
278 Points -1%
Intel NUC 13 Pro Desk Edition Kit
Intel Core i7-1360P
267 Points -5%
Beelink GTR6
AMD Ryzen 9 6900HX
260 Points -7%
Lenovo IdeaCentre Mini 01IRH8
Intel Core i7-13700H
260 Points -7%
GMK NucBox K3 Pro
Intel Core i7-12650H
256 Points -9%
AcePC Wizbox AI
Intel Core Ultra 7 155H
251 Points -10%
Geekom Mini IT13
Intel Core i9-13900H
248 Points -11%
Geekom Mini IT13
Intel Core i9-13900H
247 Points -12%
Aoostar GOD77
AMD Ryzen 7 7735HS
248 Points -11%
GMK NucBox M4
Intel Core i9-11900H
243 Points -13%
Beelink SER6 Pro
AMD Ryzen 7 6800H
242 Points -14%
GMK NucBox M3
Intel Core i5-12450H
238 Points -15%
Acemagic Tank03
Intel Core i9-12900H
235 Points -16%
Beelink SER5
AMD Ryzen 5 5560U
202 Points -28%
Blender / v2.79 BMW27 CPU
Acemagic Tank03
Intel Core i9-12900H
451 Seconds * -127%
GMK NucBox M3
Intel Core i5-12450H
429 Seconds * -116%
Beelink SER5
AMD Ryzen 5 5560U
392 Seconds * -97%
GMK NucBox K3 Pro
Intel Core i7-12650H
330 Seconds * -66%
GMK NucBox M4
Intel Core i9-11900H
270 Seconds * -36%
Beelink SER6 Pro
AMD Ryzen 7 6800H
268 Seconds * -35%
Intel NUC 13 Pro Desk Edition Kit
Intel Core i7-1360P
268 Seconds * -35%
Geekom Mini IT13
Intel Core i9-13900H
268 Seconds * -35%
Beelink GTR6
AMD Ryzen 9 6900HX
257 Seconds * -29%
Aoostar GOD77
AMD Ryzen 7 7735HS
246 Seconds * -24%
Lenovo IdeaCentre Mini 01IRH8
Intel Core i7-13700H
216 Seconds * -9%
AcePC Wizbox AI
Intel Core Ultra 7 155H
205 Seconds * -3%
Geekom A7
AMD Ryzen 9 7940HS
202 Seconds * -2%
GMK NucBox K6
AMD Ryzen 7 7840HS
199 Seconds *
Average AMD Ryzen 7 7840HS
  (185 - 229, n=18)
198.6 Seconds * -0%
7-Zip 18.03 / 7z b 4
GMK NucBox K6
AMD Ryzen 7 7840HS
70782 MIPS
Geekom A7
AMD Ryzen 9 7940HS
70707 MIPS 0%
Average AMD Ryzen 7 7840HS
  (59538 - 73035, n=18)
69127 MIPS -2%
AcePC Wizbox AI
Intel Core Ultra 7 155H
62334 MIPS -12%
Aoostar GOD77
AMD Ryzen 7 7735HS
58770 MIPS -17%
Beelink GTR6
AMD Ryzen 9 6900HX
57261 MIPS -19%
Beelink SER6 Pro
AMD Ryzen 7 6800H
55963 MIPS -21%
Lenovo IdeaCentre Mini 01IRH8
Intel Core i7-13700H
54733 MIPS -23%
Intel NUC 13 Pro Desk Edition Kit
Intel Core i7-1360P
51340 MIPS -27%
GMK NucBox M4
Intel Core i9-11900H
49486 MIPS -30%
Geekom Mini IT13
Intel Core i9-13900H
45045 MIPS -36%
GMK NucBox K3 Pro
Intel Core i7-12650H
43031 MIPS -39%
Beelink SER5
AMD Ryzen 5 5560U
38281 MIPS -46%
Acemagic Tank03
Intel Core i9-12900H
34684 MIPS -51%
GMK NucBox M3
Intel Core i5-12450H
31119 MIPS -56%
7-Zip 18.03 / 7z b 4 -mmt1
Geekom A7
AMD Ryzen 9 7940HS
6744 MIPS +1%
GMK NucBox K6
AMD Ryzen 7 7840HS
6676 MIPS
Average AMD Ryzen 7 7840HS
  (6049 - 6754, n=18)
6561 MIPS -2%
GMK NucBox M4
Intel Core i9-11900H
6018 MIPS -10%
Lenovo IdeaCentre Mini 01IRH8
Intel Core i7-13700H
6014 MIPS -10%
Beelink GTR6
AMD Ryzen 9 6900HX
6005 MIPS -10%
Aoostar GOD77
AMD Ryzen 7 7735HS
5849 MIPS -12%
Intel NUC 13 Pro Desk Edition Kit
Intel Core i7-1360P
5840 MIPS -13%
GMK NucBox K3 Pro
Intel Core i7-12650H
5772 MIPS -14%
Beelink SER6 Pro
AMD Ryzen 7 6800H
5768 MIPS -14%
Acemagic Tank03
Intel Core i9-12900H
5567 MIPS -17%
GMK NucBox M3
Intel Core i5-12450H
5356 MIPS -20%
Geekom Mini IT13
Intel Core i9-13900H
5355 MIPS -20%
AcePC Wizbox AI
Intel Core Ultra 7 155H
5344 MIPS -20%
Beelink SER5
AMD Ryzen 5 5560U
4740 MIPS -29%
Geekbench 6.3 / Multi-Core
Geekom A7
AMD Ryzen 9 7940HS
13470 Points +2%
GMK NucBox K6
AMD Ryzen 7 7840HS
13184 Points
Average AMD Ryzen 7 7840HS
  (12111 - 13538, n=18)
13025 Points -1%
AcePC Wizbox AI
Intel Core Ultra 7 155H
12539 Points -5%
GMK NucBox K3 Pro
Intel Core i7-12650H
11014 Points -16%
Intel NUC 13 Pro Desk Edition Kit
Intel Core i7-1360P
10997 Points -17%
Lenovo IdeaCentre Mini 01IRH8
Intel Core i7-13700H
10362 Points -21%
Aoostar GOD77
AMD Ryzen 7 7735HS
9970 Points -24%
GMK NucBox M4
Intel Core i9-11900H
9401 Points -29%
Acemagic Tank03
Intel Core i9-12900H
9278 Points -30%
GMK NucBox M3
Intel Core i5-12450H
8123 Points -38%
Beelink SER5
AMD Ryzen 5 5560U
6723 Points -49%
Geekbench 6.3 / Single-Core
Geekom A7
AMD Ryzen 9 7940HS
2704 Points +1%
GMK NucBox K6
AMD Ryzen 7 7840HS
2687 Points
Average AMD Ryzen 7 7840HS
  (2585 - 2721, n=18)
2662 Points -1%
Lenovo IdeaCentre Mini 01IRH8
Intel Core i7-13700H
2600 Points -3%
Intel NUC 13 Pro Desk Edition Kit
Intel Core i7-1360P
2575 Points -4%
GMK NucBox K3 Pro
Intel Core i7-12650H
2466 Points -8%
AcePC Wizbox AI
Intel Core Ultra 7 155H
2415 Points -10%
GMK NucBox M4
Intel Core i9-11900H
2355 Points -12%
GMK NucBox M3
Intel Core i5-12450H
2293 Points -15%
Acemagic Tank03
Intel Core i9-12900H
2263 Points -16%
Aoostar GOD77
AMD Ryzen 7 7735HS
2077 Points -23%
Beelink SER5
AMD Ryzen 5 5560U
1765 Points -34%
Geekbench 5.5 / Multi-Core
Geekom A7
AMD Ryzen 9 7940HS
12261 Points +4%
AcePC Wizbox AI
Intel Core Ultra 7 155H
12248 Points +4%
GMK NucBox K6
AMD Ryzen 7 7840HS
11769 Points
Average AMD Ryzen 7 7840HS
  (8446 - 12339, n=20)
11674 Points -1%
Lenovo IdeaCentre Mini 01IRH8
Intel Core i7-13700H
10361 Points -12%
Intel NUC 13 Pro Desk Edition Kit
Intel Core i7-1360P
10269 Points -13%
GMK NucBox K3 Pro
Intel Core i7-12650H
9810 Points -17%
Aoostar GOD77
AMD Ryzen 7 7735HS
9363 Points -20%
Beelink GTR6
AMD Ryzen 9 6900HX
9350 Points -21%
Beelink SER6 Pro
AMD Ryzen 7 6800H
9218 Points -22%
Geekom Mini IT13
Intel Core i9-13900H
9094 Points -23%
GMK NucBox M4
Intel Core i9-11900H
8829 Points -25%
Acemagic Tank03
Intel Core i9-12900H
8529 Points -28%
GMK NucBox M3
Intel Core i5-12450H
6990 Points -41%
Beelink SER5
AMD Ryzen 5 5560U
5955 Points -49%
Geekbench 5.5 / Single-Core
Geekom A7
AMD Ryzen 9 7940HS
2008 Points +1%
GMK NucBox K6
AMD Ryzen 7 7840HS
1986 Points
Average AMD Ryzen 7 7840HS
  (1837 - 2017, n=20)
1966 Points -1%
Geekom Mini IT13
Intel Core i9-13900H
1846 Points -7%
Lenovo IdeaCentre Mini 01IRH8
Intel Core i7-13700H
1842 Points -7%
Intel NUC 13 Pro Desk Edition Kit
Intel Core i7-1360P
1832 Points -8%
GMK NucBox K3 Pro
Intel Core i7-12650H
1790 Points -10%
AcePC Wizbox AI
Intel Core Ultra 7 155H
1720 Points -13%
GMK NucBox M4
Intel Core i9-11900H
1692 Points -15%
Acemagic Tank03
Intel Core i9-12900H
1664 Points -16%
Beelink GTR6
AMD Ryzen 9 6900HX
1652 Points -17%
GMK NucBox M3
Intel Core i5-12450H
1639 Points -17%
Aoostar GOD77
AMD Ryzen 7 7735HS
1589 Points -20%
Beelink SER6 Pro
AMD Ryzen 7 6800H
1554 Points -22%
Beelink SER5
AMD Ryzen 5 5560U
1318 Points -34%
HWBOT x265 Benchmark v2.2 / 4k Preset
Geekom A7
AMD Ryzen 9 7940HS
20.6 fps 0%
GMK NucBox K6
AMD Ryzen 7 7840HS
20.5 fps
Average AMD Ryzen 7 7840HS
  (11.7 - 21.8, n=18)
19.8 fps -3%
AcePC Wizbox AI
Intel Core Ultra 7 155H
18.3 fps -11%
Lenovo IdeaCentre Mini 01IRH8
Intel Core i7-13700H
17.6 fps -14%
Aoostar GOD77
AMD Ryzen 7 7735HS
15.7 fps -23%
Beelink GTR6
AMD Ryzen 9 6900HX
15.4 fps -25%
Beelink SER6 Pro
AMD Ryzen 7 6800H
15 fps -27%
Geekom Mini IT13
Intel Core i9-13900H
14.9 fps -27%
Intel NUC 13 Pro Desk Edition Kit
Intel Core i7-1360P
13.9 fps -32%
GMK NucBox M4
Intel Core i9-11900H
13.6 fps -34%
GMK NucBox K3 Pro
Intel Core i7-12650H
12.3 fps -40%
Beelink SER5
AMD Ryzen 5 5560U
10 fps -51%
GMK NucBox M3
Intel Core i5-12450H
8.78 fps -57%
Acemagic Tank03
Intel Core i9-12900H
8.05 fps -61%
LibreOffice / 20 Documents To PDF
Beelink SER5
AMD Ryzen 5 5560U
57.1 s * -29%
Geekom A7
AMD Ryzen 9 7940HS
54.8 s * -24%
AcePC Wizbox AI
Intel Core Ultra 7 155H
53 s * -20%
Aoostar GOD77
AMD Ryzen 7 7735HS
51.2 s * -16%
Beelink SER6 Pro
AMD Ryzen 7 6800H
48.8 s * -11%
Average AMD Ryzen 7 7840HS
  (38.3 - 68.3, n=18)
48.6 s * -10%
Intel NUC 13 Pro Desk Edition Kit
Intel Core i7-1360P
46.9 s * -6%
Beelink GTR6
AMD Ryzen 9 6900HX
46 s * -4%
GMK NucBox K6
AMD Ryzen 7 7840HS
44.1 s *
GMK NucBox M4
Intel Core i9-11900H
42.3 s * +4%
GMK NucBox M3
Intel Core i5-12450H
41.1 s * +7%
GMK NucBox K3 Pro
Intel Core i7-12650H
40 s * +9%
Acemagic Tank03
Intel Core i9-12900H
39 s * +12%
Lenovo IdeaCentre Mini 01IRH8
Intel Core i7-13700H
37.6 s * +15%
Geekom Mini IT13
Intel Core i9-13900H
36.8 s * +17%
R Benchmark 2.5 / Overall mean
Beelink SER5
AMD Ryzen 5 5560U
0.584 sec * -34%
GMK NucBox M4
Intel Core i9-11900H
0.52 sec * -20%
Aoostar GOD77
AMD Ryzen 7 7735HS
0.503 sec * -16%
Beelink SER6 Pro
AMD Ryzen 7 6800H
0.4989 sec * -15%
GMK NucBox M3
Intel Core i5-12450H
0.4949 sec * -14%
Acemagic Tank03
Intel Core i9-12900H
0.4934 sec * -14%
AcePC Wizbox AI
Intel Core Ultra 7 155H
0.4801 sec * -11%
Geekom Mini IT13
Intel Core i9-13900H
0.4792 sec * -10%
GMK NucBox K3 Pro
Intel Core i7-12650H
0.4701 sec * -8%
Beelink GTR6
AMD Ryzen 9 6900HX
0.4627 sec * -7%
Lenovo IdeaCentre Mini 01IRH8
Intel Core i7-13700H
0.4512 sec * -4%
Intel NUC 13 Pro Desk Edition Kit
Intel Core i7-1360P
0.45 sec * -4%
Average AMD Ryzen 7 7840HS
  (0.4184 - 0.4739, n=18)
0.4394 sec * -1%
Geekom A7
AMD Ryzen 9 7940HS
0.4351 sec * -0%
GMK NucBox K6
AMD Ryzen 7 7840HS
0.4343 sec *
Cinebench R23: Multi Core | Single Core
Cinebench R20: CPU (Multi Core) | CPU (Single Core)
Cinebench R15: CPU Multi 64Bit | CPU Single 64Bit
Blender: v2.79 BMW27 CPU
7-Zip 18.03: 7z b 4 | 7z b 4 -mmt1
Geekbench 6.3: Multi-Core | Single-Core
Geekbench 5.5: Multi-Core | Single-Core
HWBOT x265 Benchmark v2.2: 4k Preset
LibreOffice : 20 Documents To PDF
R Benchmark 2.5: Overall mean

* ... smaller is better

Cinebench R15 CPU Multi 64Bit
2537 Points
Cinebench R15 OpenGL 64Bit
235 fps
Cinebench R15 Ref. Match 64Bit
97.9 %
Cinebench R15 CPU Single 64Bit
280 Points
Cinebench R20 CPU (Multi Core)
6250 Points
Cinebench R20 CPU (Single Core)
688 Points
Cinebench R23 Multi Core
15947 Points
Cinebench R23 Single Core
1770 Points
Hjälp
Performance Rating
Geekom A7
AMD Ryzen 9 7940HS, Radeon 780M
96 pt
Average AMD Ryzen 7 7840HS
 
95.9 pt
GMK NucBox K6
AMD Ryzen 7 7840HS, Radeon 780M
95.8 pt
AcePC Wizbox AI
Intel Core Ultra 7 155H, Arc 8-Core
74.6 pt
Intel NUC 13 Pro Desk Edition Kit
Intel Core i7-1360P, Iris Xe G7 96EUs
52.6 pt
GMK NucBox K3 Pro
Intel Core i7-12650H, UHD Graphics 64EUs
51.2 pt
Beelink SER5
AMD Ryzen 5 5560U, Vega 6
45.6 pt
AIDA64 / FP32 Ray-Trace
Average AMD Ryzen 7 7840HS
  (24712 - 28921, n=19)
26587 KRay/s +5%
GMK NucBox K6
AMD Ryzen 7 7840HS, Radeon 780M
25360 KRay/s
Geekom A7
AMD Ryzen 9 7940HS, Radeon 780M
25359 KRay/s 0%
AcePC Wizbox AI
Intel Core Ultra 7 155H, Arc 8-Core
15761 KRay/s -38%
Intel NUC 13 Pro Desk Edition Kit
Intel Core i7-1360P, Iris Xe G7 96EUs
11188 KRay/s -56%
GMK NucBox K3 Pro
Intel Core i7-12650H, UHD Graphics 64EUs
9406 KRay/s -63%
Beelink SER5
AMD Ryzen 5 5560U, Vega 6
8895 KRay/s -65%
AIDA64 / FPU Julia
Average AMD Ryzen 7 7840HS
  (103755 - 123167, n=19)
113567 Points +5%
GMK NucBox K6
AMD Ryzen 7 7840HS, Radeon 780M
107805 Points
Geekom A7
AMD Ryzen 9 7940HS, Radeon 780M
107540 Points 0%
AcePC Wizbox AI
Intel Core Ultra 7 155H, Arc 8-Core
84610 Points -22%
Intel NUC 13 Pro Desk Edition Kit
Intel Core i7-1360P, Iris Xe G7 96EUs
56942 Points -47%
Beelink SER5
AMD Ryzen 5 5560U, Vega 6
56914 Points -47%
GMK NucBox K3 Pro
Intel Core i7-12650H, UHD Graphics 64EUs
48790 Points -55%
AIDA64 / CPU SHA3
Average AMD Ryzen 7 7840HS
  (4293 - 5155, n=19)
4797 MB/s +1%
GMK NucBox K6
AMD Ryzen 7 7840HS, Radeon 780M
4763 MB/s
Geekom A7
AMD Ryzen 9 7940HS, Radeon 780M
4753 MB/s 0%
AcePC Wizbox AI
Intel Core Ultra 7 155H, Arc 8-Core
4171 MB/s -12%
Intel NUC 13 Pro Desk Edition Kit
Intel Core i7-1360P, Iris Xe G7 96EUs
2669 MB/s -44%
GMK NucBox K3 Pro
Intel Core i7-12650H, UHD Graphics 64EUs
2094 MB/s -56%
Beelink SER5
AMD Ryzen 5 5560U, Vega 6
1943 MB/s -59%
AIDA64 / CPU Queen
Geekom A7
AMD Ryzen 9 7940HS, Radeon 780M
118174 Points +6%
Average AMD Ryzen 7 7840HS
  (105028 - 125820, n=19)
116128 Points +4%
GMK NucBox K6
AMD Ryzen 7 7840HS, Radeon 780M
111803 Points
AcePC Wizbox AI
Intel Core Ultra 7 155H, Arc 8-Core
87712 Points -22%
Intel NUC 13 Pro Desk Edition Kit
Intel Core i7-1360P, Iris Xe G7 96EUs
86881 Points -22%
GMK NucBox K3 Pro
Intel Core i7-12650H, UHD Graphics 64EUs
78091 Points -30%
Beelink SER5
AMD Ryzen 5 5560U, Vega 6
67352 Points -40%
AIDA64 / FPU SinJulia
Average AMD Ryzen 7 7840HS
  (13857 - 15525, n=19)
14941 Points +1%
GMK NucBox K6
AMD Ryzen 7 7840HS, Radeon 780M
14721 Points
Geekom A7
AMD Ryzen 9 7940HS, Radeon 780M
14663 Points 0%
AcePC Wizbox AI
Intel Core Ultra 7 155H, Arc 8-Core
10134 Points -31%
Beelink SER5
AMD Ryzen 5 5560U, Vega 6
8505 Points -42%
Intel NUC 13 Pro Desk Edition Kit
Intel Core i7-1360P, Iris Xe G7 96EUs
7246 Points -51%
GMK NucBox K3 Pro
Intel Core i7-12650H, UHD Graphics 64EUs
6561 Points -55%
AIDA64 / FPU Mandel
Average AMD Ryzen 7 7840HS
  (55540 - 65812, n=19)
60589 Points +5%
GMK NucBox K6
AMD Ryzen 7 7840HS, Radeon 780M
57534 Points
Geekom A7
AMD Ryzen 9 7940HS, Radeon 780M
57402 Points 0%
AcePC Wizbox AI
Intel Core Ultra 7 155H, Arc 8-Core
40440 Points -30%
Beelink SER5
AMD Ryzen 5 5560U, Vega 6
31339 Points -46%
Intel NUC 13 Pro Desk Edition Kit
Intel Core i7-1360P, Iris Xe G7 96EUs
28019 Points -51%
GMK NucBox K3 Pro
Intel Core i7-12650H, UHD Graphics 64EUs
23640 Points -59%
AIDA64 / CPU AES
Geekom A7
AMD Ryzen 9 7940HS, Radeon 780M
164414 MB/s 0%
GMK NucBox K6
AMD Ryzen 7 7840HS, Radeon 780M
164041 MB/s
AcePC Wizbox AI
Intel Core Ultra 7 155H, Arc 8-Core
138938 MB/s -15%
Average AMD Ryzen 7 7840HS
  (67389 - 177158, n=19)
132175 MB/s -19%
GMK NucBox K3 Pro
Intel Core i7-12650H, UHD Graphics 64EUs
82548 MB/s -50%
Beelink SER5
AMD Ryzen 5 5560U, Vega 6
78948 MB/s -52%
Intel NUC 13 Pro Desk Edition Kit
Intel Core i7-1360P, Iris Xe G7 96EUs
53328 MB/s -67%
AIDA64 / CPU ZLib
AcePC Wizbox AI
Intel Core Ultra 7 155H, Arc 8-Core
1117 MB/s +8%
Average AMD Ryzen 7 7840HS
  (949 - 1123, n=19)
1065 MB/s +3%
GMK NucBox K6
AMD Ryzen 7 7840HS, Radeon 780M
1031 MB/s
Geekom A7
AMD Ryzen 9 7940HS, Radeon 780M
1020 MB/s -1%
Intel NUC 13 Pro Desk Edition Kit
Intel Core i7-1360P, Iris Xe G7 96EUs
775 MB/s -25%
GMK NucBox K3 Pro
Intel Core i7-12650H, UHD Graphics 64EUs
601 MB/s -42%
Beelink SER5
AMD Ryzen 5 5560U, Vega 6
509 MB/s -51%
AIDA64 / FP64 Ray-Trace
Average AMD Ryzen 7 7840HS
  (13100 - 15599, n=19)
14270 KRay/s +5%
GMK NucBox K6
AMD Ryzen 7 7840HS, Radeon 780M
13642 KRay/s
Geekom A7
AMD Ryzen 9 7940HS, Radeon 780M
13517 KRay/s -1%
AcePC Wizbox AI
Intel Core Ultra 7 155H, Arc 8-Core
8240 KRay/s -40%
Intel NUC 13 Pro Desk Edition Kit
Intel Core i7-1360P, Iris Xe G7 96EUs
5957 KRay/s -56%
GMK NucBox K3 Pro
Intel Core i7-12650H, UHD Graphics 64EUs
5237 KRay/s -62%
Beelink SER5
AMD Ryzen 5 5560U, Vega 6
4540 KRay/s -67%
AIDA64 / CPU PhotoWorxx
GMK NucBox K3 Pro
Intel Core i7-12650H, UHD Graphics 64EUs
44164 MPixel/s +8%
GMK NucBox K6
AMD Ryzen 7 7840HS, Radeon 780M
40760 MPixel/s
Geekom A7
AMD Ryzen 9 7940HS, Radeon 780M
40570 MPixel/s 0%
Average AMD Ryzen 7 7840HS
  (17615 - 41516, n=19)
37735 MPixel/s -7%
AcePC Wizbox AI
Intel Core Ultra 7 155H, Arc 8-Core
32719 MPixel/s -20%
Intel NUC 13 Pro Desk Edition Kit
Intel Core i7-1360P, Iris Xe G7 96EUs
29263 MPixel/s -28%
Beelink SER5
AMD Ryzen 5 5560U, Vega 6
17917 MPixel/s -56%

Stresstest

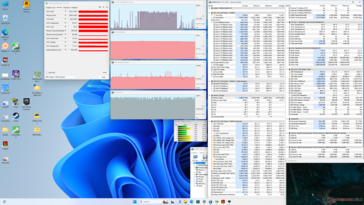
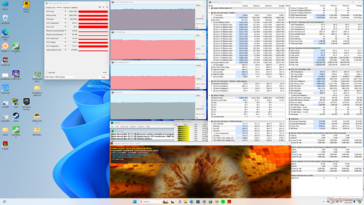
Under Prime95-stress ökade CPU:n till 4 GHz och 54 W under bara ett par sekunder innan den sjönk något till 3,8 GHz och 52 W. Kärntemperaturen under krävande belastning som spel stabiliserades i mitten av 70 C-området jämfört med 65 C på den äldre men svagare Beelink SER5.

System i viloläge
System i viloläge
Witcher 3 stress
Witcher 3 stress
Prime95 stress
Prime95 stress
Prime95+FurMark stress
CPU-klocka (GHz) GPU-klocka (MHz) Genomsnittlig CPU-temperatur (°C)
System i viloläge -- -- 37
Prime95 Stress 3.9 800 84
Prime95 + FurMark Stress 4.1 2000 76
Witcher 3 Stress ~0,4 2200 - 2700 71

Systemets prestanda

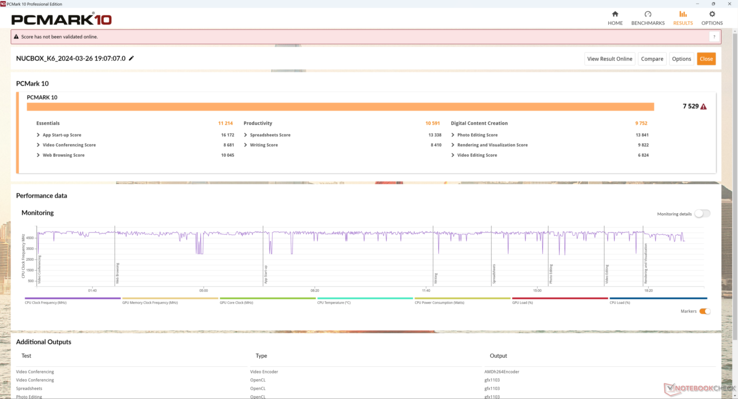
PCMark-resultaten är jämförbara med Geekom A7 även om Geekom kommer med den dyrare Ryzen 9 7940HS. När det gäller Intel är minidatorer utrustade med Meteor Lake-H-processorer som AcePC de närmaste motsvarigheterna till vår GMK.

PCMark 10 Standard
PCMark 10 Standard
PCMark 10 / Score
GMK NucBox K6
Radeon 780M, R7 7840HS, MasonSemi 1TB MC7000
7529 Points
Geekom A7
Radeon 780M, R9 7940HS, Acer N5000
7455 Points -1%
Average AMD Ryzen 7 7840HS, AMD Radeon 780M
  (7039 - 7651, n=8)
7381 Points -2%
AcePC Wizbox AI
Arc 8-Core, Ultra 7 155H, Rayson RS512GSSD710 512 GB PCIe 4.0 NVMe
7297 Points -3%
Intel NUC 13 Pro Desk Edition Kit
Iris Xe G7 96EUs, i7-1360P, Samsung PM9A1 MZVL2512HCJQ
5882 Points -22%
GMK NucBox K3 Pro
UHD Graphics 64EUs, i7-12650H, Lexar NM610 Pro NM610P001T-HNNNG
5855 Points -22%
Beelink SER5
Vega 6, R5 5560U, Crucial P3 Plus CT1000P3PSSD8
5453 Points -28%
PCMark 10 / Essentials
GMK NucBox K6
Radeon 780M, R7 7840HS, MasonSemi 1TB MC7000
11214 Points
Geekom A7
Radeon 780M, R9 7940HS, Acer N5000
11114 Points -1%
Intel NUC 13 Pro Desk Edition Kit
Iris Xe G7 96EUs, i7-1360P, Samsung PM9A1 MZVL2512HCJQ
11035 Points -2%
Average AMD Ryzen 7 7840HS, AMD Radeon 780M
  (10519 - 11214, n=8)
11024 Points -2%
AcePC Wizbox AI
Arc 8-Core, Ultra 7 155H, Rayson RS512GSSD710 512 GB PCIe 4.0 NVMe
10858 Points -3%
GMK NucBox K3 Pro
UHD Graphics 64EUs, i7-12650H, Lexar NM610 Pro NM610P001T-HNNNG
10797 Points -4%
Beelink SER5
Vega 6, R5 5560U, Crucial P3 Plus CT1000P3PSSD8
9440 Points -16%
PCMark 10 / Productivity
GMK NucBox K6
Radeon 780M, R7 7840HS, MasonSemi 1TB MC7000
10591 Points
Average AMD Ryzen 7 7840HS, AMD Radeon 780M
  (9075 - 10970, n=8)
10327 Points -2%
Geekom A7
Radeon 780M, R9 7940HS, Acer N5000
10291 Points -3%
AcePC Wizbox AI
Arc 8-Core, Ultra 7 155H, Rayson RS512GSSD710 512 GB PCIe 4.0 NVMe
9836 Points -7%
Beelink SER5
Vega 6, R5 5560U, Crucial P3 Plus CT1000P3PSSD8
8901 Points -16%
GMK NucBox K3 Pro
UHD Graphics 64EUs, i7-12650H, Lexar NM610 Pro NM610P001T-HNNNG
7803 Points -26%
Intel NUC 13 Pro Desk Edition Kit
Iris Xe G7 96EUs, i7-1360P, Samsung PM9A1 MZVL2512HCJQ
6576 Points -38%
PCMark 10 / Digital Content Creation
AcePC Wizbox AI
Arc 8-Core, Ultra 7 155H, Rayson RS512GSSD710 512 GB PCIe 4.0 NVMe
9875 Points +1%
Geekom A7
Radeon 780M, R9 7940HS, Acer N5000
9831 Points +1%
GMK NucBox K6
Radeon 780M, R7 7840HS, MasonSemi 1TB MC7000
9752 Points
Average AMD Ryzen 7 7840HS, AMD Radeon 780M
  (9052 - 9987, n=8)
9600 Points -2%
Intel NUC 13 Pro Desk Edition Kit
Iris Xe G7 96EUs, i7-1360P, Samsung PM9A1 MZVL2512HCJQ
7612 Points -22%
GMK NucBox K3 Pro
UHD Graphics 64EUs, i7-12650H, Lexar NM610 Pro NM610P001T-HNNNG
6468 Points -34%
Beelink SER5
Vega 6, R5 5560U, Crucial P3 Plus CT1000P3PSSD8
5238 Points -46%
CrossMark / Overall
GMK NucBox K6
Radeon 780M, R7 7840HS, MasonSemi 1TB MC7000
1873 Points
Geekom A7
Radeon 780M, R9 7940HS, Acer N5000
1861 Points -1%
Average AMD Ryzen 7 7840HS, AMD Radeon 780M
  (1566 - 1891, n=8)
1756 Points -6%
AcePC Wizbox AI
Arc 8-Core, Ultra 7 155H, Rayson RS512GSSD710 512 GB PCIe 4.0 NVMe
1678 Points -10%
Intel NUC 13 Pro Desk Edition Kit
Iris Xe G7 96EUs, i7-1360P, Samsung PM9A1 MZVL2512HCJQ
1596 Points -15%
GMK NucBox K3 Pro
UHD Graphics 64EUs, i7-12650H, Lexar NM610 Pro NM610P001T-HNNNG
1573 Points -16%
Beelink SER5
Vega 6, R5 5560U, Crucial P3 Plus CT1000P3PSSD8
1196 Points -36%
CrossMark / Productivity
GMK NucBox K6
Radeon 780M, R7 7840HS, MasonSemi 1TB MC7000
1816 Points
Geekom A7
Radeon 780M, R9 7940HS, Acer N5000
1781 Points -2%
Average AMD Ryzen 7 7840HS, AMD Radeon 780M
  (1535 - 1823, n=8)
1690 Points -7%
AcePC Wizbox AI
Arc 8-Core, Ultra 7 155H, Rayson RS512GSSD710 512 GB PCIe 4.0 NVMe
1600 Points -12%
Intel NUC 13 Pro Desk Edition Kit
Iris Xe G7 96EUs, i7-1360P, Samsung PM9A1 MZVL2512HCJQ
1537 Points -15%
GMK NucBox K3 Pro
UHD Graphics 64EUs, i7-12650H, Lexar NM610 Pro NM610P001T-HNNNG
1503 Points -17%
Beelink SER5
Vega 6, R5 5560U, Crucial P3 Plus CT1000P3PSSD8
1259 Points -31%
CrossMark / Creativity
Geekom A7
Radeon 780M, R9 7940HS, Acer N5000
2072 Points +4%
GMK NucBox K6
Radeon 780M, R7 7840HS, MasonSemi 1TB MC7000
1994 Points
Average AMD Ryzen 7 7840HS, AMD Radeon 780M
  (1556 - 2040, n=8)
1915 Points -4%
AcePC Wizbox AI
Arc 8-Core, Ultra 7 155H, Rayson RS512GSSD710 512 GB PCIe 4.0 NVMe
1869 Points -6%
Intel NUC 13 Pro Desk Edition Kit
Iris Xe G7 96EUs, i7-1360P, Samsung PM9A1 MZVL2512HCJQ
1769 Points -11%
GMK NucBox K3 Pro
UHD Graphics 64EUs, i7-12650H, Lexar NM610 Pro NM610P001T-HNNNG
1753 Points -12%
Beelink SER5
Vega 6, R5 5560U, Crucial P3 Plus CT1000P3PSSD8
1153 Points -42%
CrossMark / Responsiveness
GMK NucBox K6
Radeon 780M, R7 7840HS, MasonSemi 1TB MC7000
1706 Points
Geekom A7
Radeon 780M, R9 7940HS, Acer N5000
1540 Points -10%
Average AMD Ryzen 7 7840HS, AMD Radeon 780M
  (1293 - 1749, n=8)
1528 Points -10%
AcePC Wizbox AI
Arc 8-Core, Ultra 7 155H, Rayson RS512GSSD710 512 GB PCIe 4.0 NVMe
1400 Points -18%
Intel NUC 13 Pro Desk Edition Kit
Iris Xe G7 96EUs, i7-1360P, Samsung PM9A1 MZVL2512HCJQ
1311 Points -23%
GMK NucBox K3 Pro
UHD Graphics 64EUs, i7-12650H, Lexar NM610 Pro NM610P001T-HNNNG
1301 Points -24%
Beelink SER5
Vega 6, R5 5560U, Crucial P3 Plus CT1000P3PSSD8
1144 Points -33%
WebXPRT 3 / Overall
Geekom A7
Radeon 780M, R9 7940HS, Acer N5000
333 Points +2%
GMK NucBox K6
Radeon 780M, R7 7840HS, MasonSemi 1TB MC7000
328 Points
Average AMD Ryzen 7 7840HS, AMD Radeon 780M
  (297 - 339, n=8)
323 Points -2%
Intel NUC 13 Pro Desk Edition Kit
Iris Xe G7 96EUs, i7-1360P, Samsung PM9A1 MZVL2512HCJQ
301 Points -8%
GMK NucBox K3 Pro
UHD Graphics 64EUs, i7-12650H, Lexar NM610 Pro NM610P001T-HNNNG
301 Points -8%
AcePC Wizbox AI
Arc 8-Core, Ultra 7 155H, Rayson RS512GSSD710 512 GB PCIe 4.0 NVMe
269 Points -18%
Beelink SER5
Vega 6, R5 5560U, Crucial P3 Plus CT1000P3PSSD8
250 Points -24%
WebXPRT 4 / Overall
Geekom A7
Radeon 780M, R9 7940HS, Acer N5000
268 Points +1%
Average AMD Ryzen 7 7840HS, AMD Radeon 780M
  (248 - 319, n=7)
268 Points +1%
GMK NucBox K6
Radeon 780M, R7 7840HS, MasonSemi 1TB MC7000
266 Points
Intel NUC 13 Pro Desk Edition Kit
Iris Xe G7 96EUs, i7-1360P, Samsung PM9A1 MZVL2512HCJQ
265 Points 0%
Beelink SER5
Vega 6, R5 5560U, Crucial P3 Plus CT1000P3PSSD8
192.4 Points -28%
Mozilla Kraken 1.1 / Total
Beelink SER5
Vega 6, R5 5560U, Crucial P3 Plus CT1000P3PSSD8
702 ms * -31%
AcePC Wizbox AI
Arc 8-Core, Ultra 7 155H, Rayson RS512GSSD710 512 GB PCIe 4.0 NVMe
544 ms * -2%
GMK NucBox K6
Radeon 780M, R7 7840HS, MasonSemi 1TB MC7000
534 ms *
GMK NucBox K3 Pro
UHD Graphics 64EUs, i7-12650H, Lexar NM610 Pro NM610P001T-HNNNG
522 ms * +2%
Average AMD Ryzen 7 7840HS, AMD Radeon 780M
  (485 - 544, n=8)
519 ms * +3%
Geekom A7
Radeon 780M, R9 7940HS, Acer N5000
503 ms * +6%
Intel NUC 13 Pro Desk Edition Kit
Iris Xe G7 96EUs, i7-1360P, Samsung PM9A1 MZVL2512HCJQ
496 ms * +7%

* ... smaller is better

PCMark 10 Score
7529 poäng
Hjälp
AIDA64 / Memory Copy
GMK NucBox K3 Pro
Intel Core i7-12650H, UHD Graphics 64EUs
69735 MB/s +1%
GMK NucBox K6
AMD Ryzen 7 7840HS, Radeon 780M
69281 MB/s
Geekom A7
AMD Ryzen 9 7940HS, Radeon 780M
67161 MB/s -3%
Average AMD Ryzen 7 7840HS
  (30937 - 72158, n=19)
66323 MB/s -4%
AcePC Wizbox AI
Intel Core Ultra 7 155H, Arc 8-Core
63807 MB/s -8%
Intel NUC 13 Pro Desk Edition Kit
Intel Core i7-1360P, Iris Xe G7 96EUs
44299 MB/s -36%
Beelink SER5
AMD Ryzen 5 5560U, Vega 6
38690 MB/s -44%
AIDA64 / Memory Read
GMK NucBox K3 Pro
Intel Core i7-12650H, UHD Graphics 64EUs
67412 MB/s +9%
GMK NucBox K6
AMD Ryzen 7 7840HS, Radeon 780M
61708 MB/s
Geekom A7
AMD Ryzen 9 7940HS, Radeon 780M
61542 MB/s 0%
AcePC Wizbox AI
Intel Core Ultra 7 155H, Arc 8-Core
60544 MB/s -2%
Average AMD Ryzen 7 7840HS
  (30497 - 62147, n=19)
58070 MB/s -6%
Intel NUC 13 Pro Desk Edition Kit
Intel Core i7-1360P, Iris Xe G7 96EUs
44751 MB/s -27%
Beelink SER5
AMD Ryzen 5 5560U, Vega 6
39794 MB/s -36%
AIDA64 / Memory Write
Geekom A7
AMD Ryzen 9 7940HS, Radeon 780M
86810 MB/s 0%
GMK NucBox K6
AMD Ryzen 7 7840HS, Radeon 780M
86528 MB/s
Average AMD Ryzen 7 7840HS
  (34590 - 93323, n=19)
84045 MB/s -3%
AcePC Wizbox AI
Intel Core Ultra 7 155H, Arc 8-Core
64852 MB/s -25%
GMK NucBox K3 Pro
Intel Core i7-12650H, UHD Graphics 64EUs
59361 MB/s -31%
Intel NUC 13 Pro Desk Edition Kit
Intel Core i7-1360P, Iris Xe G7 96EUs
45887 MB/s -47%
Beelink SER5
AMD Ryzen 5 5560U, Vega 6
41162 MB/s -52%
AIDA64 / Memory Latency
AcePC Wizbox AI
Intel Core Ultra 7 155H, Arc 8-Core
154.6 ns * -75%
GMK NucBox K3 Pro
Intel Core i7-12650H, UHD Graphics 64EUs
97.2 ns * -10%
Intel NUC 13 Pro Desk Edition Kit
Intel Core i7-1360P, Iris Xe G7 96EUs
96.2 ns * -9%
Beelink SER5
AMD Ryzen 5 5560U, Vega 6
93.1 ns * -6%
Average AMD Ryzen 7 7840HS
  (85.1 - 112, n=19)
92.4 ns * -5%
Geekom A7
AMD Ryzen 9 7940HS, Radeon 780M
89 ns * -1%
GMK NucBox K6
AMD Ryzen 7 7840HS, Radeon 780M
88.1 ns *

* ... smaller is better

DPC-fördröjning

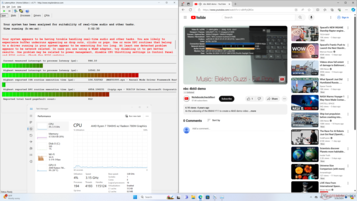
Tyvärr lider systemet av problem med DPC-latens som påverkar videouppspelningen. Vår minutlånga 4K60-video returnerade 11 tappade bildrutor när det borde vara noll. Räkna med en del mindre hackningar när du strömmar video som ett resultat av detta.

LatencyMon
LatencyMon
Lista över förare
Lista över förare
DPC Latencies / LatencyMon - interrupt to process latency (max), Web, Youtube, Prime95
GMK NucBox K6
Radeon 780M, R7 7840HS, MasonSemi 1TB MC7000
10561.5 μs *
Geekom A7
Radeon 780M, R9 7940HS, Acer N5000
1616.1 μs * +85%
GMK NucBox K3 Pro
UHD Graphics 64EUs, i7-12650H, Lexar NM610 Pro NM610P001T-HNNNG
1415.8 μs * +87%
Intel NUC 13 Pro Desk Edition Kit
Iris Xe G7 96EUs, i7-1360P, Samsung PM9A1 MZVL2512HCJQ
1068.7 μs * +90%
AcePC Wizbox AI
Arc 8-Core, Ultra 7 155H, Rayson RS512GSSD710 512 GB PCIe 4.0 NVMe
983.89 μs * +91%
Beelink SER5
Vega 6, R5 5560U, Crucial P3 Plus CT1000P3PSSD8
364.6 μs * +97%

* ... smaller is better

Lagringsenheter

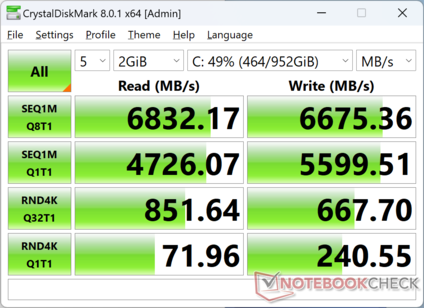
GMK:s minidatorer levereras vanligtvis med mindre kända SSD-märken, sannolikt för att hålla kostnaderna nere. Den MasonSemi MC7000 är kanske inte ett känt namn, men prestandan är ändå utmärkt med resultat som är jämförbara med den populära Samsung PM9A1-serien. Läshastigheterna är hållbara vid ~7000 MB/s vilket är nära den övre gränsen för PCIe4 x4-enheter.

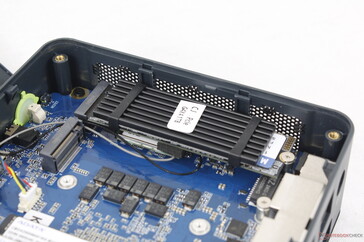
Notera att endast en värmespridare är inkluderad trots att systemet kan stödja upp till två enheter.

CDM 8
CDM 8
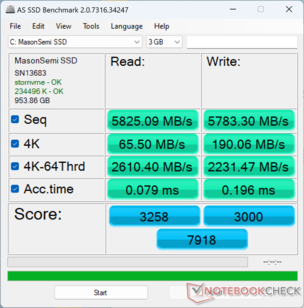
AS SSD
AS SSD
Överraskande nog innehåller systemet en värmespridare trots det relativt låga priset
SSD med värmespridare borttagen
MasonSemi 1TB MC7000
CDM 5/6 Read Seq Q32T1: 7049 MB/s
CDM 5/6 Write Seq Q32T1: 6666 MB/s
CDM 5/6 Read 4K Q32T1: 854.6 MB/s
CDM 5/6 Write 4K Q32T1: 669.6 MB/s
CDM 5 Read Seq: 4765 MB/s
CDM 5 Write Seq: 5615 MB/s
CDM 5/6 Read 4K: 74.23 MB/s
CDM 5/6 Write 4K: 236.1 MB/s
Drive Performance Rating - Percent
GMK NucBox K6
MasonSemi 1TB MC7000
90.8 pt
Intel NUC 13 Pro Desk Edition Kit
Samsung PM9A1 MZVL2512HCJQ
68.6 pt
Geekom A7
Acer N5000
62.4 pt
Beelink SER5
Crucial P3 Plus CT1000P3PSSD8
61.4 pt
AcePC Wizbox AI
Rayson RS512GSSD710 512 GB PCIe 4.0 NVMe
49.4 pt
GMK NucBox K3 Pro
Lexar NM610 Pro NM610P001T-HNNNG
45 pt
DiskSpd
seq read
Geekom A7
Acer N5000
3755 (3733.85min - 3754.99max) MB/s +1%
GMK NucBox K6
MasonSemi 1TB MC7000
3703 (3243.89min - 3702.94max) MB/s
Intel NUC 13 Pro Desk Edition Kit
Samsung PM9A1 MZVL2512HCJQ
3337 (3301.03min - 3337.16max) MB/s -10%
Beelink SER5
Crucial P3 Plus CT1000P3PSSD8
2615 (2607.21min - 2614.94max) MB/s -29%
AcePC Wizbox AI
Rayson RS512GSSD710 512 GB PCIe 4.0 NVMe
2185 (2022.91min - 2184.81max) MB/s -41%
GMK NucBox K3 Pro
Lexar NM610 Pro NM610P001T-HNNNG
2003 (1792.88min - 2003.18max) MB/s -46%
seq write
GMK NucBox K6
MasonSemi 1TB MC7000
5595 (1443.73min - 5595.13max) MB/s
Geekom A7
Acer N5000
3492 (3398.43min - 3491.76max) MB/s -38%
Intel NUC 13 Pro Desk Edition Kit
Samsung PM9A1 MZVL2512HCJQ
3356 (3181.73min - 3356.49max) MB/s -40%
Beelink SER5
Crucial P3 Plus CT1000P3PSSD8
2878 (2868.83min - 2877.62max) MB/s -49%
AcePC Wizbox AI
Rayson RS512GSSD710 512 GB PCIe 4.0 NVMe
2029 (1562.36min - 2029.13max) MB/s -64%
GMK NucBox K3 Pro
Lexar NM610 Pro NM610P001T-HNNNG
1919 (1852.07min - 1919.04max) MB/s -66%
seq q8 t1 read
GMK NucBox K6
MasonSemi 1TB MC7000
7069 (6459.52min - 7068.99max) MB/s
Intel NUC 13 Pro Desk Edition Kit
Samsung PM9A1 MZVL2512HCJQ
5438 (4937.74min - 5438.31max) MB/s -23%
Geekom A7
Acer N5000
4861 (4468.61min - 4860.57max) MB/s -31%
AcePC Wizbox AI
Rayson RS512GSSD710 512 GB PCIe 4.0 NVMe
4835 (4317.37min - 4834.75max) MB/s -32%
Beelink SER5
Crucial P3 Plus CT1000P3PSSD8
3673 (3327.76min - 3673.17max) MB/s -48%
GMK NucBox K3 Pro
Lexar NM610 Pro NM610P001T-HNNNG
3481 (3104.12min - 3480.68max) MB/s -51%
seq q8 t1 write
GMK NucBox K6
MasonSemi 1TB MC7000
6669 (1251.16min - 6668.61max) MB/s
Intel NUC 13 Pro Desk Edition Kit
Samsung PM9A1 MZVL2512HCJQ
4955 (4929.56min - 4955.41max) MB/s -26%
Geekom A7
Acer N5000
4695 (4470.16min - 4694.73max) MB/s -30%
Beelink SER5
Crucial P3 Plus CT1000P3PSSD8
3220 (3120.61min - 3219.7max) MB/s -52%
AcePC Wizbox AI
Rayson RS512GSSD710 512 GB PCIe 4.0 NVMe
2548 (1848.43min - 2547.98max) MB/s -62%
GMK NucBox K3 Pro
Lexar NM610 Pro NM610P001T-HNNNG
2408 (2336.17min - 2407.96max) MB/s -64%
4k q1 t1 read
Intel NUC 13 Pro Desk Edition Kit
Samsung PM9A1 MZVL2512HCJQ
84.5 (83.02min - 84.54max) MB/s +19%
GMK NucBox K6
MasonSemi 1TB MC7000
71 (70.41min - 71.02max) MB/s
AcePC Wizbox AI
Rayson RS512GSSD710 512 GB PCIe 4.0 NVMe
54.8 (54.1min - 54.82max) MB/s -23%
Beelink SER5
Crucial P3 Plus CT1000P3PSSD8
52.5 (52.31min - 52.46max) MB/s -26%
Geekom A7
Acer N5000
52.3 (51.85min - 52.27max) MB/s -26%
GMK NucBox K3 Pro
Lexar NM610 Pro NM610P001T-HNNNG
50.3 (48.8min - 50.32max) MB/s -29%
4k q1 t1 write
GMK NucBox K6
MasonSemi 1TB MC7000
239 (237.67min - 239.17max) MB/s
Beelink SER5
Crucial P3 Plus CT1000P3PSSD8
173.4 (172.45min - 173.36max) MB/s -27%
Geekom A7
Acer N5000
165.9 (164.35min - 165.92max) MB/s -31%
GMK NucBox K3 Pro
Lexar NM610 Pro NM610P001T-HNNNG
163.5 (154.58min - 163.51max) MB/s -32%
AcePC Wizbox AI
Rayson RS512GSSD710 512 GB PCIe 4.0 NVMe
162.6 (156.04min - 162.59max) MB/s -32%
Intel NUC 13 Pro Desk Edition Kit
Samsung PM9A1 MZVL2512HCJQ
144.6 (143.6min - 144.57max) MB/s -39%
4k q32 t16 read
Beelink SER5
Crucial P3 Plus CT1000P3PSSD8
2781 (2776.44min - 2781.48max) MB/s +13%
GMK NucBox K6
MasonSemi 1TB MC7000
2463 (2040.37min - 2463.15max) MB/s
Geekom A7
Acer N5000
1560 (1546.89min - 1559.94max) MB/s -37%
GMK NucBox K3 Pro
Lexar NM610 Pro NM610P001T-HNNNG
1132 (1079.47min - 1132.07max) MB/s -54%
AcePC Wizbox AI
Rayson RS512GSSD710 512 GB PCIe 4.0 NVMe
904 (899.18min - 903.79max) MB/s -63%
Intel NUC 13 Pro Desk Edition Kit
Samsung PM9A1 MZVL2512HCJQ
808 (792.58min - 807.51max) MB/s -67%
4k q32 t16 write
GMK NucBox K6
MasonSemi 1TB MC7000
3983 (3232.63min - 3982.67max) MB/s
Beelink SER5
Crucial P3 Plus CT1000P3PSSD8
2218 (2164.78min - 2217.8max) MB/s -44%
AcePC Wizbox AI
Rayson RS512GSSD710 512 GB PCIe 4.0 NVMe
1697 (1681.85min - 1696.69max) MB/s -57%
Geekom A7
Acer N5000
595 (582.97min - 594.71max) MB/s -85%
GMK NucBox K3 Pro
Lexar NM610 Pro NM610P001T-HNNNG
535 (489.88min - 535.49max) MB/s -87%
Intel NUC 13 Pro Desk Edition Kit
Samsung PM9A1 MZVL2512HCJQ
454 (443.2min - 453.53max) MB/s -89%
AS SSD
Score Total
GMK NucBox K6
MasonSemi 1TB MC7000
7918 Points
Intel NUC 13 Pro Desk Edition Kit
Samsung PM9A1 MZVL2512HCJQ
5249 Points -34%
Geekom A7
Acer N5000
5177 Points -35%
Beelink SER5
Crucial P3 Plus CT1000P3PSSD8
4696 Points -41%
AcePC Wizbox AI
Rayson RS512GSSD710 512 GB PCIe 4.0 NVMe
3505 Points -56%
GMK NucBox K3 Pro
Lexar NM610 Pro NM610P001T-HNNNG
3294 Points -58%
Score Read
GMK NucBox K6
MasonSemi 1TB MC7000
3258 Points
Beelink SER5
Crucial P3 Plus CT1000P3PSSD8
1701 Points -48%
Geekom A7
Acer N5000
1685 Points -48%
GMK NucBox K3 Pro
Lexar NM610 Pro NM610P001T-HNNNG
1367 Points -58%
Intel NUC 13 Pro Desk Edition Kit
Samsung PM9A1 MZVL2512HCJQ
1320 Points -59%
AcePC Wizbox AI
Rayson RS512GSSD710 512 GB PCIe 4.0 NVMe
1251 Points -62%
Score Write
Intel NUC 13 Pro Desk Edition Kit
Samsung PM9A1 MZVL2512HCJQ
3326 Points +11%
GMK NucBox K6
MasonSemi 1TB MC7000
3000 Points
Geekom A7
Acer N5000
2676 Points -11%
Beelink SER5
Crucial P3 Plus CT1000P3PSSD8
2136 Points -29%
AcePC Wizbox AI
Rayson RS512GSSD710 512 GB PCIe 4.0 NVMe
1666 Points -44%
GMK NucBox K3 Pro
Lexar NM610 Pro NM610P001T-HNNNG
1282 Points -57%
Seq Read
GMK NucBox K6
MasonSemi 1TB MC7000
5825.09 MB/s
Intel NUC 13 Pro Desk Edition Kit
Samsung PM9A1 MZVL2512HCJQ
4536 MB/s -22%
AcePC Wizbox AI
Rayson RS512GSSD710 512 GB PCIe 4.0 NVMe
3756 MB/s -36%
Geekom A7
Acer N5000
3650 MB/s -37%
Beelink SER5
Crucial P3 Plus CT1000P3PSSD8
3157.87 MB/s -46%
GMK NucBox K3 Pro
Lexar NM610 Pro NM610P001T-HNNNG
2968.96 MB/s -49%
Seq Write
GMK NucBox K6
MasonSemi 1TB MC7000
5783.3 MB/s
Beelink SER5
Crucial P3 Plus CT1000P3PSSD8
2830.61 MB/s -51%
Intel NUC 13 Pro Desk Edition Kit
Samsung PM9A1 MZVL2512HCJQ
2698 MB/s -53%
Geekom A7
Acer N5000
2611 MB/s -55%
AcePC Wizbox AI
Rayson RS512GSSD710 512 GB PCIe 4.0 NVMe
2494 MB/s -57%
GMK NucBox K3 Pro
Lexar NM610 Pro NM610P001T-HNNNG
1698.68 MB/s -71%
4K Read
Intel NUC 13 Pro Desk Edition Kit
Samsung PM9A1 MZVL2512HCJQ
72 MB/s +10%
GMK NucBox K6
MasonSemi 1TB MC7000
65.5 MB/s
GMK NucBox K3 Pro
Lexar NM610 Pro NM610P001T-HNNNG
51.31 MB/s -22%
AcePC Wizbox AI
Rayson RS512GSSD710 512 GB PCIe 4.0 NVMe
50.6 MB/s -23%
Beelink SER5
Crucial P3 Plus CT1000P3PSSD8
49.71 MB/s -24%
Geekom A7
Acer N5000
49.7 MB/s -24%
4K Write
GMK NucBox K3 Pro
Lexar NM610 Pro NM610P001T-HNNNG
205.98 MB/s +8%
GMK NucBox K6
MasonSemi 1TB MC7000
190.06 MB/s
Intel NUC 13 Pro Desk Edition Kit
Samsung PM9A1 MZVL2512HCJQ
166.8 MB/s -12%
Geekom A7
Acer N5000
160 MB/s -16%
Beelink SER5
Crucial P3 Plus CT1000P3PSSD8
143.94 MB/s -24%
AcePC Wizbox AI
Rayson RS512GSSD710 512 GB PCIe 4.0 NVMe
136.6 MB/s -28%
4K-64 Read
GMK NucBox K6
MasonSemi 1TB MC7000
2610.4 MB/s
Beelink SER5
Crucial P3 Plus CT1000P3PSSD8
1335.88 MB/s -49%
Geekom A7
Acer N5000
1270 MB/s -51%
GMK NucBox K3 Pro
Lexar NM610 Pro NM610P001T-HNNNG
1018.3 MB/s -61%
AcePC Wizbox AI
Rayson RS512GSSD710 512 GB PCIe 4.0 NVMe
825 MB/s -68%
Intel NUC 13 Pro Desk Edition Kit
Samsung PM9A1 MZVL2512HCJQ
794 MB/s -70%
4K-64 Write
Intel NUC 13 Pro Desk Edition Kit
Samsung PM9A1 MZVL2512HCJQ
2889 MB/s +29%
Geekom A7
Acer N5000
2255 MB/s +1%
GMK NucBox K6
MasonSemi 1TB MC7000
2231.47 MB/s
Beelink SER5
Crucial P3 Plus CT1000P3PSSD8
1708.89 MB/s -23%
AcePC Wizbox AI
Rayson RS512GSSD710 512 GB PCIe 4.0 NVMe
1280 MB/s -43%
GMK NucBox K3 Pro
Lexar NM610 Pro NM610P001T-HNNNG
906.2 MB/s -59%
Access Time Read
AcePC Wizbox AI
Rayson RS512GSSD710 512 GB PCIe 4.0 NVMe
0.179 ms * -127%
Geekom A7
Acer N5000
0.138 ms * -75%
Beelink SER5
Crucial P3 Plus CT1000P3PSSD8
0.094 ms * -19%
GMK NucBox K3 Pro
Lexar NM610 Pro NM610P001T-HNNNG
0.079 ms * -0%
GMK NucBox K6
MasonSemi 1TB MC7000
0.079 ms *
Intel NUC 13 Pro Desk Edition Kit
Samsung PM9A1 MZVL2512HCJQ
0.06 ms * +24%
Access Time Write
GMK NucBox K3 Pro
Lexar NM610 Pro NM610P001T-HNNNG
0.367 ms * -87%
GMK NucBox K6
MasonSemi 1TB MC7000
0.196 ms *
AcePC Wizbox AI
Rayson RS512GSSD710 512 GB PCIe 4.0 NVMe
0.084 ms * +57%
Beelink SER5
Crucial P3 Plus CT1000P3PSSD8
0.077 ms * +61%
Geekom A7
Acer N5000
0.072 ms * +63%
Intel NUC 13 Pro Desk Edition Kit
Samsung PM9A1 MZVL2512HCJQ
0.024 ms * +88%

* ... smaller is better

Disk Throttling: DiskSpd Read Loop, Queue Depth 8

035571010651420177521302485284031953550390542604615497053255680603563906745Tooltip
GMK NucBox K6; diskspd 2.0.17 f: Ø7035 (6458.68-7055.24)

GPU-prestanda - tillräckligt kraftfull för de flesta spel

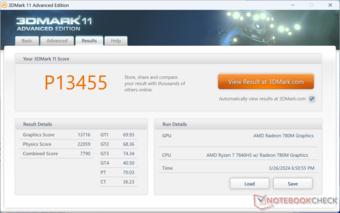
Radeon 780M Radeon 780M har visat sig vara en kraftfull integrerad GPU och den kan till och med köras snabbare på minidatorer än bärbara datorer eftersom den tjockare formfaktorn i allmänhet tillåter högre effekt. I det här fallet körs iGPU:n i vår NucBox K6 cirka 10 procent snabbare än den genomsnittliga bärbara datorn i vår databas som är utrustad med samma grafikalternativ. Prestandafördelen kan vara ännu större i spel som Tiny Tina's Wonderlands eller F1 22 där vi kan observera ett delta på upp till 20 procent. Användare som uppgraderar från UHD Graphics eller Iris Xe bör se en betydande ökning.

3DMark 11
3DMark 11
Time Spy
Time Spy
Fire Strike
Fire Strike
Fire Strike Ultra
Fire Strike Ultra
3DMark Performance Rating - Percent
Geekom A7
AMD Radeon 780M, AMD Ryzen 9 7940HS
100 pt
GMK NucBox K6
AMD Radeon 780M, AMD Ryzen 7 7840HS
97.9 pt
Average AMD Radeon 780M
 
91.1 pt
Beelink SER6 Pro
AMD Radeon 680M, AMD Ryzen 7 6800H
81.7 pt
Beelink GTR6
AMD Radeon 680M, AMD Ryzen 9 6900HX
80.8 pt
Aoostar GOD77
AMD Radeon 680M, AMD Ryzen 7 7735HS
77.8 pt
Intel NUC 13 Pro Desk Edition Kit
Intel Iris Xe Graphics G7 96EUs, Intel Core i7-1360P
58.3 pt
Geekom Mini IT13
Intel Iris Xe Graphics G7 96EUs, Intel Core i9-13900H
58.1 pt
Lenovo IdeaCentre Mini 01IRH8
Intel Iris Xe Graphics G7 96EUs, Intel Core i7-13700H
52.4 pt
GMK NucBox K3 Pro
Intel UHD Graphics 64EUs (Alder Lake 12th Gen), Intel Core i7-12650H
45.6 pt
Beelink SER5
AMD Radeon RX Vega 6 (Ryzen 4000/5000), AMD Ryzen 5 5560U
34 pt
GMK NucBox M3
Intel UHD Graphics Xe G4 48EUs, Intel Core i5-12450H
31.2 pt
3DMark 11 - 1280x720 Performance GPU
Geekom A7
AMD Radeon 780M, AMD Ryzen 9 7940HS
13932 Points +2%
GMK NucBox K6
AMD Radeon 780M, AMD Ryzen 7 7840HS
13716 Points
Average AMD Radeon 780M
  (7868 - 14249, n=54)
12467 Points -9%
Beelink SER6 Pro
AMD Radeon 680M, AMD Ryzen 7 6800H
10807 Points -21%
Beelink GTR6
AMD Radeon 680M, AMD Ryzen 9 6900HX
10566 Points -23%
Aoostar GOD77
AMD Radeon 680M, AMD Ryzen 7 7735HS
10092 Points -26%
Intel NUC 13 Pro Desk Edition Kit
Intel Iris Xe Graphics G7 96EUs, Intel Core i7-1360P
7321 Points -47%
Geekom Mini IT13
Intel Iris Xe Graphics G7 96EUs, Intel Core i9-13900H
7147 Points -48%
Lenovo IdeaCentre Mini 01IRH8
Intel Iris Xe Graphics G7 96EUs, Intel Core i7-13700H
6914 Points -50%
GMK NucBox K3 Pro
Intel UHD Graphics 64EUs (Alder Lake 12th Gen), Intel Core i7-12650H
5566 Points -59%
Beelink SER5
AMD Radeon RX Vega 6 (Ryzen 4000/5000), AMD Ryzen 5 5560U
4439 Points -68%
GMK NucBox M3
Intel UHD Graphics Xe G4 48EUs, Intel Core i5-12450H
3906 Points -72%
3DMark
1920x1080 Fire Strike Graphics
Geekom A7
AMD Radeon 780M, AMD Ryzen 9 7940HS
8391 Points +3%
GMK NucBox K6
AMD Radeon 780M, AMD Ryzen 7 7840HS
8164 Points
Average AMD Radeon 780M
  (4550 - 8816, n=56)
7746 Points -5%
Aoostar GOD77
AMD Radeon 680M, AMD Ryzen 7 7735HS
7064 Points -13%
Beelink SER6 Pro
AMD Radeon 680M, AMD Ryzen 7 6800H
7026 Points -14%
Beelink GTR6
AMD Radeon 680M, AMD Ryzen 9 6900HX
6962 Points -15%
Geekom Mini IT13
Intel Iris Xe Graphics G7 96EUs, Intel Core i9-13900H
5637 Points -31%
Intel NUC 13 Pro Desk Edition Kit
Intel Iris Xe Graphics G7 96EUs, Intel Core i7-1360P
5616 Points -31%
Lenovo IdeaCentre Mini 01IRH8
Intel Iris Xe Graphics G7 96EUs, Intel Core i7-13700H
4808 Points -41%
GMK NucBox K3 Pro
Intel UHD Graphics 64EUs (Alder Lake 12th Gen), Intel Core i7-12650H
4567 Points -44%
GMK NucBox M3
Intel UHD Graphics Xe G4 48EUs, Intel Core i5-12450H
3131 Points -62%
Beelink SER5
AMD Radeon RX Vega 6 (Ryzen 4000/5000), AMD Ryzen 5 5560U
3056 Points -63%
2560x1440 Time Spy Graphics
Geekom A7
AMD Radeon 780M, AMD Ryzen 9 7940HS
2968 Points +2%
GMK NucBox K6
AMD Radeon 780M, AMD Ryzen 7 7840HS
2906 Points
Average AMD Radeon 780M
  (1496 - 3196, n=56)
2717 Points -7%
Beelink SER6 Pro
AMD Radeon 680M, AMD Ryzen 7 6800H
2452 Points -16%
Beelink GTR6
AMD Radeon 680M, AMD Ryzen 9 6900HX
2437 Points -16%
Aoostar GOD77
AMD Radeon 680M, AMD Ryzen 7 7735HS
2290 Points -21%
Geekom Mini IT13
Intel Iris Xe Graphics G7 96EUs, Intel Core i9-13900H
1681 Points -42%
Intel NUC 13 Pro Desk Edition Kit
Intel Iris Xe Graphics G7 96EUs, Intel Core i7-1360P
1672 Points -42%
Lenovo IdeaCentre Mini 01IRH8
Intel Iris Xe Graphics G7 96EUs, Intel Core i7-13700H
1508 Points -48%
GMK NucBox K3 Pro
Intel UHD Graphics 64EUs (Alder Lake 12th Gen), Intel Core i7-12650H
1288 Points -56%
Beelink SER5
AMD Radeon RX Vega 6 (Ryzen 4000/5000), AMD Ryzen 5 5560U
996 Points -66%
GMK NucBox M3
Intel UHD Graphics Xe G4 48EUs, Intel Core i5-12450H
873 Points -70%
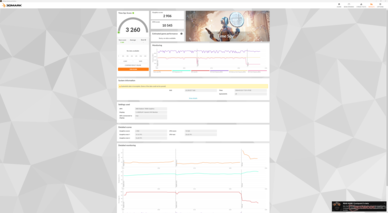
2560x1440 Time Spy Score
Geekom A7
AMD Radeon 780M, AMD Ryzen 9 7940HS
3324 Points +2%
GMK NucBox K6
AMD Radeon 780M, AMD Ryzen 7 7840HS
3260 Points
Average AMD Radeon 780M
  (1707 - 3517, n=56)
3029 Points -7%
Beelink SER6 Pro
AMD Radeon 680M, AMD Ryzen 7 6800H
2751 Points -16%
Beelink GTR6
AMD Radeon 680M, AMD Ryzen 9 6900HX
2735 Points -16%
Aoostar GOD77
AMD Radeon 680M, AMD Ryzen 7 7735HS
2578 Points -21%
Geekom Mini IT13
Intel Iris Xe Graphics G7 96EUs, Intel Core i9-13900H
1910 Points -41%
Intel NUC 13 Pro Desk Edition Kit
Intel Iris Xe Graphics G7 96EUs, Intel Core i7-1360P
1903 Points -42%
Lenovo IdeaCentre Mini 01IRH8
Intel Iris Xe Graphics G7 96EUs, Intel Core i7-13700H
1724 Points -47%
GMK NucBox K3 Pro
Intel UHD Graphics 64EUs (Alder Lake 12th Gen), Intel Core i7-12650H
1478 Points -55%
Beelink SER5
AMD Radeon RX Vega 6 (Ryzen 4000/5000), AMD Ryzen 5 5560U
1135 Points -65%
GMK NucBox M3
Intel UHD Graphics Xe G4 48EUs, Intel Core i5-12450H
1001 Points -69%
3DMark 11 Performance
13455 poäng
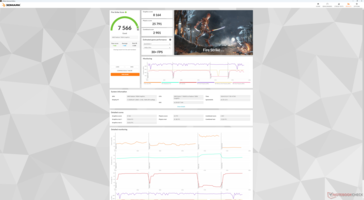
3DMark Fire Strike Score
7566 poäng
3DMark Time Spy Score
3260 poäng
Hjälp
Blender
v3.3 Classroom HIP/AMD
Beelink SER5
AMD Radeon RX Vega 6 (Ryzen 4000/5000), AMD Ryzen 5 5560U
675 Seconds *
Beelink GTR6
AMD Radeon 680M, AMD Ryzen 9 6900HX
356 Seconds *
Aoostar GOD77
AMD Radeon 680M, AMD Ryzen 7 7735HS
321 Seconds *
Beelink SER6 Pro
AMD Radeon 680M, AMD Ryzen 7 6800H
318 Seconds *
v3.3 Classroom CPU
GMK NucBox M3
Intel UHD Graphics Xe G4 48EUs, Intel Core i5-12450H
741 Seconds * -127%
Beelink SER5
AMD Radeon RX Vega 6 (Ryzen 4000/5000), AMD Ryzen 5 5560U
677 Seconds * -107%
GMK NucBox K3 Pro
Intel UHD Graphics 64EUs (Alder Lake 12th Gen), Intel Core i7-12650H
570 Seconds * -74%
GMK NucBox M4
Intel UHD Graphics Xe 32EUs (Tiger Lake-H), Intel Core i9-11900H
479 Seconds * -46%
Intel NUC 13 Pro Desk Edition Kit
Intel Iris Xe Graphics G7 96EUs, Intel Core i7-1360P
477 Seconds * -46%
Beelink SER6 Pro
AMD Radeon 680M, AMD Ryzen 7 6800H
453 Seconds * -39%
Lenovo IdeaCentre Mini 01IRH8
Intel Iris Xe Graphics G7 96EUs, Intel Core i7-13700H
441 Seconds * -35%
Beelink GTR6
AMD Radeon 680M, AMD Ryzen 9 6900HX
436 Seconds * -33%
Aoostar GOD77
AMD Radeon 680M, AMD Ryzen 7 7735HS
416 Seconds * -27%
Average AMD Radeon 780M
  (300 - 664, n=52)
375 Seconds * -15%
AcePC Wizbox AI
Intel Arc 8-Core iGPU, Intel Core Ultra 7 155H
364 Seconds * -11%
Geekom A7
AMD Radeon 780M, AMD Ryzen 9 7940HS
331 Seconds * -1%
GMK NucBox K6
AMD Radeon 780M, AMD Ryzen 7 7840HS
327 Seconds *
v3.3 Classroom oneAPI/Intel
AcePC Wizbox AI
Intel Arc 8-Core iGPU, Intel Core Ultra 7 155H
255 Seconds *

* ... smaller is better

Performance Rating - Percent
GMK NucBox K6
AMD Ryzen 7 7840HS, AMD Radeon 780M
100 pt
AcePC Wizbox AI
Intel Core Ultra 7 155H, Intel Arc 8-Core iGPU
74.6 pt
Intel NUC 13 Pro Desk Edition Kit
Intel Core i7-1360P, Intel Iris Xe Graphics G7 96EUs
60 pt
Beelink SER5
AMD Ryzen 5 5560U, AMD Radeon RX Vega 6 (Ryzen 4000/5000)
45.9 pt
The Witcher 3 - 1920x1080 Ultra Graphics & Postprocessing (HBAO+)
GMK NucBox K6
AMD Ryzen 7 7840HS, AMD Radeon 780M
30.8 (27min) fps
AcePC Wizbox AI
Intel Core Ultra 7 155H, Intel Arc 8-Core iGPU
20.8 (18min, 19P1) fps -32%
Intel NUC 13 Pro Desk Edition Kit
Intel Core i7-1360P, Intel Iris Xe Graphics G7 96EUs
16.9 fps -45%
Beelink SER5
AMD Ryzen 5 5560U, AMD Radeon RX Vega 6 (Ryzen 4000/5000)
11.8 (11min) fps -62%
GTA V - 1920x1080 Highest Settings possible AA:4xMSAA + FX AF:16x
GMK NucBox K6
AMD Ryzen 7 7840HS, AMD Radeon 780M
26 (2.62min, 17.5P1) fps
AcePC Wizbox AI
Intel Core Ultra 7 155H, Intel Arc 8-Core iGPU
12.3 (3.05min, 8.77P1) fps -53%
Beelink SER5
AMD Ryzen 5 5560U, AMD Radeon RX Vega 6 (Ryzen 4000/5000)
11.2 (6.84min, 7.58P1) fps -57%
Intel NUC 13 Pro Desk Edition Kit
Intel Core i7-1360P, Intel Iris Xe Graphics G7 96EUs
8.8 (4.66min, 7.35P1) fps -66%
Final Fantasy XV Benchmark - 1920x1080 High Quality
GMK NucBox K6
AMD Ryzen 7 7840HS, AMD Radeon 780M
29.3 fps
AcePC Wizbox AI
Intel Core Ultra 7 155H, Intel Arc 8-Core iGPU
21.8 fps -26%
Intel NUC 13 Pro Desk Edition Kit
Intel Core i7-1360P, Intel Iris Xe Graphics G7 96EUs
17.4 fps -41%
Beelink SER5
AMD Ryzen 5 5560U, AMD Radeon RX Vega 6 (Ryzen 4000/5000)
11.5 fps -61%
Strange Brigade - 1920x1080 ultra AA:ultra AF:16
GMK NucBox K6
AMD Ryzen 7 7840HS, AMD Radeon 780M
48.8 (11.1min, 31.1P1) fps
AcePC Wizbox AI
Intel Core Ultra 7 155H, Intel Arc 8-Core iGPU
41 (6.8min, 14.4P1) fps -16%
Intel NUC 13 Pro Desk Edition Kit
Intel Core i7-1360P, Intel Iris Xe Graphics G7 96EUs
26.1 (5.3min, 8.13P1) fps -47%
Beelink SER5
AMD Ryzen 5 5560U, AMD Radeon RX Vega 6 (Ryzen 4000/5000)
20.5 (12.2min, 14.6P1) fps -58%
Dota 2 Reborn - 1920x1080 ultra (3/3) best looking
GMK NucBox K6
AMD Ryzen 7 7840HS, AMD Radeon 780M
87.4 (16.1min) fps
AcePC Wizbox AI
Intel Core Ultra 7 155H, Intel Arc 8-Core iGPU
68.3 (45.5min) fps -22%
Intel NUC 13 Pro Desk Edition Kit
Intel Core i7-1360P, Intel Iris Xe Graphics G7 96EUs
60.5 (52.3min) fps -31%
Beelink SER5
AMD Ryzen 5 5560U, AMD Radeon RX Vega 6 (Ryzen 4000/5000)
45.4 (42.4min) fps -48%
X-Plane 11.11 - 1920x1080 high (fps_test=3)
GMK NucBox K6
AMD Ryzen 7 7840HS, AMD Radeon 780M
39.7 fps
AcePC Wizbox AI
Intel Core Ultra 7 155H, Intel Arc 8-Core iGPU
38.2 fps -4%
Intel NUC 13 Pro Desk Edition Kit
Intel Core i7-1360P, Intel Iris Xe Graphics G7 96EUs
35.4 fps -11%
Beelink SER5
AMD Ryzen 5 5560U, AMD Radeon RX Vega 6 (Ryzen 4000/5000)
24.2 fps -39%
Tiny Tina's Wonderlands
1280x720 Lowest Preset (DX12)
GMK NucBox K6
AMD Ryzen 7 7840HS, AMD Radeon 780M
139 fps
Average AMD Radeon 780M
  (62.6 - 151.2, n=23)
116.7 fps -16%
Aoostar GOD77
AMD Ryzen 7 7735HS, AMD Radeon 680M
100.6 fps -28%
Geekom A7
AMD Ryzen 9 7940HS, AMD Radeon 780M
98.6 fps -29%
Intel NUC 13 Pro Desk Edition Kit
Intel Core i7-1360P, Intel Iris Xe Graphics G7 96EUs
57.7 fps -58%
Lenovo IdeaCentre Mini 01IRH8
Intel Core i7-13700H, Intel Iris Xe Graphics G7 96EUs
54.3 fps -61%
Beelink SER5
AMD Ryzen 5 5560U, AMD Radeon RX Vega 6 (Ryzen 4000/5000)
54 fps -61%
GMK NucBox M3
Intel Core i5-12450H, Intel UHD Graphics Xe G4 48EUs
30.6 fps -78%
1920x1080 Low Preset (DX12)
GMK NucBox K6
AMD Ryzen 7 7840HS, AMD Radeon 780M
74.6 fps
Average AMD Radeon 780M
  (34.3 - 77.7, n=23)
61.7 fps -17%
Aoostar GOD77
AMD Ryzen 7 7735HS, AMD Radeon 680M
54.7 fps -27%
Geekom A7
AMD Ryzen 9 7940HS, AMD Radeon 780M
48.8 fps -35%
Intel NUC 13 Pro Desk Edition Kit
Intel Core i7-1360P, Intel Iris Xe Graphics G7 96EUs
32.3 fps -57%
Lenovo IdeaCentre Mini 01IRH8
Intel Core i7-13700H, Intel Iris Xe Graphics G7 96EUs
27.5 fps -63%
Beelink SER5
AMD Ryzen 5 5560U, AMD Radeon RX Vega 6 (Ryzen 4000/5000)
25.6 fps -66%
GMK NucBox M3
Intel Core i5-12450H, Intel UHD Graphics Xe G4 48EUs
17.1 fps -77%
1920x1080 Medium Preset (DX12)
GMK NucBox K6
AMD Ryzen 7 7840HS, AMD Radeon 780M
52.2 fps
Average AMD Radeon 780M
  (28.4 - 55.9, n=23)
45.1 fps -14%
Aoostar GOD77
AMD Ryzen 7 7735HS, AMD Radeon 680M
40.5 fps -22%
Geekom A7
AMD Ryzen 9 7940HS, AMD Radeon 780M
36.2 fps -31%
Intel NUC 13 Pro Desk Edition Kit
Intel Core i7-1360P, Intel Iris Xe Graphics G7 96EUs
25.4 fps -51%
Lenovo IdeaCentre Mini 01IRH8
Intel Core i7-13700H, Intel Iris Xe Graphics G7 96EUs
20.9 fps -60%
Beelink SER5
AMD Ryzen 5 5560U, AMD Radeon RX Vega 6 (Ryzen 4000/5000)
19.5 fps -63%
GMK NucBox M3
Intel Core i5-12450H, Intel UHD Graphics Xe G4 48EUs
13.3 fps -75%
1920x1080 High Preset (DX12)
GMK NucBox K6
AMD Ryzen 7 7840HS, AMD Radeon 780M
36.6 fps
Average AMD Radeon 780M
  (18.6 - 38.8, n=23)
31.3 fps -14%
Geekom A7
AMD Ryzen 9 7940HS, AMD Radeon 780M
29.9 fps -18%
Aoostar GOD77
AMD Ryzen 7 7735HS, AMD Radeon 680M
28.2 fps -23%
Intel NUC 13 Pro Desk Edition Kit
Intel Core i7-1360P, Intel Iris Xe Graphics G7 96EUs
15.9 fps -57%
Lenovo IdeaCentre Mini 01IRH8
Intel Core i7-13700H, Intel Iris Xe Graphics G7 96EUs
13.5 fps -63%
Beelink SER5
AMD Ryzen 5 5560U, AMD Radeon RX Vega 6 (Ryzen 4000/5000)
12.1 fps -67%
1920x1080 Badass Preset (DX12)
GMK NucBox K6
AMD Ryzen 7 7840HS, AMD Radeon 780M
29.5 fps
Geekom A7
AMD Ryzen 9 7940HS, AMD Radeon 780M
26.5 fps -10%
Average AMD Radeon 780M
  (16.5 - 31.3, n=23)
25.7 fps -13%
Aoostar GOD77
AMD Ryzen 7 7735HS, AMD Radeon 680M
22.6 fps -23%
Intel NUC 13 Pro Desk Edition Kit
Intel Core i7-1360P, Intel Iris Xe Graphics G7 96EUs
13.5 fps -54%
Lenovo IdeaCentre Mini 01IRH8
Intel Core i7-13700H, Intel Iris Xe Graphics G7 96EUs
10.6 fps -64%
Beelink SER5
AMD Ryzen 5 5560U, AMD Radeon RX Vega 6 (Ryzen 4000/5000)
8.9 fps -70%
F1 22
1280x720 Ultra Low Preset AA:T AF:16x
Geekom A7
AMD Ryzen 9 7940HS, AMD Radeon 780M
171.9 (142min, 114P1) fps +1%
GMK NucBox K6
AMD Ryzen 7 7840HS, AMD Radeon 780M
170 (137min, 113P1) fps
Average AMD Radeon 780M
  (85.4 - 186.7, n=27)
143.5 fps -16%
Aoostar GOD77
AMD Ryzen 7 7735HS, AMD Radeon 680M
128.6 (111min, 94P1) fps -24%
Intel NUC 13 Pro Desk Edition Kit
Intel Core i7-1360P, Intel Iris Xe Graphics G7 96EUs
80.1 (65min, 63P1) fps -53%
Lenovo IdeaCentre Mini 01IRH8
Intel Core i7-13700H, Intel Iris Xe Graphics G7 96EUs
71.6 (59min, 58P1) fps -58%
Beelink SER5
AMD Ryzen 5 5560U, AMD Radeon RX Vega 6 (Ryzen 4000/5000)
61.5 (52min, 51P1) fps -64%
GMK NucBox M3
Intel Core i5-12450H, Intel UHD Graphics Xe G4 48EUs
51.7 (41min, 40P1) fps -70%
1920x1080 Low Preset AA:T AF:16x
GMK NucBox K6
AMD Ryzen 7 7840HS, AMD Radeon 780M
99.8 (12min, 70P1) fps
Geekom A7
AMD Ryzen 9 7940HS, AMD Radeon 780M
96.9 (70min, 53P1) fps -3%
Average AMD Radeon 780M
  (47 - 109.9, n=33)
84.8 fps -15%
Aoostar GOD77
AMD Ryzen 7 7735HS, AMD Radeon 680M
77.1 (64min, 61P1) fps -23%
Intel NUC 13 Pro Desk Edition Kit
Intel Core i7-1360P, Intel Iris Xe Graphics G7 96EUs
47.6 (39min, 39P1) fps -52%
Lenovo IdeaCentre Mini 01IRH8
Intel Core i7-13700H, Intel Iris Xe Graphics G7 96EUs
39.2 (32min, 31P1) fps -61%
Beelink SER5
AMD Ryzen 5 5560U, AMD Radeon RX Vega 6 (Ryzen 4000/5000)
32.4 (28min, 26P1) fps -68%
GMK NucBox M3
Intel Core i5-12450H, Intel UHD Graphics Xe G4 48EUs
27.9 (23min, 19P1) fps -72%
1920x1080 Medium Preset AA:T AF:16x
Geekom A7
AMD Ryzen 9 7940HS, AMD Radeon 780M
88.4 (62min, 63P1) fps +3%
GMK NucBox K6
AMD Ryzen 7 7840HS, AMD Radeon 780M
85.9 (67min, 59P1) fps
Average AMD Radeon 780M
  (41.5 - 95, n=33)
75 fps -13%
Aoostar GOD77
AMD Ryzen 7 7735HS, AMD Radeon 680M
66.9 (56min, 51P1) fps -22%
Intel NUC 13 Pro Desk Edition Kit
Intel Core i7-1360P, Intel Iris Xe Graphics G7 96EUs
43.4 (36min, 36P1) fps -49%
Lenovo IdeaCentre Mini 01IRH8
Intel Core i7-13700H, Intel Iris Xe Graphics G7 96EUs
36.7 (30min, 30P1) fps -57%
Beelink SER5
AMD Ryzen 5 5560U, AMD Radeon RX Vega 6 (Ryzen 4000/5000)
28.6 (25min, 24P1) fps -67%
GMK NucBox M3
Intel Core i5-12450H, Intel UHD Graphics Xe G4 48EUs
24.8 (21min, 17P1) fps -71%
1920x1080 High Preset AA:T AF:16x
GMK NucBox K6
AMD Ryzen 7 7840HS, AMD Radeon 780M
66.7 (53min, 36P1) fps
Geekom A7
AMD Ryzen 9 7940HS, AMD Radeon 780M
65.1 (56min, 51P1) fps -2%
Average AMD Radeon 780M
  (31.7 - 70.6, n=33)
55.9 fps -16%
Aoostar GOD77
AMD Ryzen 7 7735HS, AMD Radeon 680M
50.1 (40min, 39P1) fps -25%
Intel NUC 13 Pro Desk Edition Kit
Intel Core i7-1360P, Intel Iris Xe Graphics G7 96EUs
31.7 (27min, 26P1) fps -52%
Lenovo IdeaCentre Mini 01IRH8
Intel Core i7-13700H, Intel Iris Xe Graphics G7 96EUs
27 (22min, 22P1) fps -60%
Beelink SER5
AMD Ryzen 5 5560U, AMD Radeon RX Vega 6 (Ryzen 4000/5000)
21.6 (18min, 18P1) fps -68%
GMK NucBox M3
Intel Core i5-12450H, Intel UHD Graphics Xe G4 48EUs
17.5 (14min, 12P1) fps -74%
1920x1080 Ultra High Preset AA:T AF:16x
Intel NUC 13 Pro Desk Edition Kit
Intel Core i7-1360P, Intel Iris Xe Graphics G7 96EUs
24 (20min, 20P1) fps +30%
Lenovo IdeaCentre Mini 01IRH8
Intel Core i7-13700H, Intel Iris Xe Graphics G7 96EUs
20.7 (17min, 17P1) fps +13%
Geekom A7
AMD Ryzen 9 7940HS, AMD Radeon 780M
18.5 (13min, 12P1) fps +1%
GMK NucBox K6
AMD Ryzen 7 7840HS, AMD Radeon 780M
18.4 (12min, 12P1) fps
Average AMD Radeon 780M
  (9.92 - 19.2, n=25)
15.4 fps -16%
Beelink SER5
AMD Ryzen 5 5560U, AMD Radeon RX Vega 6 (Ryzen 4000/5000)
15.3 (13min, 13P1) fps -17%
GMK NucBox M3
Intel Core i5-12450H, Intel UHD Graphics Xe G4 48EUs
13.5 (11min, 11P1) fps -27%
The Witcher 3
1024x768 Low Graphics & Postprocessing
GMK NucBox K6
AMD Ryzen 7 7840HS, AMD Radeon 780M
155.1 (145min) fps
Geekom A7
AMD Ryzen 9 7940HS, AMD Radeon 780M
154.6 (12.9min, 32P0.1, 98.7P1) fps 0%
Beelink GTR6
AMD Ryzen 9 6900HX, AMD Radeon 680M
139.2 (119min) fps -10%
Beelink SER6 Pro
AMD Ryzen 7 6800H, AMD Radeon 680M
138.1 (116min) fps -11%
Average AMD Radeon 780M
  (74 - 163.3, n=37)
136.9 fps -12%
Aoostar GOD77
AMD Ryzen 7 7735HS, AMD Radeon 680M
119.3 (5.54min, 30P0.1, 77.7P1) fps -23%
Intel NUC 13 Pro Desk Edition Kit
Intel Core i7-1360P, Intel Iris Xe Graphics G7 96EUs
102 fps -34%
Lenovo IdeaCentre Mini 01IRH8
Intel Core i7-13700H, Intel Iris Xe Graphics G7 96EUs
85.8 (61min) fps -45%
GMK NucBox K3 Pro
Intel Core i7-12650H, Intel UHD Graphics 64EUs (Alder Lake 12th Gen)
85.3 (69min) fps -45%
GMK NucBox M3
Intel Core i5-12450H, Intel UHD Graphics Xe G4 48EUs
61.1 (39min) fps -61%
Beelink SER5
AMD Ryzen 5 5560U, AMD Radeon RX Vega 6 (Ryzen 4000/5000)
58.8 (52min) fps -62%
GMK NucBox M4
Intel Core i9-11900H, Intel UHD Graphics Xe 32EUs (Tiger Lake-H)
49.7 (44min) fps -68%
1366x768 Medium Graphics & Postprocessing
Geekom A7
AMD Ryzen 9 7940HS, AMD Radeon 780M
99.3 (25.6min, 43.8P0.1, 72.1P1) fps 0%
GMK NucBox K6
AMD Ryzen 7 7840HS, AMD Radeon 780M
99 (72min) fps
Average AMD Radeon 780M
  (47.7 - 103.8, n=21)
89.6 fps -9%
Beelink SER6 Pro
AMD Ryzen 7 6800H, AMD Radeon 680M
85.1 (80min) fps -14%
Beelink GTR6
AMD Ryzen 9 6900HX, AMD Radeon 680M
84 (77min) fps -15%
Aoostar GOD77
AMD Ryzen 7 7735HS, AMD Radeon 680M
76.6 (20.1min, 52.2P0.1, 62.8P1) fps -23%
GMK NucBox K3 Pro
Intel Core i7-12650H, Intel UHD Graphics 64EUs (Alder Lake 12th Gen)
56 (53min) fps -43%
Lenovo IdeaCentre Mini 01IRH8
Intel Core i7-13700H, Intel Iris Xe Graphics G7 96EUs
54.3 (52min) fps -45%
Beelink SER5
AMD Ryzen 5 5560U, AMD Radeon RX Vega 6 (Ryzen 4000/5000)
39 (36min) fps -61%
GMK NucBox M3
Intel Core i5-12450H, Intel UHD Graphics Xe G4 48EUs
38.6 (36min) fps -61%
GMK NucBox M4
Intel Core i9-11900H, Intel UHD Graphics Xe 32EUs (Tiger Lake-H)
29.8 (18min) fps -70%
1920x1080 High Graphics & Postprocessing (Nvidia HairWorks Off)
GMK NucBox K6
AMD Ryzen 7 7840HS, AMD Radeon 780M
50.9 (45min) fps
Geekom A7
AMD Ryzen 9 7940HS, AMD Radeon 780M
49.6 (13.7min, 22.8P0.1, 39.2P1) fps -3%
Beelink GTR6
AMD Ryzen 9 6900HX, AMD Radeon 680M
46 (41min) fps -10%
Average AMD Radeon 780M
  (21.3 - 52.2, n=45)
44.2 fps -13%
Beelink SER6 Pro
AMD Ryzen 7 6800H, AMD Radeon 680M
43.3 (36min) fps -15%
Aoostar GOD77
AMD Ryzen 7 7735HS, AMD Radeon 680M
36.3 (14.7min, 17.9P0.1, 30.9P1) fps -29%
Intel NUC 13 Pro Desk Edition Kit
Intel Core i7-1360P, Intel Iris Xe Graphics G7 96EUs
33.5 fps -34%
GMK NucBox K3 Pro
Intel Core i7-12650H, Intel UHD Graphics 64EUs (Alder Lake 12th Gen)
30.1 (28min) fps -41%
Lenovo IdeaCentre Mini 01IRH8
Intel Core i7-13700H, Intel Iris Xe Graphics G7 96EUs
26.8 (26min) fps -47%
GMK NucBox M3
Intel Core i5-12450H, Intel UHD Graphics Xe G4 48EUs
20.1 (17min) fps -61%
Beelink SER5
AMD Ryzen 5 5560U, AMD Radeon RX Vega 6 (Ryzen 4000/5000)
18.8 (17min) fps -63%
GMK NucBox M4
Intel Core i9-11900H, Intel UHD Graphics Xe 32EUs (Tiger Lake-H)
16.7 (14min) fps -67%
1920x1080 Ultra Graphics & Postprocessing (HBAO+)
Geekom A7
AMD Ryzen 9 7940HS, AMD Radeon 780M
32.5 fps +6%
GMK NucBox K6
AMD Ryzen 7 7840HS, AMD Radeon 780M
30.8 (27min) fps
Average AMD Radeon 780M
  (14.3 - 36, n=47)
28 fps -9%
Beelink GTR6
AMD Ryzen 9 6900HX, AMD Radeon 680M
27.1 (24min) fps -12%
Beelink SER6 Pro
AMD Ryzen 7 6800H, AMD Radeon 680M
27 (25min) fps -12%
Aoostar GOD77
AMD Ryzen 7 7735HS, AMD Radeon 680M
22.7 (14.2min, 14.3P0.1, 14.6P1) fps -26%
AcePC Wizbox AI
Intel Core Ultra 7 155H, Intel Arc 8-Core iGPU
20.8 (18min, 19P1) fps -32%
Intel NUC 13 Pro Desk Edition Kit
Intel Core i7-1360P, Intel Iris Xe Graphics G7 96EUs
16.9 fps -45%
GMK NucBox K3 Pro
Intel Core i7-12650H, Intel UHD Graphics 64EUs (Alder Lake 12th Gen)
13.8 (12min) fps -55%
Lenovo IdeaCentre Mini 01IRH8
Intel Core i7-13700H, Intel Iris Xe Graphics G7 96EUs
12.4 (11min) fps -60%
Beelink SER5
AMD Ryzen 5 5560U, AMD Radeon RX Vega 6 (Ryzen 4000/5000)
11.8 (11min) fps -62%
GMK NucBox M3
Intel Core i5-12450H, Intel UHD Graphics Xe G4 48EUs
9.5 (8min) fps -69%
GMK NucBox M4
Intel Core i9-11900H, Intel UHD Graphics Xe 32EUs (Tiger Lake-H)
8.2 (7min) fps -73%
Far Cry 5
1280x720 Low Preset AA:T
Geekom A7
AMD Ryzen 9 7940HS, AMD Radeon 780M
86 (76min) fps 0%
GMK NucBox K6
AMD Ryzen 7 7840HS, AMD Radeon 780M
86 (75min) fps
Average AMD Radeon 780M
  (42 - 89, n=42)
71.9 fps -16%
Aoostar GOD77
AMD Ryzen 7 7735HS, AMD Radeon 680M
67 (57min) fps -22%
Beelink SER5
AMD Ryzen 5 5560U, AMD Radeon RX Vega 6 (Ryzen 4000/5000)
46 (41min) fps -47%
Intel NUC 13 Pro Desk Edition Kit
Intel Core i7-1360P, Intel Iris Xe Graphics G7 96EUs
45 (40min) fps -48%
Lenovo IdeaCentre Mini 01IRH8
Intel Core i7-13700H, Intel Iris Xe Graphics G7 96EUs
45 (41min) fps -48%
GMK NucBox M3
Intel Core i5-12450H, Intel UHD Graphics Xe G4 48EUs
34 (20min) fps -60%
1920x1080 Medium Preset AA:T
GMK NucBox K6
AMD Ryzen 7 7840HS, AMD Radeon 780M
49 (44min) fps
Geekom A7
AMD Ryzen 9 7940HS, AMD Radeon 780M
47 (41min) fps -4%
Average AMD Radeon 780M
  (22 - 54, n=44)
42.3 fps -14%
Aoostar GOD77
AMD Ryzen 7 7735HS, AMD Radeon 680M
39 (35min) fps -20%
Intel NUC 13 Pro Desk Edition Kit
Intel Core i7-1360P, Intel Iris Xe Graphics G7 96EUs
29 (27min) fps -41%
Lenovo IdeaCentre Mini 01IRH8
Intel Core i7-13700H, Intel Iris Xe Graphics G7 96EUs
22 (20min) fps -55%
Beelink SER5
AMD Ryzen 5 5560U, AMD Radeon RX Vega 6 (Ryzen 4000/5000)
21 (18min) fps -57%
GMK NucBox M3
Intel Core i5-12450H, Intel UHD Graphics Xe G4 48EUs
17 (15min) fps -65%
1920x1080 High Preset AA:T
GMK NucBox K6
AMD Ryzen 7 7840HS, AMD Radeon 780M
45 (41min) fps
Geekom A7
AMD Ryzen 9 7940HS, AMD Radeon 780M
43 (38min) fps -4%
Average AMD Radeon 780M
  (21 - 49, n=44)
39 fps -13%
Aoostar GOD77
AMD Ryzen 7 7735HS, AMD Radeon 680M
35 (31min) fps -22%
Intel NUC 13 Pro Desk Edition Kit
Intel Core i7-1360P, Intel Iris Xe Graphics G7 96EUs
27 (25min) fps -40%
Lenovo IdeaCentre Mini 01IRH8
Intel Core i7-13700H, Intel Iris Xe Graphics G7 96EUs
21 (19min) fps -53%
Beelink SER5
AMD Ryzen 5 5560U, AMD Radeon RX Vega 6 (Ryzen 4000/5000)
19 (17min) fps -58%
GMK NucBox M3
Intel Core i5-12450H, Intel UHD Graphics Xe G4 48EUs
16 (14min) fps -64%
1920x1080 Ultra Preset AA:T
GMK NucBox K6
AMD Ryzen 7 7840HS, AMD Radeon 780M
43 (38min) fps
Geekom A7
AMD Ryzen 9 7940HS, AMD Radeon 780M
41 (36min) fps -5%
Average AMD Radeon 780M
  (21 - 47, n=44)
37 fps -14%
Aoostar GOD77
AMD Ryzen 7 7735HS, AMD Radeon 680M
34 (30min) fps -21%
Intel NUC 13 Pro Desk Edition Kit
Intel Core i7-1360P, Intel Iris Xe Graphics G7 96EUs
26 (23min) fps -40%
Lenovo IdeaCentre Mini 01IRH8
Intel Core i7-13700H, Intel Iris Xe Graphics G7 96EUs
20 (18min) fps -53%
Beelink SER5
AMD Ryzen 5 5560U, AMD Radeon RX Vega 6 (Ryzen 4000/5000)
18 (16min) fps -58%
GMK NucBox M3
Intel Core i5-12450H, Intel UHD Graphics Xe G4 48EUs
15 (13min) fps -65%
GTA V
1024x768 Lowest Settings possible
Geekom A7
AMD Ryzen 9 7940HS, AMD Radeon 780M
167.5 (5.17min, 125P1) fps +3%
GMK NucBox K6
AMD Ryzen 7 7840HS, AMD Radeon 780M
163.4 (2.4min, 100P1) fps
Beelink GTR6
AMD Ryzen 9 6900HX, AMD Radeon 680M
152.6 (4.69min, 100P1) fps -7%
Beelink SER6 Pro
AMD Ryzen 7 6800H, AMD Radeon 680M
152.3 (4.42min, 100P1) fps -7%
Aoostar GOD77
AMD Ryzen 7 7735HS, AMD Radeon 680M
147.3 (5.71min, 100P1) fps -10%
Average AMD Radeon 780M
  (91.6 - 169.4, n=48)
145.1 fps -11%
Intel NUC 13 Pro Desk Edition Kit
Intel Core i7-1360P, Intel Iris Xe Graphics G7 96EUs
124.5 (12.7min, 76.9P1) fps -24%
Beelink SER5
AMD Ryzen 5 5560U, AMD Radeon RX Vega 6 (Ryzen 4000/5000)
111.2 (8.07min, 76.9P1) fps -32%
GMK NucBox M3
Intel Core i5-12450H, Intel UHD Graphics Xe G4 48EUs
106.7 (12.9min, 71.4P1) fps -35%
Lenovo IdeaCentre Mini 01IRH8
Intel Core i7-13700H, Intel Iris Xe Graphics G7 96EUs
103.8 (6.31min, 71.4P1) fps -36%
1920x1080 Lowest Settings possible
Geekom A7
AMD Ryzen 9 7940HS, AMD Radeon 780M
127.1 (21.2min, 90.9P1) fps +2%
GMK NucBox K6
AMD Ryzen 7 7840HS, AMD Radeon 780M
124.7 (11.8min, 83.3P1) fps
Average AMD Radeon 780M
  (60.9 - 130.2, n=32)
113.5 fps -9%
Beelink GTR6
AMD Ryzen 9 6900HX, AMD Radeon 680M
112 (30.2min, 71.4P1) fps -10%
Beelink SER6 Pro
AMD Ryzen 7 6800H, AMD Radeon 680M
111.4 (35min, 71.4P1) fps -11%
Aoostar GOD77
AMD Ryzen 7 7735HS, AMD Radeon 680M
109.8 (9.31min, 71.4P1) fps -12%
Intel NUC 13 Pro Desk Edition Kit
Intel Core i7-1360P, Intel Iris Xe Graphics G7 96EUs
87.6 (30.9min, 58.8P1) fps -30%
Lenovo IdeaCentre Mini 01IRH8
Intel Core i7-13700H, Intel Iris Xe Graphics G7 96EUs
64.6 (20.6min, 45.5P1) fps -48%
Beelink SER5
AMD Ryzen 5 5560U, AMD Radeon RX Vega 6 (Ryzen 4000/5000)
64 (8.04min, 45.5P1) fps -49%
GMK NucBox M3
Intel Core i5-12450H, Intel UHD Graphics Xe G4 48EUs
61.2 (24.1min, 45.5P1) fps -51%
1366x768 Normal/Off AF:4x
Geekom A7
AMD Ryzen 9 7940HS, AMD Radeon 780M
157.4 (5.24min, 100P1) fps +2%
GMK NucBox K6
AMD Ryzen 7 7840HS, AMD Radeon 780M
153.8 (4.97min, 90.9P1) fps
Beelink SER6 Pro
AMD Ryzen 7 6800H, AMD Radeon 680M
139.7 (5.95min, 90.9P1) fps -9%
Average AMD Radeon 780M
  (91.2 - 159, n=39)
138.5 fps -10%
Beelink GTR6
AMD Ryzen 9 6900HX, AMD Radeon 680M
138 (28min, 90.9P1) fps -10%
Aoostar GOD77
AMD Ryzen 7 7735HS, AMD Radeon 680M
134.5 (8.19min, 90.9P1) fps -13%
Intel NUC 13 Pro Desk Edition Kit
Intel Core i7-1360P, Intel Iris Xe Graphics G7 96EUs
101.9 (27.6min, 62.5P1) fps -34%
Beelink SER5
AMD Ryzen 5 5560U, AMD Radeon RX Vega 6 (Ryzen 4000/5000)
97.5 (36.1min, 62.5P1) fps -37%
GMK NucBox M3
Intel Core i5-12450H, Intel UHD Graphics Xe G4 48EUs
90.7 (31.1min, 55.6P1) fps -41%
AcePC Wizbox AI
Intel Core Ultra 7 155H, Intel Arc 8-Core iGPU
90.4 (9.41min, 62.5P1) fps -41%
Lenovo IdeaCentre Mini 01IRH8
Intel Core i7-13700H, Intel Iris Xe Graphics G7 96EUs
84 (16.1min, 55.6P1) fps -45%
1920x1080 Normal/Off AF:4x
Geekom A7
AMD Ryzen 9 7940HS, AMD Radeon 780M
131.5 (6.41min, 90.9P1) fps +2%
GMK NucBox K6
AMD Ryzen 7 7840HS, AMD Radeon 780M
128.7 (21.5min, 76.9P1) fps
Average AMD Radeon 780M
  (64.9 - 133.5, n=31)
114.4 fps -11%
Aoostar GOD77
AMD Ryzen 7 7735HS, AMD Radeon 680M
111.3 (22.1min, 71.4P1) fps -14%
Beelink SER6 Pro
AMD Ryzen 7 6800H, AMD Radeon 680M
110.4 (6.6min, 71.4P1) fps -14%
Beelink GTR6
AMD Ryzen 9 6900HX, AMD Radeon 680M
109.6 (8.03min, 71.4P1) fps -15%
AcePC Wizbox AI
Intel Core Ultra 7 155H, Intel Arc 8-Core iGPU
90.4 (9.41min, 62.5P1) fps -30%
Intel NUC 13 Pro Desk Edition Kit
Intel Core i7-1360P, Intel Iris Xe Graphics G7 96EUs
74.8 (27min, 47.6P1) fps -42%
Beelink SER5
AMD Ryzen 5 5560U, AMD Radeon RX Vega 6 (Ryzen 4000/5000)
64.1 (29.4min, 45.5P1) fps -50%
GMK NucBox M3
Intel Core i5-12450H, Intel UHD Graphics Xe G4 48EUs
61.7 (28min, 45.5P1) fps -52%
Lenovo IdeaCentre Mini 01IRH8
Intel Core i7-13700H, Intel Iris Xe Graphics G7 96EUs
57.5 (17.4min, 38.5P1) fps -55%
1920x1080 High/On (Advanced Graphics Off) AA:2xMSAA + FX AF:8x
Geekom A7
AMD Ryzen 9 7940HS, AMD Radeon 780M
66.6 (4.46min, 37P1) fps +1%
GMK NucBox K6
AMD Ryzen 7 7840HS, AMD Radeon 780M
65.7 (3.85min, 40P1) fps
Average AMD Radeon 780M
  (32.5 - 68.6, n=49)
60.1 fps -9%
Beelink SER6 Pro
AMD Ryzen 7 6800H, AMD Radeon 680M
51.9 (14.3min, 37P1) fps -21%
Beelink GTR6
AMD Ryzen 9 6900HX, AMD Radeon 680M
51.8 (9.91min, 35.7P1) fps -21%
Aoostar GOD77
AMD Ryzen 7 7735HS, AMD Radeon 680M
48.7 (9.22min, 34.5P1) fps -26%
AcePC Wizbox AI
Intel Core Ultra 7 155H, Intel Arc 8-Core iGPU
32.2 (6.83min, 23.3P1) fps -51%
Beelink SER5
AMD Ryzen 5 5560U, AMD Radeon RX Vega 6 (Ryzen 4000/5000)
24.6 (11.1min, 17.9P1) fps -63%
Intel NUC 13 Pro Desk Edition Kit
Intel Core i7-1360P, Intel Iris Xe Graphics G7 96EUs
20.9 (10.5min, 16.7P1) fps -68%
Lenovo IdeaCentre Mini 01IRH8
Intel Core i7-13700H, Intel Iris Xe Graphics G7 96EUs
15.9 (6.66min, 12.5P1) fps -76%
GMK NucBox M3
Intel Core i5-12450H, Intel UHD Graphics Xe G4 48EUs
15 (10min, 11.4P1) fps -77%
1920x1080 Highest Settings possible AA:4xMSAA + FX AF:16x
GMK NucBox K6
AMD Ryzen 7 7840HS, AMD Radeon 780M
26 (2.62min, 17.5P1) fps
Geekom A7
AMD Ryzen 9 7940HS, AMD Radeon 780M
25.7 (4.34min, 14.1P1) fps -1%
Average AMD Radeon 780M
  (12.2 - 27.7, n=49)
24.6 fps -5%
Beelink GTR6
AMD Ryzen 9 6900HX, AMD Radeon 680M
23.7 (7.88min, 16.4P1) fps -9%
Beelink SER6 Pro
AMD Ryzen 7 6800H, AMD Radeon 680M
23.7 (9.52min, 16.4P1) fps -9%
Aoostar GOD77
AMD Ryzen 7 7735HS, AMD Radeon 680M
20.4 (4.1min, 14.7P1) fps -22%
AcePC Wizbox AI
Intel Core Ultra 7 155H, Intel Arc 8-Core iGPU
12.3 (3.05min, 8.77P1) fps -53%
Beelink SER5
AMD Ryzen 5 5560U, AMD Radeon RX Vega 6 (Ryzen 4000/5000)
11.2 (6.84min, 7.58P1) fps -57%
Intel NUC 13 Pro Desk Edition Kit
Intel Core i7-1360P, Intel Iris Xe Graphics G7 96EUs
8.8 (4.66min, 7.35P1) fps -66%
Lenovo IdeaCentre Mini 01IRH8
Intel Core i7-13700H, Intel Iris Xe Graphics G7 96EUs
6.8 (3.29min, 3.76P1) fps -74%
GMK NucBox M3
Intel Core i5-12450H, Intel UHD Graphics Xe G4 48EUs
6.32 (3.91min, 4.98P1) fps -76%
X-Plane 11.11
1280x720 low (fps_test=1)
Geekom A7
AMD Ryzen 9 7940HS, AMD Radeon 780M
67.6 fps +3%
Beelink SER6 Pro
AMD Ryzen 7 6800H, AMD Radeon 680M
66.4 fps +1%
GMK NucBox K6
AMD Ryzen 7 7840HS, AMD Radeon 780M
65.9 fps
Beelink GTR6
AMD Ryzen 9 6900HX, AMD Radeon 680M
64.8 fps -2%
Aoostar GOD77
AMD Ryzen 7 7735HS, AMD Radeon 680M
62.7 fps -5%
AcePC Wizbox AI
Intel Core Ultra 7 155H, Intel Arc 8-Core iGPU
61.5 fps -7%
AcePC Wizbox AI
Intel Core Ultra 7 155H, Intel Arc 8-Core iGPU
53.4 fps -19%
Intel NUC 13 Pro Desk Edition Kit
Intel Core i7-1360P, Intel Iris Xe Graphics G7 96EUs
54.6 fps -17%
Average AMD Radeon 780M
  (39 - 69.6, n=58)
53.2 fps -19%
Geekom Mini IT13
Intel Core i9-13900H, Intel Iris Xe Graphics G7 96EUs
50.5 fps -23%
Lenovo IdeaCentre Mini 01IRH8
Intel Core i7-13700H, Intel Iris Xe Graphics G7 96EUs
43.4 fps -34%
GMK NucBox K3 Pro
Intel Core i7-12650H, Intel UHD Graphics 64EUs (Alder Lake 12th Gen)
41.3 fps -37%
GMK NucBox M4
Intel Core i9-11900H, Intel UHD Graphics Xe 32EUs (Tiger Lake-H)
38.8 fps -41%
Beelink SER5
AMD Ryzen 5 5560U, AMD Radeon RX Vega 6 (Ryzen 4000/5000)
38 fps -42%
GMK NucBox M3
Intel Core i5-12450H, Intel UHD Graphics Xe G4 48EUs
36.3 fps -45%
1920x1080 med (fps_test=2)
Beelink SER6 Pro
AMD Ryzen 7 6800H, AMD Radeon 680M
52.9 fps +12%
Beelink GTR6
AMD Ryzen 9 6900HX, AMD Radeon 680M
52.6 fps +11%
Aoostar GOD77
AMD Ryzen 7 7735HS, AMD Radeon 680M
49.8 fps +5%
Geekom A7
AMD Ryzen 9 7940HS, AMD Radeon 780M
48.2 fps +2%
GMK NucBox K6
AMD Ryzen 7 7840HS, AMD Radeon 780M
47.3 fps
AcePC Wizbox AI
Intel Core Ultra 7 155H, Intel Arc 8-Core iGPU
46.9 fps -1%
AcePC Wizbox AI
Intel Core Ultra 7 155H, Intel Arc 8-Core iGPU
41.3 fps -13%
Intel NUC 13 Pro Desk Edition Kit
Intel Core i7-1360P, Intel Iris Xe Graphics G7 96EUs
41 fps -13%
Average AMD Radeon 780M
  (26.2 - 48.9, n=58)
38.9 fps -18%
Geekom Mini IT13
Intel Core i9-13900H, Intel Iris Xe Graphics G7 96EUs
36.1 fps -24%
GMK NucBox K3 Pro
Intel Core i7-12650H, Intel UHD Graphics 64EUs (Alder Lake 12th Gen)
33.1 fps -30%
Lenovo IdeaCentre Mini 01IRH8
Intel Core i7-13700H, Intel Iris Xe Graphics G7 96EUs
32.9 fps -30%
Beelink SER5
AMD Ryzen 5 5560U, AMD Radeon RX Vega 6 (Ryzen 4000/5000)
27.4 fps -42%
GMK NucBox M4
Intel Core i9-11900H, Intel UHD Graphics Xe 32EUs (Tiger Lake-H)
26.3 fps -44%
GMK NucBox M3
Intel Core i5-12450H, Intel UHD Graphics Xe G4 48EUs
23.8 fps -50%
1920x1080 high (fps_test=3)
Beelink SER6 Pro
AMD Ryzen 7 6800H, AMD Radeon 680M
43 fps +8%
Beelink GTR6
AMD Ryzen 9 6900HX, AMD Radeon 680M
41.8 fps +5%
Aoostar GOD77
AMD Ryzen 7 7735HS, AMD Radeon 680M
41.6 fps +5%
Geekom A7
AMD Ryzen 9 7940HS, AMD Radeon 780M
40.7 fps +3%
GMK NucBox K6
AMD Ryzen 7 7840HS, AMD Radeon 780M
39.7 fps
AcePC Wizbox AI
Intel Core Ultra 7 155H, Intel Arc 8-Core iGPU
38.2 fps -4%
Intel NUC 13 Pro Desk Edition Kit
Intel Core i7-1360P, Intel Iris Xe Graphics G7 96EUs
35.4 fps -11%
Average AMD Radeon 780M
  (24.5 - 41.5, n=57)
32.7 fps -18%
Geekom Mini IT13
Intel Core i9-13900H, Intel Iris Xe Graphics G7 96EUs
31.4 fps -21%
Lenovo IdeaCentre Mini 01IRH8
Intel Core i7-13700H, Intel Iris Xe Graphics G7 96EUs
28.5 fps -28%
GMK NucBox K3 Pro
Intel Core i7-12650H, Intel UHD Graphics 64EUs (Alder Lake 12th Gen)
26 fps -35%
Beelink SER5
AMD Ryzen 5 5560U, AMD Radeon RX Vega 6 (Ryzen 4000/5000)
24.2 fps -39%
GMK NucBox M4
Intel Core i9-11900H, Intel UHD Graphics Xe 32EUs (Tiger Lake-H)
23.3 fps -41%
GMK NucBox M3
Intel Core i5-12450H, Intel UHD Graphics Xe G4 48EUs
22 fps -45%
Baldur's Gate 3
1920x1080 Low Preset
GMK NucBox K6
AMD Ryzen 7 7840HS, AMD Radeon 780M
40.5 fps
Average AMD Radeon 780M
  (20.2 - 43.9, n=22)
36.5 fps -10%
1920x1080 Medium Preset
GMK NucBox K6
AMD Ryzen 7 7840HS, AMD Radeon 780M
33.7 fps
Average AMD Radeon 780M
  (15.7 - 36.8, n=24)
29.3 fps -13%
1920x1080 High Preset
GMK NucBox K6
AMD Ryzen 7 7840HS, AMD Radeon 780M
28.1 fps
Average AMD Radeon 780M
  (13.8 - 29.9, n=24)
24.4 fps -13%
1920x1080 Ultra Preset
GMK NucBox K6
AMD Ryzen 7 7840HS, AMD Radeon 780M
27 fps
Average AMD Radeon 780M
  (13.4 - 29.2, n=23)
23.6 fps -13%
Cyberpunk 2077 2.1 Phantom Liberty
1280x720 Low Preset (FSR off)
GMK NucBox K6
AMD Ryzen 7 7840HS, AMD Radeon 780M
77.4 (28.7min) fps
Average AMD Radeon 780M
  (53.6 - 80.6, n=21)
66.5 fps -14%
1920x1080 Low Preset (FSR off)
GMK NucBox K6
AMD Ryzen 7 7840HS, AMD Radeon 780M
46.3 (32.3min) fps
Average AMD Radeon 780M
  (32.5 - 52.1, n=39)
40.3 fps -13%
1920x1080 Medium Preset (FSR off)
GMK NucBox K6
AMD Ryzen 7 7840HS, AMD Radeon 780M
35.2 (10.9min) fps
Average AMD Radeon 780M
  (16.3 - 37.5, n=34)
30.9 fps -12%
AcePC Wizbox AI
Intel Core Ultra 7 155H, Intel Arc 8-Core iGPU
23.8 (18.8min) fps -32%
1920x1080 High Preset (FSR off)
GMK NucBox K6
AMD Ryzen 7 7840HS, AMD Radeon 780M
27.7 (9.25min) fps
Average AMD Radeon 780M
  (13.8 - 29.6, n=35)
24.7 fps -11%
AcePC Wizbox AI
Intel Core Ultra 7 155H, Intel Arc 8-Core iGPU
17.8 (11.8min) fps -36%
1920x1080 Ultra Preset (FSR off)
GMK NucBox K6
AMD Ryzen 7 7840HS, AMD Radeon 780M
24.5 (9.31min) fps
Average AMD Radeon 780M
  (11.5 - 26.3, n=30)
21.3 fps -13%
Final Fantasy XV Benchmark
1280x720 Lite Quality
GMK NucBox K6
AMD Ryzen 7 7840HS, AMD Radeon 780M
80.8 fps
Geekom A7
AMD Ryzen 9 7940HS, AMD Radeon 780M
70.3 fps -13%
Average AMD Radeon 780M
  (27.8 - 84.5, n=54)
69.7 fps -14%
Beelink GTR6
AMD Ryzen 9 6900HX, AMD Radeon 680M
68.5 fps -15%
Beelink SER6 Pro
AMD Ryzen 7 6800H, AMD Radeon 680M
68.1 fps -16%
Aoostar GOD77
AMD Ryzen 7 7735HS, AMD Radeon 680M
62.1 fps -23%
AcePC Wizbox AI
Intel Core Ultra 7 155H, Intel Arc 8-Core iGPU
52.8 fps -35%
Geekom Mini IT13
Intel Core i9-13900H, Intel Iris Xe Graphics G7 96EUs
46.1 fps -43%
Intel NUC 13 Pro Desk Edition Kit
Intel Core i7-1360P, Intel Iris Xe Graphics G7 96EUs
45.6 fps -44%
GMK NucBox K3 Pro
Intel Core i7-12650H, Intel UHD Graphics 64EUs (Alder Lake 12th Gen)
39.6 fps -51%
Lenovo IdeaCentre Mini 01IRH8
Intel Core i7-13700H, Intel Iris Xe Graphics G7 96EUs
37.4 fps -54%
Beelink SER5
AMD Ryzen 5 5560U, AMD Radeon RX Vega 6 (Ryzen 4000/5000)
32.2 fps -60%
GMK NucBox M3
Intel Core i5-12450H, Intel UHD Graphics Xe G4 48EUs
28.5 fps -65%
GMK NucBox M4
Intel Core i9-11900H, Intel UHD Graphics Xe 32EUs (Tiger Lake-H)
23 fps -72%
1920x1080 Standard Quality
GMK NucBox K6
AMD Ryzen 7 7840HS, AMD Radeon 780M
39.3 fps
Average AMD Radeon 780M
  (21 - 40.9, n=54)
35.2 fps -10%
Beelink GTR6
AMD Ryzen 9 6900HX, AMD Radeon 680M
34.9 fps -11%
Beelink SER6 Pro
AMD Ryzen 7 6800H, AMD Radeon 680M
34.7 fps -12%
AcePC Wizbox AI
Intel Core Ultra 7 155H, Intel Arc 8-Core iGPU
33.5 fps -15%
Geekom A7
AMD Ryzen 9 7940HS, AMD Radeon 780M
33.4 fps -15%
Aoostar GOD77
AMD Ryzen 7 7735HS, AMD Radeon 680M
32.8 fps -17%
Geekom Mini IT13
Intel Core i9-13900H, Intel Iris Xe Graphics G7 96EUs
24.7 fps -37%
Intel NUC 13 Pro Desk Edition Kit
Intel Core i7-1360P, Intel Iris Xe Graphics G7 96EUs
24.3 fps -38%
GMK NucBox K3 Pro
Intel Core i7-12650H, Intel UHD Graphics 64EUs (Alder Lake 12th Gen)
21.9 fps -44%
Lenovo IdeaCentre Mini 01IRH8
Intel Core i7-13700H, Intel Iris Xe Graphics G7 96EUs
20 fps -49%
Beelink SER5
AMD Ryzen 5 5560U, AMD Radeon RX Vega 6 (Ryzen 4000/5000)
16.1 fps -59%
GMK NucBox M3
Intel Core i5-12450H, Intel UHD Graphics Xe G4 48EUs
14.8 fps -62%
1920x1080 High Quality
GMK NucBox K6
AMD Ryzen 7 7840HS, AMD Radeon 780M
29.3 fps
Average AMD Radeon 780M
  (15.9 - 30.8, n=55)
26.3 fps -10%
Geekom A7
AMD Ryzen 9 7940HS, AMD Radeon 780M
25 fps -15%
Beelink SER6 Pro
AMD Ryzen 7 6800H, AMD Radeon 680M
24.6 fps -16%
Beelink GTR6
AMD Ryzen 9 6900HX, AMD Radeon 680M
24.5 fps -16%
Aoostar GOD77
AMD Ryzen 7 7735HS, AMD Radeon 680M
23 fps -22%
AcePC Wizbox AI
Intel Core Ultra 7 155H, Intel Arc 8-Core iGPU
21.8 fps -26%
Geekom Mini IT13
Intel Core i9-13900H, Intel Iris Xe Graphics G7 96EUs
17.7 fps -40%
Intel NUC 13 Pro Desk Edition Kit
Intel Core i7-1360P, Intel Iris Xe Graphics G7 96EUs
17.4 fps -41%
GMK NucBox K3 Pro
Intel Core i7-12650H, Intel UHD Graphics 64EUs (Alder Lake 12th Gen)
15.2 fps -48%
Lenovo IdeaCentre Mini 01IRH8
Intel Core i7-13700H, Intel Iris Xe Graphics G7 96EUs
14.6 fps -50%
Beelink SER5
AMD Ryzen 5 5560U, AMD Radeon RX Vega 6 (Ryzen 4000/5000)
11.5 fps -61%
GMK NucBox M3
Intel Core i5-12450H, Intel UHD Graphics Xe G4 48EUs
10.6 fps -64%
Strange Brigade
1280x720 lowest AF:1
GMK NucBox K6
AMD Ryzen 7 7840HS, AMD Radeon 780M
167.7 (34.3min, 142.9P1) fps
Average AMD Radeon 780M
  (74.1 - 175.9, n=48)
149.5 fps -11%
Beelink GTR6
AMD Ryzen 9 6900HX, AMD Radeon 680M
142.4 (86.5min, 118P1) fps -15%
Beelink SER6 Pro
AMD Ryzen 7 6800H, AMD Radeon 680M
141.9 (78.6min, 116.6P1) fps -15%
Aoostar GOD77
AMD Ryzen 7 7735HS, AMD Radeon 680M
137.5 (81.3min, 118.1P1) fps -18%
AcePC Wizbox AI
Intel Core Ultra 7 155H, Intel Arc 8-Core iGPU
131.8 (15.2min, 64.5P1) fps -21%
Intel NUC 13 Pro Desk Edition Kit
Intel Core i7-1360P, Intel Iris Xe Graphics G7 96EUs
99 (21.7min, 36.5P1) fps -41%
Lenovo IdeaCentre Mini 01IRH8
Intel Core i7-13700H, Intel Iris Xe Graphics G7 96EUs
89.2 (21.3min, 32.1P1) fps -47%
Beelink SER5
AMD Ryzen 5 5560U, AMD Radeon RX Vega 6 (Ryzen 4000/5000)
78.9 (56.9min, 66.5P1) fps -53%
GMK NucBox M3
Intel Core i5-12450H, Intel UHD Graphics Xe G4 48EUs
64.4 (13.2min, 19P1) fps -62%
GMK NucBox M4
Intel Core i9-11900H, Intel UHD Graphics Xe 32EUs (Tiger Lake-H)
56.5 (13.2min, 17.2P1) fps -66%
1920x1080 medium AA:medium AF:4
GMK NucBox K6
AMD Ryzen 7 7840HS, AMD Radeon 780M
67.9 (43.7min, 58.3P1) fps
Average AMD Radeon 780M
  (31.7 - 70.9, n=49)
62.5 fps -8%
Beelink SER6 Pro
AMD Ryzen 7 6800H, AMD Radeon 680M
57.8 (43.1min, 50.8P1) fps -15%
Beelink GTR6
AMD Ryzen 9 6900HX, AMD Radeon 680M
57.4 (43.4min, 51P1) fps -15%
AcePC Wizbox AI
Intel Core Ultra 7 155H, Intel Arc 8-Core iGPU
57 (8.9min, 48.8P1) fps -16%
Aoostar GOD77
AMD Ryzen 7 7735HS, AMD Radeon 680M
54.2 (43.3min, 47.6P1) fps -20%
Intel NUC 13 Pro Desk Edition Kit
Intel Core i7-1360P, Intel Iris Xe Graphics G7 96EUs
39.4 (14.1min, 23P1) fps -42%
Lenovo IdeaCentre Mini 01IRH8
Intel Core i7-13700H, Intel Iris Xe Graphics G7 96EUs
34.7 (12.5min, 20P1) fps -49%
Beelink SER5
AMD Ryzen 5 5560U, AMD Radeon RX Vega 6 (Ryzen 4000/5000)
30.3 (25.6min, 27.4P1) fps -55%
GMK NucBox M3
Intel Core i5-12450H, Intel UHD Graphics Xe G4 48EUs
25.6 (7.1min, 12.5P1) fps -62%
GMK NucBox M4
Intel Core i9-11900H, Intel UHD Graphics Xe 32EUs (Tiger Lake-H)
22.4 (6.3min, 10.3P1) fps -67%
1920x1080 high AA:high AF:8
GMK NucBox K6
AMD Ryzen 7 7840HS, AMD Radeon 780M
57.9 (7min, 45P1) fps
Average AMD Radeon 780M
  (27.3 - 60.6, n=49)
52.7 fps -9%
AcePC Wizbox AI
Intel Core Ultra 7 155H, Intel Arc 8-Core iGPU
50.4 (24.4min, 40.8P1) fps -13%
Beelink SER6 Pro
AMD Ryzen 7 6800H, AMD Radeon 680M
48.6 (34.2min, 38.3P1) fps -16%
Beelink GTR6
AMD Ryzen 9 6900HX, AMD Radeon 680M
48.5 (35.1min, 38.2P1) fps -16%
Aoostar GOD77
AMD Ryzen 7 7735HS, AMD Radeon 680M
45 (34.5min, 35.8P1) fps -22%
Intel NUC 13 Pro Desk Edition Kit
Intel Core i7-1360P, Intel Iris Xe Graphics G7 96EUs
32 (8.4min, 15.8P1) fps -45%
Lenovo IdeaCentre Mini 01IRH8
Intel Core i7-13700H, Intel Iris Xe Graphics G7 96EUs
29.2 (9min, 13.5P1) fps -50%
Beelink SER5
AMD Ryzen 5 5560U, AMD Radeon RX Vega 6 (Ryzen 4000/5000)
24.6 (19.8min, 20.3P1) fps -58%
GMK NucBox M3
Intel Core i5-12450H, Intel UHD Graphics Xe G4 48EUs
20 (5min, 6.58P1) fps -65%
GMK NucBox M4
Intel Core i9-11900H, Intel UHD Graphics Xe 32EUs (Tiger Lake-H)
17.2 (5min, 5.39P1) fps -70%
1920x1080 ultra AA:ultra AF:16
GMK NucBox K6
AMD Ryzen 7 7840HS, AMD Radeon 780M
48.8 (11.1min, 31.1P1) fps
Average AMD Radeon 780M
  (23.5 - 52.1, n=50)
45 fps -8%
Beelink SER6 Pro
AMD Ryzen 7 6800H, AMD Radeon 680M
41.9 (32.6min, 33.4P1) fps -14%
Beelink GTR6
AMD Ryzen 9 6900HX, AMD Radeon 680M
41.6 (26.5min, 33P1) fps -15%
AcePC Wizbox AI
Intel Core Ultra 7 155H, Intel Arc 8-Core iGPU
41 (6.8min, 14.4P1) fps -16%
Aoostar GOD77
AMD Ryzen 7 7735HS, AMD Radeon 680M
39.1 (19min, 24.6P1) fps -20%
Intel NUC 13 Pro Desk Edition Kit
Intel Core i7-1360P, Intel Iris Xe Graphics G7 96EUs
26.1 (5.3min, 8.13P1) fps -47%
Lenovo IdeaCentre Mini 01IRH8
Intel Core i7-13700H, Intel Iris Xe Graphics G7 96EUs
22.9 (5min, 5.96P1) fps -53%
Beelink SER5
AMD Ryzen 5 5560U, AMD Radeon RX Vega 6 (Ryzen 4000/5000)
20.5 (12.2min, 14.6P1) fps -58%
GMK NucBox M3
Intel Core i5-12450H, Intel UHD Graphics Xe G4 48EUs
17.7 (5min, 5P1) fps -64%
GMK NucBox M4
Intel Core i9-11900H, Intel UHD Graphics Xe 32EUs (Tiger Lake-H)
16.4 (5min, 5P1) fps -66%
Dota 2 Reborn
1280x720 min (0/3) fastest
GMK NucBox K6
AMD Ryzen 7 7840HS, AMD Radeon 780M
161.2 (11.9min) fps
Geekom A7
AMD Ryzen 9 7940HS, AMD Radeon 780M
155.8 (135.9min) fps -3%
Beelink SER6 Pro
AMD Ryzen 7 6800H, AMD Radeon 680M
143.3 (123.8min) fps -11%
Beelink GTR6
AMD Ryzen 9 6900HX, AMD Radeon 680M
141.9 (121.4min) fps -12%
Aoostar GOD77
AMD Ryzen 7 7735HS, AMD Radeon 680M
140.9 (120.9min) fps -13%
Geekom Mini IT13
Intel Core i9-13900H, Intel Iris Xe Graphics G7 96EUs
133.8 (103.8min) fps -17%
Average AMD Radeon 780M
  (34.7 - 164.8, n=56)
132.5 fps -18%
GMK NucBox K3 Pro
Intel Core i7-12650H, Intel UHD Graphics 64EUs (Alder Lake 12th Gen)
119.5 (88.3min) fps -26%
Intel NUC 13 Pro Desk Edition Kit
Intel Core i7-1360P, Intel Iris Xe Graphics G7 96EUs
113.8 (8.3min) fps -29%
GMK NucBox M4
Intel Core i9-11900H, Intel UHD Graphics Xe 32EUs (Tiger Lake-H)
112.3 (96.7min) fps -30%
Beelink SER5
AMD Ryzen 5 5560U, AMD Radeon RX Vega 6 (Ryzen 4000/5000)
110.7 (97.6min) fps -31%
Lenovo IdeaCentre Mini 01IRH8
Intel Core i7-13700H, Intel Iris Xe Graphics G7 96EUs
110.5 (89min) fps -31%
AcePC Wizbox AI
Intel Core Ultra 7 155H, Intel Arc 8-Core iGPU
102.5 (56.5min) fps -36%
GMK NucBox M3
Intel Core i5-12450H, Intel UHD Graphics Xe G4 48EUs
37 (34.9min) fps -77%
1366x768 med (1/3)
GMK NucBox K6
AMD Ryzen 7 7840HS, AMD Radeon 780M
124.8 (104.5min) fps
Geekom A7
AMD Ryzen 9 7940HS, AMD Radeon 780M
120.6 (96.2min) fps -3%
Aoostar GOD77
AMD Ryzen 7 7735HS, AMD Radeon 680M
115.1 (100.7min) fps -8%
Beelink SER6 Pro
AMD Ryzen 7 6800H, AMD Radeon 680M
113.4 (94min) fps -9%
Beelink GTR6
AMD Ryzen 9 6900HX, AMD Radeon 680M
112.7 (95min) fps -10%
Average AMD Radeon 780M
  (33.6 - 130.2, n=56)
106.8 fps -14%
GMK NucBox K3 Pro
Intel Core i7-12650H, Intel UHD Graphics 64EUs (Alder Lake 12th Gen)
93.4 (69.8min) fps -25%
AcePC Wizbox AI
Intel Core Ultra 7 155H, Intel Arc 8-Core iGPU
92.6 (61.2min) fps -26%
Beelink SER5
AMD Ryzen 5 5560U, AMD Radeon RX Vega 6 (Ryzen 4000/5000)
90.8 (71min) fps -27%
Geekom Mini IT13
Intel Core i9-13900H, Intel Iris Xe Graphics G7 96EUs
87.3 (72.8min) fps -30%
Intel NUC 13 Pro Desk Edition Kit
Intel Core i7-1360P, Intel Iris Xe Graphics G7 96EUs
86.4 (68.3min) fps -31%
Lenovo IdeaCentre Mini 01IRH8
Intel Core i7-13700H, Intel Iris Xe Graphics G7 96EUs
82.8 (69min) fps -34%
GMK NucBox M4
Intel Core i9-11900H, Intel UHD Graphics Xe 32EUs (Tiger Lake-H)
70.1 (61.4min) fps -44%
GMK NucBox M3
Intel Core i5-12450H, Intel UHD Graphics Xe G4 48EUs
36.2 (33.9min) fps -71%
1920x1080 high (2/3)
GMK NucBox K6
AMD Ryzen 7 7840HS, AMD Radeon 780M
96.8 (17.4min) fps
Aoostar GOD77
AMD Ryzen 7 7735HS, AMD Radeon 680M
89.1 (81.8min) fps -8%
Geekom A7
AMD Ryzen 9 7940HS, AMD Radeon 780M
87.6 (75min) fps -10%
Beelink SER6 Pro
AMD Ryzen 7 6800H, AMD Radeon 680M
83.9 (73.4min) fps -13%
Beelink GTR6
AMD Ryzen 9 6900HX, AMD Radeon 680M
80.9 (71.6min) fps -16%
Average AMD Radeon 780M
  (31.6 - 98.8, n=56)
79.1 fps -18%
AcePC Wizbox AI
Intel Core Ultra 7 155H, Intel Arc 8-Core iGPU
72.3 (46.1min) fps -25%
Intel NUC 13 Pro Desk Edition Kit
Intel Core i7-1360P, Intel Iris Xe Graphics G7 96EUs
67.6 (58.9min) fps -30%
Geekom Mini IT13
Intel Core i9-13900H, Intel Iris Xe Graphics G7 96EUs
67.6 (60.7min) fps -30%
GMK NucBox K3 Pro
Intel Core i7-12650H, Intel UHD Graphics 64EUs (Alder Lake 12th Gen)
62.7 (57.3min) fps -35%
Lenovo IdeaCentre Mini 01IRH8
Intel Core i7-13700H, Intel Iris Xe Graphics G7 96EUs
56.9 (52.4min) fps -41%
Beelink SER5
AMD Ryzen 5 5560U, AMD Radeon RX Vega 6 (Ryzen 4000/5000)
48.7 (44.8min) fps -50%
GMK NucBox M4
Intel Core i9-11900H, Intel UHD Graphics Xe 32EUs (Tiger Lake-H)
36.1 (33min) fps -63%
GMK NucBox M3
Intel Core i5-12450H, Intel UHD Graphics Xe G4 48EUs
35.4 (33.8min) fps -63%
1920x1080 ultra (3/3) best looking
GMK NucBox K6
AMD Ryzen 7 7840HS, AMD Radeon 780M
87.4 (16.1min) fps
Aoostar GOD77
AMD Ryzen 7 7735HS, AMD Radeon 680M
84.9 (77.4min) fps -3%
Geekom A7
AMD Ryzen 9 7940HS, AMD Radeon 780M
81 (67.5min) fps -7%
Beelink SER6 Pro
AMD Ryzen 7 6800H, AMD Radeon 680M
73.1 (64min) fps -16%
Beelink GTR6
AMD Ryzen 9 6900HX, AMD Radeon 680M
71.4 (62.3min) fps -18%
Average AMD Radeon 780M
  (30.8 - 91.2, n=56)
71.4 fps -18%
AcePC Wizbox AI
Intel Core Ultra 7 155H, Intel Arc 8-Core iGPU
68.3 (45.5min) fps -22%
Geekom Mini IT13
Intel Core i9-13900H, Intel Iris Xe Graphics G7 96EUs
61.2 (55.2min) fps -30%
Intel NUC 13 Pro Desk Edition Kit
Intel Core i7-1360P, Intel Iris Xe Graphics G7 96EUs
60.5 (52.3min) fps -31%
GMK NucBox K3 Pro
Intel Core i7-12650H, Intel UHD Graphics 64EUs (Alder Lake 12th Gen)
57.5 (52.3min) fps -34%
Lenovo IdeaCentre Mini 01IRH8
Intel Core i7-13700H, Intel Iris Xe Graphics G7 96EUs
52 (47.1min) fps -41%
Beelink SER5
AMD Ryzen 5 5560U, AMD Radeon RX Vega 6 (Ryzen 4000/5000)
45.4 (42.4min) fps -48%
GMK NucBox M3
Intel Core i5-12450H, Intel UHD Graphics Xe G4 48EUs
34.7 (32.5min) fps -60%
GMK NucBox M4
Intel Core i9-11900H, Intel UHD Graphics Xe 32EUs (Tiger Lake-H)
32.8 (29.4min) fps -62%

Witcher 3 FPS Chart

051015202530Tooltip
GMK NucBox K6 R7 7840HS, Radeon 780M: Ø30.8 (28-34)
lågmed.högultra
GTA V (2015) 163.4 153.8 65.7 26
The Witcher 3 (2015) 155.1 99 50.9 30.8
Dota 2 Reborn (2015) 161.2 124.8 96.8 87.4
Final Fantasy XV Benchmark (2018) 80.8 39.3 29.3
X-Plane 11.11 (2018) 65.9 47.3 39.7
Far Cry 5 (2018) 86 49 45 43
Strange Brigade (2018) 167.7 67.9 57.9 48.8
Tiny Tina's Wonderlands (2022) 74.6 52.2 36.6 29.5
F1 22 (2022) 99.8 85.9 66.7 18.4
Baldur's Gate 3 (2023) 40.5 33.7 28.1 27
Cyberpunk 2077 2.1 Phantom Liberty (2023) 46.3 35.2 27.7 24.5

Utsläpp - inte rädda för att vara högljudda

Buller från systemet

Fläktljudet är alltid närvarande vid 31,3 dB(A) mot en tyst bakgrund på 23,2 dB(A) vilket automatiskt gör NucBox K6 mer högljudd än de flesta bärbara datorer som körs med U-seriens processorer. Tänk dock på att användare normalt sitter längre bort från minidatorer jämfört med bärbara datorer och att ljudnivåerna därför kan vara mindre märkbara överlag. Systemet blir något högre vid 33,4 dB(A) vid videostreaming eller webbsurfning, men eventuella RPM-förändringar är tack och lov stadiga och utan några plötsliga toppar.

Att köra mer krävande belastningar som spel skulle inducera ett fläktljud mellan 44 och 48 dB(A) för att vara mer märkbart och nästan lika högt som vissa bärbara speldatorer som MSI Stealth GS66. Intressant nog matchar fläktljudets intervall och beteende nästan vad vi observerade på Geekom A7.

Ljudprofil för fläkt (Vit: Bakgrund, Röd: System i viloläge, Blå: 3DMark 06, Orange: Witcher 3, Grön: Prime95+FurMark stress)

Ljudnivå

Låg belastning
31.3 / 31.3 / 33.4 dB(A)
Hög belastning
47.5 / 47.7 dB(A)
  red to green bar
 
 
30 dB
tyst
40 dB(A)
hörbar
50 dB(A)
högt ljud
 
min: dark, med: mid, max: light   Earthworks M23R, Arta (15 cm avstånd)   environment noise: 23.2 dB(A)
dB(A) 0102030405060708090Deep BassMiddle BassHigh BassLower RangeMidsHigher MidsLower HighsMid HighsUpper HighsSuper Highs2037.234.535.934.838.3252825.325.124.126.83129.324.52223.524.14024.323.820.119.8245024.626.420.520.926.76327.128.622.223.327.78025.825.720.119.526.210023.825.31918.526.212524.52516.21424.616024.926.316.212.226.920024.526.123.414.326.925026.928.12513.828.631533.735.429.815.832.240029.830.126.41430.75002628.317.111.228.963028.231.321.210.631.780029.932.418.411.43310003335.418.69.636.1125032.936.317.79.636.7160035.238.418.99.738.5200032.337.419.210.236.9250034.63815.910.537.8315032.837.115.610.838.8400029.335.31411.335.5500029.134.717.911.335630027.333.618.111.533.6800019.426.212.911.626.31000016.822.112.311.721.81250016.420.412.211.618.21600015.117.711.310.815.6SPL43.647.531.323.247.7N4.35.71.50.55.8median 28.2median 31.3median 17.9median 11.4median 31.7Delta5.35.32.41.65.5hearing rangehide median Fan NoiseGMK NucBox K6
GMK NucBox K6
Radeon 780M, R7 7840HS, MasonSemi 1TB MC7000
GMK NucBox K3 Pro
UHD Graphics 64EUs, i7-12650H, Lexar NM610 Pro NM610P001T-HNNNG
Intel NUC 13 Pro Desk Edition Kit
Iris Xe G7 96EUs, i7-1360P, Samsung PM9A1 MZVL2512HCJQ
Beelink SER5
Vega 6, R5 5560U, Crucial P3 Plus CT1000P3PSSD8
AcePC Wizbox AI
Arc 8-Core, Ultra 7 155H, Rayson RS512GSSD710 512 GB PCIe 4.0 NVMe
Geekom A7
Radeon 780M, R9 7940HS, Acer N5000
Noise
15%
8%
26%
19%
-1%
off / environment *
23.2
23.1
-0%
25.2
-9%
23.7
-2%
23.54
-1%
25.4
-9%
Idle Minimum *
31.3
25
20%
28.1
10%
23.9
24%
23.54
25%
33.3
-6%
Idle Average *
31.3
25.5
19%
28.2
10%
23.9
24%
24.9
20%
33.6
-7%
Idle Maximum *
33.4
25.5
24%
28.3
15%
23.9
28%
24.9
25%
33.7
-1%
Load Average *
47.5
39.9
16%
42
12%
28
41%
35.78
25%
43.3
9%
Witcher 3 ultra *
43.6
39.9
8%
27.6
37%
43.2
1%
Load Maximum *
47.7
39.9
16%
42.1
12%
32.8
31%
37.57
21%
43.3
9%

* ... smaller is better

Temperatur

Nätadapter
Nätadapter

Frisk luft kommer in från undersidan och längs den övre kanten medan avgaserna kommer ut från baksidan. Denna design gör att enheten kan placeras både horisontellt och vertikalt utan att luftflödet hindras.

AC-adaptern kan nå över 42 C när krävande belastningar körs under långa perioder.

System i viloläge (fram)
System tomgång (bak)
Prime95+FurMark stress (front)
Prime95+FurMark stress (baksida)

Energiförvaltning

Strömförbrukning

Tunn AC-adapter
Tunn AC-adapter

Systemet drar ca 73 W när man spelar, vilket är relativt mycket för en mini-PC med endast integrerad grafik. Den långsammare NUC 13 Pro, till exempel, skulle bara kräva 45 W under liknande förhållanden. Den höga förbrukningen är i linje med våra resultat ovan relaterade till det högre effektkuvertet på NucBox K6.

Vi kan registrera en maximal förbrukning på ca 88 W från den medelstora (~14,9 x 6,3 x 3 cm) 130 W AC-adaptern när processorn utnyttjas till 100 procent. Effektöverskottet kan användas för externa USB-C-enheter som SSD-enheter.

(Redaktörens anmärkning: Detta avsnitt kommer att uppdateras när reparationen av vår Metrahit Energy-multimeter är slutförd. Vi ber om ursäkt för besväret)

Strömförbrukning
Av/Standbydarklight 1.3 / 1.6 Watt
Låg belastningdarkmidlight 6.7 / 7 / 7.6 Watt
Hög belastning midlight 74.3 / 85.7 Watt
 color bar
Förklaring: min: dark, med: mid, max: light        Metrahit Energy
GMK NucBox K6
R7 7840HS, Radeon 780M, MasonSemi 1TB MC7000, , x,
GMK NucBox K3 Pro
i7-12650H, UHD Graphics 64EUs, Lexar NM610 Pro NM610P001T-HNNNG, , x,
Intel NUC 13 Pro Desk Edition Kit
i7-1360P, Iris Xe G7 96EUs, Samsung PM9A1 MZVL2512HCJQ, , x,
Beelink SER5
R5 5560U, Vega 6, Crucial P3 Plus CT1000P3PSSD8, , x,
AcePC Wizbox AI
Ultra 7 155H, Arc 8-Core, Rayson RS512GSSD710 512 GB PCIe 4.0 NVMe, , x,
Geekom A7
R9 7940HS, Radeon 780M, Acer N5000, , x,
Power Consumption
-15%
-13%
45%
-115%
16%
Idle Minimum *
6.7
7.1
-6%
7
-4%
4.4
34%
7.23
-8%
3.8
43%
Idle Average *
7
10.1
-44%
9.2
-31%
5
29%
10
-43%
4.8
31%
Idle Maximum *
7.6
18.6
-145%
11.8
-55%
5.3
30%
49
-545%
6.5
14%
Load Average *
74.3
45.3
39%
45
39%
29.8
60%
53
29%
71.9
3%
Witcher 3 ultra *
75
55.2
26%
28.8
62%
Load Maximum *
85.7
52.9
38%
97.2
-13%
40.4
53%
91
-6%
94.7
-11%

* ... smaller is better

Power Consumption Witcher 3 / Stresstest

0510152025303540455055606570758085Tooltip
GMK NucBox K6 R7 7840HS, Radeon 780M; Witcher 3 ultra: Ø75 (73.2-77.7)
GMK NucBox K2 R7 7735HS, Radeon 680M; Witcher 3 ultra: Ø62.2 (60.2-65.2)
GMK NucBox K6 R7 7840HS, Radeon 780M; 1280x720 Prime95 28.10 and Furmark 1.25: Ø83.9 (81.8-85.7)
GMK NucBox K2 R7 7735HS, Radeon 680M; 1280x720 Prime95 28.10 and Furmark 1.25: Ø64.2 (62.8-72.8)

Power Consumption external Monitor

0510152025303540455055606570758085Tooltip
GMK NucBox K6 R7 7840HS, Radeon 780M; Prime95 V2810 Stress (external Monitor): Ø83.6 (58.9-86.5)
GMK NucBox K2 R7 7735HS, Radeon 680M; Prime95 V2810 Stress (external Monitor): Ø63 (62.1-72.5)
GMK NucBox K6 R7 7840HS, Radeon 780M; Cinebench R15 Multi (external Monitor): Ø79.3 (78.4-79.9)
GMK NucBox K2 R7 7735HS, Radeon 680M; Cinebench R15 Multi (external Monitor): Ø60.7 (57.3-67.4)
GMK NucBox K6 R7 7840HS, Radeon 780M; 1280x720 FurMark 1.19 GPU Stress Test (external Monitor): Ø81.2 (72.9-86.1)
GMK NucBox K2 R7 7735HS, Radeon 680M; 1280x720 FurMark 1.19 GPU Stress Test (external Monitor): Ø63.2 (61.9-71)
GMK NucBox K6 R7 7840HS, Radeon 780M; 1920x1080 The Witcher 3 ultra (external Monitor): Ø75 (73.2-77.7)
GMK NucBox K2 R7 7735HS, Radeon 680M; 1920x1080 The Witcher 3 ultra (external Monitor): Ø62.2 (60.2-65.2)
GMK NucBox K6 R7 7840HS, Radeon 780M; Idle 1min (external Monitor): Ø7.54 (6.74-8.75)

För

+ tillgänglig 2x M.2 2280 SSD + 2x SODIMM-kortplatser
+ utmärkt Ryzen 7 7840HS prestanda
+ anständig 1080p-spelpotential
+ relativt billig

Emot

- DPC-latens och problem med bildhopp vid streaming
- generellt högre strömförbrukning
- något högljudd vid spel
- endast en USB-C-port

Slutsats - kraftfull och relativt billig

I recension: GMKtec NucBox K6

NucBox K6 är en av de mest övertygande minidatorerna från GMK som vi har testat hittills. Den uppfyller flera viktiga kriterier, inklusive ett överkomligt pris på 500 USD, stark CPU- och iGPU-prestanda, uppgraderbart RAM-minne och lagringsutrymme samt en liten formfaktor i NUC-storlek. Dess prestanda i synnerhet är särskilt imponerande för kategorin eftersom alternativ som Intel NUC 13 Pro eller Geekom A7 är långsammare, dyrare eller både och.

Den starka prestandan och det attraktiva priset överskuggar den korta listan med nackdelar och gör GMK NucBox K6 till en enkel rekommendation för HTPC och tillfälliga 1080p-spel.

Det finns bara några få mindre nackdelar. Den enda USB-C-porten kan till exempel kännas begränsande om du har många tillbehör eller bildskärmar att ansluta. Vi skulle också vilja se verktygslös service som liknar Lenovo IdeaCentre Mini eller vissa Intel NUCs. Problemen med DPC-latens bör också åtgärdas för en smidigare videouppspelningsupplevelse. Och slutligen, en övergång till USB-C AC-adaptrar skulle göra minidatorn mer resvänlig och öka kompatibiliteten med befintliga USB-C-adaptrar.

Pris och tillgänglighet

GMKtec skickar nu NucBox K6 från $400 för ett barebones-kit eller $500 med 16 GB RAM, 1 TB SSD och Windows 11 Pro. Kupongkoderna "K6-0-NBC" och "K6-2T-NBC" kan tillämpas i kassan för barebone respektive 32 GB SKU.

Alternativt, Amazon levererar också nucBox K6.

GMK NucBox K6 - 04/03/2024 v7 (old)
Allen Ngo

Design
84 / 98 → 85%
Anslutningar
62 / 81 → 77%
Vikt
83%
Spelprestanda
81%
Programprestanda
98%
Ljudnivå
71%
Medel
80%
84%
Mini PC - Vägt medel

Transparency

The selection of devices to be reviewed is made by our editorial team. The test sample was provided to the author as a loan by the manufacturer or retailer for the purpose of this review. The lender had no influence on this review, nor did the manufacturer receive a copy of this review before publication. There was no obligation to publish this review. We never accept compensation or payment in return for our reviews. As an independent media company, Notebookcheck is not subjected to the authority of manufacturers, retailers or publishers.

This is how Notebookcheck is testing

Every year, Notebookcheck independently reviews hundreds of laptops and smartphones using standardized procedures to ensure that all results are comparable. We have continuously developed our test methods for around 20 years and set industry standards in the process. In our test labs, high-quality measuring equipment is utilized by experienced technicians and editors. These tests involve a multi-stage validation process. Our complex rating system is based on hundreds of well-founded measurements and benchmarks, which maintains objectivity. Further information on our test methods can be found here.
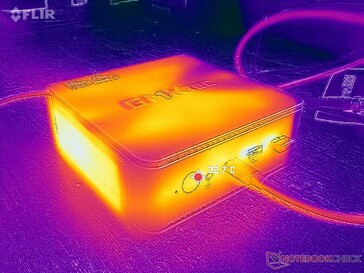
Price comparison

Please share our article, every link counts!
Mail Logo
> Bärbara datorer, laptops - tester och nyheter > Tester > GMK NucBox K6 mini PC recension: Lika kraftfull som de senaste bärbara Intel Core Ultra-datorerna
Allen Ngo, 2024-04- 4 (Update: 2024-04- 4)