

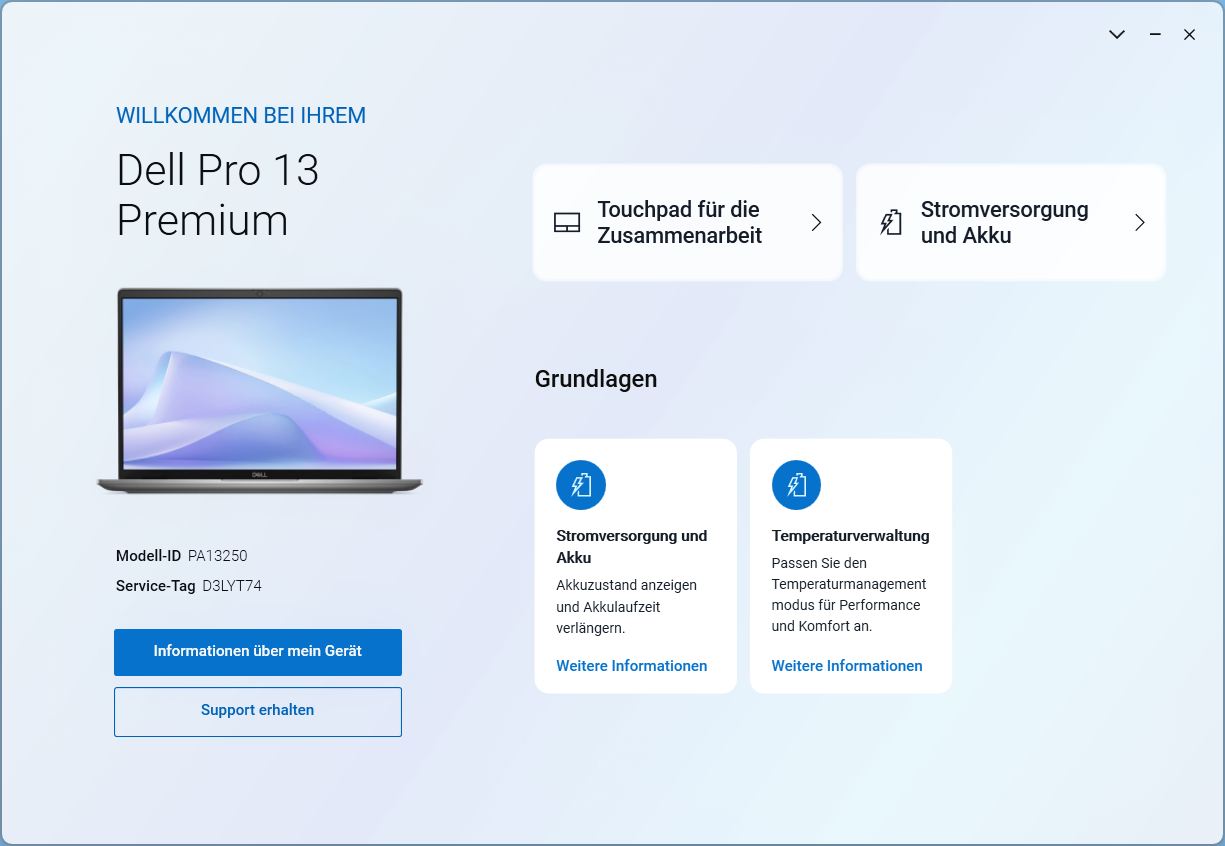
Recension av Dell Pro 13 Premium: Den nästan perfekta bärbara datorn för företag
Den bärbara datorn "Promium".
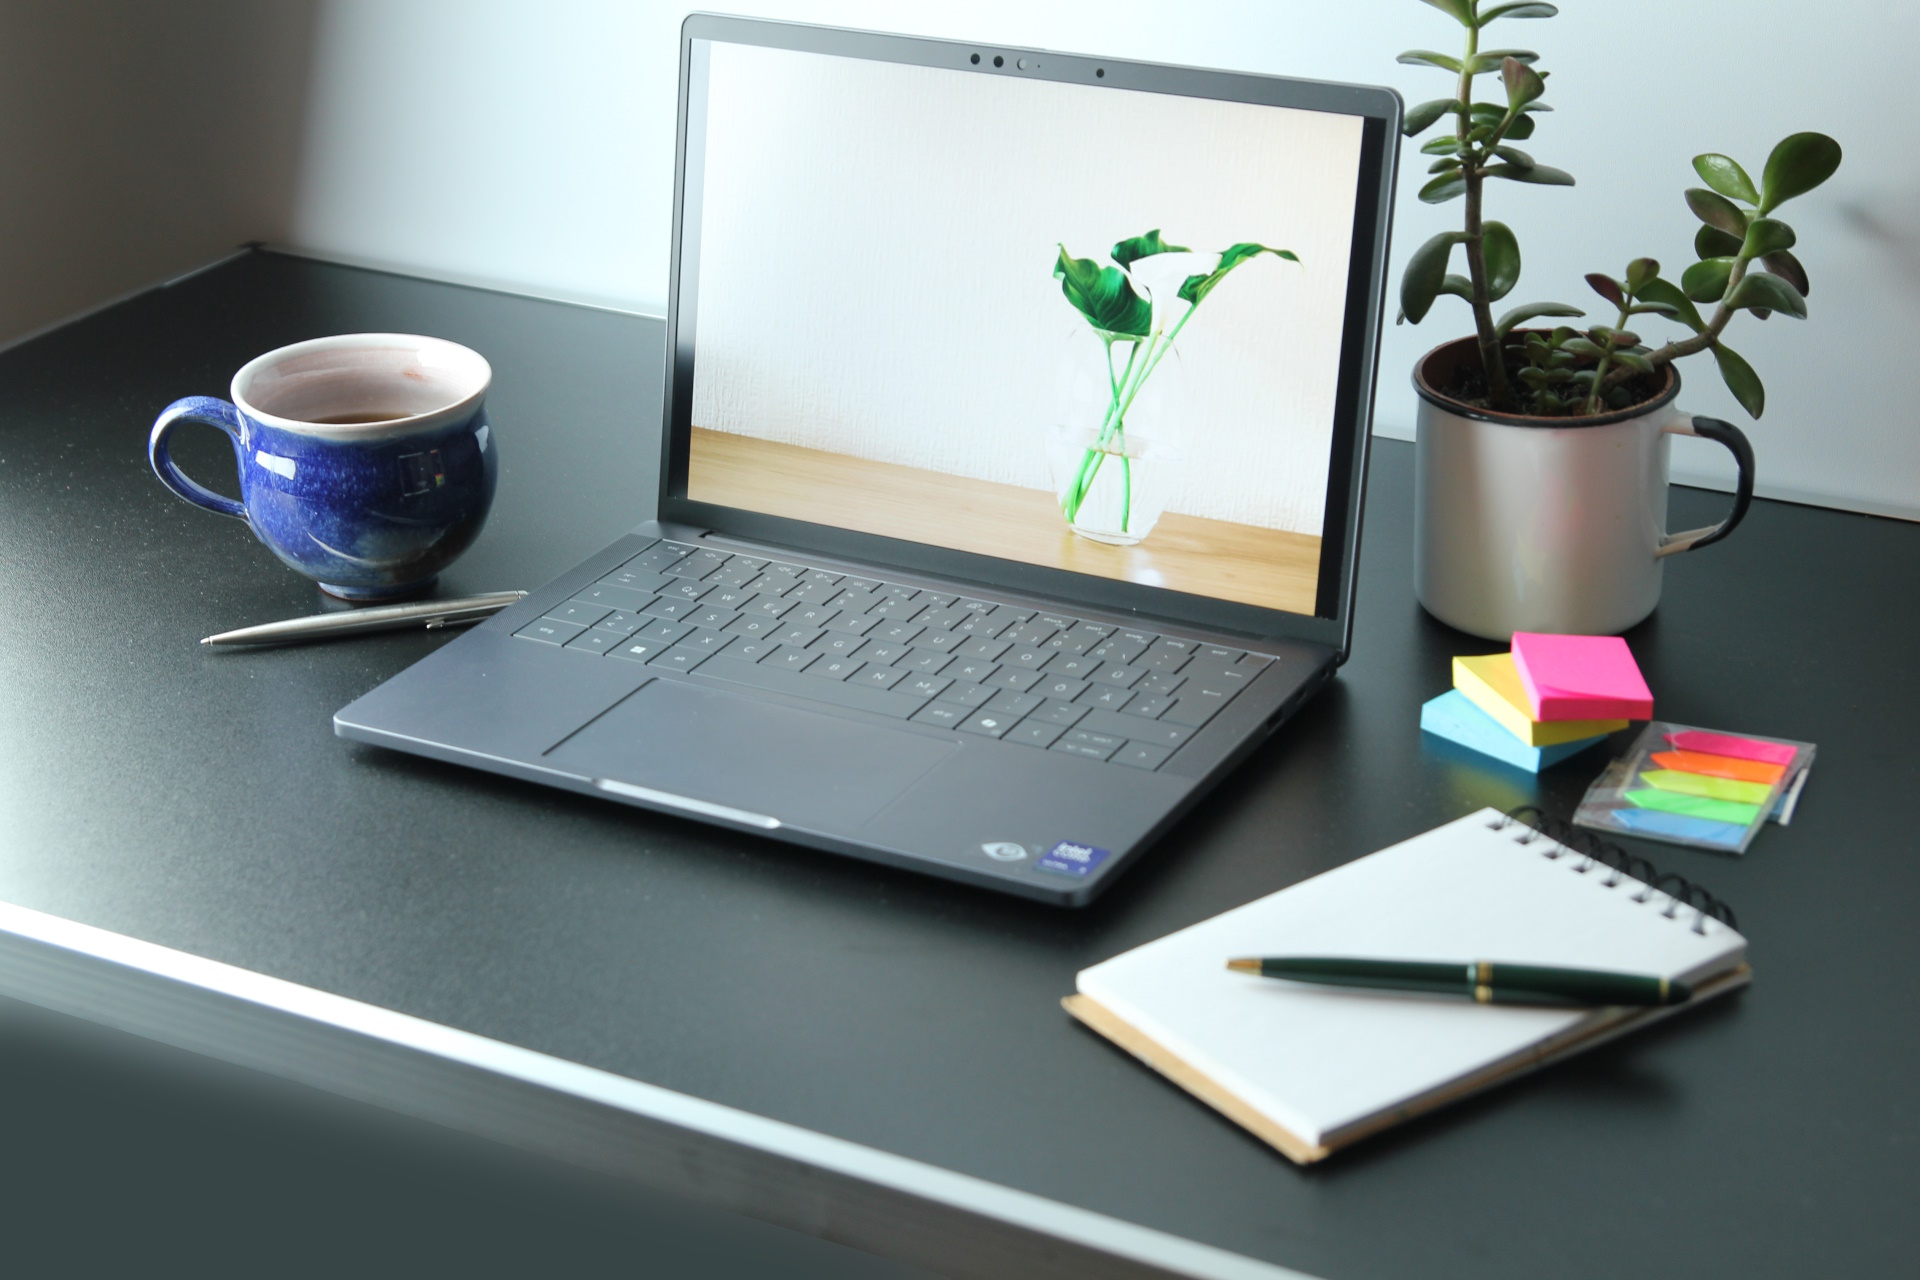
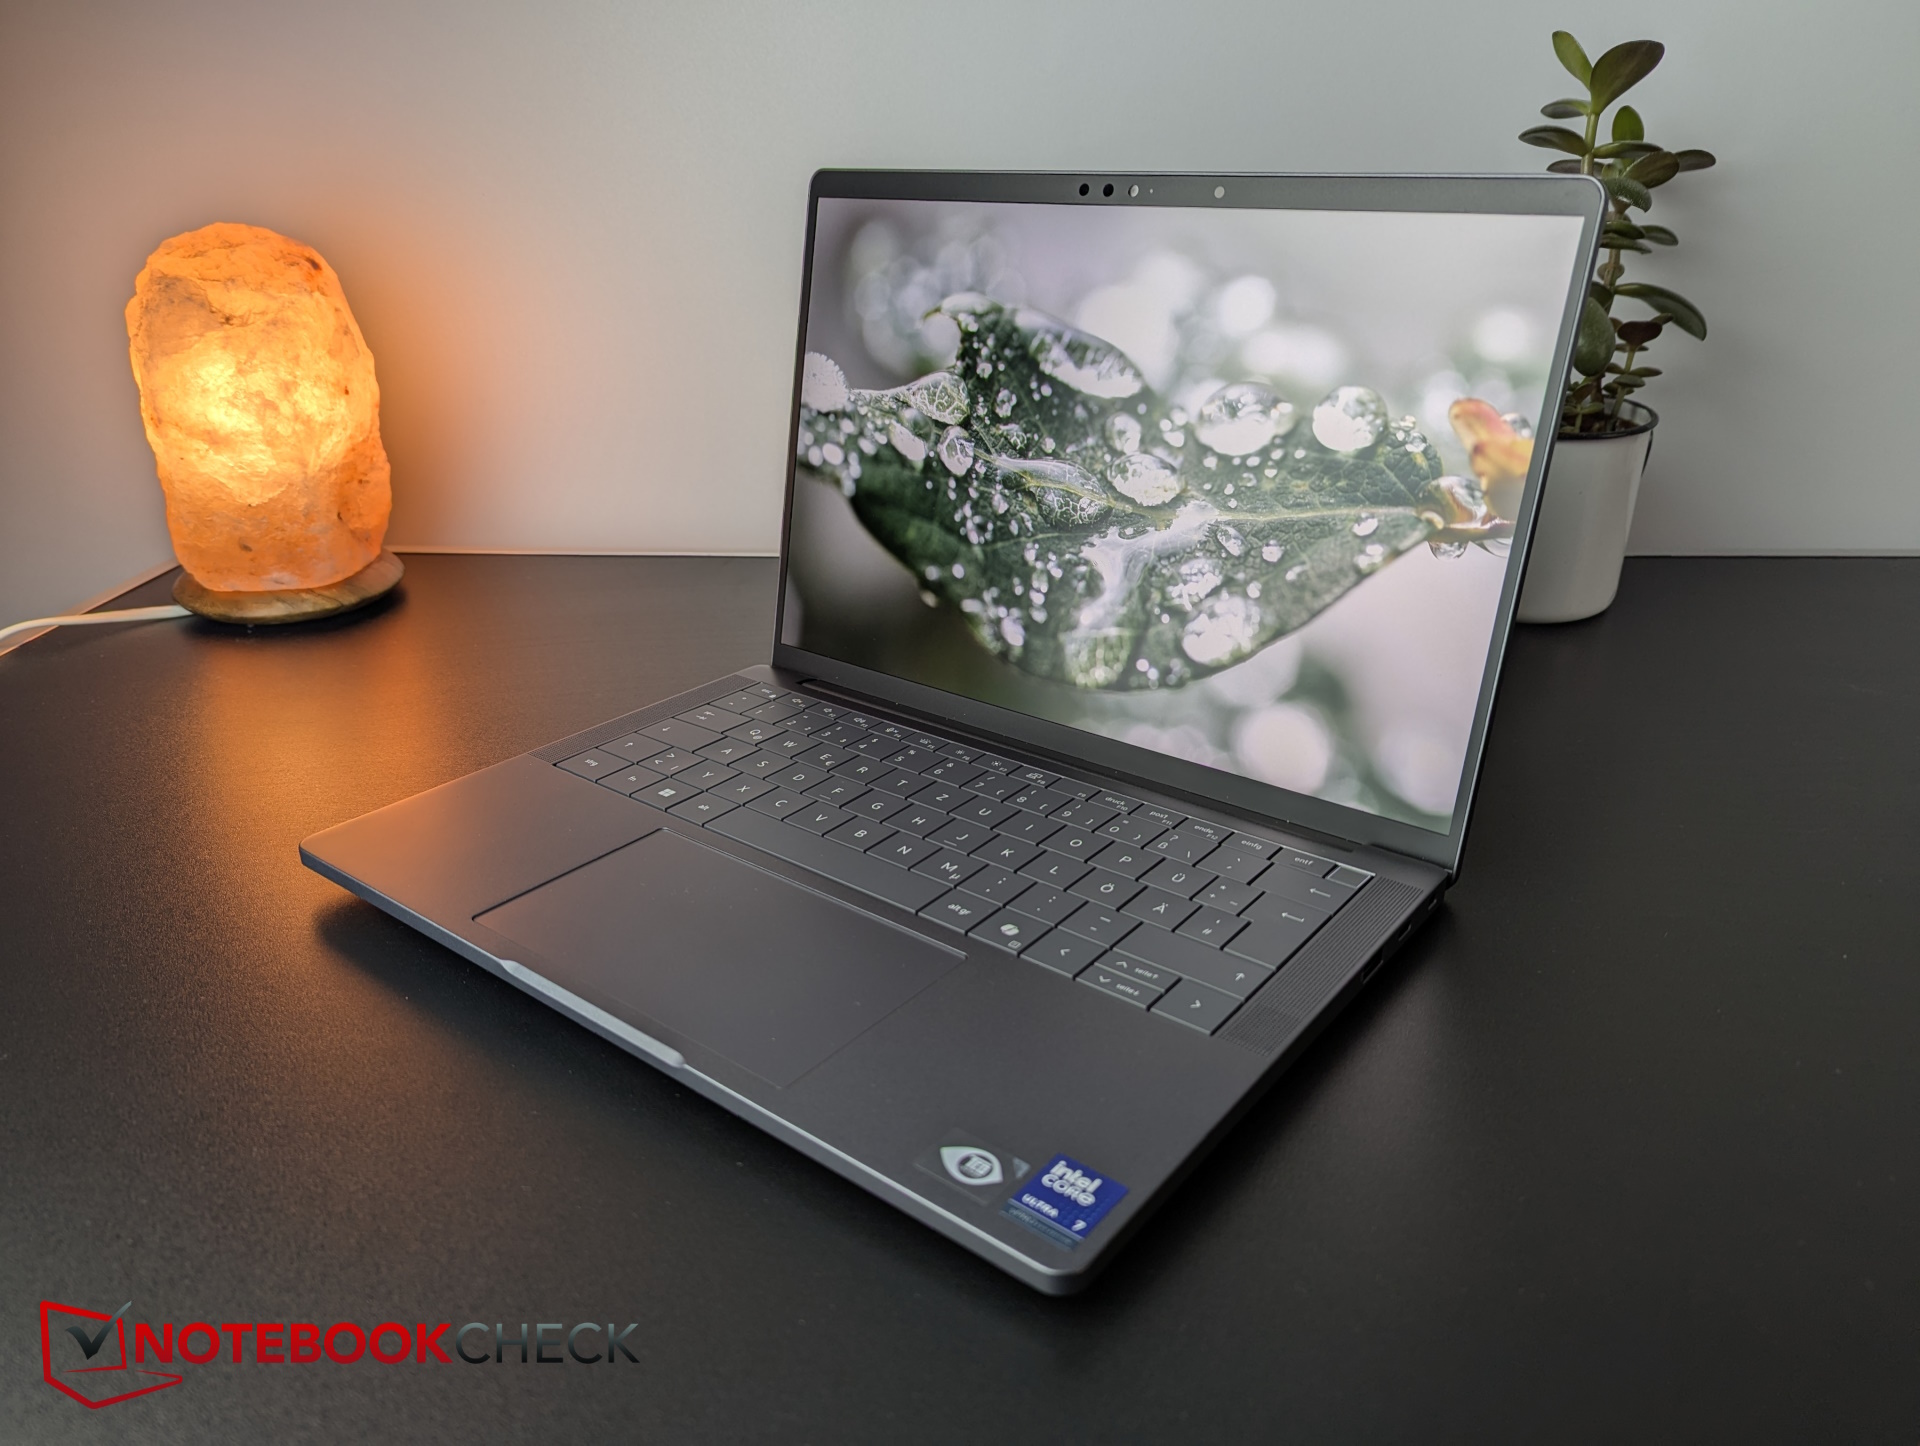
Vi tar tillfället i akt att granska den 13-tums bärbara datorn för företag i Dells produktlinje. Dell Pro 13 Premium riktar sig till krävande företagsanvändare och är utformad för att tilltala entreprenörer med sina moderna portar. Den har ett robust men ändå lätt magnesiumchassi, AI och har dessutom mycket långa batteritider.Christian Hintze, 👁 Christian Hintze (översatt av DeepL / Ninh Duy) Publicerad 🇺🇸 🇩🇪 ...
Omdöme - En nästan komplett bärbar dator för företag
Dell Pro 13 Premium är en utmärkt bärbar affärsdator med i stort sett inga svagheter, men med många positiva egenskaper som gör att den här mobila bärbara datorn får vår utmärkelse. Företagsanställda och andra potentiella köpare får en kompakt, liten, lätt, ekonomisk, extremt långlivad (24 timmar!) och kraftfull bärbar dator med ett högkvalitativt magnesiumchassi, en högupplöst 8 MP webbkamera och moderna gränssnitt som dubbla Thunderbolt 4 och Wi-Fi 7. Dessutom förblir den bärbara datorn konsekvent sval i praktiskt taget alla situationer.
Men det kostar, och den bärbara datorn kostar inte mindre än 1 900 till 2 500 dollar! Med detta i åtanke är den lama M.2 2230 SSD nästan skandalös, men i vardagliga situationer skulle du knappast märka skillnaden. De enda områden där förbättringar krävs är namnet och uppgraderingsmöjligheterna.
För
Emot
Pris och tillgänglighet
Vår testmodell har en FHD+-skärm och kostar cirka 2 100 USD i Dells onlinebutik.
- $29.99Smatree Hard EVA Protective Sleeve Compatible for 13.3 inch Dell Pro 13 Premium (PA13250), for 13 inch DELL Latitude 7350/7320 Detachable, for 12 inch DELL Latitude 7230 Rugged Extreme Tablet (X8016)
- $49.99Smatree 13 inch Laptop Sleeve for DELL Pro 13 Premium PA13250, Protective Laptop Case with Accessory Pocket, YKK Zipper, Patented Shockproof Design (E431)
Jämförelse av möjliga alternativ
Bild | Modell / recensioner | Pris | Vikt | Höjd | Skärm |
|---|---|---|---|---|---|
1. 89.9%  | Dell Pro 13 Premium PA13250 Intel Core Ultra 7 268V ⎘ Intel Arc Graphics 140V ⎘ 32 GB Minne, 1024 GB SSD | Amazon: 1. $39.99 Smatree Hard Shell Laptop Ca... 2. $29.99 Smatree Hard EVA Protective ... 3. $49.99 Smatree 13 inch Laptop Sleev... Listpris: 2700 Euro | 1.1 kg | 17.2 mm | 13.30" 1920x1200 170 PPI IPS |
2. 85% 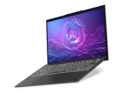 | MSI Prestige 13 AI Plus Evo A2VMG Intel Core Ultra 7 258V ⎘ Intel Arc Graphics 140V ⎘ 32 GB Minne | Amazon: $1,349.99 Listpris: 1400 USD | 970 g | 16.9 mm | 13.30" 2880x1800 255 PPI OLED |
3. 85.1%  | Lenovo ThinkPad X13 2-in-1 Gen 5 Intel Core Ultra 7 165U ⎘ Intel Graphics 4-Core iGPU (Arc) ⎘ 32 GB Minne, 1000 GB SSD | Amazon: $1,601.95 Listpris: 2107.23 Euro | 1.3 kg | 16.4 mm | 13.30" 1920x1200 170 PPI IPS |
4. 84%  | Framework Laptop 13.5 Core Ultra 7 155H Intel Core Ultra 7 155H ⎘ Intel Arc 8-Core iGPU ⎘ 32 GB Minne | Listpris: 1500 USD | 1.4 kg | 15.85 mm | 13.50" 2880x1920 256 PPI IPS |
5. 85.3%  | Dell XPS 13 9350 Intel Core Ultra 7 256V ⎘ Intel Arc Graphics 140V ⎘ 16 GB Minne, 512 GB SSD | Amazon: 1. $1,499.99 2025 Latest Dell XPS 13 9350... 2. $1,699.00 NewDell XPS 13 9350 Powerful... 3. $1,599.99 Dell XPS 13 9340 Business La... Listpris: 1400 USD | 1.2 kg | 15.3 mm | 13.40" 1920x1200 169 PPI IPS |
6. 80.7% 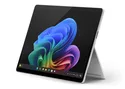 | Microsoft Surface Pro Copilot+ Qualcomm Snapdragon X Plus X1P-64-100 ⎘ Qualcomm SD X Adreno X1-85 3.8 TFLOPS ⎘ 16 GB Minne, 256 GB SSD | Amazon: $1,079.99 Listpris: 1199€ | 872 g | 9.3 mm | 13.00" 2880x1920 266 PPI IPS |
Innehållsförteckning
- Omdöme - En nästan komplett bärbar dator för företag
- Specifikationer
- Fodral och funktioner - Denna Dell levereras med en 8 MP webbkamera
- Inmatningsenheter - 13 Premium har en pekplatta för konferenssamtal
- Display - En kontorspanel med hög kontrast med ytterligare alternativ
- Prestanda - En kraftfull ljusbåge 140V
- Utsläpp och energi - Dell Pro är ekonomisk
- Notebookcheck övergripande betyg
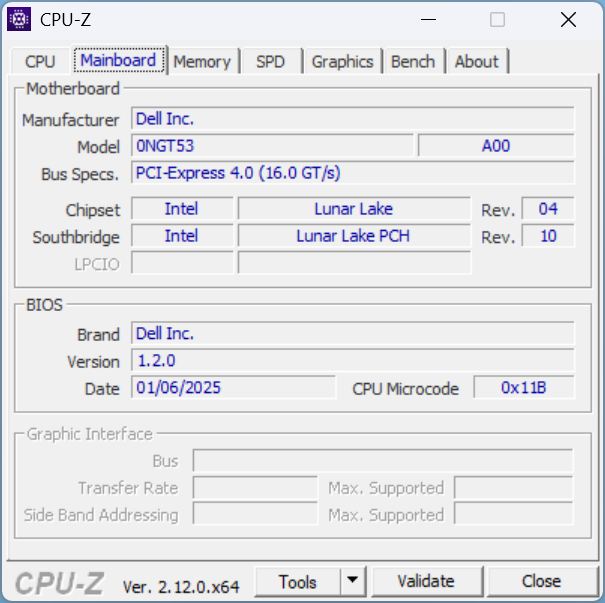
Dell har nyligen ändrat sitt namngivningsschema. Med Pro-serien riktar Dell in sig på den typiska företagsanvändaren och ersätter i princip den tidigare Latitude -serien. Premium står för de bästa materialen och funktionerna, och vår nuvarande 13-tumsmodell har moderna portar, omfattande säkerhet, massor av AI, ett robust magnesiumchassi och väger trots detta strax över 1 kg. Så är det här den bärbara premiumdatorn för företagsanvändare?
Specifikationer
Fodral och funktioner - Denna Dell levereras med en 8 MP webbkamera
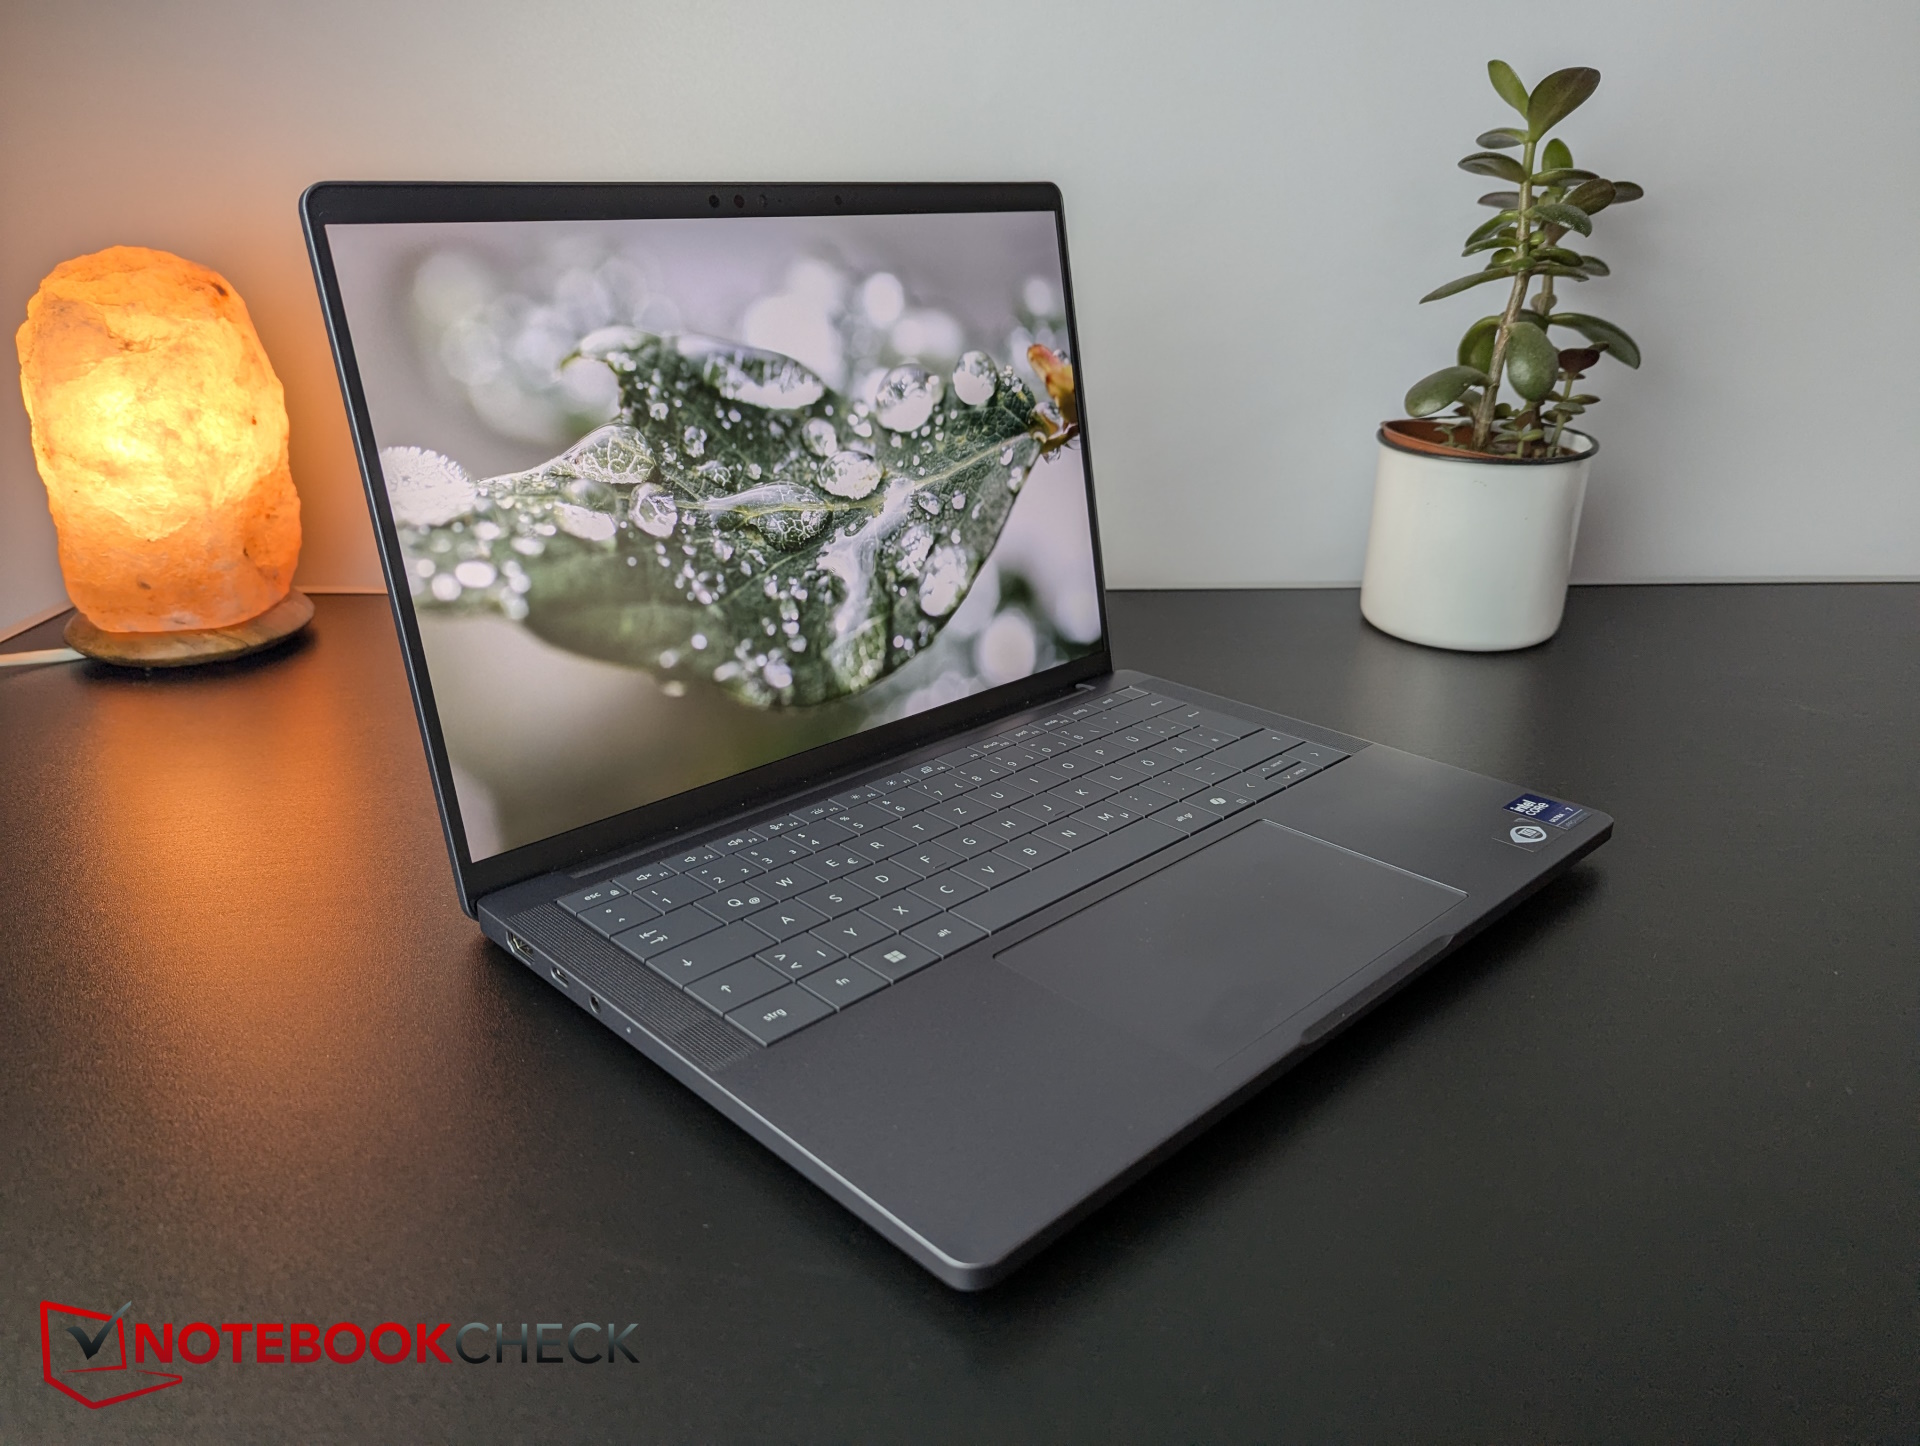
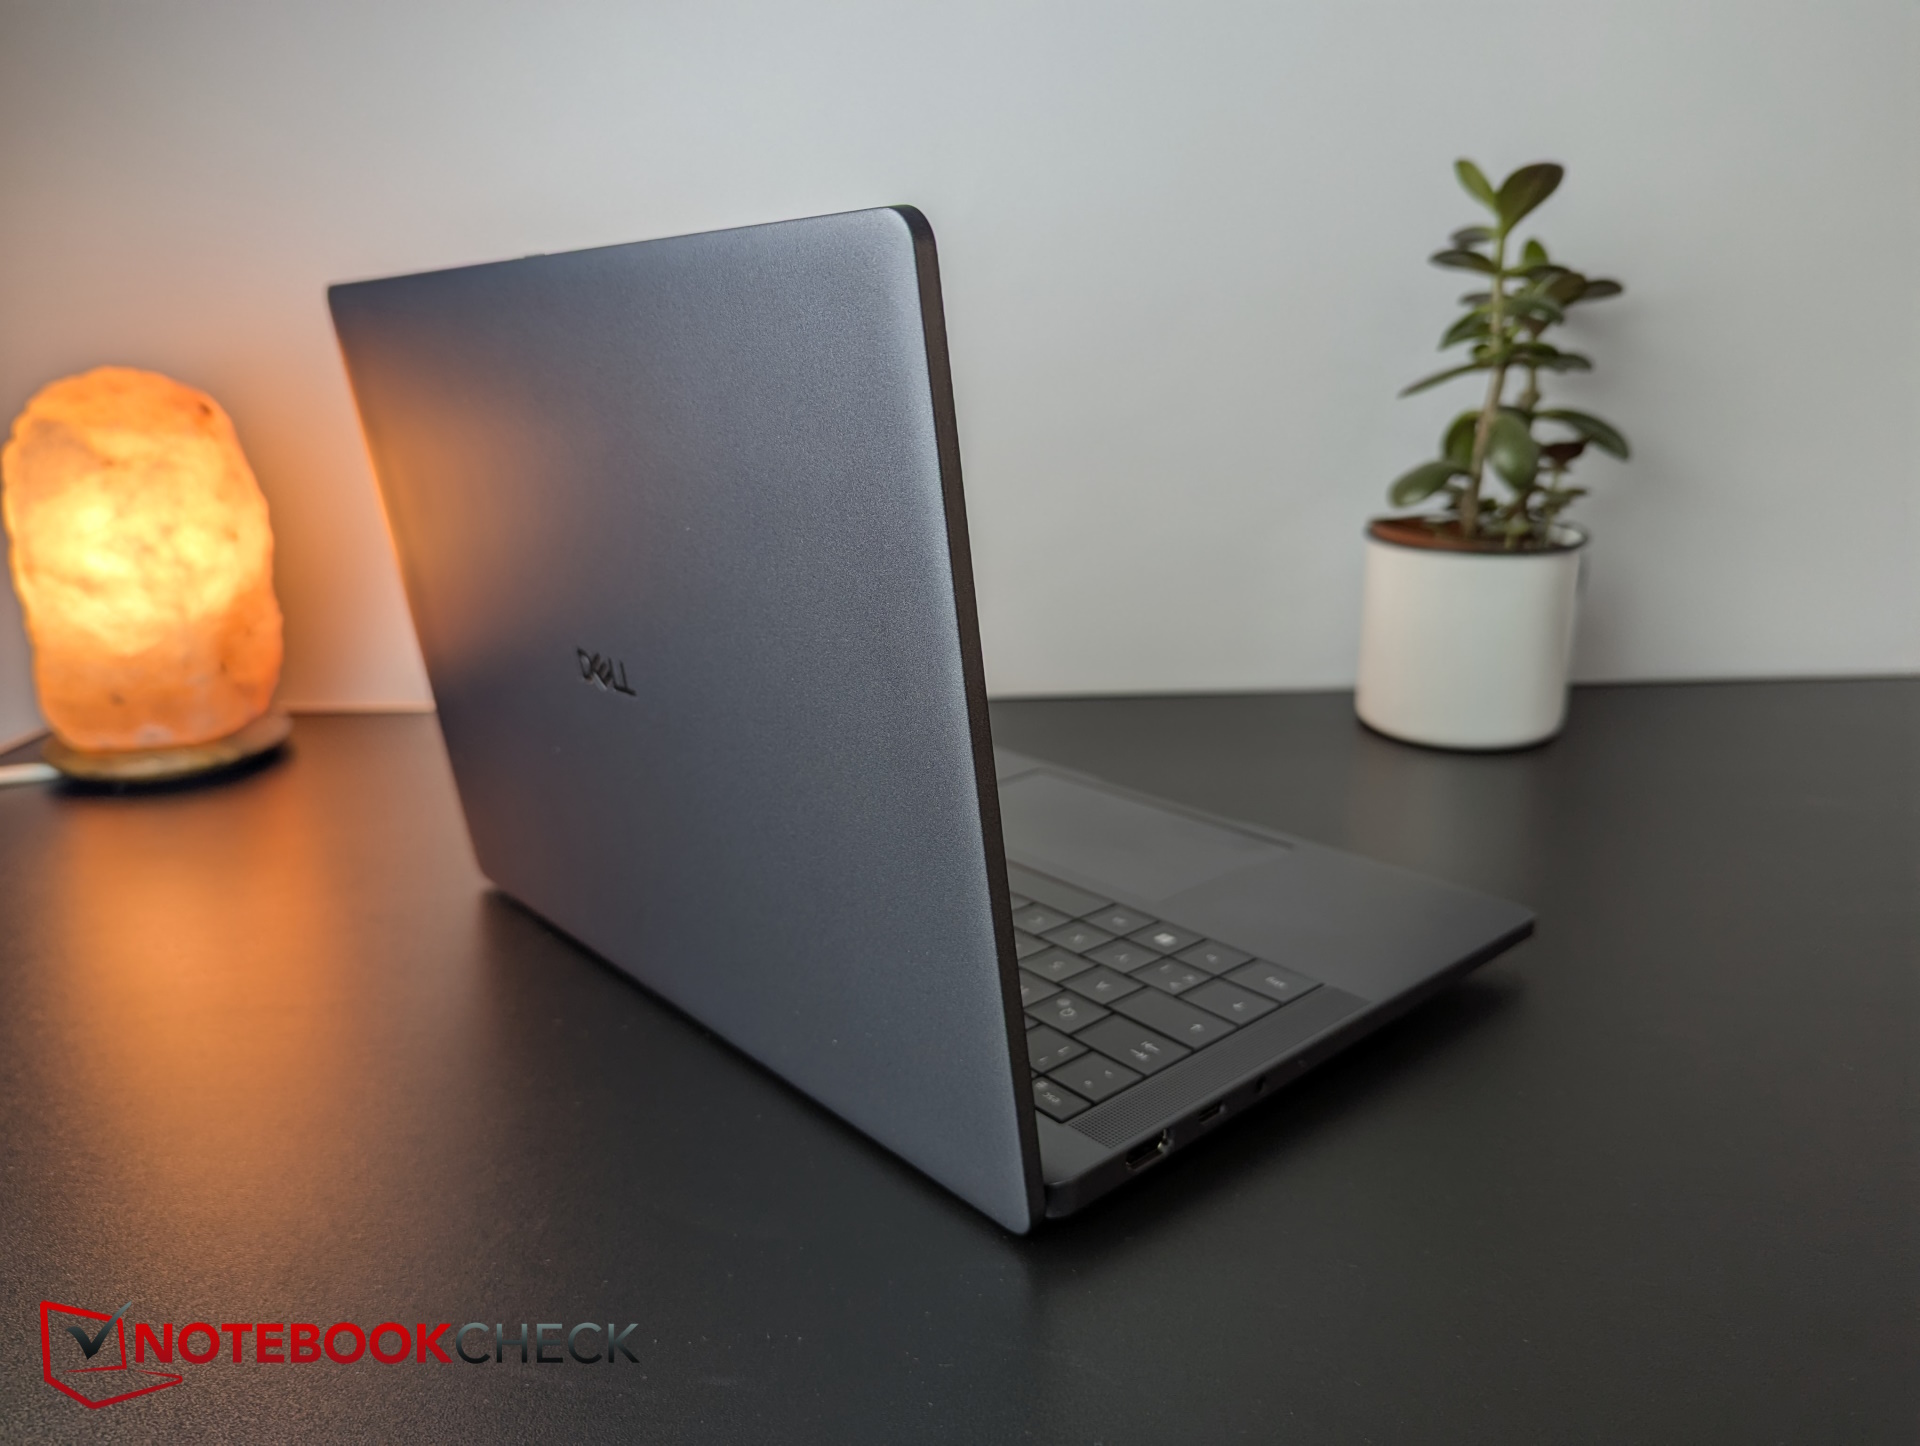
Det mörkgrå höljet är tillverkat av 90 procent återvunnet magnesium. Detta gör basenheten och 180-graderslocket mycket stabila och vi upptäckte inga knarrande ljud när vi vred på enheten. Designen framstår som extremt kompakt och enkel men ändå elegant.
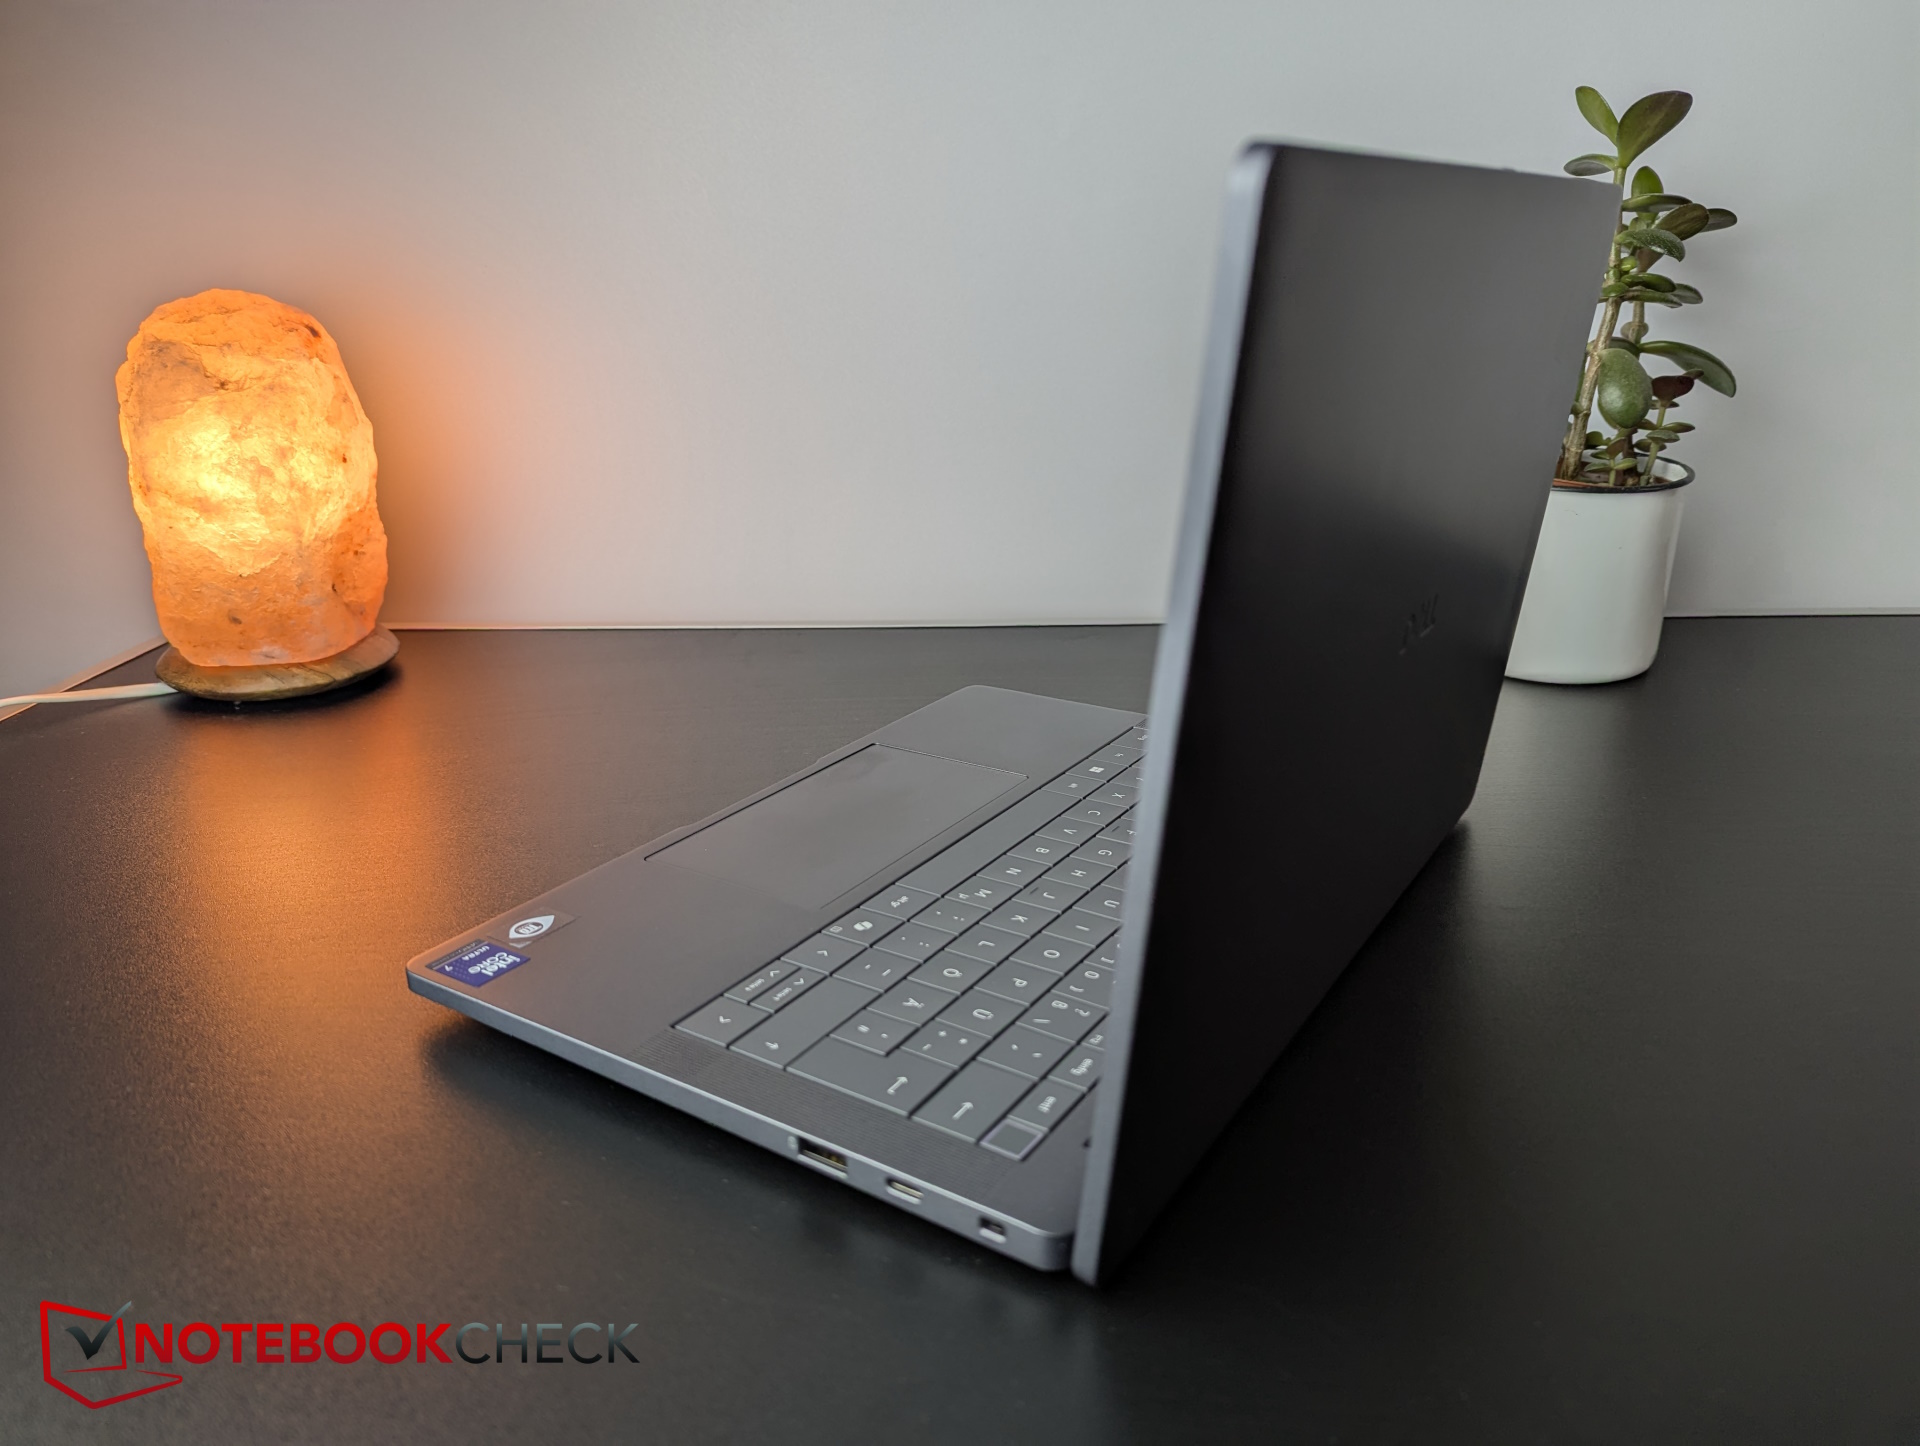
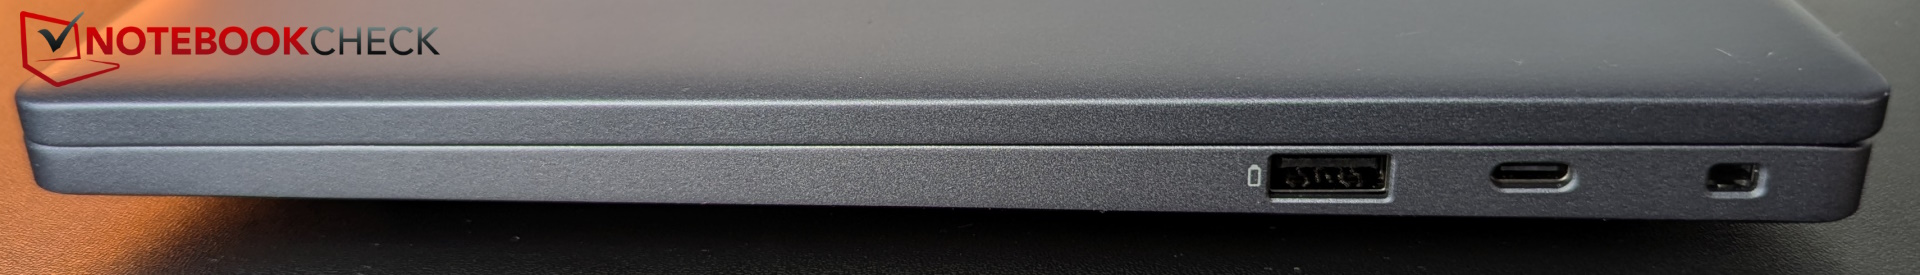
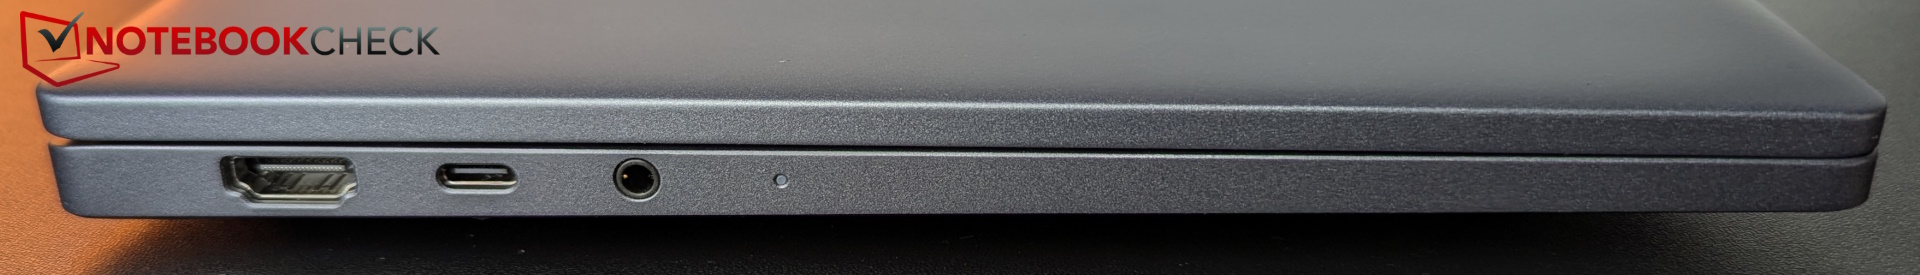
Pro 13 Premium har två Thunderbolt 4-portar, en på varje sida, och en HDMI-port i full storlek. En fingeravtryckssensor är integrerad i strömknappen. Det finns ingen kortläsare eller dedikerad LAN-port. Dell erbjuder dock Wi-Fi 7. En SIM-kortplats är tillval.
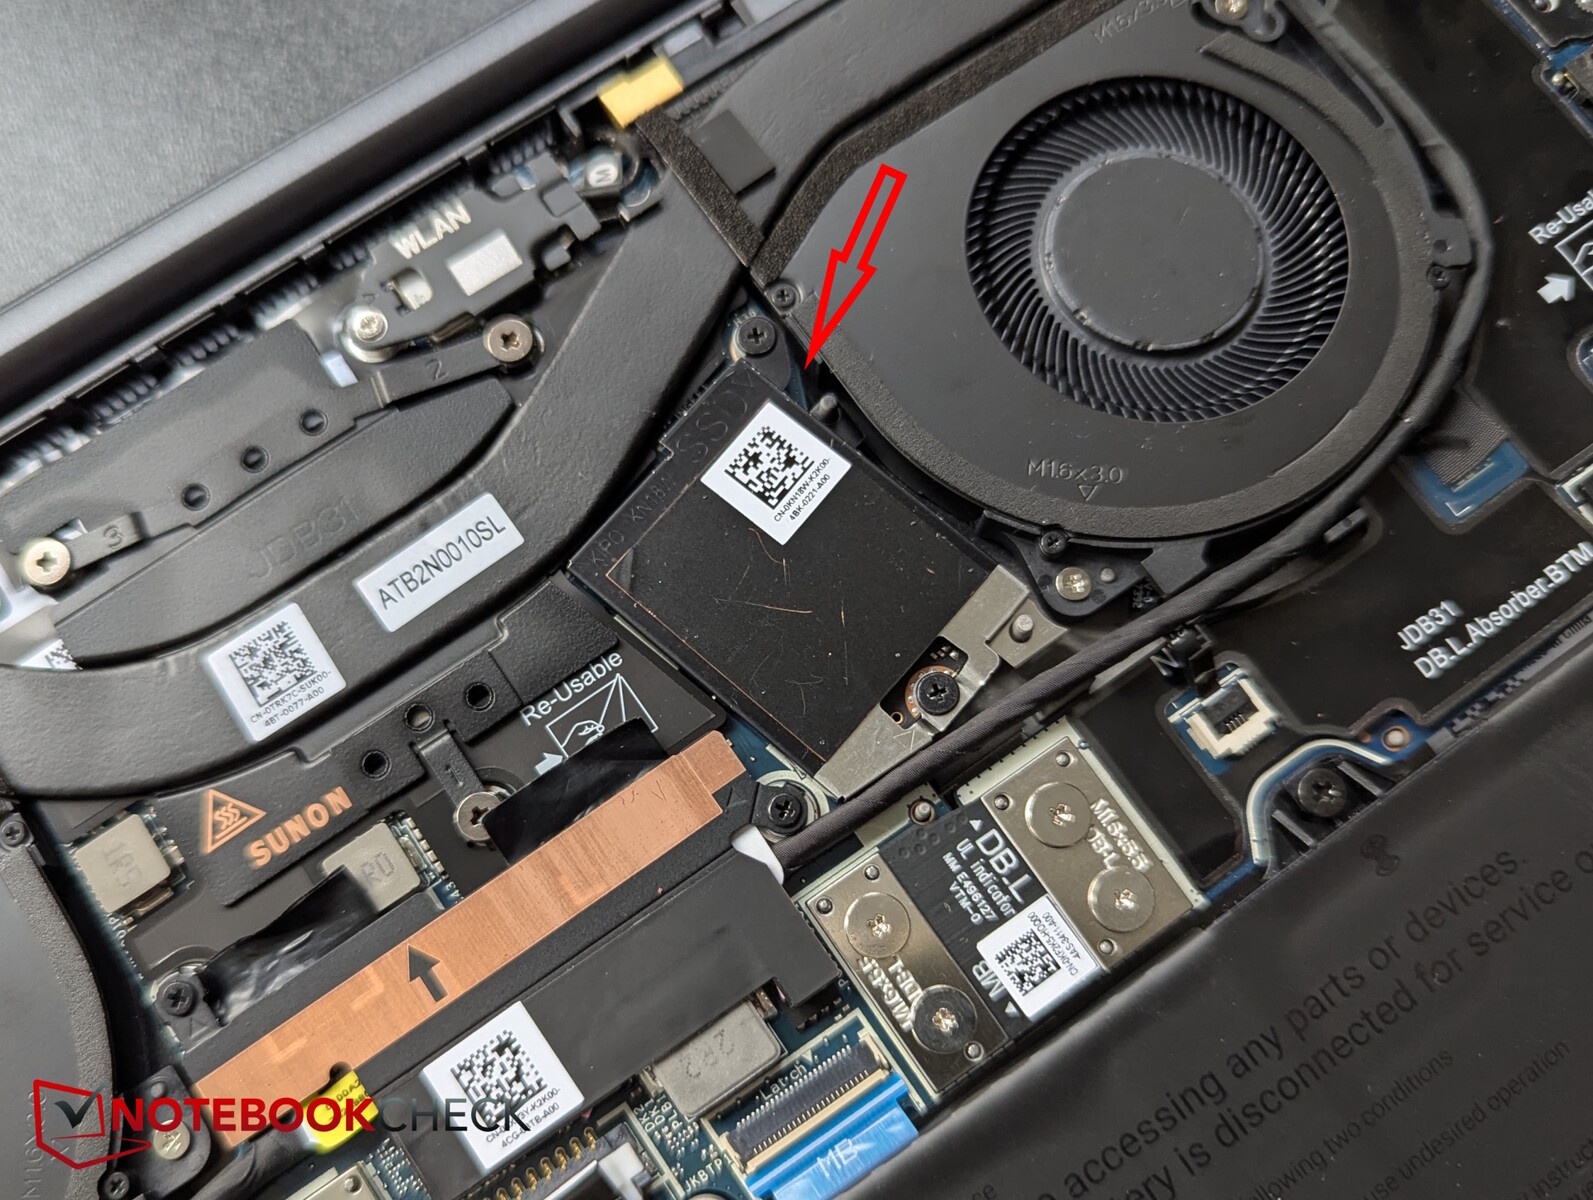
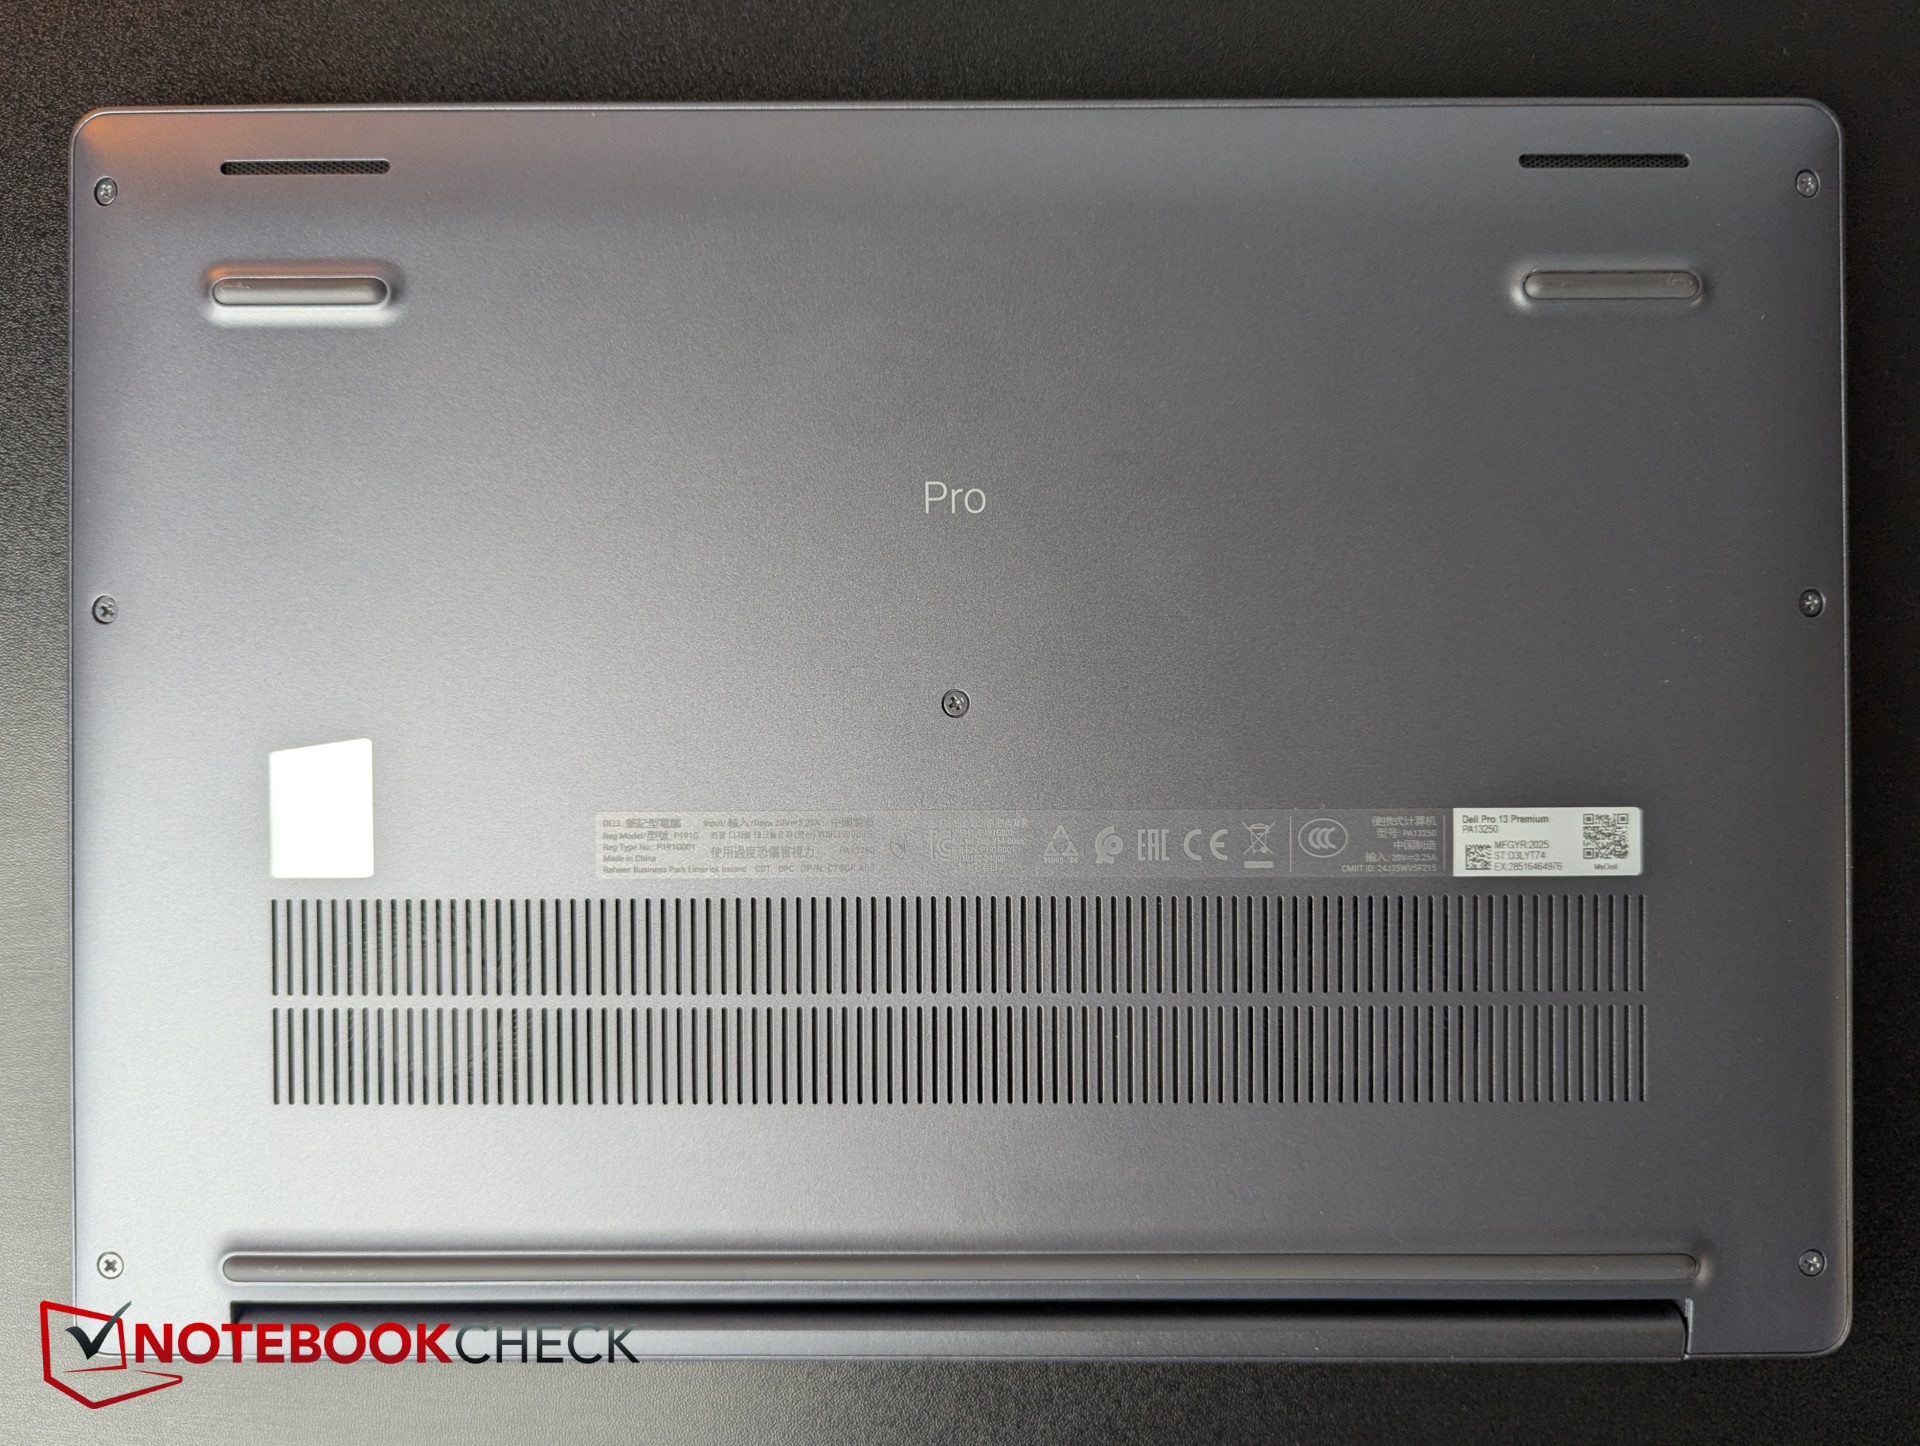
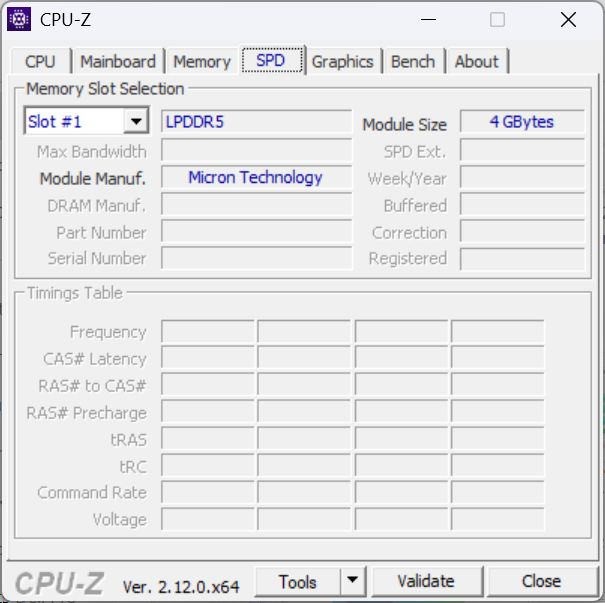
Den bärbara affärsdatorn är relativt lätt att öppna med stjärnskruvarna kvar i bottenplattan. RAM-minnet och Wi-Fi-modulen är dock permanent installerade inuti, och SSD-enheten är endast i det lilla M.2 2230-formatet och saknar en andra kortplats.
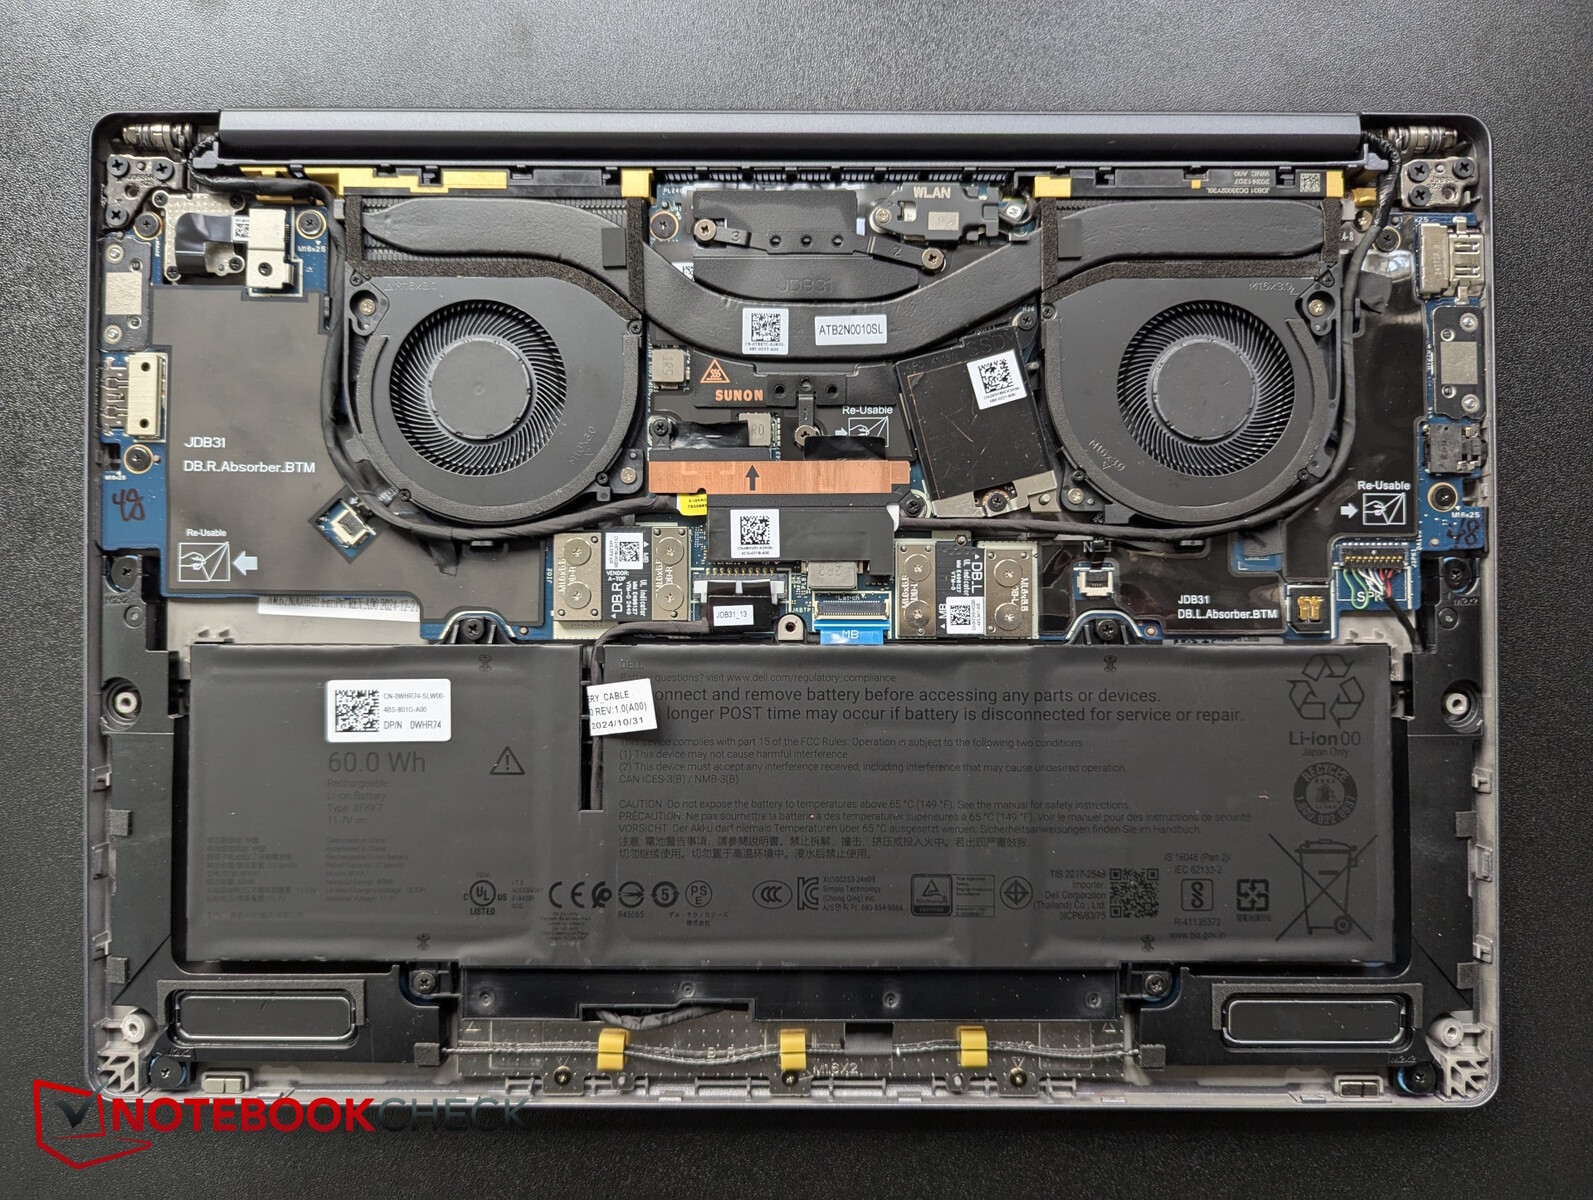
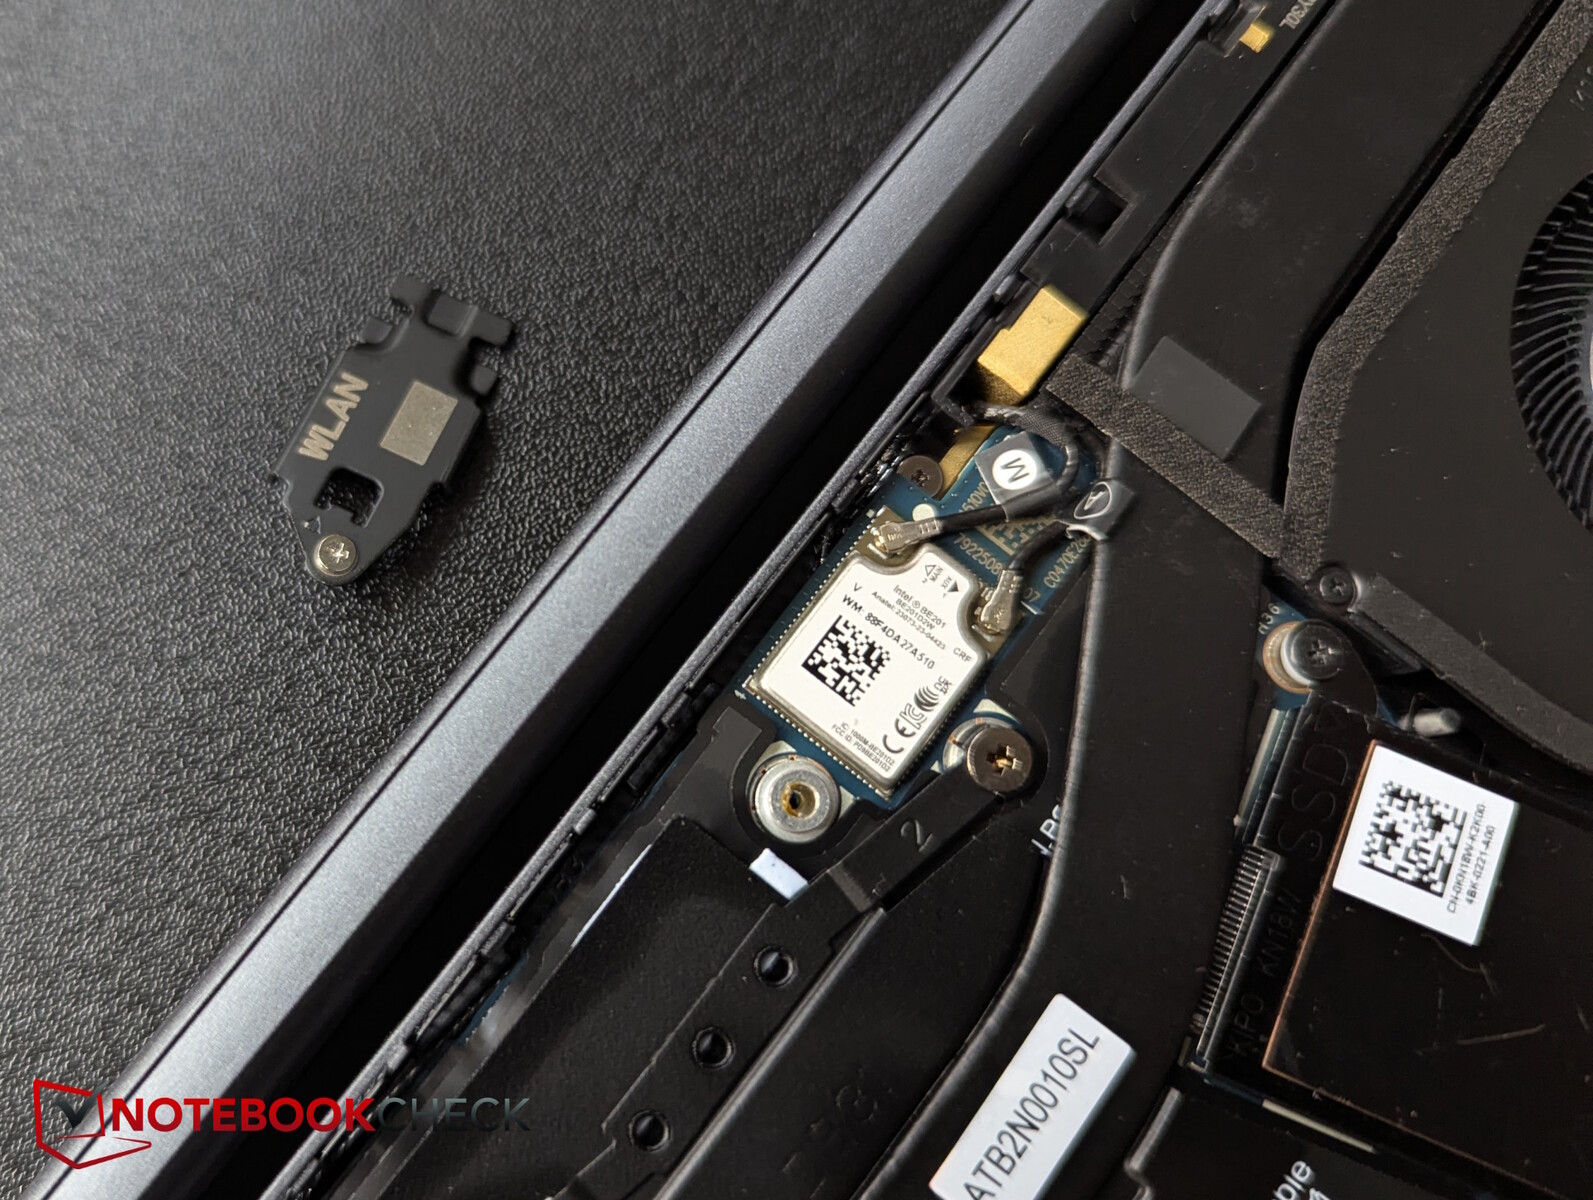

IR-webbkameran har en ovanligt hög upplösning på 8 MP. Detta ger testbilderna bra skärpa, men färgavvikelserna är medelstora till stora, särskilt i det gröna området. WiFi 7-modulen levererar genomgående höga överföringshastigheter.


Hållbarhet
Enligt Asus är Pro 13 Premium ENERGY STAR-certifierad, EPEAT Gold-registrerad och har en Climate+-sigill. Den uppfyller också den senaste TCO Generation 9-certifieringen för strömförbrukning och reparerbarhet.
Materialen som används inkluderar PCR-plast, återvunnet magnesium, biobaserad plast och återvunnen kobolt, och förpackningen är tillverkad av 100% återvunnet eller förnybart material, främst kartong.
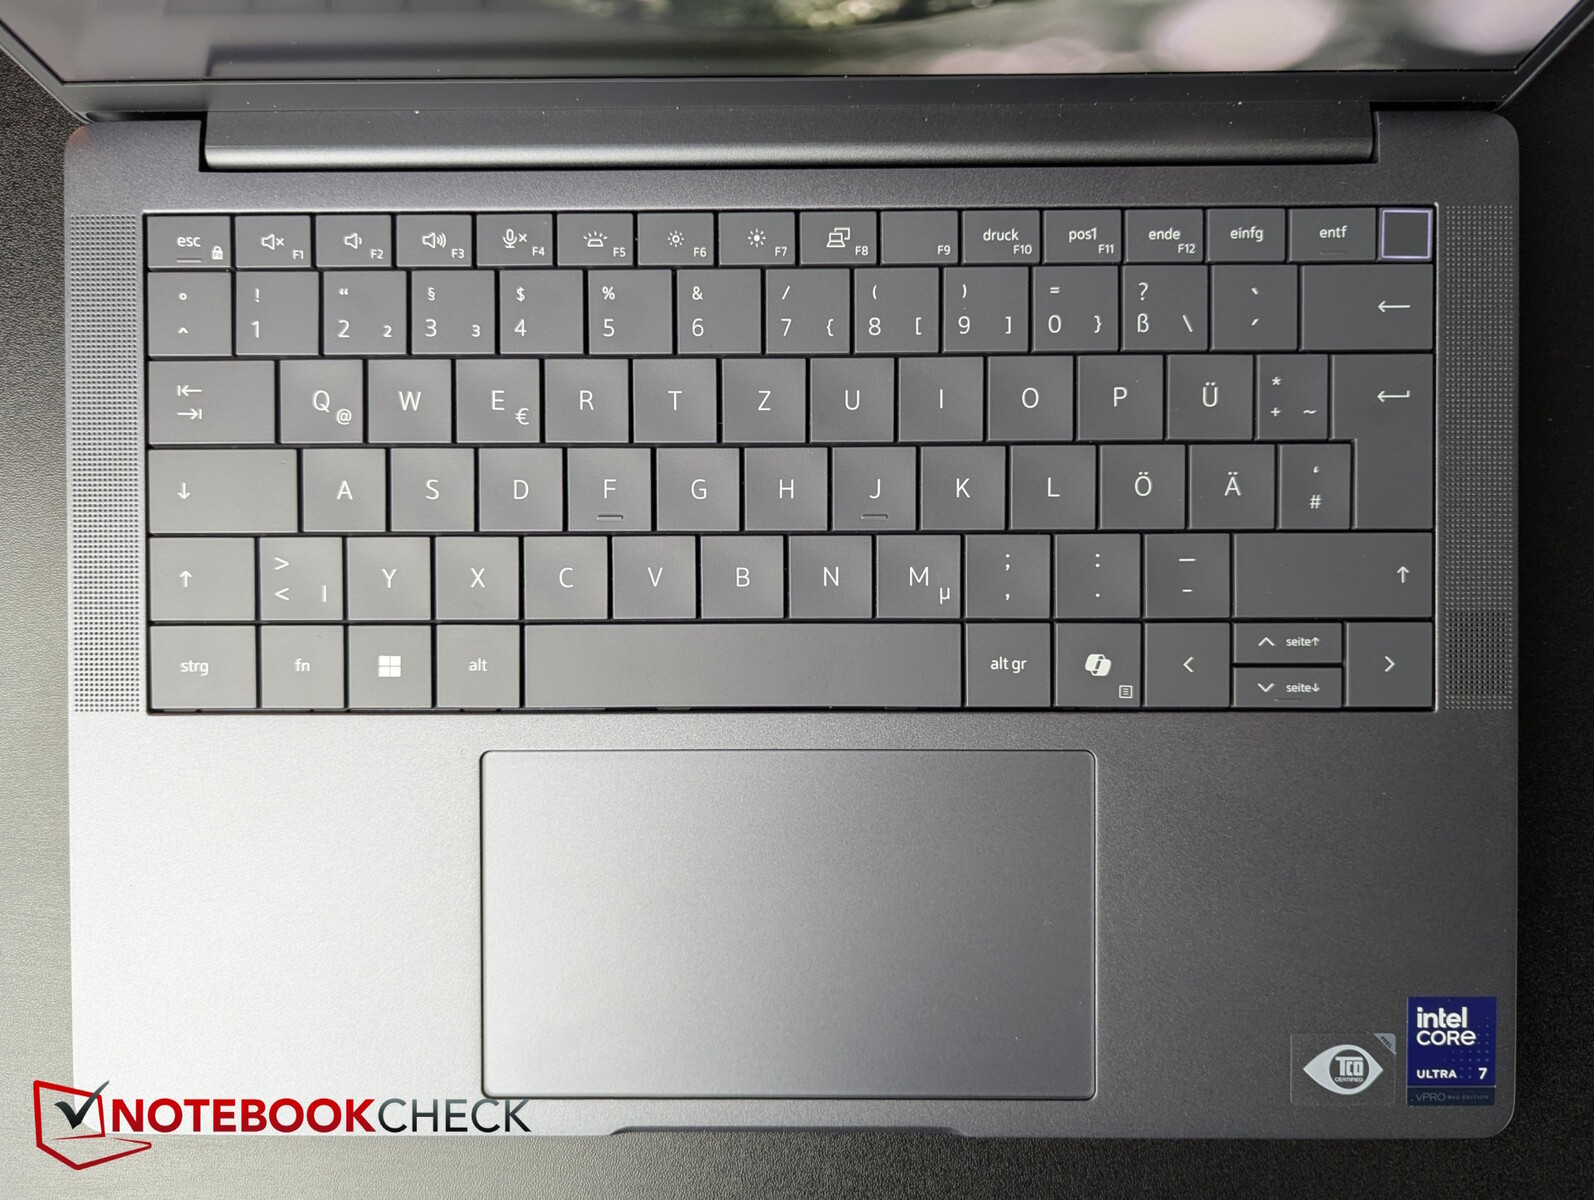
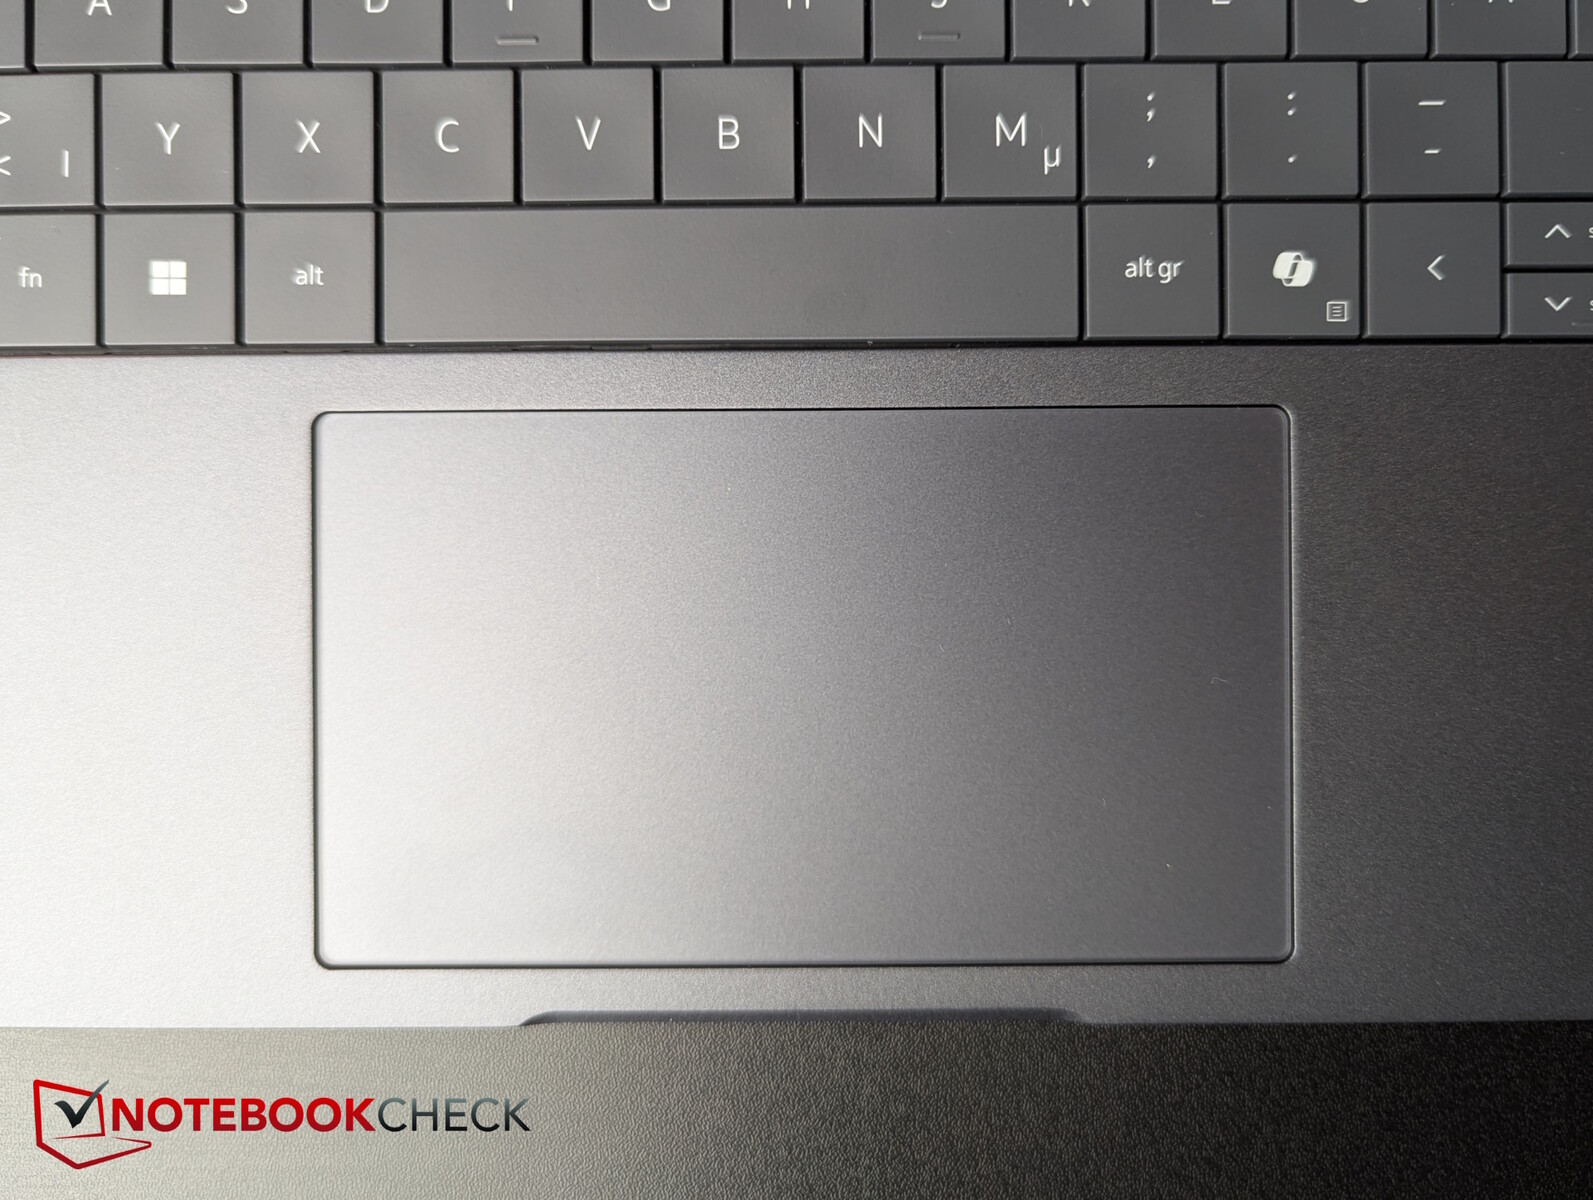
Inmatningsenheter - 13 Premium har en pekplatta för konferenssamtal
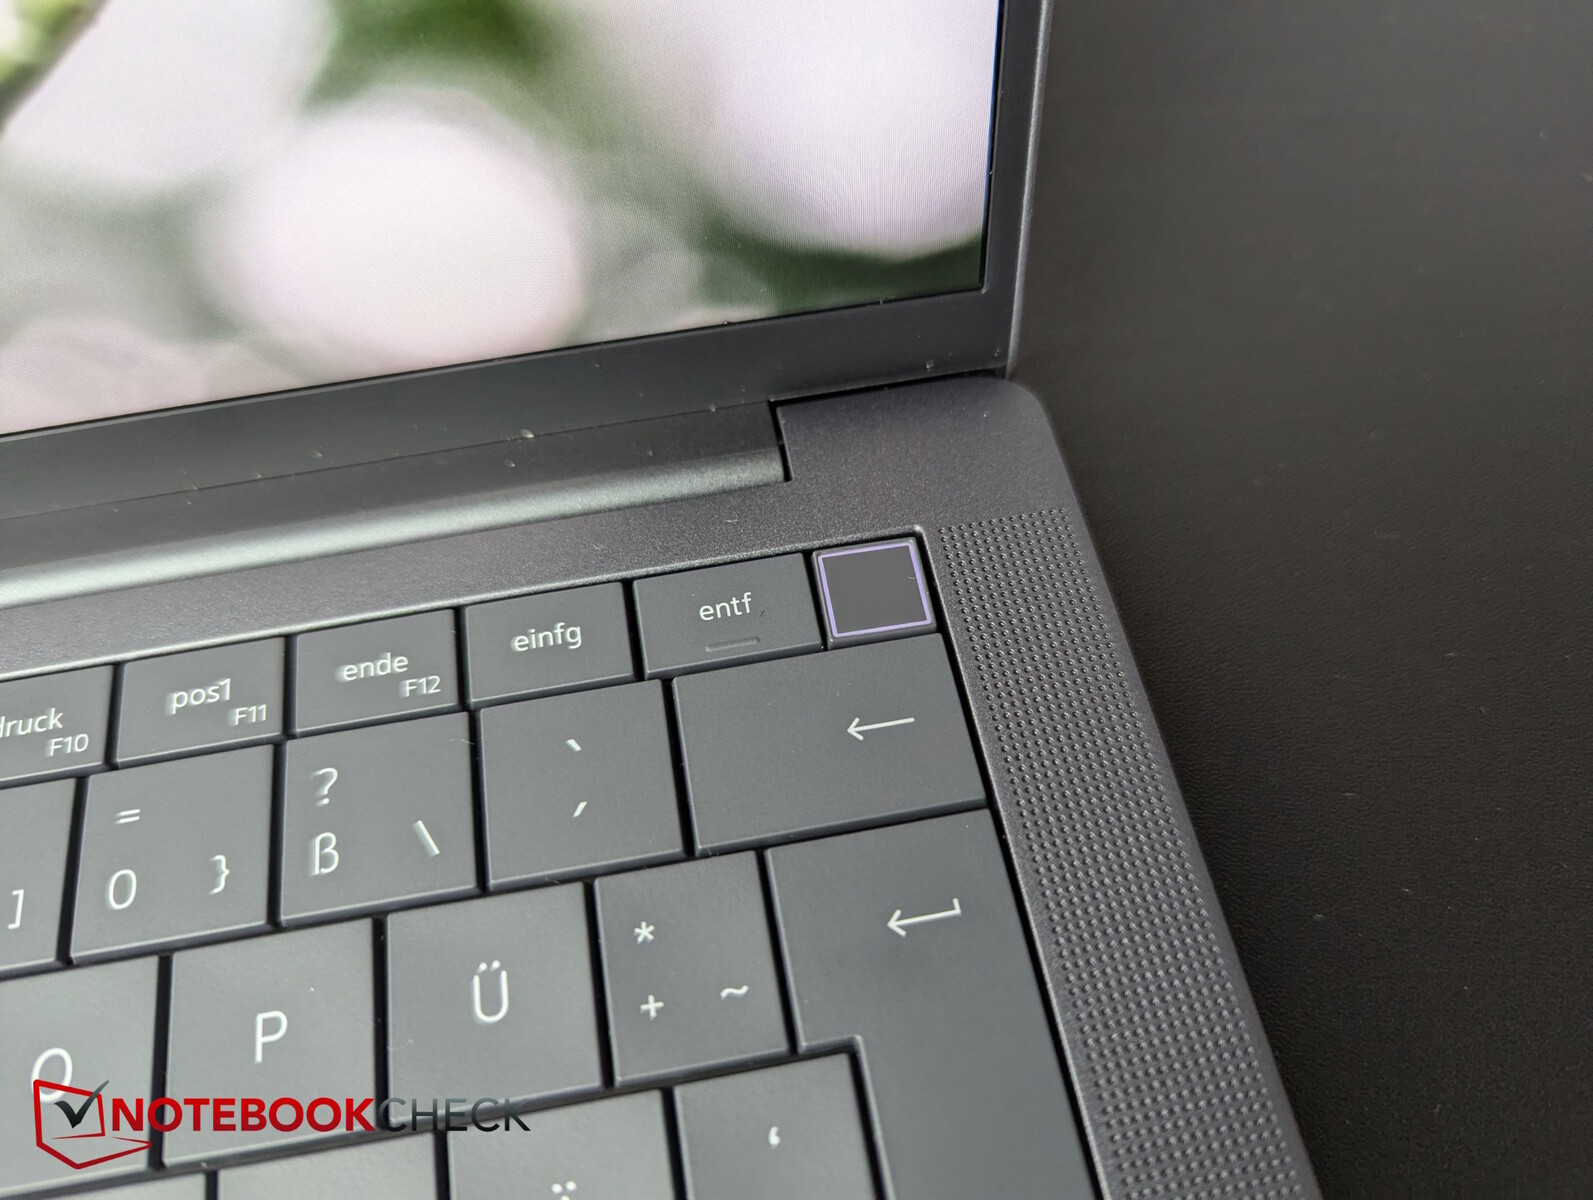
Dell erbjuder en mycket ren och kompakt layout med stora tangenter (ca 1,7 cm), inga mellanrum mellan dem och de vertikala piltangenterna är halverade i höjdled. Strömknappen som är integrerad i tangentbordet längst upp till höger rymmer även en fingeravtryckssensor.
Tangenterna har liten till medelstor rörelse men tydlig återkoppling. Detta gör att användaren kan skriva snabbt och ljudet från tangenterna är mer än måttligt. Strömförbrukningen för bakgrundsbelysningen i två steg uppges ha minskat med upp till 75 procent tack vare mini-LED.
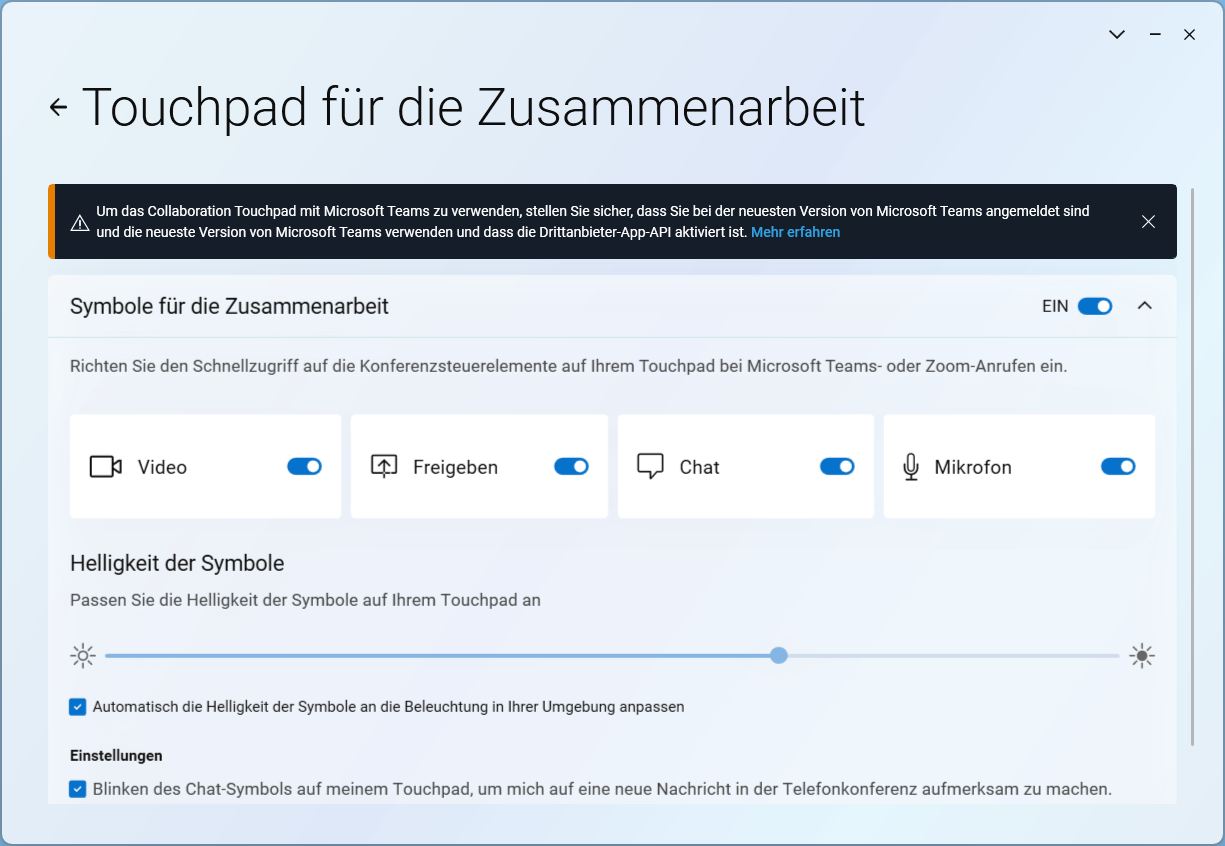
Pekplattan mäter ca 12,5 x 7,1 cm, och den utmärkande egenskapen är att det finns särskilda knappar för videochatt i den övre raden (kamera på/av, skärmdelning, chatt, mikrofon på/av). Touch-symbolerna är endast synliga under Zoom- eller Microsoft Teams-samtal. Ytan är mycket slät, men om du precis har tvättat händerna eller av någon annan anledning har lite fuktiga fingrar kommer det att hacka betänkligt. De integrerade musknapparnas tysta klick ger en behaglig feedback och utlöses på ett tillförlitligt sätt.

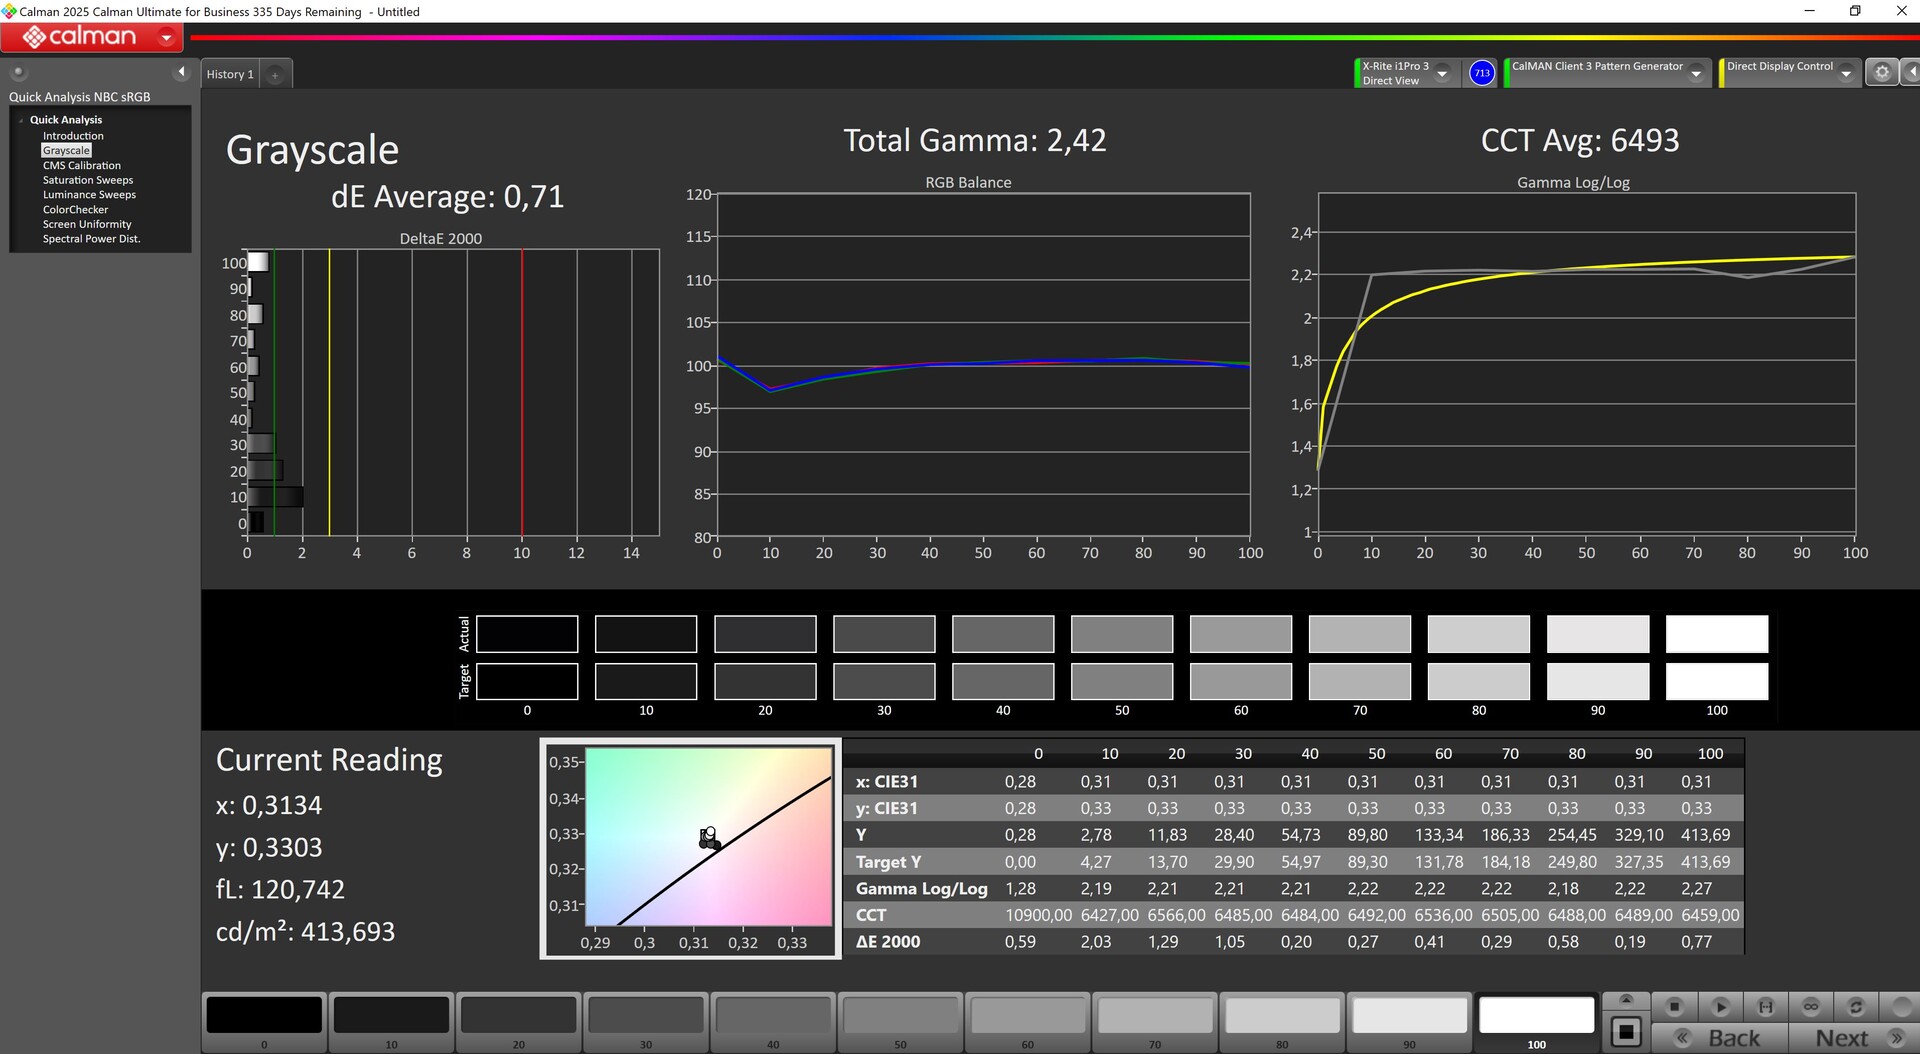
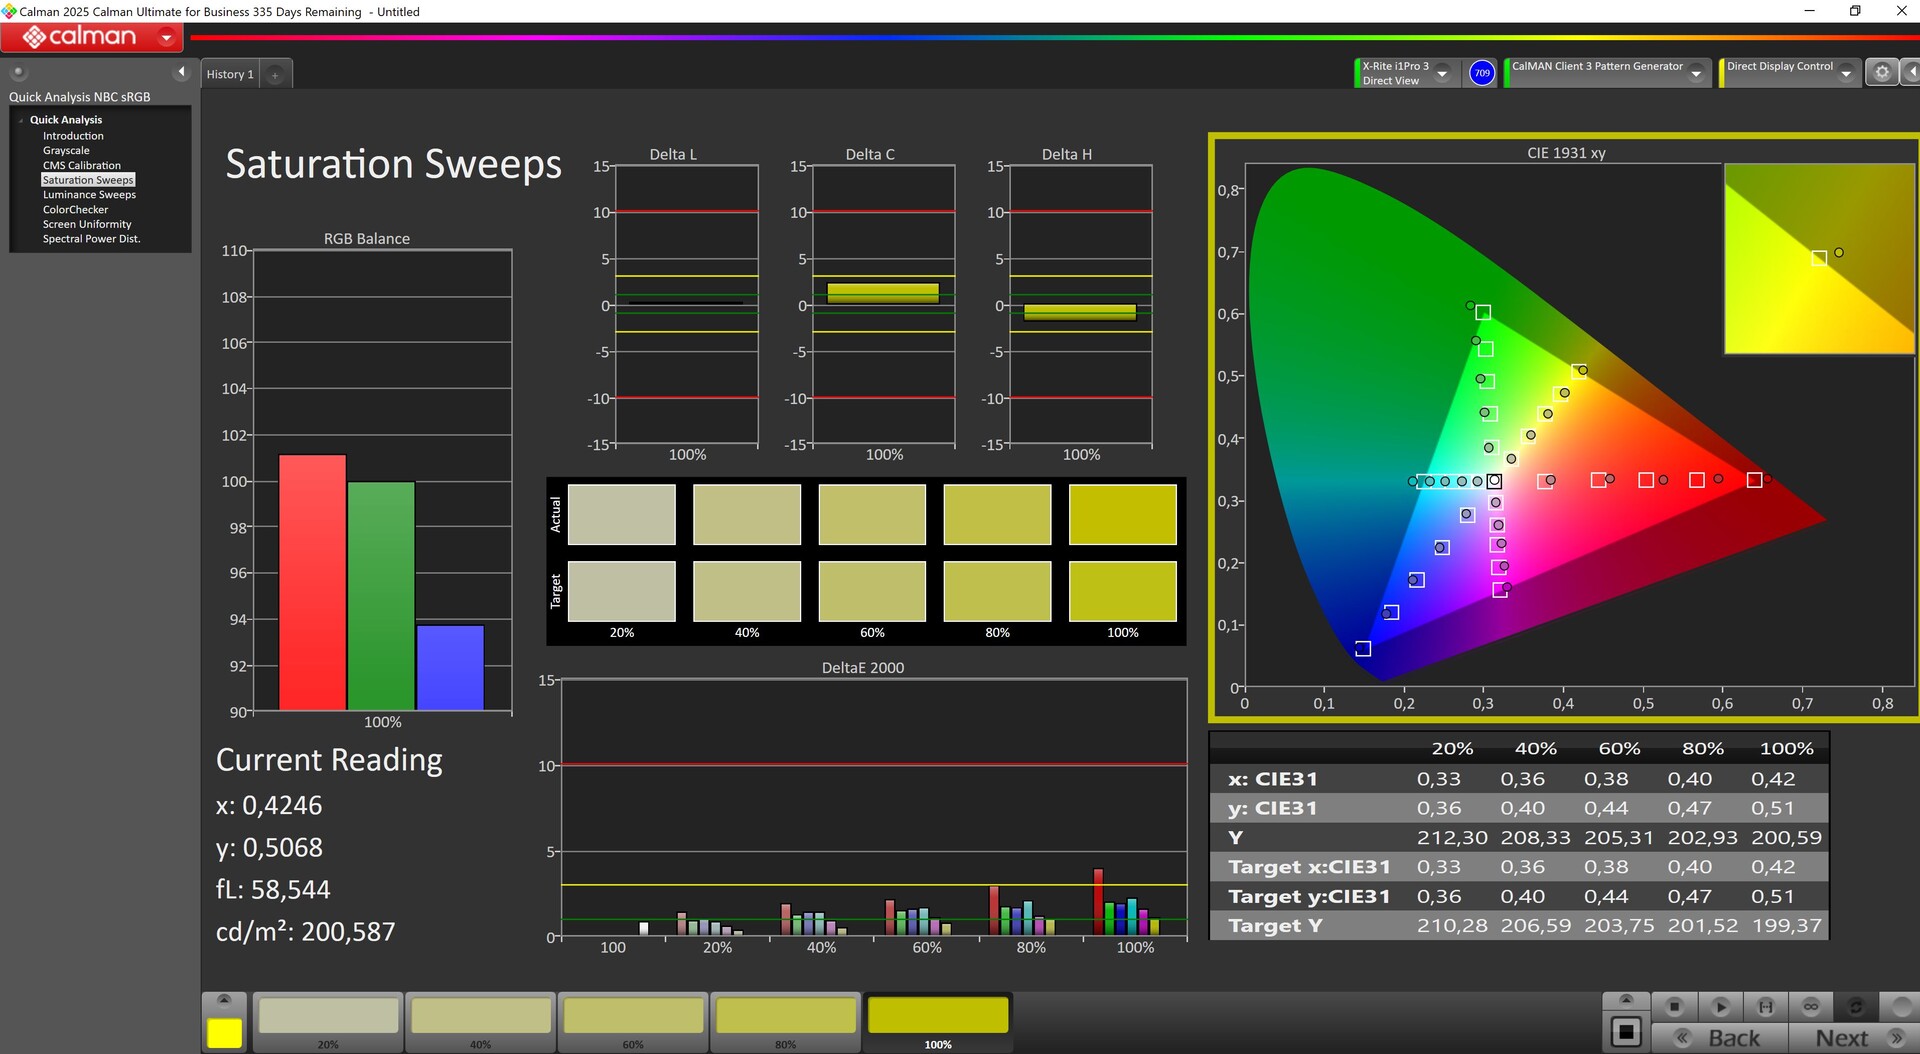
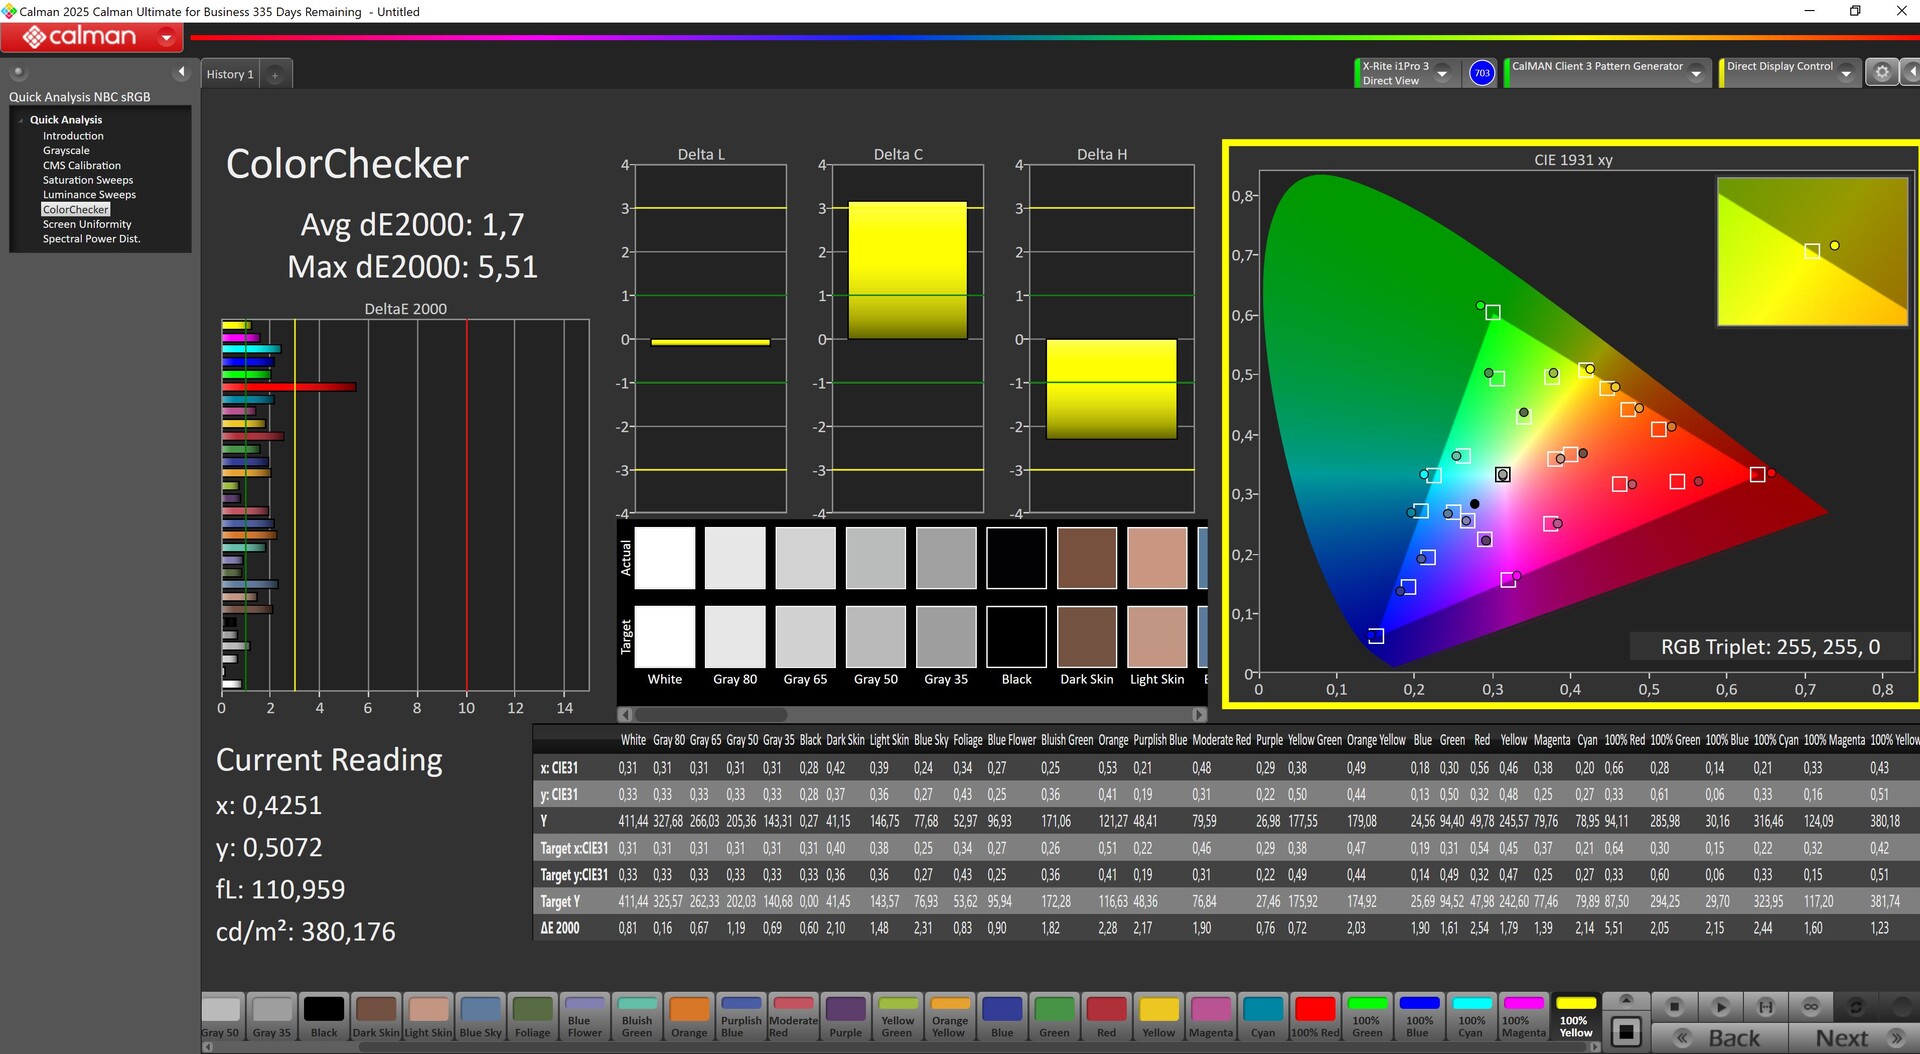
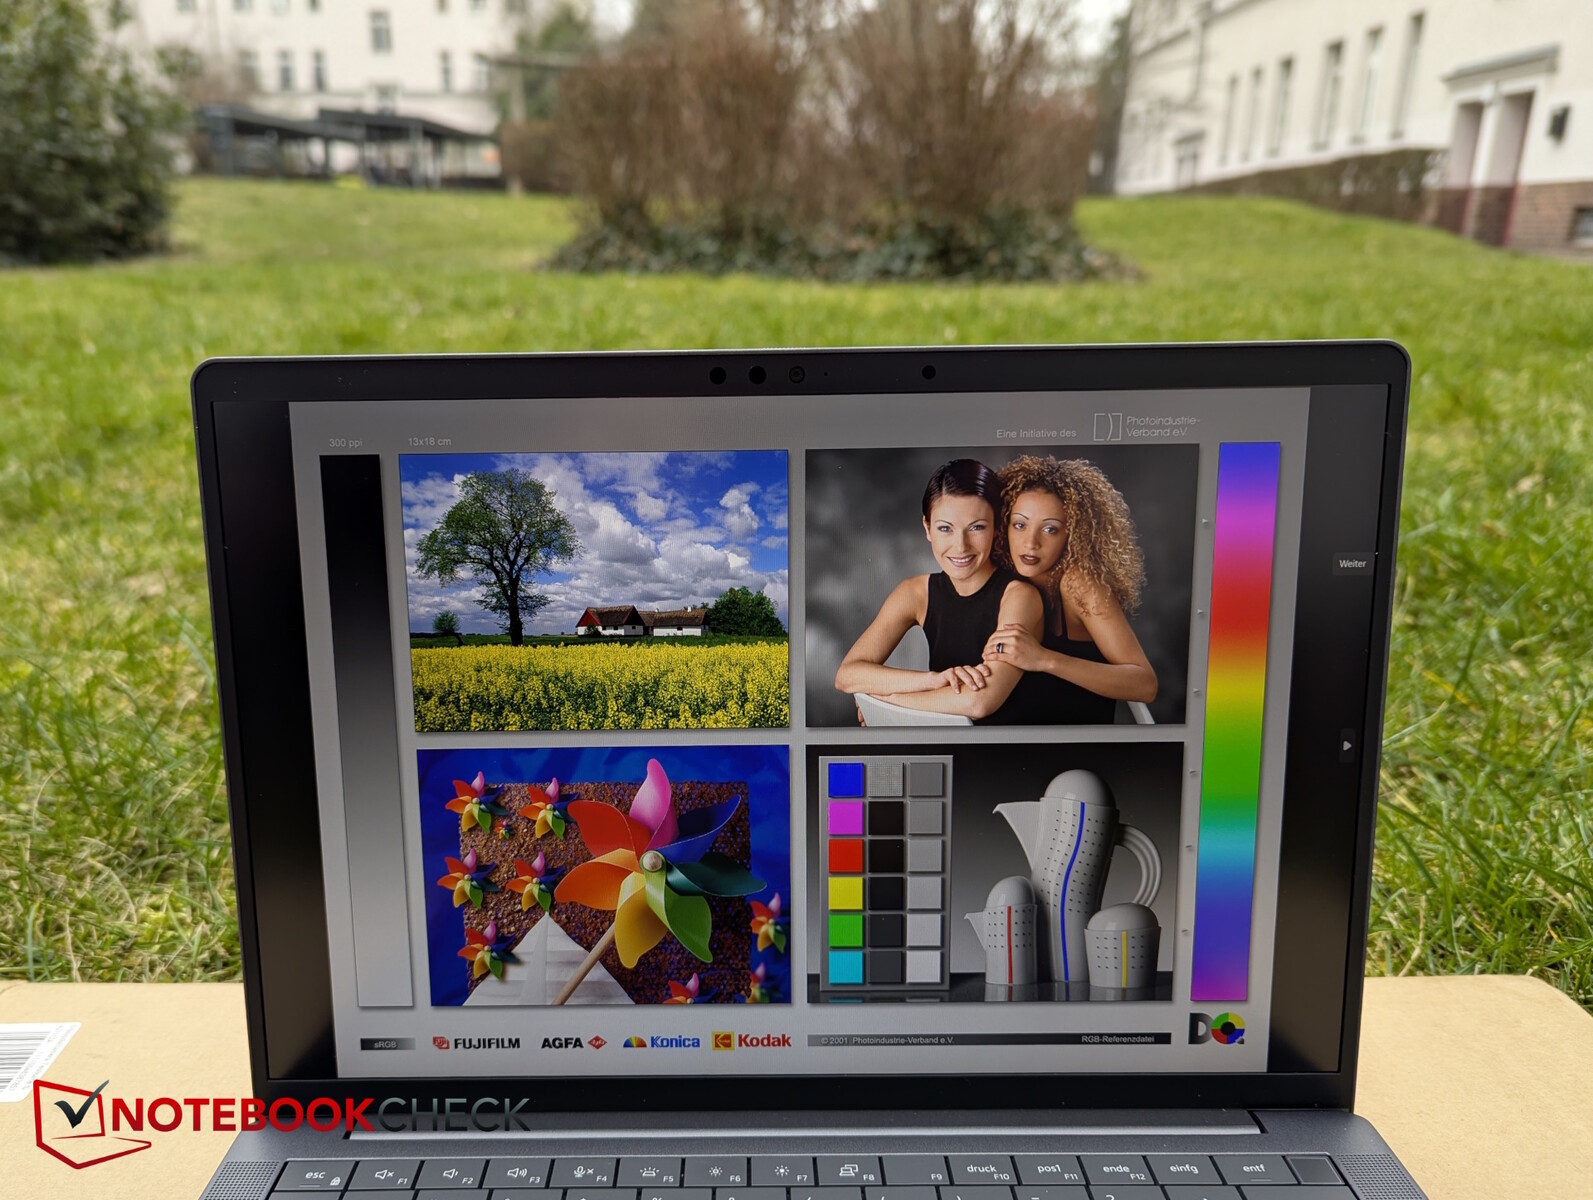
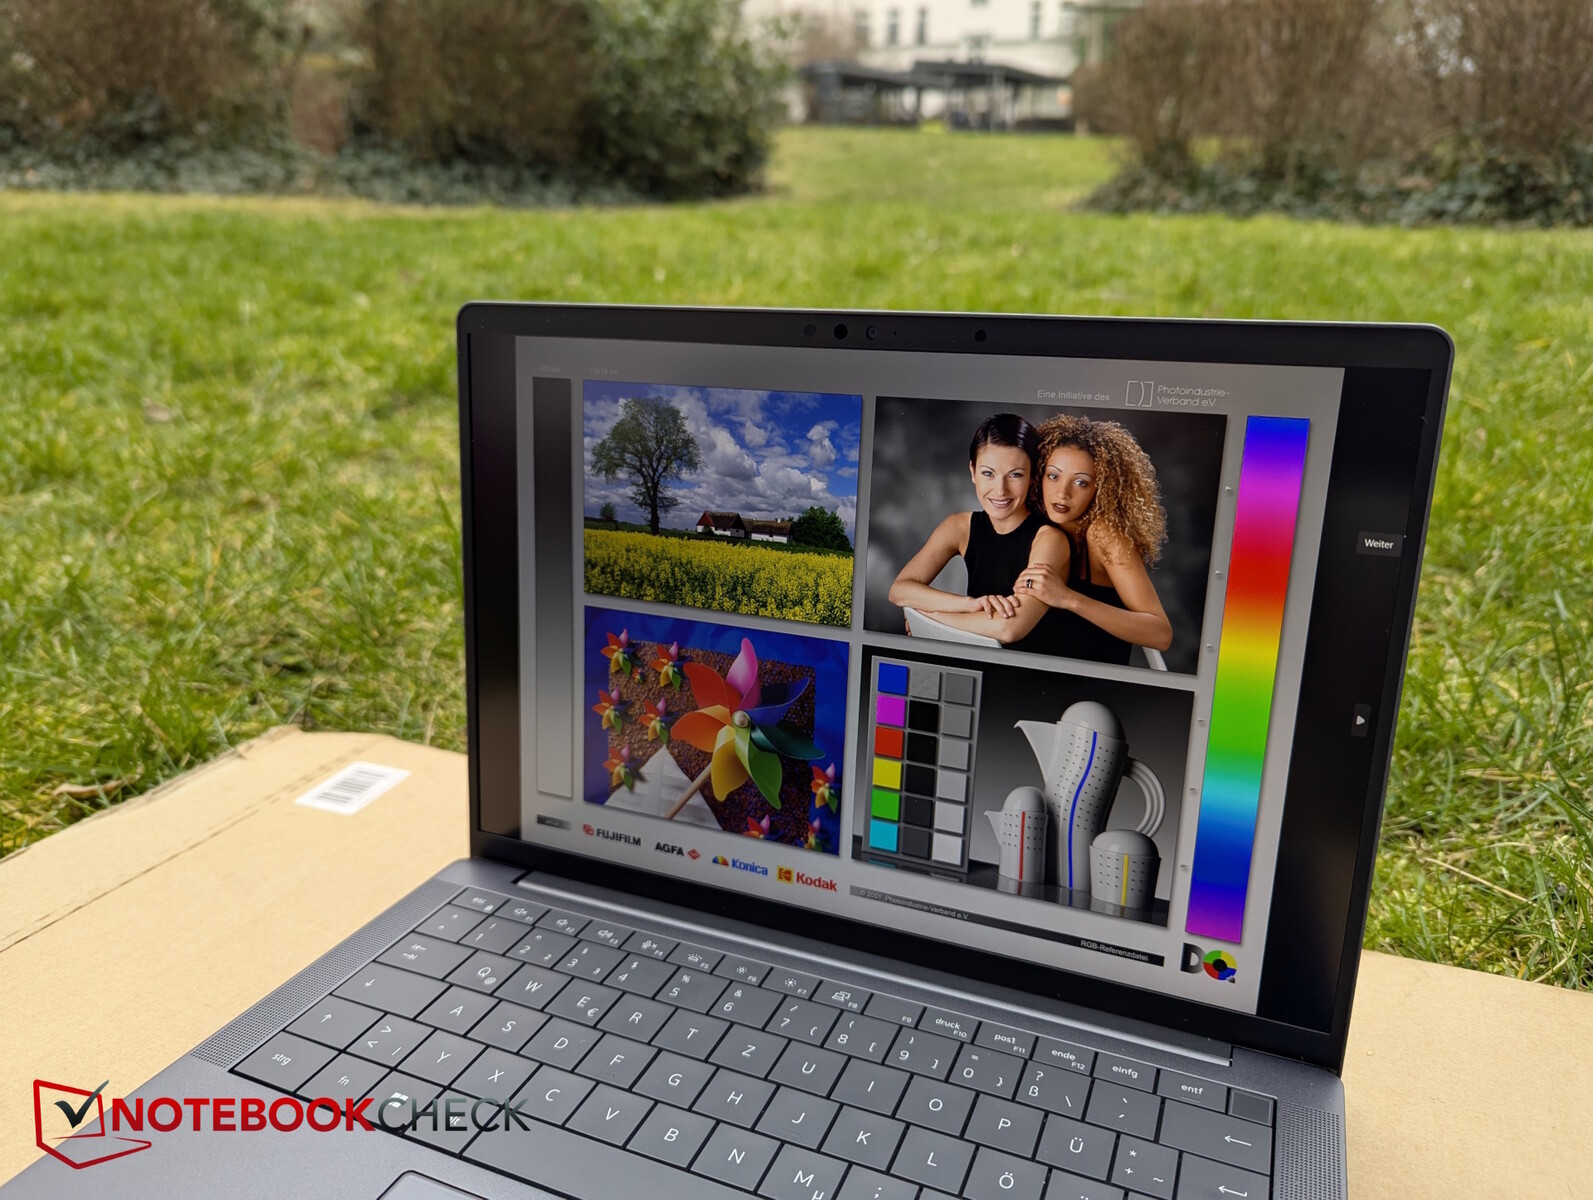
Display - En kontorspanel med hög kontrast med ytterligare alternativ
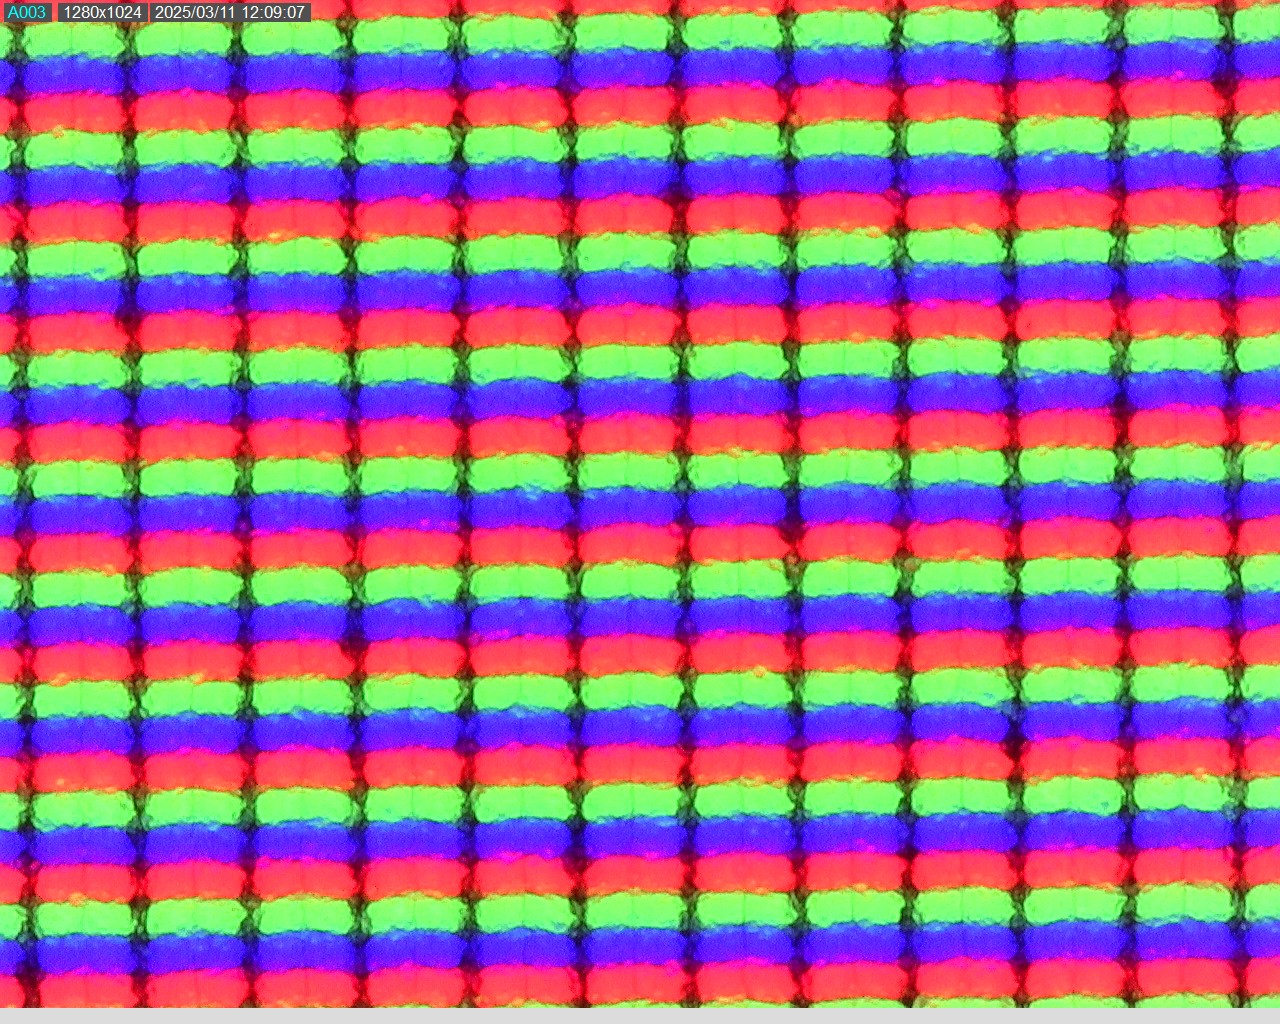
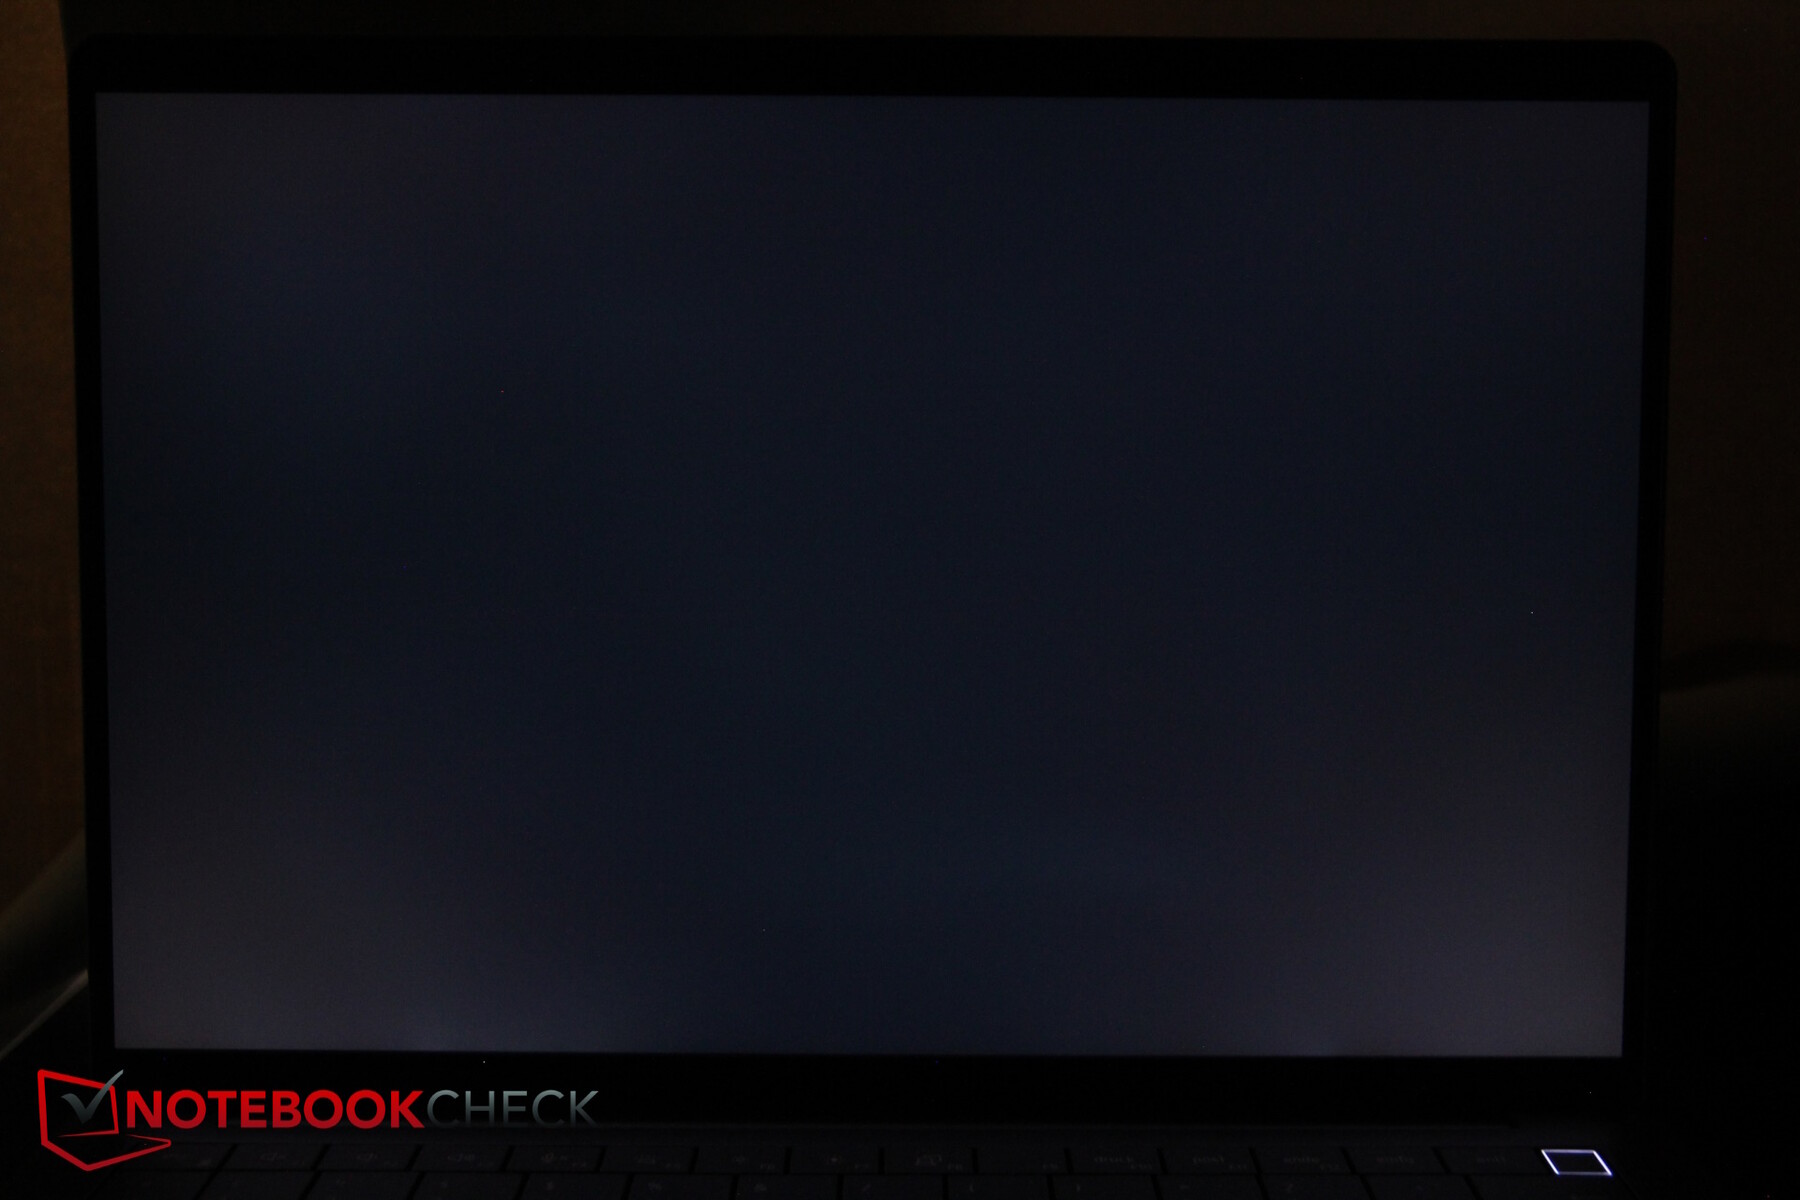
Det finns flera olika skärmalternativ, men det vi tittar på här är en matt skärm med bildförhållandet 16:10, 1 920 x 1 200 pixlar med en officiell ljusstyrka på 400 nits och ingen pekfunktion. Det finns också en 300-nits version, samt toppalternativet, som har en upplösning på 2 560 x 1 600 pixlar, 500 nits och pekfunktionalitet. Dell betonar att alla deras skärmar är särskilt energieffektiva.
Vi uppmätte en väl belyst genomsnittlig ljusstyrka på 460 nits. Kontrasten är också mer än anständig, tack vare den relativt låga svartnivån. AdobeRGB och Display P3 täcks till cirka 75 procent, och sRGB nästan helt.
Svarstiderna är dock ganska långsamma, och panelen stöder endast 60 Hz.
| |||||||||||||||||||||||||
Distribution av ljusstyrkan: 89 %
Mitt på batteriet: 456 cd/m²
Kontrast: 1983:1 (Svärta: 0.23 cd/m²)
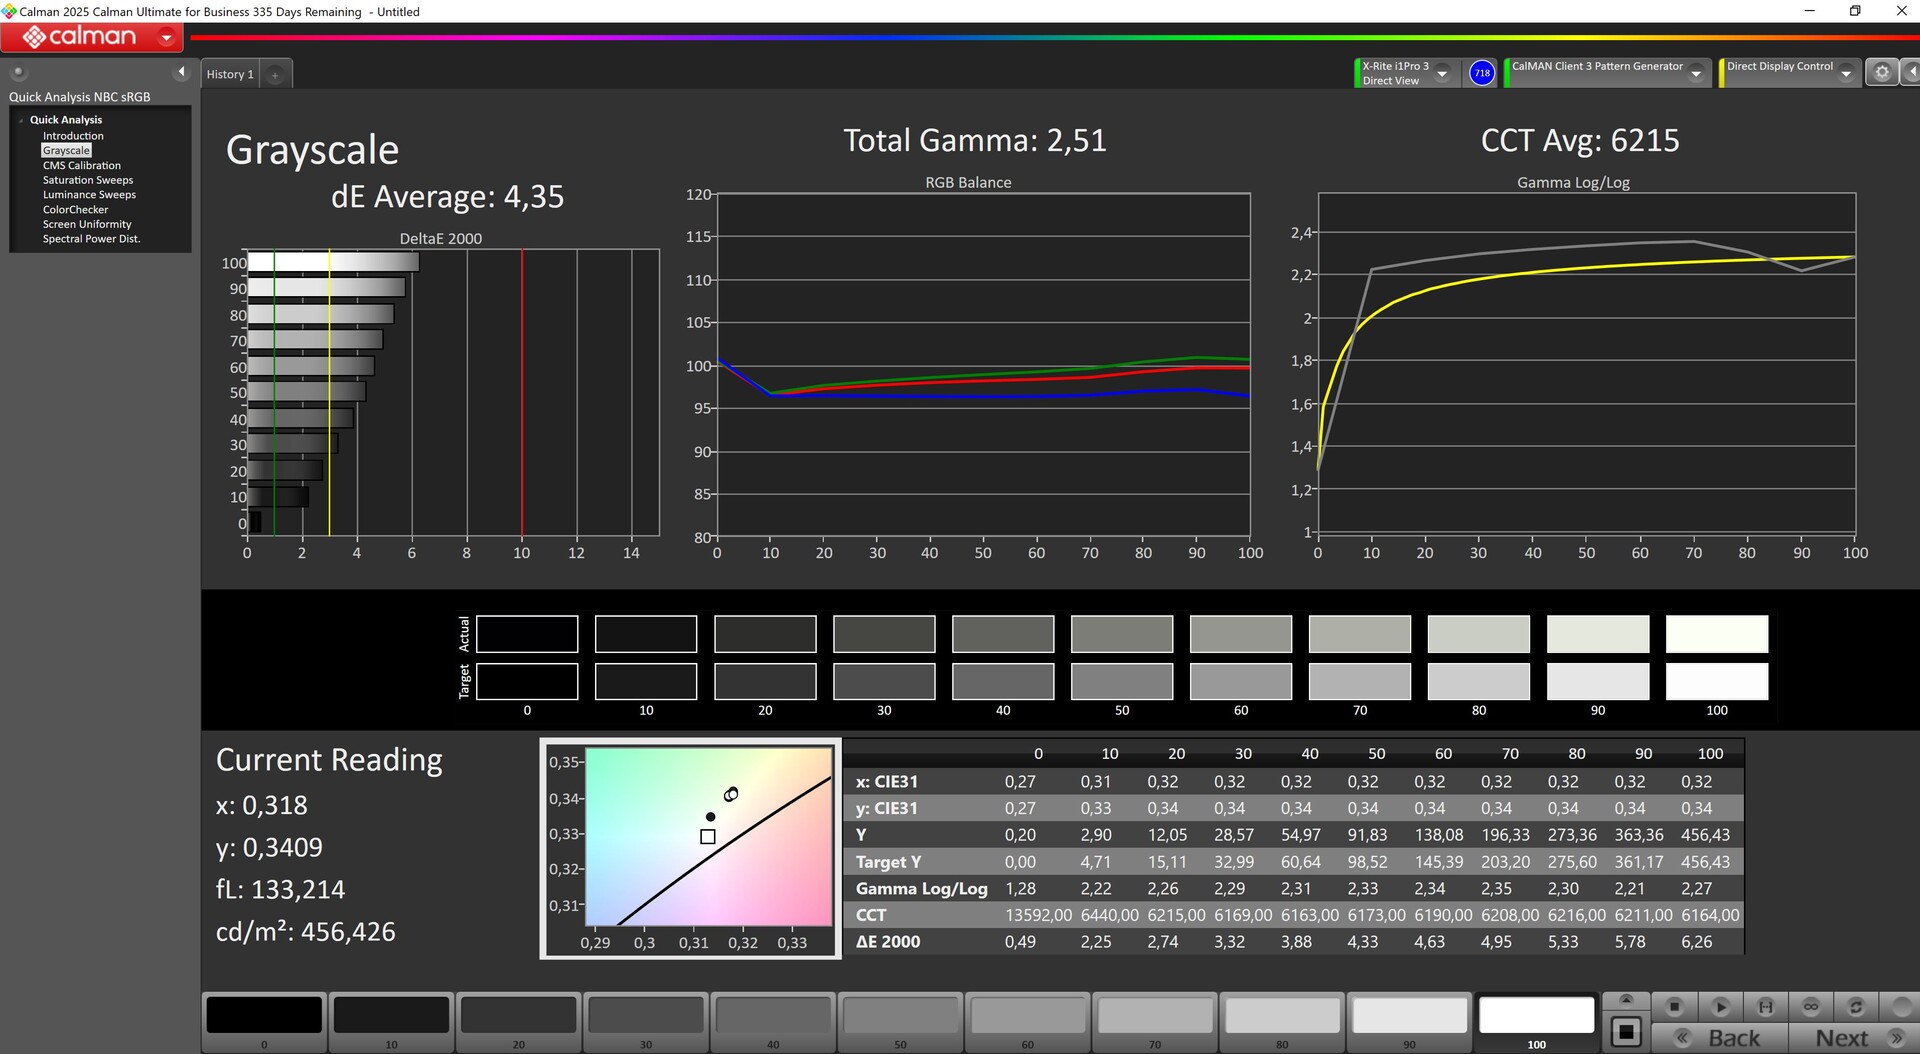
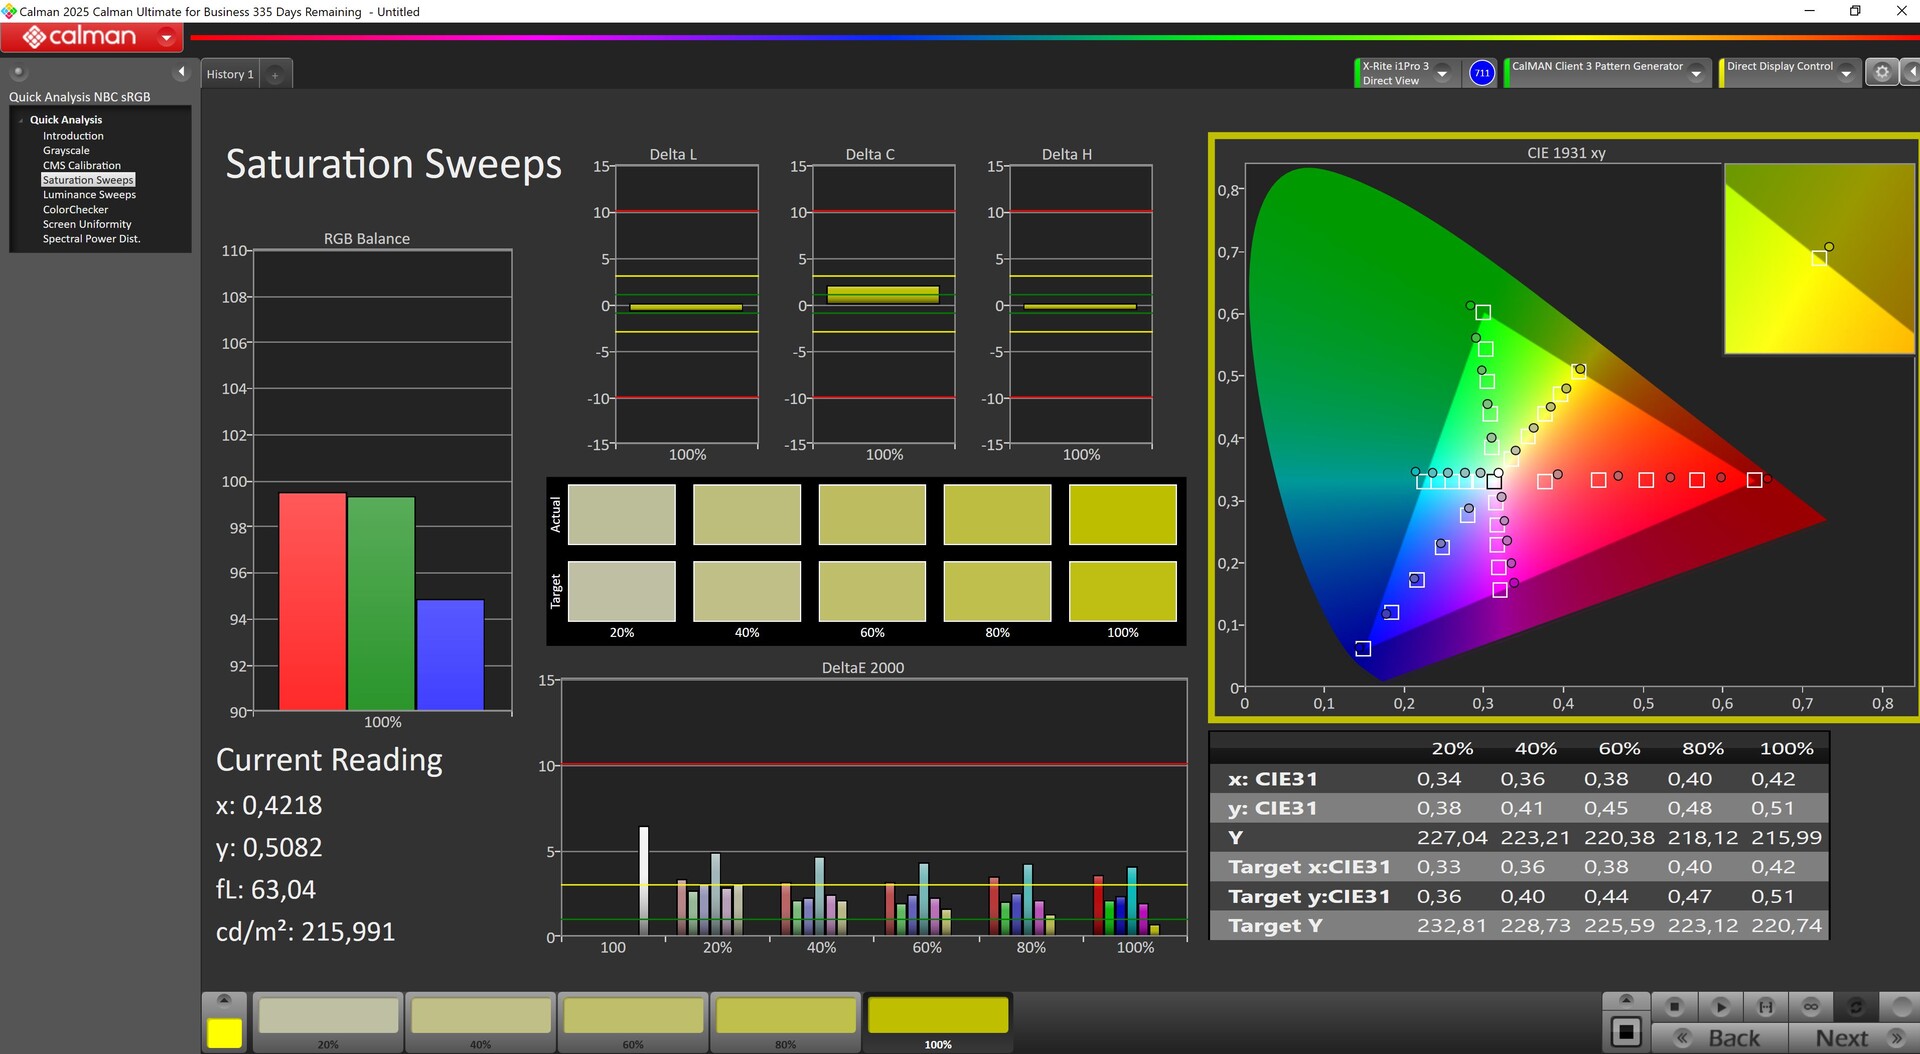
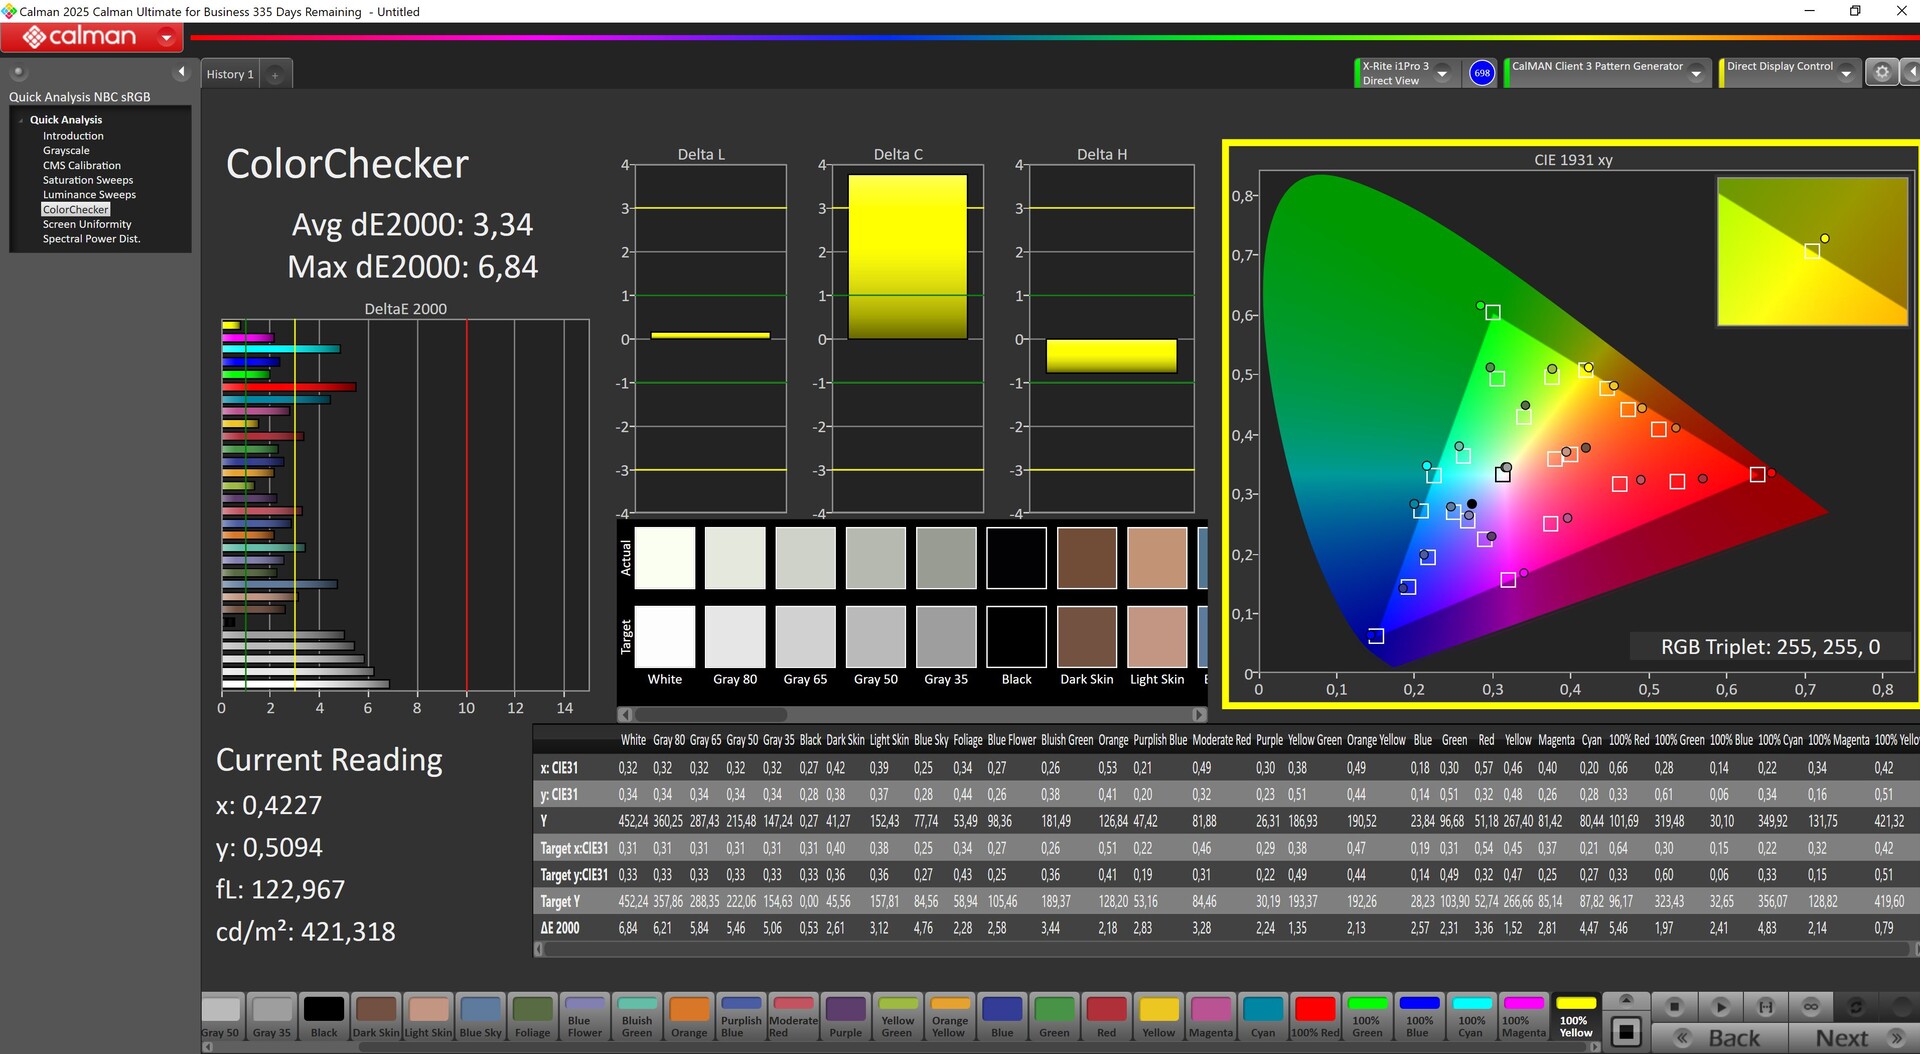
ΔE Color 3.3 | 0.5-29.43 Ø4.87, calibrated: 1.7
ΔE Greyscale 4.35 | 0.5-98 Ø5.1
75.9% AdobeRGB 1998 (Argyll 2.2.0 3D)
99.1% sRGB (Argyll 2.2.0 3D)
74.3% Display P3 (Argyll 2.2.0 3D)
Gamma: 2.51
| Dell Pro 13 Premium PA13250 B133UAN (AUOBEB0), IPS, 1920x1200, 13.3", 60 Hz | MSI Prestige 13 AI Plus Evo A2VMG ATNA33AA07-0, OLED, 2880x1800, 13.3", 60 Hz | Lenovo ThinkPad X13 2-in-1 Gen 5 Lenovo B133UAN01.2, IPS, 1920x1200, 13.3", 60 Hz | Framework Laptop 13.5 Core Ultra 7 155H BOE NE135A1M-NY1, IPS, 2880x1920, 13.5", 120 Hz | Dell XPS 13 9350 LG Philips 134WU2, IPS, 1920x1200, 13.4", 120 Hz | Microsoft Surface Pro Copilot+ LP129WT342166, IPS, 2880x1920, 13", 120 Hz | |
|---|---|---|---|---|---|---|
| Display | 20% | -4% | -2% | -6% | 6% | |
| Display P3 Coverage | 74.3 | 99.9 34% | 71.1 -4% | 72.8 -2% | 67.3 -9% | 83.4 12% |
| sRGB Coverage | 99.1 | 100 1% | 97.1 -2% | 98.6 -1% | 99 0% | 99.7 1% |
| AdobeRGB 1998 Coverage | 75.9 | 95.8 26% | 71.7 -6% | 72.9 -4% | 68.6 -10% | 79.4 5% |
| Response Times | 94% | -9% | 16% | 16% | 29% | |
| Response Time Grey 50% / Grey 80% * | 52.8 ? | 1.94 ? 96% | 50.2 ? 5% | 41.9 ? 21% | 37.3 ? 29% | 39.6 ? 25% |
| Response Time Black / White * | 26.4 ? | 2.02 ? 92% | 32.6 ? -23% | 23.7 ? 10% | 25.9 ? 2% | 18 ? 32% |
| PWM Frequency | 60 ? | |||||
| Screen | 17% | -9% | -11% | 31% | 4% | |
| Brightness middle | 456 | 382.4 -16% | 334 -27% | 498.5 9% | 462.8 1% | 585 28% |
| Brightness | 460 | 383 -17% | 308 -33% | 464 1% | 435 -5% | 574 25% |
| Brightness Distribution | 89 | 99 11% | 86 -3% | 86 -3% | 87 -2% | 89 0% |
| Black Level * | 0.23 | 0.37 -61% | 0.36 -57% | 0.19 17% | 0.56 -143% | |
| Contrast | 1983 | 903 -54% | 1385 -30% | 2436 23% | 1045 -47% | |
| Colorchecker dE 2000 * | 3.3 | 3.84 -16% | 2.36 28% | 4.27 -29% | 1.92 42% | 1.3 61% |
| Colorchecker dE 2000 max. * | 6.47 | 6.66 -3% | 4.93 24% | 7.08 -9% | 3.45 47% | 3 54% |
| Colorchecker dE 2000 calibrated * | 1.7 | 0.41 76% | 1.25 26% | 1.26 26% | 0.48 72% | |
| Greyscale dE 2000 * | 4.35 | 0.7 84% | 3.38 22% | 4.7 -8% | 0.6 86% | 2 54% |
| Gamma | 2.51 88% | 2.23 99% | 2.38 92% | 2.09 105% | 2.19 100% | 2.18 101% |
| CCT | 6215 105% | 6475 100% | 6352 102% | 7417 88% | 6539 99% | 6914 94% |
| Totalt genomsnitt (program/inställningar) | 44% /
31% | -7% /
-8% | 1% /
-5% | 14% /
21% | 13% /
8% |
* ... mindre är bättre
Panelen är inte särskilt välkalibrerad när den levereras, och även om vår manuella kalibrering lyckades förbättra DeltaE-värdena för både gråskalan och ColorChecker, fanns det fortfarande en avvikelse i det röda området.
Visa svarstider
| ↔ Svarstid svart till vitt | ||
|---|---|---|
| 26.4 ms ... stiga ↗ och falla ↘ kombinerat | ↗ 12.2 ms stiga | 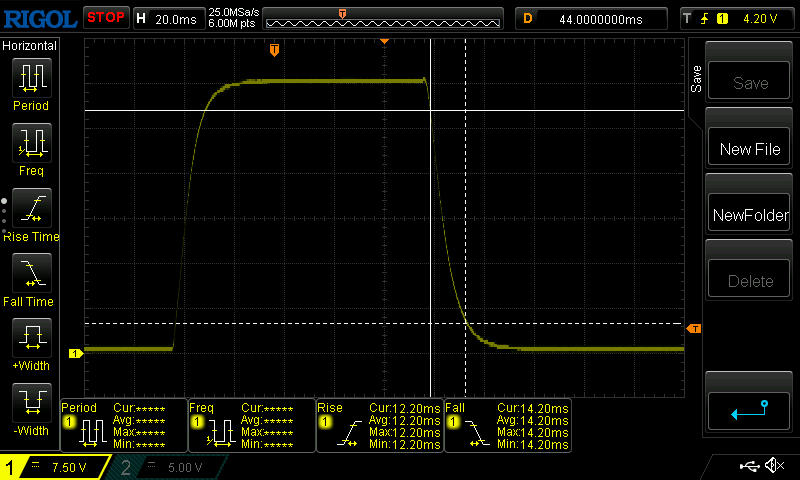 |
| ↘ 14.2 ms hösten | ||
| Skärmen visar relativt långsamma svarsfrekvenser i våra tester och kan vara för långsam för spelare. I jämförelse sträcker sig alla testade enheter från 0.1 (minst) till 240 (maximalt) ms. » 63 % av alla enheter är bättre. Detta innebär att den uppmätta svarstiden är sämre än genomsnittet av alla testade enheter (20.8 ms). | ||
| ↔ Svarstid 50 % grått till 80 % grått | ||
| 52.8 ms ... stiga ↗ och falla ↘ kombinerat | ↗ 23.4 ms stiga | 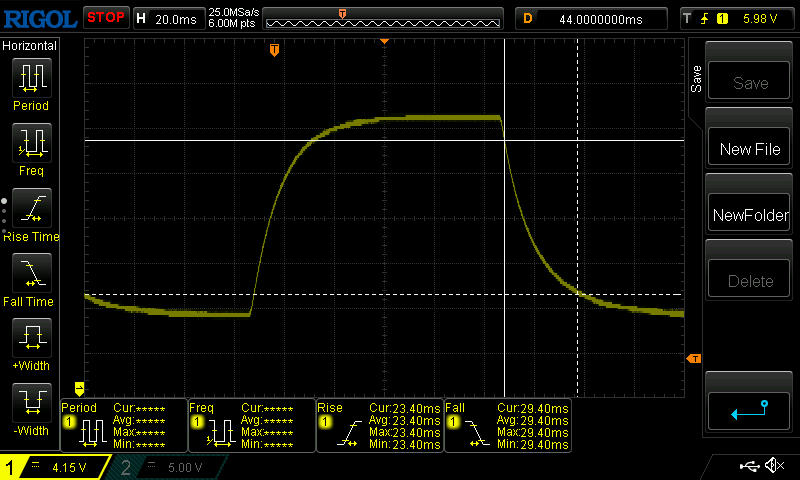 |
| ↘ 29.4 ms hösten | ||
| Skärmen visar långsamma svarsfrekvenser i våra tester och kommer att vara otillfredsställande för spelare. I jämförelse sträcker sig alla testade enheter från 0.165 (minst) till 636 (maximalt) ms. » 89 % av alla enheter är bättre. Detta innebär att den uppmätta svarstiden är sämre än genomsnittet av alla testade enheter (32.5 ms). | ||
Skärmflimmer / PWM (Puls-Width Modulation)
| Skärmflimmer / PWM upptäcktes inte |  | ||
Som jämförelse: 53 % av alla testade enheter använder inte PWM för att dämpa skärmen. Om PWM upptäcktes mättes ett medelvärde av 8516 (minst: 5 - maximum: 343500) Hz. | |||

Utomhus bidrar den goda ljusstyrkan och kontrasten, den matta ytan samt den goda stabiliteten i betraktningsvinkeln till att säkerställa en i stort sett problemfri drift.

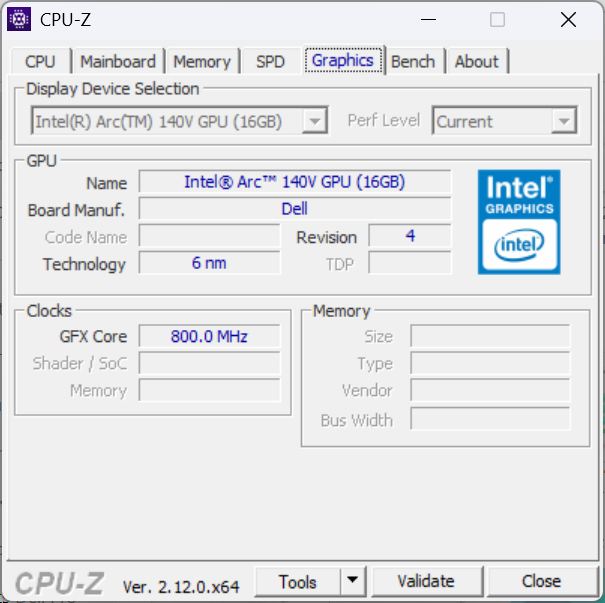
Prestanda - En kraftfull ljusbåge 140V
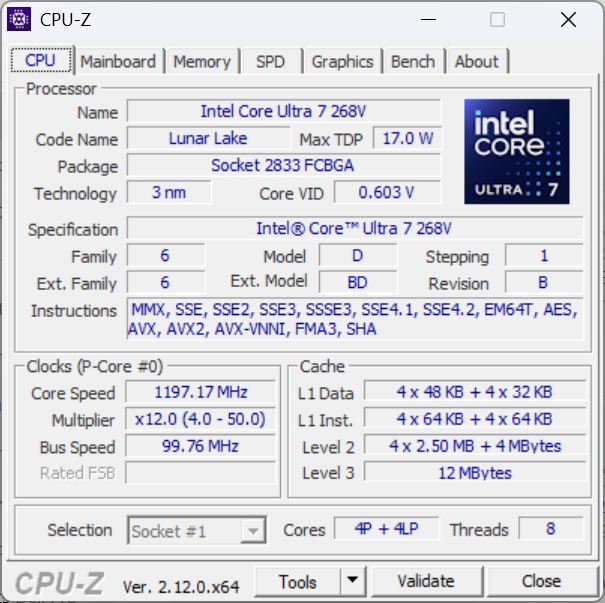
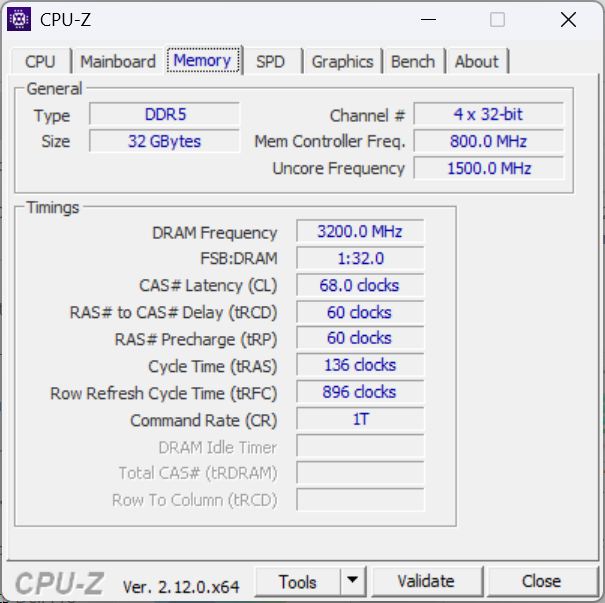
Det bultande hjärtat är den nya Intel Core Ultra 7 268V processor som också levereras med 32 GB inbyggt RAM-minne. Alternativt finns det en version med en svagare Core Ultra 5 236V och 16 GB RAM. Lagring finns också i olika konfigurationer (256 GB, 512 GB, 1 TB). Dell Pro 13 Premium är tydligt inriktad på mobila affärsanvändare.
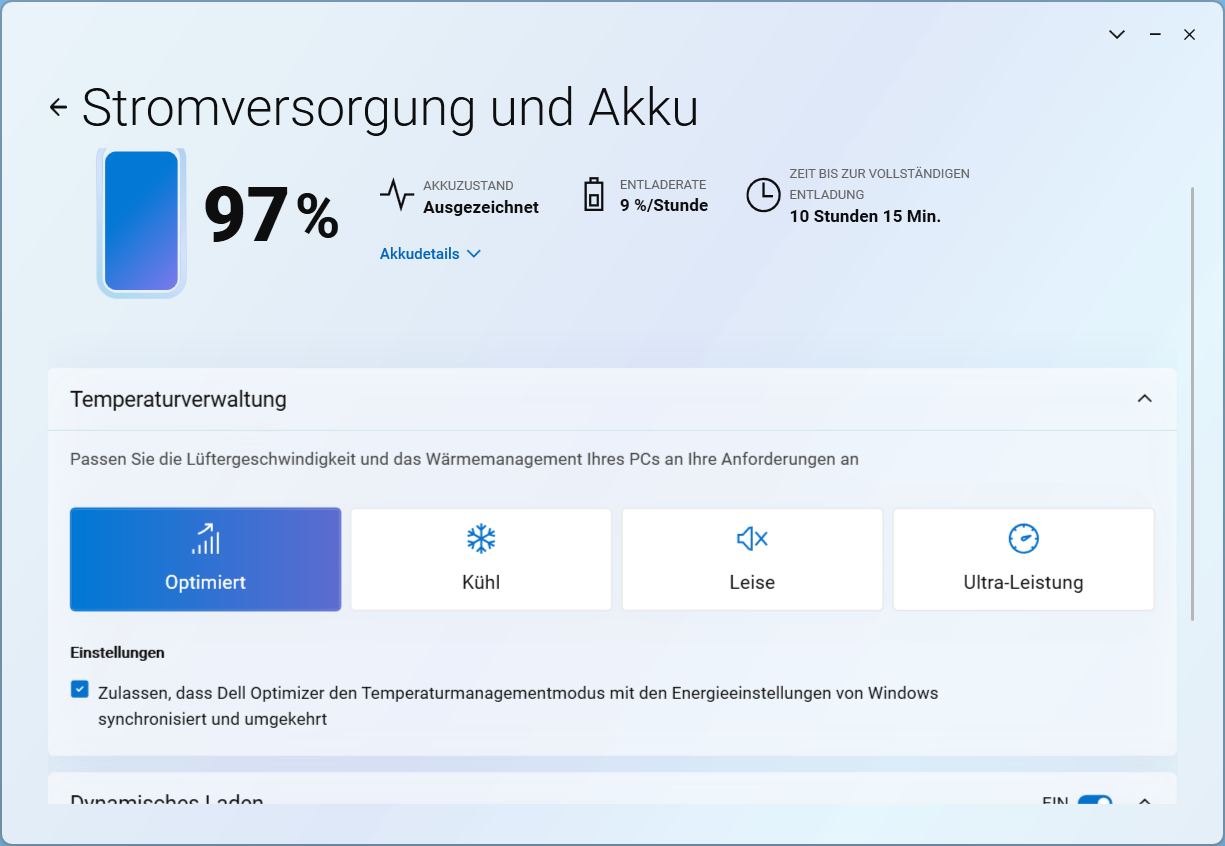
Testförhållanden
Dell Optimizer fungerar som kontrollcenter och erbjuder fläktinställningar som påverkar prestandan och några andra alternativ. För våra benchmarks lämnade vi den med det förvalda läget "Optimized".
Processor
Intel Core Intel Core Ultra 7 268V är en av de mer avancerade modellerna i den energieffektiva Lunar Lake-familjen. Dess fyra E- och fyra P-kärnor klockar från 2,2 GHz till 5,0 GHz och har även en 48 TOPS NPU.
Dess enkelkärniga prestanda var särskilt imponerande i alla tester vi körde. I flerkärniga benchmarks är processorn i Dell Pro 13 något av en besvikelse, och ligger ofta något efter konkurrenterna, vissa med nominellt svagare processorer. I batteriläge går cirka 16 procent av prestandan förlorad.
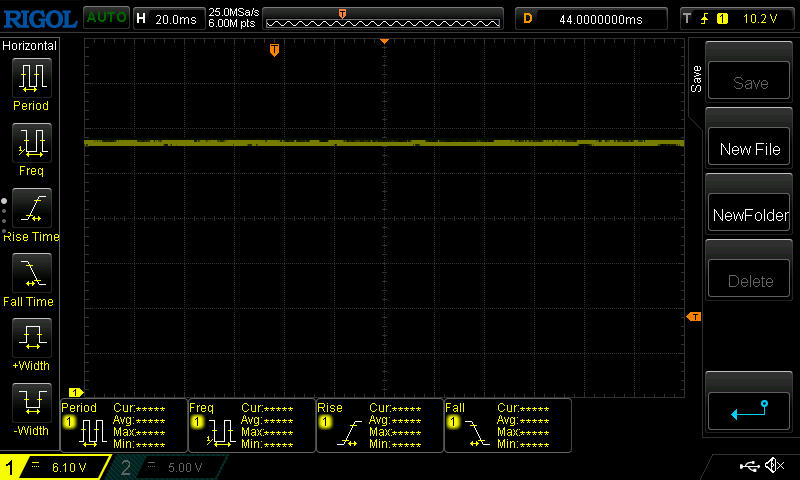
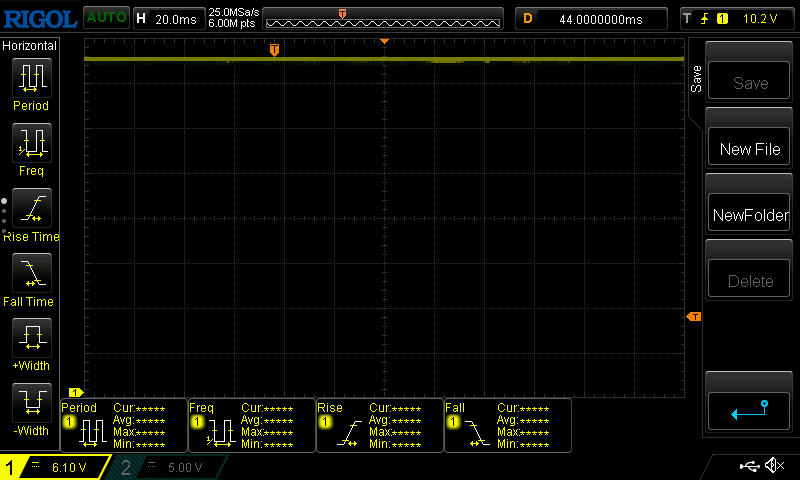
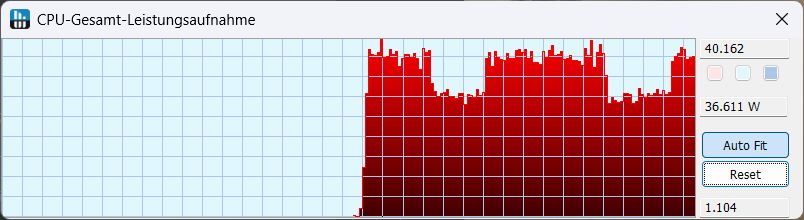
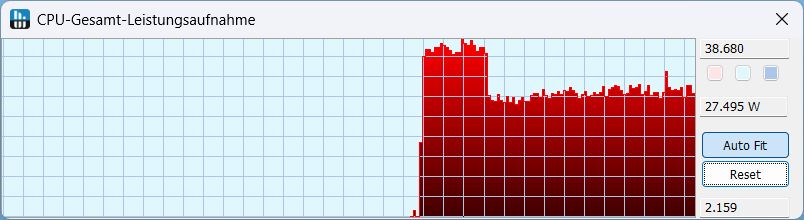
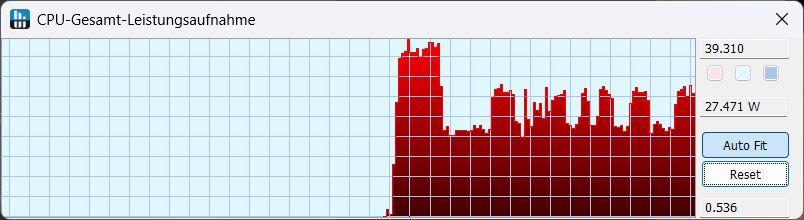
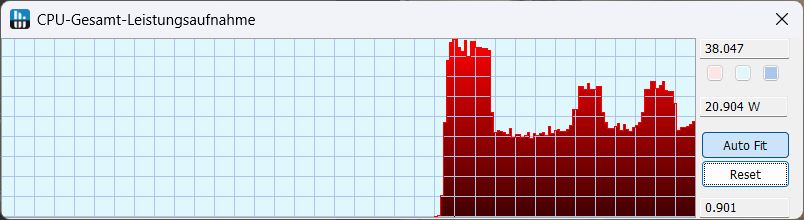
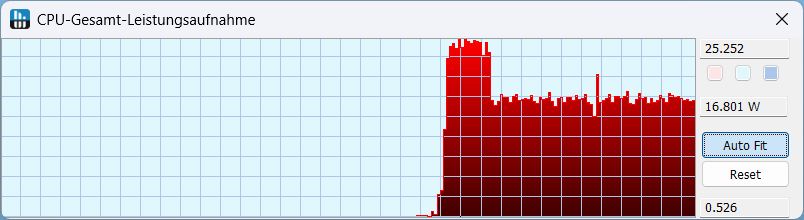
I Cinebench R15-loopen sjönk prestandan med cirka 28 procent (!) under de tre första körningarna och förblev därefter konstant. I standardläget Optimized var strömförbrukningen inledningsvis cirka 38 W och sjönk sedan till 27 W. Bilderna till höger visar strömförbrukningen i Cinebench R23, beroende på fläktläge.
Cinebench R15 Multi Continuous Test
Cinebench R23: Multi Core | Single Core
Cinebench R20: CPU (Multi Core) | CPU (Single Core)
Cinebench R15: CPU Multi 64Bit | CPU Single 64Bit
Blender: v2.79 BMW27 CPU
7-Zip 18.03: 7z b 4 | 7z b 4 -mmt1
Geekbench 6.4: Multi-Core | Single-Core
Geekbench 5.5: Multi-Core | Single-Core
HWBOT x265 Benchmark v2.2: 4k Preset
LibreOffice : 20 Documents To PDF
R Benchmark 2.5: Overall mean
| CPU Performance Rating | |
| Framework Laptop 13.5 Core Ultra 7 155H | |
| MSI Prestige 13 AI Plus Evo A2VMG | |
| Dell XPS 13 9350 | |
| Genomsnitt Intel Core Ultra 7 268V | |
| Genomsnitt av klass Subnotebook | |
| Dell Pro 13 Premium PA13250 | |
| Lenovo ThinkPad X13 2-in-1 Gen 5 | |
| Microsoft Surface Pro Copilot+ -2! | |
| Cinebench R23 / Multi Core | |
| Framework Laptop 13.5 Core Ultra 7 155H | |
| Genomsnitt av klass Subnotebook (1555 - 21812, n=76, senaste 2 åren) | |
| MSI Prestige 13 AI Plus Evo A2VMG | |
| Dell XPS 13 9350 | |
| Genomsnitt Intel Core Ultra 7 268V (9835 - 10535, n=2) | |
| Dell Pro 13 Premium PA13250 | |
| Microsoft Surface Pro Copilot+ | |
| Lenovo ThinkPad X13 2-in-1 Gen 5 | |
| Cinebench R23 / Single Core | |
| Dell Pro 13 Premium PA13250 | |
| Genomsnitt Intel Core Ultra 7 268V (1910 - 1985, n=2) | |
| Dell XPS 13 9350 | |
| MSI Prestige 13 AI Plus Evo A2VMG | |
| Framework Laptop 13.5 Core Ultra 7 155H | |
| Genomsnitt av klass Subnotebook (358 - 2165, n=76, senaste 2 åren) | |
| Lenovo ThinkPad X13 2-in-1 Gen 5 | |
| Microsoft Surface Pro Copilot+ | |
| Cinebench R20 / CPU (Multi Core) | |
| Framework Laptop 13.5 Core Ultra 7 155H | |
| Genomsnitt av klass Subnotebook (579 - 8541, n=71, senaste 2 åren) | |
| MSI Prestige 13 AI Plus Evo A2VMG | |
| Dell XPS 13 9350 | |
| Genomsnitt Intel Core Ultra 7 268V (3811 - 4129, n=2) | |
| Dell Pro 13 Premium PA13250 | |
| Lenovo ThinkPad X13 2-in-1 Gen 5 | |
| Microsoft Surface Pro Copilot+ | |
| Cinebench R20 / CPU (Single Core) | |
| Dell Pro 13 Premium PA13250 | |
| Genomsnitt Intel Core Ultra 7 268V (736 - 764, n=2) | |
| Dell XPS 13 9350 | |
| MSI Prestige 13 AI Plus Evo A2VMG | |
| Framework Laptop 13.5 Core Ultra 7 155H | |
| Genomsnitt av klass Subnotebook (128 - 826, n=71, senaste 2 åren) | |
| Lenovo ThinkPad X13 2-in-1 Gen 5 | |
| Microsoft Surface Pro Copilot+ | |
| Cinebench R15 / CPU Multi 64Bit | |
| Framework Laptop 13.5 Core Ultra 7 155H | |
| Microsoft Surface Pro Copilot+ | |
| Genomsnitt av klass Subnotebook (327 - 3345, n=77, senaste 2 åren) | |
| MSI Prestige 13 AI Plus Evo A2VMG | |
| Genomsnitt Intel Core Ultra 7 268V (1601 - 1616, n=2) | |
| Dell Pro 13 Premium PA13250 | |
| Dell XPS 13 9350 | |
| Lenovo ThinkPad X13 2-in-1 Gen 5 | |
| Cinebench R15 / CPU Single 64Bit | |
| Dell Pro 13 Premium PA13250 | |
| Genomsnitt Intel Core Ultra 7 268V (287 - 302, n=2) | |
| Dell XPS 13 9350 | |
| MSI Prestige 13 AI Plus Evo A2VMG | |
| Framework Laptop 13.5 Core Ultra 7 155H | |
| Genomsnitt av klass Subnotebook (72.4 - 322, n=72, senaste 2 åren) | |
| Lenovo ThinkPad X13 2-in-1 Gen 5 | |
| Microsoft Surface Pro Copilot+ | |
| Blender / v2.79 BMW27 CPU | |
| Dell Pro 13 Premium PA13250 | |
| Microsoft Surface Pro Copilot+ | |
| Lenovo ThinkPad X13 2-in-1 Gen 5 | |
| Genomsnitt av klass Subnotebook (159 - 2271, n=75, senaste 2 åren) | |
| Genomsnitt Intel Core Ultra 7 268V (337 - 410, n=2) | |
| Dell XPS 13 9350 | |
| MSI Prestige 13 AI Plus Evo A2VMG | |
| Framework Laptop 13.5 Core Ultra 7 155H | |
| 7-Zip 18.03 / 7z b 4 | |
| Framework Laptop 13.5 Core Ultra 7 155H | |
| Genomsnitt av klass Subnotebook (11668 - 77867, n=67, senaste 2 åren) | |
| Microsoft Surface Pro Copilot+ | |
| Dell XPS 13 9350 | |
| MSI Prestige 13 AI Plus Evo A2VMG | |
| Genomsnitt Intel Core Ultra 7 268V (32797 - 35687, n=2) | |
| Dell Pro 13 Premium PA13250 | |
| Lenovo ThinkPad X13 2-in-1 Gen 5 | |
| 7-Zip 18.03 / 7z b 4 -mmt1 | |
| Genomsnitt Intel Core Ultra 7 268V (5884 - 6021, n=2) | |
| Dell Pro 13 Premium PA13250 | |
| Dell XPS 13 9350 | |
| MSI Prestige 13 AI Plus Evo A2VMG | |
| Genomsnitt av klass Subnotebook (2643 - 6442, n=69, senaste 2 åren) | |
| Framework Laptop 13.5 Core Ultra 7 155H | |
| Microsoft Surface Pro Copilot+ | |
| Lenovo ThinkPad X13 2-in-1 Gen 5 | |
| Geekbench 6.4 / Multi-Core | |
| Microsoft Surface Pro Copilot+ | |
| Framework Laptop 13.5 Core Ultra 7 155H | |
| Genomsnitt av klass Subnotebook (2244 - 17489, n=72, senaste 2 åren) | |
| MSI Prestige 13 AI Plus Evo A2VMG | |
| Dell XPS 13 9350 | |
| Genomsnitt Intel Core Ultra 7 268V (10589 - 11279, n=3) | |
| Dell Pro 13 Premium PA13250 | |
| Lenovo ThinkPad X13 2-in-1 Gen 5 | |
| Geekbench 6.4 / Single-Core | |
| Dell Pro 13 Premium PA13250 | |
| Dell XPS 13 9350 | |
| Genomsnitt Intel Core Ultra 7 268V (2583 - 2871, n=3) | |
| MSI Prestige 13 AI Plus Evo A2VMG | |
| Genomsnitt av klass Subnotebook (960 - 3655, n=67, senaste 2 åren) | |
| Microsoft Surface Pro Copilot+ | |
| Framework Laptop 13.5 Core Ultra 7 155H | |
| Lenovo ThinkPad X13 2-in-1 Gen 5 | |
| Lenovo ThinkPad X13 2-in-1 Gen 5 | |
| Geekbench 5.5 / Multi-Core | |
| Framework Laptop 13.5 Core Ultra 7 155H | |
| Genomsnitt av klass Subnotebook (2557 - 17218, n=68, senaste 2 åren) | |
| Genomsnitt Intel Core Ultra 7 268V (9491 - 9801, n=3) | |
| MSI Prestige 13 AI Plus Evo A2VMG | |
| Dell Pro 13 Premium PA13250 | |
| Dell XPS 13 9350 | |
| Lenovo ThinkPad X13 2-in-1 Gen 5 | |
| Geekbench 5.5 / Single-Core | |
| Genomsnitt Intel Core Ultra 7 268V (2008 - 2091, n=3) | |
| Dell XPS 13 9350 | |
| Dell Pro 13 Premium PA13250 | |
| MSI Prestige 13 AI Plus Evo A2VMG | |
| Genomsnitt av klass Subnotebook (726 - 2350, n=68, senaste 2 åren) | |
| Framework Laptop 13.5 Core Ultra 7 155H | |
| Lenovo ThinkPad X13 2-in-1 Gen 5 | |
| HWBOT x265 Benchmark v2.2 / 4k Preset | |
| MSI Prestige 13 AI Plus Evo A2VMG | |
| Framework Laptop 13.5 Core Ultra 7 155H | |
| Dell XPS 13 9350 | |
| Genomsnitt av klass Subnotebook (0.97 - 25.1, n=70, senaste 2 åren) | |
| Genomsnitt Intel Core Ultra 7 268V (10.4 - 12.9, n=2) | |
| Dell Pro 13 Premium PA13250 | |
| Lenovo ThinkPad X13 2-in-1 Gen 5 | |
| Microsoft Surface Pro Copilot+ | |
| LibreOffice / 20 Documents To PDF | |
| Dell Pro 13 Premium PA13250 | |
| Microsoft Surface Pro Copilot+ | |
| Lenovo ThinkPad X13 2-in-1 Gen 5 | |
| Genomsnitt av klass Subnotebook (38.5 - 220, n=68, senaste 2 åren) | |
| Genomsnitt Intel Core Ultra 7 268V (48 - 60.8, n=2) | |
| Dell XPS 13 9350 | |
| MSI Prestige 13 AI Plus Evo A2VMG | |
| Framework Laptop 13.5 Core Ultra 7 155H | |
| R Benchmark 2.5 / Overall mean | |
| Microsoft Surface Pro Copilot+ | |
| Lenovo ThinkPad X13 2-in-1 Gen 5 | |
| Genomsnitt av klass Subnotebook (0.403 - 1.456, n=70, senaste 2 åren) | |
| Framework Laptop 13.5 Core Ultra 7 155H | |
| MSI Prestige 13 AI Plus Evo A2VMG | |
| Dell XPS 13 9350 | |
| Genomsnitt Intel Core Ultra 7 268V (0.4344 - 0.4565, n=2) | |
| Dell Pro 13 Premium PA13250 | |
* ... mindre är bättre
AIDA64: FP32 Ray-Trace | FPU Julia | CPU SHA3 | CPU Queen | FPU SinJulia | FPU Mandel | CPU AES | CPU ZLib | FP64 Ray-Trace | CPU PhotoWorxx
| Performance Rating | |
| Framework Laptop 13.5 Core Ultra 7 155H | |
| Genomsnitt av klass Subnotebook | |
| MSI Prestige 13 AI Plus Evo A2VMG | |
| Dell XPS 13 9350 | |
| Genomsnitt Intel Core Ultra 7 268V | |
| Dell Pro 13 Premium PA13250 | |
| Lenovo ThinkPad X13 2-in-1 Gen 5 | |
| Microsoft Surface Pro Copilot+ | |
| AIDA64 / FP32 Ray-Trace | |
| Genomsnitt av klass Subnotebook (1135 - 32888, n=70, senaste 2 åren) | |
| MSI Prestige 13 AI Plus Evo A2VMG | |
| Dell XPS 13 9350 | |
| Framework Laptop 13.5 Core Ultra 7 155H | |
| Genomsnitt Intel Core Ultra 7 268V (10556 - 11547, n=2) | |
| Dell Pro 13 Premium PA13250 | |
| Microsoft Surface Pro Copilot+ | |
| Lenovo ThinkPad X13 2-in-1 Gen 5 | |
| AIDA64 / FPU Julia | |
| MSI Prestige 13 AI Plus Evo A2VMG | |
| Dell XPS 13 9350 | |
| Framework Laptop 13.5 Core Ultra 7 155H | |
| Genomsnitt av klass Subnotebook (5218 - 123315, n=70, senaste 2 åren) | |
| Genomsnitt Intel Core Ultra 7 268V (47659 - 56299, n=2) | |
| Dell Pro 13 Premium PA13250 | |
| Lenovo ThinkPad X13 2-in-1 Gen 5 | |
| Microsoft Surface Pro Copilot+ | |
| AIDA64 / CPU SHA3 | |
| Genomsnitt av klass Subnotebook (444 - 5287, n=70, senaste 2 åren) | |
| MSI Prestige 13 AI Plus Evo A2VMG | |
| Framework Laptop 13.5 Core Ultra 7 155H | |
| Dell XPS 13 9350 | |
| Genomsnitt Intel Core Ultra 7 268V (2117 - 2538, n=2) | |
| Dell Pro 13 Premium PA13250 | |
| Lenovo ThinkPad X13 2-in-1 Gen 5 | |
| Microsoft Surface Pro Copilot+ | |
| AIDA64 / CPU Queen | |
| Framework Laptop 13.5 Core Ultra 7 155H | |
| Genomsnitt av klass Subnotebook (10579 - 115682, n=70, senaste 2 åren) | |
| Microsoft Surface Pro Copilot+ | |
| MSI Prestige 13 AI Plus Evo A2VMG | |
| Dell Pro 13 Premium PA13250 | |
| Genomsnitt Intel Core Ultra 7 268V (49645 - 49759, n=2) | |
| Dell XPS 13 9350 | |
| Lenovo ThinkPad X13 2-in-1 Gen 5 | |
| AIDA64 / FPU SinJulia | |
| Framework Laptop 13.5 Core Ultra 7 155H | |
| Genomsnitt av klass Subnotebook (744 - 18418, n=70, senaste 2 åren) | |
| Lenovo ThinkPad X13 2-in-1 Gen 5 | |
| Dell XPS 13 9350 | |
| MSI Prestige 13 AI Plus Evo A2VMG | |
| Genomsnitt Intel Core Ultra 7 268V (4353 - 4426, n=2) | |
| Dell Pro 13 Premium PA13250 | |
| Microsoft Surface Pro Copilot+ | |
| AIDA64 / FPU Mandel | |
| MSI Prestige 13 AI Plus Evo A2VMG | |
| Dell XPS 13 9350 | |
| Genomsnitt av klass Subnotebook (3341 - 65433, n=70, senaste 2 åren) | |
| Framework Laptop 13.5 Core Ultra 7 155H | |
| Genomsnitt Intel Core Ultra 7 268V (25929 - 29637, n=2) | |
| Dell Pro 13 Premium PA13250 | |
| Lenovo ThinkPad X13 2-in-1 Gen 5 | |
| Microsoft Surface Pro Copilot+ | |
| AIDA64 / CPU AES | |
| Framework Laptop 13.5 Core Ultra 7 155H | |
| Microsoft Surface Pro Copilot+ | |
| Genomsnitt av klass Subnotebook (638 - 161430, n=70, senaste 2 åren) | |
| Dell XPS 13 9350 | |
| MSI Prestige 13 AI Plus Evo A2VMG | |
| Lenovo ThinkPad X13 2-in-1 Gen 5 | |
| Genomsnitt Intel Core Ultra 7 268V (33196 - 38706, n=2) | |
| Dell Pro 13 Premium PA13250 | |
| AIDA64 / CPU ZLib | |
| Framework Laptop 13.5 Core Ultra 7 155H | |
| Genomsnitt av klass Subnotebook (164.9 - 1379, n=70, senaste 2 åren) | |
| Microsoft Surface Pro Copilot+ | |
| MSI Prestige 13 AI Plus Evo A2VMG | |
| Dell XPS 13 9350 | |
| Lenovo ThinkPad X13 2-in-1 Gen 5 | |
| Genomsnitt Intel Core Ultra 7 268V (441 - 583, n=2) | |
| Dell Pro 13 Premium PA13250 | |
| AIDA64 / FP64 Ray-Trace | |
| MSI Prestige 13 AI Plus Evo A2VMG | |
| Genomsnitt av klass Subnotebook (610 - 17495, n=70, senaste 2 åren) | |
| Dell XPS 13 9350 | |
| Genomsnitt Intel Core Ultra 7 268V (5938 - 6214, n=2) | |
| Framework Laptop 13.5 Core Ultra 7 155H | |
| Dell Pro 13 Premium PA13250 | |
| Lenovo ThinkPad X13 2-in-1 Gen 5 | |
| Microsoft Surface Pro Copilot+ | |
| AIDA64 / CPU PhotoWorxx | |
| MSI Prestige 13 AI Plus Evo A2VMG | |
| Dell XPS 13 9350 | |
| Genomsnitt Intel Core Ultra 7 268V (46733 - 53540, n=2) | |
| Dell Pro 13 Premium PA13250 | |
| Framework Laptop 13.5 Core Ultra 7 155H | |
| Genomsnitt av klass Subnotebook (6569 - 64588, n=70, senaste 2 åren) | |
| Lenovo ThinkPad X13 2-in-1 Gen 5 | |
| Microsoft Surface Pro Copilot+ | |
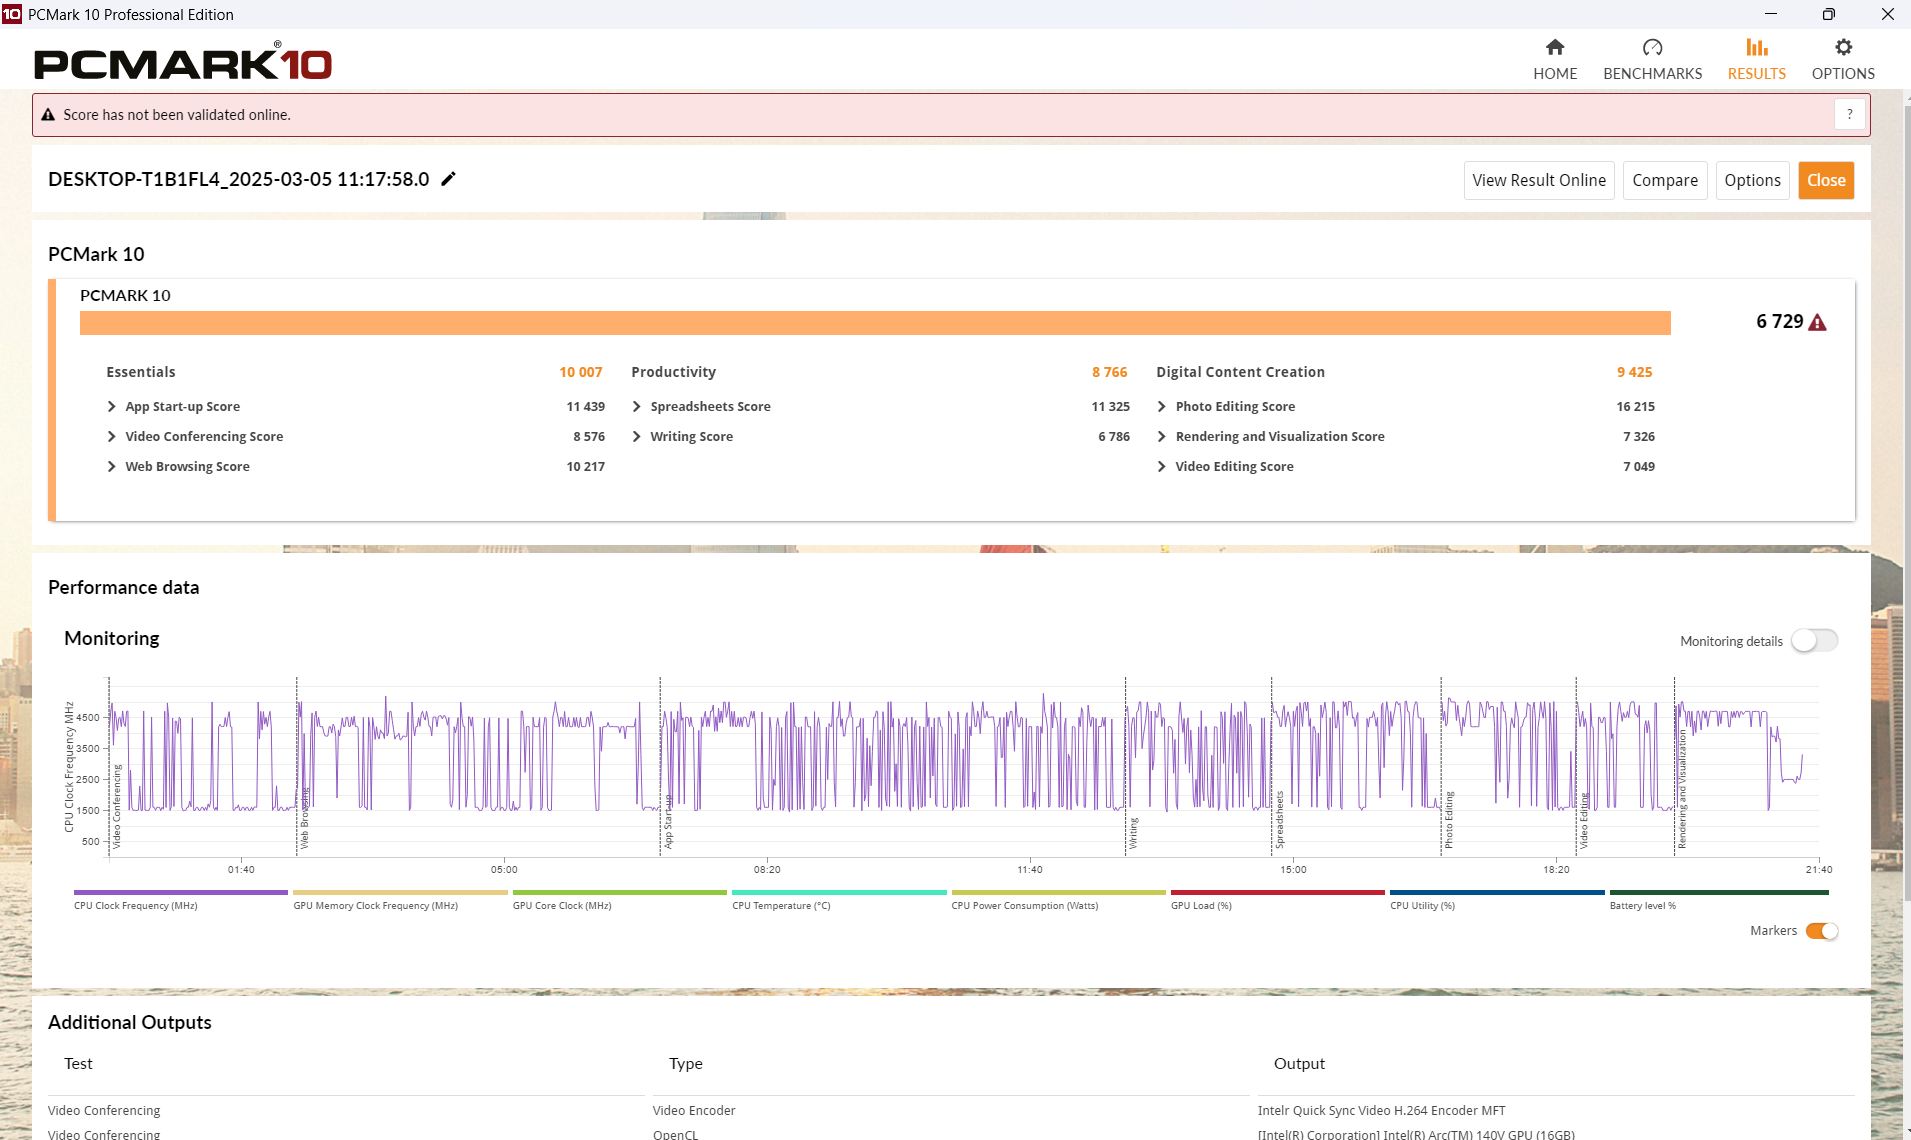
Systemets prestanda
I PCMark 10 och CrossMark ligger de jämförda enheterna nära varandra, men både i detta område och i webbtesterna ligger vår Dell Pro mer i mitten än i toppskiktet.
CrossMark: Overall | Productivity | Creativity | Responsiveness
WebXPRT 3: Overall
WebXPRT 4: Overall
Mozilla Kraken 1.1: Total
| PCMark 10 / Score | |
| Genomsnitt Intel Core Ultra 7 268V, Intel Arc Graphics 140V (6729 - 7236, n=2) | |
| Dell XPS 13 9350 | |
| Framework Laptop 13.5 Core Ultra 7 155H | |
| MSI Prestige 13 AI Plus Evo A2VMG | |
| Dell Pro 13 Premium PA13250 | |
| Genomsnitt av klass Subnotebook (4993 - 7788, n=59, senaste 2 åren) | |
| Lenovo ThinkPad X13 2-in-1 Gen 5 | |
| PCMark 10 / Essentials | |
| Lenovo ThinkPad X13 2-in-1 Gen 5 | |
| Framework Laptop 13.5 Core Ultra 7 155H | |
| Genomsnitt av klass Subnotebook (9363 - 11331, n=59, senaste 2 åren) | |
| Genomsnitt Intel Core Ultra 7 268V, Intel Arc Graphics 140V (10007 - 10701, n=2) | |
| MSI Prestige 13 AI Plus Evo A2VMG | |
| Dell Pro 13 Premium PA13250 | |
| Dell XPS 13 9350 | |
| PCMark 10 / Productivity | |
| Dell XPS 13 9350 | |
| Genomsnitt Intel Core Ultra 7 268V, Intel Arc Graphics 140V (8766 - 9217, n=2) | |
| Dell Pro 13 Premium PA13250 | |
| Framework Laptop 13.5 Core Ultra 7 155H | |
| Genomsnitt av klass Subnotebook (5435 - 10623, n=59, senaste 2 åren) | |
| MSI Prestige 13 AI Plus Evo A2VMG | |
| Lenovo ThinkPad X13 2-in-1 Gen 5 | |
| PCMark 10 / Digital Content Creation | |
| MSI Prestige 13 AI Plus Evo A2VMG | |
| Genomsnitt Intel Core Ultra 7 268V, Intel Arc Graphics 140V (9425 - 10427, n=2) | |
| Dell XPS 13 9350 | |
| Framework Laptop 13.5 Core Ultra 7 155H | |
| Dell Pro 13 Premium PA13250 | |
| Genomsnitt av klass Subnotebook (5305 - 12442, n=59, senaste 2 åren) | |
| Lenovo ThinkPad X13 2-in-1 Gen 5 | |
| CrossMark / Overall | |
| Dell XPS 13 9350 | |
| MSI Prestige 13 AI Plus Evo A2VMG | |
| Genomsnitt Intel Core Ultra 7 268V, Intel Arc Graphics 140V (1643 - 1738, n=2) | |
| Framework Laptop 13.5 Core Ultra 7 155H | |
| Dell Pro 13 Premium PA13250 | |
| Genomsnitt av klass Subnotebook (365 - 2018, n=68, senaste 2 åren) | |
| Lenovo ThinkPad X13 2-in-1 Gen 5 | |
| Microsoft Surface Pro Copilot+ | |
| CrossMark / Productivity | |
| Dell XPS 13 9350 | |
| MSI Prestige 13 AI Plus Evo A2VMG | |
| Genomsnitt Intel Core Ultra 7 268V, Intel Arc Graphics 140V (1577 - 1680, n=2) | |
| Framework Laptop 13.5 Core Ultra 7 155H | |
| Dell Pro 13 Premium PA13250 | |
| Lenovo ThinkPad X13 2-in-1 Gen 5 | |
| Genomsnitt av klass Subnotebook (364 - 1875, n=68, senaste 2 åren) | |
| Microsoft Surface Pro Copilot+ | |
| CrossMark / Creativity | |
| MSI Prestige 13 AI Plus Evo A2VMG | |
| Dell XPS 13 9350 | |
| Genomsnitt Intel Core Ultra 7 268V, Intel Arc Graphics 140V (1866 - 1976, n=2) | |
| Framework Laptop 13.5 Core Ultra 7 155H | |
| Dell Pro 13 Premium PA13250 | |
| Genomsnitt av klass Subnotebook (372 - 2396, n=68, senaste 2 åren) | |
| Lenovo ThinkPad X13 2-in-1 Gen 5 | |
| Microsoft Surface Pro Copilot+ | |
| CrossMark / Responsiveness | |
| Lenovo ThinkPad X13 2-in-1 Gen 5 | |
| Framework Laptop 13.5 Core Ultra 7 155H | |
| Dell XPS 13 9350 | |
| Genomsnitt av klass Subnotebook (312 - 1899, n=68, senaste 2 åren) | |
| MSI Prestige 13 AI Plus Evo A2VMG | |
| Genomsnitt Intel Core Ultra 7 268V, Intel Arc Graphics 140V (1267 - 1311, n=2) | |
| Dell Pro 13 Premium PA13250 | |
| Microsoft Surface Pro Copilot+ | |
| WebXPRT 3 / Overall | |
| Microsoft Surface Pro Copilot+ | |
| Genomsnitt av klass Subnotebook (156 - 479, n=67, senaste 2 åren) | |
| Dell XPS 13 9350 | |
| MSI Prestige 13 AI Plus Evo A2VMG | |
| Framework Laptop 13.5 Core Ultra 7 155H | |
| Genomsnitt Intel Core Ultra 7 268V, Intel Arc Graphics 140V (266 - 310, n=2) | |
| Dell Pro 13 Premium PA13250 | |
| Lenovo ThinkPad X13 2-in-1 Gen 5 | |
| WebXPRT 4 / Overall | |
| MSI Prestige 13 AI Plus Evo A2VMG | |
| Dell XPS 13 9350 | |
| Genomsnitt Intel Core Ultra 7 268V, Intel Arc Graphics 140V (245 - 287, n=2) | |
| Genomsnitt av klass Subnotebook (132 - 348, n=68, senaste 2 åren) | |
| Microsoft Surface Pro Copilot+ | |
| Framework Laptop 13.5 Core Ultra 7 155H | |
| Dell Pro 13 Premium PA13250 | |
| Lenovo ThinkPad X13 2-in-1 Gen 5 | |
| Mozilla Kraken 1.1 / Total | |
| Lenovo ThinkPad X13 2-in-1 Gen 5 | |
| Framework Laptop 13.5 Core Ultra 7 155H | |
| Genomsnitt av klass Subnotebook (278 - 1104, n=76, senaste 2 åren) | |
| Dell Pro 13 Premium PA13250 | |
| Genomsnitt Intel Core Ultra 7 268V, Intel Arc Graphics 140V (475 - 476, n=2) | |
| MSI Prestige 13 AI Plus Evo A2VMG | |
| Dell XPS 13 9350 | |
| Microsoft Surface Pro Copilot+ | |
* ... mindre är bättre
| PCMark 10 Score | 6729 poäng | |
Hjälp | ||
| AIDA64 / Memory Copy | |
| MSI Prestige 13 AI Plus Evo A2VMG | |
| Genomsnitt Intel Core Ultra 7 268V (100445 - 107108, n=2) | |
| Dell XPS 13 9350 | |
| Dell Pro 13 Premium PA13250 | |
| Genomsnitt av klass Subnotebook (14554 - 109035, n=70, senaste 2 åren) | |
| Framework Laptop 13.5 Core Ultra 7 155H | |
| Lenovo ThinkPad X13 2-in-1 Gen 5 | |
| Microsoft Surface Pro Copilot+ | |
| AIDA64 / Memory Read | |
| Microsoft Surface Pro Copilot+ | |
| Dell XPS 13 9350 | |
| MSI Prestige 13 AI Plus Evo A2VMG | |
| Genomsnitt Intel Core Ultra 7 268V (82511 - 88341, n=2) | |
| Dell Pro 13 Premium PA13250 | |
| Framework Laptop 13.5 Core Ultra 7 155H | |
| Genomsnitt av klass Subnotebook (15948 - 122210, n=70, senaste 2 åren) | |
| Lenovo ThinkPad X13 2-in-1 Gen 5 | |
| AIDA64 / Memory Write | |
| MSI Prestige 13 AI Plus Evo A2VMG | |
| Genomsnitt Intel Core Ultra 7 268V (115959 - 117888, n=2) | |
| Dell Pro 13 Premium PA13250 | |
| Dell XPS 13 9350 | |
| Genomsnitt av klass Subnotebook (15709 - 117898, n=70, senaste 2 åren) | |
| Framework Laptop 13.5 Core Ultra 7 155H | |
| Lenovo ThinkPad X13 2-in-1 Gen 5 | |
| Microsoft Surface Pro Copilot+ | |
| AIDA64 / Memory Latency | |
| Lenovo ThinkPad X13 2-in-1 Gen 5 | |
| Framework Laptop 13.5 Core Ultra 7 155H | |
| Genomsnitt av klass Subnotebook (7.2 - 187.8, n=69, senaste 2 åren) | |
| Dell Pro 13 Premium PA13250 | |
| MSI Prestige 13 AI Plus Evo A2VMG | |
| Dell XPS 13 9350 | |
| Genomsnitt Intel Core Ultra 7 268V (97.4 - 101.2, n=2) | |
| Microsoft Surface Pro Copilot+ | |
* ... mindre är bättre
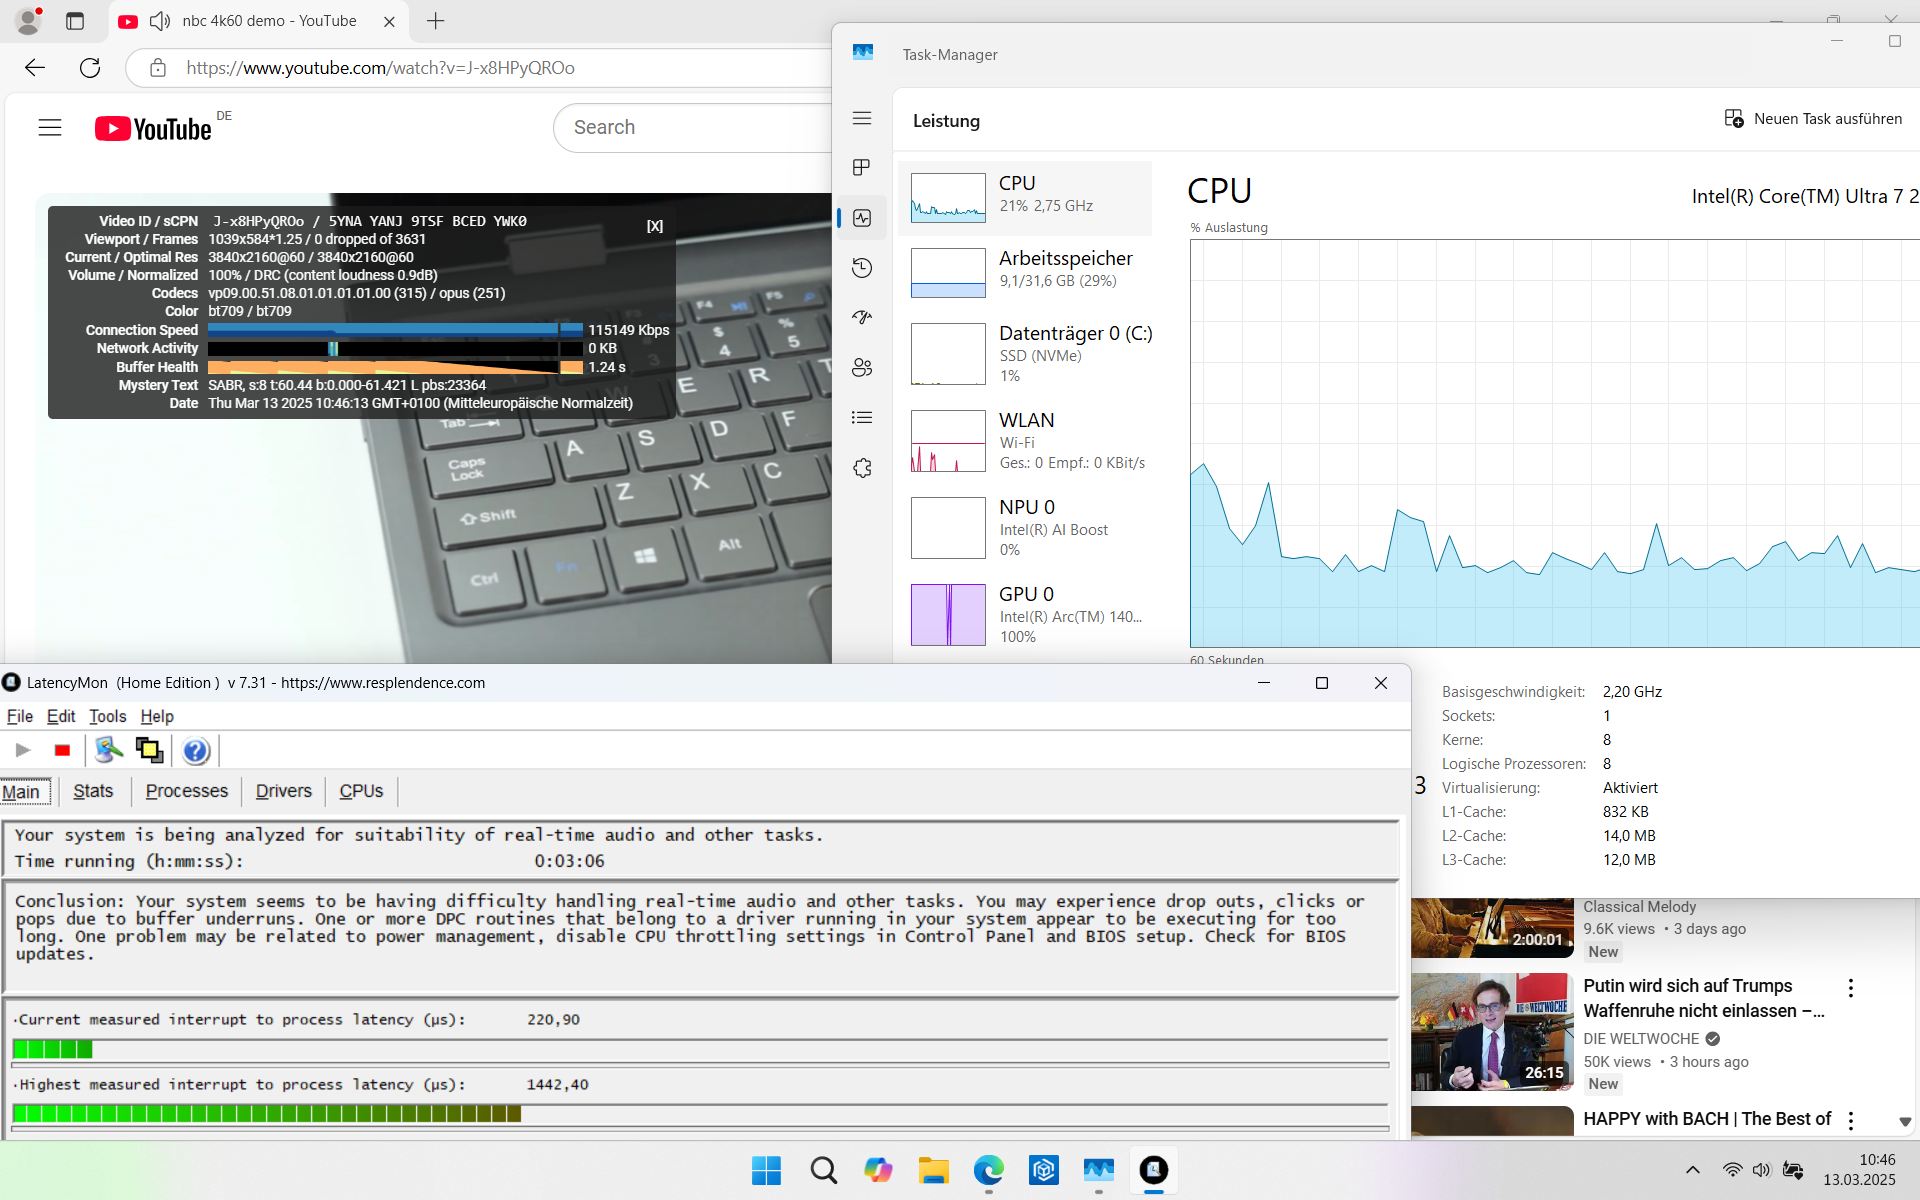
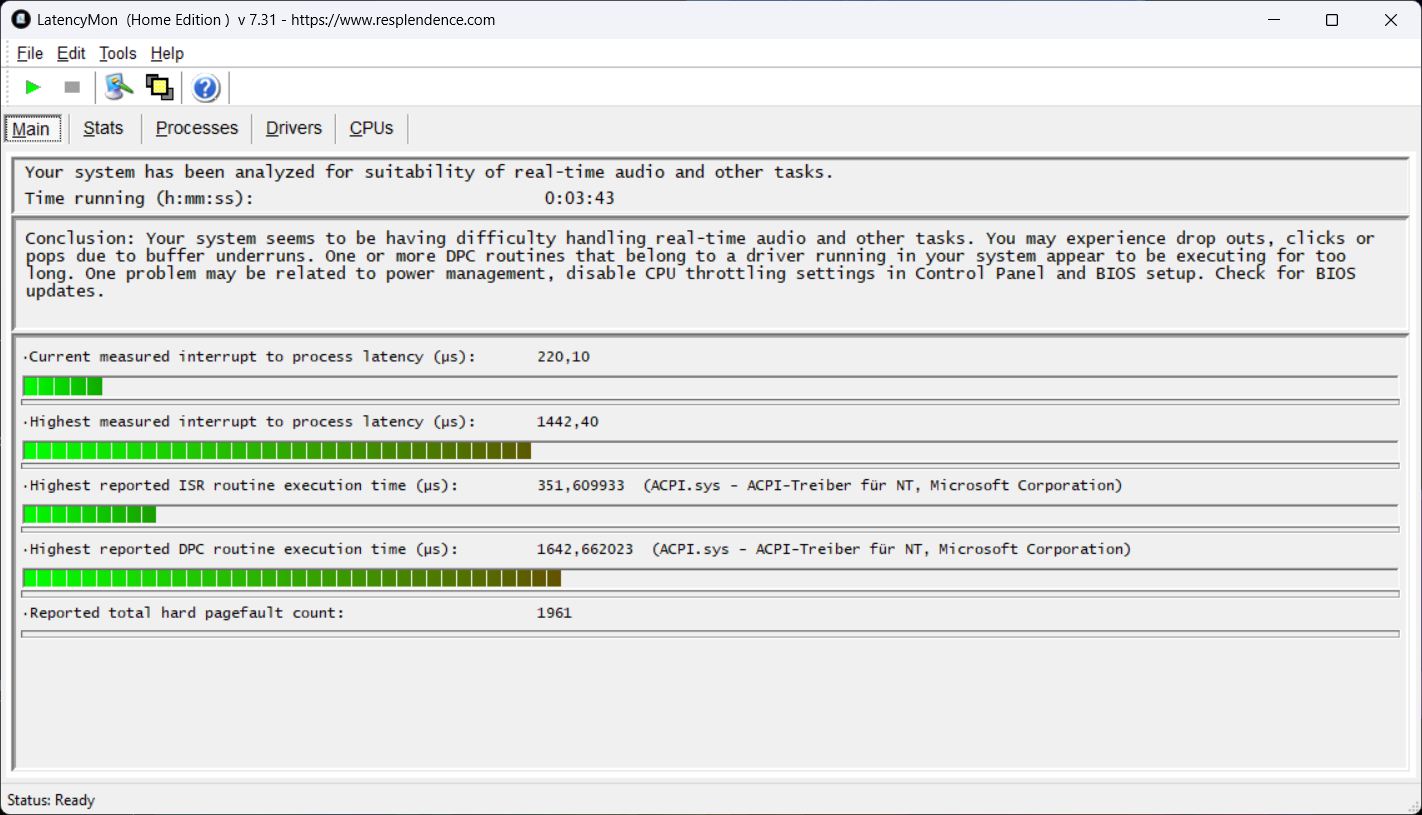
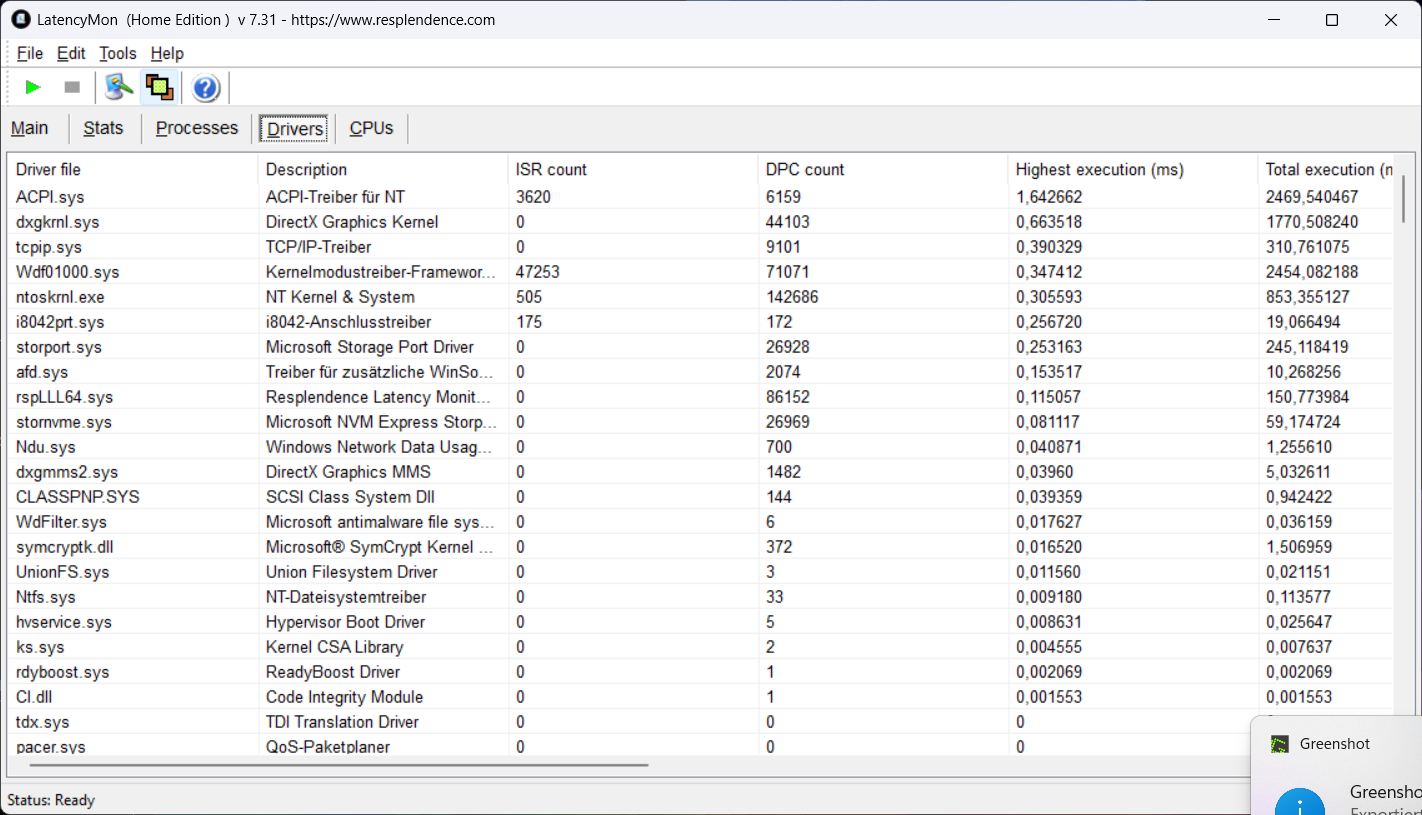
DPC-latenstider
De första allvarliga latensproblemen dök upp när vi öppnade flera webbläsarflikar. Fördröjningen ökade när vi spelade upp vår 4K/60fps YouTube-video, som lyckligtvis fortfarande kördes utan att tappa några bildrutor. Slutvärdet är lite för högt för oss.
| DPC Latencies / LatencyMon - interrupt to process latency (max), Web, Youtube, Prime95 | |
| Dell Pro 13 Premium PA13250 | |
| Lenovo ThinkPad X13 2-in-1 Gen 5 | |
| MSI Prestige 13 AI Plus Evo A2VMG | |
| Framework Laptop 13.5 Core Ultra 7 155H | |
* ... mindre är bättre
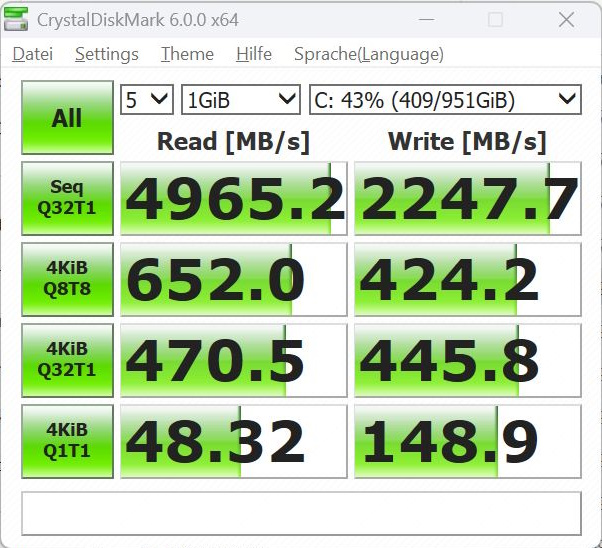
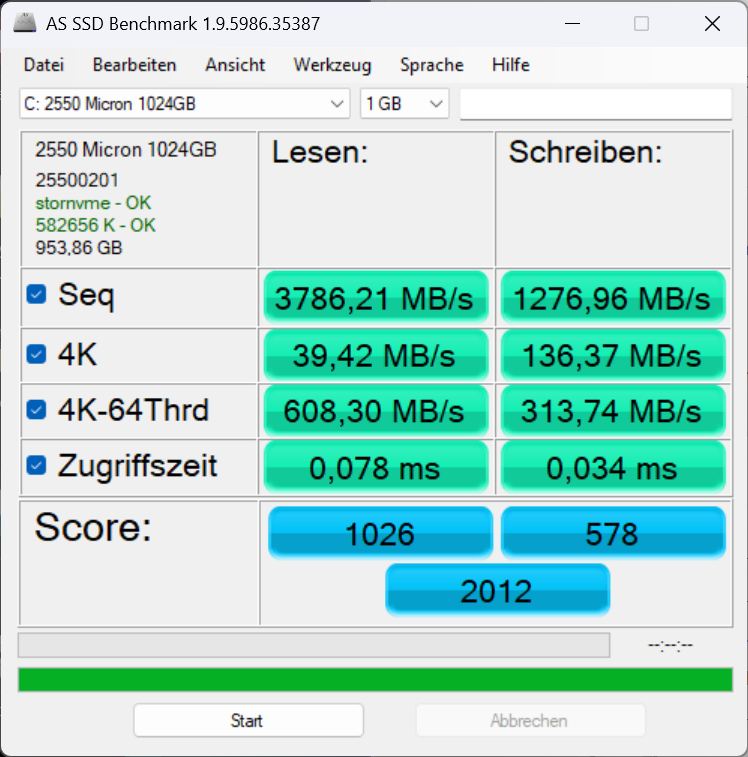
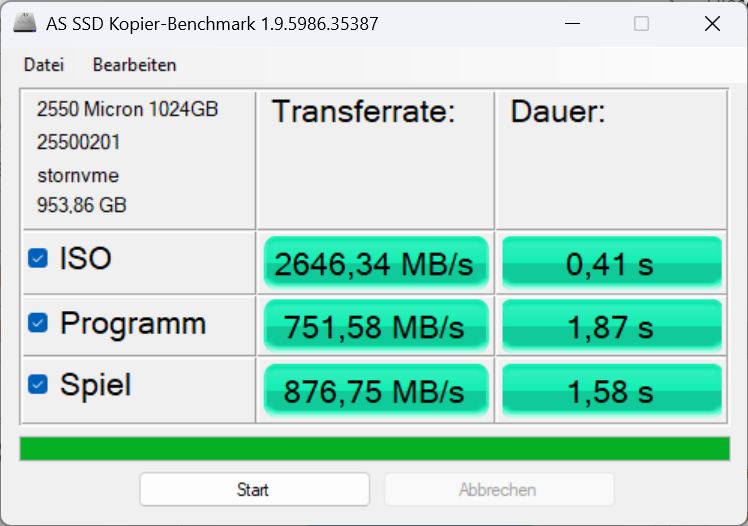
Masslagring
Lagringsutrymmet kommer i form av en 1 TB Micron 2550, men beroende på konfiguration finns även 512 GB-modeller tillgängliga. Sammantaget är hårddisken en besvikelse när det gäller hastigheten, men prestandan förblir ganska konsekvent över tid.

* ... mindre är bättre
Continuous Performance Read: DiskSpd Read Loop, Queue Depth 8
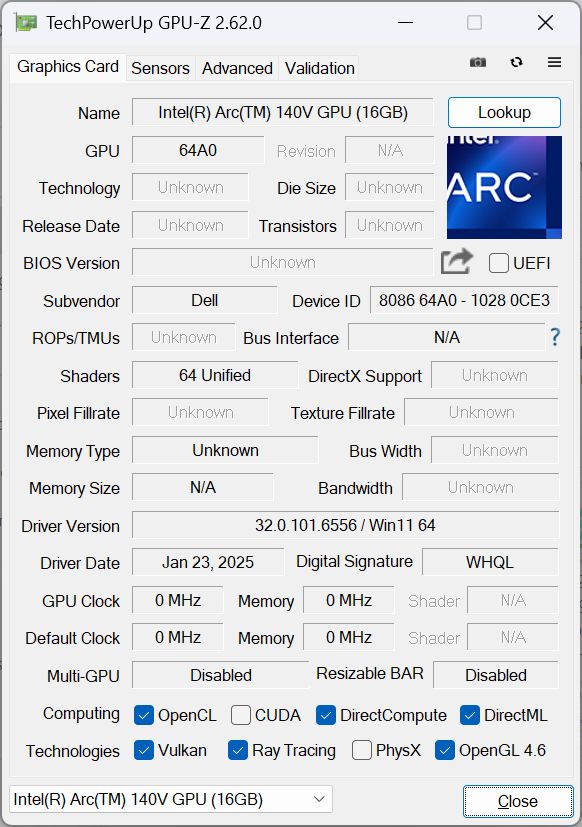
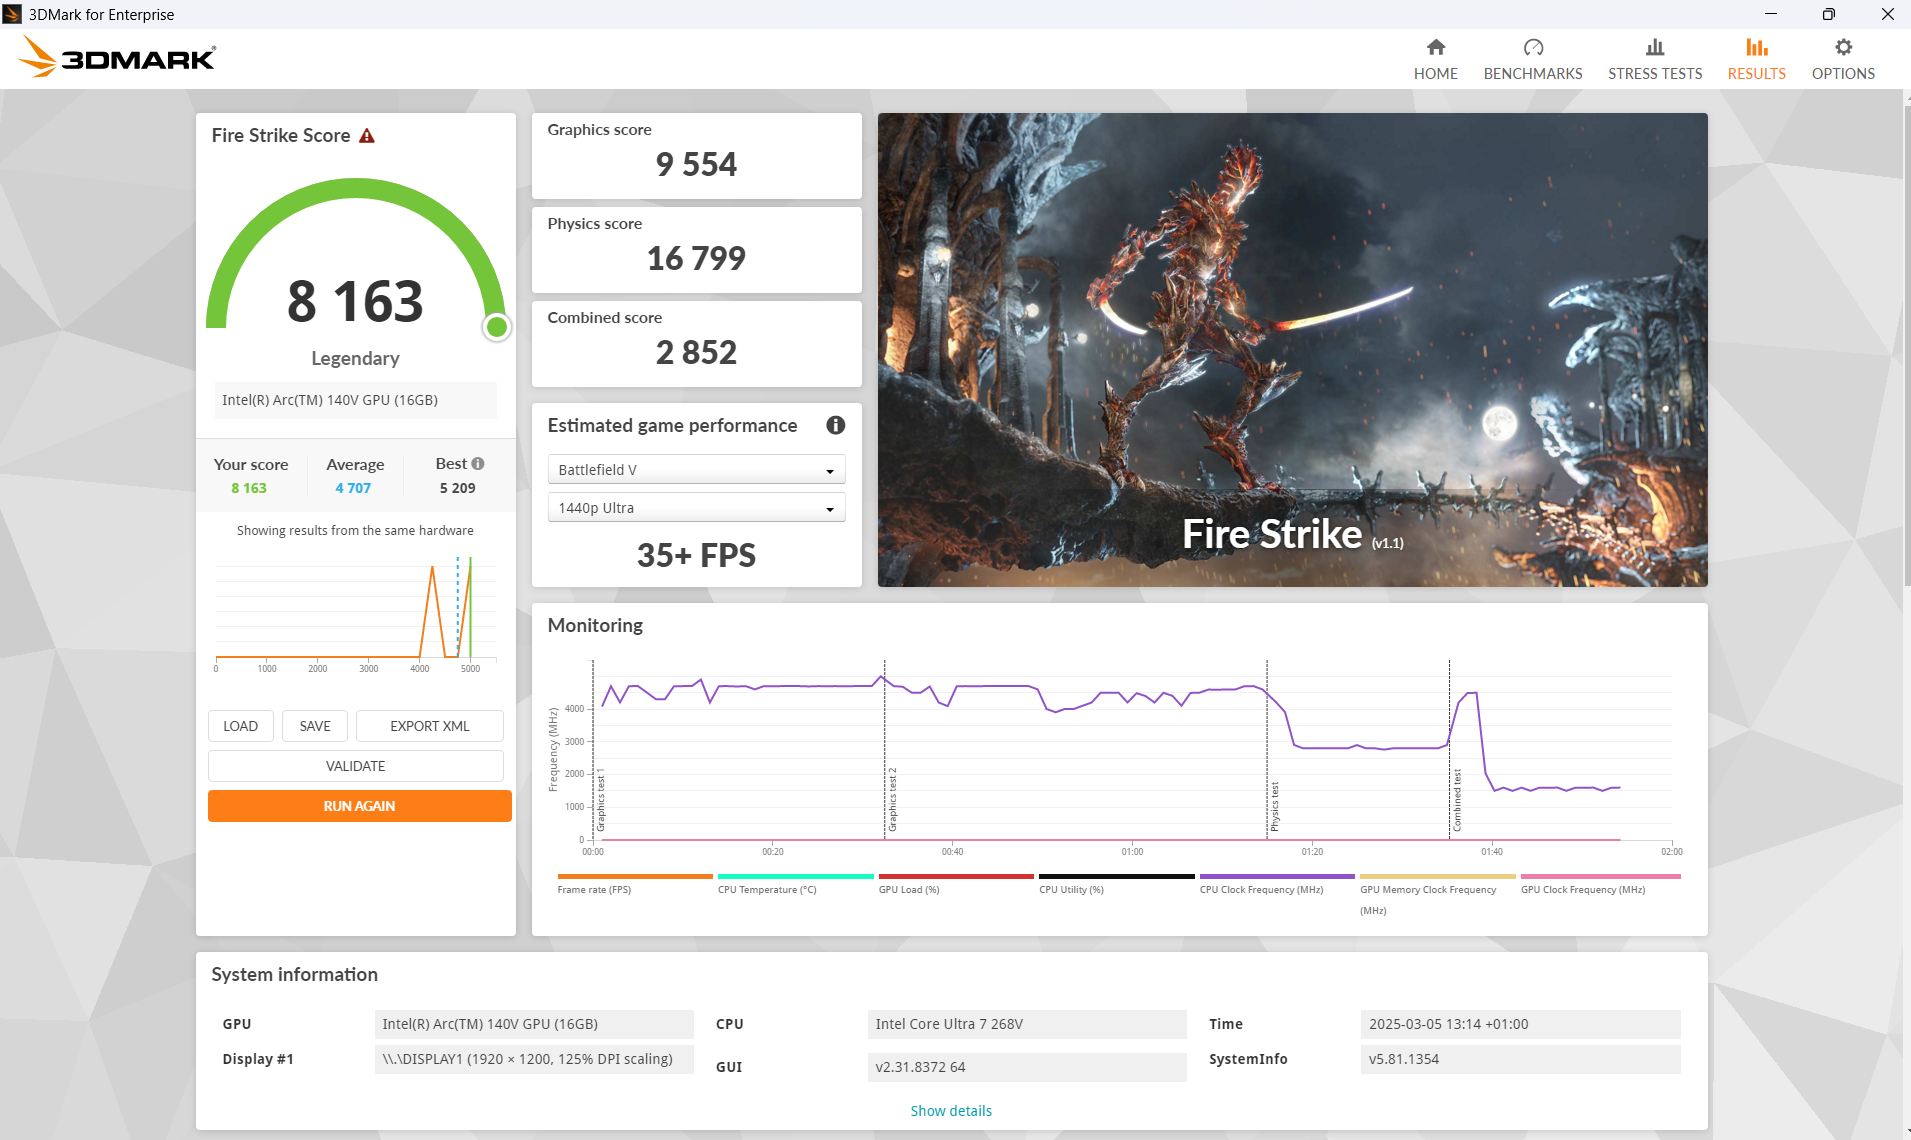
Grafikkort
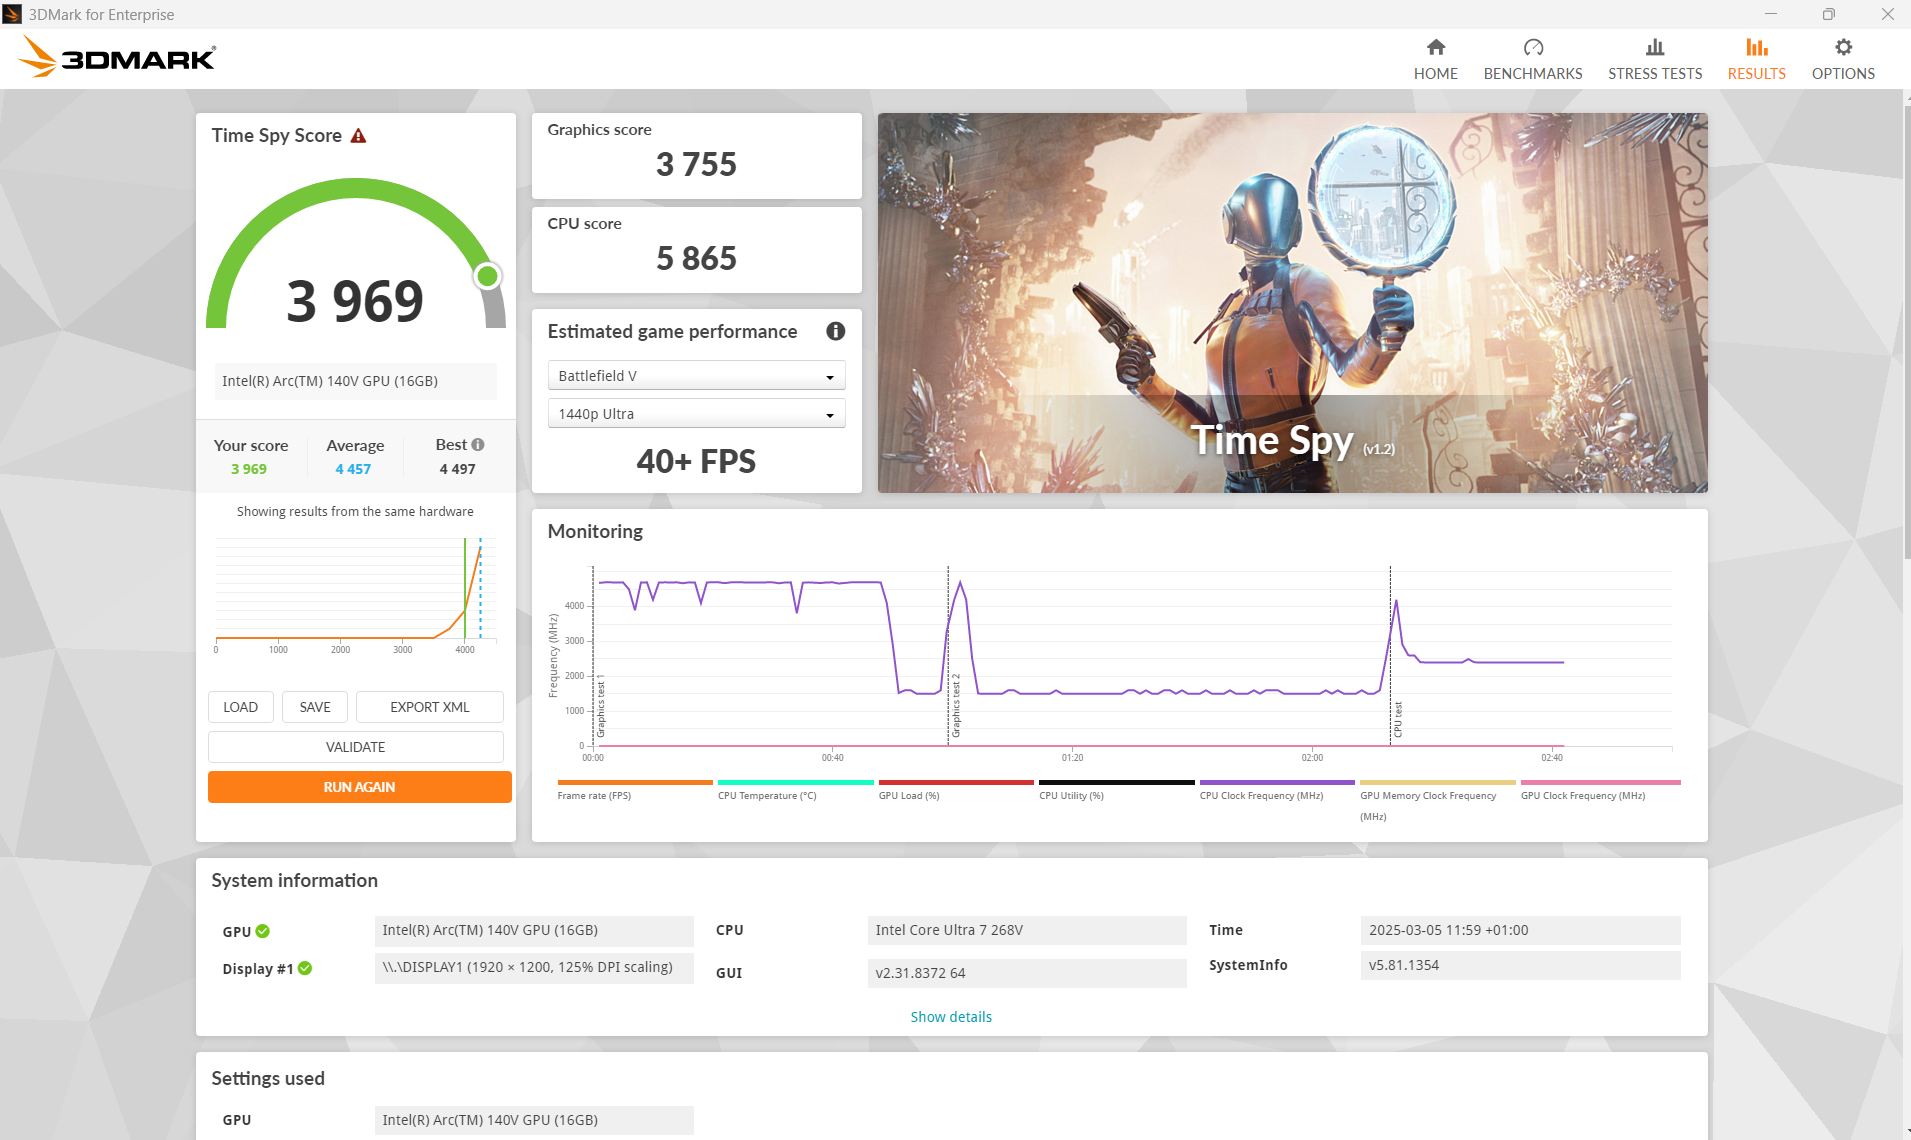
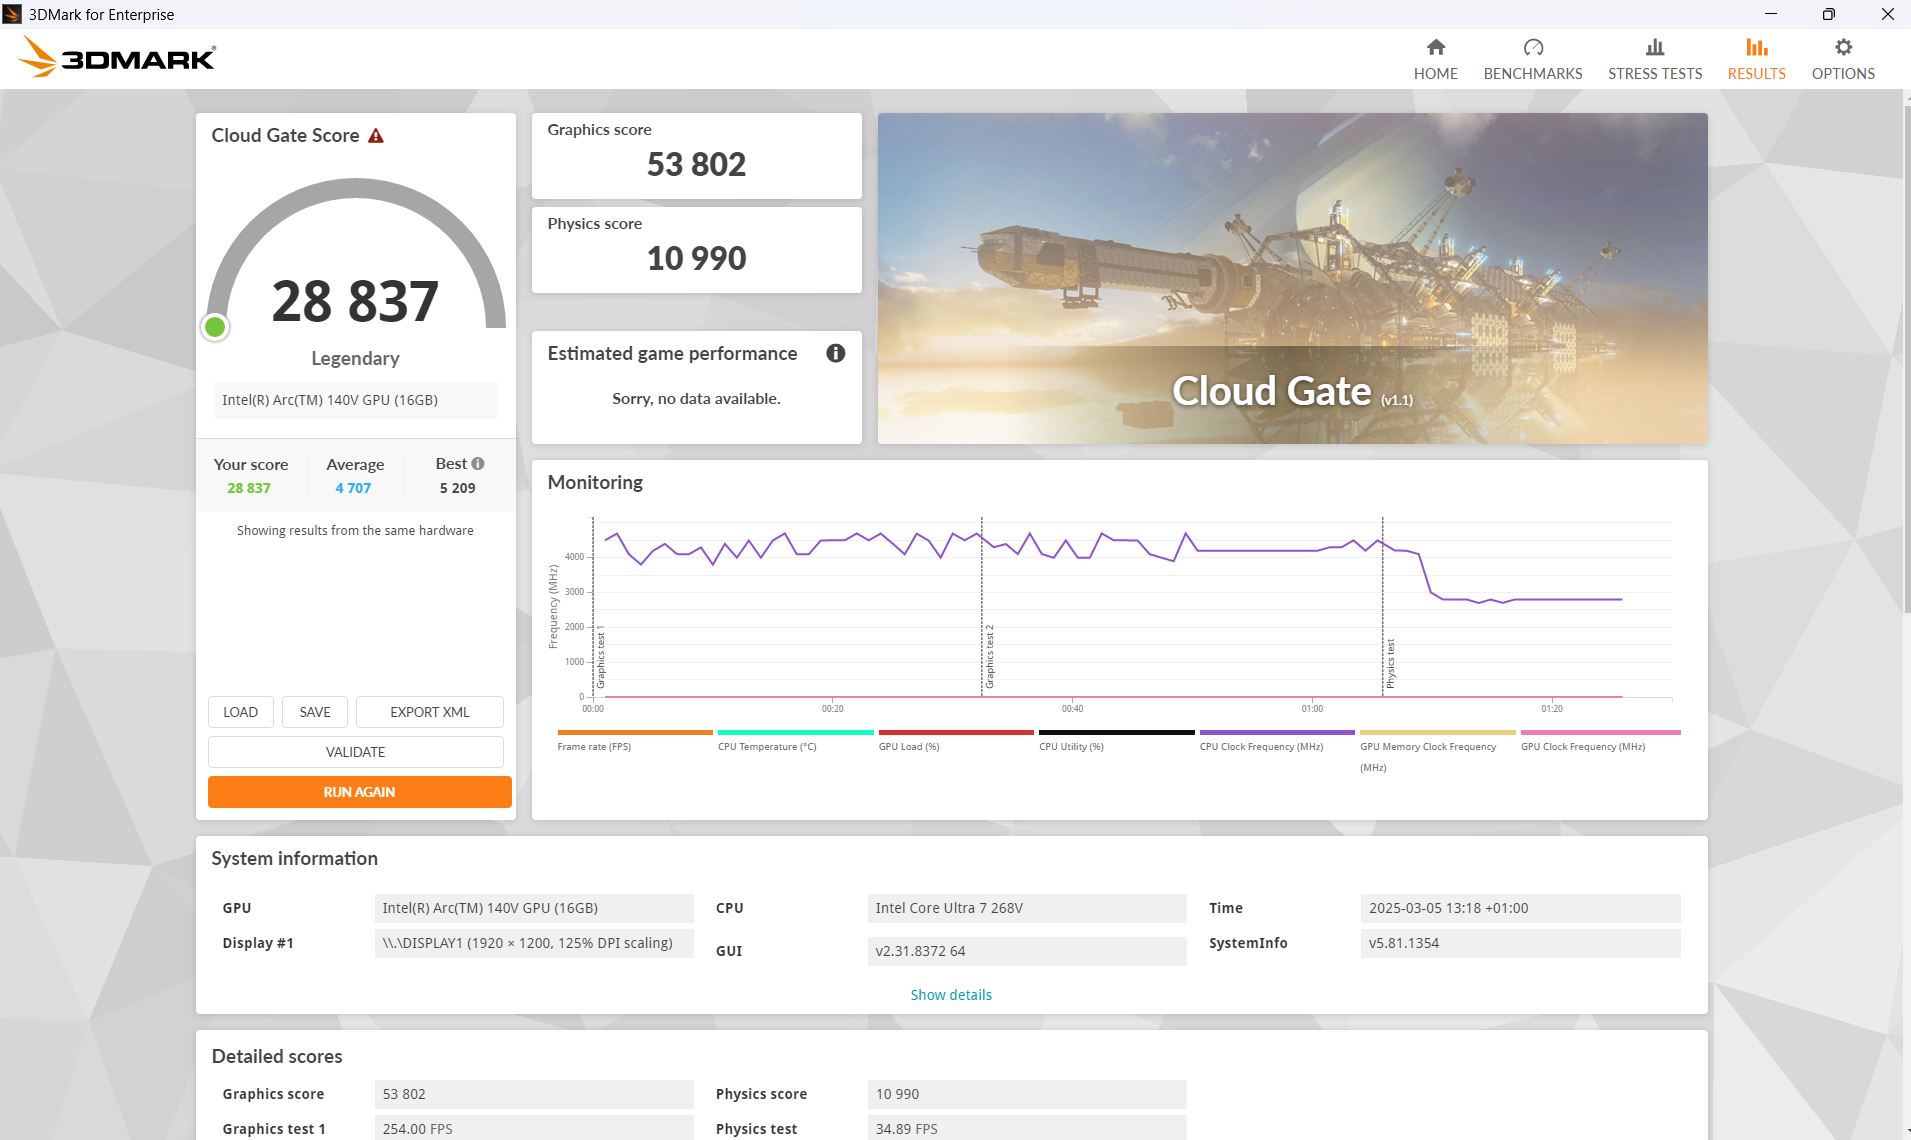
Intel Arc Graphics Intel Arc Graphics 140V iGPU Det är ett relativt snabbt integrerat grafikkort. I de syntetiska 3DMark-benchmarks presterade det i nivå med eller något över våra förväntningar. Vi märkte ingen prestandaförsämring i en loopad Fire Strike som kördes på batteriström.
Den presterade också imponerande när vi spelade, med nästan alla spel som kördes i Full HD och med medelhöga detaljer över 30 bilder per sekund, och i vissa fall var det till och med tillräckligt för höga detaljer. Bildfrekvensen under 30 minuter i Cyberpunk 2077 såg mycket konsekvent ut.
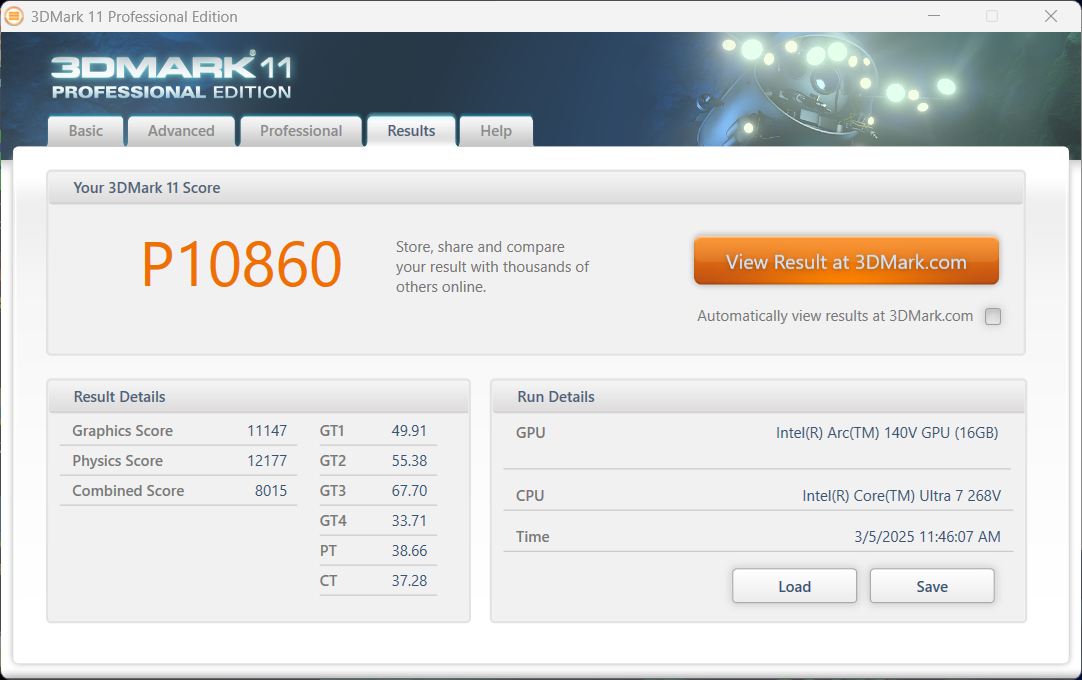
| 3DMark 11 Performance | 10860 poäng | |
| 3DMark Cloud Gate Standard Score | 28837 poäng | |
| 3DMark Fire Strike Score | 8163 poäng | |
| 3DMark Time Spy Score | 3969 poäng | |
Hjälp | ||
* ... mindre är bättre
| Cyberpunk 2077 2.2 Phantom Liberty - 1920x1080 Ultra Preset (FSR off) | |
| MSI Prestige 13 AI Plus Evo A2VMG | |
| Dell Pro 13 Premium PA13250 | |
| Framework Laptop 13.5 Core Ultra 7 155H | |
| Genomsnitt av klass Subnotebook (8.48 - 31.4, n=47, senaste 2 åren) | |
| Dell XPS 13 9350 | |
| Microsoft Surface Pro Copilot+ | |
| Lenovo ThinkPad X13 2-in-1 Gen 5 | |
| GTA V - 1920x1080 Highest Settings possible AA:4xMSAA + FX AF:16x | |
| MSI Prestige 13 AI Plus Evo A2VMG | |
| Dell Pro 13 Premium PA13250 | |
| Dell XPS 13 9350 | |
| Microsoft Surface Pro Copilot+ | |
| Genomsnitt av klass Subnotebook (7.81 - 53, n=67, senaste 2 åren) | |
| Framework Laptop 13.5 Core Ultra 7 155H | |
| Lenovo ThinkPad X13 2-in-1 Gen 5 | |
Cyberpunk 2077 ultra FPS diagram
| låg | med. | hög | ultra | |
|---|---|---|---|---|
| GTA V (2015) | 153.4 | 140 | 26.3 | |
| Dota 2 Reborn (2015) | 107.5 | 101.7 | 87.8 | 71.2 |
| Final Fantasy XV Benchmark (2018) | 74.9 | 42.3 | 29.1 | |
| X-Plane 11.11 (2018) | 48.1 | 36.7 | 32.7 | |
| Strange Brigade (2018) | 223 | 83.3 | 69.5 | 57.8 |
| Baldur's Gate 3 (2023) | 45.5 | 35.7 | 31.3 | 30.8 |
| Cyberpunk 2077 2.2 Phantom Liberty (2023) | 43.5 | 35.4 | 28.6 | 28.1 |
Utsläpp och energi - Dell Pro är ekonomisk
Bullerutsläpp
Fläktarna är vanligtvis tysta när de körs på tomgång. När vi spelade under maximal belastning uppmätte vi maximalt 42 dB, men i verkligheten var det lägre (även i stresstester) och nådde ofta bara 36 eller 37 dB.
Ljudnivå
| Låg belastning |
| 23 / 23 / 23 dB(A) |
| Hög belastning |
| 37 / 42.74 dB(A) |
 | ||
30 dB tyst 40 dB(A) hörbar 50 dB(A) högt ljud |
||
min: | ||
| Dell Pro 13 Premium PA13250 Arc 140V, Core Ultra 7 268V, Micron 2550 1TB | MSI Prestige 13 AI Plus Evo A2VMG Arc 140V, Core Ultra 7 258V | Lenovo ThinkPad X13 2-in-1 Gen 5 Graphics 4-Core, Ultra 7 165U, Lenovo UMIS RPETJ1T24MHP2QDQ | Framework Laptop 13.5 Core Ultra 7 155H Arc 8-Core, Ultra 7 155H | Dell XPS 13 9350 Arc 140V, Core Ultra 7 256V, Micron 2550 512GB | Microsoft Surface Pro Copilot+ Adreno X1-85 3.8 TFLOPS, SD X Plus X1P-64-100, Samsung PM9B1 256GB MZ9L4256HCJQ | |
|---|---|---|---|---|---|---|
| Noise | -8% | 4% | -7% | 3% | 2% | |
| av / miljö * | 23 | 24.1 -5% | 23 -0% | 24 -4% | 24.1 -5% | 23.8 -3% |
| Idle Minimum * | 23 | 24.8 -8% | 23 -0% | 24.1 -5% | 24.4 -6% | 23.8 -3% |
| Idle Average * | 23 | 24.8 -8% | 23 -0% | 25.1 -9% | 24.4 -6% | 23.8 -3% |
| Idle Maximum * | 23 | 26.7 -16% | 23 -0% | 27 -17% | 24.4 -6% | 23.8 -3% |
| Load Average * | 37 | 36.8 1% | 34.44 7% | 38.4 -4% | 26.2 29% | 23.8 36% |
| Cyberpunk 2077 ultra * | 42.74 | 44.5 -4% | 38.28 10% | 43.7 -2% | 34.2 20% | 44.7 -5% |
| Load Maximum * | 42.74 | 50.8 -19% | 39.04 9% | 45.8 -7% | 45.2 -6% | 44.7 -5% |
* ... mindre är bättre
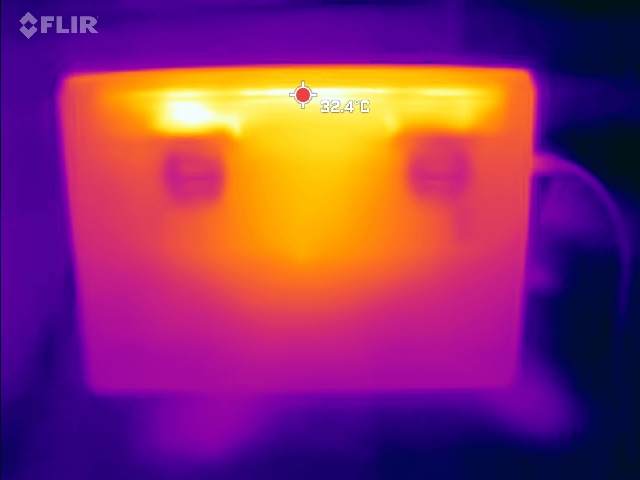
Temperatur
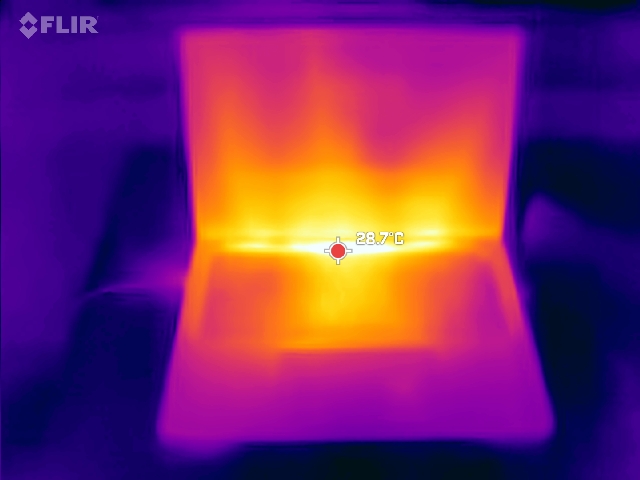
Till skillnad från många kontors- och företagskonkurrenter i den här storleken använder Dell Pro 13 Premium två fläktar istället för bara en, och det är något som har en positiv inverkan på yttemperaturerna. Gaming blir varmare än i vårt stresstest, men även här uppmätte vi hot spots på bara 37°C. Båda sidorna av den bärbara datorn kyls lika mycket, istället för bara en sida som hos vissa konkurrenter.
(+) Den maximala temperaturen på ovansidan är 31 °C / 88 F, jämfört med genomsnittet av 35.9 °C / 97 F , allt från 21.4 till 59 °C för klassen Subnotebook.
(+) Botten värms upp till maximalt 31 °C / 88 F, jämfört med genomsnittet av 39.3 °C / 103 F
(+) Vid tomgångsbruk är medeltemperaturen för ovansidan 22.3 °C / 72 F, jämfört med enhetsgenomsnittet på 30.8 °C / ### class_avg_f### F.
(+) 3: The average temperature for the upper side is 28.8 °C / 84 F, compared to the average of 30.8 °C / 87 F for the class Subnotebook.
(+) Handledsstöden och pekplattan är kallare än hudtemperaturen med maximalt 26 °C / 78.8 F och är därför svala att ta på.
(+) Medeltemperaturen för handledsstödsområdet på liknande enheter var 28.2 °C / 82.8 F (+2.2 °C / 4 F).
| Dell Pro 13 Premium PA13250 Intel Core Ultra 7 268V, Intel Arc Graphics 140V | MSI Prestige 13 AI Plus Evo A2VMG Intel Core Ultra 7 258V, Intel Arc Graphics 140V | Lenovo ThinkPad X13 2-in-1 Gen 5 Intel Core Ultra 7 165U, Intel Graphics 4-Core iGPU (Arc) | Framework Laptop 13.5 Core Ultra 7 155H Intel Core Ultra 7 155H, Intel Arc 8-Core iGPU | Dell XPS 13 9350 Intel Core Ultra 7 256V, Intel Arc Graphics 140V | Microsoft Surface Pro Copilot+ Qualcomm Snapdragon X Plus X1P-64-100, Qualcomm SD X Adreno X1-85 3.8 TFLOPS | |
|---|---|---|---|---|---|---|
| Heat | -23% | -52% | -29% | -12% | -25% | |
| Maximum Upper Side * | 31 | 43.4 -40% | 60 -94% | 42.8 -38% | 34.8 -12% | 43.9 -42% |
| Maximum Bottom * | 31 | 42.4 -37% | 57 -84% | 45.2 -46% | 37.4 -21% | 44.9 -45% |
| Idle Upper Side * | 24 | 25.4 -6% | 27 -13% | 27.2 -13% | 25.4 -6% | 26.2 -9% |
| Idle Bottom * | 24 | 25.6 -7% | 28 -17% | 28.6 -19% | 26.2 -9% | 24.6 -3% |
* ... mindre är bättre
Högtalare
För att vara en så liten bärbar dator lyckas högtalarna till och med överträffa några mycket större modeller. Mellanregistret är balanserat, men de saknar fortfarande bas. En ljudjackingång finns tillgänglig för anslutning till externa enheter.
Dell Pro 13 Premium PA13250 ljudanalys
(+) | högtalare kan spela relativt högt (87.49 dB)
Bas 100 - 315 Hz
(-) | nästan ingen bas - i genomsnitt 15.9% lägre än medianen
(±) | linjäriteten för basen är genomsnittlig (8.3% delta till föregående frekvens)
Mellan 400 - 2000 Hz
(+) | balanserad mellan - endast 2.9% från medianen
(+) | mids är linjära (4.7% delta till föregående frekvens)
Högsta 2 - 16 kHz
(±) | reducerade toppar - i genomsnitt 5.2% lägre än medianen
(±) | linjäriteten för toppar är genomsnittlig (7.1% delta till föregående frekvens)
Totalt 100 - 16 000 Hz
(+) | det totala ljudet är linjärt (12.2% skillnad mot median)
Jämfört med samma klass
» 14% av alla testade enheter i den här klassen var bättre, 4% liknande, 82% sämre
» Den bästa hade ett delta på 5%, genomsnittet var 19%, sämst var 53%
Jämfört med alla testade enheter
» 8% av alla testade enheter var bättre, 2% liknande, 89% sämre
» Den bästa hade ett delta på 4%, genomsnittet var 24%, sämst var 134%
MSI Prestige 13 AI Plus Evo A2VMG ljudanalys
(+) | högtalare kan spela relativt högt (84.5 dB)
Bas 100 - 315 Hz
(-) | nästan ingen bas - i genomsnitt 19.4% lägre än medianen
(±) | linjäriteten för basen är genomsnittlig (9.6% delta till föregående frekvens)
Mellan 400 - 2000 Hz
(±) | högre mellan - i genomsnitt 6.4% högre än median
(+) | mids är linjära (5.1% delta till föregående frekvens)
Högsta 2 - 16 kHz
(±) | högre toppar - i genomsnitt 6.1% högre än medianen
(+) | toppar är linjära (4.6% delta till föregående frekvens)
Totalt 100 - 16 000 Hz
(±) | linjäriteten för det totala ljudet är genomsnittlig (18.2% skillnad mot median)
Jämfört med samma klass
» 50% av alla testade enheter i den här klassen var bättre, 7% liknande, 43% sämre
» Den bästa hade ett delta på 5%, genomsnittet var 19%, sämst var 53%
Jämfört med alla testade enheter
» 36% av alla testade enheter var bättre, 8% liknande, 56% sämre
» Den bästa hade ett delta på 4%, genomsnittet var 24%, sämst var 134%
Strömförbrukning
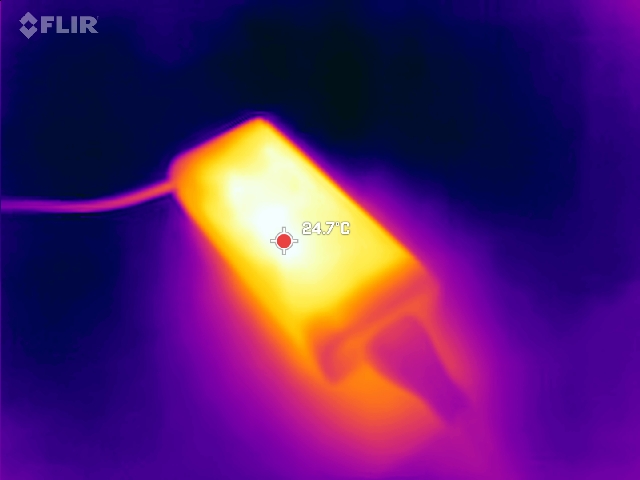
Tack vare Lunar Lake SoC är Dell Pro 13 mycket ekonomisk. Den förbrukar bara 2 till 4,75 W vid tomgångskörning, och vi uppmätte bara 38 W när vi körde Cyberpunk 2077. Endast Dell XPS 13 9350med sin något svagare Lunar Lake-processor är mer ekonomisk, och alla andra konkurrenter förbrukar mer
| Av/Standby | |
| Låg belastning | |
| Hög belastning |
|
Förklaring:
min: | |
| Dell Pro 13 Premium PA13250 Core Ultra 7 268V, Arc 140V | MSI Prestige 13 AI Plus Evo A2VMG Core Ultra 7 258V, Arc 140V | Lenovo ThinkPad X13 2-in-1 Gen 5 Ultra 7 165U, Graphics 4-Core | Framework Laptop 13.5 Core Ultra 7 155H Ultra 7 155H, Arc 8-Core | Dell XPS 13 9350 Core Ultra 7 256V, Arc 140V | Microsoft Surface Pro Copilot+ SD X Plus X1P-64-100, Adreno X1-85 3.8 TFLOPS | Genomsnitt av klass Subnotebook | |
|---|---|---|---|---|---|---|---|
| Power Consumption | -39% | -19% | -26% | 7% | -23% | -62% | |
| Idle Minimum * | 2 | 3.5 -75% | 3.2 -60% | 2.5 -25% | 1.3 35% | 1.9 5% | 4.3 ? -115% |
| Idle Average * | 4.3 | 5.9 -37% | 6.1 -42% | 5.2 -21% | 2.5 42% | 9.2 -114% | 7.33 ? -70% |
| Idle Maximum * | 4.75 | 10 -111% | 6.7 -41% | 5.8 -22% | 4.1 14% | 9.5 -100% | 9.07 ? -91% |
| Load Average * | 40 | 38.7 3% | 44.2 -11% | 47.5 -19% | 40.1 -0% | 29.6 26% | 45.2 ? -13% |
| Cyberpunk 2077 ultra * | 36.4 | 46.3 -27% | 25.2 31% | 54.5 -50% | 46.1 -27% | 39.5 -9% | |
| Cyberpunk 2077 ultra external monitor * | 38 | 45.6 -20% | 38.5 -1% | 52.4 -38% | 43.1 -13% | 37.4 2% | |
| Load Maximum * | 57 | 61.5 -8% | 62.5 -10% | 61.5 -8% | 57.3 -1% | 40.7 29% | 69 ? -21% |
* ... mindre är bättre
Power consumption Cyberpunk / stress test
Power consumption with an external monitor
Batteriets livslängd
Tack vare den låga strömförbrukningen är batteritiden utmärkt. Vi spelade in nästan 24 timmar i Wi-Fi- och videotesterna, vilket är ett fantastiskt resultat! 60W-batteriet ligger i mellanklassen när det gäller kapacitet. Den nya XPS 13 förlorar bara marginellt på grund av sitt något mindre batteri (55 Wh).
| Dell Pro 13 Premium PA13250 Core Ultra 7 268V, Arc 140V, 60 Wh | MSI Prestige 13 AI Plus Evo A2VMG Core Ultra 7 258V, Arc 140V, 75 Wh | Lenovo ThinkPad X13 2-in-1 Gen 5 Ultra 7 165U, Graphics 4-Core, 54.7 Wh | Framework Laptop 13.5 Core Ultra 7 155H Ultra 7 155H, Arc 8-Core, 61 Wh | Dell XPS 13 9350 Core Ultra 7 256V, Arc 140V, 55 Wh | Microsoft Surface Pro Copilot+ SD X Plus X1P-64-100, Adreno X1-85 3.8 TFLOPS, 47 Wh | Genomsnitt av klass Subnotebook | |
|---|---|---|---|---|---|---|---|
| Batteridrifttid | -44% | -50% | -52% | -15% | -48% | -36% | |
| H.264 | 1425 | 731 -49% | 841 -41% | 961 ? -33% | |||
| WiFi v1.3 | 1440 | 804 -44% | 739 -49% | 630 -56% | 1236 -14% | 662 -54% | 757 ? -47% |
| Load | 170 | 84 -51% | 90 -47% | 142 -16% | 89 -48% | 121.3 ? -29% | |
| Reader / Idle | 2296 | 3407 | 1882 ? |
Notebookcheck övergripande betyg
Dell Pro 13 Premium är nästan allt du kan förvänta dig av en mobil bärbar dator för affärsbruk: Den är ganska liten, lätt, ekonomisk, har bra batteritid och levererar fortfarande prestanda på hög nivå. Bortsett från det höga priset finns det praktiskt taget inga riktiga klagomål att få.
Dell Pro 13 Premium PA13250
- 03/14/2025 v8
Christian Hintze
 Total Sustainability Score:
 Genomskinlighet
Valet av enheter som ska granskas görs av vår redaktion. Testprovet gavs till författaren som ett lån av tillverkaren eller återförsäljaren för denna recension. Långivaren hade inget inflytande på denna recension och inte heller fick tillverkaren en kopia av denna recension innan publiceringen. Det fanns ingen skyldighet att publicera denna recension. Vi accepterar aldrig ersättning eller betalning i utbyte mot våra recensioner. Som ett oberoende medieföretag är Notebookcheck inte föremål för auktoritet från tillverkare, återförsäljare eller förlag.
This is how Notebookcheck is testingEvery year, Notebookcheck independently reviews hundreds of laptops and smartphones using standardized procedures to ensure that all results are comparable. We have continuously developed our test methods for around 20 years and set industry standards in the process. In our test labs, high-quality measuring equipment is utilized by experienced technicians and editors. These tests involve a multi-stage validation process. Our complex rating system is based on hundreds of well-founded measurements and benchmarks, which maintains objectivity.

