Notebookcheck Logo

Test: Fulladdad Acer Swift 3 SF313 med Ice Lake-processor (Sammanfattning)

Acer Swift 3 möter Ice Lake! Tack vare Ice Lake har nya Swift 3 mer CPU-prestanda än tidigare och dessutom har det nya chippet bättre 3D. Denna subnotebook är packad i ett modernt hölje med en ljusstark 3:2-skärm och har utmärkt uthållighet. Läs vidare i vår recension för att få reda på om den också har några svagheter.
Acer Swift 3 SF313-52-71Y7 (Swift 3 SF313 Serie)
Processor
Intel Core i7-1065G7 4 x 1.3 - 3.9 GHz, Ice Lake-U
Grafikkort
Intel Iris Plus Graphics G7 (Ice Lake 64 EU) - Shared Memory MB VRAM, Kärna: 1100 MHz, Minne: 1800 MHz, 26.20.100.7463 DCH
Minne
16 GB 
, LPDDR4, fastlött, max 16 GB
Skärm
13.50 tum 3:2, 2256 x 1504 pixlar 201 PPI, BOE, NE135FBM-N41, IPS, glansig: ja
Moderkort
Intel 495 (Ice Lake-U PCH-LP Premium)
Hårddisk
Intel SSD 660p 1TB SSDPEKNW010T8, 1024 GB 
, M.2-2280, NVMe, 910 GB ledigt
Anslutningar
1 USB 2.0, 1 USB 3.0, 1 USB 3.1 Gen2, 1 Thunderbolt, 1 HDMI, 1 DisplayPort, 1 Kensingtonlås, Ljudanslutningar: 3.5 mm hörlursanslutning, 1 Fingeravtrycksläsare
Nätverk
Intel Wi-Fi 6 AX201 (a/b/g/h/n = Wi-Fi 4/ac = Wi-Fi 5/ax = Wi-Fi 6/), Bluetooth 5
Storlek
höjd x bredd x djup (i mm) 16.6 x 302 x 234
Batteri
54.5 Wh, 3545 mAh Litiumjon
Operativsystem
Microsoft Windows 10 Home 64 Bit
Camera
Webbkamera: 720p
Övrigt
Högtalare: Stereo, Tangentbord: Chiclet, 6 rader, Nätadapter, 24 Månader Garanti
Vikt
1.163 kg, Strömförsörjning: 275 g
Pris
1299 EUR
Note: The manufacturer may use components from different suppliers including display panels, drives or memory sticks with similar specifications.


Rating
Date
Model
Weight
Height
Size
Resolution
Best Price
87 %
02/2020
Acer Swift 3 SF313-52-71Y7
i7-1065G7, Iris Plus Graphics G7 (Ice Lake 64 EU)
1.2 kg16.6 mm13.50"2256x1504
88.2 %
10/2019
Lenovo Yoga C940-14IIL
i7-1065G7, Iris Plus Graphics G7 (Ice Lake 64 EU)
1.4 kg14.95 mm14.00"1920x1080
85.7 %
02/2019
Acer Swift 3 SF313-51-59SZ
i5-8250U, UHD Graphics 620
1.3 kg16 mm13.30"1920x1080
88 %
02/2019
Dell XPS 13 9380 2019
i5-8265U, UHD Graphics 620
1.2 kg11.6 mm13.30"3840x2160
86 %
08/2019
Lenovo ThinkBook 13s-20R90071GE
i5-8265U, UHD Graphics 620
1.3 kg15.9 mm13.30"1920x1080
84.5 %
08/2019
HP Envy 13-aq0003ng
i7-8565U, GeForce MX250
1.2 kg14.7 mm13.30"1920x1080
Acer Swift 3 SF313-52-71Y7
320.3 mm 215.6 mm 14.95 mm 1.4 kg309 mm 214 mm 16 mm 1.3 kg307.6 mm 216 mm 15.9 mm 1.3 kg307 mm 211.5 mm 14.7 mm 1.2 kg302 mm 234 mm 16.6 mm 1.2 kg302 mm 199 mm 11.6 mm 1.2 kg297 mm 210 mm 1 mm 5.7 g
Vänster: Ström, HDMI, USB-A 3.0, Thunderbolt 3
Höger: 3.5 mm hörlursanslutning, USB-A 2.0, Status-LED:s, Kensington-lås
Networking
iperf3 transmit AX12
Lenovo Yoga C940-14IIL
Intel Wi-Fi 6 AX201
743 MBit/s +1392%
Lenovo ThinkBook 13s-20R90071GE
Intel Wireless-AC 9560
658 MBit/s +1221%
Acer Swift 3 SF313-51-59SZ
Intel Dual Band Wireless-AC 7265
628 (591min - 673max) MBit/s +1161%
HP Envy 13-aq0003ng
Intel Wireless-AC 9560
623 (439min - 714max) MBit/s +1151%
Dell XPS 13 9380 2019
Atheros/Qualcomm QCA6174
594 (579min - 616max) MBit/s +1093%
Acer Swift 3 SF313-52-71Y7
Intel Wi-Fi 6 AX201
49.8 (3min - 102max) MBit/s
iperf3 receive AX12
Lenovo ThinkBook 13s-20R90071GE
Intel Wireless-AC 9560
648 MBit/s +124%
Lenovo Yoga C940-14IIL
Intel Wi-Fi 6 AX201
635 MBit/s +120%
Acer Swift 3 SF313-51-59SZ
Intel Dual Band Wireless-AC 7265
536 (506min - 552max) MBit/s +85%
HP Envy 13-aq0003ng
Intel Wireless-AC 9560
534 (293min - 602max) MBit/s +85%
Dell XPS 13 9380 2019
Atheros/Qualcomm QCA6174
524 (459min - 576max) MBit/s +81%
Acer Swift 3 SF313-52-71Y7
Intel Wi-Fi 6 AX201
289 (167min - 328max) MBit/s
04080120160200240280320360400440480520560600640680Tooltip
Acer Swift 3 SF313-52-71Y7 Intel Wi-Fi 6 AX201; iperf3 receive AX12; iperf 3.1.3: Ø289 (167-328)
Dell XPS 13 9380 2019 Atheros/Qualcomm QCA6174; iperf3 receive AX12; iperf 3.1.3: Ø523 (459-576)
HP Envy 13-aq0003ng Intel Wireless-AC 9560; iperf3 receive AX12; iperf 3.1.3: Ø533 (293-602)
Acer Swift 3 SF313-52-71Y7 Intel Wi-Fi 6 AX201; iperf3 transmit AX12; iperf 3.1.3: Ø49.6 (3-102)
Dell XPS 13 9380 2019 Atheros/Qualcomm QCA6174; iperf3 transmit AX12; iperf 3.1.3: Ø594 (579-616)
HP Envy 13-aq0003ng Intel Wireless-AC 9560; iperf3 transmit AX12; iperf 3.1.3: Ø623 (439-714)
429
cd/m²
419
cd/m²
439
cd/m²
415
cd/m²
474
cd/m²
445
cd/m²
391
cd/m²
405
cd/m²
415
cd/m²
Distribution av ljusstyrkan
BOE, NE135FBM-N41 tested with X-Rite i1Pro 2
Max: 474 cd/m² (Nits) Medel: 425.8 cd/m² Minimum: 31 cd/m²
Distribution av ljusstyrkan: 82 %
Mitt på batteriet: 466 cd/m²
Kontrast: 1634:1 (Svärta: 0.29 cd/m²)
ΔE Color 2.38 | 0.5-29.43 Ø4.95, calibrated: 2.69
ΔE Greyscale 3.75 | 0.5-98 Ø5.2
100% sRGB (Argyll 1.6.3 3D)
65% AdobeRGB 1998 (Argyll 1.6.3 3D)
71.2% AdobeRGB 1998 (Argyll 2.2.0 3D)
99.8% sRGB (Argyll 2.2.0 3D)
70.1% Display P3 (Argyll 2.2.0 3D)
Gamma: 2.37
Acer Swift 3 SF313-52-71Y7
BOE, NE135FBM-N41, IPS, 2256x1504, 13.5"
Lenovo Yoga C940-14IIL
LP140WF9-SPE2, IPS LED, 1920x1080, 14"
Acer Swift 3 SF313-51-59SZ
BOE NV133FHM-N62, IPS, 1920x1080, 13.3"
Dell XPS 13 9380 2019
ID: AUO 282B B133ZAN Dell: 90NTH, IPS, 3840x2160, 13.3"
Lenovo ThinkBook 13s-20R90071GE
N133HCE-EN2, a-Si IPS LED, 1920x1080, 13.3"
HP Envy 13-aq0003ng
InfoVision M133NVF3 R2, IPS, 1920x1080, 13.3"
Display
-4%
-9%
-8%
-3%
-8%
Display P3 Coverage
70.1
66
-6%
67
-4%
64.7
-8%
67
-4%
64.4
-8%
sRGB Coverage
99.8
97.9
-2%
88
-12%
93.1
-7%
99.1
-1%
91.7
-8%
AdobeRGB 1998 Coverage
71.2
67.3
-5%
64.3
-10%
65.3
-8%
69.2
-3%
65.2
-8%
Response Times
7%
48%
-11%
3984%
630%
Response Time Grey 50% / Grey 80% *
55 ?(25, 30)
49.6 ?(23.6, 26)
10%
44 ?(22, 22)
20%
58 ?(26, 32)
-5%
40.4 ?(22, 18.4)
27%
31 ?(15, 16)
44%
Response Time Black / White *
31 ?(17, 14)
30 ?(16.4, 13.6)
3%
36 ?(21, 15)
-16%
36 ?(20, 16)
-16%
28.8 ?(15.6, 13.2)
7%
24 ?(14, 10)
23%
PWM Frequency
208 ?(90)
500 ?(90)
140%
25000 ?(20)
11919%
4000 ?(90)
1823%
Screen
4%
-40%
-16%
-1%
0%
Brightness middle
474
384
-19%
300
-37%
404
-15%
319
-33%
768
62%
Brightness
426
363
-15%
277
-35%
389
-9%
309
-27%
778
83%
Brightness Distribution
82
90
10%
87
6%
85
4%
92
12%
82
0%
Black Level *
0.29
0.17
41%
0.26
10%
0.37
-28%
0.28
3%
0.48
-66%
Contrast
1634
2259
38%
1154
-29%
1092
-33%
1139
-30%
1600
-2%
Colorchecker dE 2000 *
2.38
3.5
-47%
5.96
-150%
3.72
-56%
2.4
-1%
3.49
-47%
Colorchecker dE 2000 max. *
5.88
5.5
6%
10.6
-80%
7.38
-26%
6.3
-7%
7.41
-26%
Colorchecker dE 2000 calibrated *
2.69
1
63%
2.47
8%
2.06
23%
0.6
78%
2.07
23%
Greyscale dE 2000 *
3.75
4.6
-23%
7.64
-104%
4.44
-18%
3.8
-1%
4.09
-9%
Gamma
2.37 93%
2.32 95%
2.44 90%
2.34 94%
2.16 102%
2.54 87%
CCT
6466 101%
6884 94%
6877 95%
7095 92%
7335 89%
6452 101%
Color Space (Percent of AdobeRGB 1998)
65
62
-5%
57
-12%
60
-8%
63.5
-2%
60
-8%
Color Space (Percent of sRGB)
100
97.7
-2%
88
-12%
93
-7%
99.1
-1%
92
-8%
Total Average (Program / Settings)
2% / 3%
-0% / -19%
-12% / -14%
1327% / 702%
207% / 110%

* ... smaller is better

CalMAN: Gråskala
CalMAN: Gråskala
CalMAN: ColorChecker
CalMAN: Mättnad
CalMAN: Mättnad
CalMAN: Gråskala (Kalibrerad)
CalMAN: ColorChecker (Kalibrerad)
CalMAN: Mättnad (Kalibrerad)

Display Response Times

Display response times show how fast the screen is able to change from one color to the next. Slow response times can lead to afterimages and can cause moving objects to appear blurry (ghosting). Gamers of fast-paced 3D titles should pay special attention to fast response times.
       Response Time Black to White
31 ms ... rise ↗ and fall ↘ combined↗ 17 ms rise
↘ 14 ms fall
The screen shows slow response rates in our tests and will be unsatisfactory for gamers.
In comparison, all tested devices range from 0.1 (minimum) to 240 (maximum) ms. » 82 % of all devices are better.
This means that the measured response time is worse than the average of all tested devices (21.2 ms).
       Response Time 50% Grey to 80% Grey
55 ms ... rise ↗ and fall ↘ combined↗ 25 ms rise
↘ 30 ms fall
The screen shows slow response rates in our tests and will be unsatisfactory for gamers.
In comparison, all tested devices range from 0.165 (minimum) to 636 (maximum) ms. » 91 % of all devices are better.
This means that the measured response time is worse than the average of all tested devices (33.2 ms).

Screen Flickering / PWM (Pulse-Width Modulation)

To dim the screen, some notebooks will simply cycle the backlight on and off in rapid succession - a method called Pulse Width Modulation (PWM) . This cycling frequency should ideally be undetectable to the human eye. If said frequency is too low, users with sensitive eyes may experience strain or headaches or even notice the flickering altogether.
Screen flickering / PWM detected 208 Hz ≤ 90 % brightness setting

The display backlight flickers at 208 Hz (worst case, e.g., utilizing PWM) Flickering detected at a brightness setting of 90 % and below. There should be no flickering or PWM above this brightness setting.

The frequency of 208 Hz is relatively low, so sensitive users will likely notice flickering and experience eyestrain at the stated brightness setting and below.

In comparison: 53 % of all tested devices do not use PWM to dim the display. If PWM was detected, an average of 17373 (minimum: 5 - maximum: 3846000) Hz was measured.

CPU-Z
CPU-Z
CPU-Z
CPU-Z
CPU-Z
CPU-Z
GPU-Z
GPU-Z
DPC-latens
HWiNFO
04080120160200240280320360400440480520560600640680720Tooltip
Acer Swift 3 SF313-52-71Y7 Intel Core i7-1065G7, Intel Core i7-1065G7: Ø553 (544.51-599.88)
Lenovo Yoga C940-14IIL Intel Core i7-1065G7, Intel Core i7-1065G7; Performance Mode: Ø702 (693.71-740.11)
Lenovo Yoga C940-14IIL Intel Core i7-1065G7, Intel Core i7-1065G7: Ø672 (659-720)
Acer Swift 3 SF313-51-59SZ Intel Core i5-8250U, Intel Core i5-8250U: Ø475 (441.38-576.87)
Dell XPS 13 9380 2019 Intel Core i5-8265U, Intel Core i5-8265U: Ø614 (574.66-670.36)
Lenovo ThinkBook 13s-20R90071GE Intel Core i5-8265U, Intel Core i5-8265U: Ø557 (546-655)
HP Envy 13-aq0003ng Intel Core i7-8565U, Intel Core i7-8565U: Ø480 (438.45-513.08)
Cinebench R15
CPU Single 64Bit
Average of class Subnotebook
  (151.5 - 307, n=55, last 2 years)
247 Points +41%
Lenovo Yoga C940-14IIL
Intel Core i7-1065G7
179 Points +2%
Acer Swift 3 SF313-52-71Y7
Intel Core i7-1065G7
175 Points
Average Intel Core i7-1065G7
  (141 - 190, n=35)
174.2 Points 0%
HP Envy 13-aq0003ng
Intel Core i7-8565U
172 Points -2%
Lenovo ThinkBook 13s-20R90071GE
Intel Core i5-8265U
162 Points -7%
Dell XPS 13 9380 2019
Intel Core i5-8265U
148 Points -15%
Acer Swift 3 SF313-51-59SZ
Intel Core i5-8250U
143 Points -18%
CPU Multi 64Bit
Average of class Subnotebook
  (953 - 3345, n=60, last 2 years)
1989 Points +223%
Lenovo Yoga C940-14IIL
Intel Core i7-1065G7
740 (693min - 740max) Points +20%
Lenovo Yoga C940-14IIL
Intel Core i7-1065G7
720 (659min - 720max) Points +17%
Dell XPS 13 9380 2019
Intel Core i5-8265U
666 Points +8%
Lenovo ThinkBook 13s-20R90071GE
Intel Core i5-8265U
655 (546min - 658max) Points +7%
Average Intel Core i7-1065G7
  (288 - 836, n=36)
648 Points +5%
Acer Swift 3 SF313-52-71Y7
Intel Core i7-1065G7
615 Points
Acer Swift 3 SF313-51-59SZ
Intel Core i5-8250U
576 Points -6%
HP Envy 13-aq0003ng
Intel Core i7-8565U
517 Points -16%
Cinebench R11.5
CPU Single 64Bit
Average of class Subnotebook
  (2.75 - 3.33, n=8, last 2 years)
3.06 Points +46%
Average Intel Core i7-1065G7
  (2.09 - 2.17, n=4)
2.12 Points +1%
Acer Swift 3 SF313-52-71Y7
Intel Core i7-1065G7
2.09 Points
Acer Swift 3 SF313-51-59SZ
Intel Core i5-8250U
1.64 Points -22%
CPU Multi 64Bit
Average of class Subnotebook
  (16.5 - 30, n=8, last 2 years)
24.3 Points +281%
Average Intel Core i7-1065G7
  (5.69 - 9.37, n=4)
7.37 Points +16%
Acer Swift 3 SF313-51-59SZ
Intel Core i5-8250U
6.38 Points 0%
Acer Swift 3 SF313-52-71Y7
Intel Core i7-1065G7
6.37 Points
Cinebench R20
CPU (Single Core)
Average of class Subnotebook
  (408 - 790, n=54, last 2 years)
639 Points +45%
Acer Swift 3 SF313-52-71Y7
Intel Core i7-1065G7
441 Points
Average Intel Core i7-1065G7
  (358 - 474, n=31)
438 Points -1%
Lenovo ThinkBook 13s-20R90071GE
Intel Core i5-8265U
386 Points -12%
HP Envy 13-aq0003ng
Intel Core i7-8565U
354 Points -20%
CPU (Multi Core)
Average of class Subnotebook
  (2234 - 8233, n=54, last 2 years)
4543 Points +226%
Average Intel Core i7-1065G7
  (1081 - 2024, n=31)
1510 Points +8%
Acer Swift 3 SF313-52-71Y7
Intel Core i7-1065G7
1392 Points
Lenovo ThinkBook 13s-20R90071GE
Intel Core i5-8265U
1202 Points -14%
HP Envy 13-aq0003ng
Intel Core i7-8565U
1166 Points -16%
JetStream 1.1 - Total Score
Average of class Subnotebook
  (last 2 years)
476 Points +82%
Acer Swift 3 SF313-52-71Y7
Intel Core i7-1065G7
261.6 Points
Average Intel Core i7-1065G7
  (205 - 273, n=16)
256 Points -2%
HP Envy 13-aq0003ng
Intel Core i7-8565U
234.3 Points -10%
Acer Swift 3 SF313-51-59SZ
Intel Core i5-8250U
216.2 Points -17%
Dell XPS 13 9380 2019
Intel Core i5-8265U
207.6 Points -21%
Octane V2 - Total Score
Average of class Subnotebook
  (73281 - 98093, n=30, last 2 years)
86994 Points +137%
Average Intel Core i7-1065G7
  (25166 - 53081, n=17)
37201 Points +1%
Acer Swift 3 SF313-52-71Y7
Intel Core i7-1065G7
36670 Points
HP Envy 13-aq0003ng
Intel Core i7-8565U
33597 Points -8%
Lenovo ThinkBook 13s-20R90071GE
Intel Core i5-8265U
32789 Points -11%
Dell XPS 13 9380 2019
Intel Core i5-8265U
28455 Points -22%
Acer Swift 3 SF313-51-59SZ
Intel Core i5-8250U
28023 Points -24%
Lenovo Yoga C940-14IIL
Intel Core i7-1065G7
25166 Points -31%
Mozilla Kraken 1.1 - Total
Acer Swift 3 SF313-51-59SZ
Intel Core i5-8250U
1322 ms * -36%
Dell XPS 13 9380 2019
Intel Core i5-8265U
1245 ms * -28%
Lenovo ThinkBook 13s-20R90071GE
Intel Core i5-8265U
1233 ms * -27%
HP Envy 13-aq0003ng
Intel Core i7-8565U
1163 ms * -20%
Lenovo Yoga C940-14IIL
Intel Core i7-1065G7
988 ms * -2%
Acer Swift 3 SF313-52-71Y7
Intel Core i7-1065G7
972 ms *
Average Intel Core i7-1065G7
  (788 - 1249, n=30)
912 ms * +6%
Average of class Subnotebook
  (363 - 707, n=60, last 2 years)
526 ms * +46%
Blender - v2.79 BMW27 CPU
Average Intel Core i7-1065G7
  (675 - 1650, n=23)
882 Seconds * -6%
Acer Swift 3 SF313-52-71Y7
Intel Core i7-1065G7
835 Seconds *
Acer Swift 3 SF313-51-59SZ
Intel Core i5-8250U
813 Seconds * +3%
Lenovo ThinkBook 13s-20R90071GE
Intel Core i5-8265U
807 Seconds * +3%
Lenovo Yoga C940-14IIL
Intel Core i7-1065G7
765 Seconds * +8%
Average of class Subnotebook
  (163 - 597, n=58, last 2 years)
327 Seconds * +61%
X264 HD Benchmark 4.0
Pass 1
Average of class Subnotebook
  (250 - 305, n=4, last 2 years)
280 fps
Average Intel Core i7-1065G7
  (175.5 - 194.3, n=2)
184.9 fps
Lenovo Yoga C940-14IIL
Intel Core i7-1065G7
175.5 (174min - 198max) fps
Pass 2
Average of class Subnotebook
  (100.3 - 129.6, n=4, last 2 years)
116.1 fps
Average Intel Core i7-1065G7
  (40.6 - 49.5, n=2)
45.1 fps
Lenovo Yoga C940-14IIL
Intel Core i7-1065G7
40.6 (39min - 42.8max) fps
HWBOT x265 Benchmark v2.2 - 4k Preset
Average of class Subnotebook
  (6.2 - 21.3, n=53, last 2 years)
13 fps +179%
Lenovo Yoga C940-14IIL
Intel Core i7-1065G7
5.1 fps +9%
Acer Swift 3 SF313-52-71Y7
Intel Core i7-1065G7
4.66 fps
Average Intel Core i7-1065G7
  (2.2 - 6.38, n=22)
4.58 fps -2%
Lenovo ThinkBook 13s-20R90071GE
Intel Core i5-8265U
4.5 fps -3%
Acer Swift 3 SF313-51-59SZ
Intel Core i5-8250U
4.49 fps -4%
wPrime 2.10
1024m
Average of class Subnotebook
  (170 - 885, n=6, last 2 years)
411 s *
Acer Swift 3 SF313-51-59SZ
Intel Core i5-8250U
303 s *
Average Intel Core i7-1065G7
  (233 - 354, n=3)
281 s *
32m
Average of class Subnotebook
  (3.89 - 21, n=6, last 2 years)
9.58 s *
Average Intel Core i7-1065G7
  (6.97 - 9.19, n=3)
7.95 s *
Acer Swift 3 SF313-51-59SZ
Intel Core i5-8250U
7.917 s *
Geekbench 5.0
5.0 Multi-Core
Average of class Subnotebook
  (7692 - 11684, n=7, last 2 years)
9085 Points +108%
Lenovo Yoga C940-14IIL
Intel Core i7-1065G7
4736 Points +8%
Average Intel Core i7-1065G7
  (3375 - 4839, n=6)
4436 Points +2%
Acer Swift 3 SF313-52-71Y7
Intel Core i7-1065G7
4368 Points
5.0 Single-Core
Average of class Subnotebook
  (1500 - 1828, n=7, last 2 years)
1674 Points +29%
Lenovo Yoga C940-14IIL
Intel Core i7-1065G7
1328 Points +2%
Acer Swift 3 SF313-52-71Y7
Intel Core i7-1065G7
1301 Points
Average Intel Core i7-1065G7
  (1184 - 1334, n=6)
1295 Points 0%
Geekbench 5.5
Multi-Core
Average of class Subnotebook
  (5688 - 14608, n=54, last 2 years)
10138 Points +132%
Acer Swift 3 SF313-52-71Y7
Intel Core i7-1065G7
4374 Points
Average Intel Core i7-1065G7
  (2464 - 4855, n=18)
4215 Points -4%
Single-Core
Average of class Subnotebook
  (1426 - 2350, n=54, last 2 years)
1768 Points +34%
Acer Swift 3 SF313-52-71Y7
Intel Core i7-1065G7
1316 Points
Average Intel Core i7-1065G7
  (948 - 1348, n=18)
1274 Points -3%

* ... smaller is better

Cinebench R11.5
Cinebench R11.5
Cinebench R15
Cinebench R15
Cinebench R20
Cinebench R20
Jetstream 1.1
Jetstream 1.1
Octane V2
Octane V2
Mozilla Kraken 1.1
Mozilla Kraken 1.1
Cinebench R11.5 CPU Single 32Bit
1.84 Points
Cinebench R11.5 CPU Multi 32Bit
5.75 Points
Cinebench R11.5 OpenGL 32Bit
45.43 fps
Cinebench R11.5 CPU Single 64Bit
2.09 Points
Cinebench R11.5 CPU Multi 64Bit
6.37 Points
Cinebench R11.5 OpenGL 64Bit
47.49 fps
Cinebench R15 CPU Single 64Bit
175 Points
Cinebench R15 CPU Multi 64Bit
615 Points
Cinebench R15 Ref. Match 64Bit
97.8 %
Cinebench R15 OpenGL 64Bit
64.6 fps
Hjälp
PCMark 10
Score
Average of class Subnotebook
  (4528 - 7646, n=47, last 2 years)
6269 Points +58%
Lenovo Yoga C940-14IIL
Iris Plus Graphics G7 (Ice Lake 64 EU), i7-1065G7, Samsung SSD PM981 MZVLB512HAJQ
4583 Points +15%
Average Intel Core i7-1065G7, Intel Iris Plus Graphics G7 (Ice Lake 64 EU)
  (3878 - 4679, n=20)
4356 Points +10%
Acer Swift 3 SF313-52-71Y7
Iris Plus Graphics G7 (Ice Lake 64 EU), i7-1065G7, Intel SSD 660p 1TB SSDPEKNW010T8
3975 Points
HP Envy 13-aq0003ng
GeForce MX250, i7-8565U, Toshiba KBG30ZMV512G
3882 Points -2%
Dell XPS 13 9380 2019
UHD Graphics 620, i5-8265U, SK hynix PC401 HFS256GD9TNG
3835 Points -4%
Acer Swift 3 SF313-51-59SZ
UHD Graphics 620, i5-8250U, Kingston RBUSNS8154P3256GJ1
3668 Points -8%
Lenovo ThinkBook 13s-20R90071GE
UHD Graphics 620, i5-8265U, SK hynix BC501 HFM512GDHTNG-8310A
3630 Points -9%
Essentials
Average of class Subnotebook
  (9143 - 11331, n=47, last 2 years)
10479 Points +26%
Lenovo Yoga C940-14IIL
Iris Plus Graphics G7 (Ice Lake 64 EU), i7-1065G7, Samsung SSD PM981 MZVLB512HAJQ
9678 Points +17%
Average Intel Core i7-1065G7, Intel Iris Plus Graphics G7 (Ice Lake 64 EU)
  (8302 - 9902, n=20)
9123 Points +10%
Acer Swift 3 SF313-52-71Y7
Iris Plus Graphics G7 (Ice Lake 64 EU), i7-1065G7, Intel SSD 660p 1TB SSDPEKNW010T8
8302 Points
Dell XPS 13 9380 2019
UHD Graphics 620, i5-8265U, SK hynix PC401 HFS256GD9TNG
8033 Points -3%
Acer Swift 3 SF313-51-59SZ
UHD Graphics 620, i5-8250U, Kingston RBUSNS8154P3256GJ1
7574 Points -9%
HP Envy 13-aq0003ng
GeForce MX250, i7-8565U, Toshiba KBG30ZMV512G
7465 Points -10%
Lenovo ThinkBook 13s-20R90071GE
UHD Graphics 620, i5-8265U, SK hynix BC501 HFM512GDHTNG-8310A
7278 Points -12%
Productivity
Average of class Subnotebook
  (6440 - 10449, n=47, last 2 years)
8344 Points +32%
Lenovo Yoga C940-14IIL
Iris Plus Graphics G7 (Ice Lake 64 EU), i7-1065G7, Samsung SSD PM981 MZVLB512HAJQ
6924 Points +10%
HP Envy 13-aq0003ng
GeForce MX250, i7-8565U, Toshiba KBG30ZMV512G
6789 Points +8%
Average Intel Core i7-1065G7, Intel Iris Plus Graphics G7 (Ice Lake 64 EU)
  (5462 - 7379, n=20)
6555 Points +4%
Acer Swift 3 SF313-52-71Y7
Iris Plus Graphics G7 (Ice Lake 64 EU), i7-1065G7, Intel SSD 660p 1TB SSDPEKNW010T8
6301 Points
Dell XPS 13 9380 2019
UHD Graphics 620, i5-8265U, SK hynix PC401 HFS256GD9TNG
6101 Points -3%
Acer Swift 3 SF313-51-59SZ
UHD Graphics 620, i5-8250U, Kingston RBUSNS8154P3256GJ1
6090 Points -3%
Lenovo ThinkBook 13s-20R90071GE
UHD Graphics 620, i5-8265U, SK hynix BC501 HFM512GDHTNG-8310A
5836 Points -7%
Digital Content Creation
Average of class Subnotebook
  (4220 - 10983, n=47, last 2 years)
7725 Points +137%
Lenovo Yoga C940-14IIL
Iris Plus Graphics G7 (Ice Lake 64 EU), i7-1065G7, Samsung SSD PM981 MZVLB512HAJQ
3900 Points +20%
Average Intel Core i7-1065G7, Intel Iris Plus Graphics G7 (Ice Lake 64 EU)
  (3260 - 4424, n=20)
3773 Points +16%
Acer Swift 3 SF313-52-71Y7
Iris Plus Graphics G7 (Ice Lake 64 EU), i7-1065G7, Intel SSD 660p 1TB SSDPEKNW010T8
3260 Points
HP Envy 13-aq0003ng
GeForce MX250, i7-8565U, Toshiba KBG30ZMV512G
3133 Points -4%
Dell XPS 13 9380 2019
UHD Graphics 620, i5-8265U, SK hynix PC401 HFS256GD9TNG
3125 Points -4%
Lenovo ThinkBook 13s-20R90071GE
UHD Graphics 620, i5-8265U, SK hynix BC501 HFM512GDHTNG-8310A
3058 Points -6%
Acer Swift 3 SF313-51-59SZ
UHD Graphics 620, i5-8250U, Kingston RBUSNS8154P3256GJ1
2905 Points -11%
PCMark 8
Home Score Accelerated v2
Average of class Subnotebook
  (4730 - 5076, n=2, last 2 years)
4903 Points +30%
Lenovo Yoga C940-14IIL
Iris Plus Graphics G7 (Ice Lake 64 EU), i7-1065G7, Samsung SSD PM981 MZVLB512HAJQ
4003 Points +6%
Acer Swift 3 SF313-51-59SZ
UHD Graphics 620, i5-8250U, Kingston RBUSNS8154P3256GJ1
3773 Points 0%
Acer Swift 3 SF313-52-71Y7
Iris Plus Graphics G7 (Ice Lake 64 EU), i7-1065G7, Intel SSD 660p 1TB SSDPEKNW010T8
3759 Points
Average Intel Core i7-1065G7, Intel Iris Plus Graphics G7 (Ice Lake 64 EU)
  (3305 - 4275, n=17)
3734 Points -1%
Dell XPS 13 9380 2019
UHD Graphics 620, i5-8265U, SK hynix PC401 HFS256GD9TNG
3519 Points -6%
Lenovo ThinkBook 13s-20R90071GE
UHD Graphics 620, i5-8265U, SK hynix BC501 HFM512GDHTNG-8310A
3467 Points -8%
HP Envy 13-aq0003ng
GeForce MX250, i7-8565U, Toshiba KBG30ZMV512G
3331 Points -11%
Work Score Accelerated v2
Lenovo Yoga C940-14IIL
Iris Plus Graphics G7 (Ice Lake 64 EU), i7-1065G7, Samsung SSD PM981 MZVLB512HAJQ
5158 Points +7%
HP Envy 13-aq0003ng
GeForce MX250, i7-8565U, Toshiba KBG30ZMV512G
4922 Points +2%
Acer Swift 3 SF313-51-59SZ
UHD Graphics 620, i5-8250U, Kingston RBUSNS8154P3256GJ1
4845 Points +1%
Lenovo ThinkBook 13s-20R90071GE
UHD Graphics 620, i5-8265U, SK hynix BC501 HFM512GDHTNG-8310A
4841 Points +1%
Acer Swift 3 SF313-52-71Y7
Iris Plus Graphics G7 (Ice Lake 64 EU), i7-1065G7, Intel SSD 660p 1TB SSDPEKNW010T8
4802 Points
Average Intel Core i7-1065G7, Intel Iris Plus Graphics G7 (Ice Lake 64 EU)
  (2460 - 5291, n=17)
4309 Points -10%
Dell XPS 13 9380 2019
UHD Graphics 620, i5-8265U, SK hynix PC401 HFS256GD9TNG
4302 Points -10%
Average of class Subnotebook
  (2972 - 5271, n=2, last 2 years)
4122 Points -14%
PCMark 8 Home Score Accelerated v2
3759 poäng
PCMark 8 Creative Score Accelerated v2
5979 poäng
PCMark 8 Work Score Accelerated v2
4802 poäng
PCMark 10 Score
3975 poäng
Hjälp
AS SSD
AS SSD
CDM 3
CDM 3
CDM 5
CDM 5
CDM 6
CDM 6
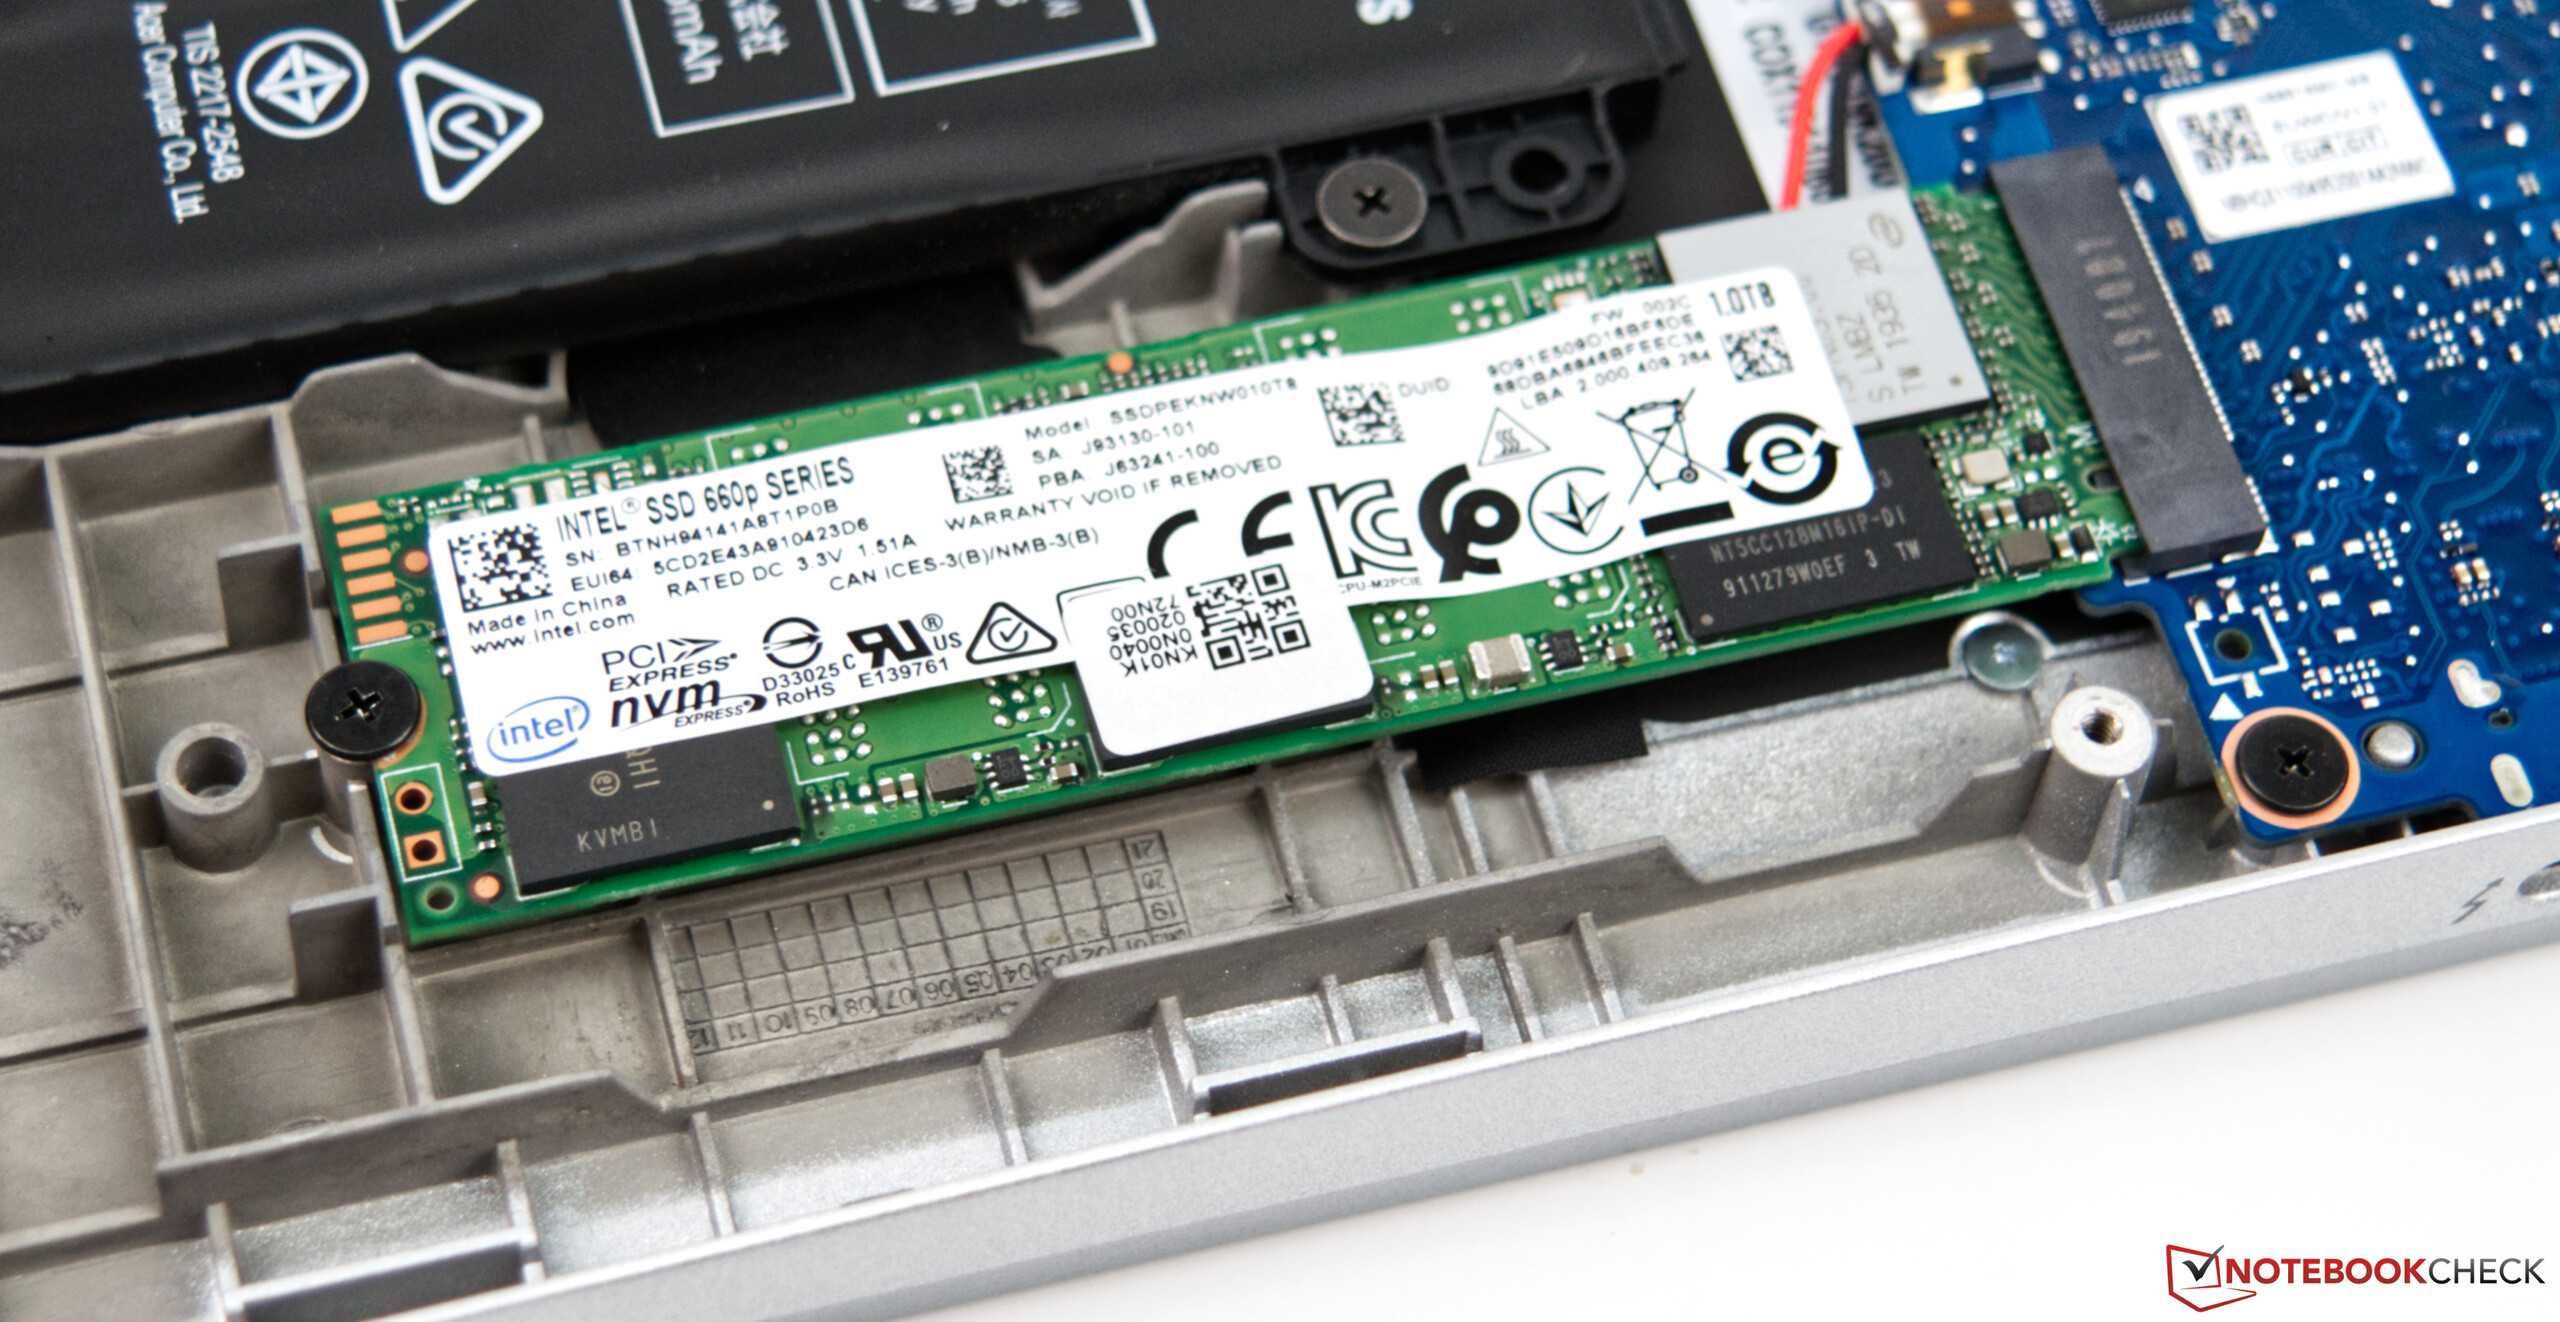
Acer Swift 3 SF313-52-71Y7
Intel SSD 660p 1TB SSDPEKNW010T8
Lenovo Yoga C940-14IIL
Samsung SSD PM981 MZVLB512HAJQ
Acer Swift 3 SF313-51-59SZ
Kingston RBUSNS8154P3256GJ1
Dell XPS 13 9380 2019
SK hynix PC401 HFS256GD9TNG
Lenovo ThinkBook 13s-20R90071GE
SK hynix BC501 HFM512GDHTNG-8310A
HP Envy 13-aq0003ng
Toshiba KBG30ZMV512G
Average Intel SSD 660p 1TB SSDPEKNW010T8
 
CrystalDiskMark 5.2 / 6
8%
-7%
-36%
-34%
-42%
-11%
Write 4K
187.4
128.4
-31%
113.7
-39%
84.6
-55%
89.3
-52%
106.2
-43%
144.5 ?(103.2 - 214, n=17)
-23%
Read 4K
63.8
46.37
-27%
40.6
-36%
38.52
-40%
37.4
-41%
44.89
-30%
54.1 ?(49.8 - 63.8, n=17)
-15%
Write Seq
1776
1863
5%
845
-52%
557
-69%
608
-66%
639
-64%
1445 ?(1264 - 1776, n=16)
-19%
Read Seq
1693
2340
38%
1137
-33%
1393
-18%
1019
-40%
849
-50%
1446 ?(1410 - 1693, n=16)
-15%
Write 4K Q32T1
492.3
451.1
-8%
868
76%
339.5
-31%
487.9
-1%
217.4
-56%
427 ?(402 - 644, n=17)
-13%
Read 4K Q32T1
539
415.3
-23%
1580
193%
255.4
-53%
284.8
-47%
322.1
-40%
456 ?(329 - 600, n=17)
-15%
Write Seq Q32T1
1770
2985
69%
345.6
-80%
558
-68%
872
-51%
865
-51%
Read Seq Q32T1
1715
2565
50%
411.7
-76%
2541
48%
1635
-5%
1630
-5%
Write 4K Q8T8
899
451.4
-50%
647
-28%
387.3
-57%
880 ?(860 - 899, n=2)
-2%
Read 4K Q8T8
630
1004
59%
685
9%
757
20%
AS SSD
35%
-26%
-33%
-18%
-72%
-14%
Seq Read
1703
2525
48%
1403
-18%
2035
19%
1264
-26%
1295
-24%
1456 ?(1038 - 1778, n=16)
-15%
Seq Write
1373
1253
-9%
836
-39%
658
-52%
518
-62%
593
-57%
4K Read
56.8
59.1
4%
42.19
-26%
39.74
-30%
40.31
-29%
45.58
-20%
48.7 ?(25.6 - 57.8, n=16)
-14%
4K Write
164.4
134.1
-18%
99.7
-39%
105.7
-36%
119.1
-28%
118.8
-28%
131.6 ?(77.5 - 167.9, n=16)
-20%
4K-64 Read
584
1010
73%
738
26%
461
-21%
772
32%
604
3%
4K-64 Write
783
1461
87%
606
-23%
300.1
-62%
672
-14%
272.4
-65%
Access Time Read *
0.044
0.052
-18%
0.074
-68%
0.061
-39%
0.046
-5%
0.147
-234%
0.07236 ?(0.036 - 0.165, n=14)
-64%
Access Time Write *
0.038
0.029
24%
0.045
-18%
0.051
-34%
0.031
18%
0.168
-342%
0.07731 ?(0.038 - 0.128, n=16)
-103%
Score Read
811
1322
63%
921
14%
704
-13%
939
16%
779
-4%
Score Write
1085
1721
59%
789
-27%
471
-57%
843
-22%
450
-59%
Score Total
2313
3670
59%
2163
-6%
1479
-36%
2234
-3%
1607
-31%
Copy ISO MB/s
1401
2016
44%
586
-58%
893
-36%
943
-33%
593
-58%
Copy Program MB/s
480.4
542
13%
315.2
-34%
287.9
-40%
292.2
-39%
277.6
-42%
Copy Game MB/s
820
1278
56%
478.5
-42%
618
-25%
374.1
-54%
452.7
-45%
Total Average (Program / Settings)
22% / 24%
-17% / -18%
-35% / -34%
-26% / -25%
-57% / -61%
-13% / -13%

* ... smaller is better

Intel SSD 660p 1TB SSDPEKNW010T8
Sequential Read: 1544 MB/s
Sequential Write: 1638 MB/s
512K Read: 1103 MB/s
512K Write: 1602 MB/s
4K Read: 63.3 MB/s
4K Write: 189.6 MB/s
4K QD32 Read: 551 MB/s
4K QD32 Write: 502 MB/s
3DMark 11 - 1280x720 Performance GPU
Average of class Subnotebook
  (4823 - 16904, n=50, last 2 years)
9466 Points +129%
Lenovo Yoga C940-14IIL
Intel Iris Plus Graphics G7 (Ice Lake 64 EU), Intel Core i7-1065G7
4613 Points +11%
Acer Swift 3 SF313-52-71Y7
Intel Iris Plus Graphics G7 (Ice Lake 64 EU), Intel Core i7-1065G7
4138 Points
Average Intel Iris Plus Graphics G7 (Ice Lake 64 EU)
  (2112 - 4630, n=28)
3996 Points -3%
HP Envy 13-aq0003ng
NVIDIA GeForce MX250, Intel Core i7-8565U
3622 Points -12%
Acer Swift 3 SF313-51-59SZ
Intel UHD Graphics 620, Intel Core i5-8250U
1818 Points -56%
Dell XPS 13 9380 2019
Intel UHD Graphics 620, Intel Core i5-8265U
1815 Points -56%
Lenovo ThinkBook 13s-20R90071GE
Intel UHD Graphics 620, Intel Core i5-8265U
1759 Points -57%
3DMark
1280x720 Cloud Gate Standard Graphics
Average of class Subnotebook
  (19200 - 58319, n=26, last 2 years)
34332 Points +105%
HP Envy 13-aq0003ng
NVIDIA GeForce MX250, Intel Core i7-8565U
20618 Points +23%
Acer Swift 3 SF313-52-71Y7
Intel Iris Plus Graphics G7 (Ice Lake 64 EU), Intel Core i7-1065G7
16731 Points
Average Intel Iris Plus Graphics G7 (Ice Lake 64 EU)
  (7024 - 18881, n=24)
15496 Points -7%
Dell XPS 13 9380 2019
Intel UHD Graphics 620, Intel Core i5-8265U
10126 Points -39%
Acer Swift 3 SF313-51-59SZ
Intel UHD Graphics 620, Intel Core i5-8250U
9974 Points -40%
Lenovo ThinkBook 13s-20R90071GE
Intel UHD Graphics 620, Intel Core i5-8265U
9058 Points -46%
1920x1080 Fire Strike Graphics
Average of class Subnotebook
  (3006 - 12349, n=54, last 2 years)
6854 Points +150%
Lenovo Yoga C940-14IIL
Intel Iris Plus Graphics G7 (Ice Lake 64 EU), Intel Core i7-1065G7
3156 Points +15%
HP Envy 13-aq0003ng
NVIDIA GeForce MX250, Intel Core i7-8565U
2988 Points +9%
Acer Swift 3 SF313-52-71Y7
Intel Iris Plus Graphics G7 (Ice Lake 64 EU), Intel Core i7-1065G7
2743 Points
Average Intel Iris Plus Graphics G7 (Ice Lake 64 EU)
  (1418 - 3156, n=27)
2594 Points -5%
Acer Swift 3 SF313-51-59SZ
Intel UHD Graphics 620, Intel Core i5-8250U
1225 Points -55%
Lenovo ThinkBook 13s-20R90071GE
Intel UHD Graphics 620, Intel Core i5-8265U
1105 Points -60%
1280x720 Sky Diver Graphics
Average of class Subnotebook
  (last 2 years)
16342 Points +86%
HP Envy 13-aq0003ng
NVIDIA GeForce MX250, Intel Core i7-8565U
9265 Points +6%
Acer Swift 3 SF313-52-71Y7
Intel Iris Plus Graphics G7 (Ice Lake 64 EU), Intel Core i7-1065G7
8774 Points
Average Intel Iris Plus Graphics G7 (Ice Lake 64 EU)
  (4558 - 9444, n=7)
7699 Points -12%
Acer Swift 3 SF313-51-59SZ
Intel UHD Graphics 620, Intel Core i5-8250U
4340 Points -51%
3DMark 11 Performance
4308 poäng
3DMark Ice Storm Standard Score
63796 poäng
3DMark Cloud Gate Standard Score
11959 poäng
3DMark Fire Strike Score
2508 poäng
3DMark Fire Strike Extreme Score
1252 poäng
Hjälp
låg med. hög ultra
BioShock Infinite (2013) 91.6 58.6 50.9 19.4
Dota 2 Reborn (2015) 82.7 52.7 32.8 30
Rise of the Tomb Raider (2016) 38.9 23.4 13.6
Rocket League (2017) 100 52.8 39.6
X-Plane 11.11 (2018) 28.2 12.5 12.1
Borderlands 3 (2019) 26.7 11.7 7.73

Ljudnivå

Låg belastning
30.3 / 30.3 / 30.3 dB(A)
Hög belastning
31.7 / 32.7 dB(A)
  red to green bar
 
 
30 dB
tyst
40 dB(A)
hörbar
50 dB(A)
högt ljud
 
min: dark, med: mid, max: light   Audix TM1, Arta (15 cm avstånd)   environment noise: 30.3 dB(A)
Acer Swift 3 SF313-52-71Y7
Iris Plus Graphics G7 (Ice Lake 64 EU), i7-1065G7, Intel SSD 660p 1TB SSDPEKNW010T8
Lenovo Yoga C940-14IIL
Iris Plus Graphics G7 (Ice Lake 64 EU), i7-1065G7, Samsung SSD PM981 MZVLB512HAJQ
Acer Swift 3 SF313-51-59SZ
UHD Graphics 620, i5-8250U, Kingston RBUSNS8154P3256GJ1
Dell XPS 13 9380 2019
UHD Graphics 620, i5-8265U, SK hynix PC401 HFS256GD9TNG
Lenovo ThinkBook 13s-20R90071GE
UHD Graphics 620, i5-8265U, SK hynix BC501 HFM512GDHTNG-8310A
HP Envy 13-aq0003ng
GeForce MX250, i7-8565U, Toshiba KBG30ZMV512G
Noise
1%
-2%
-3%
1%
-3%
off / environment *
30.3
29.3
3%
30.4
-0%
30.4
-0%
28.8
5%
30
1%
Idle Minimum *
30.3
29.3
3%
30.4
-0%
30.4
-0%
28.8
5%
30
1%
Idle Average *
30.3
29.3
3%
30.4
-0%
30.4
-0%
28.8
5%
30
1%
Idle Maximum *
30.3
29.3
3%
30.7
-1%
30.4
-0%
29.7
2%
30
1%
Load Average *
31.7
33.3
-5%
33.7
-6%
31.7
-0%
30.7
3%
Load Maximum *
32.7
33.3
-2%
34
-4%
38.1
-17%
38.3
-17%
39.5
-21%

* ... smaller is better

dB(A) 0102030405060708090Deep BassMiddle BassHigh BassLower RangeMidsHigher MidsLower HighsMid HighsUpper HighsSuper Highs2031.232.230.334.531.22532.631.732.933.732.63131.23132.333.331.24029.1292931.629.1503228.430.430326327.828.226.926.727.88025.325.724.826.225.310025.724.325.824.725.712524.523.224.124.624.516023.922.923.624.223.92002322.423.222.52325021.621.42120.621.631521.721.521.220.921.740020.120.220.119.920.150020.319.719.419.320.363019.719.419.218.519.780019.718.818.818.519.7100020.519.518.417.820.5125020.31918.117.820.3160020.318.817.717.820.3200021.119.417.817.521.1250024.723.917.717.624.7315021.618.617.817.821.6400018.617.917.917.918.6500018.41817.91818.4630018.318.118.11818.3800018.3181818.118.31000018.318.118.218.218.31250018.21818.118.218.21600018.217.918.11818.2SPL32.731.730.430.332.7N1.71.61.41.41.7median 20.3median 19.4median 18.2median 18.2median 20.3Delta1.71.91.11.21.7hearing rangehide median Fan NoiseAcer Swift 3 SF313-52-71Y7
Stress-test: Endast Prime95
Stress-test: Endast FurMark
Stress-test: FurMark+Prime95
Hög belastning
 32 °C33.5 °C30.1 °C 
 30.6 °C31.9 °C26 °C 
 25.8 °C26.1 °C25 °C 
Max: 33.5 °C
Medel: 29 °C
32.4 °C34.8 °C35.6 °C
26.3 °C30.6 °C29.4 °C
25.5 °C26.3 °C27.1 °C
Max: 35.6 °C
Medel: 29.8 °C
Strömförsörjning (max.)  34.8 °C | Rumstemperatur 22.7 °C | FIRT 550-Pocket
(+) The average temperature for the upper side under maximal load is 29 °C / 84 F, compared to the average of 30.8 °C / 87 F for the devices in the class Subnotebook.
(+) The maximum temperature on the upper side is 33.5 °C / 92 F, compared to the average of 35.9 °C / 97 F, ranging from 21.4 to 59 °C for the class Subnotebook.
(+) The bottom heats up to a maximum of 35.6 °C / 96 F, compared to the average of 39.4 °C / 103 F
(+) In idle usage, the average temperature for the upper side is 23.9 °C / 75 F, compared to the device average of 30.8 °C / 87 F.
(+) The palmrests and touchpad are cooler than skin temperature with a maximum of 26.1 °C / 79 F and are therefore cool to the touch.
(+) The average temperature of the palmrest area of similar devices was 28.3 °C / 82.9 F (+2.2 °C / 3.9 F).
Acer Swift 3 SF313-52-71Y7
Iris Plus Graphics G7 (Ice Lake 64 EU), i7-1065G7, Intel SSD 660p 1TB SSDPEKNW010T8
Lenovo Yoga C940-14IIL
Iris Plus Graphics G7 (Ice Lake 64 EU), i7-1065G7, Samsung SSD PM981 MZVLB512HAJQ
Acer Swift 3 SF313-51-59SZ
UHD Graphics 620, i5-8250U, Kingston RBUSNS8154P3256GJ1
Dell XPS 13 9380 2019
UHD Graphics 620, i5-8265U, SK hynix PC401 HFS256GD9TNG
Lenovo ThinkBook 13s-20R90071GE
UHD Graphics 620, i5-8265U, SK hynix BC501 HFM512GDHTNG-8310A
HP Envy 13-aq0003ng
GeForce MX250, i7-8565U, Toshiba KBG30ZMV512G
Heat
-11%
-12%
-22%
-10%
-20%
Maximum Upper Side *
33.5
41
-22%
40.4
-21%
47.2
-41%
40.3
-20%
41
-22%
Maximum Bottom *
35.6
44.6
-25%
42.1
-18%
43.3
-22%
44.6
-25%
42.9
-21%
Idle Upper Side *
24.9
24.4
2%
26.2
-5%
27.6
-11%
24.3
2%
29.3
-18%
Idle Bottom *
25.4
25
2%
26
-2%
28.6
-13%
24.4
4%
30.2
-19%

* ... smaller is better

dB(A) 0102030405060708090Deep BassMiddle BassHigh BassLower RangeMidsHigher MidsLower HighsMid HighsUpper HighsSuper Highs203434.5342535.833.735.83133.633.333.64037.331.637.35035.33035.36327.726.727.78027.226.227.210024.924.724.912528.224.628.216028.724.228.720031.222.531.225040.720.640.731547.120.947.140051.119.951.150055.619.355.663057.618.557.68006018.560100054.317.854.3125059.917.859.9160062.917.862.9200065.117.565.1250065.317.665.3315062.917.862.9400065.117.965.1500065.21865.2630061.31861.3800065.618.165.61000069.318.269.31250071.718.271.716000701870SPL76.230.376.2N351.435median 60median 18.2median 60Delta10.21.210.233.733.526.126.628.831.629.829.924.630.222.440.121.841.82351.12353.52258.822.963.322.767.120.56920.370.919.168.518.869.11868.518.164.817.36616.966.216.663.416.464.916.162.816.162.516561652.315.947.515.746.815.546.815.341.829.376.81.240.5median 17.3median 63.32.17.7hearing rangehide median Pink NoiseAcer Swift 3 SF313-52-71Y7Lenovo Yoga C940-14IIL
Frequency diagram (checkboxes can be checked and unchecked to compare devices)
Acer Swift 3 SF313-52-71Y7 audio analysis

(-) | not very loud speakers (71.7 dB)
Bass 100 - 315 Hz
(-) | nearly no bass - on average 26.5% lower than median
(±) | linearity of bass is average (9.8% delta to prev. frequency)
Mids 400 - 2000 Hz
(+) | balanced mids - only 3.7% away from median
(±) | linearity of mids is average (8.8% delta to prev. frequency)
Highs 2 - 16 kHz
(±) | higher highs - on average 5% higher than median
(+) | highs are linear (5.7% delta to prev. frequency)
Overall 100 - 16.000 Hz
(±) | linearity of overall sound is average (27.4% difference to median)
Compared to same class
» 87% of all tested devices in this class were better, 3% similar, 10% worse
» The best had a delta of 5%, average was 19%, worst was 53%
Compared to all devices tested
» 81% of all tested devices were better, 4% similar, 15% worse
» The best had a delta of 4%, average was 25%, worst was 134%

Lenovo Yoga C940-14IIL audio analysis

(±) | speaker loudness is average but good (76.8 dB)
Bass 100 - 315 Hz
(±) | reduced bass - on average 6% lower than median
(±) | linearity of bass is average (9.9% delta to prev. frequency)
Mids 400 - 2000 Hz
(+) | balanced mids - only 3.9% away from median
(+) | mids are linear (3.6% delta to prev. frequency)
Highs 2 - 16 kHz
(±) | reduced highs - on average 7.6% lower than median
(+) | highs are linear (6.1% delta to prev. frequency)
Overall 100 - 16.000 Hz
(±) | linearity of overall sound is average (16.9% difference to median)
Compared to same class
» 27% of all tested devices in this class were better, 7% similar, 65% worse
» The best had a delta of 6%, average was 21%, worst was 57%
Compared to all devices tested
» 26% of all tested devices were better, 7% similar, 67% worse
» The best had a delta of 4%, average was 25%, worst was 134%

Strömförbrukning
Av/Standbydarklight 0.4 / 0.4 Watt
Låg belastningdarkmidlight 1.8 / 4.6 / 6.1 Watt
Hög belastning midlight 27.4 / 27 Watt
 color bar
Förklaring: min: dark, med: mid, max: light        Metrahit Energy
Currently we use the Metrahit Energy, a professional single phase power quality and energy measurement digital multimeter, for our measurements. Find out more about it here. All of our test methods can be found here.
Acer Swift 3 SF313-52-71Y7
i7-1065G7, Iris Plus Graphics G7 (Ice Lake 64 EU), Intel SSD 660p 1TB SSDPEKNW010T8, IPS, 2256x1504, 13.5"
Lenovo Yoga C940-14IIL
i7-1065G7, Iris Plus Graphics G7 (Ice Lake 64 EU), Samsung SSD PM981 MZVLB512HAJQ, IPS LED, 1920x1080, 14"
Acer Swift 3 SF313-51-59SZ
i5-8250U, UHD Graphics 620, Kingston RBUSNS8154P3256GJ1, IPS, 1920x1080, 13.3"
Dell XPS 13 9380 2019
i5-8265U, UHD Graphics 620, SK hynix PC401 HFS256GD9TNG, IPS, 3840x2160, 13.3"
Lenovo ThinkBook 13s-20R90071GE
i5-8265U, UHD Graphics 620, SK hynix BC501 HFM512GDHTNG-8310A, a-Si IPS LED, 1920x1080, 13.3"
HP Envy 13-aq0003ng
i7-8565U, GeForce MX250, Toshiba KBG30ZMV512G, IPS, 1920x1080, 13.3"
Average Intel Iris Plus Graphics G7 (Ice Lake 64 EU)
 
Average of class Subnotebook
 
Power Consumption
-77%
-48%
-88%
-42%
-98%
-71%
-104%
Idle Minimum *
1.8
3.2
-78%
3.4
-89%
4.8
-167%
3.1
-72%
3.9
-117%
3.91 ?(1.8 - 6.9, n=26)
-117%
Idle Average *
4.6
7
-52%
5.8
-26%
8.6
-87%
5.87
-28%
7.8
-70%
7.33 ?(4.6 - 11.5, n=26)
-59%
Idle Maximum *
6.1
8.9
-46%
8.8
-44%
10.4
-70%
6.6
-8%
10.8
-77%
9.16 ?(6.1 - 12, n=26)
-50%
Load Average *
27.4
47.6
-74%
34
-24%
37.9
-38%
35.3
-29%
53
-93%
39.2 ?(25.7 - 53.3, n=26)
-43%
Load Maximum *
27
63.1
-134%
42
-56%
48.5
-80%
46.5
-72%
62.7
-132%
49.8 ?(27 - 65.2, n=26)
-84%

* ... smaller is better

Batteritid
Låg belastning (utan WLAN, min. ljusstyrka)
21tim 21min
WiFi Websurfing (Edge: 44.18362.449.0)
10tim 20min
WiFi Websurfing max. Brightness (Edge: 44.18362.449.0)
7tim 48min
Big Buck Bunny H.264 1080p
10tim 27min
Hög belastning (maximal ljusstyrka)
2tim 19min
Högsta batteritid
Högsta batteritid
Lägsta batteritid
Lägsta batteritid
WiFi batteritid
WiFi batteritid
WiFi batteritid (max. ljusstyrka)
H.264 batteritid
H.264 batteritid
Laddningstid
Laddningstid
Acer Swift 3 SF313-52-71Y7
i7-1065G7, Iris Plus Graphics G7 (Ice Lake 64 EU), 54.5 Wh
Lenovo Yoga C940-14IIL
i7-1065G7, Iris Plus Graphics G7 (Ice Lake 64 EU), 60 Wh
Acer Swift 3 SF313-51-59SZ
i5-8250U, UHD Graphics 620, 48.8 Wh
Dell XPS 13 9380 2019
i5-8265U, UHD Graphics 620, 52 Wh
Lenovo ThinkBook 13s-20R90071GE
i5-8265U, UHD Graphics 620, 45 Wh
HP Envy 13-aq0003ng
i7-8565U, GeForce MX250, 53.2 Wh
Average of class Subnotebook
 
Battery Runtime
-8%
-11%
-13%
-16%
-17%
12%
Reader / Idle
1281
1117
-13%
1032
-19%
H.264
627
793
26%
495
-21%
647
3%
WiFi v1.3
620
636
3%
573
-8%
498
-20%
545
-12%
512
-17%
Load
139
64
-54%
137
-1%
141
1%
83
-40%

För

+ Modern tunn design
+ Robust bas och skapliga materialval
+ Ljusstark IPS-skärm med 3:2-förhållande
+ Skaplig färgrymdstäckning
+ Fingeravtrycksläsare
+ USB-C med stöd för DisplayPort
+ Bakgrundsbelyst tangentbord
+ Snabb NVMe SSD på 1 TB
+ Bra systemprestanda
+ Väldigt tyst vid belastning
+ Lång batteritid

Emot

- RAM går inte att uppgradera
- LTE finns inte längre som tillval
- Saknar SD-kortläsare
- Skärm med låg PWM-frekvens
- Dålig på att utnyttja turbo boost
- WiFi-prestandan (bugg? drivrutinsproblem?)

Omdöme – En bra subnotebook med några mindre brister

Recension av Acer Swift 3 SF313-52-71Y7. Recensionsex från notebooksbilliger.de

Läs den fullständiga versionen av den här recensionen på engelska här.

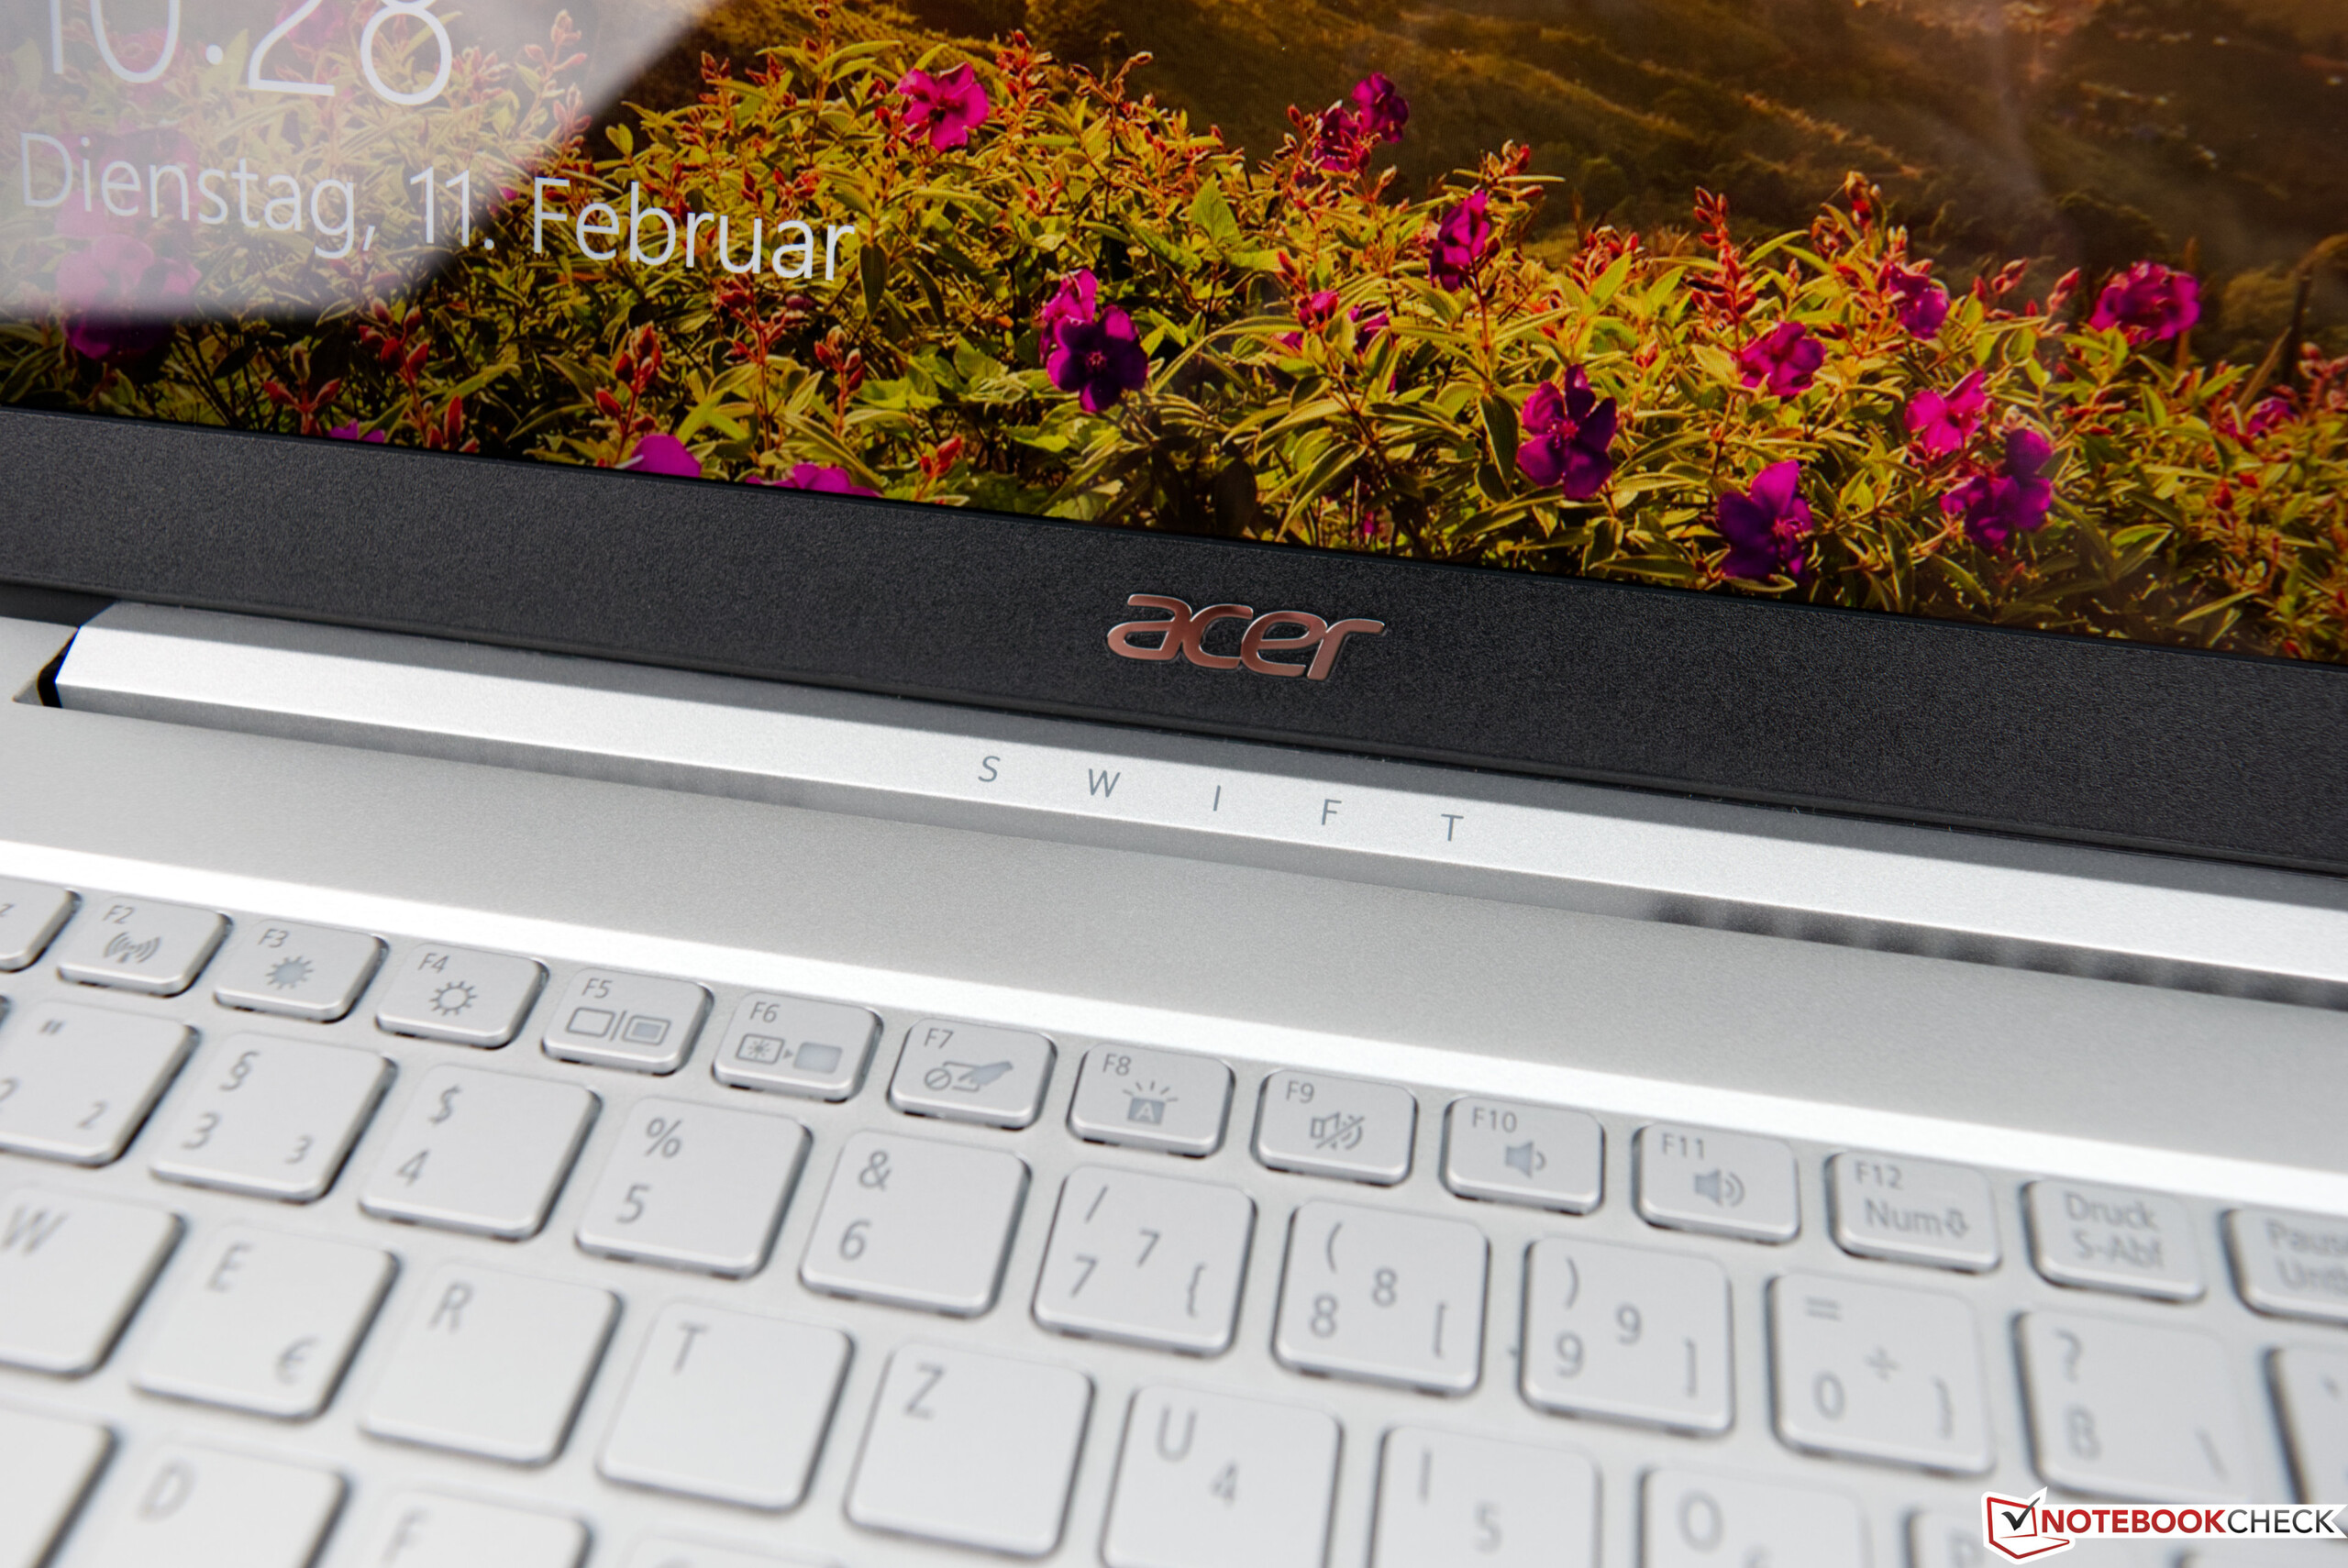
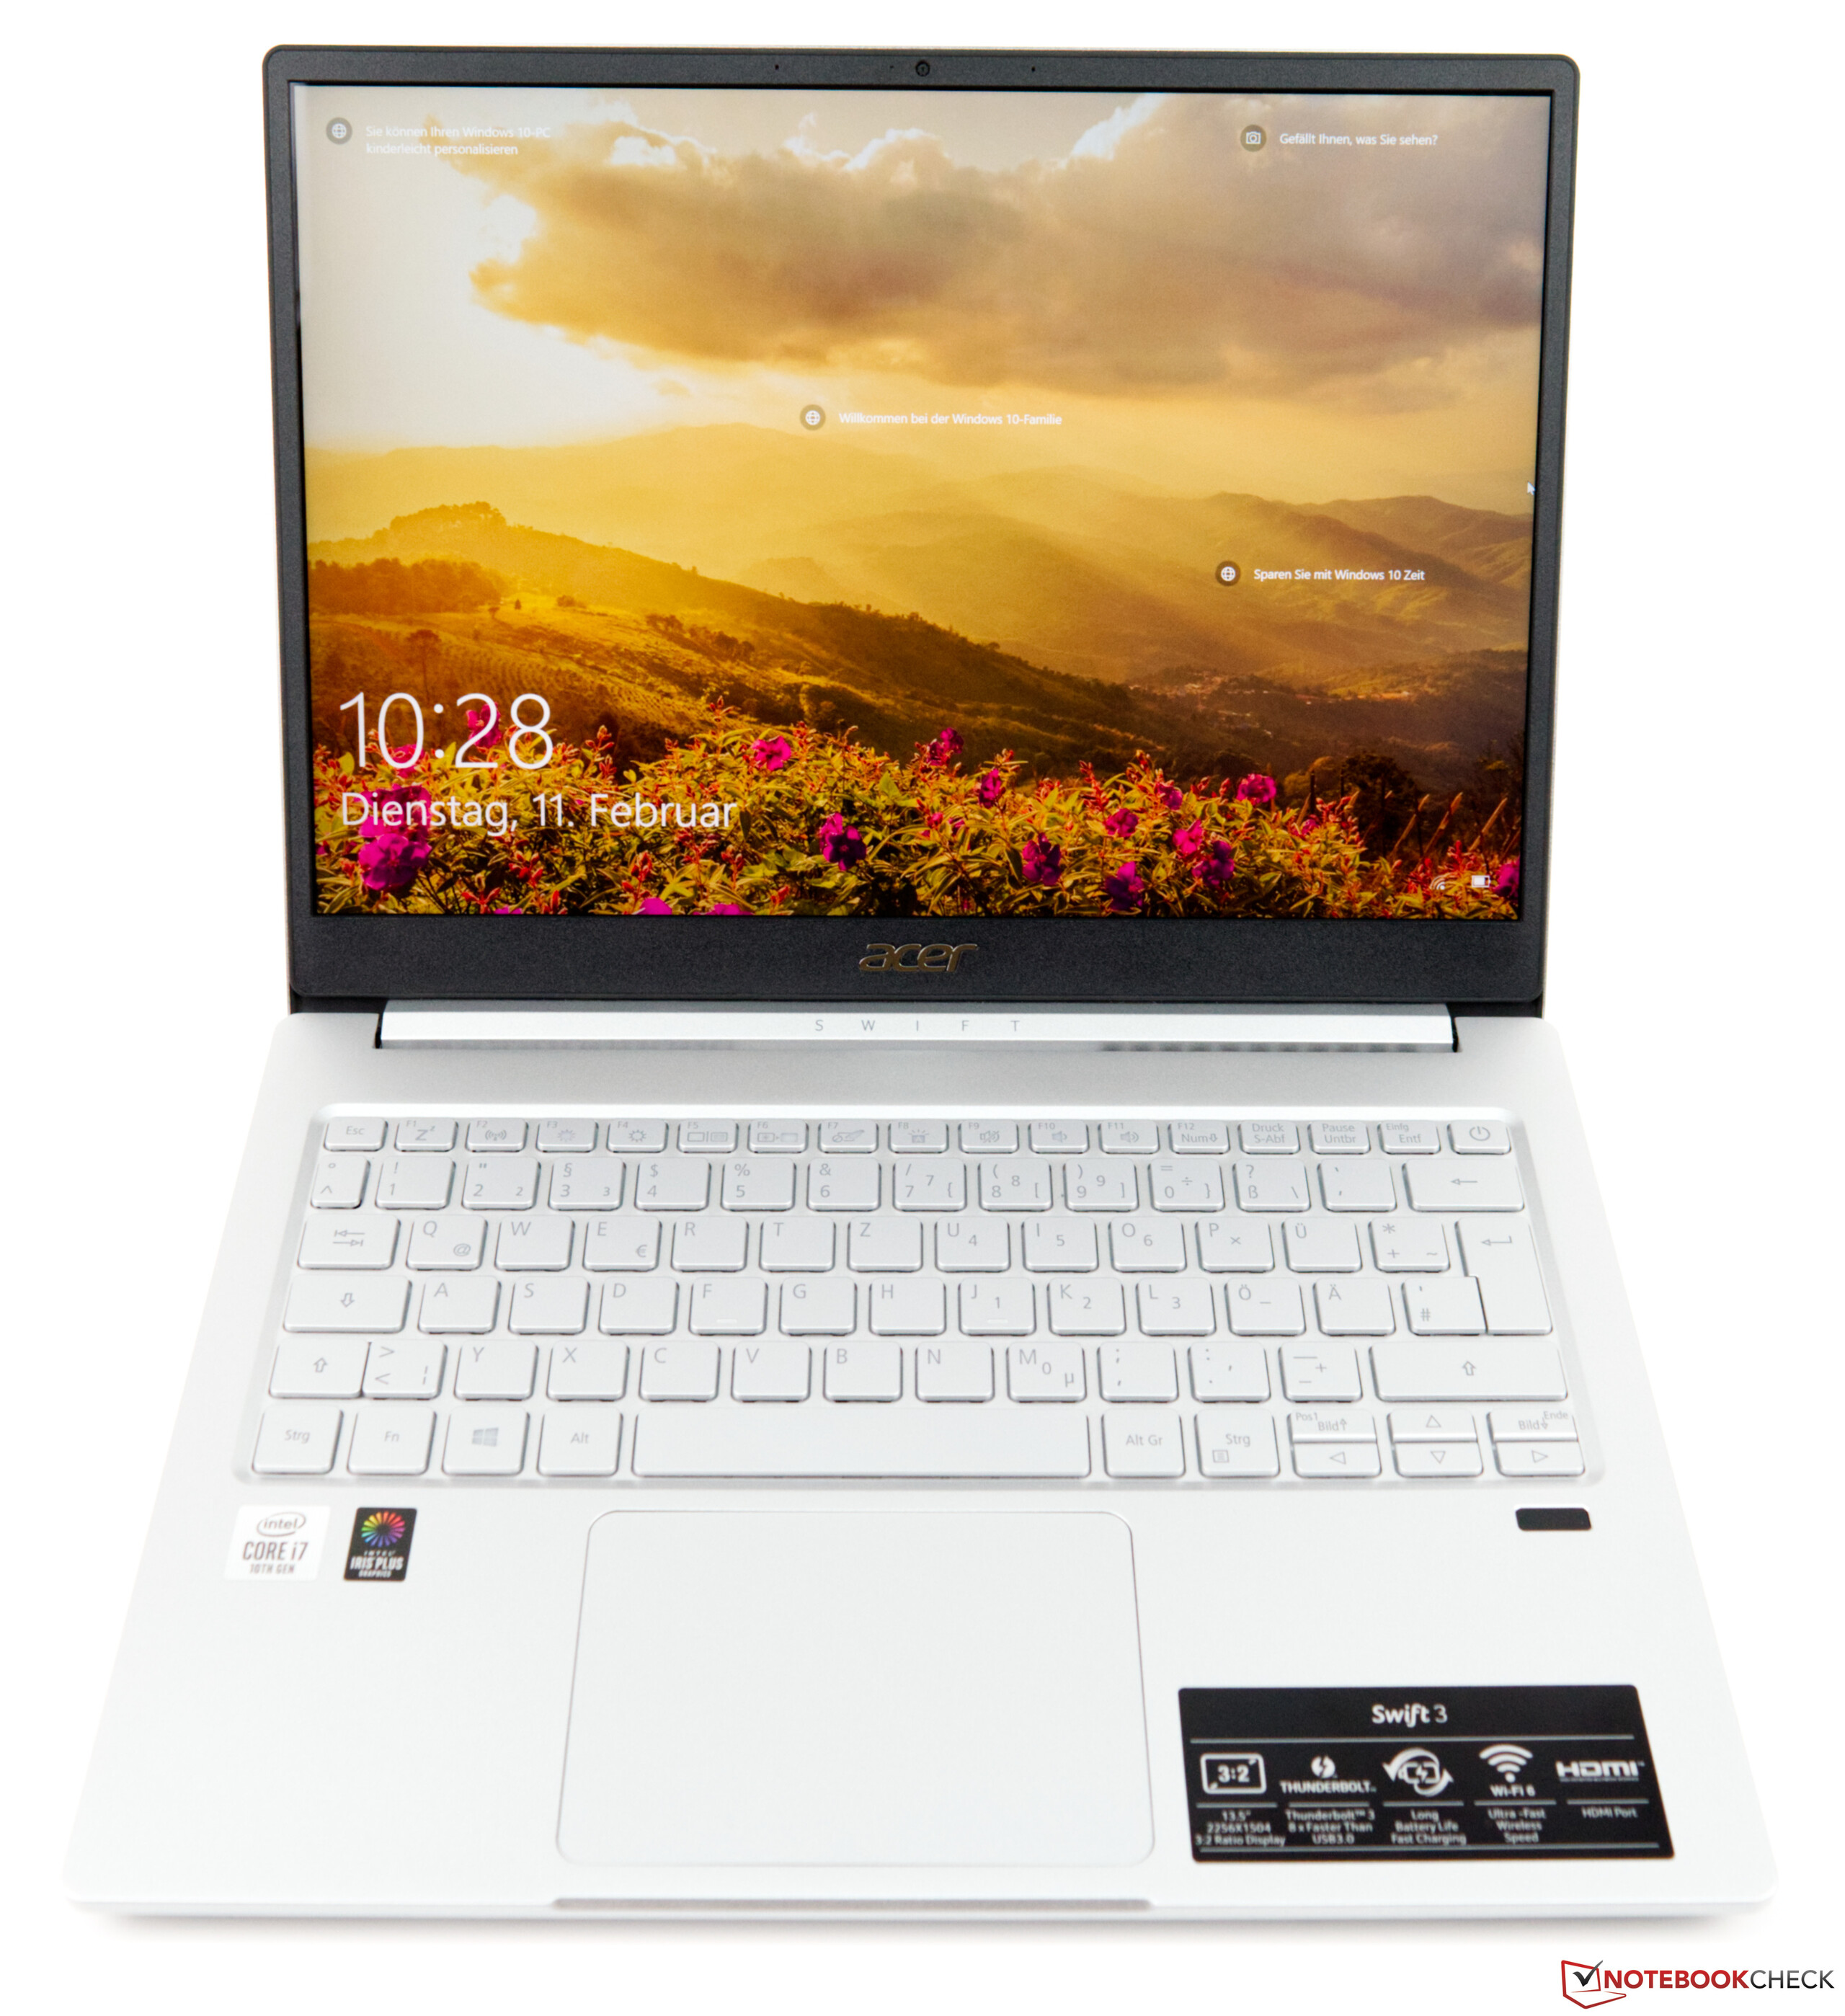
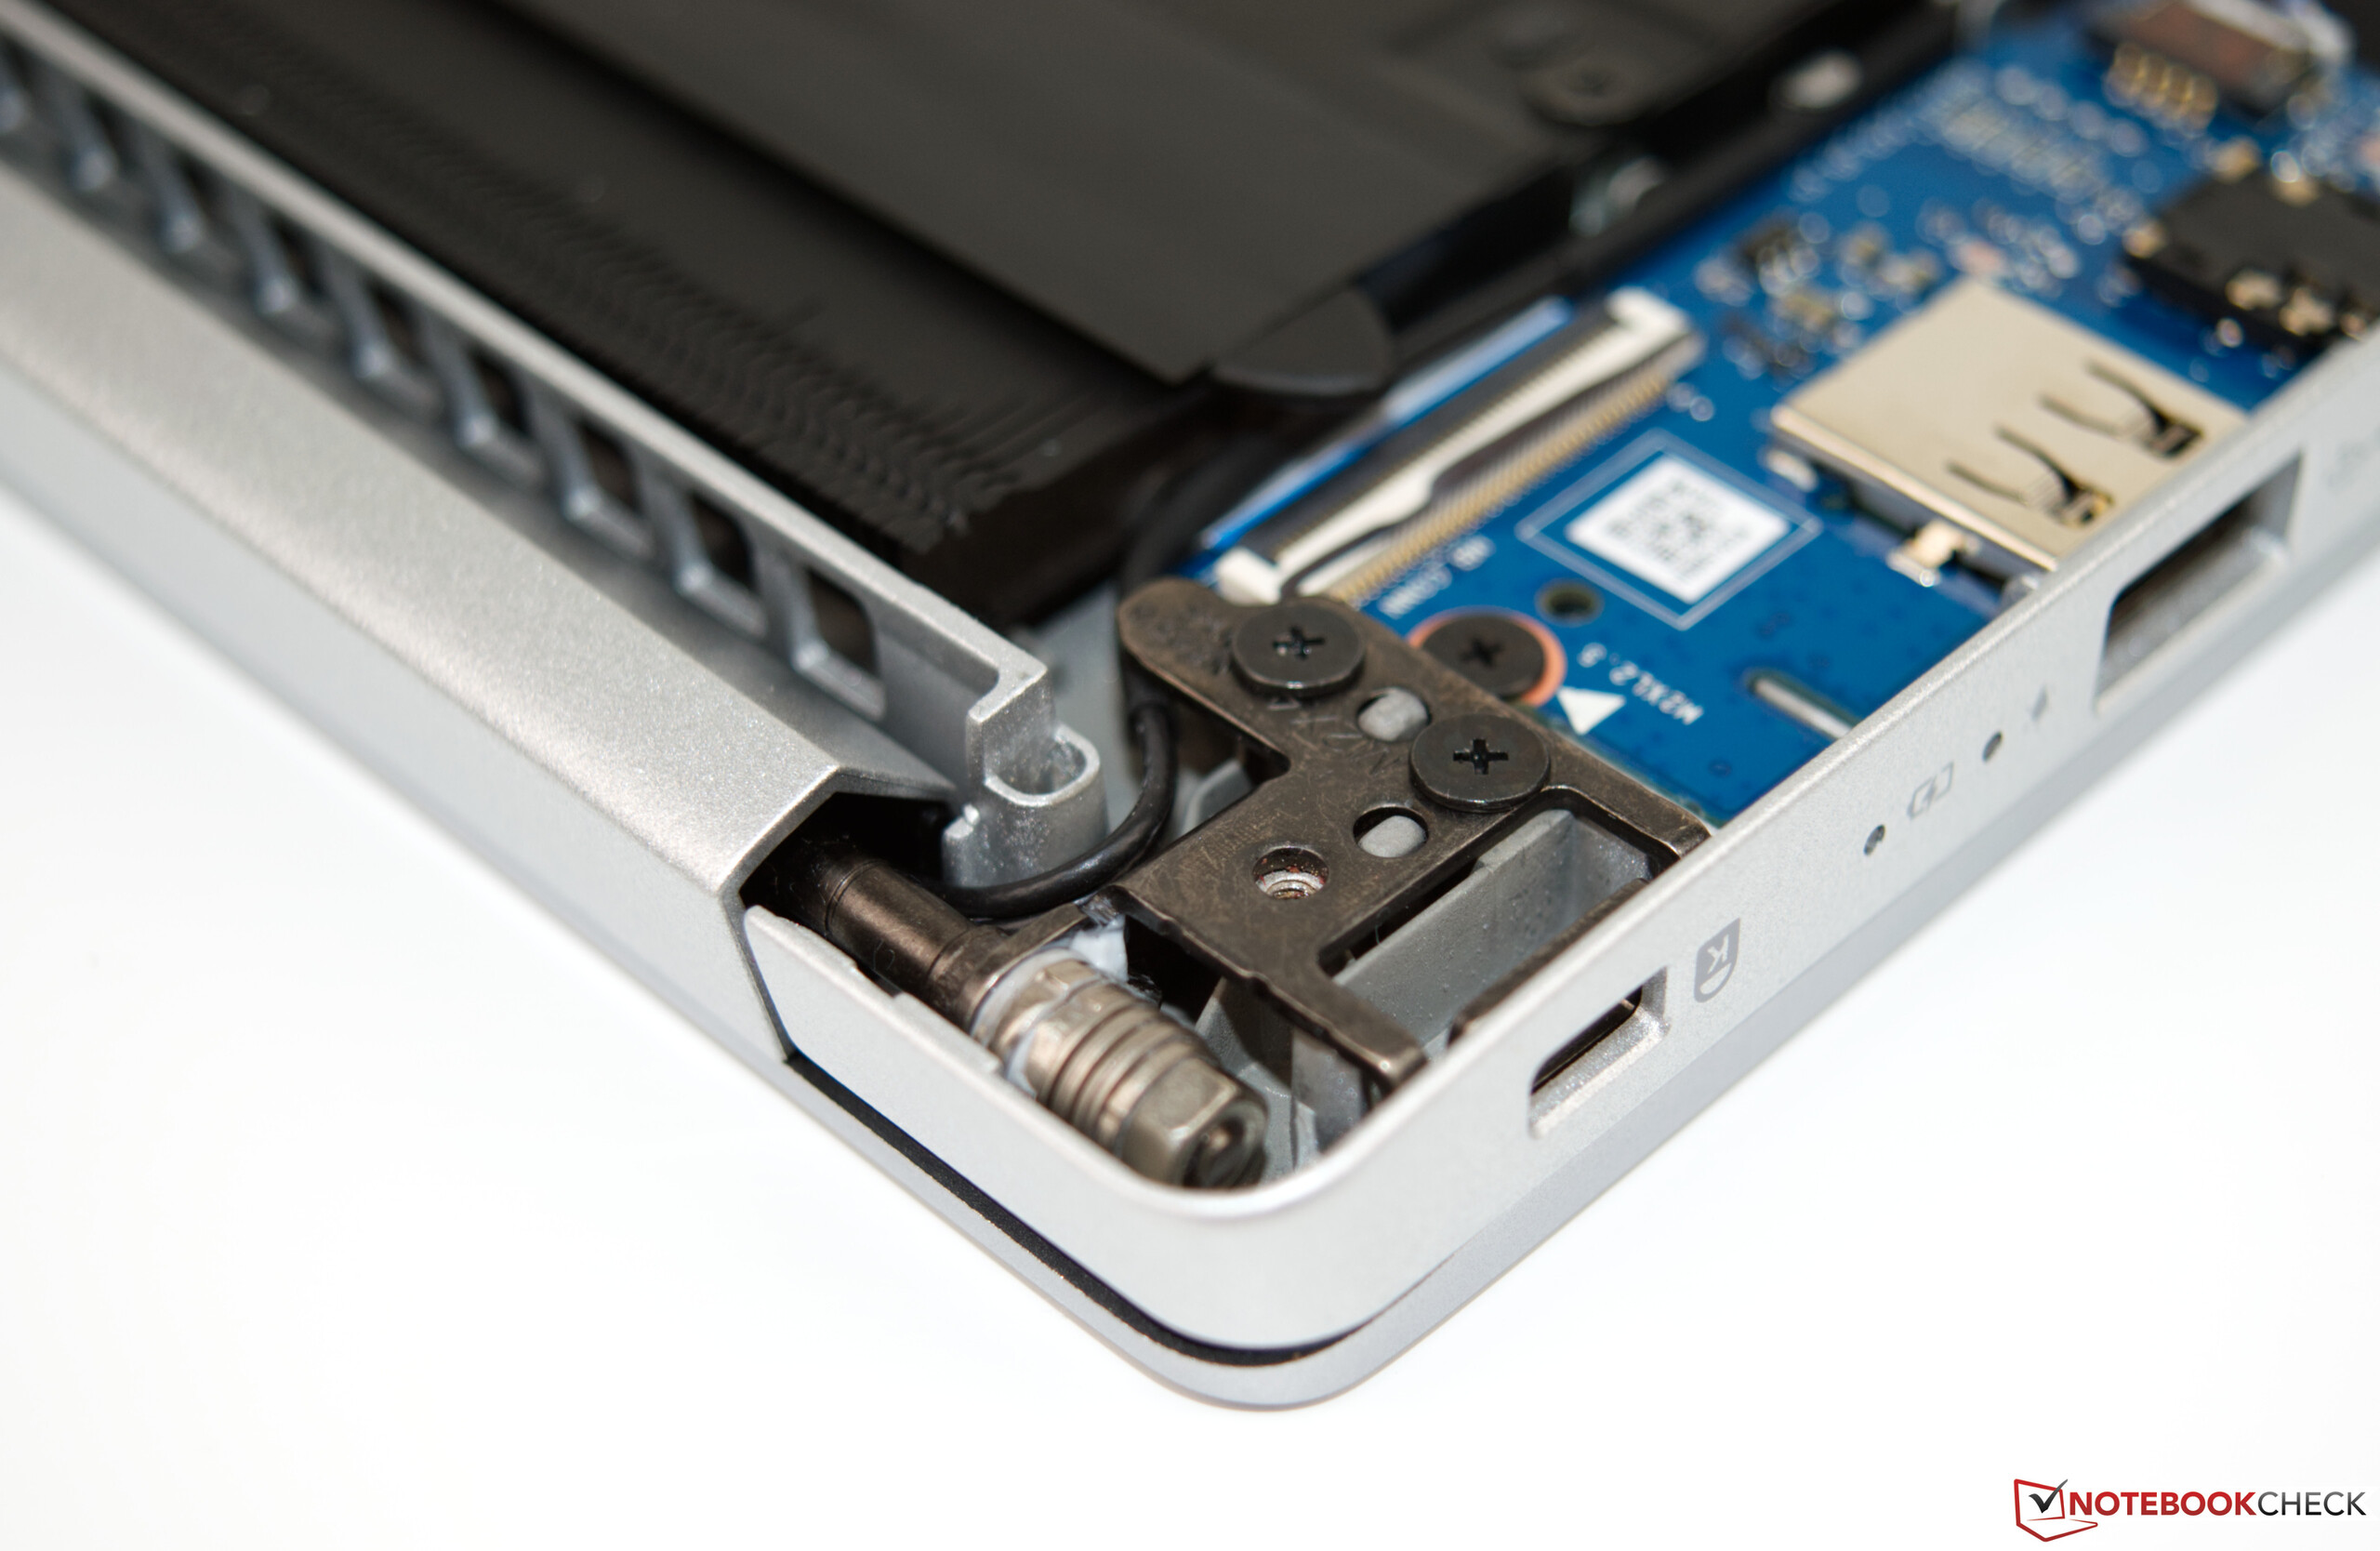
Acers nya Swift 3 SF313 är en enhet som totalt sett blivit bättre. Den har inte bara en ny och snyggare design utan har också fått en rejäl genomgång internt. Intels senaste Ice Lake SoC ger en viss prestandaförbättring som vi, i ärlighetens namn, hade trott skulle vara större. Dess Intel Core i7-1065G7 presterade riktigt bra och bättre än sina Kaby Lake-föregångare. Men jämfört med likvärdigt utrustade enheter hamnade Swift 3 efter. Den fick däremot poäng för bra design och robust konstruktionskvalitet. Den ljusstarka IPS-skärmen var definitivt en minnesvärd upplevelse och 3:2-förhållandet passade Swifts koncept riktigt bra.

Acer Swift 3 SF313 har skaplig prestanda, lång batteritid och en bra skärm utan att kräva för mycket av budgeten.

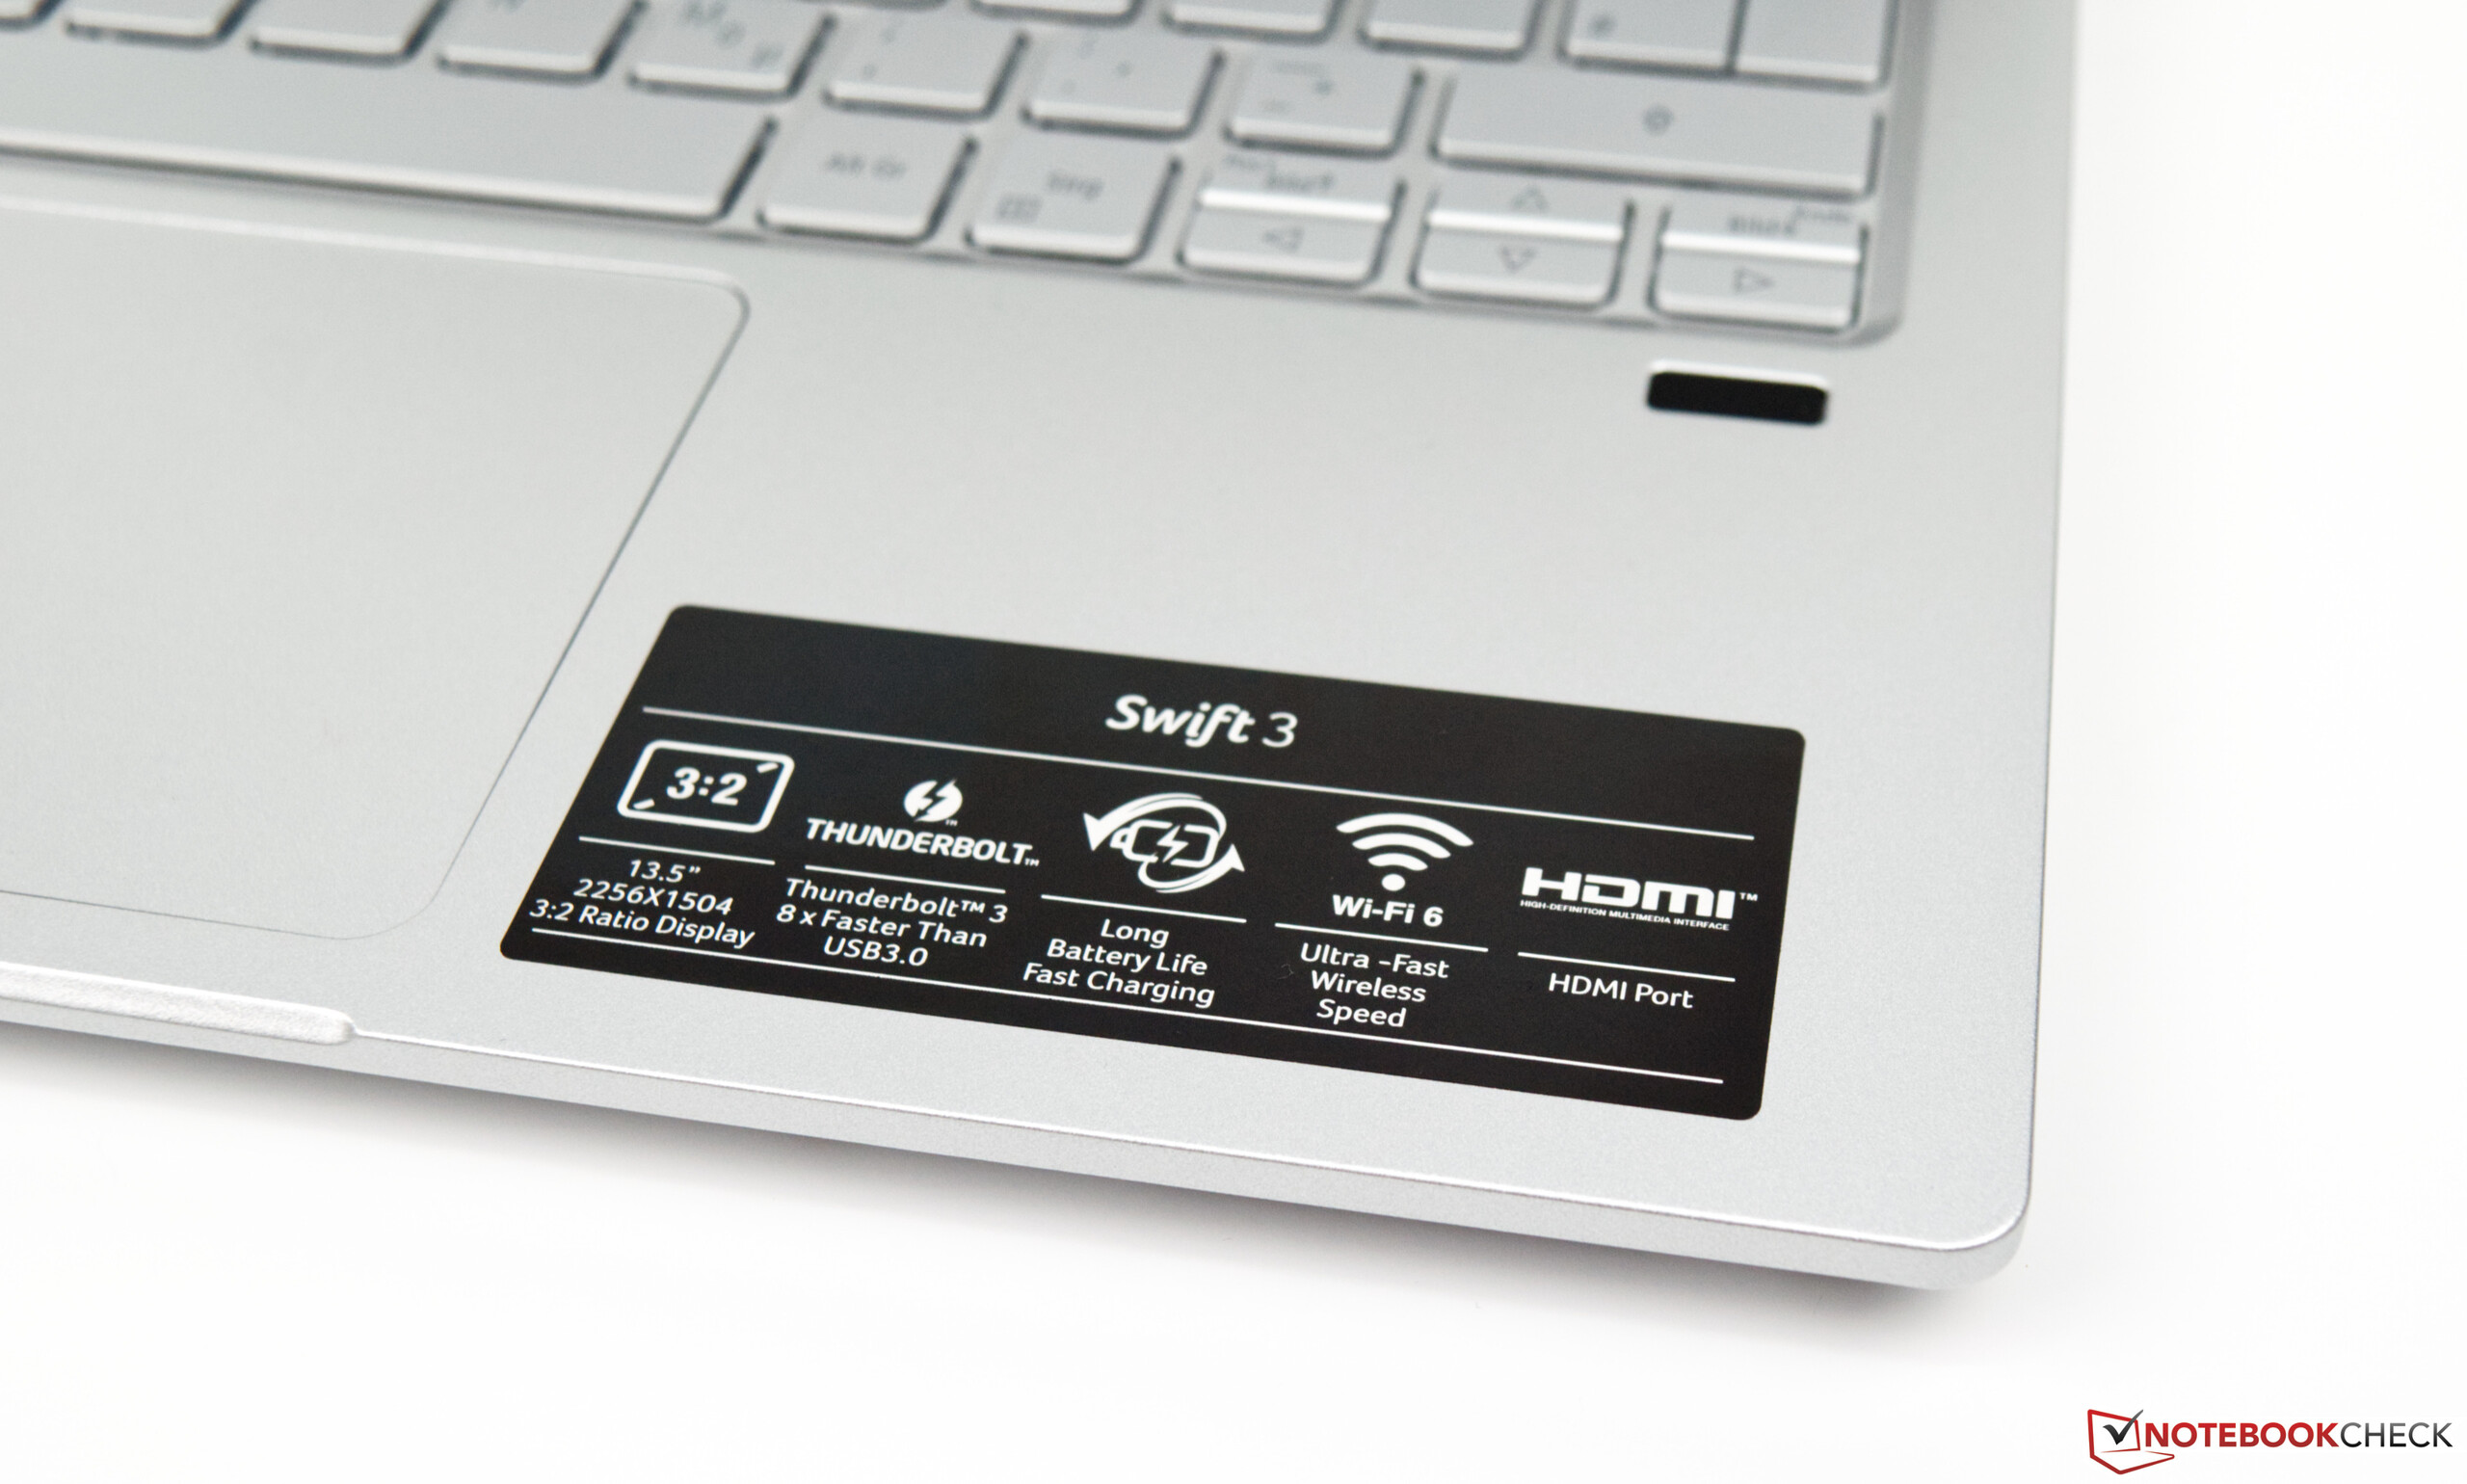
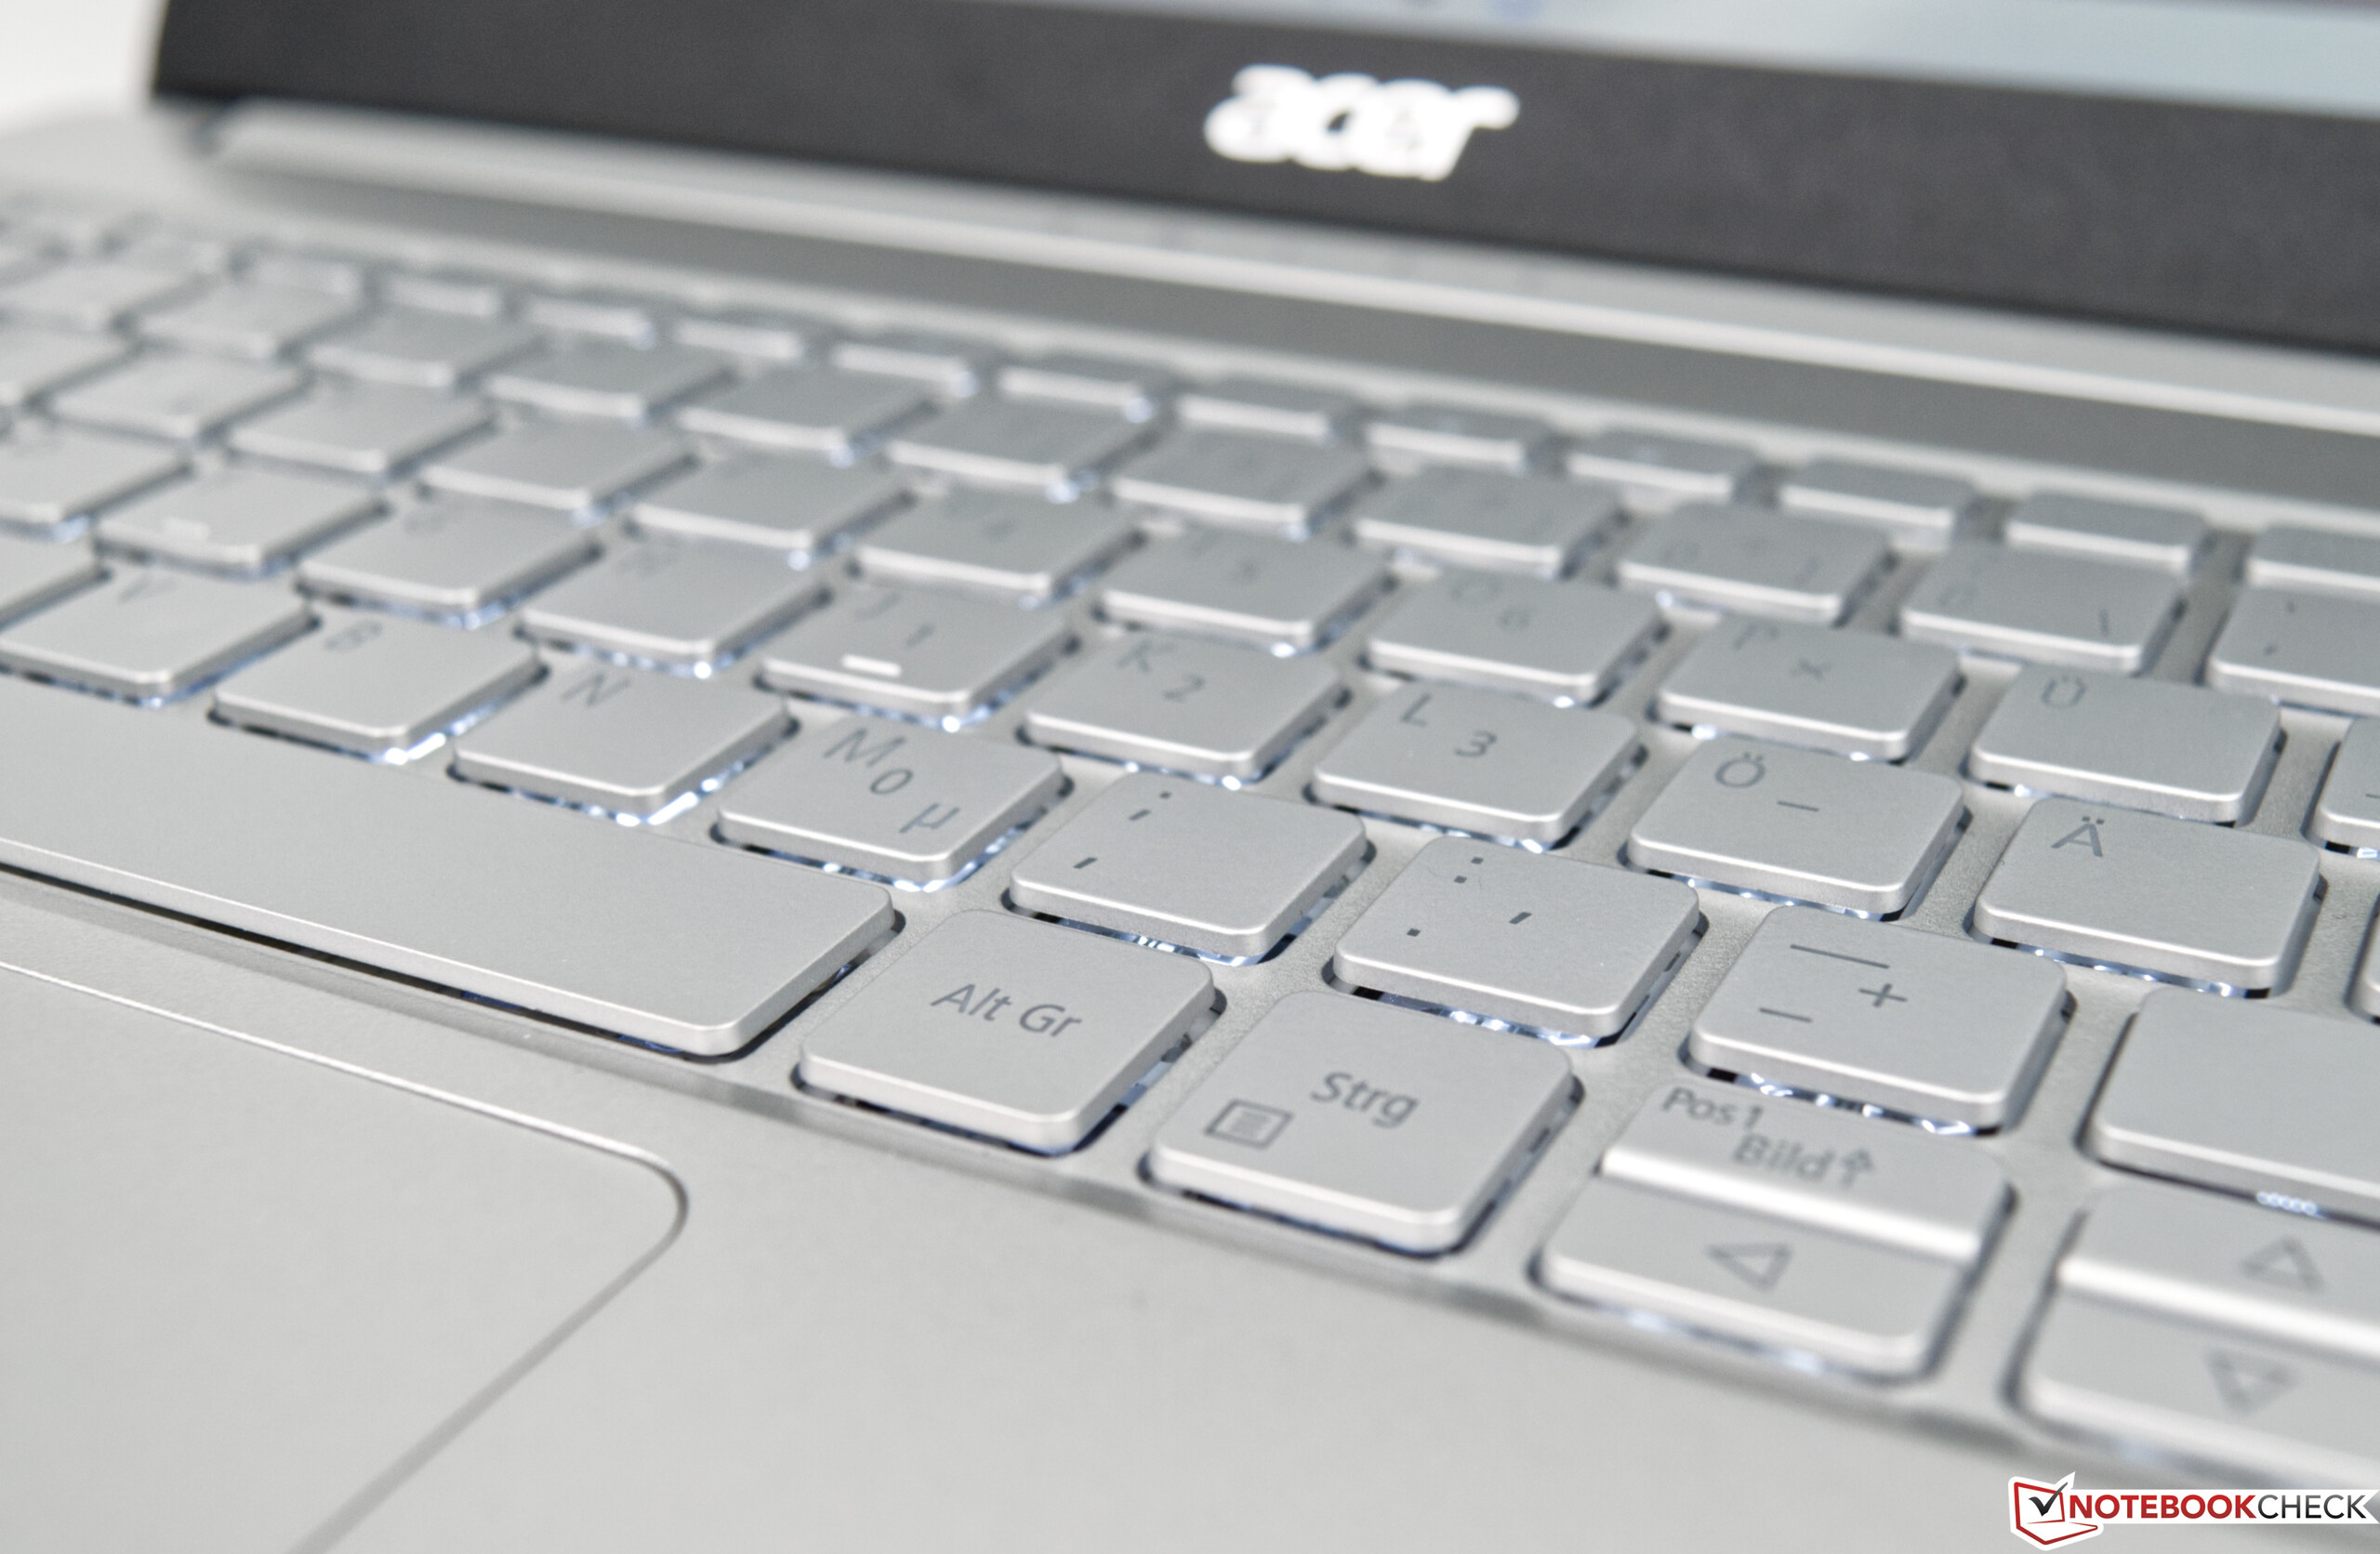
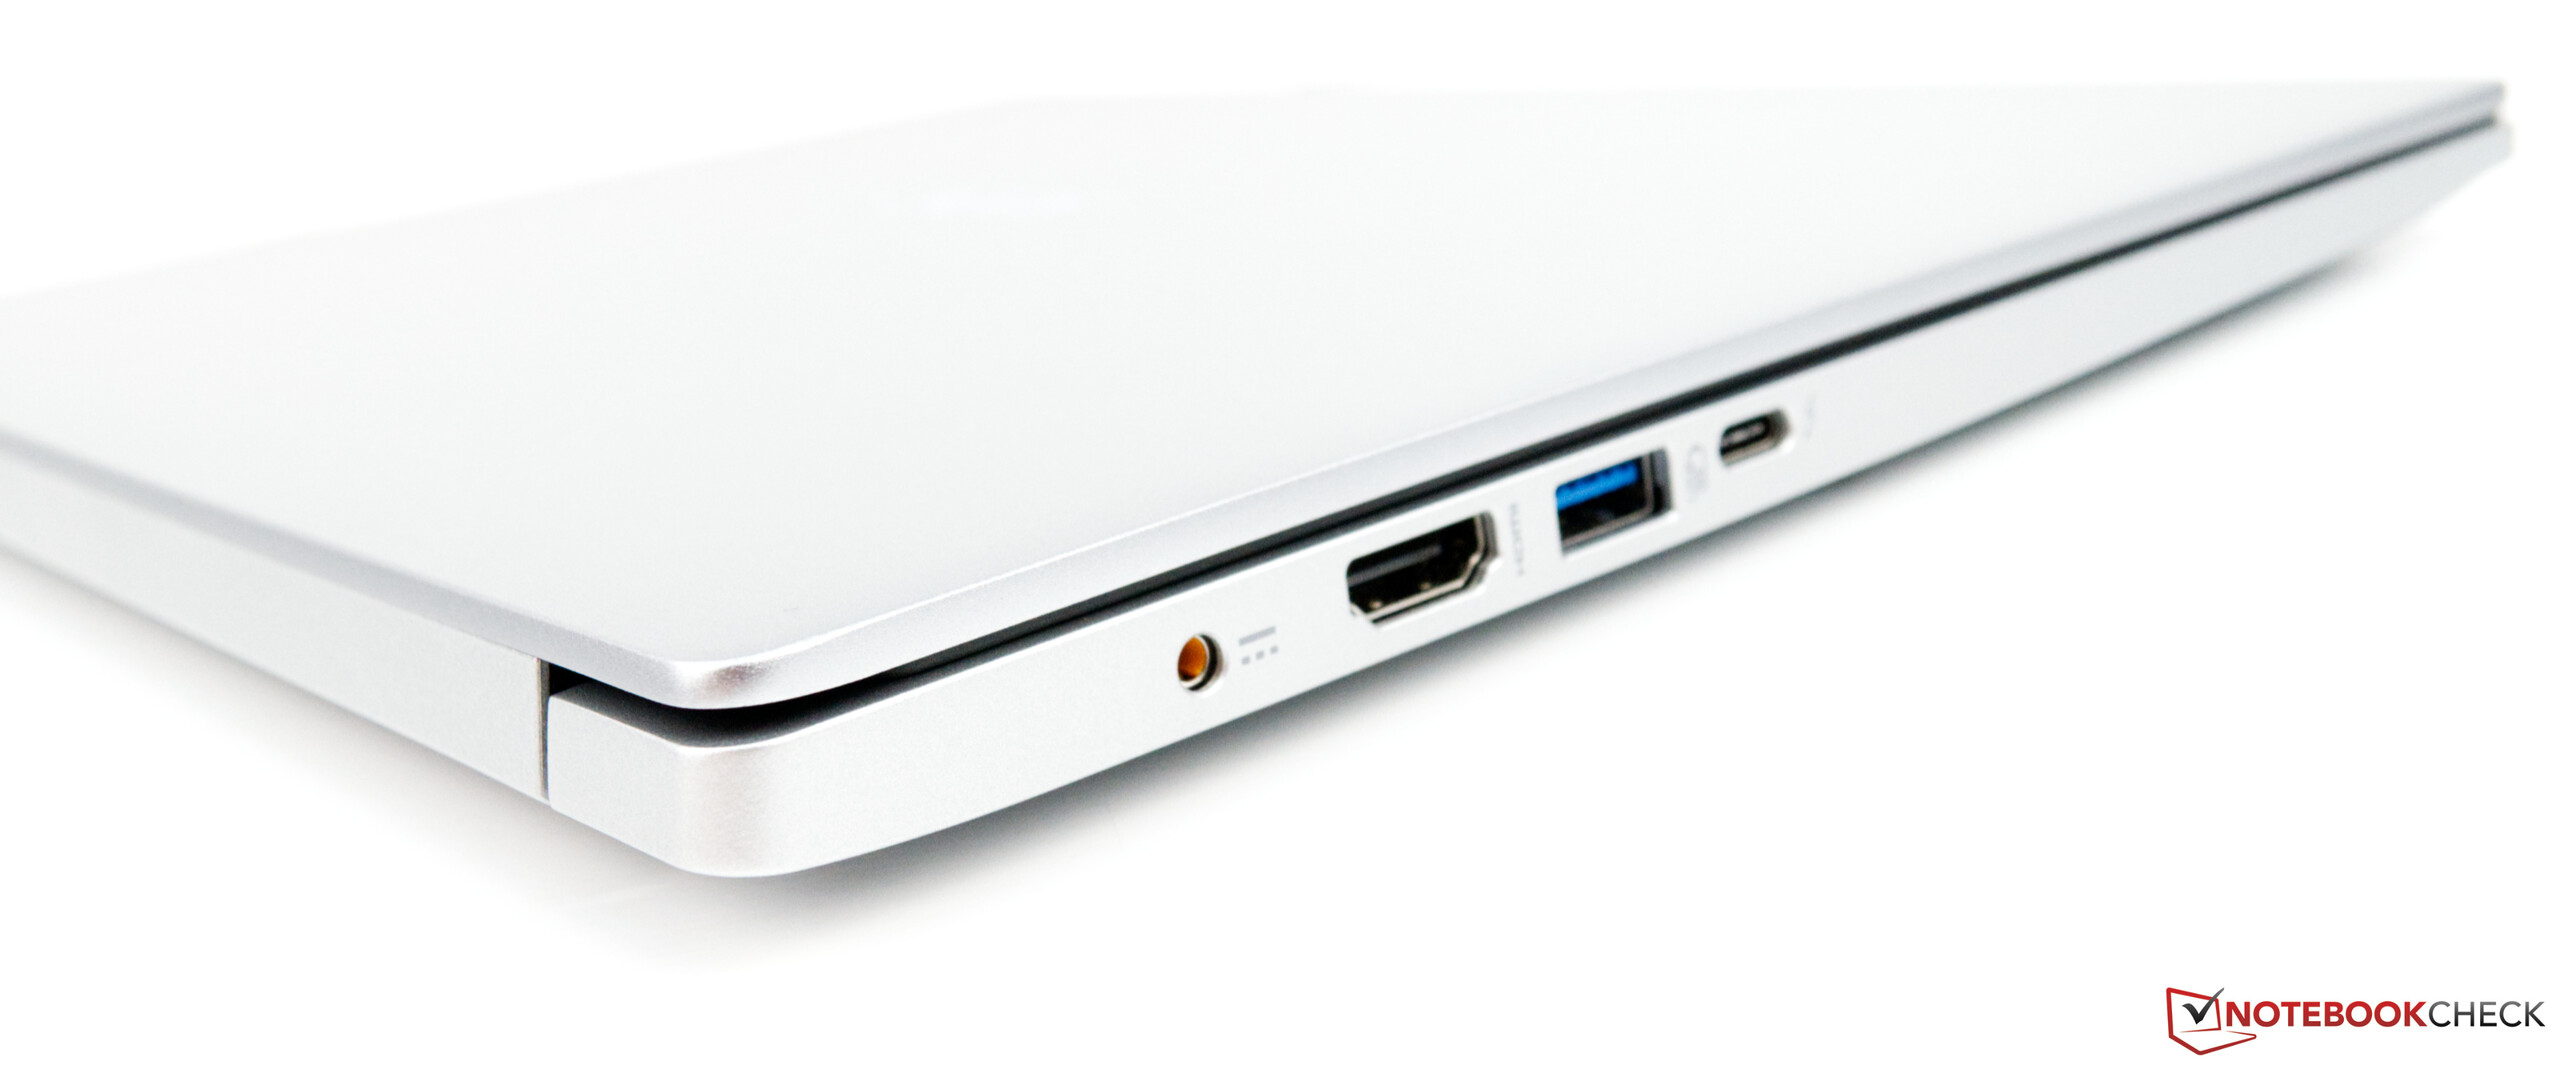
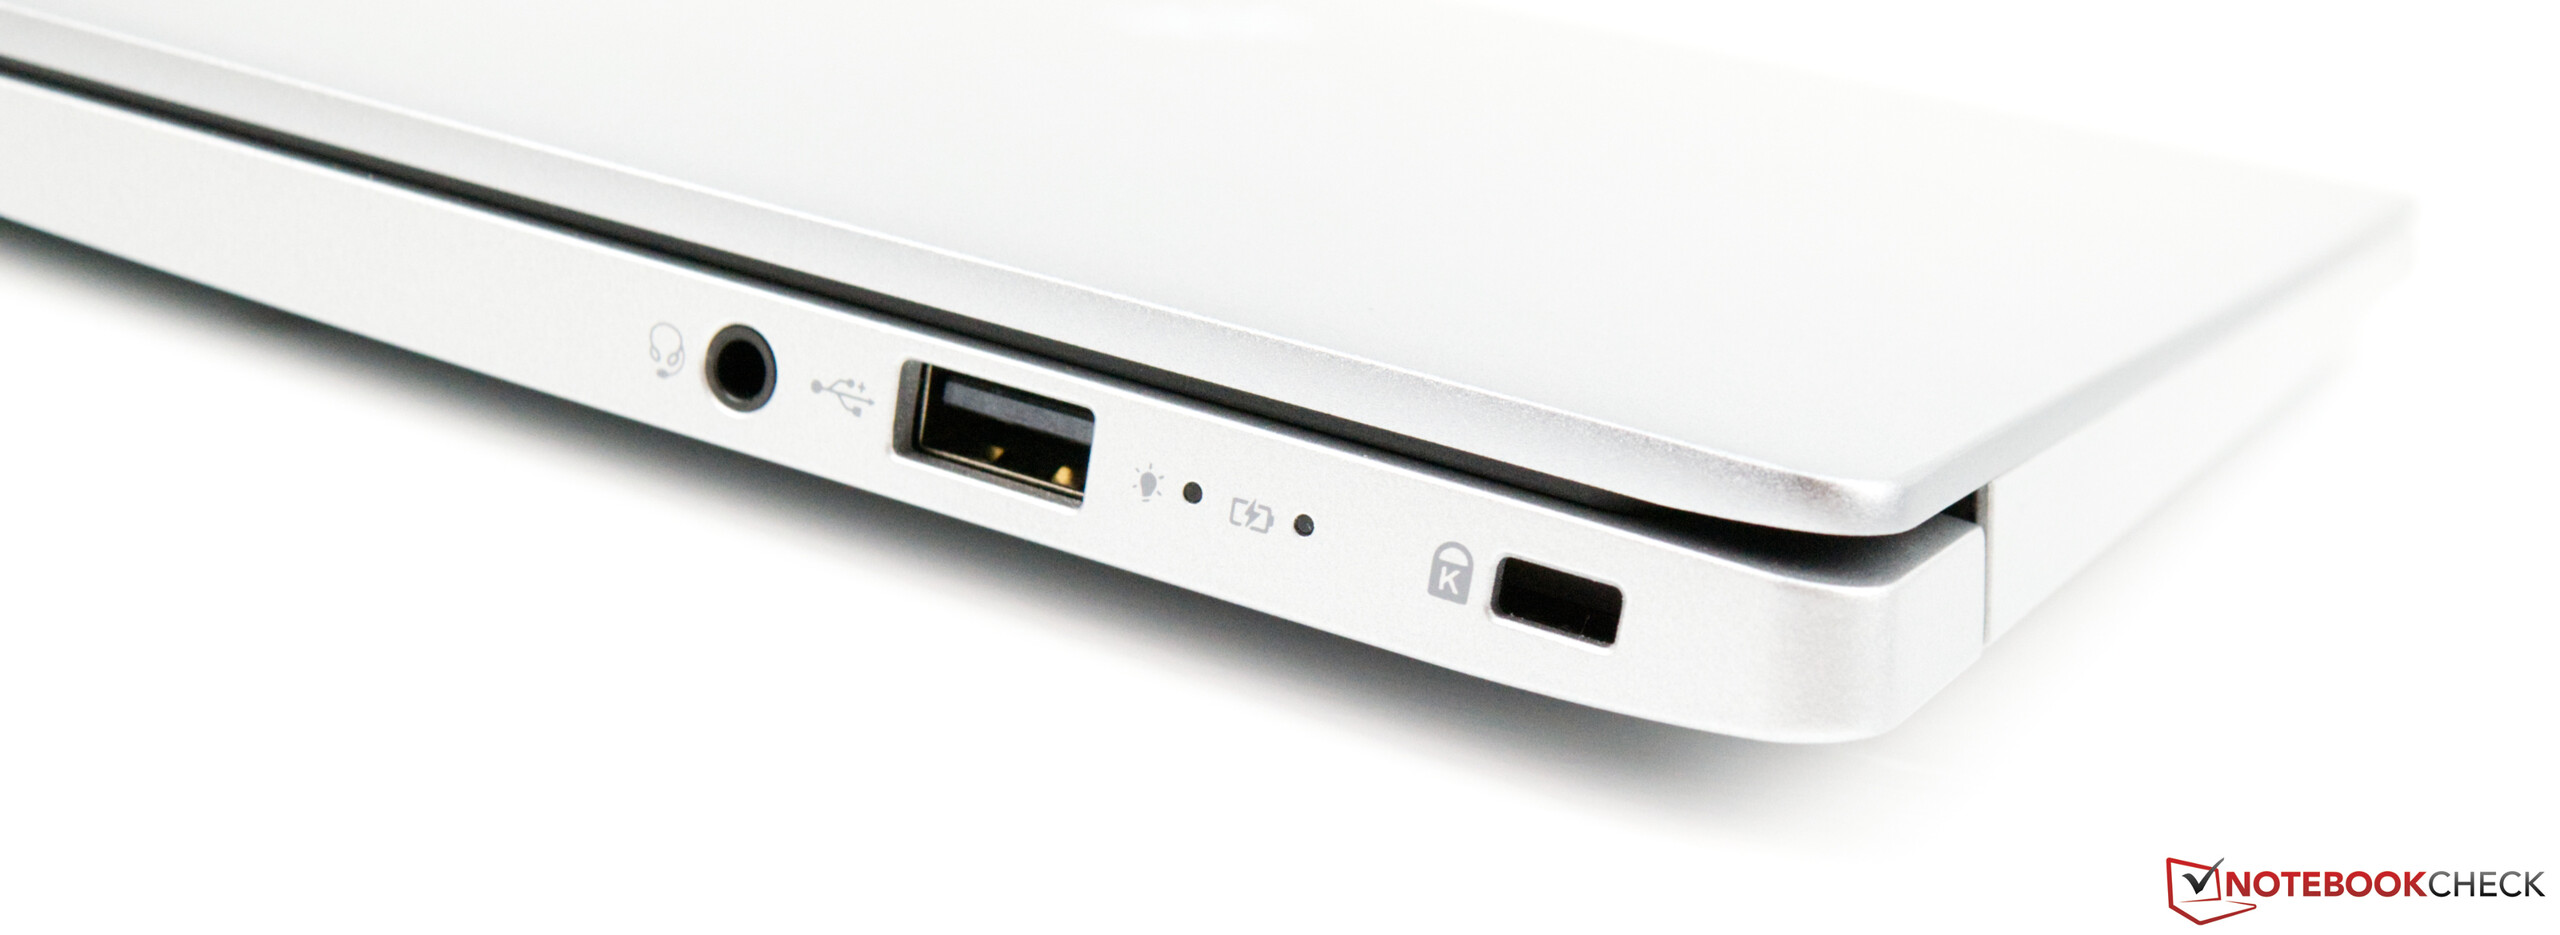
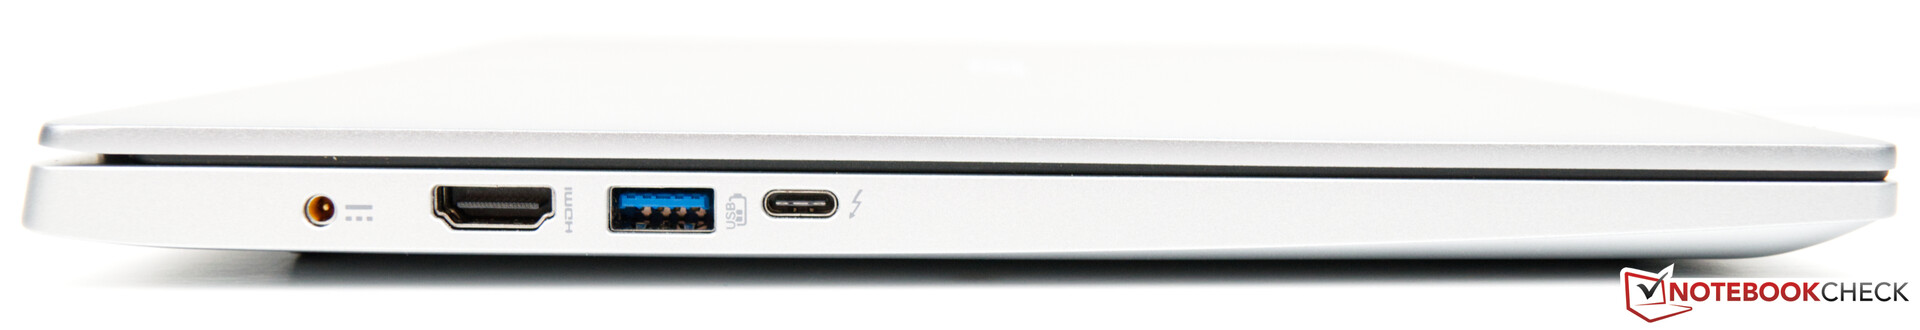
Bristerna inkluderar dålig WiFi-prestanda och ett tangentbord som var svårt att läsa av i dagsljus på grund av den vita bakgrundsbelysningen. Men med det sagt hjälpte det en del att stänga av bakgrundsbelysningen i ljusa miljöer. Den hade modern anslutbarhet, men en andra USB-C port hade inte skadat. Vi hade heller inte klagat på en kortläsare eller LTE som tillval.

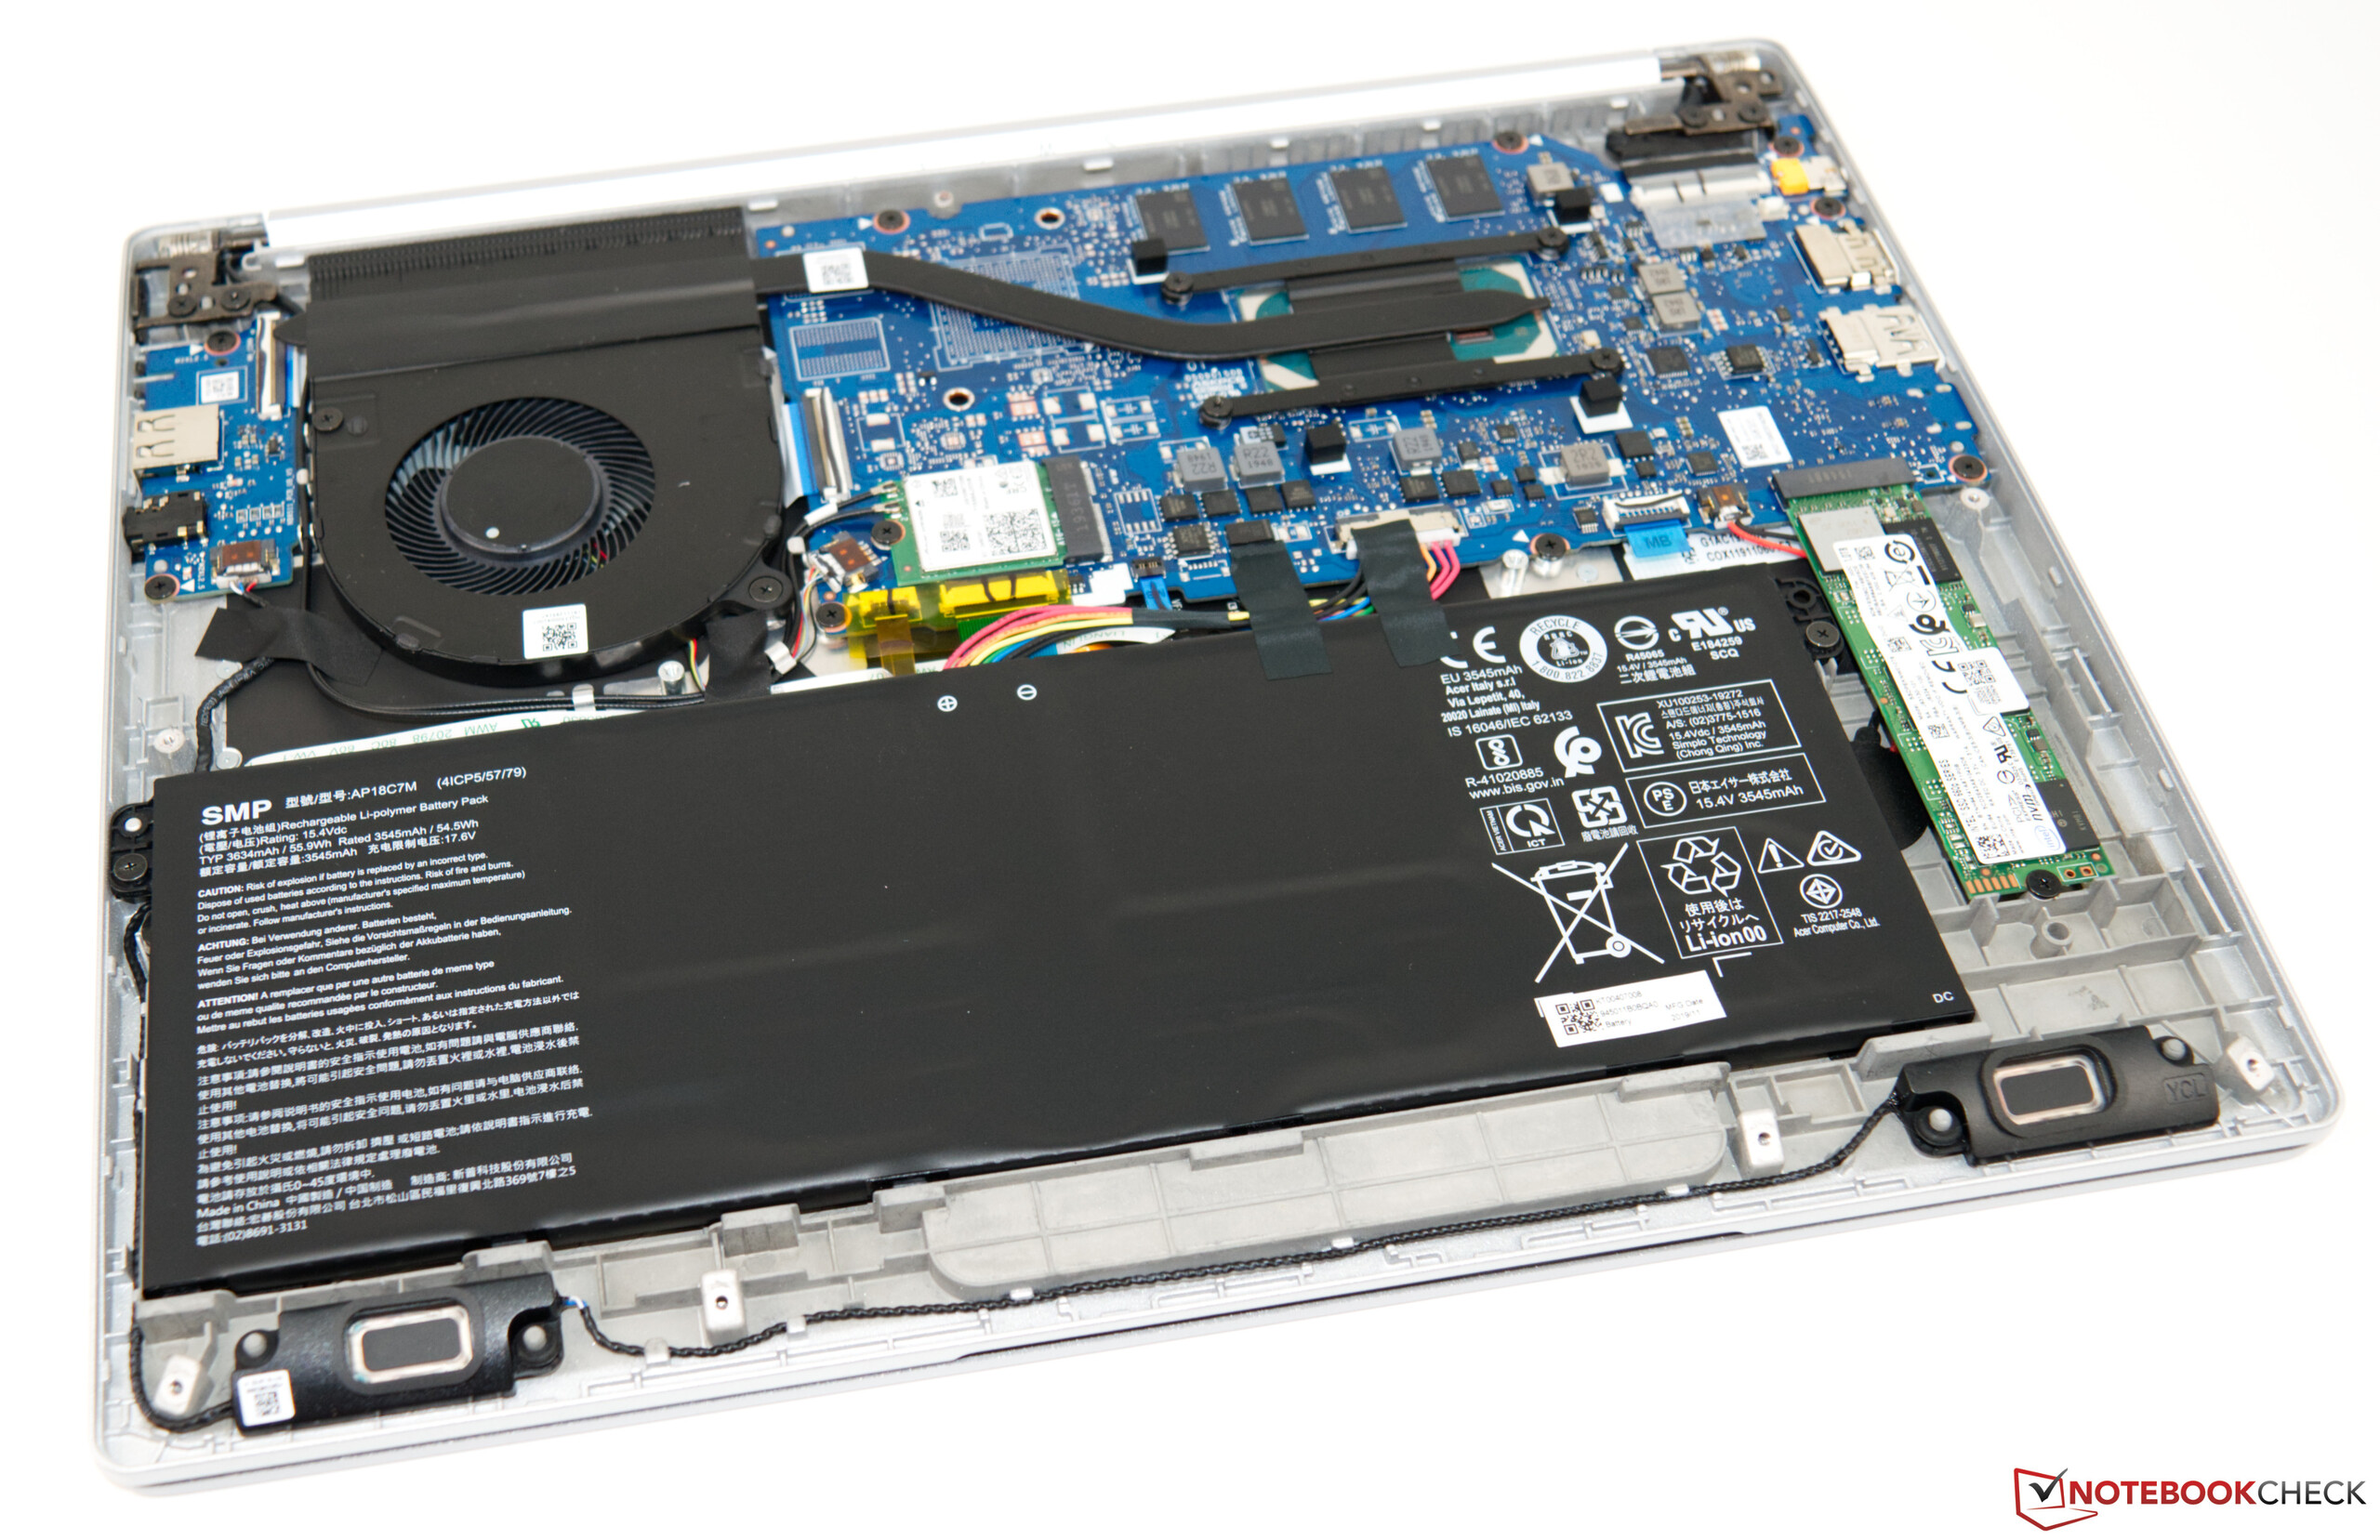
I slutändan är Swift 3 bättre än sin föregångare, vilket resulterar i en totalt sett gedigen subnotebook som också fungerar utmärkt som multimediaenhet. En extra lagringsenhet eller möjligheten att uppgradera RAM hade gjort enheten ännu bättre.

Acer Swift 3 SF313-52-71Y7 - 02/17/2020 v7 (old)
Sebastian Bade

Design
80 / 98 → 82%
Tangentbord
82%
Mus
88%
Anslutningar
54 / 75 → 72%
Vikt
73 / 20-75 → 96%
Batteri
87%
Skärm
89%
Spelprestanda
58 / 78 → 75%
Programprestanda
86 / 85 → 100%
Temperatur
96%
Ljudnivå
98%
Audio
57 / 91 → 62%
Camera
36 / 85 → 42%
Medel
76%
87%
Subnotebook - Vägt medel

Price comparison

Please share our article, every link counts!
> Bärbara datorer, laptops - tester och nyheter > Tester > Test: Fulladdad Acer Swift 3 SF313 med Ice Lake-processor (Sammanfattning)
Sebastian Bade, 2020-02-23 (Update: 2020-02-23)