Test: Lenovo IdeaPad S340 (i7-8550U, MX230) Laptop (Sammanfattning)
Topp 10...
» Topp 10: Bästa bärbara allround/multimediadatorerna
» Topp 10: Bästa bärbara speldatorerna
» Topp 10: Bärbara budget/kontorsdatorer
» Topp 10: Bästa bärbara kontors/premiumdatorerna
» Topp 10: Bärbara arbetsstationer
» Topp 10: De bästa små/kompakta bärbara datorerna
» Topp 10: Bästa ultrabooks
» Topp 10: Bästa hybriddatorerna
» Topp 10: Bästa surfplattorna
» Topp 10: Marknadens bästa smartphones
| SD Card Reader | |
| average JPG Copy Test (av. of 3 runs) | |
| Dell Latitude 14 5495 (Toshiba Exceria Pro SDXC 64 GB UHS-II) | |
| Genomsnitt av klass Multimedia (18.4 - 201, n=56, senaste 2 åren) | |
| HP ProBook 445 G6 (Toshiba Exceria Pro SDXC 64 GB UHS-II) | |
| Lenovo Ideapad S340-14IWL-81N70056GE (Toshiba Exceria Pro SDXC 64 GB UHS-II) | |
| Asus VivoBook 14 F412FJ-EB084T (Toshiba Exceria Pro M501 microSDXC 64GB) | |
| maximum AS SSD Seq Read Test (1GB) | |
| Dell Latitude 14 5495 (Toshiba Exceria Pro SDXC 64 GB UHS-II) | |
| Genomsnitt av klass Multimedia (25.8 - 266, n=56, senaste 2 åren) | |
| HP ProBook 445 G6 (Toshiba Exceria Pro SDXC 64 GB UHS-II) | |
| Lenovo Ideapad S340-14IWL-81N70056GE (Toshiba Exceria Pro SDXC 64 GB UHS-II) | |
| Asus VivoBook 14 F412FJ-EB084T (Toshiba Exceria Pro M501 microSDXC 64GB) | |
| Networking | |
| iperf3 transmit AX12 | |
| Asus VivoBook 14 F412FJ-EB084T | |
| Huawei MateBook D 14 W50F | |
| Dell Latitude 14 5495 | |
| HP ProBook 445 G6 | |
| Lenovo Ideapad S340-14IWL-81N70056GE | |
| iperf3 receive AX12 | |
| Asus VivoBook 14 F412FJ-EB084T | |
| HP ProBook 445 G6 | |
| Huawei MateBook D 14 W50F | |
| Dell Latitude 14 5495 | |
| Lenovo Ideapad S340-14IWL-81N70056GE | |
| |||||||||||||||||||||||||
Distribution av ljusstyrkan: 87 %
Mitt på batteriet: 260 cd/m²
Kontrast: 897:1 (Svärta: 0.29 cd/m²)
ΔE Color 6.29 | 0.5-29.43 Ø4.87, calibrated: 4.51
ΔE Greyscale 4.65 | 0.5-98 Ø5.1
58% sRGB (Argyll 1.6.3 3D)
37% AdobeRGB 1998 (Argyll 1.6.3 3D)
39.68% AdobeRGB 1998 (Argyll 2.2.0 3D)
57.8% sRGB (Argyll 2.2.0 3D)
38.41% Display P3 (Argyll 2.2.0 3D)
Gamma: 2.73
| Lenovo Ideapad S340-14IWL-81N70056GE LG Philips LP140WFA-SPD1, , 1920x1080, 14" | Dell Latitude 14 5495 CMN14C9, , 1920x1080, 14" | Asus VivoBook 14 F412FJ-EB084T AU Optronics AUO403D B140HAN04.0, , 1920x1080, 14" | HP ProBook 445 G6 Chi Mei CMN14D4, , 1920x1080, 14" | Huawei MateBook D 14 W50F BOE0764 / TV140FHM-NH0, , 1920x1080, 14" | |
|---|---|---|---|---|---|
| Display | 7% | 3% | 8% | 12% | |
| Display P3 Coverage | 38.41 | 40.94 7% | 39.71 3% | 41.53 8% | 43.19 12% |
| sRGB Coverage | 57.8 | 61.4 6% | 59.6 3% | 62 7% | 64 11% |
| AdobeRGB 1998 Coverage | 39.68 | 42.32 7% | 41.04 3% | 42.94 8% | 44.62 12% |
| Response Times | -13% | -9% | -4% | -26% | |
| Response Time Grey 50% / Grey 80% * | 36 ? | 41 ? -14% | 40 ? -11% | 40 ? -11% | 41 ? -14% |
| Response Time Black / White * | 27 ? | 30 ? -11% | 29 ? -7% | 26 ? 4% | 37 ? -37% |
| PWM Frequency | 25000 ? | 208 ? | 200 ? | ||
| Screen | 11% | 22% | 12% | 5% | |
| Brightness middle | 260 | 212 -18% | 267 3% | 200 -23% | 291 12% |
| Brightness | 250 | 200 -20% | 257 3% | 196 -22% | 276 10% |
| Brightness Distribution | 87 | 89 2% | 91 5% | 67 -23% | 85 -2% |
| Black Level * | 0.29 | 0.23 21% | 0.2 31% | 0.17 41% | 0.46 -59% |
| Contrast | 897 | 922 3% | 1335 49% | 1176 31% | 633 -29% |
| Colorchecker dE 2000 * | 6.29 | 4.34 31% | 3.79 40% | 4.26 32% | 4.3 32% |
| Colorchecker dE 2000 max. * | 14.77 | 9.01 39% | 8.18 45% | 9.7 34% | 10.01 32% |
| Colorchecker dE 2000 calibrated * | 4.51 | 4.71 -4% | 3.18 29% | ||
| Greyscale dE 2000 * | 4.65 | 2.81 40% | 1.49 68% | 3.15 32% | 4.21 9% |
| Gamma | 2.73 81% | 2.22 99% | 2.48 89% | 2.31 95% | 2.46 89% |
| CCT | 7331 89% | 6286 103% | 6659 98% | 6882 94% | 6867 95% |
| Color Space (Percent of AdobeRGB 1998) | 37 | 39 5% | 38 3% | 40 8% | 41 11% |
| Color Space (Percent of sRGB) | 58 | 61 5% | 59 2% | 62 7% | 64 10% |
| Totalt genomsnitt (program/inställningar) | 2% /
7% | 5% /
15% | 5% /
9% | -3% /
2% |
* ... mindre är bättre
Visa svarstider
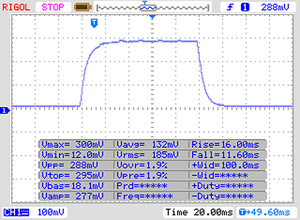
| ↔ Svarstid svart till vitt | ||
|---|---|---|
| 27 ms ... stiga ↗ och falla ↘ kombinerat | ↗ 16 ms stiga | |
| ↘ 11 ms hösten | ||
| Skärmen visar relativt långsamma svarsfrekvenser i våra tester och kan vara för långsam för spelare. I jämförelse sträcker sig alla testade enheter från 0.1 (minst) till 240 (maximalt) ms. » 65 % av alla enheter är bättre. Detta innebär att den uppmätta svarstiden är sämre än genomsnittet av alla testade enheter (20.8 ms). | ||
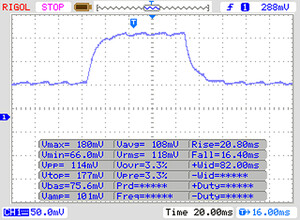
| ↔ Svarstid 50 % grått till 80 % grått | ||
| 36 ms ... stiga ↗ och falla ↘ kombinerat | ↗ 20 ms stiga | |
| ↘ 16 ms hösten | ||
| Skärmen visar långsamma svarsfrekvenser i våra tester och kommer att vara otillfredsställande för spelare. I jämförelse sträcker sig alla testade enheter från 0.165 (minst) till 636 (maximalt) ms. » 47 % av alla enheter är bättre. Detta innebär att den uppmätta svarstiden är sämre än genomsnittet av alla testade enheter (32.5 ms). | ||
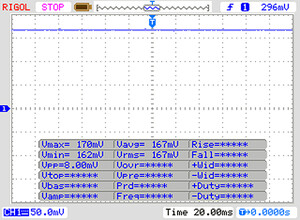
Skärmflimmer / PWM (Puls-Width Modulation)
| Skärmflimmer / PWM upptäcktes inte | |||
Som jämförelse: 53 % av alla testade enheter använder inte PWM för att dämpa skärmen. Om PWM upptäcktes mättes ett medelvärde av 8516 (minst: 5 - maximum: 343500) Hz. | |||
| Cinebench R15 | |
| CPU Single 64Bit | |
| Genomsnitt av klass Multimedia (99.6 - 323, n=82, senaste 2 åren) | |
| Acer Swift 3 SF314-55G-768V | |
| Huawei Matebook 13-53010FYW | |
| Lenovo Ideapad S340-14IWL-81N70056GE | |
| Genomsnitt Intel Core i7-8565U (138.3 - 193, n=51) | |
| Asus VivoBook 14 F412FJ-EB084T | |
| Dell Latitude 14 5495 | |
| Huawei MateBook D 14 W50F | |
| HP ProBook 445 G6 | |
| CPU Multi 64Bit | |
| Genomsnitt av klass Multimedia (856 - 5224, n=87, senaste 2 åren) | |
| Lenovo Ideapad S340-14IWL-81N70056GE | |
| Huawei Matebook 13-53010FYW | |
| Dell Latitude 14 5495 | |
| Asus VivoBook 14 F412FJ-EB084T | |
| HP ProBook 445 G6 | |
| Genomsnitt Intel Core i7-8565U (452 - 815, n=52) | |
| Huawei MateBook D 14 W50F | |
| Acer Swift 3 SF314-55G-768V | |
| PCMark 8 Home Score Accelerated v2 | 3641 poäng | |
| PCMark 8 Work Score Accelerated v2 | 5133 poäng | |
| PCMark 10 Score | 4011 poäng | |
Hjälp | ||
| Lenovo Ideapad S340-14IWL-81N70056GE WDC PC SN520 SDAPNUW-512G | Dell Latitude 14 5495 Intel SSDSCKKF256G8 | HP ProBook 445 G6 SK Hynix BC501 NVMe 256 GB | Huawei Matebook 13-53010FYW WDC PC SN520 SDAPNUW-512G | Acer Swift 3 SF314-55G-768V WDC PC SN520 SDAPNUW-512G | Genomsnitt WDC PC SN520 SDAPNUW-512G | |
|---|---|---|---|---|---|---|
| CrystalDiskMark 5.2 / 6 | -63% | -29% | 39% | 3% | -8% | |
| Write 4K | 160.8 | 48.45 -70% | 110.4 -31% | 191.2 19% | 185.5 15% | 138.5 ? -14% |
| Read 4K | 50.5 | 25.11 -50% | 39.46 -22% | 53.1 5% | 50.2 -1% | 44.2 ? -12% |
| Write Seq | 1458 | 341.2 -77% | 808 -45% | 1768 21% | 1175 -19% | 1265 ? -13% |
| Read Seq | 1447 | 521 -64% | 1130 -22% | 1710 18% | 1132 -22% | 1237 ? -15% |
| Write 4K Q32T1 | 406.5 | 202 -50% | 260.8 -36% | 575 41% | 472.6 16% | 404 ? -1% |
| Read 4K Q32T1 | 476.8 | 243.5 -49% | 308 -35% | 654 37% | 642 35% | 421 ? -12% |
| Write Seq Q32T1 | 1458 | 320.8 -78% | 816 -44% | 2544 74% | 1453 0% | 1491 ? 2% |
| Read Seq Q32T1 | 1743 | 555 -68% | 1783 2% | 3433 97% | 1738 0% | 1741 ? 0% |
| Write 4K Q8T8 | 247.5 | 715 ? | ||||
| Read 4K Q8T8 | 253.4 | 1027 ? | ||||
| AS SSD | -90% | -36% | 33% | 3% | -8% | |
| Seq Read | 1583 | 507 -68% | 1546 -2% | 2934 85% | 1438 -9% | 1363 ? -14% |
| Seq Write | 1345 | 286.5 -79% | 708 -47% | 2407 79% | 1352 1% | 1227 ? -9% |
| 4K Read | 44.47 | 19.76 -56% | 34.12 -23% | 48.31 9% | 47.35 6% | 40.8 ? -8% |
| 4K Write | 136.1 | 34.58 -75% | 76.7 -44% | 179.7 32% | 167.9 23% | 127.3 ? -6% |
| 4K-64 Read | 1038 | 238.4 -77% | 528 -49% | 1296 25% | 1051 1% | 957 ? -8% |
| 4K-64 Write | 1113 | 225.2 -80% | 588 -47% | 1459 31% | 1211 9% | 1081 ? -3% |
| Access Time Read * | 0.086 | 0.128 -49% | 0.062 28% | 0.103 -20% | 0.07744 ? 10% | |
| Access Time Write * | 0.027 | 0.101 -274% | 0.048 -78% | 0.021 22% | 0.03 -11% | 0.03671 ? -36% |
| Score Read | 1241 | 309 -75% | 717 -42% | 1638 32% | 1242 0% | 1134 ? -9% |
| Score Write | 1383 | 288 -79% | 735 -47% | 1879 36% | 1514 9% | 1331 ? -4% |
| Score Total | 3255 | 751 -77% | 1785 -45% | 4334 33% | 3397 4% | 3046 ? -6% |
| Copy ISO MB/s | 441.3 | 576 | 1169 ? | |||
| Copy Program MB/s | 152.1 | 159.8 | 446 ? | |||
| Copy Game MB/s | 260 | 330.8 | 874 ? | |||
| Totalt genomsnitt (program/inställningar) | -77% /
-79% | -33% /
-33% | 36% /
36% | 3% /
3% | -8% /
-8% |
* ... mindre är bättre
| 3DMark 11 - 1280x720 Performance GPU | |
| Genomsnitt av klass Multimedia (3765 - 60250, n=74, senaste 2 åren) | |
| Acer Swift 3 SF314-55G-768V | |
| Lenovo Ideapad S340-14IWL-81N70056GE | |
| Genomsnitt NVIDIA GeForce MX230 (3180 - 3582, n=6) | |
| Asus VivoBook 14 F412FJ-EB084T | |
| HP ProBook 445 G6 | |
| Dell Latitude 14 5495 | |
| Huawei Matebook 13-53010FYW | |
| Huawei MateBook D 14 W50F | |
| 3DMark | |
| 1280x720 Cloud Gate Standard Graphics | |
| Genomsnitt av klass Multimedia (16765 - 130614, n=31, senaste 2 åren) | |
| Acer Swift 3 SF314-55G-768V | |
| Lenovo Ideapad S340-14IWL-81N70056GE | |
| Genomsnitt NVIDIA GeForce MX230 (13376 - 17999, n=6) | |
| Asus VivoBook 14 F412FJ-EB084T | |
| HP ProBook 445 G6 | |
| Dell Latitude 14 5495 | |
| Huawei Matebook 13-53010FYW | |
| Huawei MateBook D 14 W50F | |
| 1920x1080 Fire Strike Graphics | |
| Genomsnitt av klass Multimedia (2328 - 46022, n=77, senaste 2 åren) | |
| Acer Swift 3 SF314-55G-768V | |
| Lenovo Ideapad S340-14IWL-81N70056GE | |
| Genomsnitt NVIDIA GeForce MX230 (2168 - 2755, n=6) | |
| Asus VivoBook 14 F412FJ-EB084T | |
| HP ProBook 445 G6 | |
| Dell Latitude 14 5495 | |
| Huawei Matebook 13-53010FYW | |
| Huawei MateBook D 14 W50F | |
| 2560x1440 Time Spy Graphics | |
| Genomsnitt av klass Multimedia (696 - 17620, n=78, senaste 2 åren) | |
| Genomsnitt NVIDIA GeForce MX230 (698 - 837, n=4) | |
| Asus VivoBook 14 F412FJ-EB084T | |
| HP ProBook 445 G6 | |
| 3DMark 11 Performance | 3719 poäng | |
| 3DMark Cloud Gate Standard Score | 8886 poäng | |
| 3DMark Fire Strike Score | 2476 poäng | |
Hjälp | ||
| BioShock Infinite | |
| 1920x1080 Ultra Preset, DX11 (DDOF) | |
| Acer Swift 3 SF314-55G-768V | |
| Lenovo Ideapad S340-14IWL-81N70056GE | |
| Genomsnitt NVIDIA GeForce MX230 (26.2 - 31.2, n=5) | |
| Asus VivoBook 14 F412FJ-EB084T | |
| Dell Latitude 14 5495 | |
| HP ProBook 445 G6 | |
| Huawei Matebook 13-53010FYW | |
| 1366x768 High Preset | |
| Acer Swift 3 SF314-55G-768V | |
| Lenovo Ideapad S340-14IWL-81N70056GE | |
| Genomsnitt NVIDIA GeForce MX230 (61.8 - 79.8, n=5) | |
| Asus VivoBook 14 F412FJ-EB084T | |
| HP ProBook 445 G6 | |
| Huawei Matebook 13-53010FYW | |
| Thief | |
| 1920x1080 Very High Preset AA:FXAA & High SS AF:8x | |
| Lenovo Ideapad S340-14IWL-81N70056GE | |
| Genomsnitt NVIDIA GeForce MX230 (n=1) | |
| 1366x768 High Preset AA:FXAA & Low SS AF:4x | |
| Lenovo Ideapad S340-14IWL-81N70056GE | |
| Genomsnitt NVIDIA GeForce MX230 (n=1) | |
| Huawei Matebook 13-53010FYW | |
| låg | med. | hög | ultra | |
|---|---|---|---|---|
| BioShock Infinite (2013) | 170.7 | 81.9 | 79.2 | 31.21 |
| Thief (2014) | 58.7 | 39.4 | 35.6 | 18.3 |
| Dota 2 Reborn (2015) | 126.7 | 113 | 58 | 43.2 |
Ljudnivå
| Låg belastning |
| 30.6 / 30.6 / 31.2 dB(A) |
| Hög belastning |
| 36.5 / 39.7 dB(A) |
 | ||
30 dB tyst 40 dB(A) hörbar 50 dB(A) högt ljud |
||
min: | ||
(-) Den maximala temperaturen på ovansidan är 45.2 °C / 113 F, jämfört med genomsnittet av 36.9 °C / 98 F , allt från 21.1 till 71 °C för klassen Multimedia.
(±) Botten värms upp till maximalt 43.8 °C / 111 F, jämfört med genomsnittet av 39.2 °C / 103 F
(+) Vid tomgångsbruk är medeltemperaturen för ovansidan 25.6 °C / 78 F, jämfört med enhetsgenomsnittet på 31.3 °C / ### class_avg_f### F.
(+) Handledsstöden och pekplattan är kallare än hudtemperaturen med maximalt 29.4 °C / 84.9 F och är därför svala att ta på.
(±) Medeltemperaturen för handledsstödsområdet på liknande enheter var 28.8 °C / 83.8 F (-0.6 °C / -1.1 F).
Lenovo Ideapad S340-14IWL-81N70056GE ljudanalys
(-) | inte särskilt höga högtalare (67.8 dB)
Bas 100 - 315 Hz
(-) | nästan ingen bas - i genomsnitt 20.1% lägre än medianen
(±) | linjäriteten för basen är genomsnittlig (11.5% delta till föregående frekvens)
Mellan 400 - 2000 Hz
(+) | balanserad mellan - endast 3.9% från medianen
(±) | linjäriteten för mids är genomsnittlig (7.1% delta till föregående frekvens)
Högsta 2 - 16 kHz
(+) | balanserade toppar - endast 2.6% från medianen
(+) | toppar är linjära (5.9% delta till föregående frekvens)
Totalt 100 - 16 000 Hz
(±) | linjäriteten för det totala ljudet är genomsnittlig (23.1% skillnad mot median)
Jämfört med samma klass
» 80% av alla testade enheter i den här klassen var bättre, 5% liknande, 14% sämre
» Den bästa hade ett delta på 5%, genomsnittet var 18%, sämst var 45%
Jämfört med alla testade enheter
» 67% av alla testade enheter var bättre, 6% liknande, 28% sämre
» Den bästa hade ett delta på 4%, genomsnittet var 24%, sämst var 134%
Apple MacBook 12 (Early 2016) 1.1 GHz ljudanalys
(+) | högtalare kan spela relativt högt (83.6 dB)
Bas 100 - 315 Hz
(±) | reducerad bas - i genomsnitt 11.3% lägre än medianen
(±) | linjäriteten för basen är genomsnittlig (14.2% delta till föregående frekvens)
Mellan 400 - 2000 Hz
(+) | balanserad mellan - endast 2.4% från medianen
(+) | mids är linjära (5.5% delta till föregående frekvens)
Högsta 2 - 16 kHz
(+) | balanserade toppar - endast 2% från medianen
(+) | toppar är linjära (4.5% delta till föregående frekvens)
Totalt 100 - 16 000 Hz
(+) | det totala ljudet är linjärt (10.2% skillnad mot median)
Jämfört med samma klass
» 6% av alla testade enheter i den här klassen var bättre, 2% liknande, 91% sämre
» Den bästa hade ett delta på 5%, genomsnittet var 19%, sämst var 53%
Jämfört med alla testade enheter
» 4% av alla testade enheter var bättre, 1% liknande, 95% sämre
» Den bästa hade ett delta på 4%, genomsnittet var 24%, sämst var 134%
| Av/Standby | |
| Låg belastning | |
| Hög belastning |
|
Förklaring:
min: | |
| Lenovo Ideapad S340-14IWL-81N70056GE i7-8565U, GeForce MX230, WDC PC SN520 SDAPNUW-512G, IPS, 1920x1080, 14" | Dell Latitude 14 5495 R7 2700U, Vega 10, Intel SSDSCKKF256G8, IPS LED, 1920x1080, 14" | Asus VivoBook 14 F412FJ-EB084T i5-8265U, GeForce MX230, Kingston RBU-SNS8180DS3512GJ, IPS, 1920x1080, 14" | Acer Swift 3 SF314-55G-768V i7-8565U, GeForce MX250, WDC PC SN520 SDAPNUW-512G, IPS, 1920x1080, 14" | Huawei Matebook 13-53010FYW i7-8565U, UHD Graphics 620, WDC PC SN520 SDAPNUW-512G, IPS, 2160x1440, 13" | Genomsnitt NVIDIA GeForce MX230 | Genomsnitt av klass Multimedia | |
|---|---|---|---|---|---|---|---|
| Power Consumption | -14% | -21% | -68% | -33% | -20% | -114% | |
| Idle Minimum * | 2.5 | 4.3 -72% | 3.7 -48% | 7.4 -196% | 3.84 -54% | 3.77 ? -51% | 6.86 ? -174% |
| Idle Average * | 5.1 | 6.6 -29% | 6.1 -20% | 9.9 -94% | 7.68 -51% | 6.16 ? -21% | 11.5 ? -125% |
| Idle Maximum * | 5.6 | 7.7 -38% | 8.3 -48% | 11.7 -109% | 9.36 -67% | 7.06 ? -26% | 13.5 ? -141% |
| Load Average * | 47.5 | 32 33% | 43 9% | 29 39% | 43.2 9% | 49.6 ? -4% | 71.4 ? -50% |
| Load Maximum * | 64.5 | 40 38% | 61.6 4% | 52 19% | 64.8 -0% | 63.3 ? 2% | 116.6 ? -81% |
* ... mindre är bättre
| Lenovo Ideapad S340-14IWL-81N70056GE i7-8565U, GeForce MX230, 52.5 Wh | Dell Latitude 14 5495 R7 2700U, Vega 10, 61 Wh | Asus VivoBook 14 F412FJ-EB084T i5-8265U, GeForce MX230, 37 Wh | Acer Swift 3 SF314-55G-768V i7-8565U, GeForce MX250, 50.7 Wh | Huawei Matebook 13-53010FYW i7-8565U, UHD Graphics 620, 41.7 Wh | Apple MacBook 12 (Early 2016) 1.1 GHz 6Y30, HD Graphics 515, 41.4 Wh | Genomsnitt av klass Multimedia | |
|---|---|---|---|---|---|---|---|
| Batteridrifttid | 33% | -8% | 10% | 8% | 111% | 29% | |
| Reader / Idle | 1393 | 1089 -22% | 968 -31% | 1416 2% | 1197 ? -14% | ||
| WiFi v1.3 | 361 | 562 56% | 331.3 -8% | 484 34% | 419 16% | 501 39% | 645 ? 79% |
| Load | 82 | 136 66% | 104 27% | 88 7% | 231 182% | 99 ? 21% |
För
Emot
Omdöme - En gedigen kollega med medioker batteritid
Läs den fullständiga versionen av den här recensionen på engelska här.
I vårt test framstår Lenovo IdeaPad S340 som en gedigen kollega vars robusta hölje och blygsamma design kommer passa in i valfri företagsmiljö. Systemprestandan är riktigt bra och det går att öka lagringen både genom att byta ut SSD-enheten eller genom att lägga till en SATA-enhet. Men faktum att arbetsminnet inte går att utöka eller byta ger oss en betydande anledning att klaga.
Lenovo IdeaPad S340 är en gedigen kollega med bra systemprestanda. Men batteritiden är under våra förväntningar.
Skärmen är mer än tillräcklig för de flesta uppgifter och passar dessutom användare med känsliga ögon eftersom den inte använder PWM. Bra inmatningsenheter gör det trevligt att använda IdeaPad. Men å andra sidan visar sig batteritiden på bara sex timmar vara ganska kort för en tunn och lätt enhet. Totalt sett är Lenovo IdeaPad S340 en bra kollega för vardagsarbete, förutsatt att du alltid har nära till ett eluttag.
Lenovo Ideapad S340-14IWL-81N70056GE
- 06/11/2019 v6 (old)
Mike Wobker


