

Test: MSI GP63 Leopard 8RE (i7-8750H, GTX 1060, FHD) Xotic PC Edition Laptop (Sammanfattning)


| SD Card Reader | |
| average JPG Copy Test (av. of 3 runs) (sortera efter värde) | |
| MSI GP63 Leopard 8RE-013US (Toshiba Exceria Pro SDXC 64 GB UHS-II) | |
| HP Omen 15-ce002ng (Toshiba Exceria Pro SDXC 64 GB UHS-II) | |
| Acer Aspire VN7-593G-73HP V15 Nitro BE | |
| Asus Strix GL703VM-DB74 (Toshiba Exceria Pro SDXC 64 GB UHS-II) | |
| Eurocom Q6 (Toshiba Exceria Pro SDXC 64 GB UHS-II) | |
| maximum AS SSD Seq Read Test (1GB) (sortera efter värde) | |
| MSI GP63 Leopard 8RE-013US (Toshiba Exceria Pro SDXC 64 GB UHS-II) | |
| HP Omen 15-ce002ng (Toshiba Exceria Pro SDXC 64 GB UHS-II) | |
| Acer Aspire VN7-593G-73HP V15 Nitro BE | |
| Asus Strix GL703VM-DB74 (Toshiba Exceria Pro SDXC 64 GB UHS-II) | |
| Eurocom Q6 (Toshiba Exceria Pro SDXC 64 GB UHS-II) | |
| |||||||||||||||||||||||||
Distribution av ljusstyrkan: 87 %
Mitt på batteriet: 368.5 cd/m²
Kontrast: 1084:1 (Svärta: 0.34 cd/m²)
ΔE Color 8.91 | 0.5-29.43 Ø4.87, calibrated: 2.87
ΔE Greyscale 12 | 0.5-98 Ø5.1
99.98% sRGB (Argyll 1.6.3 3D)
85.94% AdobeRGB 1998 (Argyll 1.6.3 3D)
85.9% AdobeRGB 1998 (Argyll 2.2.0 3D)
100% sRGB (Argyll 2.2.0 3D)
91.5% Display P3 (Argyll 2.2.0 3D)
Gamma: 1.825
| MSI GP63 Leopard 8RE-013US Chi Mei CMN15F4 (N156HHE-GA1 CMN), TN LED, 120 Hz, 15.6", 1920x1080 | HP Omen 15-ce002ng AUO42ED, IPS, 15.6", 1920x1080 | Lenovo Lenovo Legion Y720 80VR002XGE LG Philips LGD0533 LP156WF6-SPK3, IPS, 15.6", 1920x1080 | Acer Aspire VN7-593G-73HP V15 Nitro BE LG Display LP156WF6-SPP1, AH-IPS, Normally Black, Transmissive, 15.6", 1920x1080 | MSI GE63VR 7RF Raider Chi Mei N156HHE-GA1 (CMN15F4), TN LED, 15.6", 1920x1080 | |
|---|---|---|---|---|---|
| Display | -20% | -51% | -24% | 0% | |
| Display P3 Coverage | 91.5 | 65.8 -28% | 38.43 -58% | 65.8 -28% | 91.3 0% |
| sRGB Coverage | 100 | 90.9 -9% | 57.5 -42% | 85.1 -15% | 100 0% |
| AdobeRGB 1998 Coverage | 85.9 | 66.5 -23% | 39.75 -54% | 62.2 -28% | 86.7 1% |
| Response Times | -176% | -95% | -188% | 25% | |
| Response Time Grey 50% / Grey 80% * | 24 ? | 43.2 ? -80% | 43 ? -79% | 41 ? -71% | 9.6 ? 60% |
| Response Time Black / White * | 8.4 ? | 31.2 ? -271% | 24 ? -186% | 34 ? -305% | 7.2 ? 14% |
| PWM Frequency | 26040 ? | 21000 ? -19% | 26000 ? 0% | ||
| Screen | 14% | -4% | 6% | 19% | |
| Brightness middle | 368.5 | 304 -18% | 288 -22% | 322 -13% | 285 -23% |
| Brightness | 341 | 289 -15% | 275 -19% | 297 -13% | 273 -20% |
| Brightness Distribution | 87 | 86 -1% | 86 -1% | 86 -1% | 84 -3% |
| Black Level * | 0.34 | 0.26 24% | 0.36 -6% | 0.31 9% | 0.23 32% |
| Contrast | 1084 | 1169 8% | 800 -26% | 1039 -4% | 1239 14% |
| Colorchecker dE 2000 * | 8.91 | 3.46 61% | 5.29 41% | 4.73 47% | 3.52 60% |
| Colorchecker dE 2000 max. * | 14.39 | 7.72 46% | 9.97 31% | 12.37 14% | 5.18 64% |
| Colorchecker dE 2000 calibrated * | 2.87 | ||||
| Greyscale dE 2000 * | 12 | 2.46 79% | 4.5 62% | 2.99 75% | 3.41 72% |
| Gamma | 1.825 121% | 2.38 92% | 2.39 92% | 2.32 95% | 2.05 107% |
| CCT | 11519 56% | 6915 94% | 6839 95% | 6905 94% | 7077 92% |
| Color Space (Percent of AdobeRGB 1998) | 85.94 | 59 -31% | 37 -57% | 56 -35% | 77 -10% |
| Color Space (Percent of sRGB) | 99.98 | 91 -9% | 57 -43% | 85 -15% | 100 0% |
| Totalt genomsnitt (program/inställningar) | -61% /
-18% | -50% /
-30% | -69% /
-26% | 15% /
16% |
* ... mindre är bättre
Visa svarstider
| ↔ Svarstid svart till vitt | ||
|---|---|---|
| 8.4 ms ... stiga ↗ och falla ↘ kombinerat | ↗ 6 ms stiga |  |
| ↘ 2.4 ms hösten | ||
| Skärmen visar snabba svarsfrekvenser i våra tester och bör passa för spel. I jämförelse sträcker sig alla testade enheter från 0.1 (minst) till 240 (maximalt) ms. » 21 % av alla enheter är bättre. Det betyder att den uppmätta svarstiden är bättre än genomsnittet av alla testade enheter (20.8 ms). | ||
| ↔ Svarstid 50 % grått till 80 % grått | ||
| 24 ms ... stiga ↗ och falla ↘ kombinerat | ↗ 12.8 ms stiga |  |
| ↘ 11.2 ms hösten | ||
| Skärmen visar bra svarsfrekvens i våra tester, men kan vara för långsam för konkurrenskraftiga spelare. I jämförelse sträcker sig alla testade enheter från 0.165 (minst) till 636 (maximalt) ms. » 31 % av alla enheter är bättre. Det betyder att den uppmätta svarstiden är bättre än genomsnittet av alla testade enheter (32.5 ms). | ||
Skärmflimmer / PWM (Puls-Width Modulation)
| Skärmflimmer / PWM upptäckt | 26040 Hz | ≤ 19 % ljusstyrka inställning | 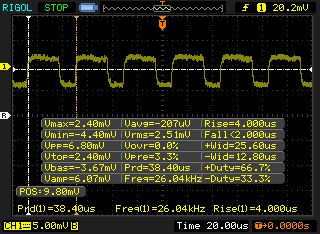 |
Displayens bakgrundsbelysning flimrar vid 26040 Hz (i värsta fall, t.ex. med PWM) Flimrande upptäckt vid en ljusstyrkeinställning på 19 % och lägre. Det ska inte finnas något flimmer eller PWM över denna ljusstyrkeinställning. Frekvensen för 26040 Hz är ganska hög, så de flesta användare som är känsliga för PWM bör inte märka något flimmer. Som jämförelse: 53 % av alla testade enheter använder inte PWM för att dämpa skärmen. Om PWM upptäcktes mättes ett medelvärde av 8516 (minst: 5 - maximum: 343500) Hz. | |||


| PCMark 8 Home Score Accelerated v2 | 4415 poäng | |
| PCMark 8 Creative Score Accelerated v2 | 5336 poäng | |
| PCMark 8 Work Score Accelerated v2 | 5354 poäng | |
Hjälp | ||
| MSI GP63 Leopard 8RE-013US Samsung PM871b MZNLN128HAHQ | Gigabyte Aero 15X Samsung SM961 MZVKW512HMJP m.2 PCI-e | Eurocom Q6 Samsung SSD 960 Pro 512 GB m.2 | MSI GE63VR 7RF Raider Toshiba HG6 THNSNJ256G8NY | Dell Inspiron 15 7000 7577 Samsung PM961 MZVLW256HEHP | |
|---|---|---|---|---|---|
| AS SSD | 259% | 282% | 16% | 145% | |
| Copy Game MB/s | 220.7 | 933 323% | 633 187% | 382.5 73% | |
| Copy Program MB/s | 328.1 | 323.8 -1% | 363.4 11% | 274.8 -16% | |
| Copy ISO MB/s | 690 | 1851 168% | 1768 156% | 814 18% | |
| Score Total | 742 | 3570 381% | 3894 425% | 930 25% | 2405 224% |
| Score Write | 245 | 1333 444% | 1693 591% | 293 20% | 594 142% |
| Score Read | 325 | 1522 368% | 1477 354% | 420 29% | 1241 282% |
| Access Time Write * | 0.072 | 0.033 54% | 0.039 46% | 0.045 37% | 0.037 49% |
| Access Time Read * | 0.155 | 0.068 56% | 0.049 68% | 0.168 -8% | 0.058 63% |
| 4K-64 Write | 137.8 | 1106 703% | 1403 918% | 170.6 24% | 375.8 173% |
| 4K-64 Read | 253 | 1225 384% | 1195 372% | 350.3 38% | 929 267% |
| 4K Write | 60.8 | 113.8 87% | 96.2 58% | 77.3 27% | 100.2 65% |
| 4K Read | 21.88 | 46.56 113% | 29.62 35% | 19.55 -11% | 46.95 115% |
| Seq Write | 462.9 | 1124 143% | 1943 320% | 447 -3% | 1181 155% |
| Seq Read | 504 | 2508 398% | 2523 401% | 506 0% | 2652 426% |
* ... mindre är bättre

| 3DMark 11 Performance | 14174 poäng | |
| 3DMark Cloud Gate Standard Score | 32310 poäng | |
| 3DMark Fire Strike Score | 10722 poäng | |
| 3DMark Fire Strike Extreme Score | 5536 poäng | |
Hjälp | ||
| The Witcher 3 | |
| 1366x768 Medium Graphics & Postprocessing | |
| Eurocom Q6 | |
| MSI GP63 Leopard 8RE-013US | |
| Asus GL702ZC-GC104T | |
| HP Omen 15-ce002ng | |
| Lenovo Lenovo Legion Y720 80VR002XGE | |
| 1920x1080 High Graphics & Postprocessing (Nvidia HairWorks Off) | |
| Eurocom Q6 | |
| Gigabyte Aero 15X v8 | |
| Dell Inspiron 15 7000 7577 | |
| MSI GP63 Leopard 8RE-013US | |
| Asus GL702ZC-GC104T | |
| Lenovo Lenovo Legion Y720 80VR002XGE | |
| HP Omen 15-ce002ng | |
| 1920x1080 Ultra Graphics & Postprocessing (HBAO+) | |
| MSI GE63VR 7RF Raider | |
| Gigabyte Aero 15X v8 | |
| Eurocom Q6 | |
| MSI GP63 Leopard 8RE-013US | |
| Asus Strix GL703VM-DB74 | |
| Asus GL702ZC-GC104T | |
| Lenovo Lenovo Legion Y720 80VR002XGE | |
| Dell Inspiron 15 7000 7577 | |
| HP Omen 15-ce002ng | |
| Rise of the Tomb Raider | |
| 1366x768 Medium Preset AF:2x | |
| Eurocom Q6 | |
| MSI GP63 Leopard 8RE-013US | |
| HP Omen 15-ce002ng | |
| Asus GL702ZC-GC104T | |
| MSI GP62 7REX-1045US | |
| 1920x1080 High Preset AA:FX AF:4x | |
| MSI GE63VR 7RF Raider | |
| Eurocom Q6 | |
| MSI GP63 Leopard 8RE-013US | |
| Dell Inspiron 15 7000 7577 | |
| HP Omen 15-ce002ng | |
| Asus GL702ZC-GC104T | |
| MSI GP62 7REX-1045US | |
| 1920x1080 Very High Preset AA:FX AF:16x | |
| MSI GE63VR 7RF Raider | |
| Eurocom Q6 | |
| MSI GP63 Leopard 8RE-013US | |
| Asus Strix GL703VM-DB74 | |
| Dell Inspiron 15 7000 7577 | |
| Asus GL702ZC-GC104T | |
| HP Omen 15-ce002ng | |
| MSI GP62 7REX-1045US | |
| BioShock Infinite | |
| 1366x768 Medium Preset | |
| Eurocom Q6 | |
| MSI GP63 Leopard 8RE-013US | |
| Lenovo Lenovo Legion Y720 80VR002XGE | |
| MSI GP62 7REX-1045US | |
| 1366x768 High Preset | |
| Eurocom Q6 | |
| MSI GP63 Leopard 8RE-013US | |
| Lenovo Lenovo Legion Y720 80VR002XGE | |
| MSI GP62 7REX-1045US | |
| 1920x1080 Ultra Preset, DX11 (DDOF) | |
| Eurocom Q6 | |
| MSI GP63 Leopard 8RE-013US | |
| Asus Strix GL703VM-DB74 | |
| Lenovo Lenovo Legion Y720 80VR002XGE | |
| Dell Inspiron 15 7000 7577 | |
| MSI GP62 7REX-1045US | |
| låg | med. | hög | ultra | |
|---|---|---|---|---|
| BioShock Infinite (2013) | 272.4 | 233.2 | 225.4 | 115.4 |
| The Witcher 3 (2015) | 197.4 | 138.7 | 68.5 | 42.3 |
| Rise of the Tomb Raider (2016) | 180.3 | 138.2 | 77.3 | 66.6 |
Ljudnivå
| Låg belastning |
| 32.8 / 32.8 / 33 dB(A) |
| Hög belastning |
| 35.8 / 52.3 dB(A) |
 | ||
30 dB tyst 40 dB(A) hörbar 50 dB(A) högt ljud |
||
min: | ||
| MSI GP63 Leopard 8RE-013US GeForce GTX 1060 Mobile, i7-8750H, Samsung PM871b MZNLN128HAHQ | HP Omen 15-ce002ng GeForce GTX 1060 Max-Q, i7-7700HQ, Samsung PM961 MZVLW256HEHP | Lenovo Lenovo Legion Y720 80VR002XGE GeForce GTX 1060 Mobile, i7-7700HQ, Samsung PM961 MZVLW256HEHP | Acer Aspire VN7-593G-73HP V15 Nitro BE GeForce GTX 1060 Mobile, i7-7700HQ, Seagate Mobile HDD 1TB ST1000LM035 | Asus Strix GL703VM-DB74 GeForce GTX 1060 Mobile, i7-7700HQ, Seagate Mobile HDD 1TB ST1000LX015-1U7172 | |
|---|---|---|---|---|---|
| Noise | -0% | 6% | 3% | 2% | |
| av / miljö * | 28.4 | 30 -6% | 30.3 -7% | 30.4 -7% | 28.4 -0% |
| Idle Minimum * | 32.8 | 30 9% | 31 5% | 30.9 6% | 30.2 8% |
| Idle Average * | 32.8 | 33 -1% | 30.9 6% | 30.9 6% | 30.2 8% |
| Idle Maximum * | 33 | 37 -12% | 31.5 5% | 31.5 5% | 30.2 8% |
| Load Average * | 35.8 | 41 -15% | 38.7 -8% | 40.7 -14% | 38.4 -7% |
| Witcher 3 ultra * | 51 | 42 18% | 42 18% | 45.5 11% | 49.7 3% |
| Load Maximum * | 52.3 | 50 4% | 41.9 20% | 43.9 16% | 54.5 -4% |
* ... mindre är bättre


(±) Den maximala temperaturen på ovansidan är 42.2 °C / 108 F, jämfört med genomsnittet av 40.4 °C / 105 F , allt från 21.2 till 68.8 °C för klassen Gaming.
(-) Botten värms upp till maximalt 47.8 °C / 118 F, jämfört med genomsnittet av 43.2 °C / 110 F
(+) Vid tomgångsbruk är medeltemperaturen för ovansidan 25.9 °C / 79 F, jämfört med enhetsgenomsnittet på 33.9 °C / ### class_avg_f### F.
(±) När du spelar The Witcher 3 är medeltemperaturen för ovansidan 34.7 °C / 94 F, jämfört med enhetsgenomsnittet på 33.9 °C / ## #class_avg_f### F.
(+) Handledsstöden och pekplattan är kallare än hudtemperaturen med maximalt 29.6 °C / 85.3 F och är därför svala att ta på.
(±) Medeltemperaturen för handledsstödsområdet på liknande enheter var 28.9 °C / 84 F (-0.7 °C / -1.3 F).
MSI GP63 Leopard 8RE-013US ljudanalys
(±) | högtalarljudstyrkan är genomsnittlig men bra (78.3 dB)
Bas 100 - 315 Hz
(-) | nästan ingen bas - i genomsnitt 23.1% lägre än medianen
(±) | linjäriteten för basen är genomsnittlig (10.6% delta till föregående frekvens)
Mellan 400 - 2000 Hz
(+) | balanserad mellan - endast 3% från medianen
(±) | linjäriteten för mids är genomsnittlig (7.1% delta till föregående frekvens)
Högsta 2 - 16 kHz
(±) | högre toppar - i genomsnitt 5.8% högre än medianen
(+) | toppar är linjära (6% delta till föregående frekvens)
Totalt 100 - 16 000 Hz
(±) | linjäriteten för det totala ljudet är genomsnittlig (21.2% skillnad mot median)
Jämfört med samma klass
» 75% av alla testade enheter i den här klassen var bättre, 4% liknande, 21% sämre
» Den bästa hade ett delta på 6%, genomsnittet var 18%, sämst var 132%
Jämfört med alla testade enheter
» 56% av alla testade enheter var bättre, 7% liknande, 37% sämre
» Den bästa hade ett delta på 4%, genomsnittet var 24%, sämst var 134%
Apple MacBook 12 (Early 2016) 1.1 GHz ljudanalys
(+) | högtalare kan spela relativt högt (83.6 dB)
Bas 100 - 315 Hz
(±) | reducerad bas - i genomsnitt 11.3% lägre än medianen
(±) | linjäriteten för basen är genomsnittlig (14.2% delta till föregående frekvens)
Mellan 400 - 2000 Hz
(+) | balanserad mellan - endast 2.4% från medianen
(+) | mids är linjära (5.5% delta till föregående frekvens)
Högsta 2 - 16 kHz
(+) | balanserade toppar - endast 2% från medianen
(+) | toppar är linjära (4.5% delta till föregående frekvens)
Totalt 100 - 16 000 Hz
(+) | det totala ljudet är linjärt (10.2% skillnad mot median)
Jämfört med samma klass
» 6% av alla testade enheter i den här klassen var bättre, 2% liknande, 91% sämre
» Den bästa hade ett delta på 5%, genomsnittet var 19%, sämst var 53%
Jämfört med alla testade enheter
» 4% av alla testade enheter var bättre, 1% liknande, 95% sämre
» Den bästa hade ett delta på 4%, genomsnittet var 24%, sämst var 134%
| Av/Standby | |
| Låg belastning | |
| Hög belastning |
|
Förklaring:
min: | |
| MSI GP63 Leopard 8RE-013US i7-8750H, GeForce GTX 1060 Mobile, Samsung PM871b MZNLN128HAHQ, TN LED, 120 Hz, 1920x1080, 15.6" | HP Omen 15-ce002ng i7-7700HQ, GeForce GTX 1060 Max-Q, Samsung PM961 MZVLW256HEHP, IPS, 1920x1080, 15.6" | Lenovo Lenovo Legion Y720 80VR002XGE i7-7700HQ, GeForce GTX 1060 Mobile, Samsung PM961 MZVLW256HEHP, IPS, 1920x1080, 15.6" | Dell Inspiron 15 7000 7577 i5-7300HQ, GeForce GTX 1060 Max-Q, Samsung PM961 MZVLW256HEHP, IPS, 1920x1080, 15.6" | MSI GP62 7REX-1045US i7-7700HQ, GeForce GTX 1050 Ti Mobile, Toshiba NVMe THNSN5128GP, TN LED, 1920x1080, 15.6" | |
|---|---|---|---|---|---|
| Power Consumption | -46% | 17% | 34% | -14% | |
| Idle Minimum * | 7.99 | 18 -125% | 8 -0% | 7.1 11% | 14.6 -83% |
| Idle Average * | 12.15 | 23 -89% | 10.9 10% | 7.6 37% | 17.2 -42% |
| Idle Maximum * | 13.4 | 30 -124% | 11.8 12% | 8.6 36% | 17.3 -29% |
| Load Average * | 103.62 | 85 18% | 70 32% | 59.5 43% | 82.7 20% |
| Witcher 3 ultra * | 156.1 | 96 39% | 102 35% | 89 43% | 107 31% |
| Load Maximum * | 164.29 | 158 4% | 148 10% | 112.8 31% | 136.7 17% |
* ... mindre är bättre
| MSI GP63 Leopard 8RE-013US i7-8750H, GeForce GTX 1060 Mobile, 51 Wh | HP Omen 15-ce002ng i7-7700HQ, GeForce GTX 1060 Max-Q, 70 Wh | Lenovo Lenovo Legion Y720 80VR002XGE i7-7700HQ, GeForce GTX 1060 Mobile, 60 Wh | Acer Aspire VN7-593G-73HP V15 Nitro BE i7-7700HQ, GeForce GTX 1060 Mobile, 69 Wh | MSI GP62 7REX-1045US i7-7700HQ, GeForce GTX 1050 Ti Mobile, 41 Wh | Dell Inspiron 15 7000 7577 i5-7300HQ, GeForce GTX 1060 Max-Q, 56 Wh | |
|---|---|---|---|---|---|---|
| Batteridrifttid | -7% | 42% | 71% | -34% | 59% | |
| Reader / Idle | 451 | 256 -43% | 707 57% | 501 11% | 259 -43% | 659 46% |
| WiFi v1.3 | 286 | 198 -31% | 380 33% | 357 25% | 174 -39% | 416 45% |
| Load | 52 | 80 54% | 71 37% | 144 177% | 41 -21% | 96 85% |
För
Emot


Läs den fullständiga versionen av den här recensionen på engelska här.
MSI GP63 Leopard Xotic PC Edition tar efter där föregångaren GP62 slutade. Chassits kvalitet är fortfarande inte särskilt imponerande, men den uppdaterade hårdvaran i form av en sexkärnig Coffee Lake H CPU och ett aningen kraftigare GTX 1060-grafikkort garanterar en betydande ökning i prestanda och en roligare spelupplevelse. Vi uppskattade också den extra USB 3.0-porten som lades till i förmån för den tidigare inbyggda DVD+/-RW-enheten. Det bakgrundsbelysta RGB-tangentbordet med tre zoner är fortfarande ett nöje att använda och styrplattan gör sitt jobb väl. TN-skärmen med stöd för 120 Hz är ljusstark med betraktningsvinklar som är acceptabla och har - åtminstone efter kalibrering - skapligt noggranna färger och gråskalor. Batteriets kapacitet har också ökat, så maskinen kan i begränsad utsträckning tjäna som en allt-i-allo-laptop.
MSI:s värmehantering förblir ganska konservativ trots det uppgraderade och rejält förbättrade kylsystemet, som nu har sju värmerör istället för sex. Även om CPU-temperaturerna generellt sett håller sig lägre än vi hade förväntat oss så tar den rena processorkraften också skada av detta. Vi anser att en 128 GB primär SSD är minimum nuförtiden och hade vi fått valet hade vi troligen uppgraderat till en större och snabbare PCIe NVMe SSD på 256 GB. Trots 120 Hz-skärmen finns G-Sync inte tillgängligt.
MSI GP63 Leopard Xotic PC Edition är en väluppfostrad spellaptop med fullt tillräcklig prestanda - men den kommer inte till ett reapris.
MSI GP63 Leopard 8RE-013US
- 06/13/2018 v6 (old)
Bernie Pechlaner
Price comparison
