Notebookcheck Logo

Test: MSI GeForce RTX 3080 Gaming X Trio 10G (Sammanfattning)

Konsekvent bra!

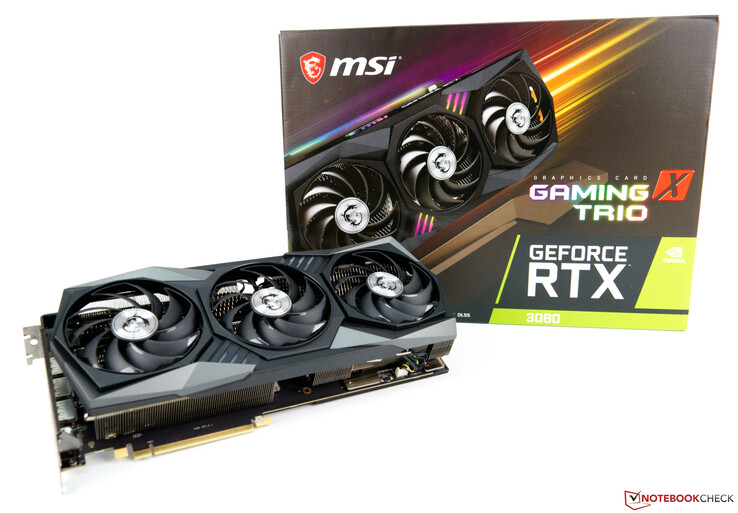
Gaming X Trio-serien har funnits på marknaden länge och har alltid lite högre prestanda än Nvidias referensmodell tack vare riktigt bra kylning och högre TDP-värden. Således får GeForce RTX 3080 Gaming X Trio också en 340-Watt BIOS och är trots det väldigt diskret i fråga om ljudnivå vid belastning. Vår recension kommer avslöja vad mer MSI:s nya modell har att erbjuda.
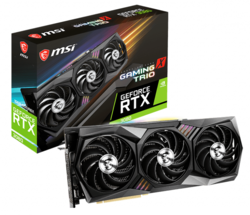
MSI GeForce RTX 3080 Gaming X Trio
MSI GeForce RTX 3080 Gaming X Trio (källa: MSI)
MSI GeForce RTX 3080 Gaming X Trio vs. MSI GeForce RTX 3070 Gaming X Trio
3DMark
1920x1080 Fire Strike Graphics
Radeon RX 6800 XT
49735 Points +32%
NVIDIA GeForce RTX 3090
42688 Points +14%
NVIDIA GeForce RTX 3080
40910 Points +9%
MSI GeForce RTX 3080 Gaming X Trio
37604 Points
NVIDIA Titan RTX
34722 Points -8%
GeForce RTX 2080 Ti (Desktop)
32081 Points -15%
NVIDIA GeForce RTX 3070
31096 Points -17%
GeForce RTX 2080 (Desktop)
27620 Points -27%
Radeon VII
27476 Points -27%
GeForce RTX 2080 Super (Desktop)
27075 Points -28%
Radeon RX 5700 XT (Desktop)
25383 Points -32%
GeForce RTX 2070 Super (Desktop)
24151 Points -36%
GeForce RTX 2070 (Desktop)
22999 Points -39%
Radeon RX 5700 (Desktop)
22457 Points -40%
RX Vega 64
22338 Points -41%
GeForce RTX 2060 Super (Desktop)
21970 Points -42%
GeForce RTX 2060 (Desktop)
19338 Points -49%
Fire Strike Extreme Graphics
Radeon RX 6800 XT
25015 Points +25%
NVIDIA GeForce RTX 3090
23114 Points +16%
NVIDIA GeForce RTX 3080
20861 Points +4%
MSI GeForce RTX 3080 Gaming X Trio
20007 Points
NVIDIA Titan RTX
17176 Points -14%
NVIDIA GeForce RTX 3070
16196 Points -19%
GeForce RTX 2080 Ti (Desktop)
15603 Points -22%
Radeon VII
13388 Points -33%
GeForce RTX 2080 (Desktop)
13355 Points -33%
GeForce RTX 2080 Super (Desktop)
12968 Points -35%
Radeon RX 5700 XT (Desktop)
12209 Points -39%
GeForce RTX 2070 Super (Desktop)
11634 Points -42%
GeForce RTX 2070 (Desktop)
11021 Points -45%
Radeon RX 5700 (Desktop)
10876 Points -46%
RX Vega 64
10758 Points -46%
GeForce RTX 2060 Super (Desktop)
10481 Points -48%
GeForce RTX 2060 (Desktop)
9097 Points -55%
3840x2160 Fire Strike Ultra Graphics
Radeon RX 6800 XT
12626 Points +19%
NVIDIA GeForce RTX 3090
12371 Points +16%
NVIDIA GeForce RTX 3080
10793 Points +1%
MSI GeForce RTX 3080 Gaming X Trio
10645 Points
NVIDIA Titan RTX
8649 Points -19%
NVIDIA GeForce RTX 3070
8483 Points -20%
GeForce RTX 2080 Ti (Desktop)
7925 Points -26%
Radeon VII
6837 Points -36%
GeForce RTX 2080 (Desktop)
6513 Points -39%
GeForce RTX 2080 Super (Desktop)
6500 Points -39%
Radeon RX 5700 XT (Desktop)
5955 Points -44%
GeForce RTX 2070 Super (Desktop)
5786 Points -46%
GeForce RTX 2070 (Desktop)
5450 Points -49%
RX Vega 64
5441 Points -49%
Radeon RX 5700 (Desktop)
5292 Points -50%
GeForce RTX 2060 Super (Desktop)
5175 Points -51%
GeForce RTX 2060 (Desktop)
4244 Points -60%
2560x1440 Time Spy Graphics
NVIDIA GeForce RTX 3090
19571 Points +11%
MSI GeForce RTX 3080 Gaming X Trio
17604 Points
Radeon RX 6800 XT
17603 Points 0%
NVIDIA GeForce RTX 3080
17467 Points -1%
NVIDIA Titan RTX
15283 Points -13%
GeForce RTX 2080 Ti (Desktop)
13744 Points -22%
NVIDIA GeForce RTX 3070
13579 Points -23%
GeForce RTX 2080 Super (Desktop)
11477 Points -35%
GeForce RTX 2080 (Desktop)
11294 Points -36%
GeForce RTX 2070 Super (Desktop)
10094 Points -43%
GeForce RTX 2070 (Desktop)
9236 Points -48%
Radeon VII
8803 Points -50%
GeForce RTX 2060 Super (Desktop)
8795 Points -50%
Radeon RX 5700 XT (Desktop)
8673 Points -51%
GeForce RTX 2060 (Desktop)
7732 Points -56%
Radeon RX 5700 (Desktop)
7675 Points -56%
RX Vega 64
7183 Points -59%
Unigine Superposition
1280x720 720p Low
NVIDIA Titan RTX
40994 Points +27%
Radeon RX 6800 XT
36452 Points +13%
NVIDIA GeForce RTX 3090
33329 Points +4%
MSI GeForce RTX 3080 Gaming X Trio
32183 Points
NVIDIA GeForce RTX 3070
31666 Points -2%
NVIDIA GeForce RTX 3080
30851 Points -4%
1920x1080 1080p High
NVIDIA GeForce RTX 3090
25953 Points +18%
Radeon RX 6800 XT
22265 Points +2%
MSI GeForce RTX 3080 Gaming X Trio
21912 Points
NVIDIA GeForce RTX 3080
21333 Points -3%
NVIDIA Titan RTX
20315 Points -7%
NVIDIA GeForce RTX 3070
17346 Points -21%
1920x1080 1080p Extreme
NVIDIA GeForce RTX 3090
12694 Points +17%
MSI GeForce RTX 3080 Gaming X Trio
10822 Points
NVIDIA GeForce RTX 3080
10572 Points -2%
Radeon RX 6800 XT
10046 Points -7%
NVIDIA Titan RTX
9056 Points -16%
NVIDIA GeForce RTX 3070
8507 Points -21%
3840x2160 4k Optimized
NVIDIA GeForce RTX 3090
16868 Points +18%
MSI GeForce RTX 3080 Gaming X Trio
14243 Points
NVIDIA GeForce RTX 3080
13984 Points -2%
Radeon RX 6800 XT
13471 Points -5%
NVIDIA Titan RTX
12186 Points -14%
NVIDIA GeForce RTX 3070
10755 Points -24%
7680x4320 8k Optimized
NVIDIA GeForce RTX 3090
7521 Points +19%
MSI GeForce RTX 3080 Gaming X Trio
6346 Points
NVIDIA GeForce RTX 3080
6243 Points -2%
NVIDIA Titan RTX
5402 Points -15%
Radeon RX 6800 XT
5256 Points -17%
NVIDIA GeForce RTX 3070
4695 Points -26%
Unigine Heaven 4.0
Extreme Preset OpenGL
NVIDIA GeForce RTX 3090
273.7 fps +13%
MSI GeForce RTX 3080 Gaming X Trio
243.2 fps
NVIDIA GeForce RTX 3080
232.4 fps -4%
NVIDIA Titan RTX
215.1 fps -12%
GeForce RTX 2080 Ti (Desktop)
204.4 fps -16%
Radeon RX 6800 XT
204 fps -16%
NVIDIA GeForce RTX 3070
196.1 fps -19%
GeForce RTX 2080 Super (Desktop)
167.5 fps -31%
GeForce RTX 2080 (Desktop)
161.4 fps -34%
GeForce RTX 2070 Super (Desktop)
153.5 fps -37%
GeForce RTX 2070 (Desktop)
139 fps -43%
GeForce RTX 2060 Super (Desktop)
132.3 fps -46%
GeForce RTX 2060 (Desktop)
115.8 fps -52%
Radeon RX 5700 XT (Desktop)
110.2 fps -55%
Radeon VII
109 fps -55%
Radeon RX 5700 (Desktop)
100.7 fps -59%
Extreme Preset DX11
NVIDIA GeForce RTX 3090
283.5 fps +12%
MSI GeForce RTX 3080 Gaming X Trio
252.5 fps
Radeon RX 6800 XT
247.9 fps -2%
NVIDIA Titan RTX
237.1 fps -6%
NVIDIA GeForce RTX 3080
232.6 fps -8%
GeForce RTX 2080 Ti (Desktop)
215.2 fps -15%
NVIDIA GeForce RTX 3070
202.5 fps -20%
GeForce RTX 2080 (Desktop)
176.5 fps -30%
GeForce RTX 2080 Super (Desktop)
175.2 fps -31%
GeForce RTX 2070 Super (Desktop)
160.1 fps -37%
GeForce RTX 2070 (Desktop)
149.3 fps -41%
GeForce RTX 2060 Super (Desktop)
141.7 fps -44%
Radeon VII
140.3 fps -44%
Radeon RX 5700 XT (Desktop)
132.5 fps -48%
GeForce RTX 2060 (Desktop)
124.1 fps -51%
Radeon RX 5700 (Desktop)
119.9 fps -53%
Unigine Valley 1.0
1920x1080 Extreme HD DirectX AA:x8
NVIDIA GeForce RTX 3090
196 fps +8%
Radeon RX 6800 XT
190.6 fps +5%
MSI GeForce RTX 3080 Gaming X Trio
181.8 fps
NVIDIA Titan RTX
180.1 fps -1%
NVIDIA GeForce RTX 3080
176.2 fps -3%
GeForce RTX 2080 Ti (Desktop)
159.4 fps -12%
NVIDIA GeForce RTX 3070
155.1 fps -15%
GeForce RTX 2080 Super (Desktop)
120.2 fps -34%
GeForce RTX 2080 (Desktop)
119.6 fps -34%
GeForce RTX 2070 Super (Desktop)
113.7 fps -37%
GeForce RTX 2070 (Desktop)
111.5 fps -39%
Radeon VII
108.5 fps -40%
GeForce RTX 2060 Super (Desktop)
106.9 fps -41%
Radeon RX 5700 XT (Desktop)
106.3 fps -42%
Radeon RX 5700 (Desktop)
99.3 fps -45%
GeForce RTX 2060 (Desktop)
91.2 fps -50%
1920x1080 Extreme HD Preset OpenGL AA:x8
NVIDIA GeForce RTX 3090
187.8 fps +9%
MSI GeForce RTX 3080 Gaming X Trio
172 fps
NVIDIA GeForce RTX 3080
163.8 fps -5%
NVIDIA Titan RTX
158.5 fps -8%
Radeon RX 6800 XT
158.2 fps -8%
GeForce RTX 2080 Ti (Desktop)
145.1 fps -16%
NVIDIA GeForce RTX 3070
142.9 fps -17%
GeForce RTX 2080 Super (Desktop)
114.5 fps -33%
GeForce RTX 2080 (Desktop)
110.5 fps -36%
GeForce RTX 2070 Super (Desktop)
105.6 fps -39%
GeForce RTX 2070 (Desktop)
101 fps -41%
GeForce RTX 2060 Super (Desktop)
98.3 fps -43%
Radeon RX 5700 XT (Desktop)
89.1 fps -48%
GeForce RTX 2060 (Desktop)
83.6 fps -51%
Radeon RX 5700 (Desktop)
82.7 fps -52%
Radeon VII
81.3 fps -53%
SiSoft Sandra 2016
GP Financial Analysis (FP High/Double Precision)
Radeon VII
1130 KOPT/s +412%
Radeon RX 6800 XT
381.8 KOPT/s +73%
NVIDIA GeForce RTX 3090
254.4 KOPT/s +15%
MSI GeForce RTX 3080 Gaming X Trio
220.9 KOPT/s
NVIDIA GeForce RTX 3080
212.8 KOPT/s -4%
GeForce RTX 2080 Ti (Desktop)
206.8 KOPT/s -6%
GeForce RTX 2080 (Desktop)
159.4 KOPT/s -28%
GeForce RTX 2080 Super (Desktop)
151.5 KOPT/s -31%
NVIDIA GeForce RTX 3070
149.2 KOPT/s -32%
GeForce RTX 2070 Super (Desktop)
124.7 KOPT/s -44%
GeForce RTX 2070 (Desktop)
121.3 KOPT/s -45%
GeForce RTX 2060 Super (Desktop)
105.3 KOPT/s -52%
GeForce RTX 2060 (Desktop)
99.1 KOPT/s -55%
Radeon RX 5700 XT (Desktop)
24 KOPT/s -89%
Radeon RX 5700 (Desktop)
20.81 KOPT/s -91%
GP Cryptography (Higher Security AES256+SHA2-512)
NVIDIA GeForce RTX 3090
200.4 GB/s +15%
MSI GeForce RTX 3080 Gaming X Trio
174 GB/s
NVIDIA GeForce RTX 3080
172.9 GB/s -1%
Radeon RX 6800 XT
160.8 GB/s -8%
GeForce RTX 2080 Ti (Desktop)
129.3 GB/s -26%
NVIDIA GeForce RTX 3070
121.5 GB/s -30%
GeForce RTX 2080 (Desktop)
101.8 GB/s -41%
Radeon VII
99.2 GB/s -43%
GeForce RTX 2080 Super (Desktop)
95.7 GB/s -45%
GeForce RTX 2070 Super (Desktop)
88.4 GB/s -49%
GeForce RTX 2070 (Desktop)
75.4 GB/s -57%
GeForce RTX 2060 Super (Desktop)
74.6 GB/s -57%
GeForce RTX 2060 (Desktop)
63.8 GB/s -63%
Image Processing
Radeon RX 6800 XT
6196 MPix/s +62%
NVIDIA GeForce RTX 3090
4437 MPix/s +16%
MSI GeForce RTX 3080 Gaming X Trio
3813 MPix/s
NVIDIA GeForce RTX 3080
3721 MPix/s -2%
Radeon VII
2800 MPix/s -27%
NVIDIA GeForce RTX 3070
2586 MPix/s -32%
GeForce RTX 2080 Ti (Desktop)
1959 MPix/s -49%
GeForce RTX 2080 Super (Desktop)
1430 MPix/s -62%
GeForce RTX 2080 (Desktop)
1380 MPix/s -64%
GeForce RTX 2070 Super (Desktop)
1250 MPix/s -67%
GeForce RTX 2070 (Desktop)
1150 MPix/s -70%
GeForce RTX 2060 Super (Desktop)
1110 MPix/s -71%
Radeon RX 5700 XT (Desktop)
919 MPix/s -76%
GeForce RTX 2060 (Desktop)
912 MPix/s -76%
Radeon RX 5700 (Desktop)
775 MPix/s -80%
3DMark 03 Standard
136483 poäng
3DMark 05 Standard
34535 poäng
3DMark 06 Standard Score
35659 poäng
3DMark Vantage P Result
62128 poäng
3DMark 11 Performance
26565 poäng
3DMark Ice Storm Standard Score
197964 poäng
3DMark Cloud Gate Standard Score
48366 poäng
3DMark Fire Strike Score
20451 poäng
3DMark Fire Strike Extreme Score
12092 poäng
3DMark Time Spy Score
8797 poäng
Hjälp
Far Cry New Dawn - 3840x2160 Ultra Preset
NVIDIA GeForce RTX 3090
96 (71min - 125max) fps +9%
Radeon RX 6800 XT
94 (75min - 129max) fps +7%
NVIDIA GeForce RTX 3080
89 (72min - 108max) fps +1%
MSI GeForce RTX 3080 Gaming X Trio
88 (71min - 110max) fps
NVIDIA Titan RTX
84 (71min - 100max) fps -5%
NVIDIA Titan RTX
81 (68min - 98max) fps -8%
GeForce RTX 2080 Ti (Desktop)
73 (59min - 92max) fps -17%
NVIDIA GeForce RTX 3070
70 (52min - 86max) fps -20%
GeForce RTX 2080 Super (Desktop)
64 (54min - 81max) fps -27%
GeForce RTX 2080 (Desktop)
62 (52min - 76max) fps -30%
Radeon VII
61 (50min - 80max) fps -31%
GeForce RTX 2070 Super (Desktop)
58 (48min - 72max) fps -34%
Radeon RX 5700 XT (Desktop)
56 (47min - 73max) fps -36%
GeForce RTX 2070 (Desktop)
51 (43min - 61max) fps -42%
Radeon RX 5700 (Desktop)
51 (42min - 67max) fps -42%
GeForce RTX 2060 Super (Desktop)
50 (41min - 62max) fps -43%
RX Vega 64
47 (38min - 60max) fps -47%
GeForce RTX 2060 (Desktop)
42 (35min - 52max) fps -52%
Far Cry 5 - 3840x2160 Ultra Preset AA:T
NVIDIA GeForce RTX 3090
106 (84min - 123max) fps +14%
NVIDIA GeForce RTX 3080
95 (85min - 107max) fps +2%
Radeon RX 6800 XT
95 (72min - 124max) fps +2%
MSI GeForce RTX 3080 Gaming X Trio
93 (78min - 109max) fps
NVIDIA Titan RTX
81 (73min - 95max) fps -13%
NVIDIA Titan RTX
78 (66min - 93max) fps -16%
GeForce RTX 2080 Ti (Desktop)
74 (65min - 88max) fps -20%
NVIDIA GeForce RTX 3070
69 (61min - 81max) fps -26%
GeForce RTX 2080 Super (Desktop)
61 (53min - 70max) fps -34%
GeForce RTX 2080 (Desktop)
59 (53min - 71max) fps -37%
Radeon VII
59 (50min - 75max) fps -37%
GeForce RTX 2070 Super (Desktop)
54 (48min - 65max) fps -42%
Radeon RX 5700 XT (Desktop)
51 (44min - 66max) fps -45%
GeForce RTX 2070 (Desktop)
48 (41min - 57max) fps -48%
GeForce RTX 2060 Super (Desktop)
45 (40min - 55max) fps -52%
Radeon RX 5700 (Desktop)
45 (38min - 58max) fps -52%
RX Vega 64
44 (37min - 56max) fps -53%
GeForce RTX 2060 (Desktop)
41 (37min - 49max) fps -56%
F1 2020 - 3840x2160 Ultra High Preset AA:T AF:16x
NVIDIA GeForce RTX 3090
144 (123min - 166max) fps +26%
Radeon RX 6800 XT
128 (106min - 152max) fps +12%
NVIDIA GeForce RTX 3080
118 (102min - 137max) fps +4%
MSI GeForce RTX 3080 Gaming X Trio
114 (100min - 136max) fps
NVIDIA Titan RTX
97.4 (84min - 114max) fps -15%
NVIDIA GeForce RTX 3070
89.2 (73min - 104max) fps -22%
Borderlands 3 - 3840x2160 Badass Overall Quality (DX11)
NVIDIA GeForce RTX 3090
73.4 fps +19%
MSI GeForce RTX 3080 Gaming X Trio
61.9 fps
NVIDIA GeForce RTX 3080
61.5 fps -1%
Radeon RX 6800 XT
53.6 fps -13%
NVIDIA Titan RTX
46.7 fps -25%
NVIDIA Titan RTX
46 fps -26%
NVIDIA GeForce RTX 3070
44.2 fps -29%
GeForce RTX 2080 Ti (Desktop)
43.6 fps -30%
Metro Exodus - 3840x2160 Ultra Quality AF:16x
NVIDIA GeForce RTX 3090
76.3 (45.25min - 131.44max) fps +16%
MSI GeForce RTX 3080 Gaming X Trio
65.9 (38.48min - 122.03max) fps
NVIDIA GeForce RTX 3080
64.1 (36.54min - 108.57max) fps -3%
Radeon RX 6800 XT
56.3 (40.14min - 64.28max) fps -15%
NVIDIA Titan RTX
54.9 (34.88min - 89.73max) fps -17%
NVIDIA Titan RTX
53.7 (33.8min - 83.74max) fps -19%
NVIDIA GeForce RTX 3070
49.1 (30.24min - 89.89max) fps -25%
GeForce RTX 2080 Ti (Desktop)
47.5 (31min - 69max) fps -28%
RX Vega 64
45.7 (26min - 67max) fps -31%
GeForce RTX 2080 Super (Desktop)
40 (25.84min - 59.35max) fps -39%
GeForce RTX 2080 (Desktop)
38.6 (25min - 58max) fps -41%
Radeon VII
37.4 (25min - 50max) fps -43%
GeForce RTX 2070 Super (Desktop)
35 (23min - 51max) fps -47%
GeForce RTX 2070 (Desktop)
31.9 (21min - 45max) fps -52%
GeForce RTX 2060 Super (Desktop)
29.7 (20min - 42max) fps -55%
Radeon RX 5700 XT (Desktop)
29.6 (20.7min - 36.64max) fps -55%
Radeon RX 5700 (Desktop)
28.6 (19.67min - 36.24max) fps -57%
GeForce RTX 2060 (Desktop)
26.3 (17min - 38max) fps -60%
Red Dead Redemption 2 - 3840x2160 Maximum Settings
NVIDIA GeForce RTX 3090
67 (34min - 98max) fps +19%
MSI GeForce RTX 3080 Gaming X Trio
56.4 (33min - 92max) fps
NVIDIA GeForce RTX 3080
56 fps -1%
Radeon RX 6800 XT
52.9 (41min, 45.5P1 - 65.3max) fps -6%
NVIDIA GeForce RTX 3070
44 (32min - 55max) fps -22%
NVIDIA Titan RTX
41 (29min - 50max) fps -27%
Rise of the Tomb Raider - 3840x2160 High Preset AA:FX AF:4x
NVIDIA GeForce RTX 3090
128 (117min - 145max) fps +12%
MSI GeForce RTX 3080 Gaming X Trio
114 (105min - 133max) fps
NVIDIA GeForce RTX 3080
107 (99min - 120max) fps -6%
Radeon RX 6800 XT
98.4 (89min - 121max) fps -14%
GeForce RTX 2080 Ti (Desktop)
93 (86min - 104max) fps -18%
NVIDIA GeForce RTX 3070
83.8 (75min - 93max) fps -26%
GeForce RTX 2080 Super (Desktop)
79 (72min - 87max) fps -31%
GeForce RTX 2080 (Desktop)
77 (71min - 85max) fps -32%
GeForce RTX 2070 Super (Desktop)
68 (60min - 75max) fps -40%
GeForce RTX 2070 (Desktop)
58.1 (53min - 68max) fps -49%
Radeon VII
56.3 (51min - 65max) fps -51%
GeForce RTX 2060 Super (Desktop)
53.4 (47min - 61max) fps -53%
RX Vega 64
50.4 (45min - 57max) fps -56%
GeForce RTX 2060 (Desktop)
47.3 (43min - 55max) fps -59%
Shadow of the Tomb Raider - 3840x2160 Highest Preset AA:T
NVIDIA GeForce RTX 3090
95.6 fps +9%
MSI GeForce RTX 3080 Gaming X Trio
87.9 fps
NVIDIA GeForce RTX 3080
83.9 fps -5%
Radeon RX 6800 XT
79.6 fps -9%
NVIDIA Titan RTX
66.3 fps -25%
NVIDIA Titan RTX
66 fps -25%
NVIDIA GeForce RTX 3070
61 fps -31%
GeForce RTX 2080 Ti (Desktop)
60 fps -32%
GeForce RTX 2080 Super (Desktop)
49 fps -44%
GeForce RTX 2080 (Desktop)
48 fps -45%
Radeon VII
44 fps -50%
GeForce RTX 2070 Super (Desktop)
43 fps -51%
GeForce RTX 2070 (Desktop)
40 fps -54%
Radeon RX 5700 XT (Desktop)
38 fps -57%
GeForce RTX 2060 Super (Desktop)
36 fps -59%
Radeon RX 5700 (Desktop)
34 fps -61%
GeForce RTX 2060 (Desktop)
32 fps -64%
RX Vega 64
29 fps -67%
Mafia Definitive Edition - 3840x2160 High Preset
NVIDIA GeForce RTX 3090
89.1 (42.7min, 53.9P0.1, 62.7P1 - 175max) fps +14%
NVIDIA GeForce RTX 3080
78.2 (17.9min, 31P0.1, 59.3P1 - 292max) fps 0%
MSI GeForce RTX 3080 Gaming X Trio
78.1 (44.8min, 50.5P0.1, 54.7P1 - 175max) fps
NVIDIA Titan RTX
63.4 fps -19%
Radeon RX 6800 XT
62.6 (28min, 37.6P0.1, 49.2P1 - 87.3max) fps -20%
NVIDIA GeForce RTX 3070
56.6 (34.7min, 37.9P0.1, 44.2P1 - 177max) fps -28%
Watch Dogs Legion - 3840x2160 Ultra Preset (DX12)
NVIDIA GeForce RTX 3090
60.3 (34.68min, 51.05P1 - 78.14max) fps +13%
NVIDIA GeForce RTX 3080
54.1 (24.72min, 44.97P1 - 114.7max) fps +1%
MSI GeForce RTX 3080 Gaming X Trio
53.5 (33.98min, 42.85P1 - 79.6max) fps
Radeon RX 6800 XT
49.3 (32.85min, 41.54P1 - 76.12max) fps -8%
NVIDIA Titan RTX
43.4 (22.94min, 35.76P1 - 80.93max) fps -19%
NVIDIA GeForce RTX 3070
37 (17.44min, 25.32P1 - 81.3max) fps -31%
The Witcher 3 - 3840x2160 High Graphics & Postprocessing (Nvidia HairWorks Off)
NVIDIA GeForce RTX 3090
128 (117min - 138max) fps +12%
NVIDIA GeForce RTX 3080
115 (107min - 124max) fps +1%
MSI GeForce RTX 3080 Gaming X Trio
114 (106min - 122max) fps
Radeon RX 6800 XT
110 (97min - 117max) fps -4%
NVIDIA Titan RTX
104 (97min - 112max) fps -9%
NVIDIA Titan RTX
102 (95min - 110max) fps -11%
GeForce RTX 2080 Ti (Desktop)
96 (87min - 109max) fps -16%
NVIDIA GeForce RTX 3070
88.2 (82min - 97max) fps -23%
GeForce RTX 2080 Super (Desktop)
79 (71min - 87max) fps -31%
GeForce RTX 2080 (Desktop)
78 (69min - 87max) fps -32%
GeForce RTX 2070 Super (Desktop)
68 (61min - 74max) fps -40%
GeForce RTX 2070 (Desktop)
64.3 (59min - 70max) fps -44%
GeForce RTX 2060 Super (Desktop)
57 (51min - 62max) fps -50%
Radeon VII
54.3 (50min - 59max) fps -52%
Radeon RX 5700 XT (Desktop)
52.1 (47min - 57max) fps -54%
GeForce RTX 2060 (Desktop)
51.3 (44min - 58max) fps -55%
RX Vega 64
49.1 (44min - 54max) fps -57%
Radeon RX 5700 (Desktop)
46.8 (42min - 51max) fps -59%
lågmed.högultraQHD4K
GTA V (2015) 182 175 169 104 101 150
The Witcher 3 (2015) 446 413 320 145 114
Dota 2 Reborn (2015) 124.1 113.2 109.3 101.1 98
Rise of the Tomb Raider (2016) 388 300 273 233 114
Final Fantasy XV Benchmark (2018) 148 132 113 91 66
X-Plane 11.11 (2018) 163 153 122.5 104.8
Far Cry 5 (2018) 175 152 144 135 132 93
Strange Brigade (2018) 426 350 315 285 218 134
Shadow of the Tomb Raider (2018) 191 181 186 177 152 87.9
Battlefield V (2018) 187.3 165.8 148.6 137.9 116.1 87.2
Apex Legends (2019) 144 144 144 144 144 140
Far Cry New Dawn (2019) 143 125 120 108 103 88
Metro Exodus (2019) 220 181 60.2 116 97.4 65.9
Anno 1800 (2019) 137 135 93.9 54 52.4 43.2
Control (2019) 235 185 151 105 56.7
Borderlands 3 (2019) 147 127 120 117 95.7 61.9
Star Wars Jedi Fallen Order (2019) 128 127 129 128 97.2
Red Dead Redemption 2 (2019) 152.1 149.5 141.9 103 86.4 56.4
Hunt Showdown (2020) 260 232 228 188 107
Doom Eternal (2020) 305 302 291 290 277 167
F1 2020 (2020) 321 288 249 179 146 114
Death Stranding (2020) 232 219 208 202 163 98.7
Horizon Zero Dawn (2020) 198 180 164 144 128 82
Crysis Remastered (2020) 227 157 98.9 62.1 59.9 49.2
Serious Sam 4 (2020) 161 125.2 121.7 114.3 112.8 112.7
Mafia Definitive Edition (2020) 182 159 144 127 78.1
Star Wars Squadrons (2020) 360 392 362 362 274 175
FIFA 21 (2020) 170 184 182 181 199 195
Watch Dogs Legion (2020) 122 121 113 99.3 81.1 53.5
Dirt 5 (2020) 186 134 112 97 85.5 65.7
Assassin´s Creed Valhalla (2020) 136 111 96 88 76 52
Call of Duty Black Ops Cold War (2020) 235 201 173 127 104 65.6
Yakuza Like a Dragon (2020) 121 116 118 110 112 72.4
Immortals Fenyx Rising (2020) 143 121 109 80 74 57
Cyberpunk 2077 1.0 (2020) 132 128 116 103 72.5 38.9
LuxMark v2.0 64Bit
Room GPUs-only
NVIDIA GeForce RTX 3090
5727 Samples/s +10%
NVIDIA GeForce RTX 3080
5198 Samples/s
NVIDIA GeForce RTX 3080
5112 Samples/s -2%
AMD Radeon RX 6800 XT
5057 Samples/s -3%
NVIDIA Titan RTX
4643 Samples/s -11%
NVIDIA GeForce RTX 2080 Ti (Desktop)
4494 Samples/s -14%
NVIDIA GeForce RTX 2080 Ti (Desktop)
4429 Samples/s -15%
NVIDIA GeForce RTX 3070
4293 Samples/s -17%
AMD Radeon VII
3477 Samples/s -33%
NVIDIA GeForce RTX 2080 (Desktop)
3453 Samples/s -34%
NVIDIA GeForce RTX 2080 Super (Desktop)
3430 Samples/s -34%
NVIDIA GeForce RTX 2070 Super (Desktop)
3404 Samples/s -35%
NVIDIA GeForce RTX 2070 (Desktop)
3300 Samples/s -37%
NVIDIA GeForce RTX 2060 Super (Desktop)
3274 Samples/s -37%
NVIDIA GeForce RTX 2060 (Desktop)
2586 Samples/s -50%
AMD Radeon RX 5700 XT (Desktop)
2104 Samples/s -60%
AMD Radeon RX 5700 (Desktop)
1856 Samples/s -64%
Sala GPUs-only
AMD Radeon RX 6800 XT
28023 Samples/s +116%
NVIDIA GeForce RTX 3090
14590 Samples/s +12%
NVIDIA GeForce RTX 3080
12980 Samples/s
NVIDIA GeForce RTX 3080
12797 Samples/s -1%
NVIDIA Titan RTX
10799 Samples/s -17%
NVIDIA GeForce RTX 2080 Ti (Desktop)
10291 Samples/s -21%
NVIDIA GeForce RTX 3070
10115 Samples/s -22%
NVIDIA GeForce RTX 2080 Ti (Desktop)
9999 Samples/s -23%
NVIDIA GeForce RTX 2080 (Desktop)
7928 Samples/s -39%
NVIDIA GeForce RTX 2080 Super (Desktop)
7878 Samples/s -39%
NVIDIA GeForce RTX 2070 Super (Desktop)
7594 Samples/s -41%
NVIDIA GeForce RTX 2070 (Desktop)
7179 Samples/s -45%
NVIDIA GeForce RTX 2060 Super (Desktop)
6980 Samples/s -46%
AMD Radeon VII
6869 Samples/s -47%
AMD Radeon RX 5700 XT (Desktop)
6188 Samples/s -52%
NVIDIA GeForce RTX 2060 (Desktop)
5655 Samples/s -56%
AMD Radeon RX 5700 (Desktop)
5312 Samples/s -59%
ComputeMark v2.1
1024x600 Normal, QJuliaRayTrace
NVIDIA GeForce RTX 3090
17058 Points +10%
NVIDIA GeForce RTX 3080
15508 Points
NVIDIA GeForce RTX 3080
14718 Points -5%
NVIDIA GeForce RTX 3070
11816 Points -24%
AMD Radeon RX 6800 XT
11304 Points -27%
NVIDIA GeForce RTX 2080 Ti (Desktop)
9690 Points -38%
NVIDIA Titan RTX
9418 Points -39%
NVIDIA GeForce RTX 2080 Ti (Desktop)
9104 Points -41%
NVIDIA GeForce RTX 2080 (Desktop)
7283 Points -53%
NVIDIA GeForce RTX 2080 Super (Desktop)
7258 Points -53%
NVIDIA GeForce RTX 2070 Super (Desktop)
6155 Points -60%
AMD Radeon VII
5878 Points -62%
AMD Radeon RX 5700 XT (Desktop)
5761 Points -63%
NVIDIA GeForce RTX 2070 (Desktop)
5747 Points -63%
NVIDIA GeForce RTX 2060 Super (Desktop)
5271 Points -66%
NVIDIA GeForce RTX 2060 (Desktop)
4903 Points -68%
AMD Radeon RX 5700 (Desktop)
4703 Points -70%
1024x600 Normal, Mandel Scalar
NVIDIA GeForce RTX 3090
11197 Points +13%
AMD Radeon RX 6800 XT
10018 Points +1%
NVIDIA GeForce RTX 3080
9938 Points
NVIDIA GeForce RTX 3080
9554 Points -4%
NVIDIA GeForce RTX 3070
7314 Points -26%
AMD Radeon VII
6312 Points -36%
NVIDIA GeForce RTX 2080 Ti (Desktop)
6226 Points -37%
NVIDIA Titan RTX
5977 Points -40%
NVIDIA GeForce RTX 2080 Ti (Desktop)
5679 Points -43%
AMD Radeon RX 5700 XT (Desktop)
4869 Points -51%
NVIDIA GeForce RTX 2080 (Desktop)
4526 Points -54%
NVIDIA GeForce RTX 2080 Super (Desktop)
4525 Points -54%
AMD Radeon RX 5700 (Desktop)
4043 Points -59%
NVIDIA GeForce RTX 2070 Super (Desktop)
3782 Points -62%
NVIDIA GeForce RTX 2070 (Desktop)
3514 Points -65%
NVIDIA GeForce RTX 2060 Super (Desktop)
3185 Points -68%
NVIDIA GeForce RTX 2060 (Desktop)
2982 Points -70%
1024x600 Normal, Mandel Vector
AMD Radeon RX 6800 XT
8399 Points +11%
NVIDIA GeForce RTX 3090
8341 Points +11%
NVIDIA GeForce RTX 3080
7540 Points
NVIDIA GeForce RTX 3080
7148 Points -5%
NVIDIA GeForce RTX 3070
5490 Points -27%
NVIDIA GeForce RTX 2080 Ti (Desktop)
5037 Points -33%
NVIDIA Titan RTX
4944 Points -34%
AMD Radeon VII
4714 Points -37%
NVIDIA GeForce RTX 2080 Ti (Desktop)
4695 Points -38%
AMD Radeon RX 5700 XT (Desktop)
4246 Points -44%
NVIDIA GeForce RTX 2080 (Desktop)
3892 Points -48%
NVIDIA GeForce RTX 2080 Super (Desktop)
3835 Points -49%
AMD Radeon RX 5700 (Desktop)
3532 Points -53%
NVIDIA GeForce RTX 2070 Super (Desktop)
3358 Points -55%
NVIDIA GeForce RTX 2070 (Desktop)
3169 Points -58%
NVIDIA GeForce RTX 2060 Super (Desktop)
2939 Points -61%
NVIDIA GeForce RTX 2060 (Desktop)
2800 Points -63%
1024x600 Normal, Fluid 2DTexArr
NVIDIA GeForce RTX 3090
4560 Points +10%
NVIDIA GeForce RTX 3080
4159 Points
NVIDIA GeForce RTX 3080
4087 Points -2%
AMD Radeon RX 6800 XT
3947 Points -5%
NVIDIA Titan RTX
3691 Points -11%
NVIDIA GeForce RTX 2080 Ti (Desktop)
3539 Points -15%
NVIDIA GeForce RTX 2080 Ti (Desktop)
3444 Points -17%
NVIDIA GeForce RTX 3070
2704 Points -35%
NVIDIA GeForce RTX 2080 Super (Desktop)
2655 Points -36%
NVIDIA GeForce RTX 2080 (Desktop)
2482 Points -40%
NVIDIA GeForce RTX 2070 Super (Desktop)
2331 Points -44%
AMD Radeon VII
2248 Points -46%
NVIDIA GeForce RTX 2070 (Desktop)
2221 Points -47%
NVIDIA GeForce RTX 2060 Super (Desktop)
2064 Points -50%
AMD Radeon RX 5700 XT (Desktop)
1960 Points -53%
AMD Radeon RX 5700 (Desktop)
1810 Points -56%
NVIDIA GeForce RTX 2060 (Desktop)
1801 Points -57%
1024x600 Normal, Fluid 3DTex
NVIDIA GeForce RTX 3090
5391 Points +21%
AMD Radeon RX 6800 XT
5154 Points +16%
NVIDIA GeForce RTX 3080
4450 Points
NVIDIA GeForce RTX 3080
4417 Points -1%
NVIDIA Titan RTX
3877 Points -13%
NVIDIA GeForce RTX 2080 Ti (Desktop)
3653 Points -18%
AMD Radeon VII
3646 Points -18%
NVIDIA GeForce RTX 2080 Ti (Desktop)
3589 Points -19%
NVIDIA GeForce RTX 3070
2776 Points -38%
NVIDIA GeForce RTX 2080 Super (Desktop)
2736 Points -39%
NVIDIA GeForce RTX 2080 (Desktop)
2588 Points -42%
NVIDIA GeForce RTX 2070 Super (Desktop)
2456 Points -45%
NVIDIA GeForce RTX 2070 (Desktop)
2380 Points -47%
AMD Radeon RX 5700 XT (Desktop)
2349 Points -47%
AMD Radeon RX 5700 (Desktop)
2294 Points -48%
NVIDIA GeForce RTX 2060 Super (Desktop)
2289 Points -49%
NVIDIA GeForce RTX 2060 (Desktop)
1889 Points -58%
1024x600 Normal, Score
NVIDIA GeForce RTX 3090
46547 Points +12%
NVIDIA GeForce RTX 3080
41594 Points
NVIDIA GeForce RTX 3080
39924 Points -4%
AMD Radeon RX 6800 XT
38823 Points -7%
NVIDIA GeForce RTX 3070
30100 Points -28%
NVIDIA GeForce RTX 2080 Ti (Desktop)
28145 Points -32%
NVIDIA Titan RTX
27907 Points -33%
NVIDIA GeForce RTX 2080 Ti (Desktop)
26510 Points -36%
AMD Radeon VII
22798 Points -45%
NVIDIA GeForce RTX 2080 Super (Desktop)
21009 Points -49%
NVIDIA GeForce RTX 2080 (Desktop)
20771 Points -50%
AMD Radeon RX 5700 XT (Desktop)
19184 Points -54%
NVIDIA GeForce RTX 2070 Super (Desktop)
18083 Points -57%
NVIDIA GeForce RTX 2070 (Desktop)
17031 Points -59%
AMD Radeon RX 5700 (Desktop)
16383 Points -61%
NVIDIA GeForce RTX 2060 Super (Desktop)
15749 Points -62%
NVIDIA GeForce RTX 2060 (Desktop)
14375 Points -65%
SPECviewperf 13
Solidworks (sw-04)
NVIDIA Titan RTX
196.4 fps +104%
AMD Radeon RX 6800 XT
193 fps +100%
NVIDIA Titan RTX
132.9 fps +38%
AMD Radeon RX 5700 XT (Desktop)
114.4 fps +19%
NVIDIA GeForce RTX 2080 Ti (Desktop)
113.2 fps +17%
NVIDIA GeForce RTX 2080 Ti (Desktop)
111.8 fps +16%
AMD Radeon RX 5700 (Desktop)
101.8 fps +5%
NVIDIA GeForce RTX 2080 (Desktop)
100.3 fps +4%
NVIDIA GeForce RTX 2080 Super (Desktop)
99.6 fps +3%
NVIDIA GeForce RTX 3080
96.5 fps
NVIDIA GeForce RTX 3090
95.3 fps -1%
AMD Radeon VII
95.1 fps -1%
NVIDIA GeForce RTX 2070 Super (Desktop)
93.3 fps -3%
NVIDIA GeForce RTX 3080
92.4 fps -4%
NVIDIA GeForce RTX 2070 (Desktop)
86.7 fps -10%
NVIDIA GeForce RTX 3070
84.8 fps -12%
NVIDIA GeForce RTX 2060 (Desktop)
83.4 fps -14%
NVIDIA GeForce RTX 2060 Super (Desktop)
75.7 fps -22%
Siemens NX (snx-03)
NVIDIA Titan RTX
493.4 fps +1934%
NVIDIA Titan RTX
462.4 fps +1806%
AMD Radeon RX 6800 XT
81.4 fps +236%
AMD Radeon RX 5700 XT (Desktop)
61.3 fps +153%
AMD Radeon RX 5700 (Desktop)
60.5 fps +149%
AMD Radeon VII
37.03 fps +53%
NVIDIA GeForce RTX 3090
27.03 fps +11%
NVIDIA GeForce RTX 3080
24.26 fps
NVIDIA GeForce RTX 3080
23.22 fps -4%
NVIDIA GeForce RTX 2080 Ti (Desktop)
22.45 fps -7%
NVIDIA GeForce RTX 3070
22.36 fps -8%
NVIDIA GeForce RTX 2080 Ti (Desktop)
21.99 fps -9%
NVIDIA GeForce RTX 2080 Super (Desktop)
21.94 fps -10%
NVIDIA GeForce RTX 2080 (Desktop)
21.7 fps -11%
NVIDIA GeForce RTX 2070 Super (Desktop)
20.71 fps -15%
NVIDIA GeForce RTX 2070 (Desktop)
15.6 fps -36%
NVIDIA GeForce RTX 2060 Super (Desktop)
15.46 fps -36%
NVIDIA GeForce RTX 2060 (Desktop)
14.99 fps -38%
Showcase (showcase-02)
NVIDIA GeForce RTX 3090
241 fps +18%
AMD Radeon RX 6800 XT
232 fps +14%
NVIDIA GeForce RTX 3080
204 fps
NVIDIA Titan RTX
192 fps -6%
NVIDIA Titan RTX
190.5 fps -7%
NVIDIA GeForce RTX 2080 Ti (Desktop)
180.4 fps -12%
NVIDIA GeForce RTX 2080 Ti (Desktop)
179.5 fps -12%
NVIDIA GeForce RTX 3070
145.5 fps -29%
NVIDIA GeForce RTX 2080 Super (Desktop)
144.5 fps -29%
AMD Radeon RX 5700 XT (Desktop)
137.6 fps -33%
NVIDIA GeForce RTX 2070 Super (Desktop)
127.3 fps -38%
AMD Radeon RX 5700 (Desktop)
127 fps -38%
NVIDIA GeForce RTX 2060 Super (Desktop)
116.8 fps -43%
NVIDIA GeForce RTX 2060 (Desktop)
101.6 fps -50%
Medical (medical-02)
AMD Radeon RX 6800 XT
130 fps +31%
NVIDIA GeForce RTX 3090
105 fps +6%
NVIDIA GeForce RTX 3080
99 fps
NVIDIA GeForce RTX 3080
91.8 fps -7%
NVIDIA Titan RTX
90.8 fps -8%
NVIDIA Titan RTX
89.3 fps -10%
NVIDIA GeForce RTX 2080 Ti (Desktop)
84.8 fps -14%
AMD Radeon RX 5700 XT (Desktop)
82.8 fps -16%
NVIDIA GeForce RTX 2080 Ti (Desktop)
82.1 fps -17%
NVIDIA GeForce RTX 3070
81.8 fps -17%
AMD Radeon VII
77.9 fps -21%
NVIDIA GeForce RTX 2080 Super (Desktop)
71.6 fps -28%
NVIDIA GeForce RTX 2080 (Desktop)
71 fps -28%
AMD Radeon RX 5700 (Desktop)
67.5 fps -32%
NVIDIA GeForce RTX 2070 Super (Desktop)
63.8 fps -36%
NVIDIA GeForce RTX 2070 (Desktop)
57.7 fps -42%
NVIDIA GeForce RTX 2060 Super (Desktop)
54.5 fps -45%
NVIDIA GeForce RTX 2060 (Desktop)
49.1 fps -50%
Maya (maya-05)
NVIDIA GeForce RTX 3090
469 fps +7%
NVIDIA Titan RTX
458 fps +4%
NVIDIA GeForce RTX 3080
440 fps
NVIDIA GeForce RTX 2080 Ti (Desktop)
392.1 fps -11%
NVIDIA GeForce RTX 2080 Ti (Desktop)
386.6 fps -12%
NVIDIA Titan RTX
367.8 fps -16%
NVIDIA GeForce RTX 3080
360.2 fps -18%
AMD Radeon RX 6800 XT
348 fps -21%
NVIDIA GeForce RTX 2080 Super (Desktop)
328.7 fps -25%
NVIDIA GeForce RTX 2070 Super (Desktop)
290.4 fps -34%
NVIDIA GeForce RTX 2070 (Desktop)
275.3 fps -37%
NVIDIA GeForce RTX 2060 Super (Desktop)
262.4 fps -40%
NVIDIA GeForce RTX 3070
256.5 fps -42%
NVIDIA GeForce RTX 2060 (Desktop)
247 fps -44%
AMD Radeon RX 5700 XT (Desktop)
220.3 fps -50%
AMD Radeon VII
212.6 fps -52%
AMD Radeon RX 5700 (Desktop)
185.2 fps -58%
Energy (energy-02)
AMD Radeon RX 6800 XT
58.4 fps +54%
NVIDIA Titan RTX
52 fps +37%
NVIDIA Titan RTX
51.9 fps +37%
NVIDIA GeForce RTX 3090
45.21 fps +19%
NVIDIA GeForce RTX 3080
37.87 fps
NVIDIA GeForce RTX 3080
36.08 fps -5%
AMD Radeon VII
35.05 fps -7%
NVIDIA GeForce RTX 2080 Ti (Desktop)
32.91 fps -13%
NVIDIA GeForce RTX 2080 Ti (Desktop)
31.52 fps -17%
NVIDIA GeForce RTX 3070
29.12 fps -23%
AMD Radeon RX 5700 XT (Desktop)
26.82 fps -29%
AMD Radeon RX 5700 (Desktop)
24.55 fps -35%
NVIDIA GeForce RTX 2080 Super (Desktop)
23.78 fps -37%
NVIDIA GeForce RTX 2070 Super (Desktop)
23.76 fps -37%
NVIDIA GeForce RTX 2070 (Desktop)
22.33 fps -41%
NVIDIA GeForce RTX 2060 Super (Desktop)
21.81 fps -42%
NVIDIA GeForce RTX 2060 (Desktop)
7.62 fps -80%
Creo (creo-02)
NVIDIA Titan RTX
346.5 fps +17%
NVIDIA GeForce RTX 3090
316 fps +7%
NVIDIA Titan RTX
307.6 fps +4%
NVIDIA GeForce RTX 3080
295 fps
NVIDIA GeForce RTX 2080 Ti (Desktop)
291.1 fps -1%
NVIDIA GeForce RTX 2080 Ti (Desktop)
286.5 fps -3%
NVIDIA GeForce RTX 3080
281.2 fps -5%
AMD Radeon RX 6800 XT
276 fps -6%
NVIDIA GeForce RTX 3070
227.7 fps -23%
NVIDIA GeForce RTX 2080 (Desktop)
220.3 fps -25%
NVIDIA GeForce RTX 2080 Super (Desktop)
220.1 fps -25%
NVIDIA GeForce RTX 2070 (Desktop)
184.2 fps -38%
NVIDIA GeForce RTX 2060 Super (Desktop)
172.5 fps -42%
NVIDIA GeForce RTX 2070 Super (Desktop)
171 fps -42%
NVIDIA GeForce RTX 2060 (Desktop)
169.8 fps -42%
AMD Radeon RX 5700 XT (Desktop)
157 fps -47%
AMD Radeon RX 5700 (Desktop)
116.7 fps -60%
AMD Radeon VII
115.7 fps -61%
Catia (catia-05)
AMD Radeon RX 6800 XT
412 fps +117%
NVIDIA Titan RTX
374.8 fps +97%
NVIDIA Titan RTX
260.4 fps +37%
AMD Radeon RX 5700 XT (Desktop)
242.8 fps +28%
AMD Radeon VII
239.2 fps +26%
AMD Radeon RX 5700 (Desktop)
209.2 fps +10%
NVIDIA GeForce RTX 3090
206 fps +8%
NVIDIA GeForce RTX 3080
190.4 fps 0%
NVIDIA GeForce RTX 3080
190 fps
NVIDIA GeForce RTX 2080 Ti (Desktop)
180.3 fps -5%
NVIDIA GeForce RTX 2080 Ti (Desktop)
178.8 fps -6%
NVIDIA GeForce RTX 3070
168.7 fps -11%
NVIDIA GeForce RTX 2080 Super (Desktop)
157.7 fps -17%
NVIDIA GeForce RTX 2070 Super (Desktop)
146.3 fps -23%
NVIDIA GeForce RTX 2070 (Desktop)
118.6 fps -38%
NVIDIA GeForce RTX 2060 Super (Desktop)
114.6 fps -40%
NVIDIA GeForce RTX 2060 (Desktop)
108.2 fps -43%
3ds Max (3dsmax-06)
NVIDIA GeForce RTX 3090
298 fps +1%
NVIDIA GeForce RTX 3080
294 fps
NVIDIA Titan RTX
291.3 fps -1%
AMD Radeon RX 6800 XT
284 fps -3%
NVIDIA GeForce RTX 2080 Ti (Desktop)
272.4 fps -7%
NVIDIA GeForce RTX 2080 Ti (Desktop)
269.4 fps -8%
NVIDIA Titan RTX
268.7 fps -9%
NVIDIA GeForce RTX 3070
252.1 fps -14%
NVIDIA GeForce RTX 3080
238.2 fps -19%
NVIDIA GeForce RTX 2080 Super (Desktop)
227.8 fps -23%
NVIDIA GeForce RTX 2070 Super (Desktop)
212.4 fps -28%
NVIDIA GeForce RTX 2070 (Desktop)
207.3 fps -29%
NVIDIA GeForce RTX 2060 Super (Desktop)
199.4 fps -32%
NVIDIA GeForce RTX 2060 (Desktop)
184.4 fps -37%
AMD Radeon RX 5700 XT (Desktop)
175.6 fps -40%
AMD Radeon VII
168.5 fps -43%
AMD Radeon RX 5700 (Desktop)
157 fps -47%
SPECviewperf 12
1900x1060 Solidworks (sw-03)
NVIDIA Titan RTX
174.9 fps +165%
AMD Radeon RX 6800 XT
150 fps +127%
NVIDIA Titan RTX
139.6 fps +112%
AMD Radeon RX 5700 XT (Desktop)
89.6 fps +36%
NVIDIA GeForce RTX 2080 Ti (Desktop)
79.3 fps +20%
AMD Radeon RX 5700 (Desktop)
79.2 fps +20%
NVIDIA GeForce RTX 2080 Ti (Desktop)
78.4 fps +19%
AMD Radeon VII
75.9 fps +15%
NVIDIA GeForce RTX 3090
72.3 fps +10%
NVIDIA GeForce RTX 3080
71.1 fps +8%
NVIDIA GeForce RTX 2080 Super (Desktop)
70.8 fps +7%
NVIDIA GeForce RTX 2080 (Desktop)
70.1 fps +6%
NVIDIA GeForce RTX 3080
66 fps
NVIDIA GeForce RTX 2070 Super (Desktop)
65.4 fps -1%
NVIDIA GeForce RTX 3070
61.7 fps -7%
NVIDIA GeForce RTX 2070 (Desktop)
60.6 fps -8%
NVIDIA GeForce RTX 2060 Super (Desktop)
58.9 fps -11%
NVIDIA GeForce RTX 2060 (Desktop)
57.6 fps -13%
1900x1060 Siemens NX (snx-02)
NVIDIA Titan RTX
273.2 fps +2026%
NVIDIA Titan RTX
256.3 fps +1895%
AMD Radeon RX 6800 XT
45.07 fps +251%
AMD Radeon RX 5700 XT (Desktop)
35.27 fps +174%
AMD Radeon RX 5700 (Desktop)
33.5 fps +161%
AMD Radeon VII
20.54 fps +60%
NVIDIA GeForce RTX 3090
14.91 fps +16%
NVIDIA GeForce RTX 3080
13.27 fps +3%
NVIDIA GeForce RTX 3080
12.85 fps
NVIDIA GeForce RTX 3070
12.71 fps -1%
NVIDIA GeForce RTX 2080 Ti (Desktop)
12.4 fps -4%
NVIDIA GeForce RTX 2080 Super (Desktop)
12.26 fps -5%
NVIDIA GeForce RTX 2080 Ti (Desktop)
12.16 fps -5%
NVIDIA GeForce RTX 2080 (Desktop)
12.08 fps -6%
NVIDIA GeForce RTX 2070 Super (Desktop)
11.44 fps -11%
NVIDIA GeForce RTX 2070 (Desktop)
8.63 fps -33%
NVIDIA GeForce RTX 2060 Super (Desktop)
8.57 fps -33%
NVIDIA GeForce RTX 2060 (Desktop)
8.35 fps -35%
1900x1060 Showcase (showcase-01)
NVIDIA GeForce RTX 3090
236 fps +31%
AMD Radeon RX 6800 XT
223 fps +24%
NVIDIA GeForce RTX 3080
199.9 fps +11%
NVIDIA Titan RTX
191.6 fps +6%
NVIDIA Titan RTX
191.1 fps +6%
NVIDIA GeForce RTX 3080
180 fps
NVIDIA GeForce RTX 2080 Ti (Desktop)
179.2 fps 0%
NVIDIA GeForce RTX 2080 Ti (Desktop)
175.6 fps -2%
NVIDIA GeForce RTX 3070
153.9 fps -14%
NVIDIA GeForce RTX 2080 Super (Desktop)
143.6 fps -20%
AMD Radeon RX 5700 XT (Desktop)
137.8 fps -23%
NVIDIA GeForce RTX 2070 Super (Desktop)
128.2 fps -29%
AMD Radeon RX 5700 (Desktop)
126.9 fps -29%
NVIDIA GeForce RTX 2060 Super (Desktop)
116.9 fps -35%
NVIDIA GeForce RTX 2060 (Desktop)
101 fps -44%
1900x1060 Medical (medical-01)
NVIDIA Titan RTX
90.7 fps +146%
NVIDIA Titan RTX
87 fps +136%
AMD Radeon RX 6800 XT
77.3 fps +109%
AMD Radeon VII
52.3 fps +42%
NVIDIA GeForce RTX 2080 Ti (Desktop)
51.1 fps +38%
NVIDIA GeForce RTX 3080
50.8 fps +38%
NVIDIA GeForce RTX 2080 Ti (Desktop)
48.61 fps +32%
AMD Radeon RX 5700 XT (Desktop)
46.9 fps +27%
NVIDIA GeForce RTX 2080 Super (Desktop)
45 fps +22%
NVIDIA GeForce RTX 2080 (Desktop)
44.89 fps +22%
NVIDIA GeForce RTX 3090
42.91 fps +16%
NVIDIA GeForce RTX 2070 Super (Desktop)
42.65 fps +15%
AMD Radeon RX 5700 (Desktop)
40.97 fps +11%
NVIDIA GeForce RTX 2070 (Desktop)
39.61 fps +7%
NVIDIA GeForce RTX 2060 Super (Desktop)
38 fps +3%
NVIDIA GeForce RTX 3080
36.93 fps
NVIDIA GeForce RTX 3070
36.68 fps -1%
NVIDIA GeForce RTX 2060 (Desktop)
35.22 fps -5%
1900x1060 Maya (maya-04)
NVIDIA Titan RTX
188.3 fps +29%
NVIDIA GeForce RTX 3080
184.6 fps +26%
NVIDIA GeForce RTX 3090
184 fps +26%
NVIDIA GeForce RTX 2080 Ti (Desktop)
180.8 fps +24%
NVIDIA GeForce RTX 2080 Ti (Desktop)
177.8 fps +22%
NVIDIA GeForce RTX 3070
176.4 fps +21%
NVIDIA GeForce RTX 2080 (Desktop)
148.7 fps +2%
NVIDIA GeForce RTX 2060 Super (Desktop)
146.3 fps 0%
NVIDIA GeForce RTX 2070 (Desktop)
146.2 fps 0%
NVIDIA GeForce RTX 3080
146 fps
NVIDIA GeForce RTX 2080 Super (Desktop)
134.8 fps -8%
NVIDIA Titan RTX
132.8 fps -9%
NVIDIA GeForce RTX 2060 (Desktop)
127.4 fps -13%
NVIDIA GeForce RTX 2070 Super (Desktop)
125.1 fps -14%
AMD Radeon RX 6800 XT
118 fps -19%
AMD Radeon VII
88.1 fps -40%
AMD Radeon RX 5700 XT (Desktop)
86.5 fps -41%
AMD Radeon RX 5700 (Desktop)
73.3 fps -50%
1900x1060 Energy (energy-01)
AMD Radeon RX 6800 XT
28.39 fps +74%
NVIDIA Titan RTX
28.31 fps +73%
NVIDIA Titan RTX
28.12 fps +72%
NVIDIA GeForce RTX 3090
20.41 fps +25%
NVIDIA GeForce RTX 3080
18.47 fps +13%
NVIDIA GeForce RTX 2080 Ti (Desktop)
16.68 fps +2%
AMD Radeon VII
16.63 fps +2%
NVIDIA GeForce RTX 3080
16.35 fps
NVIDIA GeForce RTX 2080 Ti (Desktop)
15.86 fps -3%
NVIDIA GeForce RTX 2080 Super (Desktop)
13.09 fps -20%
AMD Radeon RX 5700 XT (Desktop)
12.72 fps -22%
NVIDIA GeForce RTX 3070
12.53 fps -23%
NVIDIA GeForce RTX 2080 (Desktop)
12.52 fps -23%
NVIDIA GeForce RTX 2070 Super (Desktop)
11.96 fps -27%
AMD Radeon RX 5700 (Desktop)
11.53 fps -29%
NVIDIA GeForce RTX 2070 (Desktop)
11.27 fps -31%
NVIDIA GeForce RTX 2060 Super (Desktop)
11.07 fps -32%
NVIDIA GeForce RTX 2060 (Desktop)
9.19 fps -44%
1900x1060 Creo (creo-01)
NVIDIA Titan RTX
173 fps +164%
AMD Radeon RX 6800 XT
119 fps +81%
NVIDIA Titan RTX
106.3 fps +62%
NVIDIA GeForce RTX 3090
75.4 fps +15%
NVIDIA GeForce RTX 3080
74.2 fps +13%
AMD Radeon RX 5700 XT (Desktop)
66.9 fps +2%
NVIDIA GeForce RTX 3080
65.6 fps
NVIDIA GeForce RTX 2080 Ti (Desktop)
63.3 fps -4%
NVIDIA GeForce RTX 2080 Ti (Desktop)
63.1 fps -4%
AMD Radeon RX 5700 (Desktop)
60.2 fps -8%
NVIDIA GeForce RTX 3070
57.5 fps -12%
AMD Radeon VII
55.4 fps -16%
NVIDIA GeForce RTX 2080 Super (Desktop)
52.7 fps -20%
NVIDIA GeForce RTX 2080 (Desktop)
52.5 fps -20%
NVIDIA GeForce RTX 2070 Super (Desktop)
47.4 fps -28%
NVIDIA GeForce RTX 2070 (Desktop)
45.67 fps -30%
NVIDIA GeForce RTX 2060 (Desktop)
44.45 fps -32%
NVIDIA GeForce RTX 2060 Super (Desktop)
43.87 fps -33%
1900x1060 Catia (catia-04)
NVIDIA Titan RTX
262.7 fps +126%
AMD Radeon RX 6800 XT
238 fps +105%
NVIDIA Titan RTX
178.1 fps +54%
AMD Radeon VII
159.1 fps +37%
AMD Radeon RX 5700 XT (Desktop)
158.8 fps +37%
AMD Radeon RX 5700 (Desktop)
135.7 fps +17%
NVIDIA GeForce RTX 3090
134 fps +16%
NVIDIA GeForce RTX 3080
126.1 fps +9%
NVIDIA GeForce RTX 2080 Ti (Desktop)
120.6 fps +4%
NVIDIA GeForce RTX 2080 Ti (Desktop)
118.5 fps +2%
NVIDIA GeForce RTX 3080
116 fps
NVIDIA GeForce RTX 3070
111.2 fps -4%
NVIDIA GeForce RTX 2080 (Desktop)
109.4 fps -6%
NVIDIA GeForce RTX 2080 Super (Desktop)
104.2 fps -10%
NVIDIA GeForce RTX 2070 Super (Desktop)
96.3 fps -17%
NVIDIA GeForce RTX 2070 (Desktop)
81.9 fps -29%
NVIDIA GeForce RTX 2060 Super (Desktop)
77.1 fps -34%
NVIDIA GeForce RTX 2060 (Desktop)
74.8 fps -36%
1900x1060 3ds Max (3dsmax-05)
NVIDIA GeForce RTX 3090
322 fps +17%
NVIDIA Titan RTX
292.6 fps +6%
NVIDIA GeForce RTX 3080
276 fps
NVIDIA GeForce RTX 3080
275.6 fps 0%
NVIDIA GeForce RTX 2080 Ti (Desktop)
272.7 fps -1%
NVIDIA Titan RTX
268.2 fps -3%
NVIDIA GeForce RTX 3070
267 fps -3%
NVIDIA GeForce RTX 2080 Ti (Desktop)
258.1 fps -6%
NVIDIA GeForce RTX 2080 (Desktop)
234.1 fps -15%
NVIDIA GeForce RTX 2080 Super (Desktop)
225.8 fps -18%
NVIDIA GeForce RTX 2070 Super (Desktop)
211.8 fps -23%
NVIDIA GeForce RTX 2070 (Desktop)
207.2 fps -25%
NVIDIA GeForce RTX 2060 Super (Desktop)
201.5 fps -27%
NVIDIA GeForce RTX 2060 (Desktop)
183.6 fps -33%
AMD Radeon RX 5700 XT (Desktop)
173.8 fps -37%
AMD Radeon RX 6800 XT
167 fps -39%
AMD Radeon VII
166.9 fps -40%
AMD Radeon RX 5700 (Desktop)
155.7 fps -44%
SPECviewperf 2020
3840x2160 Solidworks (solidworks-05)
NVIDIA GeForce RTX 3090
180 fps +14%
NVIDIA GeForce RTX 3080
158 fps
NVIDIA Titan RTX
153 fps -3%
NVIDIA GeForce RTX 3070
127 fps -20%
AMD Radeon RX 6800 XT
108 fps -32%
3840x2160 Siemens NX (snx-04)
NVIDIA Titan RTX
347 fps +1653%
AMD Radeon RX 6800 XT
81.7 fps +313%
NVIDIA GeForce RTX 3090
22.6 fps +14%
NVIDIA GeForce RTX 3080
19.8 fps
NVIDIA GeForce RTX 3070
19.37 fps -2%
3840x2160 Medical (medical-03)
AMD Radeon RX 6800 XT
27.84 fps +51%
NVIDIA GeForce RTX 3090
21.19 fps +15%
NVIDIA GeForce RTX 3080
18.47 fps
NVIDIA Titan RTX
16.42 fps -11%
NVIDIA GeForce RTX 3070
14.06 fps -24%
3840x2160 Maya (maya-06)
NVIDIA GeForce RTX 3090
330 fps +13%
NVIDIA GeForce RTX 3080
293 fps
NVIDIA Titan RTX
257 fps -12%
NVIDIA GeForce RTX 3070
247.1 fps -16%
AMD Radeon RX 6800 XT
224 fps -24%
3840x2160 Energy (energy-03)
NVIDIA GeForce RTX 3090
61.1 fps +18%
AMD Radeon RX 6800 XT
60.8 fps +18%
NVIDIA Titan RTX
58.2 fps +13%
NVIDIA GeForce RTX 3080
51.7 fps
NVIDIA GeForce RTX 3070
26.66 fps -48%
3840x2160 Creo (creo-03)
NVIDIA Titan RTX
113 fps +46%
NVIDIA GeForce RTX 3090
85.1 fps +10%
NVIDIA GeForce RTX 3080
77.6 fps
NVIDIA GeForce RTX 3070
74.3 fps -4%
AMD Radeon RX 6800 XT
65 fps -16%
3840x2160 CATIA (catia-06)
NVIDIA Titan RTX
78.2 fps +56%
NVIDIA GeForce RTX 3090
56.6 fps +13%
NVIDIA GeForce RTX 3080
50 fps
NVIDIA GeForce RTX 3070
43.17 fps -14%
AMD Radeon RX 6800 XT
42.4 fps -15%
3840x2160 3ds Max (3dsmax-07)
NVIDIA GeForce RTX 3090
135 fps +35%
AMD Radeon RX 6800 XT
114 fps +14%
NVIDIA Titan RTX
108 fps +8%
NVIDIA GeForce RTX 3080
100 fps
NVIDIA GeForce RTX 3070
86.4 fps -14%
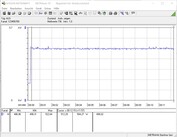
Testsystemets energiförbrukning (tomgång)
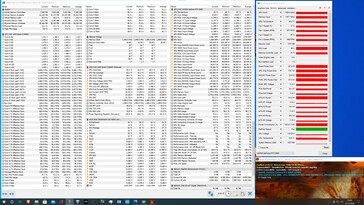
Testsystemets energiförbrukning (FurMark PT 100%)
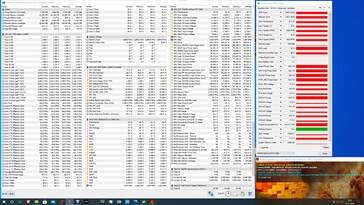
Testsystemets energiförbrukning (FurMark PT 102%)
Testsystemets energiförbrukning (Spel - The Witcher 3 Ultra preset)
Stress test FurMark (PT 100%)
Stress test FurMark (PT 102%)
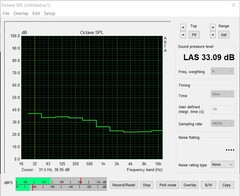
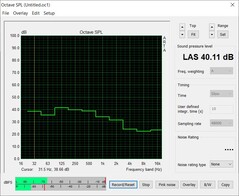
Ljudnivå vid tomgång - Fläktfritt läge
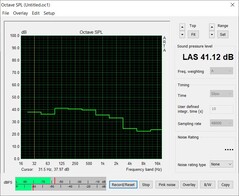
Ljudnivå i stress-testet - (PT 100%)
Ljudnivå i stress-testet - (PT 102%)
Power Consumption
1920x1080 The Witcher 3 ultra (external Monitor)
MSI GeForce RTX 3090 Suprim X
NVIDIA GeForce RTX 3090, R9 5900X, Intel Optane 905P 480GB 2.5 (Idle: 105.9 W)
597 (577min - 618max) Watt * -20%
ASUS GeForce RTX 3080 ROG STRIX OC GAMING
NVIDIA GeForce RTX 3080, R9 5900X, Intel Optane 905P 480GB 2.5 (Idle: 88.3 W)
505 (389min - 543max) Watt * -1%
AMD Radeon RX 6800 XT
Radeon RX 6800 XT, R9 5950X, Intel Optane 905P 480GB 2.5 (Idle: 99.5 W)
505 (389min - 543max) Watt * -1%
MSI GeForce RTX 3080 Gaming X Trio
NVIDIA GeForce RTX 3080, R9 5900X, Intel Optane 905P 480GB 2.5 (Idle: 103 W)
498.3 (487min - 523max) Watt *
MSI RTX 2080 Ti Gaming X Trio
GeForce RTX 2080 Ti (Desktop), R9 3900X (Idle: 87.8 W)
466.7 (457min - 505max) Watt * +6%
KFA2 GeForce RTX 2080 Ti EX
GeForce RTX 2080 Ti (Desktop), R9 3900X, Corsair MP600 (Idle: 100.5 W)
438.8 (431min - 463max) Watt * +12%
AMD Radeon RX Vega 64
RX Vega 64, R7 2700X (Idle: 74.3 W)
408 Watt * +18%
MSI RTX 2080 Gaming X Trio
GeForce RTX 2080 (Desktop), R7 2700X (Idle: 87.78 W)
404.7 (389min - 421max) Watt * +19%
MSI GeForce RTX 3070 Gaming X Trio
NVIDIA GeForce RTX 3070, R9 5900X, Intel Optane 905P 480GB 2.5 (Idle: 95.1 W)
394.5 (381min - 430max) Watt * +21%
Nvidia GeForce RTX 2080 Super
GeForce RTX 2080 Super (Desktop), R7 2700X (Idle: 78.87 W)
382.8 (360min - 410max) Watt * +23%
AMD Radeon RX 5700 XT
Radeon RX 5700 XT (Desktop), R7 2700X (Idle: 69.8 W)
348.7 (341min - 359max) Watt * +30%
Nvidia GeForce RTX 2070 Super
GeForce RTX 2070 Super (Desktop), R7 2700X (96.8 fps, Idle: 80.5 W)
344.7 (335min - 370max) Watt * +31%
MSI RTX 2070 Gaming Z 8G
GeForce RTX 2070 (Desktop), R7 2700X (Idle: 73.3 W)
342.9 (329min - 355max) Watt * +31%
AMD Radeon VII
Radeon VII, R7 2700X (Idle: 81.39 W)
339 (306min - 359max) Watt * +32%
Nvidia GeForce RTX 2060 Super
GeForce RTX 2060 Super (Desktop), R7 2700X (82.7 fps, Idle: 77.12 W)
298.2 (293min - 322max) Watt * +40%
AMD Radeon RX 5700
Radeon RX 5700 (Desktop), R7 2700X (84.2 fps, Idle: 64.5 W)
295.9 (284min - 304max) Watt * +41%
MSI RTX 2060 Gaming Z 6G
GeForce RTX 2060 (Desktop), R7 2700X (Idle: 74.66 W)
288.8 (284min - 299max) Watt * +42%
1280x720 FurMark 1.19 GPU Stress Test (external Monitor)
MSI GeForce RTX 3090 Suprim X
NVIDIA GeForce RTX 3090, R9 5900X, Intel Optane 905P 480GB 2.5 (Idle: 105.9 W)
551 (521min - 582max) Watt * -12%
ASUS GeForce RTX 3080 ROG STRIX OC GAMING
NVIDIA GeForce RTX 3080, R9 5900X, Intel Optane 905P 480GB 2.5 (Idle: 88.3 W)
505 (493min - 541max) Watt * -3%
MSI GeForce RTX 3080 Gaming X Trio
NVIDIA GeForce RTX 3080, R9 5900X, Intel Optane 905P 480GB 2.5 (Idle: 103 W)
492 (485min - 514max) Watt *
AMD Radeon RX 6800 XT
Radeon RX 6800 XT, R9 5950X, Intel Optane 905P 480GB 2.5 (Idle: 99.5 W)
447.9 (413min - 484max) Watt * +9%
MSI RTX 2080 Ti Gaming X Trio
GeForce RTX 2080 Ti (Desktop), R9 3900X (Idle: 87.8 W)
439.1 (426min - 488max) Watt * +11%
AMD Radeon VII
Radeon VII, R7 2700X (Idle: 81.39 W)
417.8 (399min - 446max) Watt * +15%
MSI RTX 2080 Gaming X Trio
GeForce RTX 2080 (Desktop), R7 2700X
402.2 (320min - 423max) Watt * +18%
KFA2 GeForce RTX 2080 Ti EX
GeForce RTX 2080 Ti (Desktop), R9 3900X, Corsair MP600 (Idle: 100.5 W)
400.8 (354min - 432max) Watt * +19%
MSI GeForce RTX 3070 Gaming X Trio
NVIDIA GeForce RTX 3070, R9 5900X, Intel Optane 905P 480GB 2.5 (Idle: 95.1 W)
376.9 (369min - 433max) Watt * +23%
Nvidia GeForce RTX 2080 Super
GeForce RTX 2080 Super (Desktop), R7 2700X (Idle: 78.87 W)
376.8 (331min - 409max) Watt * +23%
MSI RTX 2070 Gaming Z 8G
GeForce RTX 2070 (Desktop), R7 2700X (Idle: 73.3 W)
343 (336min - 382max) Watt * +30%
AMD Radeon RX 5700 XT
Radeon RX 5700 XT (Desktop), R7 2700X (239 fps, Idle: 69.8 W)
326.6 (313min - 351max) Watt * +34%
Nvidia GeForce RTX 2070 Super
GeForce RTX 2070 Super (Desktop), R7 2700X (283 fps, Idle: 80.5 W)
326 (315min - 348max) Watt * +34%
MSI RTX 2060 Gaming Z 6G
GeForce RTX 2060 (Desktop), R7 2700X (Idle: 74.66 W)
295.2 (148min - 331max) Watt * +40%
Nvidia GeForce RTX 2060 Super
GeForce RTX 2060 Super (Desktop), R7 2700X (237 fps, Idle: 77.12 W)
281.4 (275min - 321max) Watt * +43%
AMD Radeon RX 5700
Radeon RX 5700 (Desktop), R7 2700X (207 fps, Idle: 64.5 W)
280.5 (271min - 312max) Watt * +43%

* ... smaller is better

För

+ Tillräckligt snabb för UWQHD och UHD
+ Modern arkitektur (8 nm)
+ Raytracing och DLSS
+ Behagligt tyst och sval vid belastning
+ 36 månaders garanti
+ Diskret RGB-belysning
+ Billigare än föregångaren (Riktpris)
+ Fläktlöst läge

Emot

- Väldigt lång (kolla kompatibilitet med höljet)
- Endast 10 GB GDDR6X
- Väldigt hög energiförbrukning
- Väldigt svår att få tag på
MSI GeForce RTX 3080 Gaming X Trio - Recensionsex från MSI Taiwan (källa: MSI)

Läs den fullständiga versionen av den här recensionen på engelska här.

MSI utökar sin välkända serie spelgrafikkort med GeForce RTX 3080 Gaming X Trio. I fråga om ren prestanda behöver det här grafikkortet inte gömma sig bakom sina konkurrenter och det ligger på samma nivå som ett Asus GeForce RTX 3080 ROG Strix Gaming OC, som enligt specifikationerna har ännu högre boost-hastighet. Men MSI har också justerat klockfrekvensen jämfört med referensmodellen och har ökat den med 105 MHz till 1.815 MHz. Detta överträffas dock nästan alltid vid belastning, vilket bland annat beror på den utmärkta kylningen. Tack vare ett fläktlöst läge är MSI GeForce RTX 3080 Gaming X Trio till och med tyst i 2D-läge eller vid låg belastning. Även vid belastning är de tre stora fläktarna rätt tysta och känns inte irriterande.

Nvidia har en ordentlig konkurrent i toppskiktssektorn i form av AMD Radeon RX 6800 XT. GeForce RTX 3080 är ungefär lika snabb om vi jämför prestanda. Det är bara när specialfunktioner som raytracing används, helst i kombination med DLSS, som GeForce-modellerna tar fart. Det enda vi kan kritisera är den höga energiförbrukningen vid belastning. Men AMD:s motsvarighet är inte särskilt mycket effektivare med ett TGP på 300 Watt.

MSI GeForce RTX 3080 Gaming X Trio är ett riktigt snabbt RTX 3080 grafikkort som dessutom håller sig ganska svalt vid belastning.

Men vem behöver ett sådant grafikkort? Tja, tar vi en titt på nya spel som Cyberpunk 2077 är det nästan svårt att komma runt ett kraftfullt RTX 3080 om du inte vill offra detaljer. Aningen äldre spel kräver däremot höga upplösningar om de inte ska begränsas av CPU:n. Spelar man i huvudsak i 2160p eller 1440p kan det därför vara värt att överväga ett GeForce RTX 3080. Men det tar oss till nästa punkt: tillgängligheten. Det är fortfarande i princip omöjligt att köpa ett GeForce RTX 3080 just nu, och så har det varit sen kortet släpptes. Vidare har modellerna som finns alldels för höga priser. MSI har satt ett riktpris på 7.700 kronor för GeForce RTX 3080 Gaming X Trio. Men det faktiska butikspriset, om det nu finns inne, ligger på 10.000 kronor eller ännu mer. Så kommer det troligen vara ett bra tag, för ingen vet när situationen kommer bli bättre.

Please share our article, every link counts!
Mail Logo
> Bärbara datorer, laptops - tester och nyheter > Tester > Test: MSI GeForce RTX 3080 Gaming X Trio 10G (Sammanfattning)
Sebastian Bade, 2020-12-28 (Update: 2020-12-28)