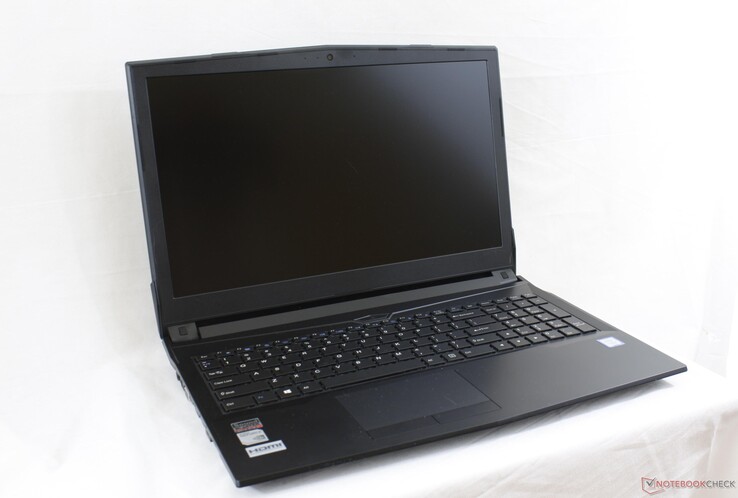
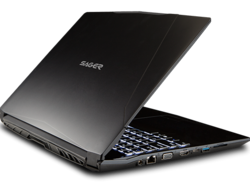
Test: Sager NP5852 (Clevo N850HL, i7-7700HQ, MX150) (Sammanfattning)
Topp 10...
» Topp 10: Bästa bärbara allround/multimediadatorerna
» Topp 10: Bästa bärbara speldatorerna
» Topp 10: Bärbara budget/kontorsdatorer
» Topp 10: Bästa bärbara kontors/premiumdatorerna
» Topp 10: Bärbara arbetsstationer
» Topp 10: De bästa små/kompakta bärbara datorerna
» Topp 10: Bästa ultrabooks
» Topp 10: Bästa hybriddatorerna
» Topp 10: Bästa surfplattorna
» Topp 10: Marknadens bästa smartphones
| SD Card Reader | |
| average JPG Copy Test (av. of 3 runs) | |
| Eurocom Tornado F5 Killer Edition | |
| Gigabyte Sabre 15G | |
| Sager NP5852 | |
| MSI GS63VR 7RF-228US | |
| maximum AS SSD Seq Read Test (1GB) | |
| Eurocom Tornado F5 Killer Edition | |
| Gigabyte Sabre 15G | |
| Sager NP5852 | |
| MSI GS63VR 7RF-228US | |
| Networking | |
| iperf3 transmit AX12 | |
| MSI GS63VR 7RF-228US | |
| Gigabyte Sabre 15G | |
| Sager NP5852 | |
| iperf3 receive AX12 | |
| MSI GS63VR 7RF-228US | |
| Gigabyte Sabre 15G | |
| Sager NP5852 | |
| |||||||||||||||||||||||||
Distribution av ljusstyrkan: 88 %
Mitt på batteriet: 303.9 cd/m²
Kontrast: 691:1 (Svärta: 0.44 cd/m²)
ΔE Color 7.3 | 0.5-29.43 Ø4.87
ΔE Greyscale 6.6 | 0.5-98 Ø5.1
56.5% sRGB (Argyll 1.6.3 3D)
36.4% AdobeRGB 1998 (Argyll 1.6.3 3D)
39.58% AdobeRGB 1998 (Argyll 2.2.0 3D)
56.8% sRGB (Argyll 2.2.0 3D)
38.19% Display P3 (Argyll 2.2.0 3D)
Gamma: 2.24
| Sager NP5852 ID: LGD0533, Name: LG Philips LP156WF6-SPK3, IPS, 15.6", 1920x1080 | Gigabyte Sabre 15G ID: LGD0533, Name: LG Display LP156WF6-SPK3, IPS, 15.6", 1920x1080 | Asus ZenBook Pro UX550VD CMN15E8 (N156HCE-EN1), IPS, 15.6", 1920x1080 | Acer Aspire 5 A515-51G-51RL AU Optronics B156HAN06.1, IPS, 15.6", 1920x1080 | Acer TravelMate P658-G2-MG-7327 LG Philips LP156WF6-SPP1, IPS, 15.6", 1920x1080 | Asus AsusPro P4540UQ-FY0056R LG Philips LP156WF6-SPB6, IPS, 15.6", 1920x1080 | |
|---|---|---|---|---|---|---|
| Display | 2% | 66% | 0% | 60% | 56% | |
| Display P3 Coverage | 38.19 | 38.97 2% | 65.7 72% | 38.3 0% | 64.9 70% | 63.3 66% |
| sRGB Coverage | 56.8 | 58.2 2% | 90.3 59% | 57.6 1% | 85.9 51% | 83.6 47% |
| AdobeRGB 1998 Coverage | 39.58 | 40.3 2% | 65.9 66% | 39.57 0% | 62.8 59% | 61.1 54% |
| Response Times | 0% | 1% | -16% | -8% | -9% | |
| Response Time Grey 50% / Grey 80% * | 29.6 ? | 32 ? -8% | 38.8 ? -31% | 41 ? -39% | 38 ? -28% | 38 ? -28% |
| Response Time Black / White * | 28 ? | 25.6 ? 9% | 27.2 ? 3% | 26 ? 7% | 28 ? -0% | 29 ? -4% |
| PWM Frequency | 20000 ? | 20000 ? 0% | 25910 ? 30% | 21000 ? 5% | 21000 ? 5% | |
| Screen | 2% | 37% | 27% | 32% | 35% | |
| Brightness middle | 303.9 | 248.4 -18% | 335 10% | 235 -23% | 284 -7% | 276 -9% |
| Brightness | 286 | 241 -16% | 313 9% | 236 -17% | 276 -3% | 283 -1% |
| Brightness Distribution | 88 | 84 -5% | 83 -6% | 80 -9% | 82 -7% | 85 -3% |
| Black Level * | 0.44 | 0.3 32% | 0.27 39% | 0.17 61% | 0.295 33% | 0.27 39% |
| Contrast | 691 | 828 20% | 1241 80% | 1382 100% | 963 39% | 1022 48% |
| Colorchecker dE 2000 * | 7.3 | 7.5 -3% | 4.7 36% | 4.69 36% | 4.07 44% | 3.92 46% |
| Colorchecker dE 2000 max. * | 27.3 | 25.2 8% | 8.1 70% | 7.9 71% | 10.52 61% | 9.13 67% |
| Greyscale dE 2000 * | 6.6 | 6.5 2% | 5.8 12% | 3.34 49% | 3.13 53% | 2.6 61% |
| Gamma | 2.24 98% | 2.19 100% | 2.06 107% | 2.63 84% | 2.41 91% | 2.53 87% |
| CCT | 7652 85% | 7852 83% | 6518 100% | 6801 96% | 7082 92% | 6561 99% |
| Color Space (Percent of AdobeRGB 1998) | 36.4 | 37 2% | 58.7 61% | 36 -1% | 56 54% | 54.5 50% |
| Color Space (Percent of sRGB) | 56.5 | 57.9 2% | 90.1 59% | 57 1% | 86 52% | 83.7 48% |
| Totalt genomsnitt (program/inställningar) | 1% /
2% | 35% /
36% | 4% /
16% | 28% /
30% | 27% /
30% |
* ... mindre är bättre
Visa svarstider
| ↔ Svarstid svart till vitt | ||
|---|---|---|
| 28 ms ... stiga ↗ och falla ↘ kombinerat | ↗ 18 ms stiga | |
| ↘ 10 ms hösten | ||
| Skärmen visar relativt långsamma svarsfrekvenser i våra tester och kan vara för långsam för spelare. I jämförelse sträcker sig alla testade enheter från 0.1 (minst) till 240 (maximalt) ms. » 69 % av alla enheter är bättre. Detta innebär att den uppmätta svarstiden är sämre än genomsnittet av alla testade enheter (20.8 ms). | ||
| ↔ Svarstid 50 % grått till 80 % grått | ||
| 29.6 ms ... stiga ↗ och falla ↘ kombinerat | ↗ 14.8 ms stiga | |
| ↘ 14.8 ms hösten | ||
| Skärmen visar relativt långsamma svarsfrekvenser i våra tester och kan vara för långsam för spelare. I jämförelse sträcker sig alla testade enheter från 0.165 (minst) till 636 (maximalt) ms. » 36 % av alla enheter är bättre. Det betyder att den uppmätta svarstiden liknar genomsnittet av alla testade enheter (32.5 ms). | ||
Skärmflimmer / PWM (Puls-Width Modulation)
| Skärmflimmer / PWM upptäckt | 20000 Hz | ≤ 99 % ljusstyrka inställning | |
Displayens bakgrundsbelysning flimrar vid 20000 Hz (i värsta fall, t.ex. med PWM) Flimrande upptäckt vid en ljusstyrkeinställning på 99 % och lägre. Det ska inte finnas något flimmer eller PWM över denna ljusstyrkeinställning. Frekvensen för 20000 Hz är ganska hög, så de flesta användare som är känsliga för PWM bör inte märka något flimmer. Som jämförelse: 53 % av alla testade enheter använder inte PWM för att dämpa skärmen. Om PWM upptäcktes mättes ett medelvärde av 8516 (minst: 5 - maximum: 343500) Hz. | |||
| Cinebench R15 | |
| CPU Single 64Bit | |
| Lenovo Legion Y920-17IKB | |
| Sager NP5852 | |
| Eurocom Q5 | |
| Gigabyte P55 V4 | |
| MSI GE72VR-6RF16H21 | |
| Dell Inspiron 15 7000 7567 Gaming (Core i5-7300HQ, GTX 1050) | |
| Lenovo IdeaPad Y50 | |
| CPU Multi 64Bit | |
| Lenovo Legion Y920-17IKB | |
| Lenovo Legion Y920-17IKB | |
| Eurocom Q5 | |
| Sager NP5852 | |
| Gigabyte P55 V4 | |
| MSI GE72VR-6RF16H21 | |
| Dell Inspiron 15 7000 7567 Gaming (Core i5-7300HQ, GTX 1050) | |
| Lenovo IdeaPad Y50 | |
| Cinebench R11.5 | |
| CPU Single 64Bit | |
| Lenovo Legion Y920-17IKB | |
| Sager NP5852 | |
| Eurocom Q5 | |
| MSI GE72VR-6RF16H21 | |
| Gigabyte P55 V4 | |
| Dell Inspiron 15 7000 7567 Gaming (Core i5-7300HQ, GTX 1050) | |
| Lenovo IdeaPad Y50 | |
| CPU Multi 64Bit | |
| Lenovo Legion Y920-17IKB | |
| Eurocom Q5 | |
| Sager NP5852 | |
| MSI GE72VR-6RF16H21 | |
| Gigabyte P55 V4 | |
| Dell Inspiron 15 7000 7567 Gaming (Core i5-7300HQ, GTX 1050) | |
| Lenovo IdeaPad Y50 | |
| Cinebench R10 | |
| Rendering Multiple CPUs 32Bit | |
| Sager NP5852 | |
| Eurocom Q5 | |
| Gigabyte P55 V4 | |
| MSI GE72VR-6RF16H21 | |
| Dell Inspiron 15 7000 7567 Gaming (Core i5-7300HQ, GTX 1050) | |
| Lenovo IdeaPad Y50 | |
| Rendering Single 32Bit | |
| Sager NP5852 | |
| Eurocom Q5 | |
| Gigabyte P55 V4 | |
| Dell Inspiron 15 7000 7567 Gaming (Core i5-7300HQ, GTX 1050) | |
| Lenovo IdeaPad Y50 | |
| MSI GE72VR-6RF16H21 | |
| wPrime 2.10 - 1024m | |
| Dell Inspiron 15 7000 7567 Gaming (Core i5-7300HQ, GTX 1050) | |
| Lenovo Legion Y920-17IKB | |
| Lenovo IdeaPad Y50 | |
| Eurocom Q5 | |
| Sager NP5852 | |
| Gigabyte P55 V4 | |
* ... mindre är bättre
| PCMark 8 | |
| Home Score Accelerated v2 | |
| Lenovo Legion Y920-17IKB | |
| Sager NP5852 | |
| Acer Aspire 5 A515-51G-51RL | |
| Gigabyte Sabre 15G | |
| Acer Aspire F5-771G-50RD | |
| Work Score Accelerated v2 | |
| Lenovo Legion Y920-17IKB | |
| Gigabyte Sabre 15G | |
| Sager NP5852 | |
| Acer Aspire 5 A515-51G-51RL | |
| Acer Aspire F5-771G-50RD | |
| Creative Score Accelerated v2 | |
| Lenovo Legion Y920-17IKB | |
| Sager NP5852 | |
| Acer Aspire 5 A515-51G-51RL | |
| Gigabyte Sabre 15G | |
| PCMark 10 | |
| Digital Content Creation | |
| Lenovo Legion Y920-17IKB | |
| Gigabyte Sabre 15G | |
| Sager NP5852 | |
| Acer Aspire 5 A515-51G-51RL | |
| Productivity | |
| Lenovo Legion Y920-17IKB | |
| Gigabyte Sabre 15G | |
| Sager NP5852 | |
| Acer Aspire 5 A515-51G-51RL | |
| Essentials | |
| Lenovo Legion Y920-17IKB | |
| Gigabyte Sabre 15G | |
| Sager NP5852 | |
| Acer Aspire 5 A515-51G-51RL | |
| Score | |
| Lenovo Legion Y920-17IKB | |
| Gigabyte Sabre 15G | |
| Sager NP5852 | |
| Acer Aspire 5 A515-51G-51RL | |
| PCMark 8 Home Score Accelerated v2 | 3742 poäng | |
| PCMark 8 Creative Score Accelerated v2 | 4741 poäng | |
| PCMark 8 Work Score Accelerated v2 | 5011 poäng | |
| PCMark 10 Score | 3939 poäng | |
Hjälp | ||
| Sager NP5852 Western Digital WD Blue PC SSD WDS250G1B0B | Gigabyte Sabre 15G Liteonit CV3-8D128 | Asus ZenBook Pro UX550VD Samsung PM961 NVMe MZVLW512HMJP | Acer Aspire 5 A515-51G-51RL Kingston RBUSNS8180DS3128GH | Acer TravelMate P658-G2-MG-7327 Liteonit CV3-8D512 | Asus AsusPro P4540UQ-FY0056R SK Hynix HFS256G39TND-N210A | |
|---|---|---|---|---|---|---|
| AS SSD | -14% | 215% | -60% | 11% | -34% | |
| Copy Game MB/s | 263.6 | 323.5 23% | 889 237% | 214.6 -19% | 410.4 56% | 168.2 -36% |
| Copy Program MB/s | 191.1 | 195.3 2% | 336.4 76% | 71.1 -63% | 266.9 40% | 123.4 -35% |
| Copy ISO MB/s | 337.5 | 446.8 32% | 1678 397% | 296.7 -12% | 491.5 46% | 266.9 -21% |
| Score Total | 1027 | 752 -27% | 3731 263% | 1043 2% | 982 -4% | 977 -5% |
| Score Write | 335 | 234 -30% | 1158 246% | 405 21% | 400 19% | 316 -6% |
| Score Read | 453 | 337 -26% | 1727 281% | 414 -9% | 379 -16% | 442 -2% |
| Access Time Write * | 0.054 | 0.073 -35% | 0.028 48% | 0.42 -678% | 0.067 -24% | 0.224 -315% |
| Access Time Read * | 0.092 | 0.141 -53% | 0.031 66% | 0.191 -108% | 0.068 26% | 0.084 9% |
| 4K-64 Write | 231.4 | 132.2 -43% | 870 276% | 309.5 34% | 293.5 27% | 233.6 1% |
| 4K-64 Read | 372.9 | 257 -31% | 1430 283% | 328.4 -12% | 301.6 -19% | 364.5 -2% |
| 4K Write | 57.5 | 53.8 -6% | 133.2 132% | 52.5 -9% | 58 1% | 63.5 10% |
| 4K Read | 30.12 | 28.3 -6% | 54 79% | 38.73 29% | 27.05 -10% | 27.19 -10% |
| Seq Write | 457.1 | 479.8 5% | 1540 237% | 425 -7% | 488.7 7% | 190.8 -58% |
| Seq Read | 497.6 | 516 4% | 2429 388% | 471.7 -5% | 501 1% | 502 1% |
* ... mindre är bättre
| 3DMark | |
| 1280x720 Cloud Gate Standard Graphics | |
| Gigabyte Sabre 15G | |
| XFX RX-460P4DFG5 Double Dissipation 4 GB | |
| Gigabyte P55K v5 | |
| Ibuypower Chimera CX-9 | |
| Acer Aspire E5-575G-549D | |
| Desktop PC Intel Xeon E5 2680v4 Zotac GT 1030 | |
| Sager NP5852 | |
| Asus N552VX-FY103T | |
| Acer Aspire 5 A515-51G-51RL | |
| Lenovo IdeaPad 520s-14IKB 80X200C1GE | |
| Apple MacBook Pro 13 2017 | |
| MSI GL62M 7RD-077 | |
| 1920x1080 Fire Strike Graphics | |
| Gigabyte Sabre 15G | |
| XFX RX-460P4DFG5 Double Dissipation 4 GB | |
| Gigabyte P55K v5 | |
| Ibuypower Chimera CX-9 | |
| Sager NP5852 | |
| Desktop PC Intel Xeon E5 2680v4 Zotac GT 1030 | |
| Acer Aspire 5 A515-51G-51RL | |
| Acer Aspire E5-575G-549D | |
| Asus N552VX-FY103T | |
| Lenovo IdeaPad 520s-14IKB 80X200C1GE | |
| Apple MacBook Pro 13 2017 | |
| MSI GL62M 7RD-077 | |
| 3DMark 11 | |
| 1280x720 Performance GPU | |
| XFX RX-460P4DFG5 Double Dissipation 4 GB | |
| Gigabyte Sabre 15G | |
| Gigabyte P55K v5 | |
| Ibuypower Chimera CX-9 | |
| Desktop PC Intel Xeon E5 2680v4 Zotac GT 1030 | |
| Sager NP5852 | |
| Acer Aspire 5 A515-51G-51RL | |
| Asus N552VX-FY103T | |
| Acer Aspire E5-575G-549D | |
| Lenovo IdeaPad 520s-14IKB 80X200C1GE | |
| Apple MacBook Pro 13 2017 | |
| MSI GL62M 7RD-077 | |
| 1280x720 Performance Combined | |
| XFX RX-460P4DFG5 Double Dissipation 4 GB | |
| Gigabyte P55K v5 | |
| Gigabyte Sabre 15G | |
| Ibuypower Chimera CX-9 | |
| Sager NP5852 | |
| Desktop PC Intel Xeon E5 2680v4 Zotac GT 1030 | |
| Acer Aspire 5 A515-51G-51RL | |
| Acer Aspire E5-575G-549D | |
| Asus N552VX-FY103T | |
| Lenovo IdeaPad 520s-14IKB 80X200C1GE | |
| Apple MacBook Pro 13 2017 | |
| MSI GL62M 7RD-077 | |
| 3DMark 11 Performance | 4906 poäng | |
| 3DMark Ice Storm Standard Score | 72119 poäng | |
| 3DMark Cloud Gate Standard Score | 15501 poäng | |
| 3DMark Fire Strike Score | 3353 poäng | |
| 3DMark Fire Strike Extreme Score | 1709 poäng | |
Hjälp | ||
| BioShock Infinite - 1920x1080 Ultra Preset, DX11 (DDOF) | |
| Gigabyte Sabre 15G | |
| MSI GL72 6QF | |
| Desktop PC Intel Xeon E5 2680v4 Zotac GT 1030 | |
| Sager NP5852 | |
| Acer Aspire 5 A515-51G-51RL | |
| Medion Erazer P6661 MD 99873 | |
| Samsung Notebook 9 NP900X5N-X01US | |
| Apple MacBook Pro 13 2017 Touchbar i5 | |
| Rise of the Tomb Raider - 1920x1080 Very High Preset AA:FX AF:16x | |
| Gigabyte Sabre 15G | |
| MSI GL72 6QF | |
| Desktop PC Intel Xeon E5 2680v4 Zotac GT 1030 | |
| Sager NP5852 | |
| Acer Aspire 5 A515-51G-51RL | |
| Medion Erazer P6661 MD 99873 | |
| Overwatch - 1920x1080 Epic (Render Scale 100 %) AA:SM AF:16x | |
| Gigabyte Sabre 15G | |
| Sager NP5852 | |
| Desktop PC Intel Xeon E5 2680v4 Zotac GT 1030 | |
| Apple MacBook Pro 13 2017 Touchbar i5 | |
| låg | med. | hög | ultra | |
|---|---|---|---|---|
| Guild Wars 2 (2012) | 95.2 | 51 | 21.2 | |
| StarCraft II: Heart of the Swarm (2013) | 66 | |||
| BioShock Infinite (2013) | 202.9 | 113.8 | 95.4 | 34.9 |
| Metro: Last Light (2013) | 97.4 | 84.6 | 49.8 | 25.6 |
| Thief (2014) | 79.2 | 51.9 | 44.1 | 23.2 |
| The Witcher 3 (2015) | 69 | 42 | 23.5 | 12.6 |
| Batman: Arkham Knight (2015) | 57 | 49 | 22 | 8 |
| Fallout 4 (2015) | 45.8 | 25 | 19.8 | |
| Rise of the Tomb Raider (2016) | 78.4 | 44.6 | 24.5 | 19.2 |
| Ashes of the Singularity (2016) | 35.1 | 20.7 | 17.1 | |
| Overwatch (2016) | 168 | 54.4 | 34.4 | |
| Mafia 3 (2016) | 31.2 | 21.9 | 14 | |
| Prey (2017) | 50.6 | 40 | 34 | |
| Dirt 4 (2017) | 52.9 | 39 | 23.7 | |
| F1 2017 (2017) | 83 | 41 | 32 | 20 |
Ljudnivå
| Låg belastning |
| 28.7 / 28.7 / 29.3 dB(A) |
| Hög belastning |
| 41.6 / 53.7 dB(A) |
 | ||
30 dB tyst 40 dB(A) hörbar 50 dB(A) högt ljud |
||
min: | ||
| Sager NP5852 GeForce MX150, i7-7700HQ, Western Digital WD Blue PC SSD WDS250G1B0B | Gigabyte Sabre 15G GeForce GTX 1050 Mobile, i7-7700HQ, Liteonit CV3-8D128 | Asus ZenBook Pro UX550VD GeForce GTX 1050 Mobile, i7-7700HQ, Samsung PM961 NVMe MZVLW512HMJP | Acer Aspire 5 A515-51G-51RL GeForce MX150, i5-7200U, Kingston RBUSNS8180DS3128GH | Acer TravelMate P658-G2-MG-7327 GeForce 940MX, i7-7500U, Liteonit CV3-8D512 | Asus AsusPro P4540UQ-FY0056R GeForce 940MX, i5-7200U, SK Hynix HFS256G39TND-N210A | |
|---|---|---|---|---|---|---|
| Noise | -11% | 3% | 0% | 4% | 4% | |
| av / miljö * | 28.3 | 28.2 -0% | 29.4 -4% | 30.1 -6% | 30 -6% | 30.3 -7% |
| Idle Minimum * | 28.7 | 33 -15% | 29.4 -2% | 30.1 -5% | 30 -5% | 30.3 -6% |
| Idle Average * | 28.7 | 33.3 -16% | 29.9 -4% | 30.2 -5% | 30 -5% | 30.3 -6% |
| Idle Maximum * | 29.3 | 34.7 -18% | 29.9 -2% | 30.5 -4% | 30 -2% | 30.3 -3% |
| Load Average * | 41.6 | 44.5 -7% | 38.3 8% | 41.1 1% | 37.3 10% | 35.4 15% |
| Witcher 3 ultra * | 39.8 | 49.2 -24% | 39.8 -0% | 40.4 -2% | ||
| Load Maximum * | 53.7 | 52.8 2% | 39.6 26% | 41.2 23% | 38 29% | 37.2 31% |
* ... mindre är bättre
(-) Den maximala temperaturen på ovansidan är 46.8 °C / 116 F, jämfört med genomsnittet av 40.4 °C / 105 F , allt från 21.2 till 68.8 °C för klassen Gaming.
(±) Botten värms upp till maximalt 40.8 °C / 105 F, jämfört med genomsnittet av 43.2 °C / 110 F
(+) Vid tomgångsbruk är medeltemperaturen för ovansidan 26.6 °C / 80 F, jämfört med enhetsgenomsnittet på 33.9 °C / ### class_avg_f### F.
(±) När du spelar The Witcher 3 är medeltemperaturen för ovansidan 34.3 °C / 94 F, jämfört med enhetsgenomsnittet på 33.9 °C / ## #class_avg_f### F.
(+) Handledsstöden och pekplattan når maximal hudtemperatur (34.8 °C / 94.6 F) och är därför inte varma.
(-) Medeltemperaturen för handledsstödsområdet på liknande enheter var 28.9 °C / 84 F (-5.9 °C / -10.6 F).
Sager NP5852 ljudanalys
(-) | inte särskilt höga högtalare (67.3 dB)
Bas 100 - 315 Hz
(-) | nästan ingen bas - i genomsnitt 17.5% lägre än medianen
(±) | linjäriteten för basen är genomsnittlig (10.9% delta till föregående frekvens)
Mellan 400 - 2000 Hz
(±) | högre mellan - i genomsnitt 7.8% högre än median
(-) | mids är inte linjära (18% delta till föregående frekvens)
Högsta 2 - 16 kHz
(±) | högre toppar - i genomsnitt 5.9% högre än medianen
(-) | toppar är inte linjära (19.8% delta till föregående frekvens)
Totalt 100 - 16 000 Hz
(-) | det totala ljudet är inte linjärt (41.9% skillnad mot median)
Jämfört med samma klass
» 99% av alla testade enheter i den här klassen var bättre, 0% liknande, 0% sämre
» Den bästa hade ett delta på 6%, genomsnittet var 18%, sämst var 132%
Jämfört med alla testade enheter
» 95% av alla testade enheter var bättre, 0% liknande, 5% sämre
» Den bästa hade ett delta på 4%, genomsnittet var 24%, sämst var 134%
Apple MacBook 12 (Early 2016) 1.1 GHz ljudanalys
(+) | högtalare kan spela relativt högt (83.6 dB)
Bas 100 - 315 Hz
(±) | reducerad bas - i genomsnitt 11.3% lägre än medianen
(±) | linjäriteten för basen är genomsnittlig (14.2% delta till föregående frekvens)
Mellan 400 - 2000 Hz
(+) | balanserad mellan - endast 2.4% från medianen
(+) | mids är linjära (5.5% delta till föregående frekvens)
Högsta 2 - 16 kHz
(+) | balanserade toppar - endast 2% från medianen
(+) | toppar är linjära (4.5% delta till föregående frekvens)
Totalt 100 - 16 000 Hz
(+) | det totala ljudet är linjärt (10.2% skillnad mot median)
Jämfört med samma klass
» 6% av alla testade enheter i den här klassen var bättre, 2% liknande, 91% sämre
» Den bästa hade ett delta på 5%, genomsnittet var 19%, sämst var 53%
Jämfört med alla testade enheter
» 4% av alla testade enheter var bättre, 1% liknande, 95% sämre
» Den bästa hade ett delta på 4%, genomsnittet var 24%, sämst var 134%
| Av/Standby | |
| Låg belastning | |
| Hög belastning |
|
Förklaring:
min: | |
| Sager NP5852 i7-7700HQ, GeForce MX150, Western Digital WD Blue PC SSD WDS250G1B0B, IPS, 1920x1080, 15.6" | Gigabyte Sabre 15G i7-7700HQ, GeForce GTX 1050 Mobile, Liteonit CV3-8D128, IPS, 1920x1080, 15.6" | Acer Aspire 5 A515-51G-51RL i5-7200U, GeForce MX150, Kingston RBUSNS8180DS3128GH, IPS, 1920x1080, 15.6" | Acer TravelMate P658-G2-MG-7327 i7-7500U, GeForce 940MX, Liteonit CV3-8D512, IPS, 1920x1080, 15.6" | Asus N552VX-FY103T 6700HQ, GeForce GTX 950M, Toshiba MQ02ABD100H, AH-IPS, 1920x1080, 15.6" | HP Pavilion 15 UHD T9Y85AV 6700HQ, GeForce GTX 960M, SanDisk Z400s SD8SNAT-128G, IPS, 3840x2160, 15.6" | Lenovo ThinkPad T470p-20J7S00000 i7-7700HQ, GeForce 940MX, Samsung PM961 NVMe MZVLW512HMJP, IPS, 2560x1440, 14" | |
|---|---|---|---|---|---|---|---|
| Power Consumption | -16% | 35% | 29% | -5% | -24% | 25% | |
| Idle Minimum * | 9.2 | 8 13% | 2.9 68% | 3.9 58% | 7 24% | 8.3 10% | 3.8 59% |
| Idle Average * | 11.2 | 10.9 3% | 5.9 47% | 7.9 29% | 10.9 3% | 14.8 -32% | 6.5 42% |
| Idle Maximum * | 11.3 | 11 3% | 6.4 43% | 11.3 -0% | 12.9 -14% | 16.8 -49% | 7.2 36% |
| Load Average * | 71.3 | 76.7 -8% | 54 24% | 47 34% | 72 -1% | 71 -0% | 62.5 12% |
| Witcher 3 ultra * | 54.8 | 94.9 -73% | 51 7% | ||||
| Load Maximum * | 80.1 | 106.4 -33% | 66 18% | 62 23% | 109 -36% | 119.2 -49% | 99.6 -24% |
* ... mindre är bättre
| Sager NP5852 i7-7700HQ, GeForce MX150, 62 Wh | Gigabyte Sabre 15G i7-7700HQ, GeForce GTX 1050 Mobile, 47 Wh | Asus ZenBook Pro UX550VD i7-7700HQ, GeForce GTX 1050 Mobile, 73 Wh | Acer Aspire 5 A515-51G-51RL i5-7200U, GeForce MX150, 48 Wh | Acer TravelMate P658-G2-MG-7327 i7-7500U, GeForce 940MX, 55 Wh | Acer Aspire F5-771G-50RD i5-7200U, GeForce GTX 950M, 40 Wh | |
|---|---|---|---|---|---|---|
| Batteridrifttid | -21% | 41% | 72% | 44% | -22% | |
| Reader / Idle | 498 | 493 -1% | 1061 113% | 1253 152% | 429 -14% | |
| WiFi v1.3 | 351 | 261 -26% | 535 52% | 517 47% | 506 44% | 268 -24% |
| Load | 121 | 77 -36% | 70 -42% | 142 17% | 87 -28% | |
| Witcher 3 ultra | 68 |
För
Emot
I fråga om prestanda så är potentialen för spel på MX150 imponerande med tanke på att den förbrukar runt 40 procent mindre energi än Sabre 15 (GTX 1050) samtidigt som den är 40 till 45 procent långsammare. Både körtemperatur och fläktljud är påtagligt svalare respektive tystare, för en respektabel spelupplevelse mellan skolarbete och raster. Det är faktiskt rätt otroligt att se prestanda jämförbar med de äldre GTX 860M eller GTX 950M på en instegsmodell med en Pascal-GPU.
Vår största anmärkning på NP5852 rör inte dess prestanda utan snarare dess pris och chassi. För det första så är ca 8 800 SEK i utgångspris ganska nära en Sabre 15, Samsung Odyssey eller Pavilion 15 Power med snabbare GTX 1050-grafik. Intresserade köpare behöver inte lägga mer än 800 - 1600 SEK mer för att få en stor förbättring i kraften på GPU:n om spel är prioriterat. För det andra är chassit ganska stort för en integsmodell med en MX150 GPU. De tidigare nämnda alternativen är inte nämnvärt större eller tjockare än vår Sager, så ett mindre Ultrabook-liknande chassi hade varit bättre lämpat för MX150. Att kombinera MX150 med en Intel U-klass skulle förvisso resultera i aningen långsammare spelprestanda, som våra jämförelser med Aspire 5 A515 har visat, men dom stora besparingarna i vikt och flyttbarhet skulle troligen kompensera för dom flesta vardagsspelare.
Sager NP5852 är en bra tillbaka-till-skolan instegsmodell för spel. Vänta dock ett par månader och marknaden kommer att vara mättad med tunnare och lättare modeller som erbjuder samma MX150 GPU. Vi kan bara rekommendera NP5852 om priset går ner ytterligare jämfört med den existerande skörden av budget-vänliga bärbara GTX 1050-modeller.
Sager NP5852
- 09/21/2017 v6 (old)
Allen Ngo


