

Test: Samsung Galaxy Tab Active 2 Surfplatta (Sammanfattning)


| |||||||||||||||||||||||||
Distribution av ljusstyrkan: 91 %
Mitt på batteriet: 509 cd/m²
Kontrast: 1060:1 (Svärta: 0.48 cd/m²)
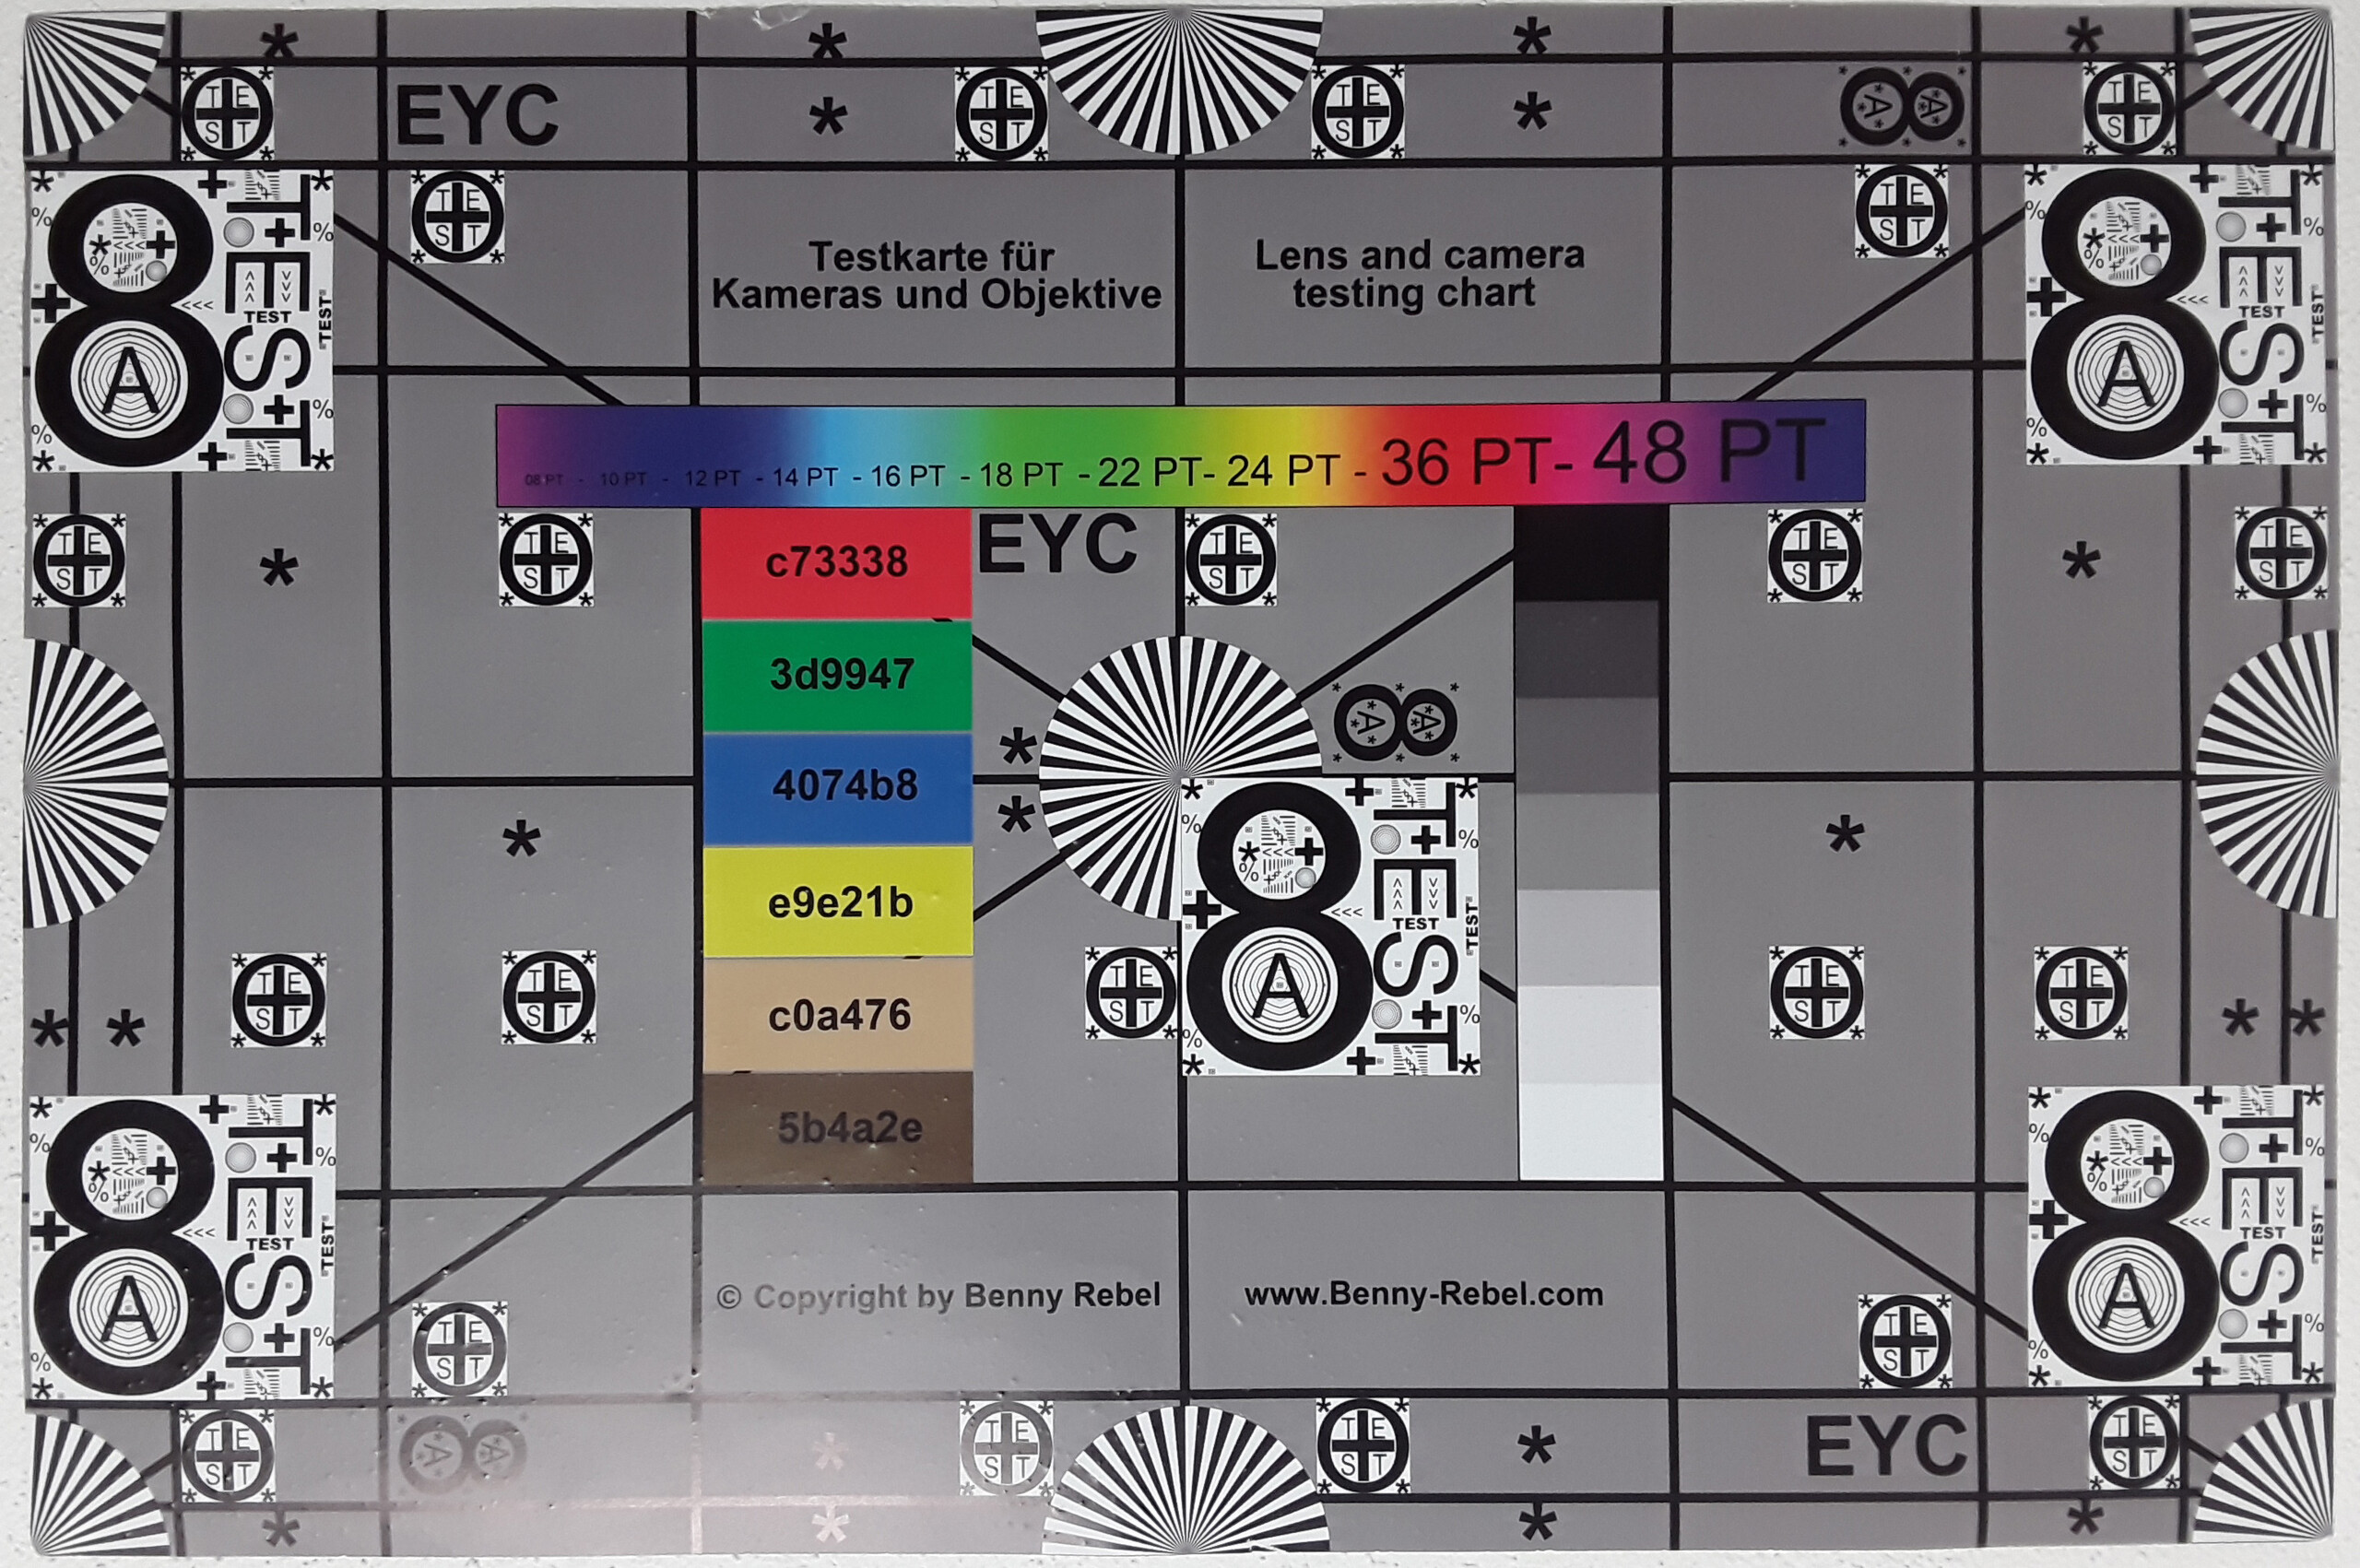
ΔE Color 3.45 | 0.5-29.43 Ø4.87
ΔE Greyscale 4.5 | 0.5-98 Ø5.1
99.9% sRGB (Calman 2D)
Gamma: 2.11
| Samsung Galaxy Tab Active 2 TFT LCD, 1280x800, 8" | Samsung Galaxy Tab Active TFT, 1280x800, 8" | Lenovo Tab 4 8 IPS, 1280x800, 8" | Huawei Mediapad M3 Lite 8 IPS, 1920x1200, 8" | Amazon Fire HD 8 2017 IPS, 1280x800, 8" | Apple iPad (2017) IPS, 2048x1536, 9.7" | |
|---|---|---|---|---|---|---|
| Screen | -31% | -38% | -26% | -57% | 21% | |
| Brightness middle | 509 | 424 -17% | 455 -11% | 409.1 -20% | 419 -18% | 514 1% |
| Brightness | 477 | 426 -11% | 446 -6% | 402 -16% | 412 -14% | 485 2% |
| Brightness Distribution | 91 | 85 -7% | 91 0% | 92 1% | 91 0% | 88 -3% |
| Black Level * | 0.48 | 0.7 -46% | 0.51 -6% | 0.56 -17% | 0.39 19% | 0.46 4% |
| Contrast | 1060 | 606 -43% | 892 -16% | 731 -31% | 1074 1% | 1117 5% |
| Colorchecker dE 2000 * | 3.45 | 5.7 -65% | 5.5 -59% | 4.1 -19% | 8.5 -146% | 1.4 59% |
| Colorchecker dE 2000 max. * | 5.17 | 14.8 -186% | 9.6 -86% | 13.8 -167% | 2.9 44% | |
| Greyscale dE 2000 * | 4.5 | 5.76 -28% | 5.5 -22% | 5.3 -18% | 10.3 -129% | 2.1 53% |
| Gamma | 2.11 104% | 2.36 93% | 2.23 99% | 2.2 100% | 2.6 85% | 2.22 99% |
| CCT | 7171 91% | 7236 90% | 7852 83% | 7603 85% | 6216 105% | 6647 98% |
* ... mindre är bättre
Skärmflimmer / PWM (Puls-Width Modulation)
| Skärmflimmer / PWM upptäcktes inte |  | ||
Som jämförelse: 53 % av alla testade enheter använder inte PWM för att dämpa skärmen. Om PWM upptäcktes mättes ett medelvärde av 8516 (minst: 5 - maximum: 343500) Hz. | |||
Visa svarstider
| ↔ Svarstid svart till vitt | ||
|---|---|---|
| 28 ms ... stiga ↗ och falla ↘ kombinerat | ↗ 17 ms stiga |  |
| ↘ 11 ms hösten | ||
| Skärmen visar relativt långsamma svarsfrekvenser i våra tester och kan vara för långsam för spelare. I jämförelse sträcker sig alla testade enheter från 0.1 (minst) till 240 (maximalt) ms. » 69 % av alla enheter är bättre. Detta innebär att den uppmätta svarstiden är sämre än genomsnittet av alla testade enheter (20.8 ms). | ||
| ↔ Svarstid 50 % grått till 80 % grått | ||
| 42 ms ... stiga ↗ och falla ↘ kombinerat | ↗ 23 ms stiga | 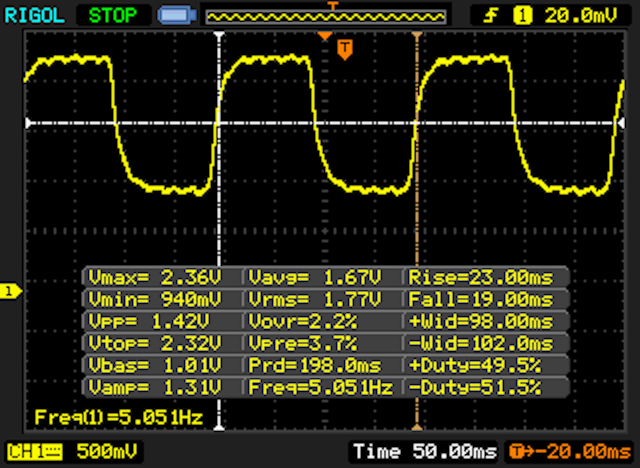 |
| ↘ 19 ms hösten | ||
| Skärmen visar långsamma svarsfrekvenser i våra tester och kommer att vara otillfredsställande för spelare. I jämförelse sträcker sig alla testade enheter från 0.165 (minst) till 636 (maximalt) ms. » 65 % av alla enheter är bättre. Detta innebär att den uppmätta svarstiden är sämre än genomsnittet av alla testade enheter (32.5 ms). | ||
| AnTuTu v6 - Total Score | |
| Apple iPad (2017) | |
| Huawei Mediapad M3 Lite 8 | |
| Samsung Galaxy Tab Active 2 | |
| Lenovo Tab 4 8 | |
| Amazon Fire HD 8 2017 | |
| PCMark for Android | |
| Work performance score | |
| Samsung Galaxy Tab Active 2 | |
| Huawei Mediapad M3 Lite 8 | |
| Lenovo Tab 4 8 | |
| Amazon Fire HD 8 2017 | |
| Samsung Galaxy Tab Active | |
| Work 2.0 performance score | |
| Samsung Galaxy Tab Active 2 | |
| Huawei Mediapad M3 Lite 8 | |
| Lenovo Tab 4 8 | |
| Amazon Fire HD 8 2017 | |
| Geekbench 4.4 | |
| 64 Bit Single-Core Score | |
| Samsung Galaxy Tab Active 2 | |
| Lenovo Tab 4 8 | |
| Huawei Mediapad M3 Lite 8 | |
| Amazon Fire HD 8 2017 | |
| 64 Bit Multi-Core Score | |
| Samsung Galaxy Tab Active 2 | |
| Huawei Mediapad M3 Lite 8 | |
| Lenovo Tab 4 8 | |
| Amazon Fire HD 8 2017 | |
| Compute RenderScript Score | |
| Samsung Galaxy Tab Active 2 | |
| Lenovo Tab 4 8 | |
| GFXBench (DX / GLBenchmark) 2.7 | |
| T-Rex Onscreen | |
| Apple iPad (2017) | |
| Samsung Galaxy Tab Active 2 | |
| Amazon Fire HD 8 2017 | |
| Huawei Mediapad M3 Lite 8 | |
| Lenovo Tab 4 8 | |
| Samsung Galaxy Tab Active | |
| 1920x1080 T-Rex Offscreen | |
| Apple iPad (2017) | |
| Huawei Mediapad M3 Lite 8 | |
| Samsung Galaxy Tab Active 2 | |
| Amazon Fire HD 8 2017 | |
| Lenovo Tab 4 8 | |
| Samsung Galaxy Tab Active | |
| GFXBench 3.0 | |
| on screen Manhattan Onscreen OGL | |
| Apple iPad (2017) | |
| Samsung Galaxy Tab Active 2 | |
| Huawei Mediapad M3 Lite 8 | |
| Amazon Fire HD 8 2017 | |
| Lenovo Tab 4 8 | |
| Samsung Galaxy Tab Active | |
| 1920x1080 1080p Manhattan Offscreen | |
| Apple iPad (2017) | |
| Huawei Mediapad M3 Lite 8 | |
| Samsung Galaxy Tab Active 2 | |
| Amazon Fire HD 8 2017 | |
| Lenovo Tab 4 8 | |
| Samsung Galaxy Tab Active | |
| GFXBench 3.1 | |
| on screen Manhattan ES 3.1 Onscreen | |
| Apple iPad (2017) | |
| Samsung Galaxy Tab Active 2 | |
| Amazon Fire HD 8 2017 | |
| Huawei Mediapad M3 Lite 8 | |
| 1920x1080 Manhattan ES 3.1 Offscreen | |
| Apple iPad (2017) | |
| Huawei Mediapad M3 Lite 8 | |
| Samsung Galaxy Tab Active 2 | |
| Amazon Fire HD 8 2017 | |
| GFXBench | |
| on screen Car Chase Onscreen | |
| Samsung Galaxy Tab Active 2 | |
| Huawei Mediapad M3 Lite 8 | |
| 1920x1080 Car Chase Offscreen | |
| Huawei Mediapad M3 Lite 8 | |
| Samsung Galaxy Tab Active 2 | |
| Octane V2 - Total Score | |
| Apple iPad (2017) | |
| Samsung Galaxy Tab Active 2 | |
| Huawei Mediapad M3 Lite 8 (Google Chrome 61.0.3163.98) | |
| Lenovo Tab 4 8 (Chrome 61) | |
| Amazon Fire HD 8 2017 (Amazon Silk 58.2.3029.83.10) | |
| Samsung Galaxy Tab Active (Chrome 40) | |
| WebXPRT 2015 - Overall | |
| Apple iPad (2017) | |
| Lenovo Tab 4 8 (Chrome 61) | |
| Huawei Mediapad M3 Lite 8 (Google Chrome 61.0.3163.98) | |
| Samsung Galaxy Tab Active 2 | |
| Amazon Fire HD 8 2017 (Amazon Silk 58.2.3029.83.10) | |
| JetStream 1.1 - Total Score | |
| Apple iPad (2017) | |
| Samsung Galaxy Tab Active 2 | |
| Amazon Fire HD 8 2017 (Amazon Silk 58.2.3029.83.10) | |
| Lenovo Tab 4 8 (Chrome 61) | |
| Huawei Mediapad M3 Lite 8 (Google Chrome 61.0.3163.98) | |
| Mozilla Kraken 1.1 - Total | |
| Samsung Galaxy Tab Active (Chrome 40) | |
| Huawei Mediapad M3 Lite 8 (Google Chrome 61.0.3163.98) | |
| Lenovo Tab 4 8 (Chrome 61) | |
| Amazon Fire HD 8 2017 (Amazon Silk 58.2.3029.83.10) | |
| Samsung Galaxy Tab Active 2 | |
| Apple iPad (2017) | |
* ... mindre är bättre
| Samsung Galaxy Tab Active 2 | Samsung Galaxy Tab Active | Lenovo Tab 4 8 | Huawei Mediapad M3 Lite 8 | Amazon Fire HD 8 2017 | |
|---|---|---|---|---|---|
| AndroBench 3-5 | -21% | 16% | -21% | -22% | |
| Sequential Read 256KB | 218.1 | 151.8 -30% | 265.1 22% | 135.1 -38% | 159.1 -27% |
| Sequential Write 256KB | 54 | 42.81 -21% | 72.3 34% | 38.01 -30% | 47.23 -13% |
| Random Read 4KB | 25.96 | 20.24 -22% | 44 69% | 35 35% | 21.55 -17% |
| Random Write 4KB | 10.98 | 9.76 -11% | 7.1 -35% | 7.64 -30% | 11.51 5% |
| Sequential Read 256KB SDCard | 78.6 | 84.8 8% | 87.7 12% | 51.1 -35% | |
| Sequential Write 256KB SDCard | 64.3 | 61.1 -5% | 14.6 -77% | 34.15 -47% |
(+) Den maximala temperaturen på ovansidan är 35.5 °C / 96 F, jämfört med genomsnittet av 33.7 °C / 93 F , allt från 20.7 till 53.2 °C för klassen Tablet.
(+) Botten värms upp till maximalt 34.4 °C / 94 F, jämfört med genomsnittet av 33.2 °C / 92 F
(+) Vid tomgångsbruk är medeltemperaturen för ovansidan 29.9 °C / 86 F, jämfört med enhetsgenomsnittet på 30 °C / ### class_avg_f### F.
Apple iPad (2017) ljudanalys
(+) | högtalare kan spela relativt högt (86.1 dB)
Bas 100 - 315 Hz
(-) | nästan ingen bas - i genomsnitt 17.5% lägre än medianen
(±) | linjäriteten för basen är genomsnittlig (10.8% delta till föregående frekvens)
Mellan 400 - 2000 Hz
(+) | balanserad mellan - endast 2.8% från medianen
(+) | mids är linjära (5.3% delta till föregående frekvens)
Högsta 2 - 16 kHz
(±) | högre toppar - i genomsnitt 8.5% högre än medianen
(+) | toppar är linjära (3.9% delta till föregående frekvens)
Totalt 100 - 16 000 Hz
(±) | linjäriteten för det totala ljudet är genomsnittlig (19% skillnad mot median)
Jämfört med samma klass
» 47% av alla testade enheter i den här klassen var bättre, 6% liknande, 47% sämre
» Den bästa hade ett delta på 7%, genomsnittet var 21%, sämst var 129%
Jämfört med alla testade enheter
» 42% av alla testade enheter var bättre, 8% liknande, 50% sämre
» Den bästa hade ett delta på 4%, genomsnittet var 24%, sämst var 134%
| Av/Standby | |
| Låg belastning | |
| Hög belastning |
|
Förklaring:
min: | |
| Samsung Galaxy Tab Active 2 4450 mAh | Samsung Galaxy Tab Active mAh | Lenovo Tab 4 8 4850 mAh | Huawei Mediapad M3 Lite 8 4800 mAh | Amazon Fire HD 8 2017 mAh | Apple iPad (2017) 8.827 mAh | |
|---|---|---|---|---|---|---|
| Power Consumption | 23% | -19% | -141% | -0% | -131% | |
| Idle Minimum * | 0.89 | 0.6 33% | 1.1 -24% | 4.02 -352% | 0.99 -11% | 2.06 -131% |
| Idle Average * | 3.13 | 2.2 30% | 3.51 -12% | 6 -92% | 2.74 12% | 7.42 -137% |
| Idle Maximum * | 3.36 | 2.5 26% | 4.14 -23% | 6.64 -98% | 2.83 16% | 7.47 -122% |
| Load Average * | 3.93 | 3.7 6% | 4.86 -24% | 7.34 -87% | 4.51 -15% | 9.45 -140% |
| Load Maximum * | 5.45 | 4.3 21% | 6.13 -12% | 9.6 -76% | 5.69 -4% | 12.31 -126% |
* ... mindre är bättre
| Samsung Galaxy Tab Active 2 4450 mAh | Samsung Galaxy Tab Active mAh | Lenovo Tab 4 8 4850 mAh | Huawei Mediapad M3 Lite 8 4800 mAh | Amazon Fire HD 8 2017 mAh | Apple iPad (2017) 8.827 mAh | |
|---|---|---|---|---|---|---|
| Batteridrifttid | 18% | -17% | 7% | 22% | 6% | |
| Reader / Idle | 1357 | 1640 21% | 1207 -11% | 1382 2% | 2032 50% | 1496 10% |
| H.264 | 493 | 771 56% | 603 22% | 744 51% | 845 71% | |
| WiFi v1.3 | 895 | 452 -49% | 877 -2% | 770 -14% | 764 -15% | |
| Load | 396 | 306 -23% | 276 -30% | 480 21% | 393 -1% | 225 -43% |
| WiFi | 861 |
För
Emot
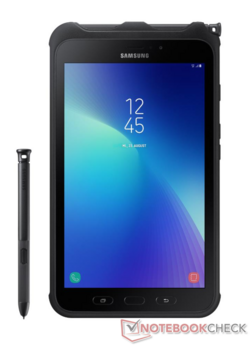
Ingen tvekan: Galaxy Tab Active 2 är en väldigt tålig och mångsidig enhet. Operativsystemet är smidigt och enheten borde med lätthet kunna hantera vardagliga uppgifter. Det interna lagringsutrymmet är dock väldigt begränsat och även om systemet i teorin inte behöver mer lagringsutrymme så kommer ett extra MicroSD-kort snabbt att bli nödvändigt. Den stödjer åtminstone MicroSD-kort med en storlek på upp till 256 GB.
Under dess hårda och tjocka skinn finns en surfplatta från mittenskiktet. Den är full tillräckligt utrustad och presumtiva köpare kommer troligen köpa den oavsett på grund av bristen på konkurrens för tåliga utomhusmodeller.
Huruvida Galaxy Tab Active 2 kommer komma till nytta i en verkstad, ett garage eller på en byggarbetsplats återstår att se. Den är definitivt tuffare och mer robust än majoriteten av sin konkurrens och kan vara en väldigt pålitlig följeslagare på hajk eller i fält. Skärmen kan fortfarande användas med handskar och den inkluderade S-pennan tillåter väldigt exakt och precis tryckkänslig inmatning.
Samsung Galaxy Tab Active 2
- 12/22/2017 v6 (old)
Mike Wobker
Price comparison
