Notebookcheck Logo

Lenovo LOQ 15 recension: FHD-spelbärbar dator med en RTX 4060 från cirka 1 000 US-dollar
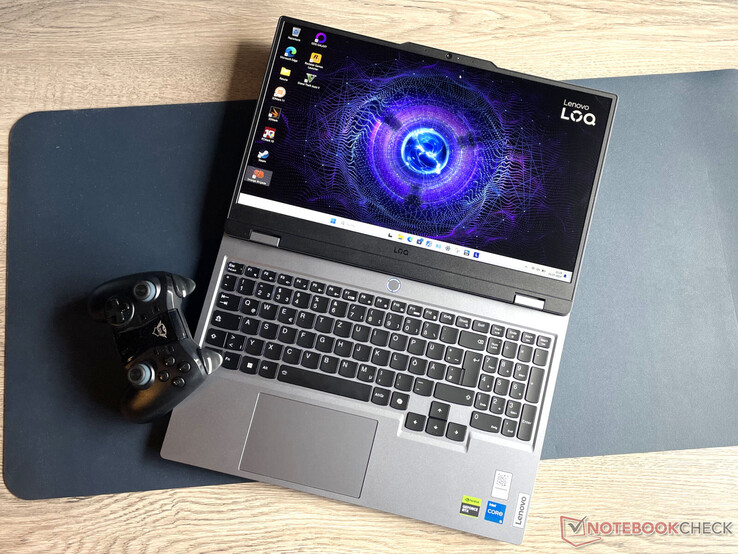
Budgetspelare.

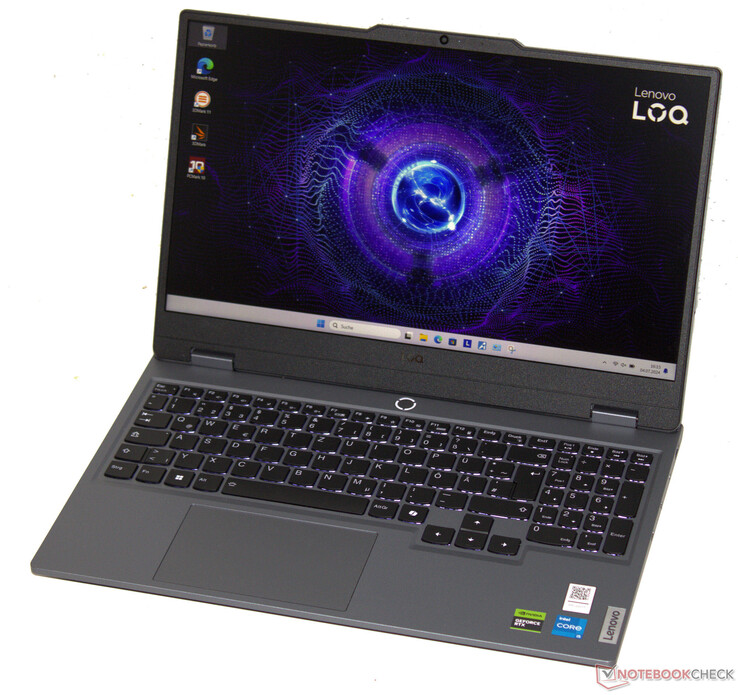
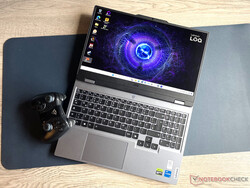
Lenovos bärbara dator på 15,6 tum är gjord för FHD-spel med höga till maximala inställningar. Dess harmoniska hårdvarubas består av en Core i5-13450HX, GeForce RTX 4060, 16 GB RAM och en 1 TB SSD. Priset är rätt: Du kan redan hitta datorn för cirka 1 000 USD - utan Windows.

I Lenovos katalog består LOQ-serien av bärbara speldatorer i budgetklassen. Den aktuella testenheten passar sömlöst in i denna kategori: Tillverkaren begär drygt 1.000 USD (utan Windows) eller 1.300 USD (med Windows 11) för detta paket som består av en Core i5-processor, GeForce RTX 4060, 16 GB RAM och en 1 TB SSD. Den bärbara datorns prislapp tar ut sin rätt: Den har ett plasthölje, relativt låg batterikapacitet och ingen Thunderbolt 4 eller USB 4. Konkurrenter inkluderar enheter som Gigabyte G6X 9KG (2024), Dell G16, XMG Core 15 (M24) eller HP Victus 16 (2024).

Lenovo LOQ 15IRX9:s hölje är inte byggt på samma sätt som hos systermodellerna som vi redan har testat (Ryzen 7/RTX 4050, Core i7/RTX 4050).

Lenovo LOQ 15IRX9 (LOQ 15 Serie)
Processor
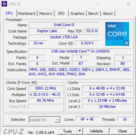
Intel Core i5-13450HX 10 x 1.8 - 4.6 GHz, 119 W PL2 / Short Burst, 60 W PL1 / Sustained, Raptor Lake-HX
Grafikkort
NVIDIA GeForce RTX 4060 Laptop GPU - 8 GB VRAM, Kärna: 1890 MHz, Minne: 2000 MHz, 115 W TDP, GDDR6, 32.0.15.5612, Advanced Optimus
Minne
16 GB 
, DDR5-5600, Dual-Channel-Mode, two memory slots (both in use)
Skärm
15.60 tum 16:9, 1920 x 1080 pixlar 141 PPI, BOE NJ NE156FHM-NX9, IPS, G-Sync, sRGB, glansig: nej, 144 Hz, Adaptive Sync
Moderkort
Intel HM770 (Raptor Lake-S PCH)
Hårddisk
Micron 2400 MTFDKCD1T0QFM, 1024 GB 
, PCIe 4, M.2-2242, 892 GB ledigt
Ljudkort
Realtek ALC3287
Anslutningar
3 USB 3.0, 1 USB 3.1 Gen2, USB-C Power Delivery (PD), 1 HDMI, 1 DisplayPort, Ljudanslutningar: Headset combined port, TPM 2.0
Nätverk
Realtek RTL8168/8111 Gigabit-LAN (10/100/1000MBit/s), Realtek RTL8852BE (b/g/n = Wi-Fi 4/ac = Wi-Fi 5/ax = Wi-Fi 6/), Bluetooth 5.2
Storlek
höjd x bredd x djup (i mm) 23.9 x 359.86 x 258.7
Batteri
60 Wh, 3887 mAh Litiumjon
Charging
fast charging / Quickcharge
Operativsystem
Microsoft Windows 11 Home
Camera
Webbkamera: FHD
Primary Camera: 2.1 MPix
Övrigt
Högtalare: Stereo, Tangentbord: Chiclet, Tangentbordsbelysning: ja, McAfee (Trial), Microsoft 365 (Trial), Microsoft OneNote (Trial), 24 Månader Garanti
Vikt
2.42 kg, Strömförsörjning: 862 g
Pris
1149 Euro
Amazon
Note: The manufacturer may use components from different suppliers including display panels, drives or memory sticks with similar specifications.


Potentiella konkurrenter i jämförelse

Rating
Version
Date
Model
Weight
Height
Size
Resolution
Price
79 %v8
07/2024
Lenovo LOQ 15IRX9
i5-13450HX, NVIDIA GeForce RTX 4060 Laptop GPU
2.4 kg23.9 mm15.60"1920x1080
83.7 %v8
06/2024
SCHENKER XMG Core 15 (M24)
R7 8845HS, NVIDIA GeForce RTX 4060 Laptop GPU
2.1 kg21.9 mm15.30"2560x1600
83.2 %
v7 (old)
v7 (old)
03/2024
Gigabyte G6X 9KG (2024)
i7-13650HX, NVIDIA GeForce RTX 4060 Laptop GPU
2.6 kg25.1 mm16.00"1920x1200
84.3 %
v7 (old)
v7 (old)
05/2024
HP Victus 16 (2024)
i7-14700HX, NVIDIA GeForce RTX 4060 Laptop GPU
2.4 kg23.9 mm16.10"1920x1080
85.5 %
v7 (old)
v7 (old)
02/2024
Dell G16, i7-13650HX, RTX 4060
i7-13650HX, NVIDIA GeForce RTX 4060 Laptop GPU
2.8 kg25.65 mm16.00"2560x1600

Observera: Vi har nyligen uppdaterat vårt betygssystem och resultaten från version 8 är inte jämförbara med resultaten från version 7. Mer information finns tillgänglig här .

Case & connectivity - LOQ utan USB 4 men med Power Delivery

Den bärbara datorns hårdvara är inrymd i ett mattgrått (Luna Gray) plasthölje som i allmänhet ser ganska snyggt ut. Locket och basenheten kan vridas en aning, men det är fortfarande acceptabelt. Dess stabilitet är bra. Locket tillåter en maximal öppningsvinkel på upp till 180 grader. De LED-remsor som är typiska för bärbara speldatorer syns inte till på den här modellen.

Tre USB-A-anslutningar (USB 3.2 Gen 1) samt en USB-C-port (USB 3.2 Gen 2) borde räcka för de flesta användare. Den senare stöder Power Delivery och Display ALT-läget. Totalt har den bärbara datorn två videoutgångar (1x HDMI, 1x DP). Dess webbkamera (2,1 MP, med på/av-omkopplare) levererar genomsnittliga resultat. Lenovo har inte sett en SD-kortläsare som nödvändig.

De WiFi-datahastigheter vi mätte är solida, men de ligger efter vad som är möjligt idag. Lenovo laptopens Realtek WiFi 6-chip (RTL8852BE) kan inte nå samma hastigheter som de Intel-chip som är installerade i många av dess konkurrenter.
Lenovo LOQ 15IRX9
Lenovo LOQ 15IRX9
Lenovo LOQ 15IRX9
Lenovo LOQ 15IRX9
Lenovo LOQ 15IRX9
Lenovo LOQ 15IRX9
Lenovo LOQ 15IRX9
Lenovo LOQ 15IRX9
Lenovo LOQ 15IRX9
Lenovo LOQ 15IRX9
Lenovo LOQ 15IRX9
Lenovo LOQ 15IRX9
Lenovo LOQ 15IRX9
Lenovo LOQ 15IRX9
Lenovo LOQ 15IRX9
Hårdvara Lenovo LOQ 15IRX9

Storleksjämförelse

369 mm 259.4 mm 23.9 mm 2.4 kg361 mm 259 mm 25.1 mm 2.6 kg359.86 mm 258.7 mm 23.9 mm 2.4 kg357 mm 289 mm 25.65 mm 2.8 kg342.5 mm 245 mm 21.9 mm 2.1 kg297 mm 210 mm 1 mm 5.7 g
Höger sida: USB 3.2 Gen 2 (USB-C; Power Delivery, DisplayPort), switch för webbkamera, ljudkombination, USB 3.2 Gen 1 (USB-A)
Baksida: USB 3.2 Gen 1 (USB-A), HDMI, Gigabit Ethernet, USB 3.2 Gen 1 (USB-A), strömanslutning
Networking
iperf3 transmit AXE11000
Dell G16, i7-13650HX, RTX 4060
Intel Wi-Fi 6 AX201
1570 (808min - 1639max) MBit/s +89%
Gigabyte G6X 9KG (2024)
Intel Wi-Fi 6E AX211
1337 (789min - 1521max) MBit/s +61%
Average of class Gaming
  (469 - 1843, n=149, last 2 years)
1233 MBit/s +49%
SCHENKER XMG Core 15 (M24)
Intel Wi-Fi 6E AX210
1208 (557min - 1301max) MBit/s +46%
Lenovo LOQ 15IRX9
Realtek RTL8852BE
830 (747min - 873max) MBit/s
Average Realtek RTL8852BE
  (536 - 925, n=42)
792 MBit/s -5%
HP Victus 16 (2024)
Realtek RTL8852BE
776 (487min - 929max) MBit/s -7%
iperf3 receive AXE11000
Gigabyte G6X 9KG (2024)
Intel Wi-Fi 6E AX211
1683 (1630min - 1706max) MBit/s +73%
Dell G16, i7-13650HX, RTX 4060
Intel Wi-Fi 6 AX201
1585 (1273min - 1662max) MBit/s +63%
SCHENKER XMG Core 15 (M24)
Intel Wi-Fi 6E AX210
1433 (616min - 1532max) MBit/s +47%
Average of class Gaming
  (680 - 1890, n=149, last 2 years)
1394 MBit/s +43%
HP Victus 16 (2024)
Realtek RTL8852BE
978 (960min - 990max) MBit/s 0%
Lenovo LOQ 15IRX9
Realtek RTL8852BE
975 (950min - 986max) MBit/s
Average Realtek RTL8852BE
  (455 - 984, n=43)
847 MBit/s -13%
050100150200250300350400450500550600650700750800850900950100010501100115012001250130013501400145015001550160016501700Tooltip
Lenovo LOQ 15IRX9 Realtek RTL8852BE; iperf3 transmit AXE11000; iperf 3.1.3: Ø830 (747-873)
SCHENKER XMG Core 15 (M24) Intel Wi-Fi 6E AX210; iperf3 transmit AXE11000; iperf 3.1.3: Ø1189 (557-1301)
Gigabyte G6X 9KG (2024) Intel Wi-Fi 6E AX211; iperf3 transmit AXE11000; iperf 3.1.3: Ø1336 (789-1521)
HP Victus 16 (2024) Realtek RTL8852BE; iperf3 transmit AXE11000; iperf 3.1.3: Ø776 (487-929)
Dell G16, i7-13650HX, RTX 4060 Intel Wi-Fi 6 AX201; iperf3 transmit AXE11000; iperf 3.1.3: Ø1543 (808-1639)
Lenovo LOQ 15IRX9 Realtek RTL8852BE; iperf3 receive AXE11000; iperf 3.1.3: Ø974 (950-986)
SCHENKER XMG Core 15 (M24) Intel Wi-Fi 6E AX210; iperf3 receive AXE11000; iperf 3.1.3: Ø1411 (616-1532)
Gigabyte G6X 9KG (2024) Intel Wi-Fi 6E AX211; iperf3 receive AXE11000; iperf 3.1.3: Ø1683 (1630-1706)
HP Victus 16 (2024) Realtek RTL8852BE; iperf3 receive AXE11000; iperf 3.1.3: Ø978 (960-990)
Dell G16, i7-13650HX, RTX 4060 Intel Wi-Fi 6 AX201; iperf3 receive AXE11000; iperf 3.1.3: Ø1585 (1273-1662)
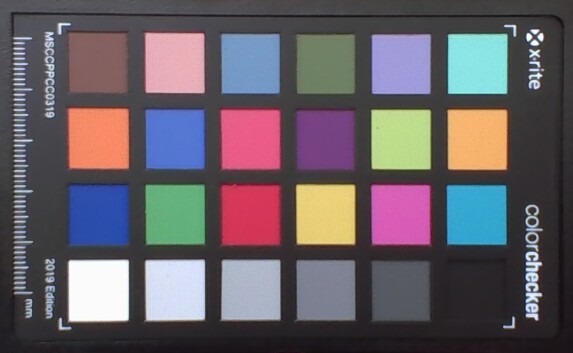
ColorChecker
9.2 ∆E
15.5 ∆E
10.6 ∆E
9.8 ∆E
9.9 ∆E
12.8 ∆E
14.3 ∆E
11.9 ∆E
11.2 ∆E
6.5 ∆E
10.9 ∆E
9.8 ∆E
6.6 ∆E
10.9 ∆E
10.3 ∆E
8.4 ∆E
7.8 ∆E
12.2 ∆E
1.8 ∆E
10.9 ∆E
10.3 ∆E
10.3 ∆E
5 ∆E
6.5 ∆E
ColorChecker Lenovo LOQ 15IRX9: 9.72 ∆E min: 1.76 - max: 15.5 ∆E

Hållbarhet

Den bärbara datorn och nätaggregatet är förpackade i varsin plastpåse, medan LOQ skyddas under transporten av skumplast. Vilka plasttyper som används anges av tillverkaren. Ett pappersomslag skyddar strömförsörjningen från repor. Allt detta är inrymt i en kartong - enligt märkningen kommer det trä som har använts från hållbart skogsbruk.

Det bör vara ganska enkelt att reparera enheten: Bottenplattan kan tas bort utan problem, vilket sedan ger dig tillgång till all hårdvara. Vi hittade inga limmade delar inuti höljet. Eftersom Windows 11 används som operativsystem bör programuppdateringar garanteras under de kommande åren. Lenovos support upphör den 31 december 2029.

Inmatningsenheter - Den bärbara datorn från Lenovo har stora piltangenter

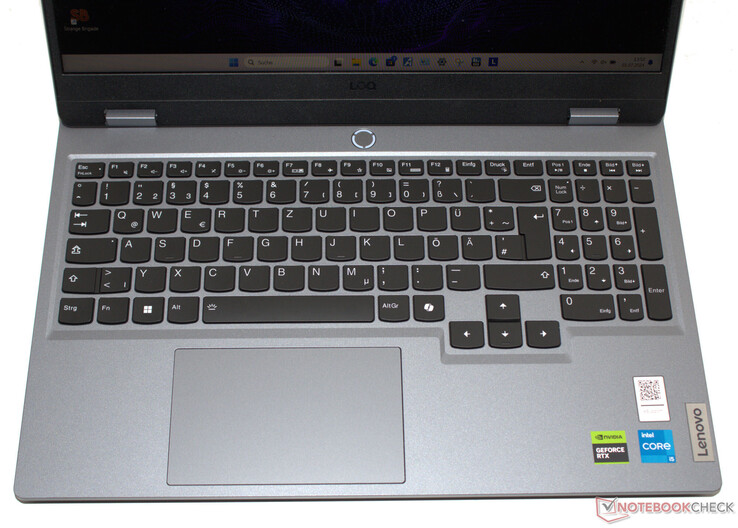
Chiclet-tangentbordet med vit bakgrundsbelysning sträcker sig över hela den bärbara datorns bredd och har dessutom en numerisk knappsats. Tangenternas form och placering motsvarar den välkända Lenovo-layouten. De konkava tangenterna ger ett bra motstånd och en tydlig tryckpunkt. Tangentbordet ger sig något när du skriver, men det är inte ett problem. En positiv sak: De förskjutna piltangenterna i full storlek är bekväma att använda. En multi-touch clickpad (ca 12 x 7,5 cm) med kort lyft och tydlig tryckpunkt fungerar som musersättning.

Tangentbord Lenovo LOQ 15IRX9

Skärm - IPS ombord

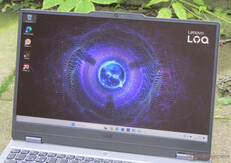
Lenovo har utrustat LOQ med en betraktningsvinkelstabil 144 Hz-panel (FHD, IPS) med ett bildförhållande på 16:9 inklusive G-Sync-stöd. Bra kontraster kompenseras av en något för låg maximal ljusstyrka. I allmänhet är skärmen utformad för inomhusbruk, men den kan också läsas utomhus under lämpliga väderförhållanden. PWM-flimmer upptäcktes inte i vårt test.

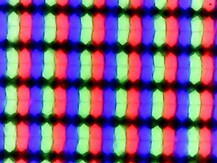
Pixeluppsättning
Pixeluppsättning
Endast en mindre blödning i bakgrundsbelysningen.
Användning utomhus
Användning utomhus
293
cd/m²
291
cd/m²
284
cd/m²
279
cd/m²
306
cd/m²
274
cd/m²
274
cd/m²
310
cd/m²
273
cd/m²
Distribution av ljusstyrkan
BOE NJ NE156FHM-NX9 tested with X-Rite i1Pro 2
Max: 310 cd/m² (Nits) Medel: 287.1 cd/m² Minimum: 1 cd/m²
Distribution av ljusstyrkan: 88 %
Mitt på batteriet: 306 cd/m²
Kontrast: 1457:1 (Svärta: 0.21 cd/m²)
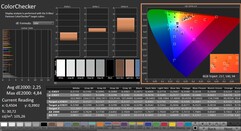
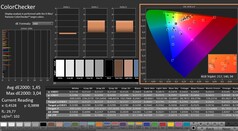
ΔE Color 2.25 | 0.5-29.43 Ø4.91, calibrated: 1.45
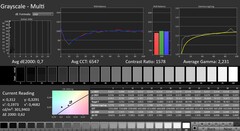
ΔE Greyscale 2.4 | 0.5-98 Ø5.2
72.6% AdobeRGB 1998 (Argyll 2.2.0 3D)
99.1% sRGB (Argyll 2.2.0 3D)
73.7% Display P3 (Argyll 2.2.0 3D)
Gamma: 2.259
Lenovo LOQ 15IRX9
BOE NJ NE156FHM-NX9, IPS, 1920x1080, 15.6"
SCHENKER XMG Core 15 (M24)
BOE NJ NE153QDM-NZ1 (BOE0C8E), IPS, 2560x1600, 15.3"
Gigabyte G6X 9KG (2024)
BOE NE160WUM-NX6, IPS, 1920x1200, 16"
HP Victus 16 (2024)
Chi Mei CMN163E, IPS, 1920x1080, 16.1"
Dell G16, i7-13650HX, RTX 4060
Chi Mei CMN161D (160GME), IPS, 2560x1600, 16"
Display
1%
-40%
-41%
-5%
Display P3 Coverage
73.7
73.2
-1%
41.8
-43%
41.3
-44%
67.5
-8%
sRGB Coverage
99.1
100
1%
62.4
-37%
61.7
-38%
98.5
-1%
AdobeRGB 1998 Coverage
72.6
74.6
3%
43.3
-40%
42.7
-41%
69.3
-5%
Response Times
68%
4%
25%
68%
Response Time Grey 50% / Grey 80% *
42.2 ?(19.1, 23.1)
9.6 ?(4.6, 5)
77%
40.5 ?(19, 21.5)
4%
28.6 ?(13.3, 15.3)
32%
7.6 ?(3.8, 3.8)
82%
Response Time Black / White *
22.6 ?(11.2, 11.4)
9.2 ?(4.6, 4.6)
59%
21.6 ?(11.1, 10.5)
4%
18.7 ?(9.6, 9.1)
17%
10.4 ?(5.8, 4.6)
54%
PWM Frequency
Screen
6%
-68%
-78%
-15%
Brightness middle
306
635
108%
353
15%
287
-6%
369
21%
Brightness
287
604
110%
318
11%
288
0%
344
20%
Brightness Distribution
88
91
3%
81
-8%
86
-2%
89
1%
Black Level *
0.21
0.64
-205%
0.21
-0%
0.19
10%
0.26
-24%
Contrast
1457
992
-32%
1681
15%
1511
4%
1419
-3%
Colorchecker dE 2000 *
2.25
1.89
16%
5.21
-132%
5.46
-143%
3.04
-35%
Colorchecker dE 2000 max. *
4.84
3.14
35%
19.95
-312%
20.36
-321%
5.56
-15%
Colorchecker dE 2000 calibrated *
1.45
1.14
21%
3.61
-149%
3.52
-143%
2.35
-62%
Greyscale dE 2000 *
2.4
2.53
-5%
3.6
-50%
4.8
-100%
3.38
-41%
Gamma
2.259 97%
2.36 93%
2.367 93%
2.108 104%
2.47 89%
CCT
6790 96%
6434 101%
7138 91%
6442 101%
6040 108%
Total Average (Program / Settings)
25% / 14%
-35% / -52%
-31% / -55%
16% / -1%

* ... smaller is better

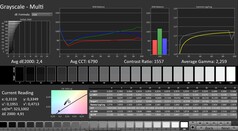
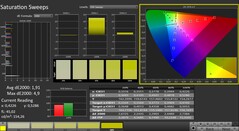
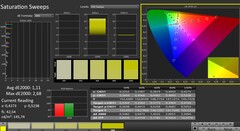
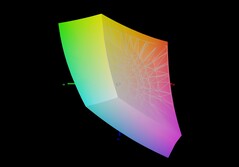
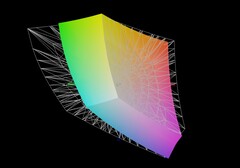
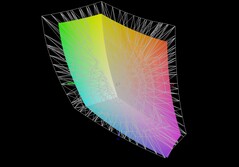
Direkt från förpackningen är displayen väl kalibrerad: Med en avvikelse på ca 2,25 har målvärdet (DeltaE < 3) uppnåtts. Kalibrering av skärmen minskar avvikelserna till 1,45 och ger mer balanserade gråtoner. Panelen kan avbilda sRGB-utrymmet nästan i sin helhet, men inte AdobeRGB- och DCI P3-utrymmena.

CalMAN: Gråskala
CalMAN: Gråskala
CalMAN: Färgmättnad
CalMAN: Färgmättnad
CalMAN: Färgkontroll
CalMAN: Gråskala (kalibrerad)
CalMAN: Färgmättnad (kalibrerad)
CalMAN: ColorChecker (kalibrerad)
Lenovo LOQ 15 jämfört med sRGB
Lenovo LOQ 15 jämfört med AdobeRGB
Lenovo LOQ 15 jämfört med DCI-P3

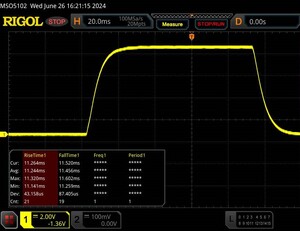
Display Response Times

Display response times show how fast the screen is able to change from one color to the next. Slow response times can lead to afterimages and can cause moving objects to appear blurry (ghosting). Gamers of fast-paced 3D titles should pay special attention to fast response times.
       Response Time Black to White
22.6 ms ... rise ↗ and fall ↘ combined↗ 11.2 ms rise
↘ 11.4 ms fall
The screen shows good response rates in our tests, but may be too slow for competitive gamers.
In comparison, all tested devices range from 0.1 (minimum) to 240 (maximum) ms. » 47 % of all devices are better.
This means that the measured response time is similar to the average of all tested devices (20.9 ms).
       Response Time 50% Grey to 80% Grey
42.2 ms ... rise ↗ and fall ↘ combined↗ 19.1 ms rise
↘ 23.1 ms fall
The screen shows slow response rates in our tests and will be unsatisfactory for gamers.
In comparison, all tested devices range from 0.165 (minimum) to 636 (maximum) ms. » 67 % of all devices are better.
This means that the measured response time is worse than the average of all tested devices (32.8 ms).

Screen Flickering / PWM (Pulse-Width Modulation)

To dim the screen, some notebooks will simply cycle the backlight on and off in rapid succession - a method called Pulse Width Modulation (PWM) . This cycling frequency should ideally be undetectable to the human eye. If said frequency is too low, users with sensitive eyes may experience strain or headaches or even notice the flickering altogether.
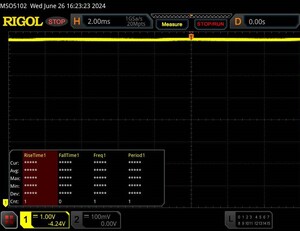
Screen flickering / PWM not detected

In comparison: 53 % of all tested devices do not use PWM to dim the display. If PWM was detected, an average of 8705 (minimum: 5 - maximum: 343500) Hz was measured.

100 % ljusstyrka
100 % ljusstyrka
75 % ljusstyrka
75 % ljusstyrka
50 % ljusstyrka
50 % ljusstyrka
25 % ljusstyrka
25 % ljusstyrka
0 % ljusstyrka
0 % ljusstyrka

Prestanda - Raptor Lake och Ada Lovelace driver den bärbara datorn

LOQ-modellerna är bärbara speldatorer i instegsklassen. Lenovo erbjuder en mängd olika konfigurationer - med AMD APU:er såväl som Intel-processorer. Raptor Lake och Ada Lovelace i form av Core i5-13450HX och GeForce RTX 4060 driver den aktuella testenheten. Den kan köpas för cirka 1 300 USD (med Windows 11) eller drygt 1 000 USD (utan Windows).

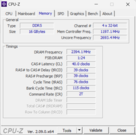
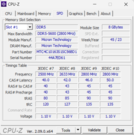
CPU-Z
CPU-Z
CPU-Z
CPU-Z
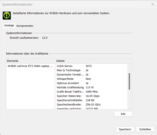
Nvidia systeminformation
GPU-Z
GPU-Z
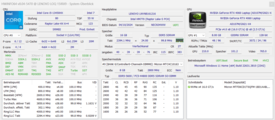
HWInfo
HWInfo
 

Testförhållanden

Den bärbara datorn erbjuder tre tillverkarspecifika prestandalägen (se tabell), som kan växlas mellan med hjälp av tangentkombinationen "Fn" + "Q". Vi använde lägena balanserad (benchmarks) och tyst (batteritest).

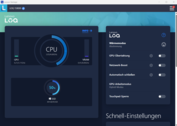
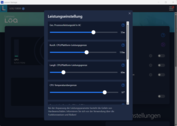
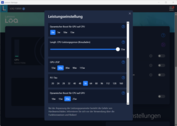
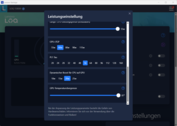
Ett fjärde läge (anpassat) kan väljas via Lenovo Vantage (den bärbara datorns kontrollcenter). Detta gör att prestandainställningarna för processorn (Power Limit) eller GPU (TGP, Dynamic Boost, temperaturgräns) och fläkthastigheten kan ställas in individuellt. Det är också möjligt att överklocka GPU och grafikminne oberoende av profilen.

Prestanda-läge Balanserat läge Tyst läge
Effektgräns 1 (HWInfo) 90 watt 60 watt 55 watt
Effektgräns 2 (HWInfo) 162 watt 119 watt 65 watt
Buller (CP 2077 Phantom Liberty) 54 dB(A) 48 dB(A) 39 dB(A)
Prestanda (CP 2077 Phantom Liberty) 70 fps 66 fps 52 fps
Lenovo Vantage
Lenovo Vantage
Lenovo Vantage
Lenovo Vantage
Lenovo Vantage
Lenovo Vantage
Lenovo Vantage
Lenovo Vantage

Processor

Core i5 Core i5-13450HXs (Raptor Lake) 10 CPU-kärnor (6P + 4E = 16 trådar) uppnår maximala klockfrekvenser på 4,6 GHz (P) och 3,4 GHz (E). Kontinuerlig belastning med flera trådar (CB15 Loop) resulterade i att klockfrekvensen sjönk från den första till den fjärde körningen (balanserat läge). Efteråt förblev den stabil. Prestanda-läget håller klockfrekvensen på en permanent hög nivå.

Benchmarkresultaten var precis som vi förväntade oss (balanserat läge), och prestandaläget resulterade i en (mycket liten) fördel. Inom jämförelsefältet gjorde Core i5 sämst ifrån sig eftersom den har minst antal beräkningskärnor. CPU:n är ett passande val för en budgetspelare.

Multi-thread (ansluten till elnätet)
Enkel tråd (ansluten till elnätet)

Cinebench R15 Multi continuous test

019539058578097511701365156017551950214523402535273029253120331535103705Tooltip
Lenovo LOQ 15IRX9 Intel Core i5-13450HX: Ø2170 (2104.93-2503.76)
SCHENKER XMG Core 15 (M24) AMD Ryzen 7 8845HS: Ø2849 (2832.66-2908.03)
Gigabyte G6X 9KG (2024) Intel Core i7-13650HX: Ø2018 (1801.23-2863.69)
HP Victus 16 (2024) Intel Core i7-14700HX: Ø2658 (2509.88-3812.18)
Dell G16, i7-13650HX, RTX 4060 Intel Core i7-13650HX: Ø2933 (2802.3-3015.45)
Lenovo LOQ 15IRX9 Intel Core i5-13450HX; Leistungsmodus: Ø2491 (2449.93-2512.09)
CB15 Loop (balanserat läge)
CB15 Loop (prestanda-läge)
CB15 Loop (tyst läge)
CPU Performance Rating - Percent
Average of class Gaming
 
82.1 pt
HP Victus 16 (2024)
Intel Core i7-14700HX
78.9 pt
SCHENKER XMG Core 15 (M24)
AMD Ryzen 7 8845HS
77 pt
Dell G16, i7-13650HX, RTX 4060
Intel Core i7-13650HX
77 pt
Gigabyte G6X 9KG (2024)
Intel Core i7-13650HX
73.9 pt
Lenovo LOQ 15IRX9
Intel Core i5-13450HX
69.4 pt
Average Intel Core i5-13450HX
 
66.3 pt
Lenovo LOQ 15IRX9
Intel Core i5-13450HX
65.3 pt
Cinebench R23
Multi Core
HP Victus 16 (2024)
Intel Core i7-14700HX
23887 Points +42%
Average of class Gaming
  (5668 - 36249, n=189, last 2 years)
21842 Points +30%
Dell G16, i7-13650HX, RTX 4060
Intel Core i7-13650HX
20557 Points +22%
Gigabyte G6X 9KG (2024)
Intel Core i7-13650HX
18879 Points +12%
SCHENKER XMG Core 15 (M24)
AMD Ryzen 7 8845HS
18037 Points +7%
Lenovo LOQ 15IRX9
Intel Core i5-13450HX (Leistungsmodus)
17234 Points +3%
Average Intel Core i5-13450HX
  (16575 - 17234, n=3)
16869 Points 0%
Lenovo LOQ 15IRX9
Intel Core i5-13450HX
16797 Points
Single Core
Average of class Gaming
  (1136 - 2235, n=187, last 2 years)
1888 Points +10%
Dell G16, i7-13650HX, RTX 4060
Intel Core i7-13650HX
1881 Points +10%
Gigabyte G6X 9KG (2024)
Intel Core i7-13650HX
1813 Points +6%
SCHENKER XMG Core 15 (M24)
AMD Ryzen 7 8845HS
1775 Points +4%
Lenovo LOQ 15IRX9
Intel Core i5-13450HX (Leistungsmodus)
1746 Points +2%
Average Intel Core i5-13450HX
  (1710 - 1766, n=3)
1741 Points +2%
Lenovo LOQ 15IRX9
Intel Core i5-13450HX
1710 Points
HP Victus 16 (2024)
Intel Core i7-14700HX
1702 Points 0%
Cinebench R20
CPU (Multi Core)
HP Victus 16 (2024)
Intel Core i7-14700HX
9244 Points +42%
Average of class Gaming
  (2179 - 13832, n=187, last 2 years)
8311 Points +27%
Dell G16, i7-13650HX, RTX 4060
Intel Core i7-13650HX
7821 Points +20%
Gigabyte G6X 9KG (2024)
Intel Core i7-13650HX
7197 Points +10%
SCHENKER XMG Core 15 (M24)
AMD Ryzen 7 8845HS
7026 Points +8%
Lenovo LOQ 15IRX9
Intel Core i5-13450HX (Leistungsmodus)
6595 Points +1%
Average Intel Core i5-13450HX
  (6489 - 6595, n=3)
6539 Points 0%
Lenovo LOQ 15IRX9
Intel Core i5-13450HX
6532 Points
CPU (Single Core)
Average of class Gaming
  (439 - 856, n=187, last 2 years)
726 Points +11%
Dell G16, i7-13650HX, RTX 4060
Intel Core i7-13650HX
721 Points +11%
Gigabyte G6X 9KG (2024)
Intel Core i7-13650HX
700 Points +7%
SCHENKER XMG Core 15 (M24)
AMD Ryzen 7 8845HS
690 Points +6%
Lenovo LOQ 15IRX9
Intel Core i5-13450HX (Leistungsmodus)
667 Points +2%
Average Intel Core i5-13450HX
  (652 - 680, n=3)
666 Points +2%
Lenovo LOQ 15IRX9
Intel Core i5-13450HX
652 Points
HP Victus 16 (2024)
Intel Core i7-14700HX
651 Points 0%
Cinebench R15
CPU Multi 64Bit
HP Victus 16 (2024)
Intel Core i7-14700HX
3812 Points +52%
Average of class Gaming
  (905 - 5663, n=194, last 2 years)
3421 Points +37%
Dell G16, i7-13650HX, RTX 4060
Intel Core i7-13650HX
3015 (2802.3min - 3015.45max) Points +20%
SCHENKER XMG Core 15 (M24)
AMD Ryzen 7 8845HS
2908 (2832.66min - 2908.03max) Points +16%
Gigabyte G6X 9KG (2024)
Intel Core i7-13650HX
2864 Points +14%
Lenovo LOQ 15IRX9
Intel Core i5-13450HX (Leistungsmodus)
2505 Points 0%
Lenovo LOQ 15IRX9
Intel Core i5-13450HX
2503 Points
Average Intel Core i5-13450HX
  (2427 - 2505, n=3)
2478 Points -1%
CPU Single 64Bit
SCHENKER XMG Core 15 (M24)
AMD Ryzen 7 8845HS
280 Points +17%
Average of class Gaming
  (191.9 - 318, n=191, last 2 years)
278 Points +16%
Dell G16, i7-13650HX, RTX 4060
Intel Core i7-13650HX
269 Points +13%
Gigabyte G6X 9KG (2024)
Intel Core i7-13650HX
256 Points +7%
Lenovo LOQ 15IRX9
Intel Core i5-13450HX (Leistungsmodus)
248 Points +4%
Average Intel Core i5-13450HX
  (239 - 251, n=3)
246 Points +3%
Lenovo LOQ 15IRX9
Intel Core i5-13450HX
239 Points
HP Victus 16 (2024)
Intel Core i7-14700HX
238 Points 0%
Blender - v2.79 BMW27 CPU
Lenovo LOQ 15IRX9
Intel Core i5-13450HX
229 Seconds *
Gigabyte G6X 9KG (2024)
Intel Core i7-13650HX
226 Seconds * +1%
Average Intel Core i5-13450HX
  (196 - 229, n=3)
208 Seconds * +9%
Lenovo LOQ 15IRX9
Intel Core i5-13450HX (Leistungsmodus)
200 Seconds * +13%
SCHENKER XMG Core 15 (M24)
AMD Ryzen 7 8845HS
179 Seconds * +22%
HP Victus 16 (2024)
Intel Core i7-14700HX
173 Seconds * +24%
Average of class Gaming
  (87 - 555, n=182, last 2 years)
170.3 Seconds * +26%
Dell G16, i7-13650HX, RTX 4060
Intel Core i7-13650HX
165 Seconds * +28%
7-Zip 18.03
7z b 4
Average of class Gaming
  (23795 - 140932, n=186, last 2 years)
85304 MIPS +45%
HP Victus 16 (2024)
Intel Core i7-14700HX
84799 MIPS +44%
Dell G16, i7-13650HX, RTX 4060
Intel Core i7-13650HX
76328 MIPS +29%
SCHENKER XMG Core 15 (M24)
AMD Ryzen 7 8845HS
74664 MIPS +26%
Gigabyte G6X 9KG (2024)
Intel Core i7-13650HX
73927 MIPS +25%
Lenovo LOQ 15IRX9
Intel Core i5-13450HX (Leistungsmodus)
62204 MIPS +5%
Average Intel Core i5-13450HX
  (59026 - 62204, n=3)
61014 MIPS +3%
Lenovo LOQ 15IRX9
Intel Core i5-13450HX
59026 MIPS
7z b 4 -mmt1
SCHENKER XMG Core 15 (M24)
AMD Ryzen 7 8845HS
6571 MIPS +22%
Average of class Gaming
  (4199 - 7581, n=186, last 2 years)
6311 MIPS +18%
Dell G16, i7-13650HX, RTX 4060
Intel Core i7-13650HX
5944 MIPS +11%
Gigabyte G6X 9KG (2024)
Intel Core i7-13650HX
5828 MIPS +9%
HP Victus 16 (2024)
Intel Core i7-14700HX
5641 MIPS +5%
Lenovo LOQ 15IRX9
Intel Core i5-13450HX (Leistungsmodus)
5576 MIPS +4%
Average Intel Core i5-13450HX
  (5370 - 5576, n=3)
5506 MIPS +3%
Lenovo LOQ 15IRX9
Intel Core i5-13450HX
5370 MIPS
Geekbench 6.3
Multi-Core
HP Victus 16 (2024)
Intel Core i7-14700HX (6.2.1)
14807 Points +17%
Average of class Gaming
  (5340 - 19665, n=111, last 2 years)
14175 Points +12%
SCHENKER XMG Core 15 (M24)
AMD Ryzen 7 8845HS (6.2.1)
14014 Points +10%
Dell G16, i7-13650HX, RTX 4060
Intel Core i7-13650HX (6.2.1)
13711 Points +8%
Gigabyte G6X 9KG (2024)
Intel Core i7-13650HX (6.2.1)
13554 Points +7%
Lenovo LOQ 15IRX9
Intel Core i5-13450HX (6.2.1, Leistungsmodus)
12799 Points +1%
Average Intel Core i5-13450HX
  (12619 - 12799, n=3)
12701 Points 0%
Lenovo LOQ 15IRX9
Intel Core i5-13450HX (6.2.1)
12684 Points
Single-Core
SCHENKER XMG Core 15 (M24)
AMD Ryzen 7 8845HS (6.2.1)
2686 Points +13%
Average of class Gaming
  (1490 - 3129, n=111, last 2 years)
2648 Points +11%
Dell G16, i7-13650HX, RTX 4060
Intel Core i7-13650HX (6.2.1)
2562 Points +8%
Gigabyte G6X 9KG (2024)
Intel Core i7-13650HX (6.2.1)
2505 Points +5%
Lenovo LOQ 15IRX9
Intel Core i5-13450HX (6.2.1, Leistungsmodus)
2417 Points +2%
Average Intel Core i5-13450HX
  (2381 - 2448, n=3)
2415 Points +1%
Lenovo LOQ 15IRX9
Intel Core i5-13450HX (6.2.1)
2381 Points
HP Victus 16 (2024)
Intel Core i7-14700HX (6.2.1)
2378 Points 0%
Geekbench 5.5
Multi-Core
HP Victus 16 (2024)
Intel Core i7-14700HX
16732 Points +39%
Average of class Gaming
  (4557 - 23194, n=187, last 2 years)
15010 Points +25%
Gigabyte G6X 9KG (2024)
Intel Core i7-13650HX
13434 Points +12%
SCHENKER XMG Core 15 (M24)
AMD Ryzen 7 8845HS
12726 Points +6%
Dell G16, i7-13650HX, RTX 4060
Intel Core i7-13650HX
12509 Points +4%
Lenovo LOQ 15IRX9
Intel Core i5-13450HX
12005 Points
Average Intel Core i5-13450HX
  (11973 - 12022, n=3)
12000 Points 0%
Lenovo LOQ 15IRX9
Intel Core i5-13450HX (Leistungsmodus)
11973 Points 0%
Single-Core
SCHENKER XMG Core 15 (M24)
AMD Ryzen 7 8845HS
1971 Points +16%
Average of class Gaming
  (986 - 2210, n=187, last 2 years)
1894 Points +12%
Dell G16, i7-13650HX, RTX 4060
Intel Core i7-13650HX
1866 Points +10%
Gigabyte G6X 9KG (2024)
Intel Core i7-13650HX
1810 Points +7%
Lenovo LOQ 15IRX9
Intel Core i5-13450HX (Leistungsmodus)
1757 Points +4%
Average Intel Core i5-13450HX
  (1696 - 1763, n=3)
1739 Points +3%
HP Victus 16 (2024)
Intel Core i7-14700HX
1700 Points 0%
Lenovo LOQ 15IRX9
Intel Core i5-13450HX
1696 Points
HWBOT x265 Benchmark v2.2 - 4k Preset
Average of class Gaming
  (6.72 - 38.9, n=186, last 2 years)
23.5 fps +34%
SCHENKER XMG Core 15 (M24)
AMD Ryzen 7 8845HS
22.7 fps +30%
HP Victus 16 (2024)
Intel Core i7-14700HX
22 fps +26%
Lenovo LOQ 15IRX9
Intel Core i5-13450HX (Leistungsmodus)
20.5 fps +17%
Dell G16, i7-13650HX, RTX 4060
Intel Core i7-13650HX
20.1 fps +15%
Gigabyte G6X 9KG (2024)
Intel Core i7-13650HX
18.9 fps +8%
Average Intel Core i5-13450HX
  (16.9 - 20.5, n=3)
18.3 fps +5%
Lenovo LOQ 15IRX9
Intel Core i5-13450HX
17.5 fps
LibreOffice - 20 Documents To PDF
Average Intel Core i5-13450HX
  (49.5 - 96.6, n=3)
68.5 s * -16%
Lenovo LOQ 15IRX9
Intel Core i5-13450HX (6.3.4.2)
59.3 s *
HP Victus 16 (2024)
Intel Core i7-14700HX (6.3.4.2)
55.3 s * +7%
Dell G16, i7-13650HX, RTX 4060
Intel Core i7-13650HX (6.3.4.2)
53.4 s * +10%
Lenovo LOQ 15IRX9
Intel Core i5-13450HX (6.3.4.2, Leistungsmodus)
49.5 s * +17%
SCHENKER XMG Core 15 (M24)
AMD Ryzen 7 8845HS (6.3.4.2)
49.2 s * +17%
Average of class Gaming
  (31.4 - 96.6, n=183, last 2 years)
47.4 s * +20%
Gigabyte G6X 9KG (2024)
Intel Core i7-13650HX (6.3.4.2)
38.9 s * +34%
R Benchmark 2.5 - Overall mean
HP Victus 16 (2024)
Intel Core i7-14700HX
0.4896 sec * -1%
Lenovo LOQ 15IRX9
Intel Core i5-13450HX
0.4838 sec *
Average Intel Core i5-13450HX
  (0.4582 - 0.4838, n=3)
0.4687 sec * +3%
Lenovo LOQ 15IRX9
Intel Core i5-13450HX (Leistungsmodus)
0.464 sec * +4%
Gigabyte G6X 9KG (2024)
Intel Core i7-13650HX
0.4407 sec * +9%
SCHENKER XMG Core 15 (M24)
AMD Ryzen 7 8845HS
0.4383 sec * +9%
Average of class Gaming
  (0.3609 - 0.759, n=187, last 2 years)
0.4374 sec * +10%
Dell G16, i7-13650HX, RTX 4060
Intel Core i7-13650HX
0.4217 sec * +13%
Dell G16, i7-13650HX, RTX 4060
Intel Core i7-13650HX
0.4217 sec * +13%

* ... smaller is better

Cinebench R15 CPU Multi 64Bit
2503 Points
Cinebench R15 OpenGL 64Bit
178.6 fps
Cinebench R15 Ref. Match 64Bit
99.6 %
Cinebench R15 CPU Single 64Bit
239 Points
Cinebench R20 CPU (Single Core)
652 Points
Cinebench R20 CPU (Multi Core)
6532 Points
Cinebench R23 Multi Core
16797 Points
Cinebench R23 Single Core
1710 Points
Cinebench 2024 CPU Multi Core
812 Points
Cinebench 2024 CPU Single Core
101.5 Points
Hjälp
Performance Rating
SCHENKER XMG Core 15 (M24)
AMD Ryzen 7 8845HS, NVIDIA GeForce RTX 4060 Laptop GPU
93.8 pt
Average of class Gaming
 
87.9 pt
Dell G16, i7-13650HX, RTX 4060
Intel Core i7-13650HX, NVIDIA GeForce RTX 4060 Laptop GPU
76.2 pt
HP Victus 16 (2024)
Intel Core i7-14700HX, NVIDIA GeForce RTX 4060 Laptop GPU
75.4 pt
Lenovo LOQ 15IRX9
Intel Core i5-13450HX, NVIDIA GeForce RTX 4060 Laptop GPU
66.9 pt
Average Intel Core i5-13450HX
 
65.2 pt
Gigabyte G6X 9KG (2024)
Intel Core i7-13650HX, NVIDIA GeForce RTX 4060 Laptop GPU
63 pt
Lenovo LOQ 15IRX9
Intel Core i5-13450HX, NVIDIA GeForce RTX 4060 Laptop GPU
62.3 pt
AIDA64 / FP32 Ray-Trace
SCHENKER XMG Core 15 (M24)
AMD Ryzen 7 8845HS, NVIDIA GeForce RTX 4060 Laptop GPU (v6.92.6600)
29544 KRay/s +115%
Average of class Gaming
  (4986 - 60169, n=183, last 2 years)
21864 KRay/s +59%
Dell G16, i7-13650HX, RTX 4060
Intel Core i7-13650HX, NVIDIA GeForce RTX 4060 Laptop GPU (v6.92.6600)
18836 KRay/s +37%
Lenovo LOQ 15IRX9
Intel Core i5-13450HX, NVIDIA GeForce RTX 4060 Laptop GPU (v6.92.6600, Leistungsmodus)
17767 KRay/s +29%
HP Victus 16 (2024)
Intel Core i7-14700HX, NVIDIA GeForce RTX 4060 Laptop GPU (v6.92.6600)
16932 KRay/s +23%
Average Intel Core i5-13450HX
  (13747 - 17767, n=3)
16263 KRay/s +18%
Lenovo LOQ 15IRX9
Intel Core i5-13450HX, NVIDIA GeForce RTX 4060 Laptop GPU (v6.92.6600)
13747 KRay/s
Gigabyte G6X 9KG (2024)
Intel Core i7-13650HX, NVIDIA GeForce RTX 4060 Laptop GPU (v6.92.6600)
13404 KRay/s -2%
AIDA64 / FPU Julia
SCHENKER XMG Core 15 (M24)
AMD Ryzen 7 8845HS, NVIDIA GeForce RTX 4060 Laptop GPU (v6.92.6600)
125873 Points +75%
Average of class Gaming
  (25360 - 252486, n=183, last 2 years)
106582 Points +48%
Dell G16, i7-13650HX, RTX 4060
Intel Core i7-13650HX, NVIDIA GeForce RTX 4060 Laptop GPU (v6.92.6600)
93053 Points +30%
HP Victus 16 (2024)
Intel Core i7-14700HX, NVIDIA GeForce RTX 4060 Laptop GPU (v6.92.6600)
86338 Points +20%
Lenovo LOQ 15IRX9
Intel Core i5-13450HX, NVIDIA GeForce RTX 4060 Laptop GPU (v6.92.6600, Leistungsmodus)
83862 Points +17%
Average Intel Core i5-13450HX
  (71834 - 83862, n=3)
79819 Points +11%
Lenovo LOQ 15IRX9
Intel Core i5-13450HX, NVIDIA GeForce RTX 4060 Laptop GPU (v6.92.6600)
71834 Points
Gigabyte G6X 9KG (2024)
Intel Core i7-13650HX, NVIDIA GeForce RTX 4060 Laptop GPU (v6.92.6600)
68241 Points -5%
AIDA64 / CPU SHA3
SCHENKER XMG Core 15 (M24)
AMD Ryzen 7 8845HS, NVIDIA GeForce RTX 4060 Laptop GPU (v6.92.6600)
5180 MB/s +47%
Average of class Gaming
  (1339 - 10389, n=183, last 2 years)
4896 MB/s +39%
Dell G16, i7-13650HX, RTX 4060
Intel Core i7-13650HX, NVIDIA GeForce RTX 4060 Laptop GPU (v6.92.6600)
4256 MB/s +21%
HP Victus 16 (2024)
Intel Core i7-14700HX, NVIDIA GeForce RTX 4060 Laptop GPU (v6.92.6600)
4008 MB/s +14%
Lenovo LOQ 15IRX9
Intel Core i5-13450HX, NVIDIA GeForce RTX 4060 Laptop GPU (v6.92.6600)
3530 MB/s
Lenovo LOQ 15IRX9
Intel Core i5-13450HX, NVIDIA GeForce RTX 4060 Laptop GPU (v6.92.6600, Leistungsmodus)
3530 MB/s 0%
Average Intel Core i5-13450HX
  (3519 - 3530, n=3)
3526 MB/s 0%
Gigabyte G6X 9KG (2024)
Intel Core i7-13650HX, NVIDIA GeForce RTX 4060 Laptop GPU (v6.92.6600)
3127 MB/s -11%
AIDA64 / CPU Queen
HP Victus 16 (2024)
Intel Core i7-14700HX, NVIDIA GeForce RTX 4060 Laptop GPU (v6.92.6600)
129836 Points +51%
SCHENKER XMG Core 15 (M24)
AMD Ryzen 7 8845HS, NVIDIA GeForce RTX 4060 Laptop GPU (v6.92.6600)
124695 Points +45%
Average of class Gaming
  (50699 - 200651, n=183, last 2 years)
116926 Points +36%
Gigabyte G6X 9KG (2024)
Intel Core i7-13650HX, NVIDIA GeForce RTX 4060 Laptop GPU (v6.92.6600)
110589 Points +28%
Dell G16, i7-13650HX, RTX 4060
Intel Core i7-13650HX, NVIDIA GeForce RTX 4060 Laptop GPU (v6.92.6600)
108955 Points +26%
Lenovo LOQ 15IRX9
Intel Core i5-13450HX, NVIDIA GeForce RTX 4060 Laptop GPU (v6.92.6600)
86148 Points
Average Intel Core i5-13450HX
  (85888 - 86148, n=3)
86016 Points 0%
Lenovo LOQ 15IRX9
Intel Core i5-13450HX, NVIDIA GeForce RTX 4060 Laptop GPU (v6.92.6600, Leistungsmodus)
86012 Points 0%
AIDA64 / FPU SinJulia
SCHENKER XMG Core 15 (M24)
AMD Ryzen 7 8845HS, NVIDIA GeForce RTX 4060 Laptop GPU (v6.92.6600)
15519 Points +66%
Average of class Gaming
  (4800 - 32988, n=183, last 2 years)
13244 Points +42%
HP Victus 16 (2024)
Intel Core i7-14700HX, NVIDIA GeForce RTX 4060 Laptop GPU (v6.92.6600)
11704 Points +25%
Dell G16, i7-13650HX, RTX 4060
Intel Core i7-13650HX, NVIDIA GeForce RTX 4060 Laptop GPU (v6.92.6600)
10802 Points +16%
Lenovo LOQ 15IRX9
Intel Core i5-13450HX, NVIDIA GeForce RTX 4060 Laptop GPU (v6.92.6600, Leistungsmodus)
9354 Points 0%
Lenovo LOQ 15IRX9
Intel Core i5-13450HX, NVIDIA GeForce RTX 4060 Laptop GPU (v6.92.6600)
9344 Points
Average Intel Core i5-13450HX
  (9325 - 9354, n=3)
9341 Points 0%
Gigabyte G6X 9KG (2024)
Intel Core i7-13650HX, NVIDIA GeForce RTX 4060 Laptop GPU (v6.92.6600)
9134 Points -2%
AIDA64 / FPU Mandel
SCHENKER XMG Core 15 (M24)
AMD Ryzen 7 8845HS, NVIDIA GeForce RTX 4060 Laptop GPU (v6.92.6600)
67367 Points +93%
Average of class Gaming
  (12321 - 134044, n=183, last 2 years)
53651 Points +53%
Dell G16, i7-13650HX, RTX 4060
Intel Core i7-13650HX, NVIDIA GeForce RTX 4060 Laptop GPU (v6.92.6600)
45501 Points +30%
Lenovo LOQ 15IRX9
Intel Core i5-13450HX, NVIDIA GeForce RTX 4060 Laptop GPU (v6.92.6600, Leistungsmodus)
42825 Points +23%
HP Victus 16 (2024)
Intel Core i7-14700HX, NVIDIA GeForce RTX 4060 Laptop GPU (v6.92.6600)
42125 Points +21%
Average Intel Core i5-13450HX
  (34956 - 42825, n=3)
39757 Points +14%
Lenovo LOQ 15IRX9
Intel Core i5-13450HX, NVIDIA GeForce RTX 4060 Laptop GPU (v6.92.6600)
34956 Points
Gigabyte G6X 9KG (2024)
Intel Core i7-13650HX, NVIDIA GeForce RTX 4060 Laptop GPU (v6.92.6600)
33391 Points -4%
AIDA64 / CPU AES
Average of class Gaming
  (19065 - 328679, n=183, last 2 years)
109303 MB/s +55%
SCHENKER XMG Core 15 (M24)
AMD Ryzen 7 8845HS, NVIDIA GeForce RTX 4060 Laptop GPU (v6.92.6600)
92092 MB/s +31%
Dell G16, i7-13650HX, RTX 4060
Intel Core i7-13650HX, NVIDIA GeForce RTX 4060 Laptop GPU (v6.92.6600)
85224 MB/s +21%
HP Victus 16 (2024)
Intel Core i7-14700HX, NVIDIA GeForce RTX 4060 Laptop GPU (v6.92.6600)
82161 MB/s +17%
Average Intel Core i5-13450HX
  (70296 - 70680, n=3)
70435 MB/s 0%
Lenovo LOQ 15IRX9
Intel Core i5-13450HX, NVIDIA GeForce RTX 4060 Laptop GPU (v6.92.6600)
70330 MB/s
Lenovo LOQ 15IRX9
Intel Core i5-13450HX, NVIDIA GeForce RTX 4060 Laptop GPU (v6.92.6600, Leistungsmodus)
70296 MB/s 0%
Gigabyte G6X 9KG (2024)
Intel Core i7-13650HX, NVIDIA GeForce RTX 4060 Laptop GPU (v6.92.6600)
64436 MB/s -8%
AIDA64 / CPU ZLib
Average of class Gaming
  (373 - 2409, n=183, last 2 years)
1361 MB/s +36%
Dell G16, i7-13650HX, RTX 4060
Intel Core i7-13650HX, NVIDIA GeForce RTX 4060 Laptop GPU (v6.92.6600)
1237 MB/s +23%
HP Victus 16 (2024)
Intel Core i7-14700HX, NVIDIA GeForce RTX 4060 Laptop GPU (v6.92.6600)
1177 MB/s +17%
Gigabyte G6X 9KG (2024)
Intel Core i7-13650HX, NVIDIA GeForce RTX 4060 Laptop GPU (v6.92.6600)
1136 MB/s +13%
Lenovo LOQ 15IRX9
Intel Core i5-13450HX, NVIDIA GeForce RTX 4060 Laptop GPU (v6.92.6600)
1002 MB/s
Average Intel Core i5-13450HX
  (977 - 1002, n=3)
991 MB/s -1%
Lenovo LOQ 15IRX9
Intel Core i5-13450HX, NVIDIA GeForce RTX 4060 Laptop GPU (v6.92.6600, Leistungsmodus)
977 MB/s -2%
SCHENKER XMG Core 15 (M24)
AMD Ryzen 7 8845HS, NVIDIA GeForce RTX 4060 Laptop GPU (v6.92.6600)
788 MB/s -21%
AIDA64 / FP64 Ray-Trace
SCHENKER XMG Core 15 (M24)
AMD Ryzen 7 8845HS, NVIDIA GeForce RTX 4060 Laptop GPU (v6.92.6600)
15911 KRay/s +114%
Average of class Gaming
  (2540 - 31796, n=183, last 2 years)
11775 KRay/s +59%
Dell G16, i7-13650HX, RTX 4060
Intel Core i7-13650HX, NVIDIA GeForce RTX 4060 Laptop GPU (v6.92.6600)
10344 KRay/s +39%
Lenovo LOQ 15IRX9
Intel Core i5-13450HX, NVIDIA GeForce RTX 4060 Laptop GPU (v6.92.6600, Leistungsmodus)
9561 KRay/s +29%
HP Victus 16 (2024)
Intel Core i7-14700HX, NVIDIA GeForce RTX 4060 Laptop GPU (v6.92.6600)
9029 KRay/s +22%
Average Intel Core i5-13450HX
  (7428 - 9561, n=3)
8807 KRay/s +19%
Lenovo LOQ 15IRX9
Intel Core i5-13450HX, NVIDIA GeForce RTX 4060 Laptop GPU (v6.92.6600)
7428 KRay/s
Gigabyte G6X 9KG (2024)
Intel Core i7-13650HX, NVIDIA GeForce RTX 4060 Laptop GPU (v6.92.6600)
7270 KRay/s -2%
AIDA64 / CPU PhotoWorxx
SCHENKER XMG Core 15 (M24)
AMD Ryzen 7 8845HS, NVIDIA GeForce RTX 4060 Laptop GPU (v6.92.6600)
41668 MPixel/s +13%
Average of class Gaming
  (10805 - 60161, n=184, last 2 years)
40126 MPixel/s +9%
HP Victus 16 (2024)
Intel Core i7-14700HX, NVIDIA GeForce RTX 4060 Laptop GPU (v6.92.6600)
39448 MPixel/s +7%
Gigabyte G6X 9KG (2024)
Intel Core i7-13650HX, NVIDIA GeForce RTX 4060 Laptop GPU (v6.92.6600)
36796 MPixel/s 0%
Lenovo LOQ 15IRX9
Intel Core i5-13450HX, NVIDIA GeForce RTX 4060 Laptop GPU (v6.92.6600)
36764 MPixel/s
Lenovo LOQ 15IRX9
Intel Core i5-13450HX, NVIDIA GeForce RTX 4060 Laptop GPU (v6.92.6600, Leistungsmodus)
36610 MPixel/s 0%
Average Intel Core i5-13450HX
  (36014 - 36764, n=3)
36463 MPixel/s -1%
Dell G16, i7-13650HX, RTX 4060
Intel Core i7-13650HX, NVIDIA GeForce RTX 4060 Laptop GPU (v6.92.6600)
36170 MPixel/s -2%

Systemets prestanda

Det välfungerande systemet saknar inte prestanda: datorn hanterar spel, rendering och streaming utan problem. RAM-minnets överföringshastigheter är som förväntat för DDR5-5600 RAM.

RAM-minnet körs i dual-channel-läge.
PCMark 10 / Score
SCHENKER XMG Core 15 (M24)
NVIDIA GeForce RTX 4060 Laptop GPU, R7 8845HS, Samsung 990 Pro 1 TB
8822 Points +27%
Average of class Gaming
  (5776 - 9852, n=165, last 2 years)
7799 Points +13%
Gigabyte G6X 9KG (2024)
NVIDIA GeForce RTX 4060 Laptop GPU, i7-13650HX, Gigabyte AG450E1024-SI
7613 Points +10%
HP Victus 16 (2024)
NVIDIA GeForce RTX 4060 Laptop GPU, i7-14700HX, Kioxia XG8 KXG80ZNV512G
7528 Points +9%
Dell G16, i7-13650HX, RTX 4060
NVIDIA GeForce RTX 4060 Laptop GPU, i7-13650HX, WD PC SN740 SDDPNQD-1T00
7449 Points +8%
Lenovo LOQ 15IRX9
NVIDIA GeForce RTX 4060 Laptop GPU, i5-13450HX, Micron 2400 MTFDKCD1T0QFM
6929 Points
Average Intel Core i5-13450HX, NVIDIA GeForce RTX 4060 Laptop GPU
  ()
6929 Points 0%
PCMark 10 / Essentials
Average of class Gaming
  (9057 - 12334, n=164, last 2 years)
10832 Points +15%
HP Victus 16 (2024)
NVIDIA GeForce RTX 4060 Laptop GPU, i7-14700HX, Kioxia XG8 KXG80ZNV512G
10778 Points +15%
Gigabyte G6X 9KG (2024)
NVIDIA GeForce RTX 4060 Laptop GPU, i7-13650HX, Gigabyte AG450E1024-SI
10333 Points +10%
SCHENKER XMG Core 15 (M24)
NVIDIA GeForce RTX 4060 Laptop GPU, R7 8845HS, Samsung 990 Pro 1 TB
10061 Points +7%
Dell G16, i7-13650HX, RTX 4060
NVIDIA GeForce RTX 4060 Laptop GPU, i7-13650HX, WD PC SN740 SDDPNQD-1T00
9532 Points +2%
Lenovo LOQ 15IRX9
NVIDIA GeForce RTX 4060 Laptop GPU, i5-13450HX, Micron 2400 MTFDKCD1T0QFM
9379 Points
Average Intel Core i5-13450HX, NVIDIA GeForce RTX 4060 Laptop GPU
  ()
9379 Points 0%
PCMark 10 / Productivity
SCHENKER XMG Core 15 (M24)
NVIDIA GeForce RTX 4060 Laptop GPU, R7 8845HS, Samsung 990 Pro 1 TB
14612 Points +66%
Gigabyte G6X 9KG (2024)
NVIDIA GeForce RTX 4060 Laptop GPU, i7-13650HX, Gigabyte AG450E1024-SI
10204 Points +16%
Dell G16, i7-13650HX, RTX 4060
NVIDIA GeForce RTX 4060 Laptop GPU, i7-13650HX, WD PC SN740 SDDPNQD-1T00
10070 Points +14%
HP Victus 16 (2024)
NVIDIA GeForce RTX 4060 Laptop GPU, i7-14700HX, Kioxia XG8 KXG80ZNV512G
9910 Points +13%
Average of class Gaming
  (6662 - 14612, n=164, last 2 years)
9904 Points +13%
Lenovo LOQ 15IRX9
NVIDIA GeForce RTX 4060 Laptop GPU, i5-13450HX, Micron 2400 MTFDKCD1T0QFM
8800 Points
Average Intel Core i5-13450HX, NVIDIA GeForce RTX 4060 Laptop GPU
  ()
8800 Points 0%
PCMark 10 / Digital Content Creation
SCHENKER XMG Core 15 (M24)
NVIDIA GeForce RTX 4060 Laptop GPU, R7 8845HS, Samsung 990 Pro 1 TB
12674 Points +16%
Average of class Gaming
  (6703 - 18475, n=164, last 2 years)
12117 Points +11%
Dell G16, i7-13650HX, RTX 4060
NVIDIA GeForce RTX 4060 Laptop GPU, i7-13650HX, WD PC SN740 SDDPNQD-1T00
11686 Points +7%
Gigabyte G6X 9KG (2024)
NVIDIA GeForce RTX 4060 Laptop GPU, i7-13650HX, Gigabyte AG450E1024-SI
11359 Points +4%
Lenovo LOQ 15IRX9
NVIDIA GeForce RTX 4060 Laptop GPU, i5-13450HX, Micron 2400 MTFDKCD1T0QFM
10937 Points
Average Intel Core i5-13450HX, NVIDIA GeForce RTX 4060 Laptop GPU
  ()
10937 Points 0%
HP Victus 16 (2024)
NVIDIA GeForce RTX 4060 Laptop GPU, i7-14700HX, Kioxia XG8 KXG80ZNV512G
10841 Points -1%
CrossMark / Overall
Gigabyte G6X 9KG (2024)
NVIDIA GeForce RTX 4060 Laptop GPU, i7-13650HX, Gigabyte AG450E1024-SI
1951 Points +8%
HP Victus 16 (2024)
NVIDIA GeForce RTX 4060 Laptop GPU, i7-14700HX, Kioxia XG8 KXG80ZNV512G
1923 Points +7%
Average of class Gaming
  (1247 - 2344, n=146, last 2 years)
1908 Points +6%
SCHENKER XMG Core 15 (M24)
NVIDIA GeForce RTX 4060 Laptop GPU, R7 8845HS, Samsung 990 Pro 1 TB
1889 Points +5%
Dell G16, i7-13650HX, RTX 4060
NVIDIA GeForce RTX 4060 Laptop GPU, i7-13650HX, WD PC SN740 SDDPNQD-1T00
1842 Points +2%
Lenovo LOQ 15IRX9
NVIDIA GeForce RTX 4060 Laptop GPU, i5-13450HX, Micron 2400 MTFDKCD1T0QFM
1804 Points
Average Intel Core i5-13450HX, NVIDIA GeForce RTX 4060 Laptop GPU
  ()
1804 Points 0%
CrossMark / Productivity
Gigabyte G6X 9KG (2024)
NVIDIA GeForce RTX 4060 Laptop GPU, i7-13650HX, Gigabyte AG450E1024-SI
1864 Points +8%
Average of class Gaming
  (1299 - 2204, n=146, last 2 years)
1808 Points +5%
SCHENKER XMG Core 15 (M24)
NVIDIA GeForce RTX 4060 Laptop GPU, R7 8845HS, Samsung 990 Pro 1 TB
1789 Points +4%
HP Victus 16 (2024)
NVIDIA GeForce RTX 4060 Laptop GPU, i7-14700HX, Kioxia XG8 KXG80ZNV512G
1782 Points +3%
Dell G16, i7-13650HX, RTX 4060
NVIDIA GeForce RTX 4060 Laptop GPU, i7-13650HX, WD PC SN740 SDDPNQD-1T00
1730 Points 0%
Lenovo LOQ 15IRX9
NVIDIA GeForce RTX 4060 Laptop GPU, i5-13450HX, Micron 2400 MTFDKCD1T0QFM
1728 Points
Average Intel Core i5-13450HX, NVIDIA GeForce RTX 4060 Laptop GPU
  ()
1728 Points 0%
CrossMark / Creativity
HP Victus 16 (2024)
NVIDIA GeForce RTX 4060 Laptop GPU, i7-14700HX, Kioxia XG8 KXG80ZNV512G
2107 Points +11%
SCHENKER XMG Core 15 (M24)
NVIDIA GeForce RTX 4060 Laptop GPU, R7 8845HS, Samsung 990 Pro 1 TB
2102 Points +10%
Average of class Gaming
  (1275 - 2660, n=146, last 2 years)
2095 Points +10%
Gigabyte G6X 9KG (2024)
NVIDIA GeForce RTX 4060 Laptop GPU, i7-13650HX, Gigabyte AG450E1024-SI
2057 Points +8%
Dell G16, i7-13650HX, RTX 4060
NVIDIA GeForce RTX 4060 Laptop GPU, i7-13650HX, WD PC SN740 SDDPNQD-1T00
2020 Points +6%
Lenovo LOQ 15IRX9
NVIDIA GeForce RTX 4060 Laptop GPU, i5-13450HX, Micron 2400 MTFDKCD1T0QFM
1904 Points
Average Intel Core i5-13450HX, NVIDIA GeForce RTX 4060 Laptop GPU
  ()
1904 Points 0%
CrossMark / Responsiveness
Gigabyte G6X 9KG (2024)
NVIDIA GeForce RTX 4060 Laptop GPU, i7-13650HX, Gigabyte AG450E1024-SI
1907 Points +9%
HP Victus 16 (2024)
NVIDIA GeForce RTX 4060 Laptop GPU, i7-14700HX, Kioxia XG8 KXG80ZNV512G
1835 Points +5%
Lenovo LOQ 15IRX9
NVIDIA GeForce RTX 4060 Laptop GPU, i5-13450HX, Micron 2400 MTFDKCD1T0QFM
1748 Points
Average Intel Core i5-13450HX, NVIDIA GeForce RTX 4060 Laptop GPU
  ()
1748 Points 0%
Average of class Gaming
  (1030 - 2330, n=146, last 2 years)
1708 Points -2%
Dell G16, i7-13650HX, RTX 4060
NVIDIA GeForce RTX 4060 Laptop GPU, i7-13650HX, WD PC SN740 SDDPNQD-1T00
1686 Points -4%
SCHENKER XMG Core 15 (M24)
NVIDIA GeForce RTX 4060 Laptop GPU, R7 8845HS, Samsung 990 Pro 1 TB
1613 Points -8%
WebXPRT 3 / Overall
SCHENKER XMG Core 15 (M24)
NVIDIA GeForce RTX 4060 Laptop GPU, R7 8845HS, Samsung 990 Pro 1 TB (Chrome 82)
305 Points +16%
Average of class Gaming
  (215 - 480, n=161, last 2 years)
304 Points +16%
Gigabyte G6X 9KG (2024)
NVIDIA GeForce RTX 4060 Laptop GPU, i7-13650HX, Gigabyte AG450E1024-SI (Chrome 82)
302 Points +15%
HP Victus 16 (2024)
NVIDIA GeForce RTX 4060 Laptop GPU, i7-14700HX, Kioxia XG8 KXG80ZNV512G (Chrome 82)
276 Points +5%
Dell G16, i7-13650HX, RTX 4060
NVIDIA GeForce RTX 4060 Laptop GPU, i7-13650HX, WD PC SN740 SDDPNQD-1T00 (Chrome 82)
268 Points +2%
Lenovo LOQ 15IRX9
NVIDIA GeForce RTX 4060 Laptop GPU, i5-13450HX, Micron 2400 MTFDKCD1T0QFM (Chrome 82)
262 Points
Average Intel Core i5-13450HX, NVIDIA GeForce RTX 4060 Laptop GPU
  ()
262 Points 0%
WebXPRT 4 / Overall
Average of class Gaming
  (176.4 - 328, n=149, last 2 years)
267 Points +10%
SCHENKER XMG Core 15 (M24)
NVIDIA GeForce RTX 4060 Laptop GPU, R7 8845HS, Samsung 990 Pro 1 TB (Chrome 105.0.0.0)
264 Points +9%
Gigabyte G6X 9KG (2024)
NVIDIA GeForce RTX 4060 Laptop GPU, i7-13650HX, Gigabyte AG450E1024-SI (Chrome 105.0.0.0)
260 Points +7%
HP Victus 16 (2024)
NVIDIA GeForce RTX 4060 Laptop GPU, i7-14700HX, Kioxia XG8 KXG80ZNV512G (Chrome 105.0.0.0)
251 Points +3%
Lenovo LOQ 15IRX9
NVIDIA GeForce RTX 4060 Laptop GPU, i5-13450HX, Micron 2400 MTFDKCD1T0QFM (Chrome 105.0.0.0)
243 Points
Average Intel Core i5-13450HX, NVIDIA GeForce RTX 4060 Laptop GPU
  ()
243 Points 0%
Mozilla Kraken 1.1 / Total
Lenovo LOQ 15IRX9
NVIDIA GeForce RTX 4060 Laptop GPU, i5-13450HX, Micron 2400 MTFDKCD1T0QFM (Chrome 82)
550 ms *
Average Intel Core i5-13450HX, NVIDIA GeForce RTX 4060 Laptop GPU
  ()
550 ms * -0%
HP Victus 16 (2024)
NVIDIA GeForce RTX 4060 Laptop GPU, i7-14700HX, Kioxia XG8 KXG80ZNV512G (Chrome 82)
542 ms * +1%
Gigabyte G6X 9KG (2024)
NVIDIA GeForce RTX 4060 Laptop GPU, i7-13650HX, Gigabyte AG450E1024-SI (Chrome 82)
511 ms * +7%
Dell G16, i7-13650HX, RTX 4060
NVIDIA GeForce RTX 4060 Laptop GPU, i7-13650HX, WD PC SN740 SDDPNQD-1T00 (Chrome 82)
507 ms * +8%
Average of class Gaming
  (421 - 674, n=176, last 2 years)
503 ms * +9%
SCHENKER XMG Core 15 (M24)
NVIDIA GeForce RTX 4060 Laptop GPU, R7 8845HS, Samsung 990 Pro 1 TB (Chrome 82)
496 ms * +10%

* ... smaller is better

PCMark 10 Score
6929 poäng
Hjälp
AIDA64 / Memory Copy
SCHENKER XMG Core 15 (M24)
AMD Ryzen 7 8845HS, NVIDIA GeForce RTX 4060 Laptop GPU (v6.92.6600)
69523 MB/s +18%
HP Victus 16 (2024)
Intel Core i7-14700HX, NVIDIA GeForce RTX 4060 Laptop GPU (v6.92.6600)
66599 MB/s +14%
Average of class Gaming
  (21842 - 94222, n=183, last 2 years)
65265 MB/s +11%
Gigabyte G6X 9KG (2024)
Intel Core i7-13650HX, NVIDIA GeForce RTX 4060 Laptop GPU (v6.92.6600)
59896 MB/s +2%
Dell G16, i7-13650HX, RTX 4060
Intel Core i7-13650HX, NVIDIA GeForce RTX 4060 Laptop GPU (v6.92.6600)
59266 MB/s +1%
Average Intel Core i5-13450HX
  (58673 - 58861, n=3)
58779 MB/s 0%
Lenovo LOQ 15IRX9
Intel Core i5-13450HX, NVIDIA GeForce RTX 4060 Laptop GPU (v6.92.6600)
58673 MB/s
AIDA64 / Memory Read
HP Victus 16 (2024)
Intel Core i7-14700HX, NVIDIA GeForce RTX 4060 Laptop GPU (v6.92.6600)
81049 MB/s +19%
Average of class Gaming
  (23681 - 99713, n=183, last 2 years)
69175 MB/s +2%
Gigabyte G6X 9KG (2024)
Intel Core i7-13650HX, NVIDIA GeForce RTX 4060 Laptop GPU (v6.92.6600)
68612 MB/s +1%
Lenovo LOQ 15IRX9
Intel Core i5-13450HX, NVIDIA GeForce RTX 4060 Laptop GPU (v6.92.6600)
68109 MB/s
Average Intel Core i5-13450HX
  (66626 - 69024, n=3)
67920 MB/s 0%
Dell G16, i7-13650HX, RTX 4060
Intel Core i7-13650HX, NVIDIA GeForce RTX 4060 Laptop GPU (v6.92.6600)
67305 MB/s -1%
SCHENKER XMG Core 15 (M24)
AMD Ryzen 7 8845HS, NVIDIA GeForce RTX 4060 Laptop GPU (v6.92.6600)
61095 MB/s -10%
AIDA64 / Memory Write
SCHENKER XMG Core 15 (M24)
AMD Ryzen 7 8845HS, NVIDIA GeForce RTX 4060 Laptop GPU (v6.92.6600)
87466 MB/s +46%
Average of class Gaming
  (22986 - 108954, n=183, last 2 years)
67077 MB/s +12%
HP Victus 16 (2024)
Intel Core i7-14700HX, NVIDIA GeForce RTX 4060 Laptop GPU (v6.92.6600)
65204 MB/s +9%
Gigabyte G6X 9KG (2024)
Intel Core i7-13650HX, NVIDIA GeForce RTX 4060 Laptop GPU (v6.92.6600)
60298 MB/s +1%
Lenovo LOQ 15IRX9
Intel Core i5-13450HX, NVIDIA GeForce RTX 4060 Laptop GPU (v6.92.6600)
59981 MB/s
Average Intel Core i5-13450HX
  (58540 - 60196, n=3)
59572 MB/s -1%
Dell G16, i7-13650HX, RTX 4060
Intel Core i7-13650HX, NVIDIA GeForce RTX 4060 Laptop GPU (v6.92.6600)
58028 MB/s -3%
AIDA64 / Memory Latency
HP Victus 16 (2024)
Intel Core i7-14700HX, NVIDIA GeForce RTX 4060 Laptop GPU (v6.92.6600)
96.4 ns * -2%
Lenovo LOQ 15IRX9
Intel Core i5-13450HX, NVIDIA GeForce RTX 4060 Laptop GPU (v6.92.6600)
94.2 ns *
Average of class Gaming
  (59.5 - 259, n=183, last 2 years)
93.7 ns * +1%
Average Intel Core i5-13450HX
  (90 - 94.2, n=3)
92.1 ns * +2%
Dell G16, i7-13650HX, RTX 4060
Intel Core i7-13650HX, NVIDIA GeForce RTX 4060 Laptop GPU (v6.92.6600)
90.8 ns * +4%
Gigabyte G6X 9KG (2024)
Intel Core i7-13650HX, NVIDIA GeForce RTX 4060 Laptop GPU (v6.92.6600)
90.4 ns * +4%
SCHENKER XMG Core 15 (M24)
AMD Ryzen 7 8845HS, NVIDIA GeForce RTX 4060 Laptop GPU (v6.92.6600)
85.6 ns * +9%

* ... smaller is better

DPC-latenstider

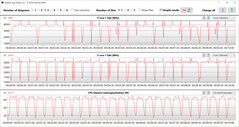
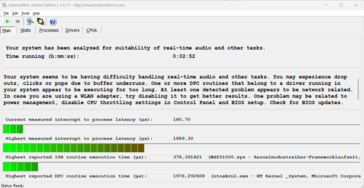
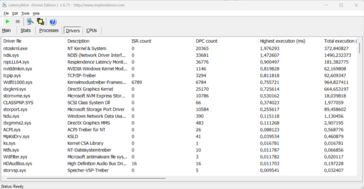
Det standardiserade latensprovet (webbsurfing, 4k-videouppspelning, Prime95 hög belastning) avslöjade vissa avvikelser. Systemet verkar inte vara lämpligt för video- och ljudredigering i realtid. Framtida programuppdateringar kan leda till förbättringar eller till och med försämringar.

Latency Monitor
Latency Monitor
Latency Monitor
Latency Monitor
DPC Latencies / LatencyMon - interrupt to process latency (max), Web, Youtube, Prime95
Gigabyte G6X 9KG (2024)
NVIDIA GeForce RTX 4060 Laptop GPU, i7-13650HX, Gigabyte AG450E1024-SI
2316.1 μs * -37%
Lenovo LOQ 15IRX9
NVIDIA GeForce RTX 4060 Laptop GPU, i5-13450HX, Micron 2400 MTFDKCD1T0QFM
1689.3 μs *
SCHENKER XMG Core 15 (M24)
NVIDIA GeForce RTX 4060 Laptop GPU, R7 8845HS, Samsung 990 Pro 1 TB
1051.8 μs * +38%
Dell G16, i7-13650HX, RTX 4060
NVIDIA GeForce RTX 4060 Laptop GPU, i7-13650HX, WD PC SN740 SDDPNQD-1T00
996.5 μs * +41%
HP Victus 16 (2024)
NVIDIA GeForce RTX 4060 Laptop GPU, i7-14700HX, Kioxia XG8 KXG80ZNV512G
853.9 μs * +49%

* ... smaller is better

Lagringsenheter

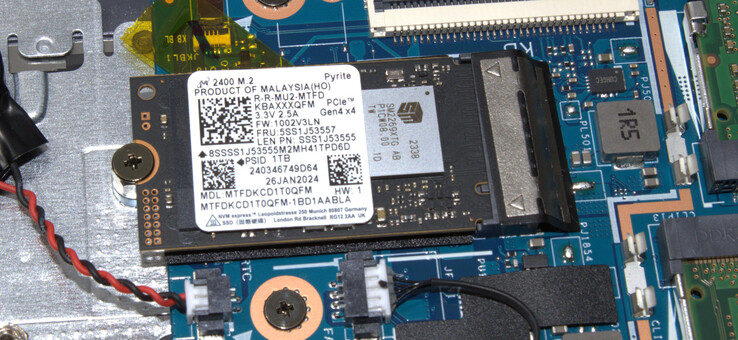
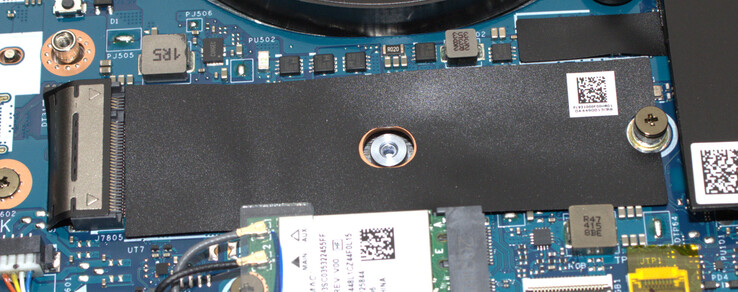
LOQ har plats för totalt två PCIe 4 SSD-enheter (M.2 2280 eller M.2 2242). Micron SSD (1 TB, M.2 2242) i vår testenhet levererar bra datahastigheter, men den kan inte klassas som en av de bästa SSD-modellerna. Under den senare delen av DiskSpd-loopen noterade vi en del termiskt inducerad strypning.

En PCIe 4 SSD fungerar som systemenhet.
Det finns plats för en andra SSD.
Micron 2400 MTFDKCD1T0QFM
CDM 5/6 Read Seq Q32T1: 4426 MB/s
CDM 5/6 Write Seq Q32T1: 3403 MB/s
CDM 5/6 Read 4K Q32T1: 606.9 MB/s
CDM 5/6 Write 4K Q32T1: 392.4 MB/s
CDM 5 Read Seq: 2160 MB/s
CDM 5 Write Seq: 3148 MB/s
CDM 5/6 Read 4K: 69.83 MB/s
CDM 5/6 Write 4K: 262.4 MB/s
Drive Performance Rating - Percent
Gigabyte G6X 9KG (2024)
Gigabyte AG450E1024-SI
86.4 pt
HP Victus 16 (2024)
Kioxia XG8 KXG80ZNV512G
80.1 pt
Average of class Gaming
 
78.4 pt
SCHENKER XMG Core 15 (M24)
Samsung 990 Pro 1 TB
77.8 pt
Dell G16, i7-13650HX, RTX 4060
WD PC SN740 SDDPNQD-1T00
76.7 pt
Lenovo LOQ 15IRX9
Micron 2400 MTFDKCD1T0QFM
68.1 pt
Average Micron 2400 MTFDKCD1T0QFM
 
68.1 pt
DiskSpd
seq read
Dell G16, i7-13650HX, RTX 4060
WD PC SN740 SDDPNQD-1T00
3748 (1761.44min - 3748.03max) MB/s +59%
Average of class Gaming
  (1319 - 7045, n=164, last 2 years)
3475 MB/s +47%
HP Victus 16 (2024)
Kioxia XG8 KXG80ZNV512G
3469 (3344.35min - 3469.11max) MB/s +47%
SCHENKER XMG Core 15 (M24)
Samsung 990 Pro 1 TB
3390 (3342.47min - 3389.7max) MB/s +43%
Gigabyte G6X 9KG (2024)
Gigabyte AG450E1024-SI
2366 (2263.79min - 2365.89max) MB/s 0%
Lenovo LOQ 15IRX9
Micron 2400 MTFDKCD1T0QFM
2364 (2348.18min - 2364.12max) MB/s
Average Micron 2400 MTFDKCD1T0QFM
  ()
2364 MB/s 0%
seq write
Gigabyte G6X 9KG (2024)
Gigabyte AG450E1024-SI
4659 (4410.1min - 4659.12max) MB/s +50%
Dell G16, i7-13650HX, RTX 4060
WD PC SN740 SDDPNQD-1T00
4403 (1750.56min - 4402.76max) MB/s +42%
SCHENKER XMG Core 15 (M24)
Samsung 990 Pro 1 TB
4209 (4104.55min - 4209.16max) MB/s +36%
HP Victus 16 (2024)
Kioxia XG8 KXG80ZNV512G
3895 (3747.67min - 3894.8max) MB/s +26%
Average of class Gaming
  (535 - 9307, n=164, last 2 years)
3805 MB/s +23%
Lenovo LOQ 15IRX9
Micron 2400 MTFDKCD1T0QFM
3103 (3061.84min - 3102.82max) MB/s
Average Micron 2400 MTFDKCD1T0QFM
  ()
3103 MB/s 0%
seq q8 t1 read
SCHENKER XMG Core 15 (M24)
Samsung 990 Pro 1 TB
7058 (5789.19min - 7057.97max) MB/s +53%
HP Victus 16 (2024)
Kioxia XG8 KXG80ZNV512G
6933 (6552.34min - 6933.16max) MB/s +50%
Average of class Gaming
  (2594 - 16089, n=164, last 2 years)
6322 MB/s +37%
Dell G16, i7-13650HX, RTX 4060
WD PC SN740 SDDPNQD-1T00
5226 (4792.98min - 5226.07max) MB/s +13%
Gigabyte G6X 9KG (2024)
Gigabyte AG450E1024-SI
5152 (4288.44min - 5152.1max) MB/s +12%
Lenovo LOQ 15IRX9
Micron 2400 MTFDKCD1T0QFM
4611 (4173.71min - 4610.79max) MB/s
Average Micron 2400 MTFDKCD1T0QFM
  ()
4611 MB/s 0%
seq q8 t1 write
SCHENKER XMG Core 15 (M24)
Samsung 990 Pro 1 TB
6898 (6891.45min - 6898.33max) MB/s +91%
Average of class Gaming
  (539 - 14571, n=164, last 2 years)
4850 MB/s +34%
Gigabyte G6X 9KG (2024)
Gigabyte AG450E1024-SI
4775 (4754.8min - 4775.22max) MB/s +32%
Dell G16, i7-13650HX, RTX 4060
WD PC SN740 SDDPNQD-1T00
4536 (3842.06min - 4535.88max) MB/s +26%
HP Victus 16 (2024)
Kioxia XG8 KXG80ZNV512G
4392 (3922.93min - 4391.65max) MB/s +22%
Lenovo LOQ 15IRX9
Micron 2400 MTFDKCD1T0QFM
3612 (3558.24min - 3612.04max) MB/s
Average Micron 2400 MTFDKCD1T0QFM
  ()
3612 MB/s 0%
4k q1 t1 read
SCHENKER XMG Core 15 (M24)
Samsung 990 Pro 1 TB
78.5 (76.33min - 78.49max) MB/s +44%
Average of class Gaming
  (30.6 - 95.9, n=164, last 2 years)
66 MB/s +21%
Dell G16, i7-13650HX, RTX 4060
WD PC SN740 SDDPNQD-1T00
62.1 (58.49min - 62.08max) MB/s +14%
Gigabyte G6X 9KG (2024)
Gigabyte AG450E1024-SI
56.2 (54.05min - 56.2max) MB/s +3%
Lenovo LOQ 15IRX9
Micron 2400 MTFDKCD1T0QFM
54.4 (52.28min - 54.35max) MB/s
Average Micron 2400 MTFDKCD1T0QFM
  ()
54.4 MB/s 0%
HP Victus 16 (2024)
Kioxia XG8 KXG80ZNV512G
46.2 (45.32min - 46.24max) MB/s -15%
4k q1 t1 write
Gigabyte G6X 9KG (2024)
Gigabyte AG450E1024-SI
298 (287.37min - 297.91max) MB/s +12%
Lenovo LOQ 15IRX9
Micron 2400 MTFDKCD1T0QFM
266 (259.13min - 265.64max) MB/s
Average Micron 2400 MTFDKCD1T0QFM
  ()
266 MB/s 0%
HP Victus 16 (2024)
Kioxia XG8 KXG80ZNV512G
251 (249.24min - 250.87max) MB/s -6%
Dell G16, i7-13650HX, RTX 4060
WD PC SN740 SDDPNQD-1T00
246 (245.02min - 245.66max) MB/s -8%
Average of class Gaming
  (78 - 397, n=164, last 2 years)
224 MB/s -16%
SCHENKER XMG Core 15 (M24)
Samsung 990 Pro 1 TB
159.2 (158.4min - 159.24max) MB/s -40%
4k q32 t16 read
HP Victus 16 (2024)
Kioxia XG8 KXG80ZNV512G
3330 (3310.23min - 3329.64max) MB/s +17%
Gigabyte G6X 9KG (2024)
Gigabyte AG450E1024-SI
3293 (2898.17min - 3292.73max) MB/s +15%
Lenovo LOQ 15IRX9
Micron 2400 MTFDKCD1T0QFM
2852 (1702.21min - 2851.88max) MB/s
Average Micron 2400 MTFDKCD1T0QFM
  ()
2852 MB/s 0%
Dell G16, i7-13650HX, RTX 4060
WD PC SN740 SDDPNQD-1T00
2620 (1053.51min - 2619.8max) MB/s -8%
Average of class Gaming
  (417 - 6172, n=164, last 2 years)
2568 MB/s -10%
SCHENKER XMG Core 15 (M24)
Samsung 990 Pro 1 TB
1192 (1160.39min - 1192.45max) MB/s -58%
4k q32 t16 write
Gigabyte G6X 9KG (2024)
Gigabyte AG450E1024-SI
3074 (2966.78min - 3074.2max) MB/s +21%
Dell G16, i7-13650HX, RTX 4060
WD PC SN740 SDDPNQD-1T00
2918 (2441.74min - 2917.63max) MB/s +15%
Lenovo LOQ 15IRX9
Micron 2400 MTFDKCD1T0QFM
2535 (2457.97min - 2535.38max) MB/s
Average Micron 2400 MTFDKCD1T0QFM
  ()
2535 MB/s 0%
HP Victus 16 (2024)
Kioxia XG8 KXG80ZNV512G
2405 (937.07min - 2405.2max) MB/s -5%
Average of class Gaming
  (162.3 - 4869, n=164, last 2 years)
2133 MB/s -16%
SCHENKER XMG Core 15 (M24)
Samsung 990 Pro 1 TB
489 (473.86min - 489.4max) MB/s -81%
AS SSD
Score Total
Gigabyte G6X 9KG (2024)
Gigabyte AG450E1024-SI
7807 Points +31%
HP Victus 16 (2024)
Kioxia XG8 KXG80ZNV512G
7423 Points +25%
Average of class Gaming
  (2271 - 13854, n=156, last 2 years)
6746 Points +13%
SCHENKER XMG Core 15 (M24)
Samsung 990 Pro 1 TB
6614 Points +11%
Lenovo LOQ 15IRX9
Micron 2400 MTFDKCD1T0QFM
5947 Points
Average Micron 2400 MTFDKCD1T0QFM
  ()
5947 Points 0%
Dell G16, i7-13650HX, RTX 4060
WD PC SN740 SDDPNQD-1T00
5239 Points -12%
Score Read
Gigabyte G6X 9KG (2024)
Gigabyte AG450E1024-SI
3051 Points +29%
HP Victus 16 (2024)
Kioxia XG8 KXG80ZNV512G
3007 Points +27%
Average of class Gaming
  (776 - 4721, n=156, last 2 years)
2446 Points +4%
Lenovo LOQ 15IRX9
Micron 2400 MTFDKCD1T0QFM
2363 Points
Average Micron 2400 MTFDKCD1T0QFM
  ()
2363 Points 0%
SCHENKER XMG Core 15 (M24)
Samsung 990 Pro 1 TB
1873 Points -21%
Dell G16, i7-13650HX, RTX 4060
WD PC SN740 SDDPNQD-1T00
1648 Points -30%
Score Write
SCHENKER XMG Core 15 (M24)
Samsung 990 Pro 1 TB
3848 Points +59%
Gigabyte G6X 9KG (2024)
Gigabyte AG450E1024-SI
3191 Points +32%
Average of class Gaming
  (515 - 7208, n=156, last 2 years)
3112 Points +29%
HP Victus 16 (2024)
Kioxia XG8 KXG80ZNV512G
2919 Points +21%
Dell G16, i7-13650HX, RTX 4060
WD PC SN740 SDDPNQD-1T00
2751 Points +14%
Lenovo LOQ 15IRX9
Micron 2400 MTFDKCD1T0QFM
2414 Points
Average Micron 2400 MTFDKCD1T0QFM
  ()
2414 Points 0%
Seq Read
SCHENKER XMG Core 15 (M24)
Samsung 990 Pro 1 TB
5283 MB/s +39%
HP Victus 16 (2024)
Kioxia XG8 KXG80ZNV512G
5247.63 MB/s +38%
Average of class Gaming
  (2260 - 12763, n=156, last 2 years)
4945 MB/s +30%
Dell G16, i7-13650HX, RTX 4060
WD PC SN740 SDDPNQD-1T00
4491 MB/s +18%
Gigabyte G6X 9KG (2024)
Gigabyte AG450E1024-SI
4212.96 MB/s +11%
Lenovo LOQ 15IRX9
Micron 2400 MTFDKCD1T0QFM
3796.49 MB/s
Average Micron 2400 MTFDKCD1T0QFM
  ()
3796 MB/s 0%
Seq Write
HP Victus 16 (2024)
Kioxia XG8 KXG80ZNV512G
4617.83 MB/s +51%
Dell G16, i7-13650HX, RTX 4060
WD PC SN740 SDDPNQD-1T00
4260 MB/s +40%
Gigabyte G6X 9KG (2024)
Gigabyte AG450E1024-SI
4234.14 MB/s +39%
Average of class Gaming
  (495 - 11316, n=156, last 2 years)
3760 MB/s +23%
SCHENKER XMG Core 15 (M24)
Samsung 990 Pro 1 TB
3646 MB/s +19%
Lenovo LOQ 15IRX9
Micron 2400 MTFDKCD1T0QFM
3051.23 MB/s
Average Micron 2400 MTFDKCD1T0QFM
  ()
3051 MB/s 0%
4K Read
Gigabyte G6X 9KG (2024)
Gigabyte AG450E1024-SI
78.34 MB/s +46%
SCHENKER XMG Core 15 (M24)
Samsung 990 Pro 1 TB
76.7 MB/s +42%
Average of class Gaming
  (27.8 - 112.1, n=156, last 2 years)
65.2 MB/s +21%
Dell G16, i7-13650HX, RTX 4060
WD PC SN740 SDDPNQD-1T00
55.5 MB/s +3%
Lenovo LOQ 15IRX9
Micron 2400 MTFDKCD1T0QFM
53.84 MB/s
Average Micron 2400 MTFDKCD1T0QFM
  ()
53.8 MB/s 0%
HP Victus 16 (2024)
Kioxia XG8 KXG80ZNV512G
51.41 MB/s -5%
4K Write
Gigabyte G6X 9KG (2024)
Gigabyte AG450E1024-SI
254.58 MB/s +12%
Lenovo LOQ 15IRX9
Micron 2400 MTFDKCD1T0QFM
226.41 MB/s
Average Micron 2400 MTFDKCD1T0QFM
  ()
226 MB/s 0%
HP Victus 16 (2024)
Kioxia XG8 KXG80ZNV512G
218.1 MB/s -4%
Average of class Gaming
  (108.8 - 512, n=156, last 2 years)
213 MB/s -6%
Dell G16, i7-13650HX, RTX 4060
WD PC SN740 SDDPNQD-1T00
211 MB/s -7%
SCHENKER XMG Core 15 (M24)
Samsung 990 Pro 1 TB
172.3 MB/s -24%
4K-64 Read
Gigabyte G6X 9KG (2024)
Gigabyte AG450E1024-SI
2551.05 MB/s +32%
HP Victus 16 (2024)
Kioxia XG8 KXG80ZNV512G
2430.71 MB/s +26%
Lenovo LOQ 15IRX9
Micron 2400 MTFDKCD1T0QFM
1929.3 MB/s
Average Micron 2400 MTFDKCD1T0QFM
  ()
1929 MB/s 0%
Average of class Gaming
  (451 - 3475, n=156, last 2 years)
1881 MB/s -3%
SCHENKER XMG Core 15 (M24)
Samsung 990 Pro 1 TB
1268 MB/s -34%
Dell G16, i7-13650HX, RTX 4060
WD PC SN740 SDDPNQD-1T00
1143 MB/s -41%
4K-64 Write
SCHENKER XMG Core 15 (M24)
Samsung 990 Pro 1 TB
3311 MB/s +76%
Average of class Gaming
  (277 - 5909, n=156, last 2 years)
2527 MB/s +34%
Gigabyte G6X 9KG (2024)
Gigabyte AG450E1024-SI
2512.87 MB/s +34%
HP Victus 16 (2024)
Kioxia XG8 KXG80ZNV512G
2238.92 MB/s +19%
Dell G16, i7-13650HX, RTX 4060
WD PC SN740 SDDPNQD-1T00
2114 MB/s +12%
Lenovo LOQ 15IRX9
Micron 2400 MTFDKCD1T0QFM
1882 MB/s
Average Micron 2400 MTFDKCD1T0QFM
  ()
1882 MB/s 0%
Access Time Read
HP Victus 16 (2024)
Kioxia XG8 KXG80ZNV512G
0.137 ms * -315%
Gigabyte G6X 9KG (2024)
Gigabyte AG450E1024-SI
0.067 ms * -103%
Average of class Gaming
  (0.016 - 0.379, n=155, last 2 years)
0.05576 ms * -69%
Dell G16, i7-13650HX, RTX 4060
WD PC SN740 SDDPNQD-1T00
0.035 ms * -6%
SCHENKER XMG Core 15 (M24)
Samsung 990 Pro 1 TB
0.033 ms * -0%
Lenovo LOQ 15IRX9
Micron 2400 MTFDKCD1T0QFM
0.033 ms *
Average Micron 2400 MTFDKCD1T0QFM
  ()
0.033 ms * -0%
Access Time Write
Lenovo LOQ 15IRX9
Micron 2400 MTFDKCD1T0QFM
0.097 ms *
Average Micron 2400 MTFDKCD1T0QFM
  ()
0.097 ms * -0%
Average of class Gaming
  (0.011 - 1.028, n=156, last 2 years)
0.04728 ms * +51%
SCHENKER XMG Core 15 (M24)
Samsung 990 Pro 1 TB
0.023 ms * +76%
HP Victus 16 (2024)
Kioxia XG8 KXG80ZNV512G
0.019 ms * +80%
Dell G16, i7-13650HX, RTX 4060
WD PC SN740 SDDPNQD-1T00
0.018 ms * +81%
Gigabyte G6X 9KG (2024)
Gigabyte AG450E1024-SI
0.015 ms * +85%

* ... smaller is better

Reading continuous performance: DiskSpd Read Loop, Queue Depth 8

036072010801440180021602520288032403600396043204680504054005760612064806840Tooltip
Lenovo LOQ 15IRX9 Micron 2400 MTFDKCD1T0QFM; diskspd 2.0.17 f: Ø3364 (2261.87-4608.28)
SCHENKER XMG Core 15 (M24) Samsung 990 Pro 1 TB; diskspd 2.0.17 f: Ø7120 (6339.48-7142.87)
Gigabyte G6X 9KG (2024) Gigabyte AG450E1024-SI; diskspd 2.0.17 f: Ø5086 (4094.28-5122.29)
HP Victus 16 (2024) Kioxia XG8 KXG80ZNV512G; diskspd 2.0.17 f: Ø5625 (4912.19-6954.3)
Dell G16, i7-13650HX, RTX 4060 WD PC SN740 SDDPNQD-1T00; diskspd 2.0.17 f: Ø2397 (880.89-5167.17)

Grafikkort

Den nya GeForce RTX 4060 (3 072 shaders, 128-bitars buss, 8 GB GDDR6, 115 watt) representerar mellanklassen inom Nvidias nuvarande sortiment av mobila GPU:er. Den möjliggör FHD-spel vid höga till maximala inställningar. Dess benchmarkresultat och bildfrekvenser är ungefär i nivå med RTX-4060-genomsnittet (balanserat läge). Prestandaläget resulterade i förbättrade värden. Att växla mellan dGPU och Optimus kräver ingen omstart: Avancerad Optimus stöds.

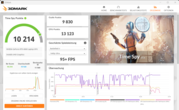
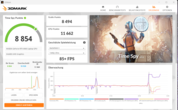
Time Spy (ansluten till elnätet, balanserat läge)
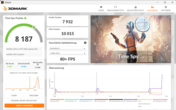
Time Spy (batteriläge, balanserat läge)
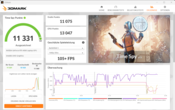
Time Spy (ansluten till elnätet, prestandaläge)
Time Spy (ansluten till elnätet, tyst läge)
3DMark Performance Rating - Percent
Average of class Gaming
 
100 pt
SCHENKER XMG Core 15 (M24)
NVIDIA GeForce RTX 4060 Laptop GPU, AMD Ryzen 7 8845HS
90.2 pt
Lenovo LOQ 15IRX9
NVIDIA GeForce RTX 4060 Laptop GPU, Intel Core i5-13450HX
87.3 pt
Dell G16, i7-13650HX, RTX 4060
NVIDIA GeForce RTX 4060 Laptop GPU, Intel Core i7-13650HX
83.3 pt
Lenovo LOQ 15IRX9
NVIDIA GeForce RTX 4060 Laptop GPU, Intel Core i5-13450HX
80.7 pt
Gigabyte G6X 9KG (2024)
NVIDIA GeForce RTX 4060 Laptop GPU, Intel Core i7-13650HX
80.6 pt
HP Victus 16 (2024)
NVIDIA GeForce RTX 4060 Laptop GPU, Intel Core i7-14700HX
80.4 pt
Average NVIDIA GeForce RTX 4060 Laptop GPU
 
79.1 pt
3DMark 11 - 1280x720 Performance GPU
Average of class Gaming
  (1029 - 72178, n=183, last 2 years)
43810 Points +23%
SCHENKER XMG Core 15 (M24)
NVIDIA GeForce RTX 4060 Laptop GPU, AMD Ryzen 7 8845HS
38912 Points +9%
Lenovo LOQ 15IRX9
NVIDIA GeForce RTX 4060 Laptop GPU, Intel Core i5-13450HX (Leistungsmodus)
38065 Points +7%
Dell G16, i7-13650HX, RTX 4060
NVIDIA GeForce RTX 4060 Laptop GPU, Intel Core i7-13650HX
36185 Points +2%
Lenovo LOQ 15IRX9
NVIDIA GeForce RTX 4060 Laptop GPU, Intel Core i5-13450HX
35608 Points
Gigabyte G6X 9KG (2024)
NVIDIA GeForce RTX 4060 Laptop GPU, Intel Core i7-13650HX
35409 Points -1%
HP Victus 16 (2024)
NVIDIA GeForce RTX 4060 Laptop GPU, Intel Core i7-14700HX
35045 Points -2%
Average NVIDIA GeForce RTX 4060 Laptop GPU
  (28136 - 38912, n=56)
34832 Points -2%
3DMark
1920x1080 Fire Strike Graphics
Average of class Gaming
  (781 - 53059, n=194, last 2 years)
31415 Points +16%
SCHENKER XMG Core 15 (M24)
NVIDIA GeForce RTX 4060 Laptop GPU, AMD Ryzen 7 8845HS
29656 Points +10%
Lenovo LOQ 15IRX9
NVIDIA GeForce RTX 4060 Laptop GPU, Intel Core i5-13450HX (Leistungsmodus)
28423 Points +5%
Lenovo LOQ 15IRX9
NVIDIA GeForce RTX 4060 Laptop GPU, Intel Core i5-13450HX
27026 Points
Gigabyte G6X 9KG (2024)
NVIDIA GeForce RTX 4060 Laptop GPU, Intel Core i7-13650HX
26964 Points 0%
Dell G16, i7-13650HX, RTX 4060
NVIDIA GeForce RTX 4060 Laptop GPU, Intel Core i7-13650HX
26952 Points 0%
HP Victus 16 (2024)
NVIDIA GeForce RTX 4060 Laptop GPU, Intel Core i7-14700HX
26844 Points -1%
Average NVIDIA GeForce RTX 4060 Laptop GPU
  (20533 - 29656, n=53)
25748 Points -5%
2560x1440 Time Spy Graphics
Average of class Gaming
  (224 - 22717, n=189, last 2 years)
13118 Points +33%
SCHENKER XMG Core 15 (M24)
NVIDIA GeForce RTX 4060 Laptop GPU, AMD Ryzen 7 8845HS
11451 Points +16%
Lenovo LOQ 15IRX9
NVIDIA GeForce RTX 4060 Laptop GPU, Intel Core i5-13450HX (Leistungsmodus)
11075 Points +13%
Dell G16, i7-13650HX, RTX 4060
NVIDIA GeForce RTX 4060 Laptop GPU, Intel Core i7-13650HX
10680 Points +9%
HP Victus 16 (2024)
NVIDIA GeForce RTX 4060 Laptop GPU, Intel Core i7-14700HX
9937 Points +1%
Average NVIDIA GeForce RTX 4060 Laptop GPU
  (7484 - 11451, n=55)
9936 Points +1%
Gigabyte G6X 9KG (2024)
NVIDIA GeForce RTX 4060 Laptop GPU, Intel Core i7-13650HX
9841 Points 0%
Lenovo LOQ 15IRX9
NVIDIA GeForce RTX 4060 Laptop GPU, Intel Core i5-13450HX
9830 Points
3DMark 11 Performance
30755 poäng
3DMark Fire Strike Score
22788 poäng
3DMark Time Spy Score
10214 poäng
3DMark Steel Nomad Score
2143 poäng
Hjälp
Blender
v3.3 Classroom OPTIX/RTX
Lenovo LOQ 15IRX9
NVIDIA GeForce RTX 4060 Laptop GPU, Intel Core i5-13450HX (3.3.3)
25 Seconds *
Dell G16, i7-13650HX, RTX 4060
NVIDIA GeForce RTX 4060 Laptop GPU, Intel Core i7-13650HX (3.3.3)
24 Seconds * +4%
Average NVIDIA GeForce RTX 4060 Laptop GPU
  (19 - 28, n=52)
23 Seconds * +8%
HP Victus 16 (2024)
NVIDIA GeForce RTX 4060 Laptop GPU, Intel Core i7-14700HX (3.3.3)
22 Seconds * +12%
Lenovo LOQ 15IRX9
NVIDIA GeForce RTX 4060 Laptop GPU, Intel Core i5-13450HX (3.3.3, Leistungsmodus)
22 Seconds * +12%
Average of class Gaming
  (9 - 95, n=178, last 2 years)
20.9 Seconds * +16%
Gigabyte G6X 9KG (2024)
NVIDIA GeForce RTX 4060 Laptop GPU, Intel Core i7-13650HX (3.3.3)
20 Seconds * +20%
SCHENKER XMG Core 15 (M24)
NVIDIA GeForce RTX 4060 Laptop GPU, AMD Ryzen 7 8845HS (3.3.3)
19 Seconds * +24%
v3.3 Classroom CUDA
Dell G16, i7-13650HX, RTX 4060
NVIDIA GeForce RTX 4060 Laptop GPU, Intel Core i7-13650HX (3.3.3)
49 Seconds * -11%
Lenovo LOQ 15IRX9
NVIDIA GeForce RTX 4060 Laptop GPU, Intel Core i5-13450HX (3.3.3)
44 Seconds *
Average NVIDIA GeForce RTX 4060 Laptop GPU
  (39 - 53, n=52)
43.2 Seconds * +2%
Lenovo LOQ 15IRX9
NVIDIA GeForce RTX 4060 Laptop GPU, Intel Core i5-13450HX (3.3.3, Leistungsmodus)
42 Seconds * +5%
HP Victus 16 (2024)
NVIDIA GeForce RTX 4060 Laptop GPU, Intel Core i7-14700HX (3.3.3)
41 Seconds * +7%
Gigabyte G6X 9KG (2024)
NVIDIA GeForce RTX 4060 Laptop GPU, Intel Core i7-13650HX (3.3.3)
40 Seconds * +9%
SCHENKER XMG Core 15 (M24)
NVIDIA GeForce RTX 4060 Laptop GPU, AMD Ryzen 7 8845HS (3.3.3)
39 Seconds * +11%
Average of class Gaming
  (16 - 175, n=183, last 2 years)
36.5 Seconds * +17%
v3.3 Classroom CPU
Gigabyte G6X 9KG (2024)
NVIDIA GeForce RTX 4060 Laptop GPU, Intel Core i7-13650HX (3.3.3)
401 Seconds * -1%
Lenovo LOQ 15IRX9
NVIDIA GeForce RTX 4060 Laptop GPU, Intel Core i5-13450HX (3.3.3)
397 Seconds *
Lenovo LOQ 15IRX9
NVIDIA GeForce RTX 4060 Laptop GPU, Intel Core i5-13450HX (3.3.3, Leistungsmodus)
338 Seconds * +15%
HP Victus 16 (2024)
NVIDIA GeForce RTX 4060 Laptop GPU, Intel Core i7-14700HX (3.3.3)
312 Seconds * +21%
Average NVIDIA GeForce RTX 4060 Laptop GPU
  (189 - 452, n=52)
311 Seconds * +22%
Average of class Gaming
  (138 - 962, n=187, last 2 years)
294 Seconds * +26%
SCHENKER XMG Core 15 (M24)
NVIDIA GeForce RTX 4060 Laptop GPU, AMD Ryzen 7 8845HS (3.3.3)
288 Seconds * +27%
Dell G16, i7-13650HX, RTX 4060
NVIDIA GeForce RTX 4060 Laptop GPU, Intel Core i7-13650HX (3.3.3)
272 Seconds * +31%
Geekbench 5.5
OpenCL Score
Average of class Gaming
  (5039 - 237138, n=189, last 2 years)
127274 Points +22%
SCHENKER XMG Core 15 (M24)
NVIDIA GeForce RTX 4060 Laptop GPU, AMD Ryzen 7 8845HS
112141 Points +7%
Lenovo LOQ 15IRX9
NVIDIA GeForce RTX 4060 Laptop GPU, Intel Core i5-13450HX (Leistungsmodus)
111242 Points +7%
Lenovo LOQ 15IRX9
NVIDIA GeForce RTX 4060 Laptop GPU, Intel Core i5-13450HX
104333 Points
Gigabyte G6X 9KG (2024)
NVIDIA GeForce RTX 4060 Laptop GPU, Intel Core i7-13650HX
103588 Points -1%
Dell G16, i7-13650HX, RTX 4060
NVIDIA GeForce RTX 4060 Laptop GPU, Intel Core i7-13650HX
103039 Points -1%
HP Victus 16 (2024)
NVIDIA GeForce RTX 4060 Laptop GPU, Intel Core i7-14700HX
102604 Points -2%
Average NVIDIA GeForce RTX 4060 Laptop GPU
  (5039 - 112238, n=52)
99381 Points -5%
Vulkan Score 5.5
SCHENKER XMG Core 15 (M24)
NVIDIA GeForce RTX 4060 Laptop GPU, AMD Ryzen 7 8845HS
85280 Points +14%
Lenovo LOQ 15IRX9
NVIDIA GeForce RTX 4060 Laptop GPU, Intel Core i5-13450HX (Leistungsmodus)
78493 Points +5%
Lenovo LOQ 15IRX9
NVIDIA GeForce RTX 4060 Laptop GPU, Intel Core i5-13450HX
74517 Points
Average of class Gaming
  (7995 - 163089, n=119, last 2 years)
73245 Points -2%
Average NVIDIA GeForce RTX 4060 Laptop GPU
  (28838 - 87612, n=30)
62733 Points -16%
HP Victus 16 (2024)
NVIDIA GeForce RTX 4060 Laptop GPU, Intel Core i7-14700HX
61926 Points -17%
Gigabyte G6X 9KG (2024)
NVIDIA GeForce RTX 4060 Laptop GPU, Intel Core i7-13650HX
54630 Points -27%
Geekbench 6.3
GPU OpenCL
Average of class Gaming
  (4321 - 207373, n=110, last 2 years)
116145 Points +28%
Gigabyte G6X 9KG (2024)
NVIDIA GeForce RTX 4060 Laptop GPU, Intel Core i7-13650HX (6.2.1)
97899 Points +8%
SCHENKER XMG Core 15 (M24)
NVIDIA GeForce RTX 4060 Laptop GPU, AMD Ryzen 7 8845HS (6.2.1)
96625 Points +7%
HP Victus 16 (2024)
NVIDIA GeForce RTX 4060 Laptop GPU, Intel Core i7-14700HX (6.2.1)
96607 Points +7%
Dell G16, i7-13650HX, RTX 4060
NVIDIA GeForce RTX 4060 Laptop GPU, Intel Core i7-13650HX (6.2.1)
93994 Points +4%
Lenovo LOQ 15IRX9
NVIDIA GeForce RTX 4060 Laptop GPU, Intel Core i5-13450HX (6.2.1, Leistungsmodus)
93291 Points +3%
Lenovo LOQ 15IRX9
NVIDIA GeForce RTX 4060 Laptop GPU, Intel Core i5-13450HX (6.2.1)
90435 Points
Average NVIDIA GeForce RTX 4060 Laptop GPU
  (4321 - 100831, n=39)
90125 Points 0%
GPU Vulkan
SCHENKER XMG Core 15 (M24)
NVIDIA GeForce RTX 4060 Laptop GPU, AMD Ryzen 7 8845HS (6.2.1)
96989 Points +7%
Lenovo LOQ 15IRX9
NVIDIA GeForce RTX 4060 Laptop GPU, Intel Core i5-13450HX (6.2.1, Leistungsmodus)
94531 Points +4%
Gigabyte G6X 9KG (2024)
NVIDIA GeForce RTX 4060 Laptop GPU, Intel Core i7-13650HX (6.2.1)
92895 Points +2%
Lenovo LOQ 15IRX9
NVIDIA GeForce RTX 4060 Laptop GPU, Intel Core i5-13450HX (6.2.1)
91034 Points
HP Victus 16 (2024)
NVIDIA GeForce RTX 4060 Laptop GPU, Intel Core i7-14700HX (6.2.1)
88889 Points -2%
Average of class Gaming
  (4286 - 196201, n=105, last 2 years)
83044 Points -9%
Average NVIDIA GeForce RTX 4060 Laptop GPU
  (4286 - 101001, n=35)
65274 Points -28%
Dell G16, i7-13650HX, RTX 4060
NVIDIA GeForce RTX 4060 Laptop GPU, Intel Core i7-13650HX (6.2.1)
4769 Points -95%
V-Ray 5 Benchmark
GPU RTX
Average of class Gaming
  (171 - 3824, n=113, last 2 years)
2190 mpaths +32%
Gigabyte G6X 9KG (2024)
NVIDIA GeForce RTX 4060 Laptop GPU, Intel Core i7-13650HX (5.0.1)
1803 mpaths +8%
HP Victus 16 (2024)
NVIDIA GeForce RTX 4060 Laptop GPU, Intel Core i7-14700HX (5.0.1)
1782 mpaths +7%
Lenovo LOQ 15IRX9
NVIDIA GeForce RTX 4060 Laptop GPU, Intel Core i5-13450HX (5.0.1, Leistungsmodus)
1782 mpaths +7%
Dell G16, i7-13650HX, RTX 4060
NVIDIA GeForce RTX 4060 Laptop GPU, Intel Core i7-13650HX (5.0.1)
1744 mpaths +5%
Average NVIDIA GeForce RTX 4060 Laptop GPU
  (1387 - 1817, n=28)
1711 mpaths +3%
Lenovo LOQ 15IRX9
NVIDIA GeForce RTX 4060 Laptop GPU, Intel Core i5-13450HX (5.0.1)
1664 mpaths
GPU CUDA
Average of class Gaming
  (120 - 2797, n=115, last 2 years)
1574 mpaths +31%
Lenovo LOQ 15IRX9
NVIDIA GeForce RTX 4060 Laptop GPU, Intel Core i5-13450HX (5.0.1, Leistungsmodus)
1244 mpaths +4%
Gigabyte G6X 9KG (2024)
NVIDIA GeForce RTX 4060 Laptop GPU, Intel Core i7-13650HX (5.0.1)
1220 mpaths +2%
Lenovo LOQ 15IRX9
NVIDIA GeForce RTX 4060 Laptop GPU, Intel Core i5-13450HX (5.0.1)
1199 mpaths
HP Victus 16 (2024)
NVIDIA GeForce RTX 4060 Laptop GPU, Intel Core i7-14700HX (5.0.1)
1198 mpaths 0%
Average NVIDIA GeForce RTX 4060 Laptop GPU
  (957 - 1294, n=29)
1170 mpaths -2%
Dell G16, i7-13650HX, RTX 4060
NVIDIA GeForce RTX 4060 Laptop GPU, Intel Core i7-13650HX (5.0.1)
1157 mpaths -4%
CPU
Average of class Gaming
  (3562 - 26944, n=117, last 2 years)
15137 mpaths +40%
HP Victus 16 (2024)
NVIDIA GeForce RTX 4060 Laptop GPU, Intel Core i7-14700HX (5.0.1)
13952 mpaths +29%
Average NVIDIA GeForce RTX 4060 Laptop GPU
  (8364 - 21065, n=28)
12813 mpaths +18%
Gigabyte G6X 9KG (2024)
NVIDIA GeForce RTX 4060 Laptop GPU, Intel Core i7-13650HX (5.0.1)
11935 mpaths +10%
Lenovo LOQ 15IRX9
NVIDIA GeForce RTX 4060 Laptop GPU, Intel Core i5-13450HX (5.0.1, Leistungsmodus)
11369 mpaths +5%
Dell G16, i7-13650HX, RTX 4060
NVIDIA GeForce RTX 4060 Laptop GPU, Intel Core i7-13650HX (5.0.1)
10897 mpaths +1%
Lenovo LOQ 15IRX9
NVIDIA GeForce RTX 4060 Laptop GPU, Intel Core i5-13450HX (5.0.1)
10813 mpaths
V-Ray Benchmark Next 4.10
GPU
Average of class Gaming
  (54 - 1334, n=151, last 2 years)
709 mpaths +15%
SCHENKER XMG Core 15 (M24)
NVIDIA GeForce RTX 4060 Laptop GPU, AMD Ryzen 7 8845HS (v4.10.07 )
704 mpaths +14%
Gigabyte G6X 9KG (2024)
NVIDIA GeForce RTX 4060 Laptop GPU, Intel Core i7-13650HX (v4.10.07 )
648 mpaths +5%
Lenovo LOQ 15IRX9
NVIDIA GeForce RTX 4060 Laptop GPU, Intel Core i5-13450HX (v4.10.07, Leistungsmodus)
639 mpaths +4%
Average NVIDIA GeForce RTX 4060 Laptop GPU
  (483 - 715, n=45)
632 mpaths +2%
HP Victus 16 (2024)
NVIDIA GeForce RTX 4060 Laptop GPU, Intel Core i7-14700HX (v4.10.07 )
628 mpaths +2%
Lenovo LOQ 15IRX9
NVIDIA GeForce RTX 4060 Laptop GPU, Intel Core i5-13450HX (v4.10.07 )
617 mpaths
CPU
HP Victus 16 (2024)
NVIDIA GeForce RTX 4060 Laptop GPU, Intel Core i7-14700HX (v4.10.07 )
21499 ksamples +31%
Average of class Gaming
  (5413 - 37629, n=151, last 2 years)
21459 ksamples +31%
Average NVIDIA GeForce RTX 4060 Laptop GPU
  (12680 - 32360, n=45)
19596 ksamples +20%
SCHENKER XMG Core 15 (M24)
NVIDIA GeForce RTX 4060 Laptop GPU, AMD Ryzen 7 8845HS (v4.10.07 )
18555 ksamples +13%
Gigabyte G6X 9KG (2024)
NVIDIA GeForce RTX 4060 Laptop GPU, Intel Core i7-13650HX (v4.10.07 )
18304 ksamples +12%
Lenovo LOQ 15IRX9
NVIDIA GeForce RTX 4060 Laptop GPU, Intel Core i5-13450HX (v4.10.07, Leistungsmodus)
16990 ksamples +4%
Lenovo LOQ 15IRX9
NVIDIA GeForce RTX 4060 Laptop GPU, Intel Core i5-13450HX (v4.10.07 )
16391 ksamples

* ... smaller is better

Performance Rating - Percent
Average of class Gaming
 
97.3 pt
SCHENKER XMG Core 15 (M24)
AMD Ryzen 7 8845HS, NVIDIA GeForce RTX 4060 Laptop GPU
92 pt
Dell G16, i7-13650HX, RTX 4060
Intel Core i7-13650HX, NVIDIA GeForce RTX 4060 Laptop GPU
90.9 pt
Lenovo LOQ 15IRX9
Intel Core i5-13450HX, NVIDIA GeForce RTX 4060 Laptop GPU
90.1 pt
Gigabyte G6X 9KG (2024)
Intel Core i7-13650HX, NVIDIA GeForce RTX 4060 Laptop GPU
87.5 pt
Average NVIDIA GeForce RTX 4060 Laptop GPU
 
85.6 pt
HP Victus 16 (2024)
Intel Core i7-14700HX, NVIDIA GeForce RTX 4060 Laptop GPU
85.4 pt
Lenovo LOQ 15IRX9
Intel Core i5-13450HX, NVIDIA GeForce RTX 4060 Laptop GPU
84.9 pt
Cyberpunk 2077 2.1 Phantom Liberty - 1920x1080 Ultra Preset (FSR off)
SCHENKER XMG Core 15 (M24)
AMD Ryzen 7 8845HS, NVIDIA GeForce RTX 4060 Laptop GPU (2.12)
93.1 (78.7min) fps +30%
Average of class Gaming
  (6.76 - 144.7, n=80, last 2 years)
86.5 fps +21%
Lenovo LOQ 15IRX9
Intel Core i5-13450HX, NVIDIA GeForce RTX 4060 Laptop GPU (2.02, Leistungsmodus)
78.5 (44.5min) fps +10%
Average NVIDIA GeForce RTX 4060 Laptop GPU
  (56.4 - 93.1, n=30)
71.5 fps 0%
Lenovo LOQ 15IRX9
Intel Core i5-13450HX, NVIDIA GeForce RTX 4060 Laptop GPU (2.02)
71.4 (40.1min) fps
Dell G16, i7-13650HX, RTX 4060
Intel Core i7-13650HX, NVIDIA GeForce RTX 4060 Laptop GPU (2.11)
69.8 (60.3min) fps -2%
Gigabyte G6X 9KG (2024)
Intel Core i7-13650HX, NVIDIA GeForce RTX 4060 Laptop GPU (2.02)
69.7 (39min) fps -2%
HP Victus 16 (2024)
Intel Core i7-14700HX, NVIDIA GeForce RTX 4060 Laptop GPU (2.02)
67.1 (20.8min) fps -6%
GTA V - 1920x1080 Highest Settings possible AA:4xMSAA + FX AF:16x
Dell G16, i7-13650HX, RTX 4060
Intel Core i7-13650HX, NVIDIA GeForce RTX 4060 Laptop GPU
117.4 (3.75min, 76.9P1) fps +4%
SCHENKER XMG Core 15 (M24)
AMD Ryzen 7 8845HS, NVIDIA GeForce RTX 4060 Laptop GPU
116.7 (5.3min, 76.9P1) fps +4%
Lenovo LOQ 15IRX9
Intel Core i5-13450HX, NVIDIA GeForce RTX 4060 Laptop GPU (Leistungsmodus)
116.5 (3.91min, 83.3P1) fps +3%
Gigabyte G6X 9KG (2024)
Intel Core i7-13650HX, NVIDIA GeForce RTX 4060 Laptop GPU
115.2 (4.02min, 76.9P1) fps +2%
Average of class Gaming
  (12.1 - 167.7, n=169, last 2 years)
113.7 fps +1%
Lenovo LOQ 15IRX9
Intel Core i5-13450HX, NVIDIA GeForce RTX 4060 Laptop GPU
112.6 (5.45min, 76.9P1) fps
HP Victus 16 (2024)
Intel Core i7-14700HX, NVIDIA GeForce RTX 4060 Laptop GPU
110.2 (8.03min, 76.9P1) fps -2%
Average NVIDIA GeForce RTX 4060 Laptop GPU
  (76.9 - 126.3, n=47)
107.6 fps -4%
Final Fantasy XV Benchmark - 1920x1080 High Quality
Average of class Gaming
  (19.2 - 201, n=181, last 2 years)
119.8 fps +20%
Lenovo LOQ 15IRX9
Intel Core i5-13450HX, NVIDIA GeForce RTX 4060 Laptop GPU (1.3, Leistungsmodus)
108.6 fps +9%
SCHENKER XMG Core 15 (M24)
AMD Ryzen 7 8845HS, NVIDIA GeForce RTX 4060 Laptop GPU (1.3)
107.2 fps +7%
Dell G16, i7-13650HX, RTX 4060
Intel Core i7-13650HX, NVIDIA GeForce RTX 4060 Laptop GPU (1.3)
103.7 fps +4%
Gigabyte G6X 9KG (2024)
Intel Core i7-13650HX, NVIDIA GeForce RTX 4060 Laptop GPU (1.3)
101.5 fps +2%
Lenovo LOQ 15IRX9
Intel Core i5-13450HX, NVIDIA GeForce RTX 4060 Laptop GPU (1.3)
99.9 fps
HP Victus 16 (2024)
Intel Core i7-14700HX, NVIDIA GeForce RTX 4060 Laptop GPU (1.3)
98.1 fps -2%
Average NVIDIA GeForce RTX 4060 Laptop GPU
  (75.1 - 109.8, n=50)
97.3 fps -3%
Strange Brigade - 1920x1080 ultra AA:ultra AF:16
Average of class Gaming
  (38.9 - 421, n=178, last 2 years)
229 fps +25%
SCHENKER XMG Core 15 (M24)
AMD Ryzen 7 8845HS, NVIDIA GeForce RTX 4060 Laptop GPU (1.47.22.14 D3D12)
204 (141.8min, 149.7P1) fps +12%
Dell G16, i7-13650HX, RTX 4060
Intel Core i7-13650HX, NVIDIA GeForce RTX 4060 Laptop GPU (1.47.22.14 D3D12)
194.9 (18.1min, 141.1P1) fps +7%
Lenovo LOQ 15IRX9
Intel Core i5-13450HX, NVIDIA GeForce RTX 4060 Laptop GPU (1.47.22.14 D3D12, Leistungsmodus)
190 (49.6min, 135P1) fps +4%
Lenovo LOQ 15IRX9
Intel Core i5-13450HX, NVIDIA GeForce RTX 4060 Laptop GPU (1.47.22.14 D3D12)
182.7 (43.5min, 133.1P1) fps
Gigabyte G6X 9KG (2024)
Intel Core i7-13650HX, NVIDIA GeForce RTX 4060 Laptop GPU (1.47.22.14 D3D12)
182.2 (56.5min, 132.3P1) fps 0%
Average NVIDIA GeForce RTX 4060 Laptop GPU
  (135.3 - 210, n=49)
181.3 fps -1%
HP Victus 16 (2024)
Intel Core i7-14700HX, NVIDIA GeForce RTX 4060 Laptop GPU (1.47.22.14 D3D12)
179 (76.4min, 130.3P1) fps -2%
Dota 2 Reborn - 1920x1080 ultra (3/3) best looking
Average of class Gaming
  (65.1 - 220, n=186, last 2 years)
151 fps +7%
HP Victus 16 (2024)
Intel Core i7-14700HX, NVIDIA GeForce RTX 4060 Laptop GPU
149.7 (130.4min) fps +6%
Dell G16, i7-13650HX, RTX 4060
Intel Core i7-13650HX, NVIDIA GeForce RTX 4060 Laptop GPU
149 (130min) fps +6%
Average NVIDIA GeForce RTX 4060 Laptop GPU
  (115 - 183.8, n=52)
145 fps +3%
Lenovo LOQ 15IRX9
Intel Core i5-13450HX, NVIDIA GeForce RTX 4060 Laptop GPU (Leistungsmodus)
144.3 (125.6min) fps +2%
Gigabyte G6X 9KG (2024)
Intel Core i7-13650HX, NVIDIA GeForce RTX 4060 Laptop GPU
142.4 (120.3min) fps +1%
Lenovo LOQ 15IRX9
Intel Core i5-13450HX, NVIDIA GeForce RTX 4060 Laptop GPU
141 (122.7min) fps
SCHENKER XMG Core 15 (M24)
AMD Ryzen 7 8845HS, NVIDIA GeForce RTX 4060 Laptop GPU
135.2 (117.4min) fps -4%
X-Plane 11.11 - 1920x1080 high (fps_test=3)
Dell G16, i7-13650HX, RTX 4060
Intel Core i7-13650HX, NVIDIA GeForce RTX 4060 Laptop GPU
114.9 fps +25%
Average of class Gaming
  (32.8 - 166.2, n=192, last 2 years)
108.2 fps +17%
Gigabyte G6X 9KG (2024)
Intel Core i7-13650HX, NVIDIA GeForce RTX 4060 Laptop GPU
107.1 fps +16%
Average NVIDIA GeForce RTX 4060 Laptop GPU
  (60.7 - 141.1, n=53)
102.1 fps +11%
Lenovo LOQ 15IRX9
Intel Core i5-13450HX, NVIDIA GeForce RTX 4060 Laptop GPU (Leistungsmodus)
101.1 fps +10%
HP Victus 16 (2024)
Intel Core i7-14700HX, NVIDIA GeForce RTX 4060 Laptop GPU
100.3 fps +9%
SCHENKER XMG Core 15 (M24)
AMD Ryzen 7 8845HS, NVIDIA GeForce RTX 4060 Laptop GPU
97.2 fps +5%
Lenovo LOQ 15IRX9
Intel Core i5-13450HX, NVIDIA GeForce RTX 4060 Laptop GPU
92.2 fps
Dragon's Dogma 2 - 1920x1080 High Preset
Average of class Gaming
  (49.5 - 80, n=8, last 2 years)
64.5 fps +2%
HP Victus 16 (2024)
Intel Core i7-14700HX, NVIDIA GeForce RTX 4060 Laptop GPU
63.3 (25.6min, 34.9P0.1, 46.2P1) fps 0%
Lenovo LOQ 15IRX9
Intel Core i5-13450HX, NVIDIA GeForce RTX 4060 Laptop GPU
63.3 (34.7min, 41.6P0.1, 48P1) fps
Average NVIDIA GeForce RTX 4060 Laptop GPU
  (57.2 - 67.7, n=5)
62.3 fps -2%
Razer Blade 14 Mid 23
AMD Ryzen 9 7940HS, NVIDIA GeForce RTX 4060 Laptop GPU
57.2 (28min, 31.4P0.1, 38.3P1) fps -10%
F1 24 - 1920x1080 Ultra High Preset AA:T AF:16x
Average of class Gaming
  (54.1 - 127, n=14, last 2 years)
78.2 fps +45%
Average NVIDIA GeForce RTX 4060 Laptop GPU
  (47.5 - 60.9, n=9)
56.1 fps +4%
Razer Blade 14 Mid 23
AMD Ryzen 9 7940HS, NVIDIA GeForce RTX 4060 Laptop GPU
55 (40min) fps +2%
Lenovo LOQ 15IRX9
Intel Core i5-13450HX, NVIDIA GeForce RTX 4060 Laptop GPU (1122588)
54.1 (44min, 43P1) fps
Counter-Strike 2 - 1920x1080 Very High Preset
Razer Blade 14 Mid 23
AMD Ryzen 9 7940HS, NVIDIA GeForce RTX 4060 Laptop GPU
139.1 (20.5min, 37.6P0.1, 66.1P1) fps +12%
Average NVIDIA GeForce RTX 4060 Laptop GPU
  (123.9 - 139.1, n=2)
131.5 fps +6%
Lenovo LOQ 15IRX9
Intel Core i5-13450HX, NVIDIA GeForce RTX 4060 Laptop GPU
123.9 (42min, 50.6P0.1, 62.8P1) fps
Average of class Gaming
  (11.5 - 189.7, n=11, last 2 years)
80.1 fps -35%
Senua's Saga Hellblade 2 - 1920x1080 High Preset
Average of class Gaming
  (38.4 - 78.8, n=4, last 2 years)
52 fps +35%
Average NVIDIA GeForce RTX 4060 Laptop GPU
  (37.6 - 39.5, n=3)
38.5 fps 0%
Lenovo LOQ 15IRX9
Intel Core i5-13450HX, NVIDIA GeForce RTX 4060 Laptop GPU
38.4 (28min, 28.6P0.1, 33P1) fps
Razer Blade 14 Mid 23
AMD Ryzen 9 7940HS, NVIDIA GeForce RTX 4060 Laptop GPU
37.6 (14.7min, 30P0.1, 32.9P1) fps -2%
Ghost of Tsushima - 1920x1080 Very High Preset AA:T
Lenovo LOQ 15IRX9
Intel Core i5-13450HX, NVIDIA GeForce RTX 4060 Laptop GPU
60.6 (36.3min, 39.3P0.1, 45.1P1) fps
Average NVIDIA GeForce RTX 4060 Laptop GPU
  (55.6 - 63.4, n=5)
60 fps -1%
Average of class Gaming
  (28.5 - 73.7, n=7, last 2 years)
59 fps -3%
Razer Blade 14 Mid 23
AMD Ryzen 9 7940HS, NVIDIA GeForce RTX 4060 Laptop GPU
58.5 (22.7min, 35.7P0.1, 45.3P1) fps -3%

Cyberpunk 2077 ultra FPS diagram

0510152025303540455055606570Tooltip
Lenovo LOQ 15IRX9 i5-13450HX, NVIDIA GeForce RTX 4060 Laptop GPU: Ø65.1 (61.4-65.8)
Lenovo LOQ 15IRX9 i5-13450HX, NVIDIA GeForce RTX 4060 Laptop GPU; Leistungsmodus: Ø71.1 (66-71.9)
Cyberpunk 2077 (balanserat läge)
Cyberpunk 2077 (prestandaläge)
lågmed.högultra
GTA V (2015) 184.4 181.5 175.5 112.6
Dota 2 Reborn (2015) 171.2 156.8 149.4 141
Final Fantasy XV Benchmark (2018) 198.9 138.5 99.9
X-Plane 11.11 (2018) 139.6 118.4 92.2
Strange Brigade (2018) 425 260 209 182.7
Cyberpunk 2077 2.1 Phantom Liberty (2023) 118.9 94.3 80.1 71.4
Counter-Strike 2 (2023) 195.3 195 157 123.9
Dragon's Dogma 2 (2024) 70.6 63.3
Ghost of Tsushima (2024) 91 81.7 74.5 60.6
Senua's Saga Hellblade 2 (2024) 64.1 53.2 38.4
F1 24 (2024) 216 201 162.5 54.1

Utsläpp &amp; effekt - Lenovo LOQ med en batteritid under genomsnittet

Bullerutsläpp

När det gäller bullernivåer presterar den bärbara datorn som förväntat för sin klass: Under belastning producerar den en hel del ljud. Att spela Cyberpunk 2077 resulterar i ljudutsläpp på 48 dB(A) (balanserat läge) och 54 dB(A) (prestandaläge ). Tyst läge sänker ljudnivåerna till mer måttliga värden - på bekostnad av den bärbara datorns prestanda. Gaming bör fortfarande vara möjligt - med reducerade inställningar.

Fläktkontrollen behöver justeras lite: Vid tomgångskörning startar fläktarna upprepade gånger kortvarigt - ett mycket irriterande beteende i det långa loppet. Ibland körs de också permanent på en tydligt hörbar nivå.

Ljudnivå

Låg belastning
26 / 34 / 36 dB(A)
Hög belastning
48 / 50 dB(A)
  red to green bar
 
 
30 dB
tyst
40 dB(A)
hörbar
50 dB(A)
högt ljud
 
min: dark, med: mid, max: light   Earthworks M23R, Arta (15 cm avstånd)   environment noise: 25 dB(A)
dB(A) 0102030405060708090Deep BassMiddle BassHigh BassLower RangeMidsHigher MidsLower HighsMid HighsUpper HighsSuper Highs2041.636.235.645.641.42538.637.929.637.136.13147.848.141.344.245.14034.232.428.231.132.85030.429.730.130.928.36340.529.725.326.237.68028.920.619.818.52910031.422.320.41929.412532.822.824.717.329.116029.526.126.219.128.820031.82422.520.730.525032.122.722.116.430.731530.921.722.21431.940035.425.825.412.834.55003731.235.812.538.663036.425.527.7123880037.325.426.311.738.5100038.924.926.911.940.4125038.221.923.912.140160038.221.323.312.240.4200036.420.121.412.438.8250035.718.620.313.138315036.117.818.313.138.340003416.716.113.336.4500031.614.814.913.134.5630030.114.813.913.233.6800025.116.113.913.628.71000021.515.413.513.225.31250017.714.813.112.721.51600015.113.612.312.117.8SPL47.734.136.425.149.7N6.11.92.20.76.9median 32.8median 21.7median 22.1median 13.1median 34.5Delta5.44.45.21.85hearing rangehide median Fan NoiseLenovo LOQ 15IRX9
Lenovo LOQ 15IRX9
NVIDIA GeForce RTX 4060 Laptop GPU, i5-13450HX, Micron 2400 MTFDKCD1T0QFM
SCHENKER XMG Core 15 (M24)
NVIDIA GeForce RTX 4060 Laptop GPU, R7 8845HS, Samsung 990 Pro 1 TB
Gigabyte G6X 9KG (2024)
NVIDIA GeForce RTX 4060 Laptop GPU, i7-13650HX, Gigabyte AG450E1024-SI
HP Victus 16 (2024)
NVIDIA GeForce RTX 4060 Laptop GPU, i7-14700HX, Kioxia XG8 KXG80ZNV512G
Dell G16, i7-13650HX, RTX 4060
NVIDIA GeForce RTX 4060 Laptop GPU, i7-13650HX, WD PC SN740 SDDPNQD-1T00
Noise
14%
-4%
4%
20%
off / environment *
25
23
8%
26
-4%
25
-0%
23
8%
Idle Minimum *
26
23
12%
30
-15%
28
-8%
23
12%
Idle Average *
34
23
32%
32
6%
29
15%
23
32%
Idle Maximum *
36
23
36%
35
3%
33
8%
27.96
22%
Load Average *
48
38.92
19%
51
-6%
45
6%
27.96
42%
Cyberpunk 2077 ultra *
48
52.06
-8%
Load Maximum *
50
52.09
-4%
54
-8%
48
4%
47.89
4%
Witcher 3 ultra *
50.96
51
43
47.89

* ... smaller is better

Temperatur

Under belastning (stresstest, Cyberpunk) blir den bärbara datorn märkbart varm: Ibland överstiger den 50-graders Celcius-markeringen. Den når också högre värden under vardaglig användning (kontor, internet) än många av jämförelseenheterna. Handledsstödets temperaturer är fortfarande rimliga.

I det extrema scenariot (stresstest med Prime95 och Furmark i kontinuerlig drift) kontrolleras systemets stabilitet under full belastning. CPU:n klockades till cirka 2,4 GHz (P) och 2,6 GHz (E), medan grafikkärnan nådde värden runt 1 800 MHz.

Furmark &amp; Prime95
Cyberpunk 2077
Cyberpunk 2077
Cyberpunk 2077
Cyberpunk 2077
Cyberpunk 2077
Cyberpunk 2077
 45 °C47 °C41 °C 
 43 °C46 °C43 °C 
 36 °C37 °C36 °C 
Max: 47 °C
Medel: 41.6 °C
58 °C53 °C57 °C
47 °C48 °C43 °C
42 °C39 °C36 °C
Max: 58 °C
Medel: 47 °C
Strömförsörjning (max.)  56 °C | Rumstemperatur 22 °C | Fluke t3000FC (calibrated), Voltcraft IR-900
(-) The average temperature for the upper side under maximal load is 41.6 °C / 107 F, compared to the average of 33.9 °C / 93 F for the devices in the class Gaming.
(-) The maximum temperature on the upper side is 47 °C / 117 F, compared to the average of 40.5 °C / 105 F, ranging from 21.2 to 68.8 °C for the class Gaming.
(-) The bottom heats up to a maximum of 58 °C / 136 F, compared to the average of 43.2 °C / 110 F
(+) In idle usage, the average temperature for the upper side is 30.2 °C / 86 F, compared to the device average of 33.9 °C / 93 F.
(-) 3: The average temperature for the upper side is 41.7 °C / 107 F, compared to the average of 33.9 °C / 93 F for the class Gaming.
(±) The palmrests and touchpad can get very hot to the touch with a maximum of 38 °C / 100.4 F.
(-) The average temperature of the palmrest area of similar devices was 28.9 °C / 84 F (-9.1 °C / -16.4 F).
Lenovo LOQ 15IRX9
Intel Core i5-13450HX, NVIDIA GeForce RTX 4060 Laptop GPU
SCHENKER XMG Core 15 (M24)
AMD Ryzen 7 8845HS, NVIDIA GeForce RTX 4060 Laptop GPU
Gigabyte G6X 9KG (2024)
Intel Core i7-13650HX, NVIDIA GeForce RTX 4060 Laptop GPU
HP Victus 16 (2024)
Intel Core i7-14700HX, NVIDIA GeForce RTX 4060 Laptop GPU
Dell G16, i7-13650HX, RTX 4060
Intel Core i7-13650HX, NVIDIA GeForce RTX 4060 Laptop GPU
Heat
-8%
9%
15%
-3%
Maximum Upper Side *
47
52
-11%
41
13%
50
-6%
49
-4%
Maximum Bottom *
58
61
-5%
43
26%
50
14%
58
-0%
Idle Upper Side *
32
35
-9%
32
-0%
25
22%
35
-9%
Idle Bottom *
36
39
-8%
37
-3%
26
28%
35
3%

* ... smaller is better

Högtalare

Stereohögtalarna ger överlag en mycket acceptabel ljudbild. Lite mer bas hade dock inte varit fel.

dB(A) 0102030405060708090Deep BassMiddle BassHigh BassLower RangeMidsHigher MidsLower HighsMid HighsUpper HighsSuper Highs2045.6392537.135.83144.251.34031.134.45030.931.36326.234.58018.529.2100193612517.343.716019.147.920020.75225016.458.33151458.440012.861.750012.566.66301267.880011.767.3100011.966.9125012.163.7160012.263.7200012.464.9250013.164315013.160400013.358.5500013.166.3630013.271.8800013.677.11000013.272.71250012.768.81600012.167.4SPL25.180.7N0.747.7median 13.1median 64Delta1.85.325.924.825.924.123.424.120.628.220.62616.52629.822.129.827.823.827.818.112.318.125.719.725.731.514.931.547114758.316.558.365.914.765.96812.46867.510.967.5739.27372.77.872.7688.76866.68.666.669.1969.168.69.868.665.610.165.663.81163.866.211.266.264.111.764.163.411.863.464.41264.462.912.162.962.112.162.163.412.563.458.611.158.679.12379.147.90.447.9median 64.4median 11.2median 64.44.61.94.6hearing rangehide median Pink NoiseLenovo LOQ 15IRX9SCHENKER XMG Core 15 (M24)
Frequency diagram (checkboxes can be checked and unchecked to compare devices)
Lenovo LOQ 15IRX9 audio analysis

(±) | speaker loudness is average but good (81 dB)
Bass 100 - 315 Hz
(±) | reduced bass - on average 14.6% lower than median
(±) | linearity of bass is average (9.6% delta to prev. frequency)
Mids 400 - 2000 Hz
(+) | balanced mids - only 2.1% away from median
(+) | mids are linear (3.6% delta to prev. frequency)
Highs 2 - 16 kHz
(±) | higher highs - on average 5.9% higher than median
(±) | linearity of highs is average (8.2% delta to prev. frequency)
Overall 100 - 16.000 Hz
(+) | overall sound is linear (14.7% difference to median)
Compared to same class
» 27% of all tested devices in this class were better, 7% similar, 66% worse
» The best had a delta of 6%, average was 18%, worst was 132%
Compared to all devices tested
» 17% of all tested devices were better, 4% similar, 79% worse
» The best had a delta of 4%, average was 25%, worst was 134%

SCHENKER XMG Core 15 (M24) audio analysis

(±) | speaker loudness is average but good (79.12 dB)
Bass 100 - 315 Hz
(-) | nearly no bass - on average 16.7% lower than median
(-) | bass is not linear (15.7% delta to prev. frequency)
Mids 400 - 2000 Hz
(+) | balanced mids - only 4.5% away from median
(+) | mids are linear (4.4% delta to prev. frequency)
Highs 2 - 16 kHz
(+) | balanced highs - only 1% away from median
(+) | highs are linear (2.7% delta to prev. frequency)
Overall 100 - 16.000 Hz
(+) | overall sound is linear (13.7% difference to median)
Compared to same class
» 20% of all tested devices in this class were better, 6% similar, 74% worse
» The best had a delta of 6%, average was 18%, worst was 132%
Compared to all devices tested
» 13% of all tested devices were better, 3% similar, 84% worse
» The best had a delta of 4%, average was 25%, worst was 134%

Strömförbrukning

Dess strömförbrukning är ganska normal för den installerade hårdvaran. Cyberpunk och stresstesterna kördes med relativt konstant strömförbrukning. Nätaggregatet är precis tillräckligt kraftfullt med sina 230 watt.

Strömförbrukning
Av/Standbydarklight 0.1 / 0.1 Watt
Låg belastningdarkmidlight 13 / 18 / 24 Watt
Hög belastning midlight 85 / 232 Watt
 color bar
Förklaring: min: dark, med: mid, max: light        Metrahit Energy
Lenovo LOQ 15IRX9
Intel Core i5-13450HX, NVIDIA GeForce RTX 4060 Laptop GPU
SCHENKER XMG Core 15 (M24)
AMD Ryzen 7 8845HS, NVIDIA GeForce RTX 4060 Laptop GPU
Gigabyte G6X 9KG (2024)
Intel Core i7-13650HX, NVIDIA GeForce RTX 4060 Laptop GPU
HP Victus 16 (2024)
Intel Core i7-14700HX, NVIDIA GeForce RTX 4060 Laptop GPU
Dell G16, i7-13650HX, RTX 4060
Intel Core i7-13650HX, NVIDIA GeForce RTX 4060 Laptop GPU
Power Consumption
20%
2%
1%
6%
Idle Minimum *
13
9.3
28%
12
8%
9
31%
11
15%
Idle Average *
18
12.9
28%
13
28%
15
17%
14.8
18%
Idle Maximum *
24
12.8
47%
27
-13%
23
4%
16.8
30%
Load Average *
85
105
-24%
123
-45%
103.7
-22%
Cyberpunk 2077 ultra *
155.7
Cyberpunk 2077 ultra external monitor *
150.9
Load Maximum *
232
286
-23%
210
9%
241
-4%
255
-10%
Witcher 3 ultra *
167
167.8
143.7
185

* ... smaller is better

Power consumption Cyberpunk 2077 / stress test

0153045607590105120135150165180195210Tooltip
Lenovo LOQ 15IRX9; 1280x720 Prime95 28.10 and Furmark 1.25: Ø161 (150.5-213)
Lenovo LOQ 15IRX9; Idle 150cd/m2: Ø18.1 (13.4-24.2)
Lenovo LOQ 15IRX9; Cyberpunk 2077 FHD ultra no FSR 150cd: Ø155.7 (152.6-163.6)

Power consumption with external monitor

0102030405060708090100110120130140150160Tooltip
Lenovo LOQ 15IRX9; Prime95 V2810 Stress (external Monitor): Ø108.7 (86.1-163.3)
Lenovo LOQ 15IRX9; Cinebench R23 Multi (external Monitor): Ø149.6 (64.9-166.3)
Lenovo LOQ 15IRX9; 1280x720 FurMark 1.19 GPU Stress Test (external Monitor): Ø125.4 (117.2-140.8)
Lenovo LOQ 15IRX9; Idle 1min (external Monitor): Ø19.2 (10.7-37)
Lenovo LOQ 15IRX9; Cyberpunk 2077 FHD ultra no FSR (external Monitor): Ø150.9 (147.9-154)

Körtider

Den 15,6-tums stora enheten klarade en drifttid på 5:20 timmar i vårt praktiska WLAN-test (kartläggning av belastningen när du besöker webbplatser med hjälp av ett skript) - inte ett enastående värde. Den relativt låga batterikapaciteten (60 Wh) blir uppenbar här.

Batteritid
WiFi Websurfing (Edge 126)
5tim 20min
Battery Runtime - WiFi Websurfing
SCHENKER XMG Core 15 (M24)
R7 8845HS, NVIDIA GeForce RTX 4060 Laptop GPU, 99.8 Wh
889 min +178%
HP Victus 16 (2024)
i7-14700HX, NVIDIA GeForce RTX 4060 Laptop GPU, 83 Wh
511 min +60%
Gigabyte G6X 9KG (2024)
i7-13650HX, NVIDIA GeForce RTX 4060 Laptop GPU, 73 Wh
474 min +48%
Dell G16, i7-13650HX, RTX 4060
i7-13650HX, NVIDIA GeForce RTX 4060 Laptop GPU, 86 Wh
378 min +18%
Average of class Gaming
  (85 - 889, n=154, last 2 years)
375 min +17%
Lenovo LOQ 15IRX9
i5-13450HX, NVIDIA GeForce RTX 4060 Laptop GPU, 60 Wh
320 min

För

+ matt FHD-skärm (144 Hz, G-Sync)
+ två SSD-platser (PCIe 4)
+ RAM-minne kan bytas ut/utökas
+ Strömförsörjning
+ GPU-överklockning via programvara

Emot

- högljudd under belastning
- värms upp mer än den genomsnittliga bärbara datorn
- inkonsekvent fläktkontroll
- ingen Thunderbolt 4/USB 4
- ingen SD-kortläsare

Omdöme - En solid budgetspelare

Lenovo LOQ 15IRX9, tillhandahållen av Lenovo Tyskland.

LOQ möjliggör FHD-spel vid höga till maximala inställningar - den Core i5-13450HX och GeForce RTX 4060 gör detta möjligt. På så sätt körs CPU och GPU med konsekvent höga klockfrekvenser. En PCIe 4 SSD (1 TB) säkerställer att laddningstiderna hålls korta.

Lenovos LOQ 15IRX9 är en prisvärd FHD-spelbärbar dator som lider av en eller två mindre brister.

Höga utsläpp kan sänkas till måttliga nivåer med hjälp av tyst läge - på bekostnad av den bärbara datorns prestanda. Dess fläktkontroll kan förbättras något: I viloläge körs fläktarna permanent eller pulserar, vilket är helt onödigt.

Du kommer att leta efter en 16:10-skärm förgäves, eftersom Lenovo har hållit fast vid ett bildförhållande på 16:9. Den installerade 15,6-tumspanelen (FHD, 144 Hz, G-Sync, sRGB) fungerar helt okej, men den skulle kunna vara lite ljusare. Den bärbara datorn erbjuder inte Thunderbolt 4 eller USB 4. Ändå: Dess USB-C-port (USB 3.2 Gen 2) stöder Power Delivery och Display ALT-läget. Enhetens batteritid kommer inte att slå några världsrekord.

Ett alternativ kan vara Gigabyte G6X 9KG. Den har en något mer kraftfull CPU, en 16-tums 16:10-skärm samt bättre körtider. När det gäller färgrymdstäckning ligger den efter LOQ.

Pris och tillgänglighet

I skrivande stund kan vår konfiguration av Lenovo LOQ 15IRX9 köpas via Amazon för 1 279 USD.

Observera: Vi har nyligen uppdaterat vårt betygssystem och resultaten från version 8 är inte jämförbara med resultaten från version 7. Mer information finns tillgänglig här .

Lenovo LOQ 15IRX9 - 07/08/2024 v8
Sascha Mölck

Design
74 / 98 → 76%
Tangentbord
85%
Mus
86%
Anslutningar
58 / 80 → 72%
Vikt
60 / 10-68 → 87%
Batteri
65 / 95 → 69%
Skärm
82%
Spelprestanda
80%
Programprestanda
82%
AI Performance
93%
Temperatur
79 / 95 → 83%
Ljudnivå
64 / 90 → 71%
Audio
80%
Camera
39 / 75 → 52%
Medel
65%
79%
Gaming - Vägt medel
CO2 Emissions
No Data
Materials
50%
Packaging
50%
Power Use
85.6%
Repairability
80%
Software Updates
22.3%
Recycle Logo Total Sustainability Score: 48%

Transparency

The selection of devices to be reviewed is made by our editorial team. The test sample was provided to the author as a loan by the manufacturer or retailer for the purpose of this review. The lender had no influence on this review, nor did the manufacturer receive a copy of this review before publication. There was no obligation to publish this review. We never accept compensation or payment in return for our reviews. As an independent media company, Notebookcheck is not subjected to the authority of manufacturers, retailers or publishers.

This is how Notebookcheck is testing

Every year, Notebookcheck independently reviews hundreds of laptops and smartphones using standardized procedures to ensure that all results are comparable. We have continuously developed our test methods for around 20 years and set industry standards in the process. In our test labs, high-quality measuring equipment is utilized by experienced technicians and editors. These tests involve a multi-stage validation process. Our complex rating system is based on hundreds of well-founded measurements and benchmarks, which maintains objectivity. Further information on our test methods can be found here.
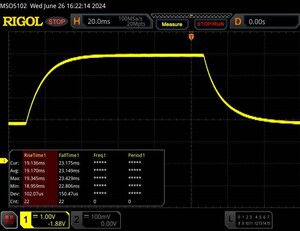
Price comparison

Please share our article, every link counts!
Mail Logo
> Bärbara datorer, laptops - tester och nyheter > Tester > Lenovo LOQ 15 recension: FHD-spelbärbar dator med en RTX 4060 från cirka 1 000 US-dollar
Sascha Mölck, 2024-07-11 (Update: 2024-07-11)