Notebookcheck Logo
Schenker Key 17 Pro M24

SCHENKER Key 17 Pro (M24) recension - ultrasnabba dubbla Thunderbolt 5-anslutningar och i9-14900HX-kraft

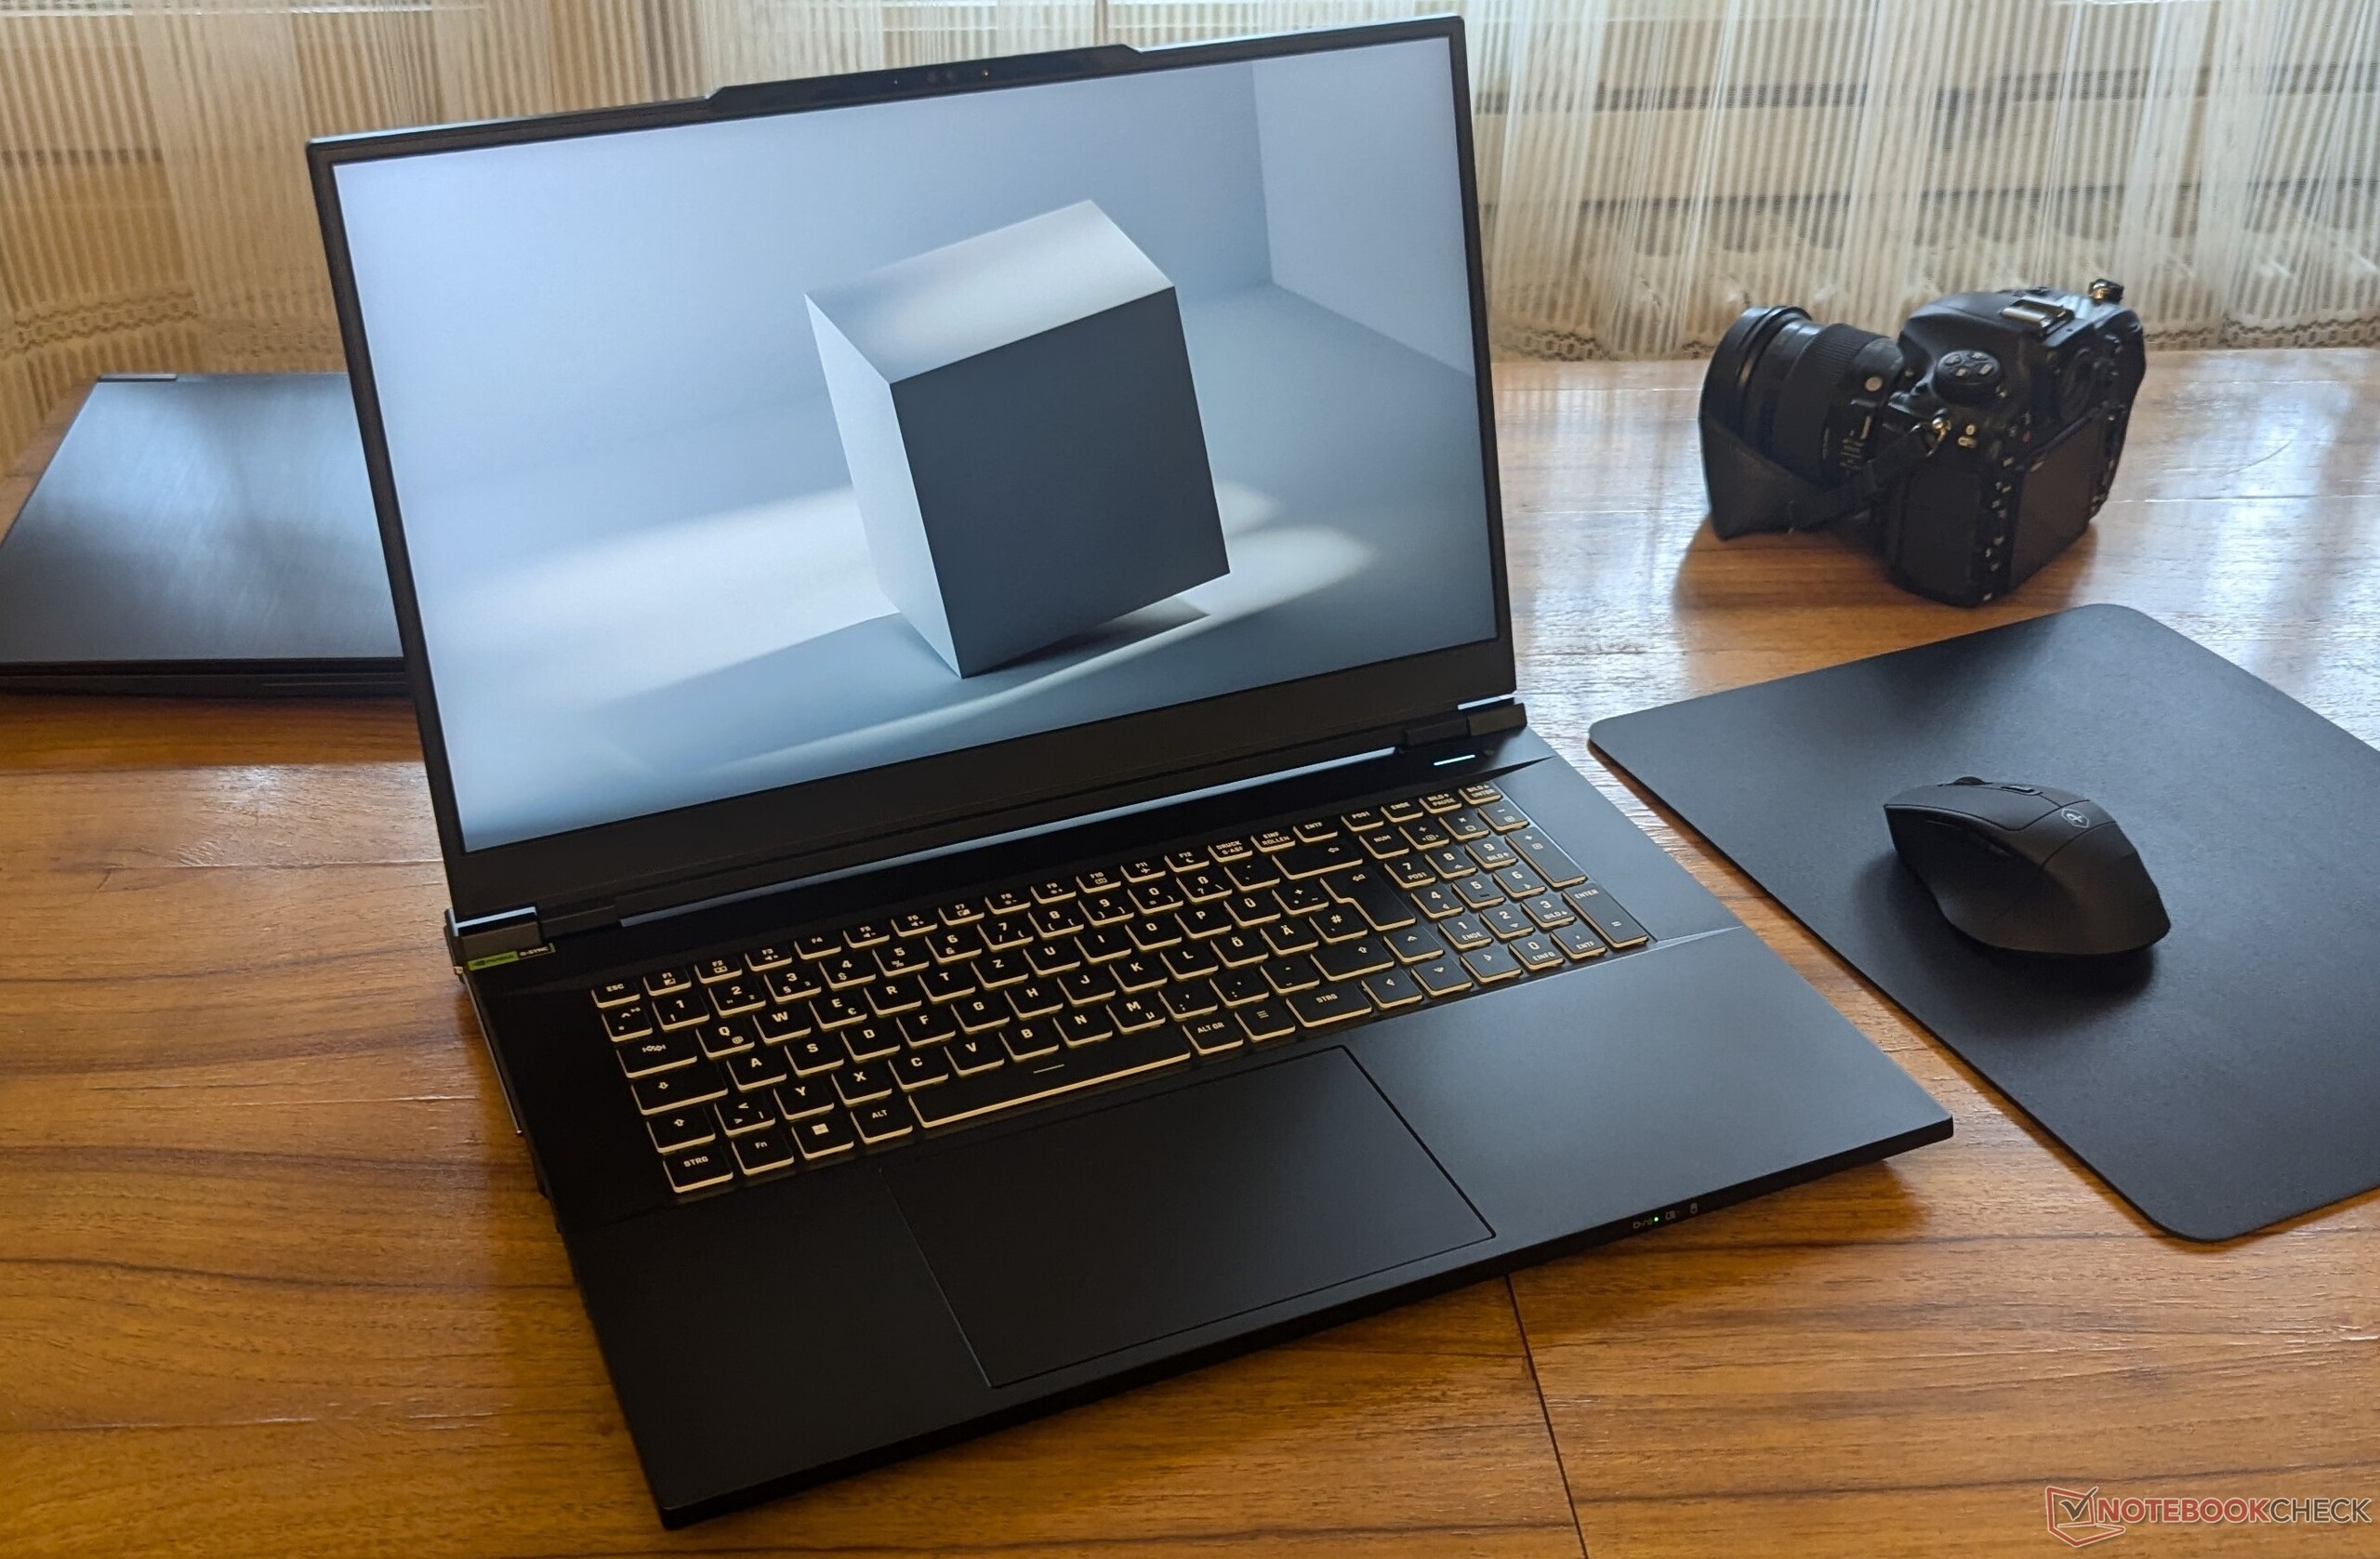
Schenker KEY 17 Pro är en av de första avancerade mobila arbetsstationerna som har dubbla Thunderbolt 5-portar. Den innehåller toppkomponenter som en uppgraderad Intel i9-14900HX-processor kompletterad med Nvidias RTX 4090, samt den snabbaste Wi-Fi 7-anslutningen.
Bogdan Solca, 👁 Bogdan Solca (översatt av DeepL / Ninh Duy) Published 🇺🇸 🇫🇷 ...
Gaming Geforce GPU Intel Laptop / Notebook Nvidia Raptor Lake Thunderbolt Workstation

Utlåtande

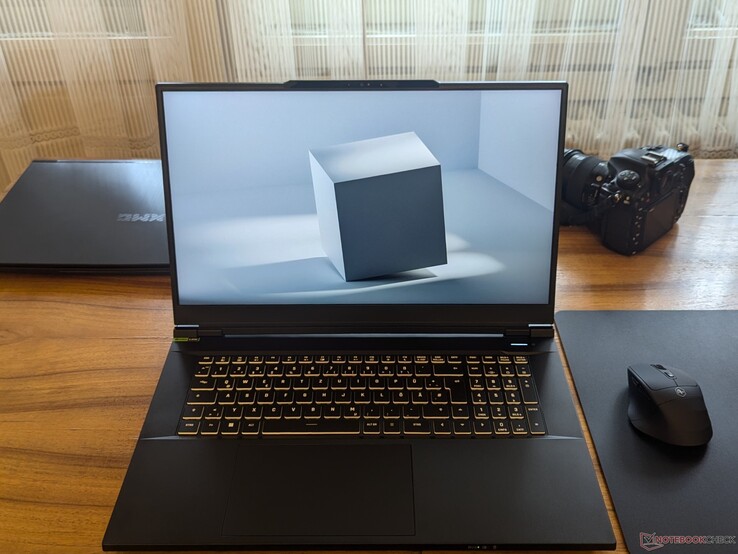
Schenkers 2024-uppdatering för de bärbara datorerna i arbetsstationsklassen Key 17 Pro kommer med en CPU-uppgradering och några imponerande tillägg. Den senaste iterationen av arbetsstationen behåller samma Clevo-chassi som förra årets modell, men ersätter i9-13900HX med den snabbare i9-14900HXsom för närvarande fortfarande är den snabbaste mobila lösningen från Intel. Schenker har också lagt till Wi-Fi 7 stöd och två Thunderbolt 5 portar, var och en med 80 Gbps bandbredd, och dessa funktioner kan enkelt läggas till proffsen.

Även om RAM-minnet och lagringsutrymmet är detsamma som i den tidigare varianten, ger de fortfarande bra prestanda. Den nya RTX 4090 mobil GPU är alltid ett bra tillskott, men våra tester visar att Schenkers implementering inte är den bästa där ute. Sammantaget är prestandan fantastisk.

På nackdelarna har Schenker inte förbättrat kylsystemet, som fortfarande är bullrigt, särskilt i prestandaprofilen, även vid medelbelastning. Kontrollcenter-appen möjliggör anpassade fläktkurvor, men det måste ställas in per applikation. En nedgradering från förra årets version är batteriets drifttid som verkar ha minskat avsevärt, trots att det har samma kapacitet på 99 Wh. På grund av detta kan Key 17 Pro M24 användas som en stationär ersättare eller på sin höjd i hybrida arbetsflöden. 4K IPS-skärmen är tillräckligt ljusstark, men kontrasten och svartnivån verkar låg för den här prispunkten, plus att den medföljande 1080p-webbkameran är ganska medioker.

För

+ Robust chassi i aluminium
+ Snabb i9-14900HX-processor och Nvidia RTX 4090 GPU
+ Snabbt RAM-minne och lagringsutrymme, med möjlighet till uppgraderingar
+ Två Thunderbolt 5-portar
+ Wi-Fi 7-anslutning

Emot

- Bullrigt kylsystem med ganska höga temperaturer vid full belastning
- Låg batteritid
- Prestanda på batteri reducerad med mer än 66%
- Displaykontrasten kunde vara bättre
- Medelmåttig 1080p webbkamera

Pris och tillgänglighet

Den testade konfigurationen kan beställas direkt från Bestware för 4273 Euro.

Jämförelse av möjliga alternativ

Image
Model / Review
Geizhals
Weight
Height
Display
1.
85.1%
SCHENKER Key 17 Pro (M24)
Intel Core i9-14900HX ⎘
NVIDIA GeForce RTX 4090 Laptop GPU ⎘
32 GB Minne, 1024 GB SSD
Listenpreis 4273€3.4 kg24.9 mm17.30"
3840x2160
255 PPI
IPS
2.
87.2% v7 (old)
Asus ROG Strix Scar 17 G733PYV-LL053X
AMD Ryzen 9 7945HX3D ⎘
NVIDIA GeForce RTX 4090 Laptop GPU ⎘
32 GB Minne, 1024 GB SSD
Geizhals Suche2.9 kg28.3 mm17.30"
2560x1440
170 PPI
IPS
3.
85.2% v7 (old)
Eurocom Raptor X17 Core i9-14900HX
Intel Core i9-14900HX ⎘
NVIDIA GeForce RTX 4090 Laptop GPU ⎘
32 GB Minne, 2048 GB SSD
Listenpreis 4500 USD3.4 kg24.9 mm17.30"
3840x2160
255 PPI
IPS
4.
85.9%
HP ZBook Fury 16 G11
Intel Core i9-14900HX ⎘
NVIDIA RTX 3500 Ada Generation Laptop GPU ⎘
64 GB Minne, 1024 GB SSD
Bestpreis 3840.13€ Cyclotron
2. 3849€ Jacob Elektronik direkt
3. 3850€ HEINZSOFT
2.6 kg28.5 mm16.00"
3840x2400
283 PPI
IPS
5.
86% v7 (old)
Aorus 17X AZF
Aorus 17X AZF
Intel Core i9-13900HX ⎘
NVIDIA GeForce RTX 4090 Laptop GPU ⎘
32 GB Minne, 1024 GB SSD
Listenpreis 3800 EUR
Geizhals Suche
2.9 kg21.8 mm17.30"
2560x1440
170 PPI
IPS

Schenker marknadsför Key 17 Pro (M24) som en avancerad arbetsstation, så våra tester kommer att återspegla detta. Tidigare har vi granskat E23-versionen som en bärbar speldator, men med uppgraderingen till i9-14900HX CPU rekommenderas nu M24-varianten som en arbetsstation. Vi kunde dock inte bara ställa den här mot arbetsstationer, eftersom Key 17 Pro drivs av RTX 4090 GPU och inte en professionell GPU. Som sådan inkluderar de valda konkurrenterna bärbara speldatorer med en RTX 4090 och liknande eller samma processorer.

Chassit verkar vara oförändrat från den tidigare iterationen, med samma Clevo-barebone. Men förutom den kraftfullare processorn introducerar M24 några viktiga uppgraderingar som Wi-Fi 7 och två Thunderbolt 5-anslutningar. Med den uppgraderade CPU:n och de nya tilläggen har batteriet i M24 tyvärr fått sig en törn och håller inte lika länge som E23-batteriet.

Specifikationer

SCHENKER Key 17 Pro (M24)
Processor
Intel Core i9-14900HX 24 x 1.6 - 5.8 GHz, Raptor Lake-HX Refresh
Grafikkort
NVIDIA GeForce RTX 4090 Laptop GPU - 15.6 GB VRAM, 175 W TDP ( including 25 W Dynamic Boost), 566.03, MUX switch
Minne
32 GB 
, DDR5-5600
Skärm
17.30 tum 16:9, 3840 x 2160 pixlar 255 PPI, BOE, IPS, glansig: nej, 144 Hz, Adaptive Sync
Moderkort
Intel HM770 (Raptor Lake-S PCH)
Hårddisk
Samsung 990 Pro 1 TB, 1024 GB 
Ljudkort
Creative Sound Blaster Recon3Di @ Intel Panther Point PCH - High Definition Audio Controller
Anslutningar
2 USB 3.1 Gen2, 2 USB 4.0 40 Gbps, 2 Thunderbolt, USB-C Power Delivery (PD), 1 HDMI, 3 DisplayPort, 1 Kensingtonlås, Ljudanslutningar: 2-in-1 jack
Nätverk
Intel/Killer E3100X 2.5 Gigabit Ethernet Controller (10/100/1000/2500MBit/s), Intel Wi-Fi 7 BE200 320MHz (a/b/g/n = Wi-Fi 4/ac = Wi-Fi 5/ax = Wi-Fi 6/ Wi-Fi 6E 6 GHz be = Wi-Fi 7), Bluetooth 5.3
Storlek
höjd x bredd x djup (i mm) 24.9 x 396 x 278
Batteri
99 Wh Litiumpolymer
Operativsystem
Microsoft Windows 11 Home
Camera
Webbkamera: 1080p
Övrigt
Högtalare: stereo, Tangentbordsbelysning: ja, 36 Månader Garanti, dual Thunderbolt 5 ports
Vikt
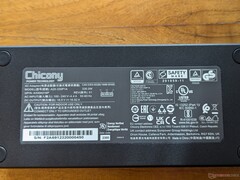
3.4 kg, Strömförsörjning: 1.178 kg
Pris
4273 Kr
Note: The manufacturer may use components from different suppliers including display panels, drives or memory sticks with similar specifications.


Fodral och anslutningsmöjligheter

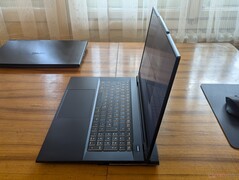
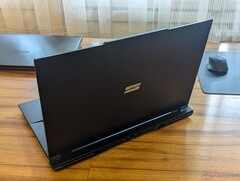
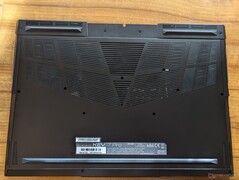
Systemet är byggt på ett barebone från Clevo, som också användes med den bärbara Eurocom-dator som vi inkluderade i prestandajämförelsen. Tack vare en lätt avtagbar bakplatta kan RAM och lagring uppgraderas när det behövs.

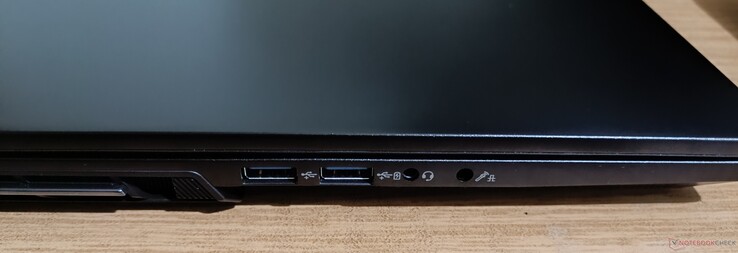
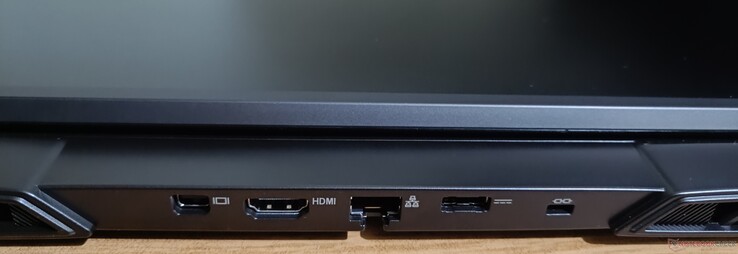
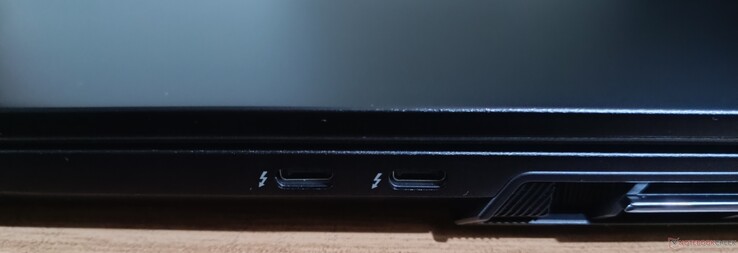
När det gäller anslutningsmöjligheter imponerar Key 17 Pro med ett gediget framtidssäkert portval och uppdaterade internethastigheter. Detta är en av de få utvalda modeller som erbjuder två Thunderbolt 5-anslutningar på höger sida, var och en med full bandbredd på 80 Gbps. Tyvärr är alternativet med 120 Gbps boost inte tillgängligt, eftersom Nvidia RTX 4090 och Intels iGPU är begränsade till DP 1.4 / HDMI 2.1-hastigheter. Ändå kan den dubbla 80 Gbps-bandbredden utnyttjas väl med PCIe 5.0 externa SSD-enheter. På vänster sida finns två USB-A 3.2 Gen 2-portar (endast en med strömförsörjning), tillsammans med mikrofoninmatning eller S/PDIF optisk och hörlursuttag. På baksidan finns en strömkontakt, LAN-uttag och HDMI 2.1 med full bandbredd samt mini DisplayPort 1.4a videoutgångar.

Internetanslutningen är snabb, med en 5G-anslutning som når 900+ Mb/s, medan 6G-hastigheterna är bland de högsta vi har testat med upp till 1,7 Gb/s i mottagarläge.
Anslutningar på vänster sida: två USB-A 3.2 Gen 2 (en strömförsörjd), hörlursutgång + mikrofoningång S/PDIF-ljuduttag
Bakre anslutningar: mini DisplayPort 1.4a, HDMI 2.1, 2,5 GbE-uttag, poer-uttag, Kensington-lås
Anslutningar på höger sida: två Thunderbolt 5-portar

Jämförelse av storlek

395 mm 282.1 mm 28.3 mm 2.9 kg396 mm 278 mm 24.9 mm 3.4 kg396 mm 278 mm 24.9 mm 3.4 kg396 mm 293 mm 21.8 mm 2.9 kg363 mm 250 mm 28.5 mm 2.6 kg297 mm 210 mm 1 mm 5.7 g
Networking
iperf3 transmit AXE11000
Aorus 17X AZF
Intel Wi-Fi 6E AX210
1456 (1068min - 1561max) MBit/s +59%
Average Intel Wi-Fi 7 BE200 320MHz
  (469 - 1634, n=17)
1183 MBit/s +29%
Average of class Workstation
  (521 - 1838, n=27, last 2 years)
1127 MBit/s +23%
SCHENKER Key 17 Pro (M24)
Intel Wi-Fi 7 BE200 320MHz
916 (448min - 965max) MBit/s
HP ZBook Fury 16 G11
 
878 (829min - 937max) MBit/s -4%
Eurocom Raptor X17 Core i9-14900HX
Intel Wi-Fi 6E AX211
793 (386min - 871max) MBit/s -13%
iperf3 receive AXE11000
Aorus 17X AZF
Intel Wi-Fi 6E AX210
1619 (1579min - 1691max) MBit/s +70%
Average of class Workstation
  (845 - 1777, n=27, last 2 years)
1391 MBit/s +46%
Average Intel Wi-Fi 7 BE200 320MHz
  (838 - 1701, n=17)
1356 MBit/s +43%
Eurocom Raptor X17 Core i9-14900HX
Intel Wi-Fi 6E AX211
1214 (1011min - 1285max) MBit/s +28%
SCHENKER Key 17 Pro (M24)
Intel Wi-Fi 7 BE200 320MHz
951 (473min - 961max) MBit/s
HP ZBook Fury 16 G11
 
852 (750min - 875max) MBit/s -10%
iperf3 transmit AXE11000 6GHz
SCHENKER Key 17 Pro (M24)
Intel Wi-Fi 7 BE200 320MHz
1634 (812min - 1725max) MBit/s
HP ZBook Fury 16 G11
 
1505 (760min - 1591max) MBit/s -8%
Average Intel Wi-Fi 7 BE200 320MHz
  (943 - 1646, n=13)
1383 MBit/s -15%
Average of class Workstation
  (623 - 1634, n=23, last 2 years)
1211 MBit/s -26%
Eurocom Raptor X17 Core i9-14900HX
Intel Wi-Fi 6E AX211
691 (640min - 779max) MBit/s -58%
iperf3 receive AXE11000 6GHz
SCHENKER Key 17 Pro (M24)
Intel Wi-Fi 7 BE200 320MHz
1714 (853min - 1741max) MBit/s
HP ZBook Fury 16 G11
 
1599 (1565min - 1622max) MBit/s -7%
Average of class Workstation
  (1106 - 1774, n=23, last 2 years)
1535 MBit/s -10%
Average Intel Wi-Fi 7 BE200 320MHz
  (1149 - 1770, n=13)
1526 MBit/s -11%
Eurocom Raptor X17 Core i9-14900HX
Intel Wi-Fi 6E AX211
1227 (1158min - 1258max) MBit/s -28%
050100150200250300350400450500550600650700750800850900950100010501100115012001250130013501400145015001550160016501700Tooltip
SCHENKER Key 17 Pro (M24) Intel Wi-Fi 7 BE200 320MHz; iperf3 transmit AXE11000 6GHz; iperf 3.1.3: Ø1607 (812-1725)
Eurocom Raptor X17 Core i9-14900HX Intel Wi-Fi 6E AX211; iperf3 transmit AXE11000 6GHz; iperf 3.1.3: Ø691 (640-779)
HP ZBook Fury 16 G11  ; iperf3 transmit AXE11000 6GHz; iperf 3.1.3: Ø1480 (760-1591)
SCHENKER Key 17 Pro (M24) Intel Wi-Fi 7 BE200 320MHz; iperf3 receive AXE11000 6GHz; iperf 3.1.3: Ø1685 (853-1741)
Eurocom Raptor X17 Core i9-14900HX Intel Wi-Fi 6E AX211; iperf3 receive AXE11000 6GHz; iperf 3.1.3: Ø1226 (1158-1258)
HP ZBook Fury 16 G11  ; iperf3 receive AXE11000 6GHz; iperf 3.1.3: Ø1598 (1565-1622)
SCHENKER Key 17 Pro (M24) Intel Wi-Fi 7 BE200 320MHz; iperf3 transmit AXE11000; iperf 3.1.3: Ø902 (448-965)
Eurocom Raptor X17 Core i9-14900HX Intel Wi-Fi 6E AX211; iperf3 transmit AXE11000; iperf 3.1.3: Ø780 (386-871)
HP ZBook Fury 16 G11  ; iperf3 transmit AXE11000; iperf 3.1.3: Ø878 (829-937)
Aorus 17X AZF Intel Wi-Fi 6E AX210; iperf3 transmit AXE11000; iperf 3.1.3: Ø1456 (1068-1561)
SCHENKER Key 17 Pro (M24) Intel Wi-Fi 7 BE200 320MHz; iperf3 receive AXE11000; iperf 3.1.3: Ø935 (473-961)
Eurocom Raptor X17 Core i9-14900HX Intel Wi-Fi 6E AX211; iperf3 receive AXE11000; iperf 3.1.3: Ø1213 (1011-1285)
HP ZBook Fury 16 G11  ; iperf3 receive AXE11000; iperf 3.1.3: Ø852 (750-875)
Aorus 17X AZF Intel Wi-Fi 6E AX210; iperf3 receive AXE11000; iperf 3.1.3: Ø1618 (1579-1691)
ColorChecker
5.5 ∆E
8 ∆E
7.8 ∆E
6.9 ∆E
8 ∆E
9.4 ∆E
7.5 ∆E
6 ∆E
11.3 ∆E
3.8 ∆E
14.8 ∆E
10.8 ∆E
7.3 ∆E
11.8 ∆E
9.3 ∆E
15.1 ∆E
12.9 ∆E
11.8 ∆E
3.4 ∆E
11.5 ∆E
13.6 ∆E
12.2 ∆E
9.6 ∆E
5.6 ∆E
ColorChecker SCHENKER Key 17 Pro (M24): 9.34 ∆E min: 3.43 - max: 15.07 ∆E

Inmatningsenheter

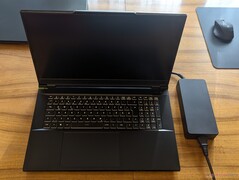
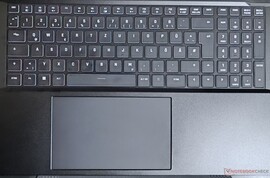
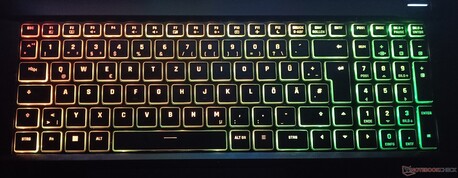
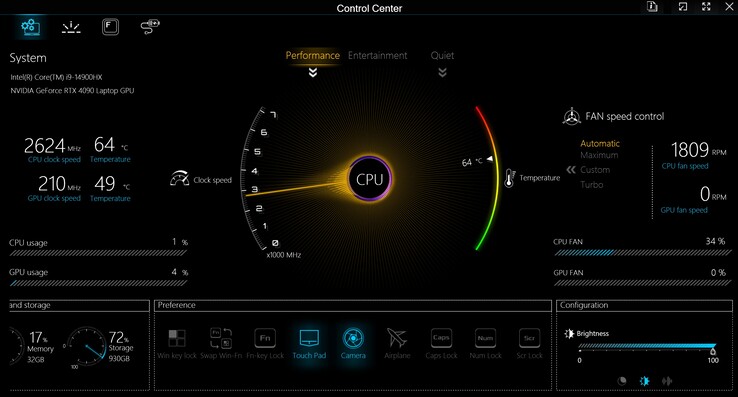
Eftersom det här är en bärbar 17-tumsdator har den ett fullstort tangentbord med numerisk knappsats och piltangenter. Chiclet-mekanismen tillåter medelhög rörelse, vilket ger en tillräckligt bekväm skrivupplevelse. Den testade modellen levererades med tysk layout, men Schenker erbjuder andra europeiska layouter och US EN som standard. Tangenterna har per-pixel RGB-belysning som kan anpassas i den speciella Control Center-appen.

Pekplattan är tillräckligt stor med sina 150 x 90 mm och känns silkeslen tack vare en innovativ yta som förbättrar glidningen. Den har också handflateigenkänning som hjälper till att förhindra oavsiktliga inmatningar när du vilar de nedre handflatorna på pekplattan.

Display

Den testade enheten är utrustad med en 3840 X 2160 IPS LCD-skärm tillverkad av BOE. Den har en maximal uppdatering på 144 Hz och stödjer G-SYNC. Det finns också en 2560 X 1440 240 Hz 300 nit-variant.

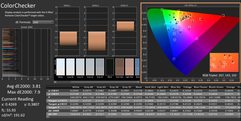
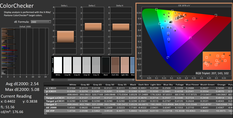
sRGB-färgåtergivningen är 99% som utlovat, men DCI-P3-färgåtergivningen är 93% istället för 99% som utlovats. På grund av den icke-glänsande beläggningen blir kontrasten något lidande, med något förhöjda svartnivåer på 0,54 cd/m². Den ljusstarkare skärmen kompenserar dock för den lägre kontrasten. Färgnoggrannheten är lite bristfällig och vi kunde minska dE till 2,54 från 3,81 i DCI-P3-färgskalan.

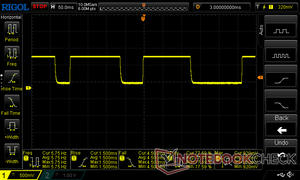
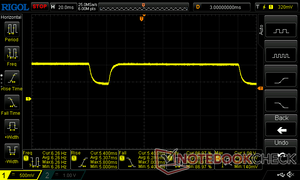
Svarstiderna är bra för allmän användning och innehållsskapande, men kan visa sig vara något långsamma för mer snabba skjutspel på 11,6 ms. PWM eller skärmflimmer upptäcktes inte.

503
cd/m²
499
cd/m²
519
cd/m²
496
cd/m²
548
cd/m²
500
cd/m²
491
cd/m²
517
cd/m²
472
cd/m²
Distribution av ljusstyrkan
BOE tested with X-Rite i1Pro 3
Max: 548 cd/m² (Nits) Medel: 505 cd/m² Minimum: 29 cd/m²
Distribution av ljusstyrkan: 86 %
Mitt på batteriet: 555 cd/m²
Kontrast: 1015:1 (Svärta: 0.54 cd/m²)
ΔE Color 3.81 | 0.5-29.43 Ø4.92, calibrated: 2.54
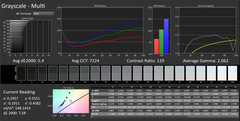
ΔE Greyscale 5.4 | 0.5-98 Ø5.2
84.33% AdobeRGB 1998 (Argyll 2.2.0 3D)
99.86% sRGB (Argyll 2.2.0 3D)
93.51% Display P3 (Argyll 2.2.0 3D)
Gamma: 2.062
SCHENKER Key 17 Pro (M24)
BOE, IPS, 3840x2160, 17.3", 144 Hz
Eurocom Raptor X17 Core i9-14900HX
BOE CQ NE173QUM-NY1, IPS, 3840x2160, 17.3", 144 Hz
HP ZBook Fury 16 G11
AUO87A8, IPS, 3840x2400, 16", 120 Hz
Aorus 17X AZF
BOE09F9, IPS, 2560x1440, 17.3", 240 Hz
Display
1%
2%
1%
Display P3 Coverage
93.51
95.9
3%
98.4
5%
96.7
3%
sRGB Coverage
99.86
99.8
0%
99.9
0%
99.9
0%
AdobeRGB 1998 Coverage
84.33
84.2
0%
86
2%
84.5
0%
Response Times
-59%
-19%
-45%
Response Time Grey 50% / Grey 80% *
11.593 ?(5.307, 6.286)
14.8 ?(7.2, 7.6)
-28%
11.4 ?(5.3, 6.1)
2%
14 ?(6.9, 7.1)
-21%
Response Time Black / White *
6 ?(1.5, 4.5)
11.4 ?(6.1, 5.3)
-90%
8.4 ?(4.7, 3.7)
-40%
10.1 ?(5.3, 4.8)
-68%
PWM Frequency
Screen
12%
18%
14%
Brightness middle
548
544.6
-1%
457.6
-16%
294
-46%
Brightness
505
507
0%
466
-8%
276
-45%
Brightness Distribution
86
77
-10%
83
-3%
90
5%
Black Level *
0.54
0.48
11%
0.43
20%
0.28
48%
Contrast
1015
1135
12%
1064
5%
1050
3%
Colorchecker dE 2000 *
3.81
3.38
11%
2.78
27%
2.81
26%
Colorchecker dE 2000 max. *
7.9
7.13
10%
5.53
30%
5.7
28%
Colorchecker dE 2000 calibrated *
2.54
1.03
59%
1.37
46%
0.86
66%
Greyscale dE 2000 *
5.4
4.3
20%
2
63%
3.4
37%
Gamma
2.062 107%
2.42 91%
2.28 96%
2.301 96%
CCT
7224 90%
7356 88%
6806 96%
7389 88%
Total Average (Program / Settings)
-15% / -0%
0% / 10%
-10% / 3%

* ... smaller is better

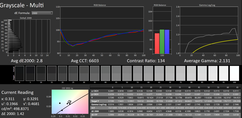
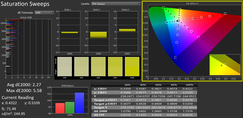
Standardgråskalan är förskjuten mot blått, vilket driver upp det genomsnittliga deltaE till 5,4. Kalibrering för DCI-P3 med X-Rite i1Pro 3-kolorimetern sänkte deltaE till 2,8, men blå, röda och i mindre grad violetta nyanser är fortfarande något felaktiga, så skärmen rekommenderas kanske inte för innehållsskapande som kräver mer exakta färger. Den resulterande kalibrerade ICM-profilen kan laddas ner gratis ovan.

Standard gråskala
Standard gråskala
Standard färgkontroll
Standardmättnad
Standardmättnad
Kalibrerad gråskala
Kalibrerad gråskala
Kalibrerad färgkontroll
Kalibrerad mättnad
Kalibrerad mättnad

Display Response Times

Display response times show how fast the screen is able to change from one color to the next. Slow response times can lead to afterimages and can cause moving objects to appear blurry (ghosting). Gamers of fast-paced 3D titles should pay special attention to fast response times.
       Response Time Black to White
6 ms ... rise ↗ and fall ↘ combined↗ 1.5 ms rise
↘ 4.5 ms fall
The screen shows very fast response rates in our tests and should be very well suited for fast-paced gaming.
In comparison, all tested devices range from 0.1 (minimum) to 240 (maximum) ms. » 15 % of all devices are better.
This means that the measured response time is better than the average of all tested devices (21 ms).
       Response Time 50% Grey to 80% Grey
11.593 ms ... rise ↗ and fall ↘ combined↗ 5.307 ms rise
↘ 6.286 ms fall
The screen shows good response rates in our tests, but may be too slow for competitive gamers.
In comparison, all tested devices range from 0.165 (minimum) to 636 (maximum) ms. » 21 % of all devices are better.
This means that the measured response time is better than the average of all tested devices (32.9 ms).

Screen Flickering / PWM (Pulse-Width Modulation)

To dim the screen, some notebooks will simply cycle the backlight on and off in rapid succession - a method called Pulse Width Modulation (PWM) . This cycling frequency should ideally be undetectable to the human eye. If said frequency is too low, users with sensitive eyes may experience strain or headaches or even notice the flickering altogether.
Screen flickering / PWM not detected

In comparison: 53 % of all tested devices do not use PWM to dim the display. If PWM was detected, an average of 8738 (minimum: 5 - maximum: 343500) Hz was measured.

0% ljusstyrka
0% ljusstyrka
50% ljusstyrka
50% ljusstyrka
100% ljusstyrka
100% ljusstyrka

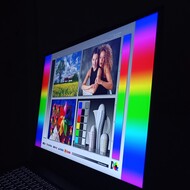
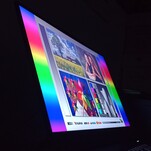
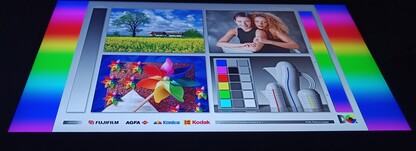
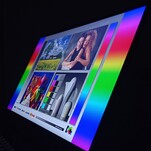
Betraktningsvinklarna är i linje med andra IPS-skärmar, vilket innebär att kontrasten börjar skifta utanför axeln. Ändå är IPS-skärmar fortfarande bättre i detta avseende jämfört med TN- och VA-paneler, som ändå inte är så populära med bärbara datorer idag.

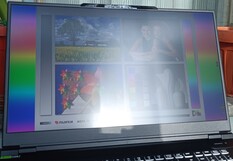
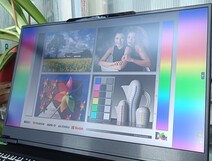
Bakgrundsbelysningens enhetlighet visar måttlig blödning i de övre hörnen. Tyvärr är den matta ytan inte till någon större hjälp vid användning utomhus eftersom den avsevärt sprider direkt eller indirekt ljus. Den maximala ljusstyrkan på 500+ nit hjälper dock till i indirekt solljus.

Enhetlig bakgrundsbelysning
Direkt solljus
Direkt solljus
Indirekt solljus
Indirekt solljus

Prestanda

Testförhållanden

Prestandatesterna gjordes med profilen "performance" som aktiverats i den speciella kontrollcenterapplikationen. Denna profil använder maximal TDP, boostklockor och fläkthastigheter.

Processor

Vår kombinerade CPU-prestandabedömning visar att Schenkers i9-14900HX-implementering är näst snabbast bland de testade Intel-modellerna, 4% efter Eurocom och 2% före Aorus. Som väntat ligger AMD Ryzen 9 7945HX3D betydligt före Intel-flocken med minst 10%, trots att single core-prestandan för det mesta är sämre än alla Intel-processorer. I Cinebench R15:s throttling-loop börjar Schenker i9-14900HX på ungefär samma nivå som Eurocom-implementationen, men sjunker under de två följande körningarna med 15% och är sedan den enda modellen som uppvisar stigande och sjunkande variationer under resten av loopen, vilket tyder på att turboläget inte är särskilt väl inställt för effektivitet.

CPU-prestanda på batteri minskar med minst 66% i Cinebench R23-testet och detta gäller även för GPU-prestanda.

CPU-information
CPU-information
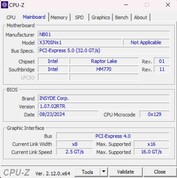
Information om moderkortet
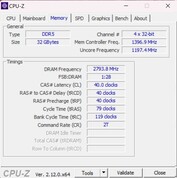
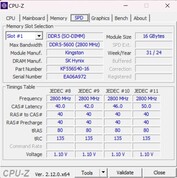
RAM-information
RAM-information
RAM-tider
RAM-tider
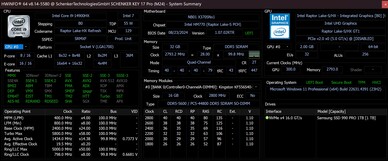
CPUZ-benchmark vs i9-13900K
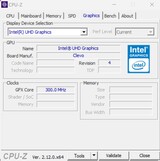
iGPU-information
iGPU-information
HWInfo
HWInfo
 

Cinebench R15 Multi Loop

02805608401120140016801960224025202800308033603640392042004480476050405320Tooltip
SCHENKER Key 17 Pro (M24) Intel Core i9-14900HX: Ø3786 (3488.57-4363)
Asus ROG Strix Scar 17 G733PYV-LL053X AMD Ryzen 9 7945HX3D: Ø5282 (5177.32-5599.89)
Eurocom Raptor X17 Core i9-14900HX Intel Core i9-14900HX: Ø4467 (4379.24-4648.46)
HP ZBook Fury 16 G11 Intel Core i9-14900HX: Ø3302 (2849.61-4173.19)
Aorus 17X AZF Intel Core i9-13900HX: Ø3258 (3190.05-4396.09)
CPU Performance Rating: Percent
Cinebench R23: Multi Core | Single Core
Cinebench R20: CPU (Multi Core) | CPU (Single Core)
Cinebench R15: CPU Multi 64Bit | CPU Single 64Bit
Blender: v2.79 BMW27 CPU
7-Zip 18.03: 7z b 4 | 7z b 4 -mmt1
Geekbench 6.3: Multi-Core | Single-Core
Geekbench 5.5: Multi-Core | Single-Core
HWBOT x265 Benchmark v2.2: 4k Preset
LibreOffice : 20 Documents To PDF
R Benchmark 2.5: Overall mean
CPU Performance Rating
Asus ROG Strix Scar 17 G733PYV-LL053X
AMD Ryzen 9 7945HX3D
84.4 pt
Average Intel Core i9-14900HX
 
79 pt
Eurocom Raptor X17 Core i9-14900HX
Intel Core i9-14900HX
76.8 pt
HP ZBook Fury 16 G11
Intel Core i9-14900HX
74.3 pt
SCHENKER Key 17 Pro (M24)
Intel Core i9-14900HX
73.8 pt
Aorus 17X AZF -2!
Intel Core i9-13900HX
72.1 pt
Average of class Workstation
 
56.8 pt
Cinebench R23 / Multi Core
Asus ROG Strix Scar 17 G733PYV-LL053X
AMD Ryzen 9 7945HX3D
32782 Points +20%
Eurocom Raptor X17 Core i9-14900HX
Intel Core i9-14900HX
31323 (28572.5min - 31322.6max) Points +15%
Average Intel Core i9-14900HX
  (17078 - 36249, n=34)
29130 Points +7%
Aorus 17X AZF
Intel Core i9-13900HX
27776 Points +2%
SCHENKER Key 17 Pro (M24)
Intel Core i9-14900HX
27338 Points
HP ZBook Fury 16 G11
Intel Core i9-14900HX
27130 (20747.4min - 27130max) Points -1%
Average of class Workstation
  (11026 - 27338, n=28, last 2 years)
17777 Points -35%
Cinebench R23 / Single Core
HP ZBook Fury 16 G11
Intel Core i9-14900HX
2178 Points +7%
Average Intel Core i9-14900HX
  (1720 - 2245, n=34)
2157 Points +6%
Eurocom Raptor X17 Core i9-14900HX
Intel Core i9-14900HX
2100 Points +4%
Aorus 17X AZF
Intel Core i9-13900HX
2097 Points +3%
SCHENKER Key 17 Pro (M24)
Intel Core i9-14900HX
2028 Points
Asus ROG Strix Scar 17 G733PYV-LL053X
AMD Ryzen 9 7945HX3D
1935 Points -5%
Average of class Workstation
  (1465 - 2178, n=28, last 2 years)
1835 Points -10%
Cinebench R20 / CPU (Multi Core)
Asus ROG Strix Scar 17 G733PYV-LL053X
AMD Ryzen 9 7945HX3D
13033 Points +27%
Eurocom Raptor X17 Core i9-14900HX
Intel Core i9-14900HX
11543 Points +12%
Average Intel Core i9-14900HX
  (6579 - 13832, n=34)
11084 Points +8%
Aorus 17X AZF
Intel Core i9-13900HX
10557 Points +3%
SCHENKER Key 17 Pro (M24)
Intel Core i9-14900HX
10276 Points
HP ZBook Fury 16 G11
Intel Core i9-14900HX
10069 Points -2%
Average of class Workstation
  (2990 - 10276, n=29, last 2 years)
6709 Points -35%
Cinebench R20 / CPU (Single Core)
HP ZBook Fury 16 G11
Intel Core i9-14900HX
827 Points +6%
Average Intel Core i9-14900HX
  (657 - 859, n=34)
826 Points +6%
Aorus 17X AZF
Intel Core i9-13900HX
810 Points +4%
Eurocom Raptor X17 Core i9-14900HX
Intel Core i9-14900HX
804 Points +3%
SCHENKER Key 17 Pro (M24)
Intel Core i9-14900HX
779 Points
Asus ROG Strix Scar 17 G733PYV-LL053X
AMD Ryzen 9 7945HX3D
755 Points -3%
Average of class Workstation
  (564 - 827, n=29, last 2 years)
706 Points -9%
Cinebench R15 / CPU Multi 64Bit
Asus ROG Strix Scar 17 G733PYV-LL053X
AMD Ryzen 9 7945HX3D
5600 (5177.32min - 5599.89max) Points +28%
Eurocom Raptor X17 Core i9-14900HX
Intel Core i9-14900HX
4648 (4379.24min - 4648.46max) Points +7%
Aorus 17X AZF
Intel Core i9-13900HX
4487 Points +3%
Average Intel Core i9-14900HX
  (3263 - 5589, n=35)
4462 Points +2%
SCHENKER Key 17 Pro (M24)
Intel Core i9-14900HX
4363 (3488.57min - 4363max) Points
HP ZBook Fury 16 G11
Intel Core i9-14900HX
4173 (2849.61min - 4173.19max) Points -4%
Average of class Workstation
  (1863 - 4363, n=28, last 2 years)
2780 Points -36%
Cinebench R15 / CPU Single 64Bit
Asus ROG Strix Scar 17 G733PYV-LL053X
AMD Ryzen 9 7945HX3D
311 Points +8%
Average Intel Core i9-14900HX
  (247 - 323, n=34)
306 Points +6%
Aorus 17X AZF
Intel Core i9-13900HX
304 Points +6%
Eurocom Raptor X17 Core i9-14900HX
Intel Core i9-14900HX
300 Points +4%
HP ZBook Fury 16 G11
Intel Core i9-14900HX
297 Points +3%
SCHENKER Key 17 Pro (M24)
Intel Core i9-14900HX
288 Points
Average of class Workstation
  (166.2 - 301, n=28, last 2 years)
265 Points -8%
Blender / v2.79 BMW27 CPU
Average of class Workstation
  (121 - 295, n=28, last 2 years)
200 Seconds * -65%
Aorus 17X AZF
Intel Core i9-13900HX
144 Seconds * -19%
HP ZBook Fury 16 G11
Intel Core i9-14900HX
134 Seconds * -11%
SCHENKER Key 17 Pro (M24)
Intel Core i9-14900HX
121 Seconds *
Average Intel Core i9-14900HX
  (91 - 206, n=34)
119.5 Seconds * +1%
Eurocom Raptor X17 Core i9-14900HX
Intel Core i9-14900HX
105 Seconds * +13%
Asus ROG Strix Scar 17 G733PYV-LL053X
AMD Ryzen 9 7945HX3D
95 Seconds * +21%
7-Zip 18.03 / 7z b 4
Asus ROG Strix Scar 17 G733PYV-LL053X
AMD Ryzen 9 7945HX3D
136201 MIPS +25%
Eurocom Raptor X17 Core i9-14900HX
Intel Core i9-14900HX
121036 MIPS +11%
Average Intel Core i9-14900HX
  (66769 - 136645, n=34)
112494 MIPS +3%
SCHENKER Key 17 Pro (M24)
Intel Core i9-14900HX
109204 MIPS
HP ZBook Fury 16 G11
Intel Core i9-14900HX
101027 MIPS -7%
Aorus 17X AZF
Intel Core i9-13900HX
93947 MIPS -14%
Average of class Workstation
  (47244 - 109204, n=28, last 2 years)
70695 MIPS -35%
7-Zip 18.03 / 7z b 4 -mmt1
Asus ROG Strix Scar 17 G733PYV-LL053X
AMD Ryzen 9 7945HX3D
7573 MIPS +10%
Aorus 17X AZF
Intel Core i9-13900HX
7177 MIPS +5%
Average Intel Core i9-14900HX
  (5452 - 7545, n=34)
7017 MIPS +2%
HP ZBook Fury 16 G11
Intel Core i9-14900HX
6960 MIPS +1%
SCHENKER Key 17 Pro (M24)
Intel Core i9-14900HX
6858 MIPS
Eurocom Raptor X17 Core i9-14900HX
Intel Core i9-14900HX
6658 MIPS -3%
Average of class Workstation
  (4981 - 6960, n=28, last 2 years)
6068 MIPS -12%
Geekbench 6.3 / Multi-Core
Eurocom Raptor X17 Core i9-14900HX
Intel Core i9-14900HX
18291 Points +11%
Average Intel Core i9-14900HX
  (13158 - 19665, n=34)
17369 Points +5%
Asus ROG Strix Scar 17 G733PYV-LL053X
AMD Ryzen 9 7945HX3D
16957 Points +3%
SCHENKER Key 17 Pro (M24)
Intel Core i9-14900HX
16482 Points
HP ZBook Fury 16 G11
Intel Core i9-14900HX
15279 Points -7%
Average of class Workstation
  (10200 - 16482, n=20, last 2 years)
13325 Points -19%
Geekbench 6.3 / Single-Core
Average Intel Core i9-14900HX
  (2419 - 3129, n=34)
2973 Points +14%
HP ZBook Fury 16 G11
Intel Core i9-14900HX
2924 Points +12%
Asus ROG Strix Scar 17 G733PYV-LL053X
AMD Ryzen 9 7945HX3D
2916 Points +12%
Eurocom Raptor X17 Core i9-14900HX
Intel Core i9-14900HX
2874 Points +10%
SCHENKER Key 17 Pro (M24)
Intel Core i9-14900HX
2611 Points
Average of class Workstation
  (2352 - 2949, n=20, last 2 years)
2603 Points 0%
Geekbench 5.5 / Multi-Core
Asus ROG Strix Scar 17 G733PYV-LL053X
AMD Ryzen 9 7945HX3D
19875 Points +3%
Average Intel Core i9-14900HX
  (8618 - 23194, n=34)
19540 Points +1%
SCHENKER Key 17 Pro (M24)
Intel Core i9-14900HX
19316 Points
Aorus 17X AZF
Intel Core i9-13900HX
19272 Points 0%
HP ZBook Fury 16 G11
Intel Core i9-14900HX
18407 Points -5%
Average of class Workstation
  (8050 - 19316, n=28, last 2 years)
13122 Points -32%
Eurocom Raptor X17 Core i9-14900HX
Intel Core i9-14900HX
8618 Points -55%
Geekbench 5.5 / Single-Core
Asus ROG Strix Scar 17 G733PYV-LL053X
AMD Ryzen 9 7945HX3D
2133 Points +11%
Average Intel Core i9-14900HX
  (1669 - 2210, n=34)
2092 Points +9%
Aorus 17X AZF
Intel Core i9-13900HX
2063 Points +7%
HP ZBook Fury 16 G11
Intel Core i9-14900HX
2030 Points +6%
SCHENKER Key 17 Pro (M24)
Intel Core i9-14900HX
1924 Points
Average of class Workstation
  (1474 - 2095, n=28, last 2 years)
1857 Points -3%
Eurocom Raptor X17 Core i9-14900HX
Intel Core i9-14900HX
1669 Points -13%
HWBOT x265 Benchmark v2.2 / 4k Preset
Asus ROG Strix Scar 17 G733PYV-LL053X
AMD Ryzen 9 7945HX3D
36.4 fps +34%
Eurocom Raptor X17 Core i9-14900HX
Intel Core i9-14900HX
33.8 fps +25%
Average Intel Core i9-14900HX
  (16.8 - 38.9, n=34)
29.7 fps +10%
SCHENKER Key 17 Pro (M24)
Intel Core i9-14900HX
27.1 fps
HP ZBook Fury 16 G11
Intel Core i9-14900HX
27 fps 0%
Aorus 17X AZF
Intel Core i9-13900HX
24.2 fps -11%
Average of class Workstation
  (12.7 - 27.1, n=28, last 2 years)
19.5 fps -28%
LibreOffice / 20 Documents To PDF
Average of class Workstation
  (36.5 - 95.2, n=28, last 2 years)
48.4 s * -4%
HP ZBook Fury 16 G11
Intel Core i9-14900HX
48 s * -3%
SCHENKER Key 17 Pro (M24)
Intel Core i9-14900HX
46.6 s *
Aorus 17X AZF
Intel Core i9-13900HX
44.7 s * +4%
Average Intel Core i9-14900HX
  (31.4 - 85.1, n=34)
43.4 s * +7%
Asus ROG Strix Scar 17 G733PYV-LL053X
AMD Ryzen 9 7945HX3D
39 s * +16%
Eurocom Raptor X17 Core i9-14900HX
Intel Core i9-14900HX
37.6 s * +19%
R Benchmark 2.5 / Overall mean
Average of class Workstation
  (0.3825 - 0.54, n=28, last 2 years)
0.4482 sec * -8%
SCHENKER Key 17 Pro (M24)
Intel Core i9-14900HX
0.4143 sec *
Asus ROG Strix Scar 17 G733PYV-LL053X
AMD Ryzen 9 7945HX3D
0.4127 sec * -0%
Aorus 17X AZF
Intel Core i9-13900HX
0.3935 sec * +5%
Eurocom Raptor X17 Core i9-14900HX
Intel Core i9-14900HX
0.3845 sec * +7%
Average Intel Core i9-14900HX
  (0.3604 - 0.4859, n=34)
0.3845 sec * +7%
HP ZBook Fury 16 G11
Intel Core i9-14900HX
0.3825 sec * +8%

* ... smaller is better

Cinebench R15 CPU Multi 64Bit
4363 Points
Cinebench R15 OpenGL 64Bit
279 fps
Cinebench R15 Ref. Match 64Bit
99.6 %
Cinebench R15 CPU Single 64Bit
288 Points
Cinebench R20 CPU (Multi Core)
10276 Points
Cinebench R20 CPU (Single Core)
779 Points
Cinebench R23 Single Core
2028 Points
Cinebench R23 Multi Core
27338 Points
Hjälp
Performance Rating
Asus ROG Strix Scar 17 G733PYV-LL053X
AMD Ryzen 9 7945HX3D, NVIDIA GeForce RTX 4090 Laptop GPU
97.1 pt
Eurocom Raptor X17 Core i9-14900HX
Intel Core i9-14900HX, NVIDIA GeForce RTX 4090 Laptop GPU
70.1 pt
Average Intel Core i9-14900HX
 
61.7 pt
SCHENKER Key 17 Pro (M24)
Intel Core i9-14900HX, NVIDIA GeForce RTX 4090 Laptop GPU
57.4 pt
Aorus 17X AZF
Intel Core i9-13900HX, NVIDIA GeForce RTX 4090 Laptop GPU
53.8 pt
HP ZBook Fury 16 G11
Intel Core i9-14900HX, NVIDIA RTX 3500 Ada Generation Laptop GPU
51 pt
Average of class Workstation
 
43.8 pt
AIDA64 / FP32 Ray-Trace
Asus ROG Strix Scar 17 G733PYV-LL053X
AMD Ryzen 9 7945HX3D, NVIDIA GeForce RTX 4090 Laptop GPU
53908 KRay/s +147%
Eurocom Raptor X17 Core i9-14900HX
Intel Core i9-14900HX, NVIDIA GeForce RTX 4090 Laptop GPU
26984 KRay/s +23%
Average Intel Core i9-14900HX
  (13098 - 33474, n=33)
25096 KRay/s +15%
SCHENKER Key 17 Pro (M24)
Intel Core i9-14900HX, NVIDIA GeForce RTX 4090 Laptop GPU
21858 KRay/s
HP ZBook Fury 16 G11
Intel Core i9-14900HX, NVIDIA RTX 3500 Ada Generation Laptop GPU
20058 KRay/s -8%
Aorus 17X AZF
Intel Core i9-13900HX, NVIDIA GeForce RTX 4090 Laptop GPU
19255 KRay/s -12%
Average of class Workstation
  (10658 - 25776, n=28, last 2 years)
17880 KRay/s -18%
AIDA64 / FPU Julia
Asus ROG Strix Scar 17 G733PYV-LL053X
AMD Ryzen 9 7945HX3D, NVIDIA GeForce RTX 4090 Laptop GPU
222115 Points +96%
Eurocom Raptor X17 Core i9-14900HX
Intel Core i9-14900HX, NVIDIA GeForce RTX 4090 Laptop GPU
138436 Points +22%
Average Intel Core i9-14900HX
  (67573 - 166040, n=33)
125765 Points +11%
SCHENKER Key 17 Pro (M24)
Intel Core i9-14900HX, NVIDIA GeForce RTX 4090 Laptop GPU
113270 Points
HP ZBook Fury 16 G11
Intel Core i9-14900HX, NVIDIA RTX 3500 Ada Generation Laptop GPU
101926 Points -10%
Aorus 17X AZF
Intel Core i9-13900HX, NVIDIA GeForce RTX 4090 Laptop GPU
95343 Points -16%
Average of class Workstation
  (56664 - 113270, n=28, last 2 years)
88964 Points -21%
AIDA64 / CPU SHA3
Asus ROG Strix Scar 17 G733PYV-LL053X
AMD Ryzen 9 7945HX3D, NVIDIA GeForce RTX 4090 Laptop GPU
9582 MB/s +71%
Eurocom Raptor X17 Core i9-14900HX
Intel Core i9-14900HX, NVIDIA GeForce RTX 4090 Laptop GPU
7026 MB/s +26%
Average Intel Core i9-14900HX
  (3589 - 7979, n=33)
6212 MB/s +11%
SCHENKER Key 17 Pro (M24)
Intel Core i9-14900HX, NVIDIA GeForce RTX 4090 Laptop GPU
5598 MB/s
HP ZBook Fury 16 G11
Intel Core i9-14900HX, NVIDIA RTX 3500 Ada Generation Laptop GPU
4972 MB/s -11%
Aorus 17X AZF
Intel Core i9-13900HX, NVIDIA GeForce RTX 4090 Laptop GPU
4880 MB/s -13%
Average of class Workstation
  (2598 - 5598, n=28, last 2 years)
3968 MB/s -29%
AIDA64 / CPU Queen
Asus ROG Strix Scar 17 G733PYV-LL053X
AMD Ryzen 9 7945HX3D, NVIDIA GeForce RTX 4090 Laptop GPU
181270 Points +31%
Eurocom Raptor X17 Core i9-14900HX
Intel Core i9-14900HX, NVIDIA GeForce RTX 4090 Laptop GPU
144137 Points +4%
Average Intel Core i9-14900HX
  (118405 - 148966, n=33)
138709 Points 0%
SCHENKER Key 17 Pro (M24)
Intel Core i9-14900HX, NVIDIA GeForce RTX 4090 Laptop GPU
138708 Points
HP ZBook Fury 16 G11
Intel Core i9-14900HX, NVIDIA RTX 3500 Ada Generation Laptop GPU
136844 Points -1%
Aorus 17X AZF
Intel Core i9-13900HX, NVIDIA GeForce RTX 4090 Laptop GPU
128728 Points -7%
Average of class Workstation
  (84022 - 144411, n=28, last 2 years)
107100 Points -23%
AIDA64 / FPU SinJulia
Asus ROG Strix Scar 17 G733PYV-LL053X
AMD Ryzen 9 7945HX3D, NVIDIA GeForce RTX 4090 Laptop GPU
29487 Points +112%
Eurocom Raptor X17 Core i9-14900HX
Intel Core i9-14900HX, NVIDIA GeForce RTX 4090 Laptop GPU
16403 Points +18%
Average Intel Core i9-14900HX
  (10475 - 18517, n=33)
15369 Points +11%
SCHENKER Key 17 Pro (M24)
Intel Core i9-14900HX, NVIDIA GeForce RTX 4090 Laptop GPU
13903 Points
HP ZBook Fury 16 G11
Intel Core i9-14900HX, NVIDIA RTX 3500 Ada Generation Laptop GPU
13331 Points -4%
Aorus 17X AZF
Intel Core i9-13900HX, NVIDIA GeForce RTX 4090 Laptop GPU
12939 Points -7%
Average of class Workstation
  (7906 - 14742, n=28, last 2 years)
11606 Points -17%
AIDA64 / FPU Mandel
Asus ROG Strix Scar 17 G733PYV-LL053X
AMD Ryzen 9 7945HX3D, NVIDIA GeForce RTX 4090 Laptop GPU
118813 Points +118%
Eurocom Raptor X17 Core i9-14900HX
Intel Core i9-14900HX, NVIDIA GeForce RTX 4090 Laptop GPU
67115 Points +23%
Average Intel Core i9-14900HX
  (32543 - 83662, n=33)
61872 Points +14%
SCHENKER Key 17 Pro (M24)
Intel Core i9-14900HX, NVIDIA GeForce RTX 4090 Laptop GPU
54428 Points
HP ZBook Fury 16 G11
Intel Core i9-14900HX, NVIDIA RTX 3500 Ada Generation Laptop GPU
50518 Points -7%
Aorus 17X AZF
Intel Core i9-13900HX, NVIDIA GeForce RTX 4090 Laptop GPU
47560 Points -13%
Average of class Workstation
  (27301 - 58181, n=28, last 2 years)
44611 Points -18%
AIDA64 / CPU AES
Asus ROG Strix Scar 17 G733PYV-LL053X
AMD Ryzen 9 7945HX3D, NVIDIA GeForce RTX 4090 Laptop GPU
328679 MB/s +209%
Eurocom Raptor X17 Core i9-14900HX
Intel Core i9-14900HX, NVIDIA GeForce RTX 4090 Laptop GPU
241777 MB/s +127%
Aorus 17X AZF
Intel Core i9-13900HX, NVIDIA GeForce RTX 4090 Laptop GPU
174819 MB/s +64%
Average Intel Core i9-14900HX
  (86964 - 241777, n=33)
137399 MB/s +29%
SCHENKER Key 17 Pro (M24)
Intel Core i9-14900HX, NVIDIA GeForce RTX 4090 Laptop GPU
106371 MB/s
HP ZBook Fury 16 G11
Intel Core i9-14900HX, NVIDIA RTX 3500 Ada Generation Laptop GPU
99014 MB/s -7%
Average of class Workstation
  (45568 - 128243, n=28, last 2 years)
81020 MB/s -24%
AIDA64 / CPU ZLib
Asus ROG Strix Scar 17 G733PYV-LL053X
AMD Ryzen 9 7945HX3D, NVIDIA GeForce RTX 4090 Laptop GPU
2043 MB/s +21%
Eurocom Raptor X17 Core i9-14900HX
Intel Core i9-14900HX, NVIDIA GeForce RTX 4090 Laptop GPU
2037 MB/s +20%
Average Intel Core i9-14900HX
  (1054 - 2292, n=33)
1815 MB/s +7%
SCHENKER Key 17 Pro (M24)
Intel Core i9-14900HX, NVIDIA GeForce RTX 4090 Laptop GPU
1691 MB/s
HP ZBook Fury 16 G11
Intel Core i9-14900HX, NVIDIA RTX 3500 Ada Generation Laptop GPU
1473 MB/s -13%
Aorus 17X AZF
Intel Core i9-13900HX, NVIDIA GeForce RTX 4090 Laptop GPU
1353 MB/s -20%
Average of class Workstation
  (713 - 1691, n=28, last 2 years)
1092 MB/s -35%
AIDA64 / FP64 Ray-Trace
Asus ROG Strix Scar 17 G733PYV-LL053X
AMD Ryzen 9 7945HX3D, NVIDIA GeForce RTX 4090 Laptop GPU
29140 KRay/s +146%
Eurocom Raptor X17 Core i9-14900HX
Intel Core i9-14900HX, NVIDIA GeForce RTX 4090 Laptop GPU
14781 KRay/s +25%
Average Intel Core i9-14900HX
  (6809 - 18349, n=33)
13525 KRay/s +14%
SCHENKER Key 17 Pro (M24)
Intel Core i9-14900HX, NVIDIA GeForce RTX 4090 Laptop GPU
11838 KRay/s
HP ZBook Fury 16 G11
Intel Core i9-14900HX, NVIDIA RTX 3500 Ada Generation Laptop GPU
10878 KRay/s -8%
Aorus 17X AZF
Intel Core i9-13900HX, NVIDIA GeForce RTX 4090 Laptop GPU
10268 KRay/s -13%
Average of class Workstation
  (5580 - 13800, n=28, last 2 years)
9530 KRay/s -19%
AIDA64 / CPU PhotoWorxx
Eurocom Raptor X17 Core i9-14900HX
Intel Core i9-14900HX, NVIDIA GeForce RTX 4090 Laptop GPU
51118 MPixel/s +1%
SCHENKER Key 17 Pro (M24)
Intel Core i9-14900HX, NVIDIA GeForce RTX 4090 Laptop GPU
50465 MPixel/s
Aorus 17X AZF
Intel Core i9-13900HX, NVIDIA GeForce RTX 4090 Laptop GPU
50348 MPixel/s 0%
Average Intel Core i9-14900HX
  (23903 - 54702, n=33)
46637 MPixel/s -8%
Average of class Workstation
  (18157 - 51647, n=28, last 2 years)
38975 MPixel/s -23%
HP ZBook Fury 16 G11
Intel Core i9-14900HX, NVIDIA RTX 3500 Ada Generation Laptop GPU
37151 MPixel/s -26%
Asus ROG Strix Scar 17 G733PYV-LL053X
AMD Ryzen 9 7945HX3D, NVIDIA GeForce RTX 4090 Laptop GPU
36406 MPixel/s -28%

Systemets prestanda

Jämfört med de andra två i9-14900HX verkar Key 17 Pro vara den snabbaste Intel-modellen i PCMark 10, men AMD Ryzen 9 7945HX3D på Asus bärbara dator ligger före med högst 10%. Den äldre i9-13900HX på Aorus-modellen är överraskande nog snabbare med en liten marginal jämfört med Zbook Fury i9-14900HX.

Kingston DDR5-5600 RAM-minnet som sitter i Schenker-modellen visade sig dock vara det snabbaste genomsnittet. Det kniper förstaplatsen i AIDA64 Memory Copy och Memory Write-testerna, medan det hamnar på andra plats för Memory Read och på tredje plats för Latency.

PCMark 10 / Score
Asus ROG Strix Scar 17 G733PYV-LL053X
NVIDIA GeForce RTX 4090 Laptop GPU, R9 7945HX3D, SK hynix PC801 HFS001TEJ9X101N
9117 Points +10%
Average Intel Core i9-14900HX, NVIDIA GeForce RTX 4090 Laptop GPU
  (8230 - 9234, n=13)
8674 Points +5%
SCHENKER Key 17 Pro (M24)
NVIDIA GeForce RTX 4090 Laptop GPU, i9-14900HX, Samsung 990 Pro 1 TB
8277 Points
Aorus 17X AZF
NVIDIA GeForce RTX 4090 Laptop GPU, i9-13900HX, Gigabyte AG470S1TB-SI B10
7690 Points -7%
HP ZBook Fury 16 G11
NVIDIA RTX 3500 Ada Generation Laptop GPU, i9-14900HX, SK hynix PC801 HFS001TEJ9X101N
7607 Points -8%
Average of class Workstation
  (5953 - 8587, n=28, last 2 years)
7259 Points -12%
PCMark 10 / Essentials
Asus ROG Strix Scar 17 G733PYV-LL053X
NVIDIA GeForce RTX 4090 Laptop GPU, R9 7945HX3D, SK hynix PC801 HFS001TEJ9X101N
11561 Points +7%
Aorus 17X AZF
NVIDIA GeForce RTX 4090 Laptop GPU, i9-13900HX, Gigabyte AG470S1TB-SI B10
11188 Points +4%
Average Intel Core i9-14900HX, NVIDIA GeForce RTX 4090 Laptop GPU
  (10778 - 11628, n=13)
11125 Points +3%
SCHENKER Key 17 Pro (M24)
NVIDIA GeForce RTX 4090 Laptop GPU, i9-14900HX, Samsung 990 Pro 1 TB
10778 Points
Average of class Workstation
  (9151 - 12197, n=28, last 2 years)
10648 Points -1%
HP ZBook Fury 16 G11
NVIDIA RTX 3500 Ada Generation Laptop GPU, i9-14900HX, SK hynix PC801 HFS001TEJ9X101N
9647 Points -10%
PCMark 10 / Productivity
Asus ROG Strix Scar 17 G733PYV-LL053X
NVIDIA GeForce RTX 4090 Laptop GPU, R9 7945HX3D, SK hynix PC801 HFS001TEJ9X101N
10881 Points +15%
Average Intel Core i9-14900HX, NVIDIA GeForce RTX 4090 Laptop GPU
  (9458 - 11759, n=13)
10610 Points +12%
Aorus 17X AZF
NVIDIA GeForce RTX 4090 Laptop GPU, i9-13900HX, Gigabyte AG470S1TB-SI B10
10403 Points +10%
HP ZBook Fury 16 G11
NVIDIA RTX 3500 Ada Generation Laptop GPU, i9-14900HX, SK hynix PC801 HFS001TEJ9X101N
9554 Points +1%
SCHENKER Key 17 Pro (M24)
NVIDIA GeForce RTX 4090 Laptop GPU, i9-14900HX, Samsung 990 Pro 1 TB
9458 Points
Average of class Workstation
  (7846 - 10820, n=28, last 2 years)
9393 Points -1%
PCMark 10 / Digital Content Creation
Asus ROG Strix Scar 17 G733PYV-LL053X
NVIDIA GeForce RTX 4090 Laptop GPU, R9 7945HX3D, SK hynix PC801 HFS001TEJ9X101N
16348 Points +8%
SCHENKER Key 17 Pro (M24)
NVIDIA GeForce RTX 4090 Laptop GPU, i9-14900HX, Samsung 990 Pro 1 TB
15093 Points
Average Intel Core i9-14900HX, NVIDIA GeForce RTX 4090 Laptop GPU
  (13219 - 16462, n=13)
15042 Points 0%
HP ZBook Fury 16 G11
NVIDIA RTX 3500 Ada Generation Laptop GPU, i9-14900HX, SK hynix PC801 HFS001TEJ9X101N
12961 Points -14%
Aorus 17X AZF
NVIDIA GeForce RTX 4090 Laptop GPU, i9-13900HX, Gigabyte AG470S1TB-SI B10
10605 Points -30%
Average of class Workstation
  (7417 - 15093, n=28, last 2 years)
10492 Points -30%
CrossMark / Overall
Eurocom Raptor X17 Core i9-14900HX
NVIDIA GeForce RTX 4090 Laptop GPU, i9-14900HX, Corsair MP700 Pro 2TB
2238 Points
Aorus 17X AZF
NVIDIA GeForce RTX 4090 Laptop GPU, i9-13900HX, Gigabyte AG470S1TB-SI B10
2163 Points
Average Intel Core i9-14900HX, NVIDIA GeForce RTX 4090 Laptop GPU
  (1877 - 2344, n=10)
2119 Points
Asus ROG Strix Scar 17 G733PYV-LL053X
NVIDIA GeForce RTX 4090 Laptop GPU, R9 7945HX3D, SK hynix PC801 HFS001TEJ9X101N
2086 Points
HP ZBook Fury 16 G11
NVIDIA RTX 3500 Ada Generation Laptop GPU, i9-14900HX, SK hynix PC801 HFS001TEJ9X101N
2037 Points
Average of class Workstation
  (1154 - 2037, n=26, last 2 years)
1761 Points
CrossMark / Productivity
Eurocom Raptor X17 Core i9-14900HX
NVIDIA GeForce RTX 4090 Laptop GPU, i9-14900HX, Corsair MP700 Pro 2TB
2113 Points
Aorus 17X AZF
NVIDIA GeForce RTX 4090 Laptop GPU, i9-13900HX, Gigabyte AG470S1TB-SI B10
2050 Points
Average Intel Core i9-14900HX, NVIDIA GeForce RTX 4090 Laptop GPU
  (1738 - 2162, n=10)
1968 Points
Asus ROG Strix Scar 17 G733PYV-LL053X
NVIDIA GeForce RTX 4090 Laptop GPU, R9 7945HX3D, SK hynix PC801 HFS001TEJ9X101N
1948 Points
HP ZBook Fury 16 G11
NVIDIA RTX 3500 Ada Generation Laptop GPU, i9-14900HX, SK hynix PC801 HFS001TEJ9X101N
1902 Points
Average of class Workstation
  (1188 - 1902, n=26, last 2 years)
1677 Points
CrossMark / Creativity
Asus ROG Strix Scar 17 G733PYV-LL053X
NVIDIA GeForce RTX 4090 Laptop GPU, R9 7945HX3D, SK hynix PC801 HFS001TEJ9X101N
2415 Points
Average Intel Core i9-14900HX, NVIDIA GeForce RTX 4090 Laptop GPU
  (2195 - 2660, n=10)
2387 Points
Eurocom Raptor X17 Core i9-14900HX
NVIDIA GeForce RTX 4090 Laptop GPU, i9-14900HX, Corsair MP700 Pro 2TB
2341 Points
Aorus 17X AZF
NVIDIA GeForce RTX 4090 Laptop GPU, i9-13900HX, Gigabyte AG470S1TB-SI B10
2319 Points
HP ZBook Fury 16 G11
NVIDIA RTX 3500 Ada Generation Laptop GPU, i9-14900HX, SK hynix PC801 HFS001TEJ9X101N
2304 Points
Average of class Workstation
  (1180 - 2311, n=26, last 2 years)
1963 Points
CrossMark / Responsiveness
Eurocom Raptor X17 Core i9-14900HX
NVIDIA GeForce RTX 4090 Laptop GPU, i9-14900HX, Corsair MP700 Pro 2TB
2327 Points
Aorus 17X AZF
NVIDIA GeForce RTX 4090 Laptop GPU, i9-13900HX, Gigabyte AG470S1TB-SI B10
2063 Points
Average Intel Core i9-14900HX, NVIDIA GeForce RTX 4090 Laptop GPU
  (1478 - 2327, n=10)
1862 Points
HP ZBook Fury 16 G11
NVIDIA RTX 3500 Ada Generation Laptop GPU, i9-14900HX, SK hynix PC801 HFS001TEJ9X101N
1730 Points
Asus ROG Strix Scar 17 G733PYV-LL053X
NVIDIA GeForce RTX 4090 Laptop GPU, R9 7945HX3D, SK hynix PC801 HFS001TEJ9X101N
1649 Points
Average of class Workstation
  (990 - 1805, n=26, last 2 years)
1478 Points
WebXPRT 3 / Overall
Asus ROG Strix Scar 17 G733PYV-LL053X
NVIDIA GeForce RTX 4090 Laptop GPU, R9 7945HX3D, SK hynix PC801 HFS001TEJ9X101N
480 Points +56%
Aorus 17X AZF
NVIDIA GeForce RTX 4090 Laptop GPU, i9-13900HX, Gigabyte AG470S1TB-SI B10
340 Points +10%
Eurocom Raptor X17 Core i9-14900HX
NVIDIA GeForce RTX 4090 Laptop GPU, i9-14900HX, Corsair MP700 Pro 2TB
332 Points +8%
Average Intel Core i9-14900HX, NVIDIA GeForce RTX 4090 Laptop GPU
  (279 - 339, n=10)
323 Points +5%
HP ZBook Fury 16 G11
NVIDIA RTX 3500 Ada Generation Laptop GPU, i9-14900HX, SK hynix PC801 HFS001TEJ9X101N
319 Points +4%
SCHENKER Key 17 Pro (M24)
NVIDIA GeForce RTX 4090 Laptop GPU, i9-14900HX, Samsung 990 Pro 1 TB
308 Points
Average of class Workstation
  (218 - 415, n=29, last 2 years)
301 Points -2%
WebXPRT 4 / Overall
Asus ROG Strix Scar 17 G733PYV-LL053X
NVIDIA GeForce RTX 4090 Laptop GPU, R9 7945HX3D, SK hynix PC801 HFS001TEJ9X101N
328 Points +19%
Eurocom Raptor X17 Core i9-14900HX
NVIDIA GeForce RTX 4090 Laptop GPU, i9-14900HX, Corsair MP700 Pro 2TB
308 Points +12%
HP ZBook Fury 16 G11
NVIDIA RTX 3500 Ada Generation Laptop GPU, i9-14900HX, SK hynix PC801 HFS001TEJ9X101N
302 Points +10%
Aorus 17X AZF
NVIDIA GeForce RTX 4090 Laptop GPU, i9-13900HX, Gigabyte AG470S1TB-SI B10
297 Points +8%
Average Intel Core i9-14900HX, NVIDIA GeForce RTX 4090 Laptop GPU
  (246 - 309, n=8)
291 Points +6%
SCHENKER Key 17 Pro (M24)
NVIDIA GeForce RTX 4090 Laptop GPU, i9-14900HX, Samsung 990 Pro 1 TB
275 Points
Average of class Workstation
  (166.7 - 338, n=25, last 2 years)
265 Points -4%
Mozilla Kraken 1.1 / Total
Average of class Workstation
  (447 - 612, n=29, last 2 years)
517 ms * -7%
SCHENKER Key 17 Pro (M24)
NVIDIA GeForce RTX 4090 Laptop GPU, i9-14900HX, Samsung 990 Pro 1 TB
481 ms *
Aorus 17X AZF
NVIDIA GeForce RTX 4090 Laptop GPU, i9-13900HX, Gigabyte AG470S1TB-SI B10
473 ms * +2%
Eurocom Raptor X17 Core i9-14900HX
NVIDIA GeForce RTX 4090 Laptop GPU, i9-14900HX, Corsair MP700 Pro 2TB
467 ms * +3%
Average Intel Core i9-14900HX, NVIDIA GeForce RTX 4090 Laptop GPU
  (428 - 535, n=11)
456 ms * +5%
HP ZBook Fury 16 G11
NVIDIA RTX 3500 Ada Generation Laptop GPU, i9-14900HX, SK hynix PC801 HFS001TEJ9X101N
447 ms * +7%
Asus ROG Strix Scar 17 G733PYV-LL053X
NVIDIA GeForce RTX 4090 Laptop GPU, R9 7945HX3D, SK hynix PC801 HFS001TEJ9X101N
421.3 ms * +12%

* ... smaller is better

PCMark 10 Score
8277 poäng
Hjälp
AIDA64 / Memory Copy
SCHENKER Key 17 Pro (M24)
Intel Core i9-14900HX, NVIDIA GeForce RTX 4090 Laptop GPU
78820 MB/s
Aorus 17X AZF
Intel Core i9-13900HX, NVIDIA GeForce RTX 4090 Laptop GPU
78171 MB/s -1%
Eurocom Raptor X17 Core i9-14900HX
Intel Core i9-14900HX, NVIDIA GeForce RTX 4090 Laptop GPU
76328 MB/s -3%
Average Intel Core i9-14900HX
  (38028 - 83392, n=33)
74739 MB/s -5%
Average of class Workstation
  (30324 - 95718, n=28, last 2 years)
63058 MB/s -20%
HP ZBook Fury 16 G11
Intel Core i9-14900HX, NVIDIA RTX 3500 Ada Generation Laptop GPU
60295 MB/s -24%
Asus ROG Strix Scar 17 G733PYV-LL053X
AMD Ryzen 9 7945HX3D, NVIDIA GeForce RTX 4090 Laptop GPU
50335 MB/s -36%
AIDA64 / Memory Read
Aorus 17X AZF
Intel Core i9-13900HX, NVIDIA GeForce RTX 4090 Laptop GPU
88462 MB/s +3%
SCHENKER Key 17 Pro (M24)
Intel Core i9-14900HX, NVIDIA GeForce RTX 4090 Laptop GPU
85763 MB/s
Average Intel Core i9-14900HX
  (43306 - 87568, n=33)
80919 MB/s -6%
Eurocom Raptor X17 Core i9-14900HX
Intel Core i9-14900HX, NVIDIA GeForce RTX 4090 Laptop GPU
80139 MB/s -7%
Average of class Workstation
  (30787 - 86584, n=28, last 2 years)
61266 MB/s -29%
Asus ROG Strix Scar 17 G733PYV-LL053X
AMD Ryzen 9 7945HX3D, NVIDIA GeForce RTX 4090 Laptop GPU
59921 MB/s -30%
HP ZBook Fury 16 G11
Intel Core i9-14900HX, NVIDIA RTX 3500 Ada Generation Laptop GPU
59863 MB/s -30%
AIDA64 / Memory Write
SCHENKER Key 17 Pro (M24)
Intel Core i9-14900HX, NVIDIA GeForce RTX 4090 Laptop GPU
77439 MB/s
Aorus 17X AZF
Intel Core i9-13900HX, NVIDIA GeForce RTX 4090 Laptop GPU
76529 MB/s -1%
Eurocom Raptor X17 Core i9-14900HX
Intel Core i9-14900HX, NVIDIA GeForce RTX 4090 Laptop GPU
76442 MB/s -1%
Average Intel Core i9-14900HX
  (37146 - 80589, n=33)
71949 MB/s -7%
Average of class Workstation
  (32728 - 93871, n=28, last 2 years)
66503 MB/s -14%
Asus ROG Strix Scar 17 G733PYV-LL053X
AMD Ryzen 9 7945HX3D, NVIDIA GeForce RTX 4090 Laptop GPU
58774 MB/s -24%
HP ZBook Fury 16 G11
Intel Core i9-14900HX, NVIDIA RTX 3500 Ada Generation Laptop GPU
56987 MB/s -26%
AIDA64 / Memory Latency
Average of class Workstation
  (83.4 - 140.8, n=28, last 2 years)
103.9 ns * -23%
HP ZBook Fury 16 G11
Intel Core i9-14900HX, NVIDIA RTX 3500 Ada Generation Laptop GPU
96.3 ns * -14%
Asus ROG Strix Scar 17 G733PYV-LL053X
AMD Ryzen 9 7945HX3D, NVIDIA GeForce RTX 4090 Laptop GPU
88.6 ns * -5%
Eurocom Raptor X17 Core i9-14900HX
Intel Core i9-14900HX, NVIDIA GeForce RTX 4090 Laptop GPU
85.5 ns * -1%
Average Intel Core i9-14900HX
  (76.1 - 105, n=33)
84.8 ns * -0%
SCHENKER Key 17 Pro (M24)
Intel Core i9-14900HX, NVIDIA GeForce RTX 4090 Laptop GPU
84.5 ns *
Aorus 17X AZF
Intel Core i9-13900HX, NVIDIA GeForce RTX 4090 Laptop GPU
80.4 ns * +5%

* ... smaller is better

DPC-fördröjning

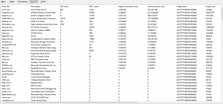
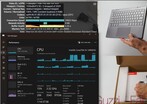
Schenkers Key 17 Pro M24 har den näst högsta latensen bland alla i9-14900HX-implementeringar i den här jämförelsen, även om den inte är betydligt högre eftersom de bättre implementeringarna bara ligger i 1000 mikrosekundersområdet. I9-13900HX från Gigabyte och i9-14900HX på Zbook Fury ser betydligt sämre ut med 11000 - 12000+ mikrosekunders latens. Latencymon föreslår att 1,9K μs latens är för hög för realtidsljud i kombination med andra uppgifter, så detta kan ha en negativ inverkan på innehållsskapande som videoredigering. Uppspelningen av 4K@60 fps-video från Youtube visar dock inga tappade bildrutor och relativt lågt CPU-användande.

Latencymon huvudflik
Latencymon drivrutinsflik
Youtube-statistik och CPU-användning på 4K-video
DPC Latencies / LatencyMon - interrupt to process latency (max), Web, Youtube, Prime95
Aorus 17X AZF
NVIDIA GeForce RTX 4090 Laptop GPU, i9-13900HX, Gigabyte AG470S1TB-SI B10
12614 μs * -545%
HP ZBook Fury 16 G11
NVIDIA RTX 3500 Ada Generation Laptop GPU, i9-14900HX, SK hynix PC801 HFS001TEJ9X101N
11167.3 μs * -471%
SCHENKER Key 17 Pro (M24)
NVIDIA GeForce RTX 4090 Laptop GPU, i9-14900HX, Samsung 990 Pro 1 TB
1955.8 μs *
Eurocom Raptor X17 Core i9-14900HX
NVIDIA GeForce RTX 4090 Laptop GPU, i9-14900HX, Corsair MP700 Pro 2TB
1123.4 μs * +43%
Asus ROG Strix Scar 17 G733PYV-LL053X
NVIDIA GeForce RTX 4090 Laptop GPU, R9 7945HX3D, SK hynix PC801 HFS001TEJ9X101N
1100.8 μs * +44%

* ... smaller is better

Lagringsenheter

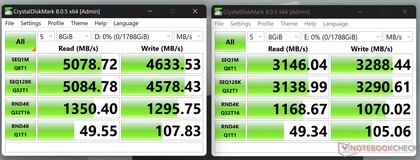
Samsungs 990 Pro PCIe 4.0 1 TB SSD är i genomsnitt snabbare jämfört med alla andra SSD-modeller utom Corsair MP700som är en PCIe 5.0 lösning. Samsungs SSD är också 14% snabbare än genomsnittet bland andra bärbara modeller som är utrustade med den. I throttling-loopen visar Samsung 990 Pro inga signifikanta variationer, bortsett från de första körningarna, även om maxhastigheten verkar vara några % lägre jämfört med de andra PCIe 4.0 SSD-enheterna.

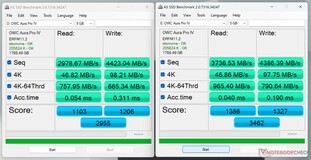
Samsung 990 Pro 1 TB
Sequential Read: 5346MB/s
Sequential Write: 5012MB/s
4K Read: 90.9MB/s
4K Write: 260MB/s
4K-64 Read: 3182MB/s
4K-64 Write: 4090MB/s
Access Time Read: 0.046ms
Access Time Write: 0.015ms
Score Read: 3807Points
Score Write: 4852Points
Score Total: 10591Points
Drive Performance Rating - Percent
Eurocom Raptor X17 Core i9-14900HX
Corsair MP700 Pro 2TB
90.9 pt
SCHENKER Key 17 Pro (M24)
Samsung 990 Pro 1 TB
73.2 pt
Average Samsung 990 Pro 1 TB
 
62.5 pt
Aorus 17X AZF
Gigabyte AG470S1TB-SI B10
59.6 pt
HP ZBook Fury 16 G11
SK hynix PC801 HFS001TEJ9X101N
53.2 pt
Average of class Workstation
 
46.9 pt
Asus ROG Strix Scar 17 G733PYV-LL053X
SK hynix PC801 HFS001TEJ9X101N
45.3 pt
DiskSpd
seq read
HP ZBook Fury 16 G11
SK hynix PC801 HFS001TEJ9X101N
4835 (4788.71min - 4834.56max) MB/s +54%
Average of class Workstation
  (1844 - 5715, n=28, last 2 years)
3594 MB/s +14%
Average Samsung 990 Pro 1 TB
  (2556 - 4234, n=18)
3249 MB/s +3%
Aorus 17X AZF
Gigabyte AG470S1TB-SI B10
3185 (2979.13min - 3184.87max) MB/s +1%
SCHENKER Key 17 Pro (M24)
Samsung 990 Pro 1 TB
3142 (3005.43min - 3141.53max) MB/s
Eurocom Raptor X17 Core i9-14900HX
Corsair MP700 Pro 2TB
2672 (2652.21min - 2671.88max) MB/s -15%
Asus ROG Strix Scar 17 G733PYV-LL053X
SK hynix PC801 HFS001TEJ9X101N
2570 (2552.37min - 2570.06max) MB/s -18%
seq write
Eurocom Raptor X17 Core i9-14900HX
Corsair MP700 Pro 2TB
9307 (5304.83min - 9307.21max) MB/s +90%
SCHENKER Key 17 Pro (M24)
Samsung 990 Pro 1 TB
4891 (4759.07min - 4890.56max) MB/s
Average Samsung 990 Pro 1 TB
  (3598 - 5842, n=18)
4777 MB/s -2%
Average of class Workstation
  (1309 - 7289, n=28, last 2 years)
3809 MB/s -22%
HP ZBook Fury 16 G11
SK hynix PC801 HFS001TEJ9X101N
3548 (3467.85min - 3547.93max) MB/s -27%
Aorus 17X AZF
Gigabyte AG470S1TB-SI B10
2988 (2534.41min - 2987.71max) MB/s -39%
Asus ROG Strix Scar 17 G733PYV-LL053X
SK hynix PC801 HFS001TEJ9X101N
1690 (1454.82min - 1690.3max) MB/s -65%
seq q8 t1 read
Eurocom Raptor X17 Core i9-14900HX
Corsair MP700 Pro 2TB
12029 (6621.31min - 12029.1max) MB/s +71%
Average Samsung 990 Pro 1 TB
  (7011 - 7148, n=18)
7091 MB/s +1%
SCHENKER Key 17 Pro (M24)
Samsung 990 Pro 1 TB
7033 (6025.44min - 7033.01max) MB/s
Asus ROG Strix Scar 17 G733PYV-LL053X
SK hynix PC801 HFS001TEJ9X101N
6971 (6127.67min - 6971.35max) MB/s -1%
HP ZBook Fury 16 G11
SK hynix PC801 HFS001TEJ9X101N
6961 (6365.34min - 6960.66max) MB/s -1%
Aorus 17X AZF
Gigabyte AG470S1TB-SI B10
6936 (6051.54min - 6936.09max) MB/s -1%
Average of class Workstation
  (3361 - 12631, n=28, last 2 years)
6593 MB/s -6%
seq q8 t1 write
Eurocom Raptor X17 Core i9-14900HX
Corsair MP700 Pro 2TB
11581 (11375.7min - 11581max) MB/s +75%
Average Samsung 990 Pro 1 TB
  (6531 - 6898, n=18)
6802 MB/s +3%
SCHENKER Key 17 Pro (M24)
Samsung 990 Pro 1 TB
6620 (6576.94min - 6620.29max) MB/s
HP ZBook Fury 16 G11
SK hynix PC801 HFS001TEJ9X101N
6159 (6120.41min - 6159.34max) MB/s -7%
Average of class Workstation
  (2526 - 9890, n=28, last 2 years)
5534 MB/s -16%
Aorus 17X AZF
Gigabyte AG470S1TB-SI B10
4348 (4155.37min - 4348.35max) MB/s -34%
Asus ROG Strix Scar 17 G733PYV-LL053X
SK hynix PC801 HFS001TEJ9X101N
2382 (920.86min - 2382.42max) MB/s -64%
4k q1 t1 read
SCHENKER Key 17 Pro (M24)
Samsung 990 Pro 1 TB
99 (97.84min - 99.01max) MB/s
Eurocom Raptor X17 Core i9-14900HX
Corsair MP700 Pro 2TB
95.9 (94.45min - 95.94max) MB/s -3%
Average Samsung 990 Pro 1 TB
  (55.3 - 99, n=18)
76.4 MB/s -23%
Average of class Workstation
  (45.4 - 99, n=28, last 2 years)
65.6 MB/s -34%
HP ZBook Fury 16 G11
SK hynix PC801 HFS001TEJ9X101N
64.3 (64.19min - 64.33max) MB/s -35%
Aorus 17X AZF
Gigabyte AG470S1TB-SI B10
55 (54.75min - 55.02max) MB/s -44%
Asus ROG Strix Scar 17 G733PYV-LL053X
SK hynix PC801 HFS001TEJ9X101N
54.3 (54.23min - 54.34max) MB/s -45%
4k q1 t1 write
Eurocom Raptor X17 Core i9-14900HX
Corsair MP700 Pro 2TB
397 (385.91min - 396.86max) MB/s +26%
Aorus 17X AZF
Gigabyte AG470S1TB-SI B10
324 (317.18min - 324.02max) MB/s +3%
SCHENKER Key 17 Pro (M24)
Samsung 990 Pro 1 TB
316 (303.92min - 316.48max) MB/s
Average Samsung 990 Pro 1 TB
  (133.9 - 343, n=18)
235 MB/s -26%
Asus ROG Strix Scar 17 G733PYV-LL053X
SK hynix PC801 HFS001TEJ9X101N
183.8 (182.06min - 183.78max) MB/s -42%
HP ZBook Fury 16 G11
SK hynix PC801 HFS001TEJ9X101N
162.1 (160.38min - 162.08max) MB/s -49%
Average of class Workstation
  (106.8 - 316, n=28, last 2 years)
157.2 MB/s -50%
4k q32 t16 read
Eurocom Raptor X17 Core i9-14900HX
Corsair MP700 Pro 2TB
6172 (6083.33min - 6171.85max) MB/s +25%
SCHENKER Key 17 Pro (M24)
Samsung 990 Pro 1 TB
4926 (4895.9min - 4926.27max) MB/s
Aorus 17X AZF
Gigabyte AG470S1TB-SI B10
3583 (3572.22min - 3582.76max) MB/s -27%
Average Samsung 990 Pro 1 TB
  (818 - 4926, n=18)
3327 MB/s -32%
Average of class Workstation
  (561 - 4926, n=28, last 2 years)
1535 MB/s -69%
Asus ROG Strix Scar 17 G733PYV-LL053X
SK hynix PC801 HFS001TEJ9X101N
1331 (1250.04min - 1330.81max) MB/s -73%
HP ZBook Fury 16 G11
SK hynix PC801 HFS001TEJ9X101N
905 (889.91min - 905max) MB/s -82%
4k q32 t16 write
Eurocom Raptor X17 Core i9-14900HX
Corsair MP700 Pro 2TB
4485 (4443.23min - 4484.95max) MB/s +25%
Aorus 17X AZF
Gigabyte AG470S1TB-SI B10
3622 (3512.08min - 3621.76max) MB/s +1%
SCHENKER Key 17 Pro (M24)
Samsung 990 Pro 1 TB
3579 (3433.86min - 3579.4max) MB/s
Average Samsung 990 Pro 1 TB
  (413 - 4683, n=18)
2563 MB/s -28%
Average of class Workstation
  (361 - 3579, n=28, last 2 years)
1014 MB/s -72%
Asus ROG Strix Scar 17 G733PYV-LL053X
SK hynix PC801 HFS001TEJ9X101N
730 (694.74min - 729.67max) MB/s -80%
HP ZBook Fury 16 G11
SK hynix PC801 HFS001TEJ9X101N
526 (510.99min - 525.65max) MB/s -85%
AS SSD
Score Total
Eurocom Raptor X17 Core i9-14900HX
Corsair MP700 Pro 2TB
13854 Points +31%
SCHENKER Key 17 Pro (M24)
Samsung 990 Pro 1 TB
10591 Points
Aorus 17X AZF
Gigabyte AG470S1TB-SI B10
8788 Points -17%
Average Samsung 990 Pro 1 TB
  (5405 - 10591, n=18)
8308 Points -22%
HP ZBook Fury 16 G11
SK hynix PC801 HFS001TEJ9X101N
6724 Points -37%
Asus ROG Strix Scar 17 G733PYV-LL053X
SK hynix PC801 HFS001TEJ9X101N
6546 Points -38%
Average of class Workstation
  (2512 - 10591, n=28, last 2 years)
5740 Points -46%
Score Read
Eurocom Raptor X17 Core i9-14900HX
Corsair MP700 Pro 2TB
4345 Points +14%
SCHENKER Key 17 Pro (M24)
Samsung 990 Pro 1 TB
3807 Points
Aorus 17X AZF
Gigabyte AG470S1TB-SI B10
3522 Points -7%
Average Samsung 990 Pro 1 TB
  (1349 - 4721, n=18)
2891 Points -24%
Average of class Workstation
  (1162 - 3807, n=28, last 2 years)
1779 Points -53%
Asus ROG Strix Scar 17 G733PYV-LL053X
SK hynix PC801 HFS001TEJ9X101N
1689 Points -56%
HP ZBook Fury 16 G11
SK hynix PC801 HFS001TEJ9X101N
1574 Points -59%
Score Write
Eurocom Raptor X17 Core i9-14900HX
Corsair MP700 Pro 2TB
7208 Points +49%
SCHENKER Key 17 Pro (M24)
Samsung 990 Pro 1 TB
4852 Points
HP ZBook Fury 16 G11
SK hynix PC801 HFS001TEJ9X101N
4428 Points -9%
Asus ROG Strix Scar 17 G733PYV-LL053X
SK hynix PC801 HFS001TEJ9X101N
4073 Points -16%
Average Samsung 990 Pro 1 TB
  (2308 - 4852, n=18)
4043 Points -17%
Aorus 17X AZF
Gigabyte AG470S1TB-SI B10
3618 Points -25%
Average of class Workstation
  (742 - 4852, n=28, last 2 years)
3138 Points -35%
Seq Read
Eurocom Raptor X17 Core i9-14900HX
Corsair MP700 Pro 2TB
7812.91 MB/s +46%
Asus ROG Strix Scar 17 G733PYV-LL053X
SK hynix PC801 HFS001TEJ9X101N
5739 MB/s +7%
HP ZBook Fury 16 G11
SK hynix PC801 HFS001TEJ9X101N
5639.52 MB/s +5%
SCHENKER Key 17 Pro (M24)
Samsung 990 Pro 1 TB
5346 MB/s
Average of class Workstation
  (2873 - 7437, n=28, last 2 years)
5291 MB/s -1%
Average Samsung 990 Pro 1 TB
  (4362 - 5760, n=18)
5211 MB/s -3%
Aorus 17X AZF
Gigabyte AG470S1TB-SI B10
4887 MB/s -9%
Seq Write
Eurocom Raptor X17 Core i9-14900HX
Corsair MP700 Pro 2TB
9485.67 MB/s +89%
SCHENKER Key 17 Pro (M24)
Samsung 990 Pro 1 TB
5012 MB/s
Average Samsung 990 Pro 1 TB
  (3376 - 5651, n=18)
4712 MB/s -6%
Asus ROG Strix Scar 17 G733PYV-LL053X
SK hynix PC801 HFS001TEJ9X101N
3972 MB/s -21%
HP ZBook Fury 16 G11
SK hynix PC801 HFS001TEJ9X101N
3610.72 MB/s -28%
Average of class Workstation
  (1785 - 6302, n=28, last 2 years)
3284 MB/s -34%
Aorus 17X AZF
Gigabyte AG470S1TB-SI B10
1891 MB/s -62%
4K Read
SCHENKER Key 17 Pro (M24)
Samsung 990 Pro 1 TB
90.9 MB/s
Eurocom Raptor X17 Core i9-14900HX
Corsair MP700 Pro 2TB
89.1 MB/s -2%
Aorus 17X AZF
Gigabyte AG470S1TB-SI B10
72.6 MB/s -20%
HP ZBook Fury 16 G11
SK hynix PC801 HFS001TEJ9X101N
71.74 MB/s -21%
Average Samsung 990 Pro 1 TB
  (52.7 - 90.9, n=18)
71.6 MB/s -21%
Average of class Workstation
  (46.6 - 90.9, n=28, last 2 years)
62.4 MB/s -31%
Asus ROG Strix Scar 17 G733PYV-LL053X
SK hynix PC801 HFS001TEJ9X101N
56 MB/s -38%
4K Write
Eurocom Raptor X17 Core i9-14900HX
Corsair MP700 Pro 2TB
350.79 MB/s +35%
Aorus 17X AZF
Gigabyte AG470S1TB-SI B10
284 MB/s +9%
HP ZBook Fury 16 G11
SK hynix PC801 HFS001TEJ9X101N
262.32 MB/s +1%
SCHENKER Key 17 Pro (M24)
Samsung 990 Pro 1 TB
260 MB/s
Average Samsung 990 Pro 1 TB
  (172.3 - 306, n=18)
223 MB/s -14%
Asus ROG Strix Scar 17 G733PYV-LL053X
SK hynix PC801 HFS001TEJ9X101N
192.1 MB/s -26%
Average of class Workstation
  (98.6 - 262, n=28, last 2 years)
176.2 MB/s -32%
4K-64 Read
Eurocom Raptor X17 Core i9-14900HX
Corsair MP700 Pro 2TB
3474.56 MB/s +9%
SCHENKER Key 17 Pro (M24)
Samsung 990 Pro 1 TB
3182 MB/s
Aorus 17X AZF
Gigabyte AG470S1TB-SI B10
2961 MB/s -7%
Average Samsung 990 Pro 1 TB
  (787 - 3182, n=18)
2252 MB/s -29%
Average of class Workstation
  (649 - 3182, n=28, last 2 years)
1191 MB/s -63%
Asus ROG Strix Scar 17 G733PYV-LL053X
SK hynix PC801 HFS001TEJ9X101N
1059 MB/s -67%
HP ZBook Fury 16 G11
SK hynix PC801 HFS001TEJ9X101N
938.68 MB/s -71%
4K-64 Write
Eurocom Raptor X17 Core i9-14900HX
Corsair MP700 Pro 2TB
5908.55 MB/s +44%
SCHENKER Key 17 Pro (M24)
Samsung 990 Pro 1 TB
4090 MB/s
HP ZBook Fury 16 G11
SK hynix PC801 HFS001TEJ9X101N
3804.93 MB/s -7%
Asus ROG Strix Scar 17 G733PYV-LL053X
SK hynix PC801 HFS001TEJ9X101N
3484 MB/s -15%
Average Samsung 990 Pro 1 TB
  (1592 - 4090, n=18)
3356 MB/s -18%
Aorus 17X AZF
Gigabyte AG470S1TB-SI B10
3145 MB/s -23%
Average of class Workstation
  (431 - 4090, n=28, last 2 years)
2633 MB/s -36%
Access Time Read
Aorus 17X AZF
Gigabyte AG470S1TB-SI B10
0.086 ms * -87%
Asus ROG Strix Scar 17 G733PYV-LL053X
SK hynix PC801 HFS001TEJ9X101N
0.062 ms * -35%
Average of class Workstation
  (0.017 - 0.105, n=28, last 2 years)
0.04943 ms * -7%
SCHENKER Key 17 Pro (M24)
Samsung 990 Pro 1 TB
0.046 ms *
Average Samsung 990 Pro 1 TB
  (0.018 - 0.074, n=18)
0.0345 ms * +25%
Eurocom Raptor X17 Core i9-14900HX
Corsair MP700 Pro 2TB
0.02 ms * +57%
HP ZBook Fury 16 G11
SK hynix PC801 HFS001TEJ9X101N
0.017 ms * +63%
Access Time Write
Eurocom Raptor X17 Core i9-14900HX
Corsair MP700 Pro 2TB
0.1 ms * -567%
HP ZBook Fury 16 G11
SK hynix PC801 HFS001TEJ9X101N
0.052 ms * -247%
Average of class Workstation
  (0.015 - 0.092, n=28, last 2 years)
0.04825 ms * -222%
Average Samsung 990 Pro 1 TB
  (0.012 - 0.053, n=18)
0.01978 ms * -32%
Asus ROG Strix Scar 17 G733PYV-LL053X
SK hynix PC801 HFS001TEJ9X101N
0.019 ms * -27%
SCHENKER Key 17 Pro (M24)
Samsung 990 Pro 1 TB
0.015 ms *
Aorus 17X AZF
Gigabyte AG470S1TB-SI B10
0.014 ms * +7%

* ... smaller is better

Disk Throttling: DiskSpd Read Loop, Queue Depth 8

0620124018602480310037204340496055806200682074408060868093009920105401116011780Tooltip
SCHENKER Key 17 Pro (M24) Samsung 990 Pro 1 TB; diskspd 2.0.17 f: Ø5981 (4453.3-6104.14)
Asus ROG Strix Scar 17 G733PYV-LL053X SK hynix PC801 HFS001TEJ9X101N: Ø6593 (4837.89-6648.18)
Eurocom Raptor X17 Core i9-14900HX Corsair MP700 Pro 2TB; diskspd 2.0.17 f: Ø12251 (10175.58-12345.09)
Eurocom Raptor X17 Core i9-14900HX Corsair MP700 Pro 2TB; diskspd 2.0.17 f: Ø6127 (3845.97-12312.59)
HP ZBook Fury 16 G11 SK hynix PC801 HFS001TEJ9X101N; diskspd 2.0.17 f: Ø5610 (3481.65-6919.34)
Aorus 17X AZF Gigabyte AG470S1TB-SI B10: Ø6890 (5212.74-6934.62)

GPU-prestanda

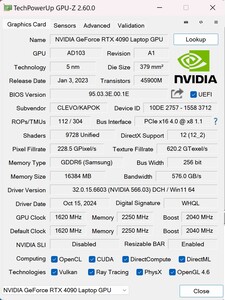
GPUZ iinfo
GPUZ iinfo

Den övergripande spelprestandan placerar Schenkers RTX 4090-implementering på sista plats, men inte heller här ligger den efter alltför mycket (högst 9%) jämfört med de snabbaste Intel-baserade konkurrenterna. Den AMD-baserade bärbara Asus-datorn är dock 16% snabbare.

Ett märkligt beteende registreras i Cyberpunk 2077 1080p ultra 30 minuters körning, där Schenker RTX 4090 sjunker till under 20 fps var 5:e minut eller så, även om den genomsnittliga fps ligger kvar över 100.

Dessutom sänks GPU-prestandan drastiskt i batteriläge. Till exempel registrerar stresstestet Furmark endast 30 fps i genomsnitt, medan det med nätadaptern ansluten registrerar 581 fps. På samma sätt kör Cyberpunk 2077 1080p ultra och Fire Strike med cirka 30 fps på batteri. GPU-prestandan sjunker också en hel del när man begränsar strömmen till balanserat (underhållning) eller energisparande (tyst) läge, vilket framgår av Fire Strike benchmark.

Ström profil
Grafikpoäng
Fysikpoäng
Kombinerad poäng
Prestanda-läge
456003061910857
Underhållningsläge
34723 (-24%)
19943 (-35%)6499 (-41%)
Tyst läge
30603 (-33%)
17142 (-44%)
4452 (-59%)
Batterikraft
6899 (-85%)
9512 (-69%)
3095 (-72%)


3DMark Performance Rating - Percent
Asus ROG Strix Scar 17 G733PYV-LL053X -1!
NVIDIA GeForce RTX 4090 Laptop GPU, AMD Ryzen 9 7945HX3D
98.4 pt
Average NVIDIA GeForce RTX 4090 Laptop GPU
 
97.1 pt
Eurocom Raptor X17 Core i9-14900HX -1!
NVIDIA GeForce RTX 4090 Laptop GPU, Intel Core i9-14900HX
96.9 pt
Aorus 17X AZF
NVIDIA GeForce RTX 4090 Laptop GPU, Intel Core i9-13900HX
95.7 pt
SCHENKER Key 17 Pro (M24)
NVIDIA GeForce RTX 4090 Laptop GPU, Intel Core i9-14900HX
92.5 pt
HP ZBook Fury 16 G11 -1!
NVIDIA RTX 3500 Ada Generation Laptop GPU, Intel Core i9-14900HX
60.4 pt
Average of class Workstation
 
45.6 pt
3DMark 11 - 1280x720 Performance GPU
Average NVIDIA GeForce RTX 4090 Laptop GPU
  (54073 - 73027, n=42)
65041 Points +9%
Asus ROG Strix Scar 17 G733PYV-LL053X
NVIDIA GeForce RTX 4090 Laptop GPU, AMD Ryzen 9 7945HX3D
64166 Points +7%
Eurocom Raptor X17 Core i9-14900HX
NVIDIA GeForce RTX 4090 Laptop GPU, Intel Core i9-14900HX
63191 Points +6%
Aorus 17X AZF
NVIDIA GeForce RTX 4090 Laptop GPU, Intel Core i9-13900HX
62544 Points +5%
SCHENKER Key 17 Pro (M24)
NVIDIA GeForce RTX 4090 Laptop GPU, Intel Core i9-14900HX
59715 Points
HP ZBook Fury 16 G11
NVIDIA RTX 3500 Ada Generation Laptop GPU, Intel Core i9-14900HX
41630 Points -30%
Average of class Workstation
  (9356 - 59715, n=29, last 2 years)
29325 Points -51%
3DMark
1280x720 Cloud Gate Standard Graphics
Average NVIDIA GeForce RTX 4090 Laptop GPU
  (95671 - 164399, n=14)
142227 Points +3%
SCHENKER Key 17 Pro (M24)
NVIDIA GeForce RTX 4090 Laptop GPU, Intel Core i9-14900HX
137440 Points
Aorus 17X AZF
NVIDIA GeForce RTX 4090 Laptop GPU, Intel Core i9-13900HX
132812 Points -3%
Average of class Workstation
  (40615 - 152418, n=15, last 2 years)
81395 Points -41%
1920x1080 Fire Strike Graphics
Asus ROG Strix Scar 17 G733PYV-LL053X
NVIDIA GeForce RTX 4090 Laptop GPU, AMD Ryzen 9 7945HX3D
49422 Points +8%
Aorus 17X AZF
NVIDIA GeForce RTX 4090 Laptop GPU, Intel Core i9-13900HX
48251 Points +6%
Average NVIDIA GeForce RTX 4090 Laptop GPU
  (40259 - 53059, n=41)
46365 Points +2%
Eurocom Raptor X17 Core i9-14900HX
NVIDIA GeForce RTX 4090 Laptop GPU, Intel Core i9-14900HX
46191 Points +1%
SCHENKER Key 17 Pro (M24)
NVIDIA GeForce RTX 4090 Laptop GPU, Intel Core i9-14900HX
45600 Points
HP ZBook Fury 16 G11
NVIDIA RTX 3500 Ada Generation Laptop GPU, Intel Core i9-14900HX
29248 Points -36%
Average of class Workstation
  (6121 - 45600, n=29, last 2 years)
20806 Points -54%
2560x1440 Time Spy Graphics
Eurocom Raptor X17 Core i9-14900HX
NVIDIA GeForce RTX 4090 Laptop GPU, Intel Core i9-14900HX
22104 Points +12%
Asus ROG Strix Scar 17 G733PYV-LL053X
NVIDIA GeForce RTX 4090 Laptop GPU, AMD Ryzen 9 7945HX3D
21353 Points +8%
Aorus 17X AZF
NVIDIA GeForce RTX 4090 Laptop GPU, Intel Core i9-13900HX
21158 Points +7%
Average NVIDIA GeForce RTX 4090 Laptop GPU
  (16950 - 23292, n=43)
20950 Points +6%
SCHENKER Key 17 Pro (M24)
NVIDIA GeForce RTX 4090 Laptop GPU, Intel Core i9-14900HX
19741 Points
HP ZBook Fury 16 G11
NVIDIA RTX 3500 Ada Generation Laptop GPU, Intel Core i9-14900HX
12806 Points -35%
Average of class Workstation
  (1997 - 19741, n=29, last 2 years)
8356 Points -58%
3DMark 11 Performance
40366 poäng
3DMark Cloud Gate Standard Score
59382 poäng
3DMark Fire Strike Score
32725 poäng
3DMark Time Spy Score
18674 poäng
Hjälp
Blender
v3.3 Classroom OPTIX/RTX
Average of class Workstation
  (13 - 95, n=25, last 2 years)
34.2 Seconds * -163%
HP ZBook Fury 16 G11
NVIDIA RTX 3500 Ada Generation Laptop GPU, Intel Core i9-14900HX
21 Seconds * -62%
Aorus 17X AZF
NVIDIA GeForce RTX 4090 Laptop GPU, Intel Core i9-13900HX
14 Seconds * -8%
SCHENKER Key 17 Pro (M24)
NVIDIA GeForce RTX 4090 Laptop GPU, Intel Core i9-14900HX
13 Seconds *
Average NVIDIA GeForce RTX 4090 Laptop GPU
  (9 - 19, n=39)
12.1 Seconds * +7%
Eurocom Raptor X17 Core i9-14900HX
NVIDIA GeForce RTX 4090 Laptop GPU, Intel Core i9-14900HX
12 Seconds * +8%
Asus ROG Strix Scar 17 G733PYV-LL053X
NVIDIA GeForce RTX 4090 Laptop GPU, AMD Ryzen 9 7945HX3D
11 Seconds * +15%
v3.3 Classroom CUDA
Average of class Workstation
  (18 - 155, n=25, last 2 years)
61.8 Seconds * -243%
HP ZBook Fury 16 G11
NVIDIA RTX 3500 Ada Generation Laptop GPU, Intel Core i9-14900HX
33 Seconds * -83%
Aorus 17X AZF
NVIDIA GeForce RTX 4090 Laptop GPU, Intel Core i9-13900HX
21 Seconds * -17%
Eurocom Raptor X17 Core i9-14900HX
NVIDIA GeForce RTX 4090 Laptop GPU, Intel Core i9-14900HX
19 Seconds * -6%
Average NVIDIA GeForce RTX 4090 Laptop GPU
  (16 - 24, n=39)
18.3 Seconds * -2%
Asus ROG Strix Scar 17 G733PYV-LL053X
NVIDIA GeForce RTX 4090 Laptop GPU, AMD Ryzen 9 7945HX3D
18 Seconds * -0%
SCHENKER Key 17 Pro (M24)
NVIDIA GeForce RTX 4090 Laptop GPU, Intel Core i9-14900HX
18 Seconds *

* ... smaller is better

Performance Rating - Percent
Asus ROG Strix Scar 17 G733PYV-LL053X -3!
AMD Ryzen 9 7945HX3D, NVIDIA GeForce RTX 4090 Laptop GPU
100 pt
Eurocom Raptor X17 Core i9-14900HX -2!
Intel Core i9-14900HX, NVIDIA GeForce RTX 4090 Laptop GPU
94.3 pt
Aorus 17X AZF -3!
Intel Core i9-13900HX, NVIDIA GeForce RTX 4090 Laptop GPU
86.9 pt
SCHENKER Key 17 Pro (M24)
Intel Core i9-14900HX, NVIDIA GeForce RTX 4090 Laptop GPU
86.3 pt
HP ZBook Fury 16 G11 -1!
Intel Core i9-14900HX, NVIDIA RTX 3500 Ada Generation Laptop GPU
64.5 pt
Average of class Workstation
 
48.7 pt
Cyberpunk 2077 2.1 Phantom Liberty - 1920x1080 Ultra Preset (FSR off)
Eurocom Raptor X17 Core i9-14900HX
Intel Core i9-14900HX, NVIDIA GeForce RTX 4090 Laptop GPU
144.7 (63.1min) fps +27%
SCHENKER Key 17 Pro (M24)
Intel Core i9-14900HX, NVIDIA GeForce RTX 4090 Laptop GPU
113.5 (84.3min) fps
HP ZBook Fury 16 G11
Intel Core i9-14900HX, NVIDIA RTX 3500 Ada Generation Laptop GPU
90.3 (73.1min) fps -20%
Average of class Workstation
  (19.6 - 113.5, n=13, last 2 years)
62.4 fps -45%
The Witcher 3 v4.00 - 1920x1080 Ultra Preset / On AA:FX
SCHENKER Key 17 Pro (M24)
Intel Core i9-14900HX, NVIDIA GeForce RTX 4090 Laptop GPU
217 fps
Average of class Workstation
  (66.7 - 217, n=2, last 2 years)
141.9 fps -35%
Baldur's Gate 3 - 1920x1080 Ultra Preset
Eurocom Raptor X17 Core i9-14900HX
Intel Core i9-14900HX, NVIDIA GeForce RTX 4090 Laptop GPU
200.4 fps +13%
SCHENKER Key 17 Pro (M24)
Intel Core i9-14900HX, NVIDIA GeForce RTX 4090 Laptop GPU
177 fps
HP ZBook Fury 16 G11
Intel Core i9-14900HX, NVIDIA RTX 3500 Ada Generation Laptop GPU
117.3 fps -34%
Average of class Workstation
  (25.8 - 177, n=11, last 2 years)
89.8 fps -49%
GTA V - 1920x1080 Highest Settings possible AA:4xMSAA + FX AF:16x
Asus ROG Strix Scar 17 G733PYV-LL053X
AMD Ryzen 9 7945HX3D, NVIDIA GeForce RTX 4090 Laptop GPU
167.7 (1.87min, 111.1P1) fps +32%
Eurocom Raptor X17 Core i9-14900HX
Intel Core i9-14900HX, NVIDIA GeForce RTX 4090 Laptop GPU
152.2 (3.85min, 111.1P1) fps +20%
Aorus 17X AZF
Intel Core i9-13900HX, NVIDIA GeForce RTX 4090 Laptop GPU
135.3 (6.48min, 90.9P1) fps +7%
SCHENKER Key 17 Pro (M24)
Intel Core i9-14900HX, NVIDIA GeForce RTX 4090 Laptop GPU
126.7 (8.43min, 83.3P1) fps
HP ZBook Fury 16 G11
Intel Core i9-14900HX, NVIDIA RTX 3500 Ada Generation Laptop GPU
115.5 (4.64min, 76.9P1) fps -9%
Average of class Workstation
  (18.3 - 126.7, n=25, last 2 years)
82.8 fps -35%
Final Fantasy XV Benchmark - 1920x1080 High Quality
Asus ROG Strix Scar 17 G733PYV-LL053X
AMD Ryzen 9 7945HX3D, NVIDIA GeForce RTX 4090 Laptop GPU
180 fps +3%
Aorus 17X AZF
Intel Core i9-13900HX, NVIDIA GeForce RTX 4090 Laptop GPU
177.6 fps +2%
SCHENKER Key 17 Pro (M24)
Intel Core i9-14900HX, NVIDIA GeForce RTX 4090 Laptop GPU
174.6 fps
HP ZBook Fury 16 G11
Intel Core i9-14900HX, NVIDIA RTX 3500 Ada Generation Laptop GPU
128.9 fps -26%
Average of class Workstation
  (21.2 - 174.6, n=29, last 2 years)
80.9 fps -54%
Strange Brigade - 1920x1080 ultra AA:ultra AF:16
Asus ROG Strix Scar 17 G733PYV-LL053X
AMD Ryzen 9 7945HX3D, NVIDIA GeForce RTX 4090 Laptop GPU
420 (64.7min, 302P1) fps +17%
Eurocom Raptor X17 Core i9-14900HX
Intel Core i9-14900HX, NVIDIA GeForce RTX 4090 Laptop GPU
402 (69.8min, 280P1) fps +12%
Aorus 17X AZF
Intel Core i9-13900HX, NVIDIA GeForce RTX 4090 Laptop GPU
386 (35.7min, 279P1) fps +7%
SCHENKER Key 17 Pro (M24)
Intel Core i9-14900HX, NVIDIA GeForce RTX 4090 Laptop GPU
360 (22.5min, 268P1) fps
HP ZBook Fury 16 G11
Intel Core i9-14900HX, NVIDIA RTX 3500 Ada Generation Laptop GPU
223 (52.5min, 159.8P1) fps -38%
Average of class Workstation
  (34.1 - 360, n=26, last 2 years)
139.8 fps -61%
Dota 2 Reborn - 1920x1080 ultra (3/3) best looking
Asus ROG Strix Scar 17 G733PYV-LL053X
AMD Ryzen 9 7945HX3D, NVIDIA GeForce RTX 4090 Laptop GPU
220 (175min) fps +23%
Eurocom Raptor X17 Core i9-14900HX
Intel Core i9-14900HX, NVIDIA GeForce RTX 4090 Laptop GPU
195.2 (163.9min) fps +9%
SCHENKER Key 17 Pro (M24)
Intel Core i9-14900HX, NVIDIA GeForce RTX 4090 Laptop GPU
178.4 (149.2min) fps
Aorus 17X AZF
Intel Core i9-13900HX, NVIDIA GeForce RTX 4090 Laptop GPU
176.1 (149.8min) fps -1%
HP ZBook Fury 16 G11
Intel Core i9-14900HX, NVIDIA RTX 3500 Ada Generation Laptop GPU
153.9 (131.9min) fps -14%
Average of class Workstation
  (57.8 - 178.4, n=29, last 2 years)
128.3 fps -28%
X-Plane 11.11 - 1920x1080 high (fps_test=3)
Asus ROG Strix Scar 17 G733PYV-LL053X
AMD Ryzen 9 7945HX3D, NVIDIA GeForce RTX 4090 Laptop GPU
166.2 fps +19%
Eurocom Raptor X17 Core i9-14900HX
Intel Core i9-14900HX, NVIDIA GeForce RTX 4090 Laptop GPU
150.2 fps +8%
SCHENKER Key 17 Pro (M24)
Intel Core i9-14900HX, NVIDIA GeForce RTX 4090 Laptop GPU
139.7 fps
Aorus 17X AZF
Intel Core i9-13900HX, NVIDIA GeForce RTX 4090 Laptop GPU
138.5 fps -1%
HP ZBook Fury 16 G11
Intel Core i9-14900HX, NVIDIA RTX 3500 Ada Generation Laptop GPU
110.9 fps -21%
Average of class Workstation
  (27.7 - 139.7, n=30, last 2 years)
84.2 fps -40%

Cyberpunk 2077 ultra FPS Chart

0102030405060708090100110120Tooltip
SCHENKER Key 17 Pro (M24) i9-14900HX, NVIDIA GeForce RTX 4090 Laptop GPU: Ø105 (17.74-129.39)
HP ZBook Fury 16 G11 i9-14900HX, NVIDIA RTX 3500 Ada Generation Laptop GPU: Ø67.6 (57.7-73.7)
lågmed.högultraQHD4K DLSS4K
GTA V (2015) 179.1 126.7 124.3 83.5
Dota 2 Reborn (2015) 240 209 199.8 178.4 170.9
Final Fantasy XV Benchmark (2018) 208 174.6 147.8 86.1
X-Plane 11.11 (2018) 201 178.2 139.7 114.8
Strange Brigade (2018) 480 389 379 360 281 145.5
The Witcher 3 v4.00 (2023) 241 217 165.7 84.4
Baldur's Gate 3 (2023) 183 177 124.7 107.9 66.5
Cyberpunk 2077 2.1 Phantom Liberty (2023) 134.1 129.8 127.7 113.5 89.7 40.4

Utsläpp och energiförbrukning

Systembuller

På tomgång och vid medelhög belastning är Schenkers kyllösning relativt tystare jämfört med de andra kylsystemen. En sak att notera på tomgång är att det uppenbarligen kommer ett mycket svagt vinande från fläktarna. Problemet är att så fort vi växlar till prestandaläget med automatiska fläkthastigheter går fläktarna alltid på max, även om belastningen inte är så hög. I det här fallet visar sig kylsystemet vara det mest högljudda med häpnadsväckande 62,14 dBA. Eurocom-modellen följer tätt efter eftersom den i princip har samma Clevo-chassi som Schenker använder. De andra modellerna är betydligt tystare med som mest 54 dBA vid maximala fläkthastigheter.

Ljudnivå

Låg belastning
25.33 / 25.33 / 25.33 dB(A)
Hög belastning
33.57 / 62.14 dB(A)
  red to green bar
 
 
30 dB
tyst
40 dB(A)
hörbar
50 dB(A)
högt ljud
 
min: dark, med: mid, max: light   Earthworks M23R, Arta (15 cm avstånd)   environment noise: 23.41 dB(A)
dB(A) 0102030405060708090Deep BassMiddle BassHigh BassLower RangeMidsHigher MidsLower HighsMid HighsUpper HighsSuper Highs2024.522.120.721.623.324.52528.730.528.728.125.828.73129.229.727.927.523.529.24029.530.228.128.223.729.55043.64442.743.436.443.66328.831.124.126.728.928.8803033.620.118.824.63010031.432.120.817.224.431.412532.433.521.52020.732.416037.137.220.416.81437.120037.838.120.915.113.937.825042.14224.617.415.442.131544.445.226.118.21744.440046.747.329.418.614.146.750044.144.22614.612.144.163046.646.924.413.89.146.680047.848.523.412.48.647.8100048.848.623.311.38.748.8125049.850.122.711.58.949.8160048.248.320.910.39.648.2200049.149.323.611.69.949.1250051.351.52013.610.551.3315053.353.418.313.511.353.3400051.651.315.912.111.551.6500053.153.614.112.311.653.1630048.748.913.512.611.848.7800046.646.613.312.211.946.61000042.843.113.712.311.842.81250038.939.313.812.311.638.91600034.634.812.91210.934.6SPL6262.133.625.323.462N15.8161.80.70.515.8median 46.6median 46.9median 20.9median 12.6median 11.6median 46.6Delta5.15.34.42.12.45.1hearing rangehide median Fan NoiseSCHENKER Key 17 Pro (M24)
SCHENKER Key 17 Pro (M24)
NVIDIA GeForce RTX 4090 Laptop GPU, i9-14900HX, Samsung 990 Pro 1 TB
Asus ROG Strix Scar 17 G733PYV-LL053X
NVIDIA GeForce RTX 4090 Laptop GPU, R9 7945HX3D, SK hynix PC801 HFS001TEJ9X101N
Eurocom Raptor X17 Core i9-14900HX
NVIDIA GeForce RTX 4090 Laptop GPU, i9-14900HX, Corsair MP700 Pro 2TB
HP ZBook Fury 16 G11
NVIDIA RTX 3500 Ada Generation Laptop GPU, i9-14900HX, SK hynix PC801 HFS001TEJ9X101N
Aorus 17X AZF
NVIDIA GeForce RTX 4090 Laptop GPU, i9-13900HX, Gigabyte AG470S1TB-SI B10
Noise
-13%
-14%
2%
-18%
off / environment *
23.41
23
2%
23.7
-1%
23.2
1%
25
-7%
Idle Minimum *
25.33
23
9%
31.7
-25%
23.2
8%
28
-11%
Idle Average *
25.33
27.7
-9%
31.7
-25%
23.2
8%
29
-14%
Idle Maximum *
25.33
34.7
-37%
32.9
-30%
29.5
-16%
34
-34%
Load Average *
33.57
53.4
-59%
34
-1%
43
-28%
51
-52%
Cyberpunk 2077 ultra *
61.97
48.2
22%
Load Maximum *
62.14
53.4
14%
61.6
1%
48.2
22%
54
13%
Witcher 3 ultra *
53.4
61.6
57

* ... smaller is better

Temperatur

De genomsnittliga temperaturerna varierar endast något mellan tomgång och belastning på tangentbordssidan. Styrplattans område förblir under hudtemperatur, medan tangentbordet blir varmare i övre mitten och i det vänstra hörnet. Å andra sidan är undersidan något varmare i viloläge, men temperaturerna når över 60° C i de övre och mittersta områdena, så det är inte riktigt knävänligt. Jämfört med de andra testade modellerna verkar tomgångs- och belastningstemperaturerna vara betydligt högre. Värmebilder visar att de bakre och laterala ventilationshålen har de hetaste platserna. Temperaturerna på strömförsörjningen varierar bara något mellan belastning och tomgång och går inte över 40° C.

Hög belastning
 49 °C51 °C29 °C 
 33.5 °C45 °C34.2 °C 
 30.3 °C29.3 °C32.2 °C 
Max: 51 °C
Medel: 37.1 °C
60 °C63.6 °C60 °C
44.3 °C64 °C40 °C
38.6 °C38.5 °C35.4 °C
Max: 64 °C
Medel: 49.4 °C
Strömförsörjning (max.)  43.6 °C | Rumstemperatur 24.6 °C | Fluke t3000FC (calibrated), Fluke 62 MAX
(±) The average temperature for the upper side under maximal load is 37.1 °C / 99 F, compared to the average of 32 °C / 90 F for the devices in the class Workstation.
(-) The maximum temperature on the upper side is 51 °C / 124 F, compared to the average of 38.2 °C / 101 F, ranging from 22.2 to 69.8 °C for the class Workstation.
(-) The bottom heats up to a maximum of 64 °C / 147 F, compared to the average of 41.2 °C / 106 F
(±) In idle usage, the average temperature for the upper side is 35.4 °C / 96 F, compared to the device average of 32 °C / 90 F.
(+) The palmrests and touchpad are reaching skin temperature as a maximum (33.1 °C / 91.6 F) and are therefore not hot.
(-) The average temperature of the palmrest area of similar devices was 27.9 °C / 82.2 F (-5.2 °C / -9.4 F).
Temperaturer fram (tomgång)
Bakre temperaturer (tomgång)
Temperaturer för strömadapter (tomgång)
Temperaturer på framsidan (stresstest)
Bakre temperaturer (stresstest)
Temperaturer för nätadapter (stresstest)
SCHENKER Key 17 Pro (M24)
Intel Core i9-14900HX, NVIDIA GeForce RTX 4090 Laptop GPU
Asus ROG Strix Scar 17 G733PYV-LL053X
AMD Ryzen 9 7945HX3D, NVIDIA GeForce RTX 4090 Laptop GPU
Eurocom Raptor X17 Core i9-14900HX
Intel Core i9-14900HX, NVIDIA GeForce RTX 4090 Laptop GPU
HP ZBook Fury 16 G11
Intel Core i9-14900HX, NVIDIA RTX 3500 Ada Generation Laptop GPU
Aorus 17X AZF
Intel Core i9-13900HX, NVIDIA GeForce RTX 4090 Laptop GPU
Heat
31%
21%
19%
23%
Maximum Upper Side *
51
40.1
21%
52.2
-2%
42.2
17%
47
8%
Maximum Bottom *
64
46.7
27%
53.2
17%
48
25%
51
20%
Idle Upper Side *
42.3
26.5
37%
28.6
32%
37
13%
30
29%
Idle Bottom *
46
27.7
40%
29.8
35%
36.8
20%
31
33%

* ... smaller is better

Högtalare

Vid maximal volym tenderar vissa mellan- och högfrekvenser att resonera med chassit. Basen är inte särskilt uttalad eftersom det inte ingår några subwoofers i ljudsystemet.

dB(A) 0102030405060708090Deep BassMiddle BassHigh BassLower RangeMidsHigher MidsLower HighsMid HighsUpper HighsSuper Highs2023.622.623.62531.131.331.13125.42025.44027.919.927.95038.22838.26327.519.627.58031.421.231.410041.415.141.412551.116.751.116053.112.553.120059.312.859.325059.719.259.731561.519.761.540061.117.161.150068.713.668.763067.112.367.180067.410.467.4100069.79.769.7125073.31073.3160067.310.467.3200067.810.867.8250067.811.267.8315060.111.660.1400068.411.768.4500073.411.973.46300671267800069.41269.41000064.612.164.61250065.711.865.71600057.311.157.3SPL80.924.280.9N51.60.651.6median 67median 12median 67Delta4.41.94.426.325.821.422.12624.925.127.622.532.523.448.72655.818.860.922.167.2267019.372.317.674.217.774.319.575.31571.711.871.311.27410.574.21072.710.17210.67210.97511.374.811.671.71269.71269.612.371.112.669.61270.111.269.824.784.70.666.6median 12median 71.73.42.2hearing rangehide median Pink NoiseSCHENKER Key 17 Pro (M24)Apple MacBook Pro 16 2021 M1 Pro
Frequency diagram (checkboxes can be checked and unchecked to compare devices)
SCHENKER Key 17 Pro (M24) audio analysis

(±) | speaker loudness is average but good (80.9 dB)
Bass 100 - 315 Hz
(±) | reduced bass - on average 12.7% lower than median
(±) | linearity of bass is average (9.1% delta to prev. frequency)
Mids 400 - 2000 Hz
(+) | balanced mids - only 2.3% away from median
(+) | mids are linear (5.1% delta to prev. frequency)
Highs 2 - 16 kHz
(+) | balanced highs - only 2.9% away from median
(±) | linearity of highs is average (8.9% delta to prev. frequency)
Overall 100 - 16.000 Hz
(+) | overall sound is linear (11.2% difference to median)
Compared to same class
» 9% of all tested devices in this class were better, 3% similar, 88% worse
» The best had a delta of 7%, average was 18%, worst was 35%
Compared to all devices tested
» 6% of all tested devices were better, 2% similar, 93% worse
» The best had a delta of 4%, average was 25%, worst was 134%

Apple MacBook Pro 16 2021 M1 Pro audio analysis

(+) | speakers can play relatively loud (84.7 dB)
Bass 100 - 315 Hz
(+) | good bass - only 3.8% away from median
(+) | bass is linear (5.2% delta to prev. frequency)
Mids 400 - 2000 Hz
(+) | balanced mids - only 1.3% away from median
(+) | mids are linear (2.1% delta to prev. frequency)
Highs 2 - 16 kHz
(+) | balanced highs - only 1.9% away from median
(+) | highs are linear (2.7% delta to prev. frequency)
Overall 100 - 16.000 Hz
(+) | overall sound is linear (4.6% difference to median)
Compared to same class
» 0% of all tested devices in this class were better, 0% similar, 100% worse
» The best had a delta of 5%, average was 18%, worst was 45%
Compared to all devices tested
» 0% of all tested devices were better, 0% similar, 100% worse
» The best had a delta of 4%, average was 25%, worst was 134%

Strömförbrukning

Strömförbrukningen i viloläge är betydligt högre än för alla modeller i den här jämförelsen, runt 40 W. Det är nästan dubbelt så mycket som för föregående generation i9-13900HX och AMD:s Ryzen 9 7945HX3D. Förbrukningen vid full belastning är dock näst lägst i genomsnitt. Den börjar på 300 W, men sjunker till cirka 200 W efter några minuter. Däremot varierar i9-13900HX på Aorus-modellen kraftigt vid full belastning. I Cyberpunk 2077 1080p ultra 150 nit-testet registrerar Key 17 Pro den högsta förbrukningen på 274 W i genomsnitt.

I testerna med externa bildskärmar är förbrukningen i viloläge något lägre (29 W) som förväntat, men Cyberpunk 2077 1080p Ultra förbrukar något mer (280 W).

Strömförbrukning
Av/Standbydarklight 0.62 / 2 Watt
Låg belastningdarkmidlight 33.79 / 41.67 / 49.66 Watt
Hög belastning midlight 113.06 / 301 Watt
 color bar
Förklaring: min: dark, med: mid, max: light        Metrahit Energy

Power Consumption Cyberpunk / Stress Test

020406080100120140160180200220240260280300320Tooltip
SCHENKER Key 17 Pro (M24) i9-14900HX, NVIDIA GeForce RTX 4090 Laptop GPU; 1280x720 Prime95 28.10 and Furmark 1.25: Ø248 (199.5-300)
Asus ROG Strix Scar 17 G733PYV-LL053X R9 7945HX3D, NVIDIA GeForce RTX 4090 Laptop GPU; 1280x720 Prime95 28.10 and Furmark 1.25: Ø287 (278-327)
HP ZBook Fury 16 G11 i9-14900HX, NVIDIA RTX 3500 Ada Generation Laptop GPU; 1280x720 Prime95 28.10 and Furmark 1.25: Ø177.3 (156.9-236)
Aorus 17X AZF i9-13900HX, NVIDIA GeForce RTX 4090 Laptop GPU; 1280x720 Prime95 28.10 and Furmark 1.25: Ø163.2 (123.4-275)
SCHENKER Key 17 Pro (M24) i9-14900HX, NVIDIA GeForce RTX 4090 Laptop GPU; Idle 150cd/m2: Ø42.7 (40.3-52)
Asus ROG Strix Scar 17 G733PYV-LL053X R9 7945HX3D, NVIDIA GeForce RTX 4090 Laptop GPU; Idle 150cd/m2: Ø17.2 (14.8-22.6)
HP ZBook Fury 16 G11 i9-14900HX, NVIDIA RTX 3500 Ada Generation Laptop GPU; Idle 150cd/m2: Ø9.03 (5.95-16.7)
Aorus 17X AZF i9-13900HX, NVIDIA GeForce RTX 4090 Laptop GPU; Idle 150cd/m2: Ø16.9 (11.9-21)
SCHENKER Key 17 Pro (M24) i9-14900HX, NVIDIA GeForce RTX 4090 Laptop GPU; Cyberpunk 2077 FHD ultra no FSR 150cd: Ø274 (178.4-310)
HP ZBook Fury 16 G11 i9-14900HX, NVIDIA RTX 3500 Ada Generation Laptop GPU; Cyberpunk 2077 FHD ultra no FSR 150cd: Ø199.4 (186.2-223)

Power Consumption external Monitor

020406080100120140160180200220240260280300Tooltip
SCHENKER Key 17 Pro (M24) i9-14900HX, NVIDIA GeForce RTX 4090 Laptop GPU; Prime95 V2810 Stress (external Monitor): Ø171.9 (158.8-211)
Asus ROG Strix Scar 17 G733PYV-LL053X R9 7945HX3D, NVIDIA GeForce RTX 4090 Laptop GPU; Prime95 V2810 Stress (external Monitor): Ø157.2 (155-164.7)
HP ZBook Fury 16 G11 i9-14900HX, NVIDIA RTX 3500 Ada Generation Laptop GPU; Prime95 V2810 Stress (external Monitor): Ø132.3 (110.2-196.2)
Aorus 17X AZF i9-13900HX, NVIDIA GeForce RTX 4090 Laptop GPU; Prime95 V2810 Stress (external Monitor): Ø126.3 (116.6-203)
Asus ROG Strix Scar 17 G733PYV-LL053X R9 7945HX3D, NVIDIA GeForce RTX 4090 Laptop GPU; Cinebench R15 Multi (external Monitor): Ø187.3 (172.4-195.5)
HP ZBook Fury 16 G11 i9-14900HX, NVIDIA RTX 3500 Ada Generation Laptop GPU; Cinebench R15 Multi (external Monitor): Ø209 (207-221)
SCHENKER Key 17 Pro (M24) i9-14900HX, NVIDIA GeForce RTX 4090 Laptop GPU; Cinebench R23 Single (external Monitor): Ø76.2 (67.2-92.4)
Asus ROG Strix Scar 17 G733PYV-LL053X R9 7945HX3D, NVIDIA GeForce RTX 4090 Laptop GPU; Cinebench R23 Single (external Monitor): Ø71.9 (70.8-86)
SCHENKER Key 17 Pro (M24) i9-14900HX, NVIDIA GeForce RTX 4090 Laptop GPU; Cinebench R23 Multi (external Monitor): Ø136.1 (84.2-156.1)
Asus ROG Strix Scar 17 G733PYV-LL053X R9 7945HX3D, NVIDIA GeForce RTX 4090 Laptop GPU; Cinebench R23 Multi (external Monitor): Ø158.5 (149.9-171.1)
Aorus 17X AZF i9-13900HX, NVIDIA GeForce RTX 4090 Laptop GPU; Cinebench R23 Multi (external Monitor): Ø160.8 (158.2-169.2)
SCHENKER Key 17 Pro (M24) i9-14900HX, NVIDIA GeForce RTX 4090 Laptop GPU; 1280x720 FurMark 1.19 GPU Stress Test (external Monitor): Ø235 (229-245)
Asus ROG Strix Scar 17 G733PYV-LL053X R9 7945HX3D, NVIDIA GeForce RTX 4090 Laptop GPU; 1280x720 FurMark 1.19 GPU Stress Test (external Monitor): Ø242 (225-263)
HP ZBook Fury 16 G11 i9-14900HX, NVIDIA RTX 3500 Ada Generation Laptop GPU; 1280x720 FurMark 1.19 GPU Stress Test (external Monitor): Ø175.5 (160.4-203)
Aorus 17X AZF i9-13900HX, NVIDIA GeForce RTX 4090 Laptop GPU; 1280x720 FurMark 1.19 GPU Stress Test (external Monitor): Ø239 (233-273)
SCHENKER Key 17 Pro (M24) i9-14900HX, NVIDIA GeForce RTX 4090 Laptop GPU; Idle 1min (external Monitor): Ø29 (22.5-36.9)
Asus ROG Strix Scar 17 G733PYV-LL053X R9 7945HX3D, NVIDIA GeForce RTX 4090 Laptop GPU; Idle 1min (external Monitor): Ø28.9 (22.6-43.7)
HP ZBook Fury 16 G11 i9-14900HX, NVIDIA RTX 3500 Ada Generation Laptop GPU; Idle 1min (external Monitor): Ø8.59 (4.29-17.9)
Aorus 17X AZF i9-13900HX, NVIDIA GeForce RTX 4090 Laptop GPU; Idle 1min (external Monitor): Ø22.5 (18.2-30.9)
SCHENKER Key 17 Pro (M24) i9-14900HX, NVIDIA GeForce RTX 4090 Laptop GPU; Cyberpunk 2077 FHD ultra no FSR - external Monitor: Ø280 (250-312)
HP ZBook Fury 16 G11 i9-14900HX, NVIDIA RTX 3500 Ada Generation Laptop GPU; Cyberpunk 2077 FHD ultra no FSR - external Monitor: Ø192.6 (181.9-209)

Batteritid

Trots att batteriet i Key 17 Pro har en generös kapacitet på 99 Wh står det sig inte bra i jämförelse med de andra modellerna. Vid Wi-Fi-webbsurfning med 150 nits räcker batteriet bara i 203 minuter, medan de andra modellerna har mellan 40 % och 96 % längre drifttid. Vid full belastning håller Key 17 Pro i 64 minuter, näst lägst drifttid, medan batteriet i Cyberpunk 2077 1080p ultra 150 cd-förhållanden bara håller i 3 minuter mer. Den här modellen verkar vara utformad som en stationär ersättare, inte som en mobil enhet.

Batteritid
Cyberpunk 2077 ultra 150cd
1tim 07min
WiFi Websurfing
3tim 23min
Hög belastning (maximal ljusstyrka)
1tim 04min
SCHENKER Key 17 Pro (M24)
i9-14900HX, NVIDIA GeForce RTX 4090 Laptop GPU, 99 Wh
Asus ROG Strix Scar 17 G733PYV-LL053X
R9 7945HX3D, NVIDIA GeForce RTX 4090 Laptop GPU, 90 Wh
Eurocom Raptor X17 Core i9-14900HX
i9-14900HX, NVIDIA GeForce RTX 4090 Laptop GPU, 99 Wh
HP ZBook Fury 16 G11
i9-14900HX, NVIDIA RTX 3500 Ada Generation Laptop GPU, 95 Wh
Aorus 17X AZF
i9-13900HX, NVIDIA GeForce RTX 4090 Laptop GPU, 99 Wh
Average of class Workstation
 
Battery Runtime
14%
40%
98%
96%
90%
WiFi v1.3
203
287
41%
284
40%
402
98%
389
92%
Cyberpunk 2077 ultra 150cd
67
Load
64
55
-14%
128
100%
H.264
302
403
Reader / Idle
541

Notebookcheck Betyg

Årets mobila arbetsstation Key 17 Pro från Schenker imponerar med utmärkta anslutningsmöjligheter som två ultrasnabba Thunderbolt 5-portar och Wi-Fi 7-hastigheter. Intel i9-14900HX och Nvidias RTX 4090 erbjuder bra prestanda, men inte riktigt i nivå med konkurrenterna. Noterbara nackdelar inkluderar det bullriga kylsystemet och den ganska korta batteritiden.

SCHENKER Key 17 Pro (M24) - 11/15/2024 v8
Bogdan Solca

Design
84 / 98 → 86%
Tangentbord
96%
Mus
94%
Anslutningar
76 / 80 → 95%
Vikt
54 / 10-66 → 78%
Batteri
51 / 95 → 53%
Skärm
83%
Spelprestanda
90%
Programprestanda
88%
Workstation
80%
AI Performance
99%
Temperatur
82 / 95 → 86%
Ljudnivå
56 / 90 → 63%
Audio
81%
Camera
50 / 75 → 67%
Medel
73%
85%
Workstation - Vägt medel

Transparency

The selection of devices to be reviewed is made by our editorial team. The test sample was provided to the author as a loan by the manufacturer or retailer for the purpose of this review. The lender had no influence on this review, nor did the manufacturer receive a copy of this review before publication. There was no obligation to publish this review. We never accept compensation or payment in return for our reviews. As an independent media company, Notebookcheck is not subjected to the authority of manufacturers, retailers or publishers.

This is how Notebookcheck is testing

Every year, Notebookcheck independently reviews hundreds of laptops and smartphones using standardized procedures to ensure that all results are comparable. We have continuously developed our test methods for around 20 years and set industry standards in the process. In our test labs, high-quality measuring equipment is utilized by experienced technicians and editors. These tests involve a multi-stage validation process. Our complex rating system is based on hundreds of well-founded measurements and benchmarks, which maintains objectivity. Further information on our test methods can be found here.

Please share our article, every link counts!
Mail Logo
> Bärbara datorer, laptops - tester och nyheter > Tester > SCHENKER Key 17 Pro (M24) recension - ultrasnabba dubbla Thunderbolt 5-anslutningar och i9-14900HX-kraft
Bogdan Solca, 2024-11-22 (Update: 2024-11-22)