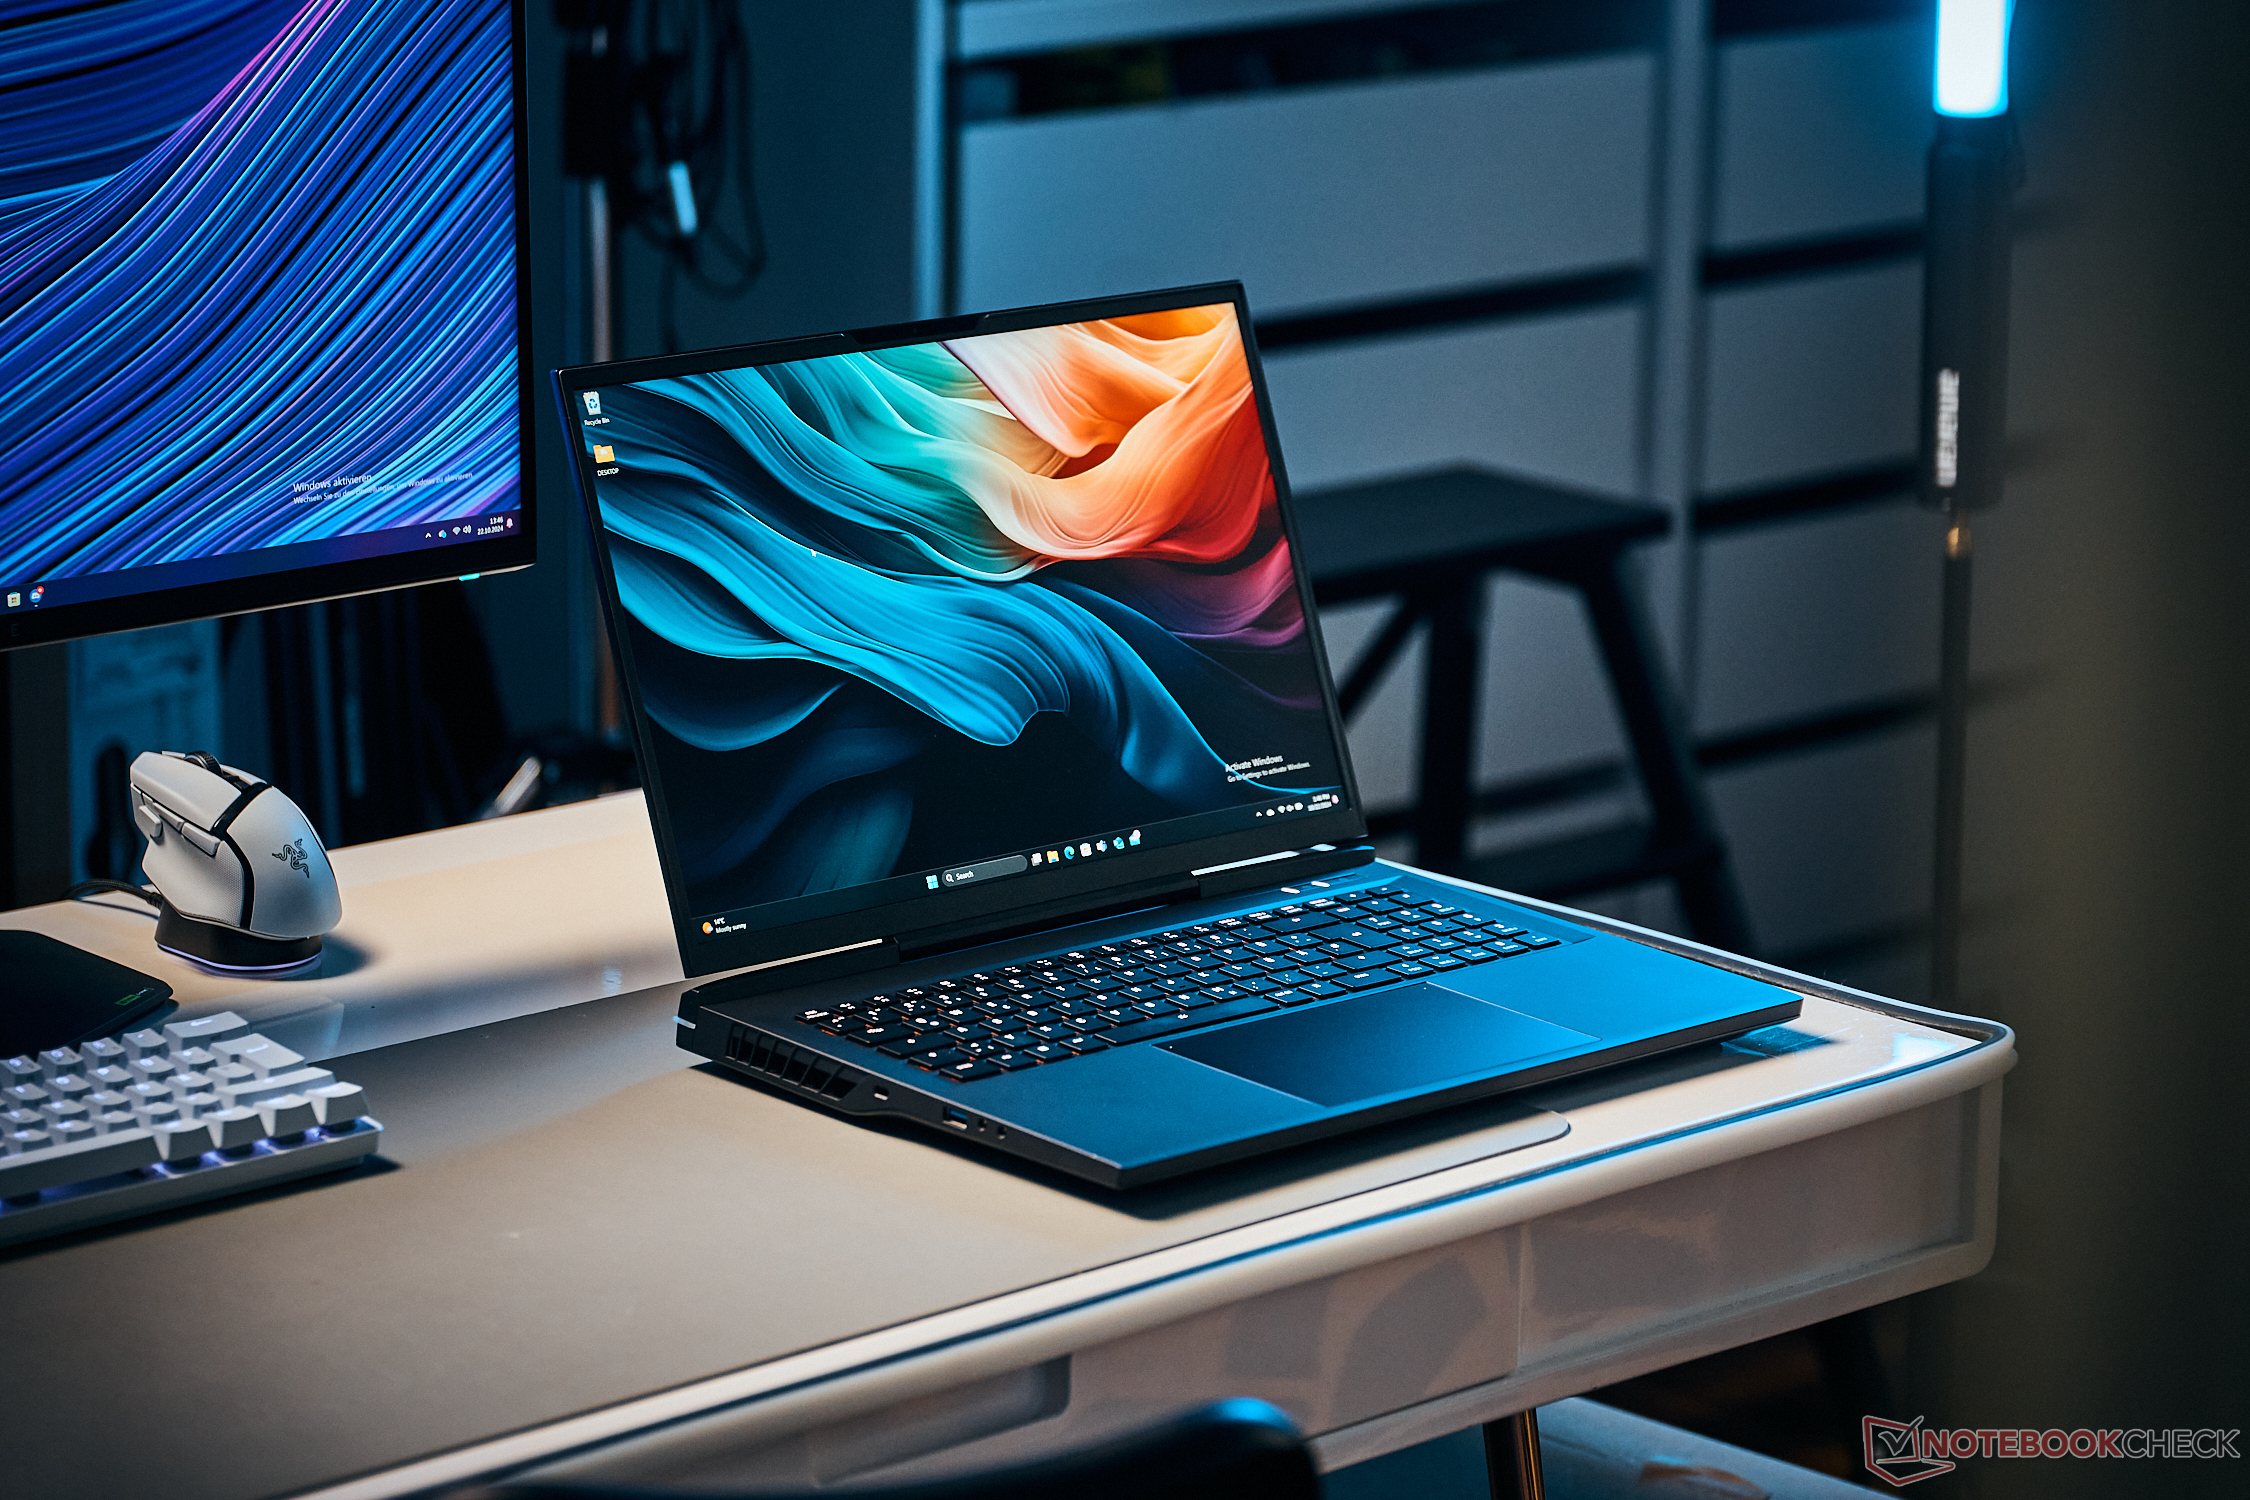
XMG Neo 17 E24 recension - Snabb bärbar dator för spel med vattenkylning som tillval
RTX 4080 bärbar dator och mekaniskt tangentbord.
Med XMG Neo 17 får du en fullblodsspelare som kan utrustas med de snabbaste komponenterna på marknaden. Ett mekaniskt Cherry-tangentbord och ett externt vattenkylningssystem finns också som tillval, vilket inte bara sänker temperaturerna utan också bakgrundsljudet.Andreas Osthoff, 👁 Andreas Osthoff (översatt av DeepL / Ninh Duy) Publicerad 🇺🇸 🇩🇪 ...
Utlåtande - XMG Neo 17 fokuserar på spelprestanda
XMG Neo 17 presenterar sig i testet som en kraftfull bärbar speldator med ett uppenbart fokus på komponenternas maximala prestanda. Intel Core i9-14900HX används som processor i alla konfigurationer, medan de dedikerade Nvidia GPU:erna kan överklockas. Resultatet är en av de snabbaste bärbara RTX 4080-datorerna som vi har testat hittills. Detta ger tillräcklig prestanda för den snabba 240 Hz QHD-panelen, som också är mycket lämplig för spel. Kretsen för den externa Oasis-vattenkylningen (tillval) har förbättrats och täcker nu även processorn. Resultatet är betydligt lägre temperaturer och därmed en lägre ljudnivå när du spelar.
Spelaren gör också bra ifrån sig på andra områden: det finns tillräckligt med portar, höljet är av god kvalitet och det mekaniska Cherry-tangentbordet (tillval) är mycket bra, men också mycket högljutt. RAM/SSD-kapaciteten kan också konfigureras och det är inga problem att uppgradera vid ett senare tillfälle. Den bärbara 17-tumsdatorn är relativt stor och väger knappt 3 kg, vilket inte är någon lättvikt. Kylaggregatet gör ett bra jobb även utan Oasis vattenkylning, men fläktarna blir väldigt högljudda när man spelar och då bör man använda hörlurar.
När det gäller pris är mer än 3 000 euro naturligtvis inget fynd, men det beror främst på GeForce GPU. Om du letar efter en fullblodsspelare och också vill dra nytta av vattenkylningen är XMG Neo 17 definitivt ett bra val.
För
Emot
Pris och tillgänglighet
Schenker Neo 17 E24 kan konfigureras och beställas direkt från Bestware. Startpriset är 1 949 euro för konfigurationen med den bärbara datorn RTX 4060 och 2 924 euro för den bärbara datorn RTX 4080.
Jämförelse av möjliga alternativ
Bild | Modell / recensioner | Geizhals | Vikt | Höjd | Skärm |
|---|---|---|---|---|---|
| SCHENKER XMG Neo 17 E24 Intel Core i9-14900HX ⎘ NVIDIA GeForce RTX 4080 Laptop GPU ⎘ 32 GB Minne, 1024 GB SSD | Listenpreis 3189€ | 2.9 kg | 27 mm | 17.00" 2560x1600 178 PPI IPS | |
| Medion Erazer Beast X40 2024 Intel Core i9-14900HX ⎘ NVIDIA GeForce RTX 4090 Laptop GPU ⎘ 32 GB Minne, 1024 GB SSD | Listenpreis 4000 Euro | 2.9 kg | 36 mm | 17.00" 2560x1600 178 PPI IPS | |
| HP Omen 17-db0079ng AMD Ryzen 7 8845HS ⎘ NVIDIA GeForce RTX 4070 Laptop GPU ⎘ 32 GB Minne, 1024 GB SSD | Listenpreis 1900€ | 2.8 kg | 30.1 mm | 17.30" 2560x1440 170 PPI IPS | |
| Eurocom Raptor X17 Core i9-14900HX Intel Core i9-14900HX ⎘ NVIDIA GeForce RTX 4090 Laptop GPU ⎘ 32 GB Minne, 2048 GB SSD | Listenpreis 4500 USD | 3.4 kg | 24.9 mm | 17.30" 3840x2160 255 PPI IPS | |
| MSI GE78HX 13VH-070US Intel Core i9-13950HX ⎘ NVIDIA GeForce RTX 4080 Laptop GPU ⎘ 32 GB Minne, 2048 GB SSD | Listenpreis 3600 USD | 3 kg | 23 mm | 17.00" 2560x1600 178 PPI IPS |
Topp 10...
» Topp 10: Bästa bärbara allround/multimediadatorerna
» Topp 10: Bästa bärbara speldatorerna
» Topp 10: Bärbara budget/kontorsdatorer
» Topp 10: Bästa bärbara kontors/premiumdatorerna
» Topp 10: Bärbara arbetsstationer
» Topp 10: De bästa små/kompakta bärbara datorerna
» Topp 10: Bästa ultrabooks
» Topp 10: Bästa hybriddatorerna
» Topp 10: Bästa surfplattorna
» Topp 10: Marknadens bästa smartphones
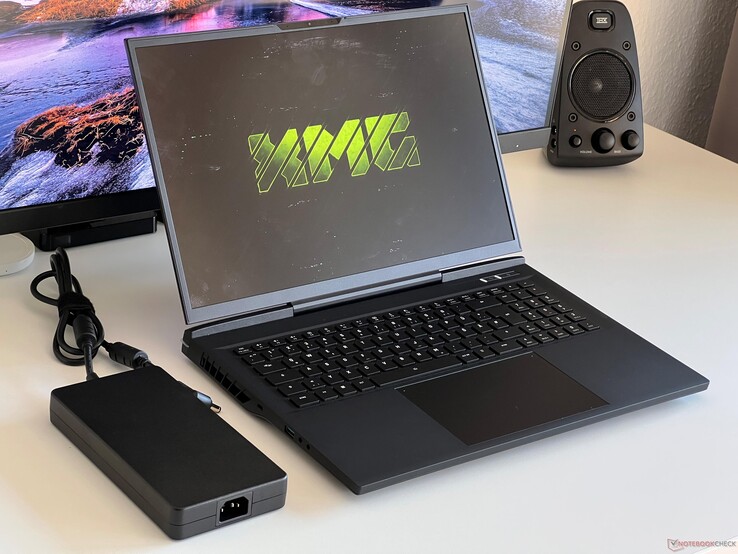
Med XMG Neo 17 E24 erbjuder Schenker en kraftfull 17-tums gaming notebook med en 240 Hz QHD-panel (G-Sync). Processorn är alltid Intels Core i9-14900HX och för grafikkortet har du valet mellan Nvidia GeForce RTX 4060 bärbar dator och alla andra modeller upp till GeForce RTX 4090 bärbar dator. RAM/SSD-minnet kan konfigureras i stor utsträckning och förutom ett mekaniskt tangentbord finns också det externa Oasis-vattenkylsystemet som tillval, vilket kan öka den bärbara datorns kylkapacitet avsevärt.
Vår testenhet är utrustad med den dedikerade GeForce RTX 4080 bärbar dator GPU, 32 GB RAM och en 1 TB SSD från Samsung, vilket ökar priset inklusive det mekaniska Cherry-tangentbordet till 3 182 euro (baspris 1 948 euro). Vi tar också en titt på några riktmärken för Neo 17 med RTX 4090 bärbar dator i kombination med Oasis vattenkylningssystem (199 euro).
Specifikationer
Väska & utrustning
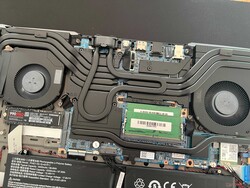
Vi känner redan till det svarta metallchassit och den gummerade basenheten från Medion Erazer Beastsom är baserad på samma barebone. Det finns en LED-remsa på baksidan och en XMG-logotyp på locket, men annars finns det inga irriterande klistermärken från tillverkaren. Den övergripande stabiliteten är mycket bra, men med en vikt på strax under 2,9 kg och en höjd på 2,7 cm är Neo 17 inte heller lätt. Det nedre höljet kan tas bort relativt enkelt (de två skruvarna på vattenkylningsanslutningen måste också lossas) och du kan komma åt alla viktiga komponenter, inklusive RAM, 2x M.2-2280 SSD eller WLAN-modulen.
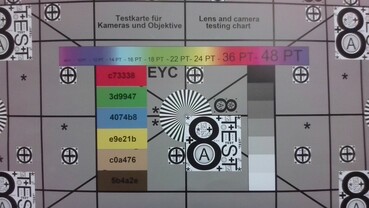
Utbudet av anslutningar är mycket omfattande eftersom, förutom tillräckliga USB-portar, Thunderbolt 4 och HDMI också finns tillgängliga. Kortläsaren uppnår genomsnittliga överföringshastigheter i kombination med vårt referenskort (Angelbird AV Pro V60) och 1080p-webbkameran tar tillräckligt skarpa bilder. Wi-Fi 6E-modulen från Intel (AX211) uppnår mycket bra överföringshastigheter tillsammans med vår referensrouter, men den senaste Wi-Fi 7-standarden stöds ännu inte.
| SD Card Reader | |
| average JPG Copy Test (av. of 3 runs) | |
| Genomsnitt av klass Gaming (19 - 197.3, n=68, senaste 2 åren) | |
| SCHENKER XMG Neo 17 E24 (Angelbird AV Pro V60) | |
| Medion Erazer Beast X40 2024 (AV PRO microSD 128 GB V60) | |
| MSI GE78HX 13VH-070US (Angelibird AV Pro V60) | |
| maximum AS SSD Seq Read Test (1GB) | |
| Genomsnitt av klass Gaming (25.8 - 263, n=67, senaste 2 åren) | |
| Medion Erazer Beast X40 2024 (AV PRO microSD 128 GB V60) | |
| MSI GE78HX 13VH-070US (Angelibird AV Pro V60) | |
| SCHENKER XMG Neo 17 E24 (Angelbird AV Pro V60) | |
| Networking | |
| SCHENKER XMG Neo 17 E24 | |
| iperf3 transmit AXE11000 | |
| iperf3 receive AXE11000 | |
| Medion Erazer Beast X40 2024 | |
| iperf3 transmit AXE11000 | |
| iperf3 receive AXE11000 | |
| HP Omen 17-db0079ng | |
| iperf3 transmit AXE11000 | |
| iperf3 receive AXE11000 | |
| Eurocom Raptor X17 Core i9-14900HX | |
| iperf3 transmit AXE11000 | |
| iperf3 receive AXE11000 | |
| iperf3 transmit AXE11000 6GHz | |
| iperf3 receive AXE11000 6GHz | |
| MSI GE78HX 13VH-070US | |
| iperf3 transmit AXE11000 | |
| iperf3 receive AXE11000 | |
| iperf3 transmit AXE11000 6GHz | |
| iperf3 receive AXE11000 6GHz | |

Inmatningsenheter - Mekaniskt Cherry-tangentbord
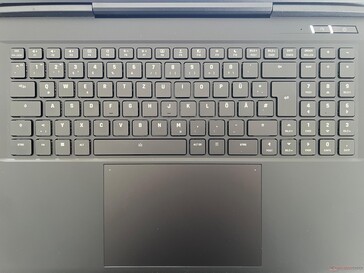
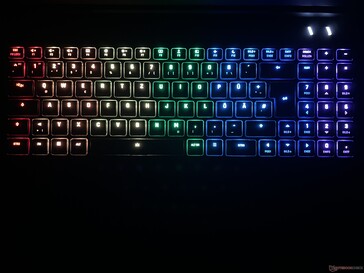
Neo 17 finns tillgänglig med antingen ett konventionellt membrantangentbord med 4 belysningszoner eller ett mekaniskt tangentbord med individuell tangentbelysning (tilläggsavgift på 95 euro). Detta är också installerat i vår testenhet, där taktila brytare från Cherry (MX ULP) används. Dessa lever upp till sitt namn och erbjuder en mycket taktil och exakt skrivkänsla, men knapparna är också mycket högljudda. Detta bör definitivt tas med i beräkningen när du gör ditt val. Den stora ClickPad i glas (15 x 9,5 cm) fungerar utan problem.
Skärm - QHD med 240 Hz
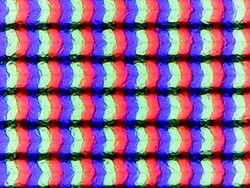
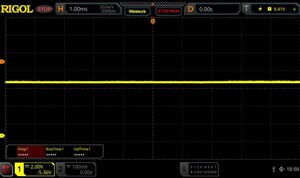
Den 17-tums IPS-skärmen med matt yta erbjuder en upplösning på 2.560 x 1.600 pixlar (16:10) och är mycket lämplig för spel tack vare de snabba svarstiderna och frekvensen på 240 Hz. Den subjektiva bildkvaliteten är också mycket bra. PWM används inte och det finns inga större problem med halos.
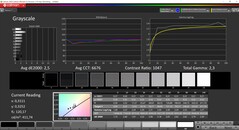
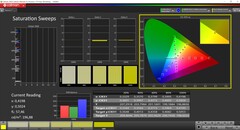
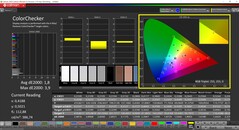
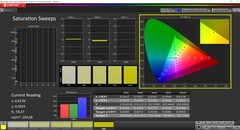
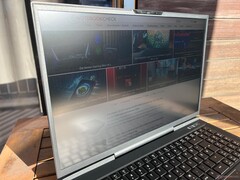
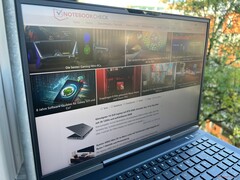
Den genomsnittliga ljusstyrkan är cirka 400 cd/m², även om svartnivån är något högre på 0,39. Detta resulterar i ett maximalt kontrastförhållande på drygt 1.000:1, vilket är bra. Panelen bör vara ännu ljusare utomhus. Fabrikskalibreringen är redan mycket bra, men vi kan optimera skärmen ytterligare med vår kalibrering. Den motsvarande profilen finns tillgänglig för gratis nedladdning i rutan till höger. Tillsammans med den fullständiga sRGB-täckningen är panelen också lämplig för redigering av bilder/videor.
| |||||||||||||||||||||||||
Distribution av ljusstyrkan: 88 %
Mitt på batteriet: 412 cd/m²
Kontrast: 1056:1 (Svärta: 0.39 cd/m²)
ΔE Color 1.8 | 0.5-29.43 Ø4.87, calibrated: 0.9
ΔE Greyscale 2.5 | 0.5-98 Ø5.1
69.6% AdobeRGB 1998 (Argyll 2.2.0 3D)
98.4% sRGB (Argyll 2.2.0 3D)
69% Display P3 (Argyll 2.2.0 3D)
Gamma: 2.3
| SCHENKER XMG Neo 17 E24 NE170QDM-NZ1, IPS, 2560x1600, 17", 240 Hz | Medion Erazer Beast X40 2024 BOE NE170QDM-NZ1, IPS, 2560x1600, 17", 240 Hz | HP Omen 17-db0079ng BOE0B67, IPS, 2560x1440, 17.3", 240 Hz | Eurocom Raptor X17 Core i9-14900HX BOE CQ NE173QUM-NY1, IPS, 3840x2160, 17.3", 144 Hz | MSI GE78HX 13VH-070US AU Optronics B170QAN01.2, IPS, 2560x1600, 17", 240 Hz | |
|---|---|---|---|---|---|
| Display | -0% | -3% | 20% | 22% | |
| Display P3 Coverage | 69 | 68.1 -1% | 66.2 -4% | 95.9 39% | 97.6 41% |
| sRGB Coverage | 98.4 | 99.5 1% | 95.5 -3% | 99.8 1% | 99.9 2% |
| AdobeRGB 1998 Coverage | 69.6 | 69 -1% | 68.1 -2% | 84.2 21% | 86.5 24% |
| Response Times | 4% | -17% | -40% | 38% | |
| Response Time Grey 50% / Grey 80% * | 12.1 ? | 11.7 ? 3% | 14.4 ? -19% | 14.8 ? -22% | 4.2 ? 65% |
| Response Time Black / White * | 7.2 ? | 6.9 ? 4% | 8.3 ? -15% | 11.4 ? -58% | 6.4 ? 11% |
| PWM Frequency | |||||
| Screen | 14% | -9% | -25% | -51% | |
| Brightness middle | 412 | 422 2% | 363 -12% | 544.6 32% | 398.6 -3% |
| Brightness | 401 | 388 -3% | 341 -15% | 507 26% | 384 -4% |
| Brightness Distribution | 88 | 87 -1% | 84 -5% | 77 -12% | 89 1% |
| Black Level * | 0.39 | 0.42 -8% | 0.38 3% | 0.48 -23% | 0.46 -18% |
| Contrast | 1056 | 1005 -5% | 955 -10% | 1135 7% | 867 -18% |
| Colorchecker dE 2000 * | 1.8 | 1.42 21% | 1.74 3% | 3.38 -88% | 4.05 -125% |
| Colorchecker dE 2000 max. * | 3.9 | 1.97 49% | 5.39 -38% | 7.13 -83% | 8.68 -123% |
| Colorchecker dE 2000 calibrated * | 0.9 | 0.7 22% | 1.43 -59% | 1.03 -14% | 1.02 -13% |
| Greyscale dE 2000 * | 2.5 | 1.2 52% | 1.3 48% | 4.3 -72% | 6.5 -160% |
| Gamma | 2.3 96% | 2.078 106% | 2.235 98% | 2.42 91% | 2.11 104% |
| CCT | 6676 97% | 6581 99% | 6346 102% | 7356 88% | 7518 86% |
| Totalt genomsnitt (program/inställningar) | 6% /
10% | -10% /
-9% | -15% /
-18% | 3% /
-23% |
* ... mindre är bättre
Visa svarstider
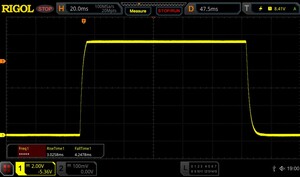
| ↔ Svarstid svart till vitt | ||
|---|---|---|
| 7.2 ms ... stiga ↗ och falla ↘ kombinerat | ↗ 3 ms stiga | |
| ↘ 4.2 ms hösten | ||
| Skärmen visar väldigt snabba svarsfrekvenser i våra tester och borde vara mycket väl lämpad för fartfyllt spel. I jämförelse sträcker sig alla testade enheter från 0.1 (minst) till 240 (maximalt) ms. » 18 % av alla enheter är bättre. Det betyder att den uppmätta svarstiden är bättre än genomsnittet av alla testade enheter (20.8 ms). | ||
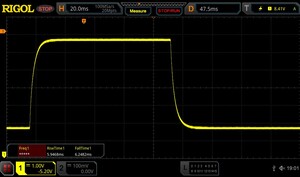
| ↔ Svarstid 50 % grått till 80 % grått | ||
| 12.1 ms ... stiga ↗ och falla ↘ kombinerat | ↗ 5.9 ms stiga | |
| ↘ 6.2 ms hösten | ||
| Skärmen visar bra svarsfrekvens i våra tester, men kan vara för långsam för konkurrenskraftiga spelare. I jämförelse sträcker sig alla testade enheter från 0.165 (minst) till 636 (maximalt) ms. » 23 % av alla enheter är bättre. Det betyder att den uppmätta svarstiden är bättre än genomsnittet av alla testade enheter (32.5 ms). | ||
Skärmflimmer / PWM (Puls-Width Modulation)
| Skärmflimmer / PWM upptäcktes inte | |||
Som jämförelse: 53 % av alla testade enheter använder inte PWM för att dämpa skärmen. Om PWM upptäcktes mättes ett medelvärde av 8516 (minst: 5 - maximum: 343500) Hz. | |||
Prestanda - Raptor Lake-HX
Neo 17 är exklusivt utrustad med Intel Core i9-14900HX. 16 GB RAM är installerat som standard, men upp till 96 GB är möjligt tack vare två SO-DIMM-platser (tillägg 260 euro).
Testförhållanden
XMG Neo 17 erbjuder olika energiprofiler, som vi har sammanfattat i följande tabell. Vi använde Overboost-läget för våra benchmarks och mätningar, eftersom skillnaden i brus jämfört med Enthusiast-läget är liten. Tillverkaren tillhandahåller också en Deep Dive för ytterligare teknisk bakgrundsinformation om Neo 17 och energiprofilerna.
| Energiprofil | CPU TDP | CB R23 Multi | GPU TDP | Time Spy Grafik | CP 2077 Ultra QHD | Max. fläktvolym |
|---|---|---|---|---|---|---|
| Balanserad | 45 W | 14 899 poäng | 130 W | 10 778 poäng | 73,9 FPS | 43,1 dB(A) |
| Enthusiast | 75 W | 22 027 poäng | 150 W | 18 021 poäng | 78,6 FPS | 49,9 dB(A) |
| Overboost | 160/140 W | 31 740 poäng | 175 W | 19 155 poäng | 80,7 FPS | 51,9 dB(A) |
Processor - Core i9-14900HX
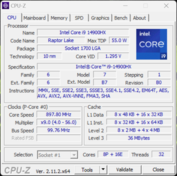
Intel Core i9-14900HX är fortfarande en av de snabbaste mobila processorerna och det är inte troligt att detta kommer att förändras mycket med de kommande Arrow Lake-chipen. Processorns strömförsörjning är utmärkt, eftersom den kan förbruka 160 watt under korta perioder och 140 watt kontinuerligt. För användaren innebär detta mycket hög och konstant prestanda. I batteriläge måste man dock räkna med betydande förluster, eftersom processorn tillåts förbruka maximalt 35 watt, vilket motsvarar en 65-procentig minskning av prestandan i flerkärniga tester. Ytterligare CPU-benchmarks finns tillgängliga i vårt teknikavsnitt.
Cinebench R15 Multi loop
Cinebench R23: Multi Core | Single Core
Cinebench R20: CPU (Multi Core) | CPU (Single Core)
Cinebench R15: CPU Multi 64Bit | CPU Single 64Bit
Blender: v2.79 BMW27 CPU
7-Zip 18.03: 7z b 4 | 7z b 4 -mmt1
Geekbench 6.4: Multi-Core | Single-Core
Geekbench 5.5: Multi-Core | Single-Core
HWBOT x265 Benchmark v2.2: 4k Preset
LibreOffice : 20 Documents To PDF
R Benchmark 2.5: Overall mean
| CPU Performance Rating | |
| SCHENKER XMG Neo 17 E24 | |
| MSI GE78HX 13VH-070US -2! | |
| Genomsnitt Intel Core i9-14900HX | |
| Eurocom Raptor X17 Core i9-14900HX | |
| Medion Erazer Beast X40 2024 | |
| Genomsnitt av klass Gaming | |
| HP Omen 17-db0079ng | |
| Cinebench R23 / Multi Core | |
| MSI GE78HX 13VH-070US | |
| SCHENKER XMG Neo 17 E24 | |
| Eurocom Raptor X17 Core i9-14900HX | |
| Genomsnitt Intel Core i9-14900HX (17078 - 36249, n=37) | |
| Medion Erazer Beast X40 2024 | |
| Genomsnitt av klass Gaming (5668 - 39652, n=151, senaste 2 åren) | |
| HP Omen 17-db0079ng | |
| Cinebench R23 / Single Core | |
| SCHENKER XMG Neo 17 E24 | |
| Medion Erazer Beast X40 2024 | |
| Genomsnitt Intel Core i9-14900HX (1720 - 2245, n=37) | |
| MSI GE78HX 13VH-070US | |
| Eurocom Raptor X17 Core i9-14900HX | |
| Genomsnitt av klass Gaming (1136 - 2252, n=151, senaste 2 åren) | |
| HP Omen 17-db0079ng | |
| Cinebench R20 / CPU (Multi Core) | |
| MSI GE78HX 13VH-070US | |
| SCHENKER XMG Neo 17 E24 | |
| Eurocom Raptor X17 Core i9-14900HX | |
| Genomsnitt Intel Core i9-14900HX (6579 - 13832, n=37) | |
| Medion Erazer Beast X40 2024 | |
| Genomsnitt av klass Gaming (2179 - 15517, n=151, senaste 2 åren) | |
| HP Omen 17-db0079ng | |
| Cinebench R20 / CPU (Single Core) | |
| SCHENKER XMG Neo 17 E24 | |
| Medion Erazer Beast X40 2024 | |
| Genomsnitt Intel Core i9-14900HX (657 - 859, n=37) | |
| Eurocom Raptor X17 Core i9-14900HX | |
| MSI GE78HX 13VH-070US | |
| Genomsnitt av klass Gaming (439 - 866, n=151, senaste 2 åren) | |
| HP Omen 17-db0079ng | |
| Cinebench R15 / CPU Multi 64Bit | |
| MSI GE78HX 13VH-070US | |
| SCHENKER XMG Neo 17 E24 | |
| Eurocom Raptor X17 Core i9-14900HX | |
| Genomsnitt Intel Core i9-14900HX (3263 - 5589, n=38) | |
| Genomsnitt av klass Gaming (905 - 6074, n=154, senaste 2 åren) | |
| Medion Erazer Beast X40 2024 | |
| HP Omen 17-db0079ng | |
| Cinebench R15 / CPU Single 64Bit | |
| SCHENKER XMG Neo 17 E24 | |
| Medion Erazer Beast X40 2024 | |
| Genomsnitt Intel Core i9-14900HX (247 - 323, n=37) | |
| MSI GE78HX 13VH-070US | |
| Eurocom Raptor X17 Core i9-14900HX | |
| Genomsnitt av klass Gaming (191.9 - 343, n=151, senaste 2 åren) | |
| HP Omen 17-db0079ng | |
| Blender / v2.79 BMW27 CPU | |
| HP Omen 17-db0079ng | |
| Genomsnitt av klass Gaming (81 - 555, n=144, senaste 2 åren) | |
| Medion Erazer Beast X40 2024 | |
| Genomsnitt Intel Core i9-14900HX (91 - 206, n=37) | |
| Eurocom Raptor X17 Core i9-14900HX | |
| SCHENKER XMG Neo 17 E24 | |
| MSI GE78HX 13VH-070US | |
| 7-Zip 18.03 / 7z b 4 | |
| MSI GE78HX 13VH-070US | |
| SCHENKER XMG Neo 17 E24 | |
| Eurocom Raptor X17 Core i9-14900HX | |
| Genomsnitt Intel Core i9-14900HX (66769 - 136645, n=37) | |
| Medion Erazer Beast X40 2024 | |
| Genomsnitt av klass Gaming (23795 - 144064, n=149, senaste 2 åren) | |
| HP Omen 17-db0079ng | |
| 7-Zip 18.03 / 7z b 4 -mmt1 | |
| Medion Erazer Beast X40 2024 | |
| SCHENKER XMG Neo 17 E24 | |
| MSI GE78HX 13VH-070US | |
| Genomsnitt Intel Core i9-14900HX (5452 - 7545, n=37) | |
| Eurocom Raptor X17 Core i9-14900HX | |
| Genomsnitt av klass Gaming (4199 - 7573, n=149, senaste 2 åren) | |
| HP Omen 17-db0079ng | |
| Geekbench 6.4 / Multi-Core | |
| SCHENKER XMG Neo 17 E24 | |
| Eurocom Raptor X17 Core i9-14900HX | |
| Genomsnitt Intel Core i9-14900HX (13158 - 19665, n=37) | |
| Medion Erazer Beast X40 2024 | |
| Genomsnitt av klass Gaming (5340 - 21668, n=119, senaste 2 åren) | |
| HP Omen 17-db0079ng | |
| Geekbench 6.4 / Single-Core | |
| Medion Erazer Beast X40 2024 | |
| SCHENKER XMG Neo 17 E24 | |
| Genomsnitt Intel Core i9-14900HX (2419 - 3129, n=37) | |
| Eurocom Raptor X17 Core i9-14900HX | |
| Genomsnitt av klass Gaming (1490 - 3219, n=119, senaste 2 åren) | |
| HP Omen 17-db0079ng | |
| Geekbench 5.5 / Multi-Core | |
| MSI GE78HX 13VH-070US | |
| SCHENKER XMG Neo 17 E24 | |
| Genomsnitt Intel Core i9-14900HX (8618 - 23194, n=37) | |
| Medion Erazer Beast X40 2024 | |
| Genomsnitt av klass Gaming (4557 - 25855, n=148, senaste 2 åren) | |
| HP Omen 17-db0079ng | |
| Eurocom Raptor X17 Core i9-14900HX | |
| Geekbench 5.5 / Single-Core | |
| Medion Erazer Beast X40 2024 | |
| SCHENKER XMG Neo 17 E24 | |
| MSI GE78HX 13VH-070US | |
| Genomsnitt Intel Core i9-14900HX (1669 - 2210, n=37) | |
| Genomsnitt av klass Gaming (986 - 2423, n=148, senaste 2 åren) | |
| HP Omen 17-db0079ng | |
| Eurocom Raptor X17 Core i9-14900HX | |
| HWBOT x265 Benchmark v2.2 / 4k Preset | |
| MSI GE78HX 13VH-070US | |
| Eurocom Raptor X17 Core i9-14900HX | |
| SCHENKER XMG Neo 17 E24 | |
| Genomsnitt Intel Core i9-14900HX (16.8 - 38.9, n=37) | |
| Medion Erazer Beast X40 2024 | |
| Genomsnitt av klass Gaming (6.72 - 42.9, n=148, senaste 2 åren) | |
| HP Omen 17-db0079ng | |
| LibreOffice / 20 Documents To PDF | |
| HP Omen 17-db0079ng | |
| Genomsnitt av klass Gaming (19 - 96.6, n=147, senaste 2 åren) | |
| MSI GE78HX 13VH-070US | |
| Medion Erazer Beast X40 2024 | |
| Genomsnitt Intel Core i9-14900HX (19 - 85.1, n=37) | |
| SCHENKER XMG Neo 17 E24 | |
| Eurocom Raptor X17 Core i9-14900HX | |
| R Benchmark 2.5 / Overall mean | |
| HP Omen 17-db0079ng | |
| Genomsnitt av klass Gaming (0.3609 - 0.759, n=150, senaste 2 åren) | |
| Genomsnitt Intel Core i9-14900HX (0.3604 - 0.4859, n=37) | |
| Eurocom Raptor X17 Core i9-14900HX | |
| MSI GE78HX 13VH-070US | |
| SCHENKER XMG Neo 17 E24 | |
| Medion Erazer Beast X40 2024 | |
* ... mindre är bättre
AIDA64: FP32 Ray-Trace | FPU Julia | CPU SHA3 | CPU Queen | FPU SinJulia | FPU Mandel | CPU AES | CPU ZLib | FP64 Ray-Trace | CPU PhotoWorxx
| Performance Rating | |
| Eurocom Raptor X17 Core i9-14900HX | |
| SCHENKER XMG Neo 17 E24 | |
| MSI GE78HX 13VH-070US | |
| Genomsnitt Intel Core i9-14900HX | |
| HP Omen 17-db0079ng | |
| Medion Erazer Beast X40 2024 | |
| Genomsnitt av klass Gaming | |
| AIDA64 / FP32 Ray-Trace | |
| SCHENKER XMG Neo 17 E24 | |
| MSI GE78HX 13VH-070US | |
| Eurocom Raptor X17 Core i9-14900HX | |
| HP Omen 17-db0079ng | |
| Genomsnitt Intel Core i9-14900HX (13098 - 33474, n=36) | |
| Genomsnitt av klass Gaming (4986 - 81639, n=147, senaste 2 åren) | |
| Medion Erazer Beast X40 2024 | |
| AIDA64 / FPU Julia | |
| SCHENKER XMG Neo 17 E24 | |
| MSI GE78HX 13VH-070US | |
| Eurocom Raptor X17 Core i9-14900HX | |
| Genomsnitt Intel Core i9-14900HX (67573 - 166040, n=36) | |
| HP Omen 17-db0079ng | |
| Genomsnitt av klass Gaming (25360 - 252486, n=147, senaste 2 åren) | |
| Medion Erazer Beast X40 2024 | |
| AIDA64 / CPU SHA3 | |
| Eurocom Raptor X17 Core i9-14900HX | |
| SCHENKER XMG Neo 17 E24 | |
| MSI GE78HX 13VH-070US | |
| Genomsnitt Intel Core i9-14900HX (3589 - 7979, n=36) | |
| Medion Erazer Beast X40 2024 | |
| Genomsnitt av klass Gaming (1339 - 10389, n=147, senaste 2 åren) | |
| HP Omen 17-db0079ng | |
| AIDA64 / CPU Queen | |
| Eurocom Raptor X17 Core i9-14900HX | |
| SCHENKER XMG Neo 17 E24 | |
| MSI GE78HX 13VH-070US | |
| Genomsnitt Intel Core i9-14900HX (118405 - 148966, n=36) | |
| Medion Erazer Beast X40 2024 | |
| HP Omen 17-db0079ng | |
| Genomsnitt av klass Gaming (50699 - 200651, n=147, senaste 2 åren) | |
| AIDA64 / FPU SinJulia | |
| MSI GE78HX 13VH-070US | |
| SCHENKER XMG Neo 17 E24 | |
| Eurocom Raptor X17 Core i9-14900HX | |
| Genomsnitt Intel Core i9-14900HX (10475 - 18517, n=36) | |
| HP Omen 17-db0079ng | |
| Medion Erazer Beast X40 2024 | |
| Genomsnitt av klass Gaming (4800 - 32988, n=147, senaste 2 åren) | |
| AIDA64 / FPU Mandel | |
| SCHENKER XMG Neo 17 E24 | |
| MSI GE78HX 13VH-070US | |
| Eurocom Raptor X17 Core i9-14900HX | |
| Genomsnitt Intel Core i9-14900HX (32543 - 83662, n=36) | |
| HP Omen 17-db0079ng | |
| Genomsnitt av klass Gaming (12321 - 134044, n=147, senaste 2 åren) | |
| Medion Erazer Beast X40 2024 | |
| AIDA64 / CPU AES | |
| Eurocom Raptor X17 Core i9-14900HX | |
| Genomsnitt Intel Core i9-14900HX (86964 - 241777, n=36) | |
| SCHENKER XMG Neo 17 E24 | |
| MSI GE78HX 13VH-070US | |
| Genomsnitt av klass Gaming (19065 - 328679, n=147, senaste 2 åren) | |
| Medion Erazer Beast X40 2024 | |
| HP Omen 17-db0079ng | |
| AIDA64 / CPU ZLib | |
| MSI GE78HX 13VH-070US | |
| Eurocom Raptor X17 Core i9-14900HX | |
| SCHENKER XMG Neo 17 E24 | |
| Genomsnitt Intel Core i9-14900HX (1054 - 2292, n=36) | |
| Medion Erazer Beast X40 2024 | |
| Genomsnitt av klass Gaming (373 - 2531, n=147, senaste 2 åren) | |
| HP Omen 17-db0079ng | |
| AIDA64 / FP64 Ray-Trace | |
| MSI GE78HX 13VH-070US | |
| SCHENKER XMG Neo 17 E24 | |
| Eurocom Raptor X17 Core i9-14900HX | |
| HP Omen 17-db0079ng | |
| Genomsnitt Intel Core i9-14900HX (6809 - 18349, n=36) | |
| Genomsnitt av klass Gaming (2540 - 43430, n=147, senaste 2 åren) | |
| Medion Erazer Beast X40 2024 | |
| AIDA64 / CPU PhotoWorxx | |
| Eurocom Raptor X17 Core i9-14900HX | |
| MSI GE78HX 13VH-070US | |
| SCHENKER XMG Neo 17 E24 | |
| Medion Erazer Beast X40 2024 | |
| Genomsnitt Intel Core i9-14900HX (23903 - 54702, n=36) | |
| HP Omen 17-db0079ng | |
| Genomsnitt av klass Gaming (10805 - 60161, n=147, senaste 2 åren) | |
Systemets prestanda
Neo 17 imponerar också i de syntetiska systembenchmarks, även om konkurrensen i allmänhet är mycket jämn här. I vardagen innebär detta ett extremt responsivt system, även om det finns ett kort häng när man byter grafikkort. Detta är dock helt normalt och kan undvikas genom att helt avaktivera iGPU.
CrossMark: Overall | Productivity | Creativity | Responsiveness
WebXPRT 3: Overall
WebXPRT 4: Overall
Mozilla Kraken 1.1: Total
| PCMark 10 / Score | |
| Medion Erazer Beast X40 2024 | |
| MSI GE78HX 13VH-070US | |
| Genomsnitt Intel Core i9-14900HX, NVIDIA GeForce RTX 4080 Laptop GPU (7703 - 9223, n=7) | |
| SCHENKER XMG Neo 17 E24 | |
| Genomsnitt av klass Gaming (5776 - 9852, n=133, senaste 2 åren) | |
| HP Omen 17-db0079ng | |
| PCMark 10 / Essentials | |
| Genomsnitt Intel Core i9-14900HX, NVIDIA GeForce RTX 4080 Laptop GPU (11255 - 12600, n=7) | |
| MSI GE78HX 13VH-070US | |
| SCHENKER XMG Neo 17 E24 | |
| Medion Erazer Beast X40 2024 | |
| Genomsnitt av klass Gaming (9057 - 12600, n=133, senaste 2 åren) | |
| HP Omen 17-db0079ng | |
| PCMark 10 / Productivity | |
| Medion Erazer Beast X40 2024 | |
| SCHENKER XMG Neo 17 E24 | |
| MSI GE78HX 13VH-070US | |
| Genomsnitt Intel Core i9-14900HX, NVIDIA GeForce RTX 4080 Laptop GPU (6662 - 11410, n=7) | |
| HP Omen 17-db0079ng | |
| Genomsnitt av klass Gaming (6662 - 14612, n=133, senaste 2 åren) | |
| PCMark 10 / Digital Content Creation | |
| Medion Erazer Beast X40 2024 | |
| MSI GE78HX 13VH-070US | |
| Genomsnitt Intel Core i9-14900HX, NVIDIA GeForce RTX 4080 Laptop GPU (14211 - 16246, n=7) | |
| SCHENKER XMG Neo 17 E24 | |
| Genomsnitt av klass Gaming (6807 - 18475, n=133, senaste 2 åren) | |
| HP Omen 17-db0079ng | |
| CrossMark / Overall | |
| Eurocom Raptor X17 Core i9-14900HX | |
| Genomsnitt Intel Core i9-14900HX, NVIDIA GeForce RTX 4080 Laptop GPU (1992 - 2334, n=7) | |
| Medion Erazer Beast X40 2024 | |
| SCHENKER XMG Neo 17 E24 | |
| MSI GE78HX 13VH-070US | |
| Genomsnitt av klass Gaming (1247 - 2344, n=114, senaste 2 åren) | |
| HP Omen 17-db0079ng | |
| CrossMark / Productivity | |
| Eurocom Raptor X17 Core i9-14900HX | |
| Medion Erazer Beast X40 2024 | |
| Genomsnitt Intel Core i9-14900HX, NVIDIA GeForce RTX 4080 Laptop GPU (1812 - 2204, n=7) | |
| MSI GE78HX 13VH-070US | |
| SCHENKER XMG Neo 17 E24 | |
| Genomsnitt av klass Gaming (1299 - 2204, n=114, senaste 2 åren) | |
| HP Omen 17-db0079ng | |
| CrossMark / Creativity | |
| Genomsnitt Intel Core i9-14900HX, NVIDIA GeForce RTX 4080 Laptop GPU (2327 - 2500, n=7) | |
| SCHENKER XMG Neo 17 E24 | |
| Eurocom Raptor X17 Core i9-14900HX | |
| Medion Erazer Beast X40 2024 | |
| Genomsnitt av klass Gaming (1275 - 2660, n=114, senaste 2 åren) | |
| MSI GE78HX 13VH-070US | |
| HP Omen 17-db0079ng | |
| CrossMark / Responsiveness | |
| Eurocom Raptor X17 Core i9-14900HX | |
| Genomsnitt Intel Core i9-14900HX, NVIDIA GeForce RTX 4080 Laptop GPU (1520 - 2254, n=7) | |
| Medion Erazer Beast X40 2024 | |
| Genomsnitt av klass Gaming (1030 - 2330, n=114, senaste 2 åren) | |
| MSI GE78HX 13VH-070US | |
| SCHENKER XMG Neo 17 E24 | |
| HP Omen 17-db0079ng | |
| WebXPRT 3 / Overall | |
| Eurocom Raptor X17 Core i9-14900HX | |
| SCHENKER XMG Neo 17 E24 | |
| Genomsnitt Intel Core i9-14900HX, NVIDIA GeForce RTX 4080 Laptop GPU (310 - 345, n=7) | |
| Medion Erazer Beast X40 2024 | |
| MSI GE78HX 13VH-070US | |
| Genomsnitt av klass Gaming (215 - 480, n=127, senaste 2 åren) | |
| HP Omen 17-db0079ng | |
| WebXPRT 4 / Overall | |
| SCHENKER XMG Neo 17 E24 | |
| Genomsnitt Intel Core i9-14900HX, NVIDIA GeForce RTX 4080 Laptop GPU (300 - 321, n=7) | |
| Eurocom Raptor X17 Core i9-14900HX | |
| Medion Erazer Beast X40 2024 | |
| MSI GE78HX 13VH-070US | |
| Genomsnitt av klass Gaming (176.4 - 335, n=115, senaste 2 åren) | |
| Mozilla Kraken 1.1 / Total | |
| HP Omen 17-db0079ng | |
| Genomsnitt av klass Gaming (409 - 674, n=139, senaste 2 åren) | |
| MSI GE78HX 13VH-070US | |
| Eurocom Raptor X17 Core i9-14900HX | |
| Genomsnitt Intel Core i9-14900HX, NVIDIA GeForce RTX 4080 Laptop GPU (437 - 446, n=7) | |
| SCHENKER XMG Neo 17 E24 | |
| Medion Erazer Beast X40 2024 | |
* ... mindre är bättre
| PCMark 10 Score | 8694 poäng | |
Hjälp | ||
| AIDA64 / Memory Copy | |
| Medion Erazer Beast X40 2024 | |
| SCHENKER XMG Neo 17 E24 | |
| MSI GE78HX 13VH-070US | |
| Eurocom Raptor X17 Core i9-14900HX | |
| Genomsnitt Intel Core i9-14900HX (38028 - 83392, n=36) | |
| HP Omen 17-db0079ng | |
| Genomsnitt av klass Gaming (21750 - 97515, n=147, senaste 2 åren) | |
| AIDA64 / Memory Read | |
| SCHENKER XMG Neo 17 E24 | |
| MSI GE78HX 13VH-070US | |
| Medion Erazer Beast X40 2024 | |
| Genomsnitt Intel Core i9-14900HX (43306 - 87568, n=36) | |
| Eurocom Raptor X17 Core i9-14900HX | |
| Genomsnitt av klass Gaming (22956 - 102937, n=147, senaste 2 åren) | |
| HP Omen 17-db0079ng | |
| AIDA64 / Memory Write | |
| HP Omen 17-db0079ng | |
| Medion Erazer Beast X40 2024 | |
| SCHENKER XMG Neo 17 E24 | |
| MSI GE78HX 13VH-070US | |
| Eurocom Raptor X17 Core i9-14900HX | |
| Genomsnitt Intel Core i9-14900HX (37146 - 80589, n=36) | |
| Genomsnitt av klass Gaming (22297 - 108954, n=147, senaste 2 åren) | |
| AIDA64 / Memory Latency | |
| HP Omen 17-db0079ng | |
| Genomsnitt av klass Gaming (59.5 - 259, n=147, senaste 2 åren) | |
| Eurocom Raptor X17 Core i9-14900HX | |
| Genomsnitt Intel Core i9-14900HX (76.1 - 105, n=36) | |
| MSI GE78HX 13VH-070US | |
| SCHENKER XMG Neo 17 E24 | |
| Medion Erazer Beast X40 2024 | |
* ... mindre är bättre
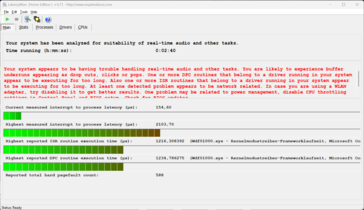
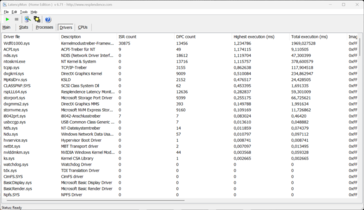
DPC-latenstider
| DPC Latencies / LatencyMon - interrupt to process latency (max), Web, Youtube, Prime95 | |
| MSI GE78HX 13VH-070US | |
| SCHENKER XMG Neo 17 E24 | |
| HP Omen 17-db0079ng | |
| Medion Erazer Beast X40 2024 | |
| Eurocom Raptor X17 Core i9-14900HX | |
* ... mindre är bättre
Masslagring
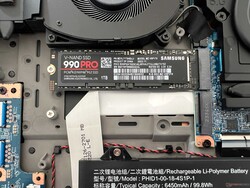
Neo 17 erbjuder två snabba M.2-2280-kortplatser som är anslutna via PCIe 4.0 x4. I testenheten är 1 TB-versionen av Samsung 990 Pro installerad, som uppnår snabba överföringshastigheter och är en av de snabbaste SSD-enheterna på marknaden. Dessutom förblir prestandan helt stabil även under konstant belastning. Efter den första uppstarten har användaren 864 GB till sitt förfogande. Ytterligare SSD-benchmarks kan hittas här.
* ... mindre är bättre
Continuous read: DiskSpd Read Loop, Queue Depth 8
Grafikkort
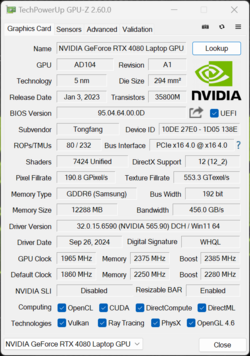
I vår testenhet var den dedikerade Nvidia GeForce RTX 4080 bärbar dator med 12 GB VRAM installerat. Grafikkortet kan förbruka maximalt 175 watt (150 watt TGP + 25 watt Dynamic Boost), så Neo 17 kan utnyttja GPU:n fullt ut. Tack vare Advanced Optimus-grafikomkopplingen är spelprestandan enastående och RTX 4080 laptop är helt tillräcklig för den inbyggda QHD-upplösningen. Dessutom förblir prestandan helt stabil även under konstant belastning.
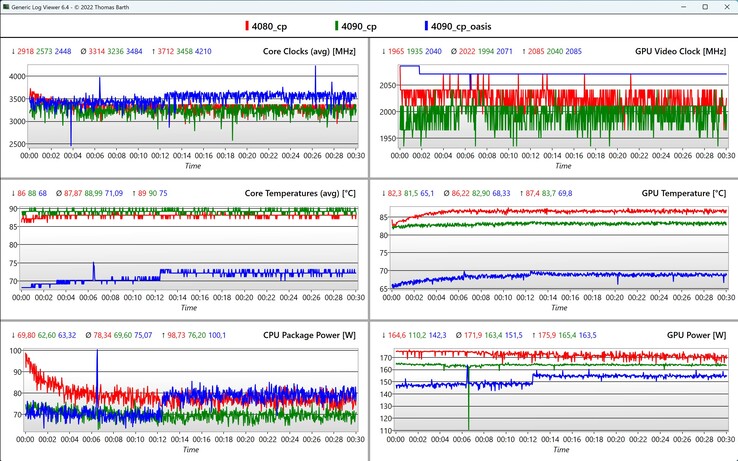
När vi jämför CPU/GPU-data i vår Cyberpunk 2077-loop blir fördelen med extern vattenkylning mycket tydlig, eftersom CPU/GPU-temperaturerna är cirka 20 °C lägre, vilket är anledningen till att fläktarna också behöver arbeta mindre.
I batteriläge är GPU:ns strömförbrukning begränsad till 52 watt, vilket är anledningen till att GPU-prestandan är cirka 53% lägre. Ytterligare GPU-benchmarks finns tillgängliga här.
| 3DMark Performance Rating - Percent | |
| Eurocom Raptor X17 Core i9-14900HX | |
| SCHENKER Neo 17 2024 Engineering Sample -1! | |
| Medion Erazer Beast X40 2024 | |
| SCHENKER XMG Neo 17 E24 | |
| MSI GE78HX 13VH-070US | |
| Genomsnitt NVIDIA GeForce RTX 4080 Laptop GPU | |
| HP Omen 17-db0079ng | |
| Genomsnitt av klass Gaming | |
| 3DMark 11 - 1280x720 Performance GPU | |
| SCHENKER Neo 17 2024 Engineering Sample | |
| Medion Erazer Beast X40 2024 | |
| Eurocom Raptor X17 Core i9-14900HX | |
| SCHENKER XMG Neo 17 E24 | |
| MSI GE78HX 13VH-070US | |
| Genomsnitt NVIDIA GeForce RTX 4080 Laptop GPU (45199 - 63128, n=24) | |
| HP Omen 17-db0079ng | |
| Genomsnitt av klass Gaming (10741 - 72178, n=143, senaste 2 åren) | |
| 3DMark 11 Performance | 45722 poäng | |
| 3DMark Fire Strike Score | 34851 poäng | |
| 3DMark Time Spy Score | 18980 poäng | |
Hjälp | ||
| Blender / v3.3 Classroom OPTIX/RTX | |
| HP Omen 17-db0079ng | |
| Genomsnitt av klass Gaming (10 - 95, n=143, senaste 2 åren) | |
| Genomsnitt NVIDIA GeForce RTX 4080 Laptop GPU (13 - 20, n=22) | |
| MSI GE78HX 13VH-070US | |
| SCHENKER XMG Neo 17 E24 | |
| Eurocom Raptor X17 Core i9-14900HX | |
| Medion Erazer Beast X40 2024 | |
| Blender / v3.3 Classroom CUDA | |
| Genomsnitt av klass Gaming (16 - 175, n=145, senaste 2 åren) | |
| HP Omen 17-db0079ng | |
| Genomsnitt NVIDIA GeForce RTX 4080 Laptop GPU (21 - 28, n=23) | |
| MSI GE78HX 13VH-070US | |
| SCHENKER XMG Neo 17 E24 | |
| Eurocom Raptor X17 Core i9-14900HX | |
| Medion Erazer Beast X40 2024 | |
| Blender / v3.3 Classroom CPU | |
| HP Omen 17-db0079ng | |
| Genomsnitt av klass Gaming (123 - 962, n=150, senaste 2 åren) | |
| Medion Erazer Beast X40 2024 | |
| Genomsnitt NVIDIA GeForce RTX 4080 Laptop GPU (177 - 337, n=23) | |
| Eurocom Raptor X17 Core i9-14900HX | |
| SCHENKER XMG Neo 17 E24 | |
| MSI GE78HX 13VH-070US | |
* ... mindre är bättre
| Performance Rating - Percent | |
| Eurocom Raptor X17 Core i9-14900HX -1! | |
| SCHENKER Neo 17 2024 Engineering Sample -2! | |
| Medion Erazer Beast X40 2024 -1! | |
| SCHENKER XMG Neo 17 E24 | |
| MSI GE78HX 13VH-070US -2! | |
| Genomsnitt av klass Gaming | |
| HP Omen 17-db0079ng -1! | |
| Cyberpunk 2077 2.2 Phantom Liberty - 1920x1080 Ultra Preset (FSR off) | |
| Eurocom Raptor X17 Core i9-14900HX | |
| SCHENKER XMG Neo 17 E24 | |
| Medion Erazer Beast X40 2024 | |
| HP Omen 17-db0079ng | |
| Genomsnitt av klass Gaming (6.76 - 158, n=90, senaste 2 åren) | |
| Baldur's Gate 3 - 1920x1080 Ultra Preset | |
| Eurocom Raptor X17 Core i9-14900HX | |
| Genomsnitt av klass Gaming (34.5 - 208, n=57, senaste 2 åren) | |
| SCHENKER XMG Neo 17 E24 | |
| GTA V - 1920x1080 Highest Settings possible AA:4xMSAA + FX AF:16x | |
| Eurocom Raptor X17 Core i9-14900HX | |
| SCHENKER XMG Neo 17 E24 | |
| SCHENKER Neo 17 2024 Engineering Sample | |
| Medion Erazer Beast X40 2024 | |
| Genomsnitt av klass Gaming (12.1 - 168.2, n=132, senaste 2 åren) | |
| HP Omen 17-db0079ng | |
| MSI GE78HX 13VH-070US | |
| Final Fantasy XV Benchmark - 1920x1080 High Quality | |
| SCHENKER Neo 17 2024 Engineering Sample | |
| Medion Erazer Beast X40 2024 | |
| SCHENKER XMG Neo 17 E24 | |
| MSI GE78HX 13VH-070US | |
| HP Omen 17-db0079ng | |
| Genomsnitt av klass Gaming (19.2 - 201, n=144, senaste 2 åren) | |
| Strange Brigade - 1920x1080 ultra AA:ultra AF:16 | |
| Eurocom Raptor X17 Core i9-14900HX | |
| SCHENKER Neo 17 2024 Engineering Sample | |
| Medion Erazer Beast X40 2024 | |
| SCHENKER XMG Neo 17 E24 | |
| MSI GE78HX 13VH-070US | |
| Genomsnitt av klass Gaming (38.9 - 420, n=140, senaste 2 åren) | |
| HP Omen 17-db0079ng | |
| Dota 2 Reborn - 1920x1080 ultra (3/3) best looking | |
| Eurocom Raptor X17 Core i9-14900HX | |
| Medion Erazer Beast X40 2024 | |
| SCHENKER Neo 17 2024 Engineering Sample | |
| SCHENKER XMG Neo 17 E24 | |
| Genomsnitt av klass Gaming (65.1 - 220, n=148, senaste 2 åren) | |
| MSI GE78HX 13VH-070US | |
| HP Omen 17-db0079ng | |
| X-Plane 11.11 - 1920x1080 high (fps_test=3) | |
| Eurocom Raptor X17 Core i9-14900HX | |
| Medion Erazer Beast X40 2024 | |
| SCHENKER XMG Neo 17 E24 | |
| MSI GE78HX 13VH-070US | |
| SCHENKER Neo 17 2024 Engineering Sample | |
| Genomsnitt av klass Gaming (32.8 - 166.2, n=151, senaste 2 åren) | |
| HP Omen 17-db0079ng | |
Cyberpunk 2077 Ultra FPS chart
| låg | med. | hög | ultra | QHD DLSS | QHD | 4K | |
|---|---|---|---|---|---|---|---|
| GTA V (2015) | 181.7 | 143.4 | 135.1 | 163.7 | |||
| Dota 2 Reborn (2015) | 220 | 197.1 | 194 | 179.7 | |||
| Final Fantasy XV Benchmark (2018) | 226 | 215 | 173.9 | 134.4 | |||
| X-Plane 11.11 (2018) | 202 | 176.8 | 138.9 | ||||
| Far Cry 5 (2018) | 179 | 162 | 157 | ||||
| Strange Brigade (2018) | 381 | 347 | 239 | 122 | |||
| Shadow of the Tomb Raider (2018) | 212 | 176 | |||||
| Far Cry 6 (2021) | 156 | 141 | |||||
| F1 23 (2023) | 321 | 111.6 | 70.7 | 35.5 | |||
| Baldur's Gate 3 (2023) | 231 | 143 | 122.2 | 111.8 | 88.3 | ||
| Cyberpunk 2077 2.2 Phantom Liberty (2023) | 101.1 | 146.9 | 133.8 | 121.3 | 110.1 | 80.7 | |
| Assassin's Creed Mirage (2023) | 197 | 153 | 129 | ||||
| Call of Duty Modern Warfare 3 2023 (2023) | 180 | 171 | 123 | ||||
| Avatar Frontiers of Pandora (2023) | 125 | 97 | 66 | ||||
| F1 24 (2024) | 304 | 323 | 289 | 112.2 | 71.2 |
Utsläpp & Energi
Bullerutsläpp
Kylningen med två fläktar är i princip densamma som förra årets modell, men konfigurationer av Neo 17 med RTX 4080/4090 bärbar dator erbjuder en modifierad kanal för vattenkylning, som nu också går direkt över CPU. Fläktarna är alltid igång, men under mycket enkla uppgifter (surfa på internet, e-post, videor) kan du bara höra ett mycket lågt ljud. När du spelar blir det dock betydligt högre med 52 dB(A). Även om det finns konkurrenter med högre ljudnivå bör du ändå använda hörlurar när du spelar. Under benchmarktesterna/spelen hördes också ett svagt gnisslande ljud från spolen.
Ljudnivå
| Låg belastning |
| 28.1 / 28.1 / 28.1 dB(A) |
| Hårddisk |
| 0 dB(A) |
| Hög belastning |
| 43.1 / 51.9 dB(A) |
 | ||
30 dB tyst 40 dB(A) hörbar 50 dB(A) högt ljud |
||
min: | ||
| SCHENKER XMG Neo 17 E24 NVIDIA GeForce RTX 4080 Laptop GPU, i9-14900HX, Samsung 990 Pro 1 TB | Medion Erazer Beast X40 2024 NVIDIA GeForce RTX 4090 Laptop GPU, i9-14900HX, Phison E18-1TB-PHISON-SSD-BICS5 | HP Omen 17-db0079ng NVIDIA GeForce RTX 4070 Laptop GPU, R7 8845HS, WD PC SN560 SDDPNQE-1T00 | Eurocom Raptor X17 Core i9-14900HX NVIDIA GeForce RTX 4090 Laptop GPU, i9-14900HX, Corsair MP700 Pro 2TB | MSI GE78HX 13VH-070US NVIDIA GeForce RTX 4080 Laptop GPU, i9-13950HX, Samsung PM9A1 MZVL22T0HBLB | |
|---|---|---|---|---|---|
| Noise | -6% | -2% | -7% | -0% | |
| av / miljö * | 23.3 | 25 -7% | 25 -7% | 23.7 -2% | 23.4 -0% |
| Idle Minimum * | 28.1 | 28 -0% | 25 11% | 31.7 -13% | 24.2 14% |
| Idle Average * | 28.1 | 29 -3% | 29 -3% | 31.7 -13% | 25.6 9% |
| Idle Maximum * | 28.1 | 32 -14% | 33 -17% | 32.9 -17% | 31 -10% |
| Load Average * | 43.1 | 48 -11% | 45 -4% | 34 21% | 43.3 -0% |
| Cyberpunk 2077 ultra * | 51.9 | 48 8% | |||
| Load Maximum * | 51.9 | 52 -0% | 52 -0% | 61.6 -19% | 59.1 -14% |
| Witcher 3 ultra * | 50 | 61.6 | 56.3 |
* ... mindre är bättre
Temperatur
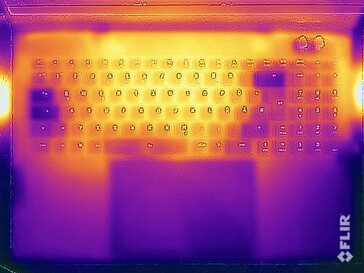
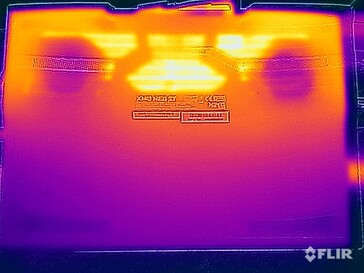
Schenker använder ett termiskt gränssnitt i flytande metall för både CPU och GPU i konfigurationer från RTX 4080 laptop och uppåt. Höljets temperaturer förblir svala under enkla uppgifter, men vi uppmätte mer än 50 °C på undersidan vid vissa punkter under belastning. På grund av sin storlek kommer Neo 17 dock inte att placeras på dina lår, så dessa värden är inte problematiska. Tangentbordsområdet värms också upp märkbart, men det finns inga begränsningar här. I stresstestet stabiliserades grafikkortet på 160 watt och processorn på cirka 70 watt.
(-) Den maximala temperaturen på ovansidan är 46.2 °C / 115 F, jämfört med genomsnittet av 40.4 °C / 105 F , allt från 21.2 till 68.8 °C för klassen Gaming.
(-) Botten värms upp till maximalt 56.7 °C / 134 F, jämfört med genomsnittet av 43.2 °C / 110 F
(+) Vid tomgångsbruk är medeltemperaturen för ovansidan 28.2 °C / 83 F, jämfört med enhetsgenomsnittet på 33.9 °C / ### class_avg_f### F.
(-) 3: The average temperature for the upper side is 39.8 °C / 104 F, compared to the average of 33.9 °C / 93 F for the class Gaming.
(+) Handledsstöden och pekplattan når maximal hudtemperatur (33.5 °C / 92.3 F) och är därför inte varma.
(-) Medeltemperaturen för handledsstödsområdet på liknande enheter var 28.9 °C / 84 F (-4.6 °C / -8.3 F).
| SCHENKER XMG Neo 17 E24 Intel Core i9-14900HX, NVIDIA GeForce RTX 4080 Laptop GPU | Medion Erazer Beast X40 2024 Intel Core i9-14900HX, NVIDIA GeForce RTX 4090 Laptop GPU | HP Omen 17-db0079ng AMD Ryzen 7 8845HS, NVIDIA GeForce RTX 4070 Laptop GPU | Eurocom Raptor X17 Core i9-14900HX Intel Core i9-14900HX, NVIDIA GeForce RTX 4090 Laptop GPU | MSI GE78HX 13VH-070US Intel Core i9-13950HX, NVIDIA GeForce RTX 4080 Laptop GPU | |
|---|---|---|---|---|---|
| Heat | 1% | 14% | 1% | 10% | |
| Maximum Upper Side * | 46.2 | 47 -2% | 44 5% | 52.2 -13% | 37.4 19% |
| Maximum Bottom * | 56.7 | 54 5% | 45 21% | 53.2 6% | 45 21% |
| Idle Upper Side * | 29.8 | 30 -1% | 26 13% | 28.6 4% | 29.8 -0% |
| Idle Bottom * | 32 | 32 -0% | 27 16% | 29.8 7% | 32.4 -1% |
* ... mindre är bättre
Högtalare
Stereohögtalarna är inte särskilt bra, men räcker för en och annan YouTube-video. Högtalarna är dock inte riktigt användbara för spel ändå på grund av de högljudda fläktarna.
SCHENKER XMG Neo 17 E24 ljudanalys
(+) | högtalare kan spela relativt högt (83.7 dB)
Bas 100 - 315 Hz
(-) | nästan ingen bas - i genomsnitt 19% lägre än medianen
(+) | basen är linjär (6% delta till föregående frekvens)
Mellan 400 - 2000 Hz
(±) | högre mellan - i genomsnitt 6.6% högre än median
(±) | linjäriteten för mids är genomsnittlig (9.4% delta till föregående frekvens)
Högsta 2 - 16 kHz
(+) | balanserade toppar - endast 3.6% från medianen
(±) | linjäriteten för toppar är genomsnittlig (7.1% delta till föregående frekvens)
Totalt 100 - 16 000 Hz
(±) | linjäriteten för det totala ljudet är genomsnittlig (18.3% skillnad mot median)
Jämfört med samma klass
» 56% av alla testade enheter i den här klassen var bättre, 8% liknande, 35% sämre
» Den bästa hade ett delta på 6%, genomsnittet var 18%, sämst var 132%
Jämfört med alla testade enheter
» 37% av alla testade enheter var bättre, 7% liknande, 55% sämre
» Den bästa hade ett delta på 4%, genomsnittet var 24%, sämst var 134%
Medion Erazer Beast X40 2024 ljudanalys
(+) | högtalare kan spela relativt högt (88 dB)
Bas 100 - 315 Hz
(±) | reducerad bas - i genomsnitt 14.7% lägre än medianen
(±) | linjäriteten för basen är genomsnittlig (7.2% delta till föregående frekvens)
Mellan 400 - 2000 Hz
(+) | balanserad mellan - endast 3.7% från medianen
(+) | mids är linjära (5.8% delta till föregående frekvens)
Högsta 2 - 16 kHz
(+) | balanserade toppar - endast 2.8% från medianen
(+) | toppar är linjära (6.4% delta till föregående frekvens)
Totalt 100 - 16 000 Hz
(+) | det totala ljudet är linjärt (12.1% skillnad mot median)
Jämfört med samma klass
» 11% av alla testade enheter i den här klassen var bättre, 4% liknande, 85% sämre
» Den bästa hade ett delta på 6%, genomsnittet var 18%, sämst var 132%
Jämfört med alla testade enheter
» 8% av alla testade enheter var bättre, 2% liknande, 90% sämre
» Den bästa hade ett delta på 4%, genomsnittet var 24%, sämst var 134%
HP Omen 17-db0079ng ljudanalys
(±) | högtalarljudstyrkan är genomsnittlig men bra (80 dB)
Bas 100 - 315 Hz
(-) | nästan ingen bas - i genomsnitt 19.1% lägre än medianen
(±) | linjäriteten för basen är genomsnittlig (10.3% delta till föregående frekvens)
Mellan 400 - 2000 Hz
(+) | balanserad mellan - endast 1.9% från medianen
(+) | mids är linjära (4.4% delta till föregående frekvens)
Högsta 2 - 16 kHz
(+) | balanserade toppar - endast 3.8% från medianen
(±) | linjäriteten för toppar är genomsnittlig (7.8% delta till föregående frekvens)
Totalt 100 - 16 000 Hz
(+) | det totala ljudet är linjärt (14.3% skillnad mot median)
Jämfört med samma klass
» 25% av alla testade enheter i den här klassen var bättre, 7% liknande, 69% sämre
» Den bästa hade ett delta på 6%, genomsnittet var 18%, sämst var 132%
Jämfört med alla testade enheter
» 16% av alla testade enheter var bättre, 4% liknande, 80% sämre
» Den bästa hade ett delta på 4%, genomsnittet var 24%, sämst var 134%
Eurocom Raptor X17 Core i9-14900HX ljudanalys
(±) | högtalarljudstyrkan är genomsnittlig men bra (74.2 dB)
Bas 100 - 315 Hz
(±) | reducerad bas - i genomsnitt 13.4% lägre än medianen
(±) | linjäriteten för basen är genomsnittlig (10.1% delta till föregående frekvens)
Mellan 400 - 2000 Hz
(±) | högre mellan - i genomsnitt 6.6% högre än median
(±) | linjäriteten för mids är genomsnittlig (8.6% delta till föregående frekvens)
Högsta 2 - 16 kHz
(+) | balanserade toppar - endast 2% från medianen
(±) | linjäriteten för toppar är genomsnittlig (8.5% delta till föregående frekvens)
Totalt 100 - 16 000 Hz
(±) | linjäriteten för det totala ljudet är genomsnittlig (24% skillnad mot median)
Jämfört med samma klass
» 85% av alla testade enheter i den här klassen var bättre, 5% liknande, 10% sämre
» Den bästa hade ett delta på 6%, genomsnittet var 18%, sämst var 132%
Jämfört med alla testade enheter
» 70% av alla testade enheter var bättre, 7% liknande, 23% sämre
» Den bästa hade ett delta på 4%, genomsnittet var 24%, sämst var 134%
MSI GE78HX 13VH-070US ljudanalys
(+) | högtalare kan spela relativt högt (84.4 dB)
Bas 100 - 315 Hz
(±) | reducerad bas - i genomsnitt 8.3% lägre än medianen
(±) | linjäriteten för basen är genomsnittlig (9.3% delta till föregående frekvens)
Mellan 400 - 2000 Hz
(±) | högre mellan - i genomsnitt 6.8% högre än median
(+) | mids är linjära (3.4% delta till föregående frekvens)
Högsta 2 - 16 kHz
(+) | balanserade toppar - endast 2% från medianen
(+) | toppar är linjära (2.6% delta till föregående frekvens)
Totalt 100 - 16 000 Hz
(+) | det totala ljudet är linjärt (12% skillnad mot median)
Jämfört med samma klass
» 11% av alla testade enheter i den här klassen var bättre, 4% liknande, 85% sämre
» Den bästa hade ett delta på 6%, genomsnittet var 18%, sämst var 132%
Jämfört med alla testade enheter
» 8% av alla testade enheter var bättre, 2% liknande, 90% sämre
» Den bästa hade ett delta på 4%, genomsnittet var 24%, sämst var 134%
Strömförbrukning
Den maximala förbrukningen på 13 watt i viloläge är mycket låg för en stor 17-tums bärbar dator. Vid spel ligger den dock på runt 300 watt, vilket inte är förvånande med tanke på de höga TDP/TGP-värdena. Det medföljande 330-watts nätaggregatet är tillräckligt dimensionerat. Standby-förbrukningen på 2,1 watt är dock för hög.
| Av/Standby | |
| Låg belastning | |
| Hög belastning |
|
Förklaring:
min: | |
Power consumption Cyberpunk / Stresstest
Power consumption with external monitor
Batteriets livslängd
Neo 17 är utrustad med ett 99 Wh-batteri, som ger en hyfsad drifttid på ca 6 timmar i WLAN-läge vid 150 cd/m² (58% av den maximala ljusstyrkan på testenheten). Detta placerar den stora spelaren i mittfältet jämfört med konkurrenterna. En full laddning med påslagen enhet tar 107 minuter, varvid 80% av batteriet är tillgängligt igen efter cirka 45 minuter.
Notebookcheck övergripande betyg
XMG Neo 17 har ett tydligt fokus på spelprestanda och prestandan är mycket bra. Tack vare vattenkylning som tillval kan temperaturerna och därmed även fläktljudet återigen sänkas avsevärt. Den matta QHD-panelen med 240 Hz och snabba svarstider är också mycket lämplig för spel.
SCHENKER XMG Neo 17 E24
- 11/27/2024 v8
Andreas Osthoff
Genomskinlighet
Valet av enheter som ska granskas görs av vår redaktion. Testprovet gavs till författaren som ett lån av tillverkaren eller återförsäljaren för denna recension. Långivaren hade inget inflytande på denna recension och inte heller fick tillverkaren en kopia av denna recension innan publiceringen. Det fanns ingen skyldighet att publicera denna recension. Vi accepterar aldrig ersättning eller betalning i utbyte mot våra recensioner. Som ett oberoende medieföretag är Notebookcheck inte föremål för auktoritet från tillverkare, återförsäljare eller förlag.
This is how Notebookcheck is testingEvery year, Notebookcheck independently reviews hundreds of laptops and smartphones using standardized procedures to ensure that all results are comparable. We have continuously developed our test methods for around 20 years and set industry standards in the process. In our test labs, high-quality measuring equipment is utilized by experienced technicians and editors. These tests involve a multi-stage validation process. Our complex rating system is based on hundreds of well-founded measurements and benchmarks, which maintains objectivity.


















 Total Sustainability Score:


