

XMG Pro 16 Studio (Mid 24) recension: Core i9 och RTX 4070 för spelare och kreatörer
Skaparens njutning?
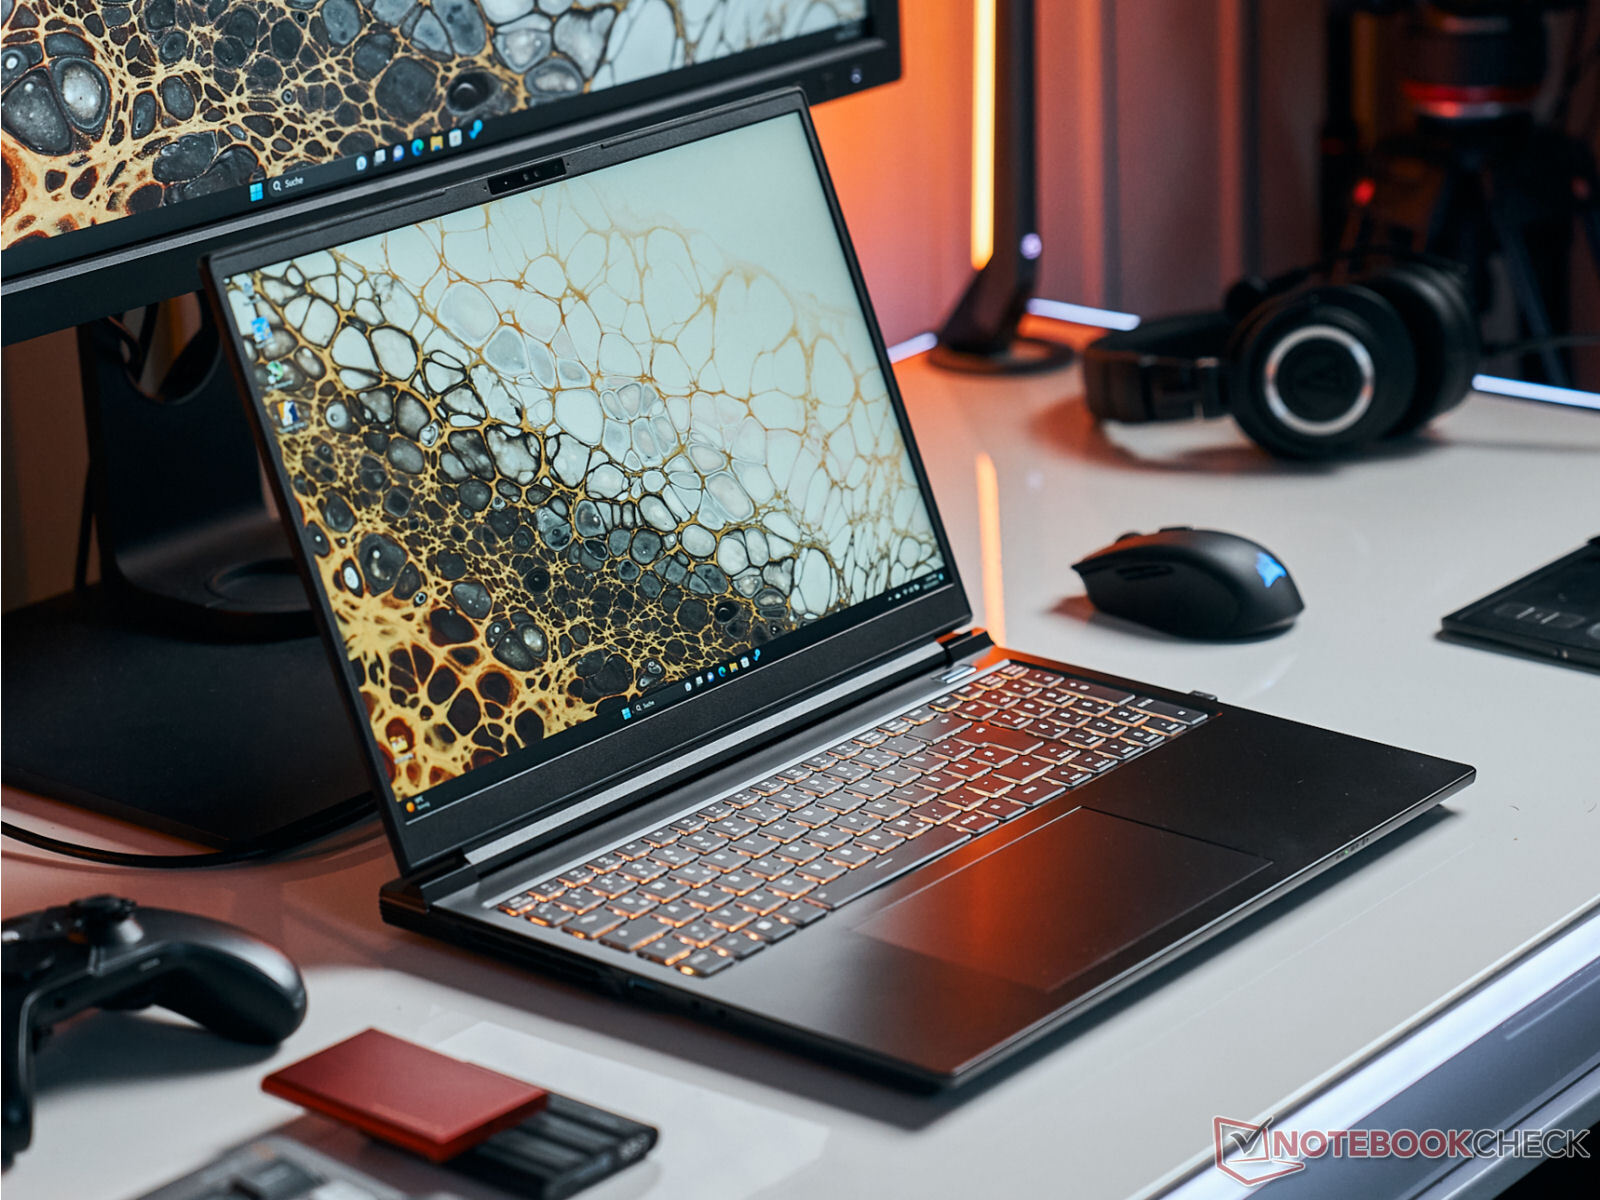
Innehållsskapare och gamers utgör målgruppen för XMG Pro 16 Studio: Schenker har satt ihop ett erbjudande som består av en Core i9-processor, RTX 4070, Thunderbolt 4-port och en 16:10-skärm (QHD+, 240Hz, sRGB). Bra kylning ska enligt uppgift säkerställas genom användning av en Vapor Chamber.Sascha Mölck, 👁 Florian Glaser (översatt av DeepL / Ninh Duy) Publicerad 🇺🇸 🇩🇪 ...
XMG Pro 16 Studio (Mid 24) vänder sig till spelare och kreatörer. Motsvarande hårdvara finns ombord: En Core i9-14900HX, GeForce RTX 4070 samt en kalibrerad (X-Rite) 16-tumsskärm med ett bildförhållande på 16:10. Ett barebone (PE60SNE-S) från tillverkaren Clevo fungerar som bas för detta. Detta är efterföljaren till XMG Pro 16 (mitten av 23) som visuellt ser likadan ut. Konkurrenter inkluderar Lenovo Legion Pro 5 16IRX9, Acer Predator Helios Neo 16 (2024), Lenovo Legion 7 16 G9 och Aorus 16X (2024).
Potentiella konkurrenter i jämförelse
Gradering | Version | Datum | Modell | Vikt | Höjd | Storlek | Upplösning | Pris |
|---|---|---|---|---|---|---|---|---|
| 81.2 % | v8 | 07/2024 | SCHENKER XMG Pro 16 Studio (Mid 24) i9-14900HX, NVIDIA GeForce RTX 4070 Laptop GPU | 2.3 kg | 19.9 mm | 16.00" | 2560x1600 | |
| 86.8 % v7 (old) | v7 (old) | 05/2024 | Acer Predator Helios Neo 16 (2024) i7-14700HX, NVIDIA GeForce RTX 4070 Laptop GPU | 2.6 kg | 25.95 mm | 16.00" | 2560x1600 | from EUR 1999 |
| 89.3 % v7 (old) | v7 (old) | 04/2024 | Lenovo Legion Pro 5 16IRX9 i9-14900HX, NVIDIA GeForce RTX 4070 Laptop GPU | 2.5 kg | 26.95 mm | 16.00" | 2560x1600 | |
| 87.4 % v7 (old) | v7 (old) | 04/2024 | Aorus 16X 2024 i9-14900HX, NVIDIA GeForce RTX 4070 Laptop GPU | 2.3 kg | 20 mm | 16.00" | 2560x1600 | |
| 90.8 % v7 (old) | v7 (old) | 04/2024 | Lenovo Legion 7 16 IRX G9 i9-14900HX, NVIDIA GeForce RTX 4070 Laptop GPU | 2.3 kg | 19.8 mm | 16.00" | 3200x2000 | from EUR 2249 |
Observera: Vi har nyligen uppdaterat vårt betygssystem och resultaten från version 8 är inte jämförbara med resultaten från version 7. Mer information finns tillgänglig här.
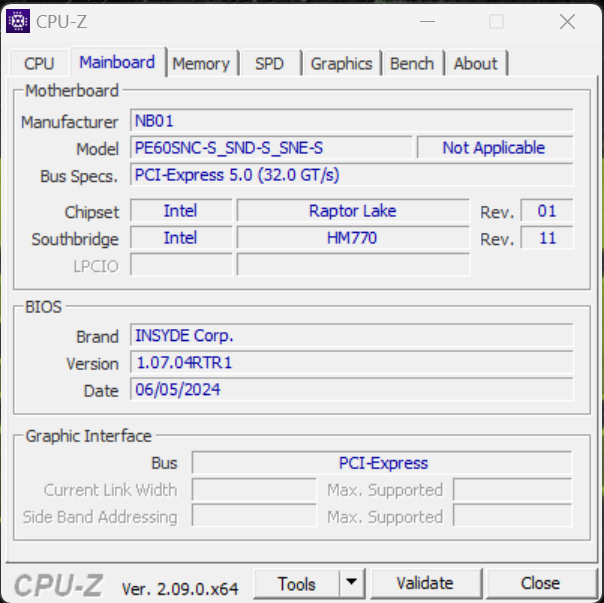
Case och anslutningsmöjligheter - Schenker använder ett barebone från Clevo
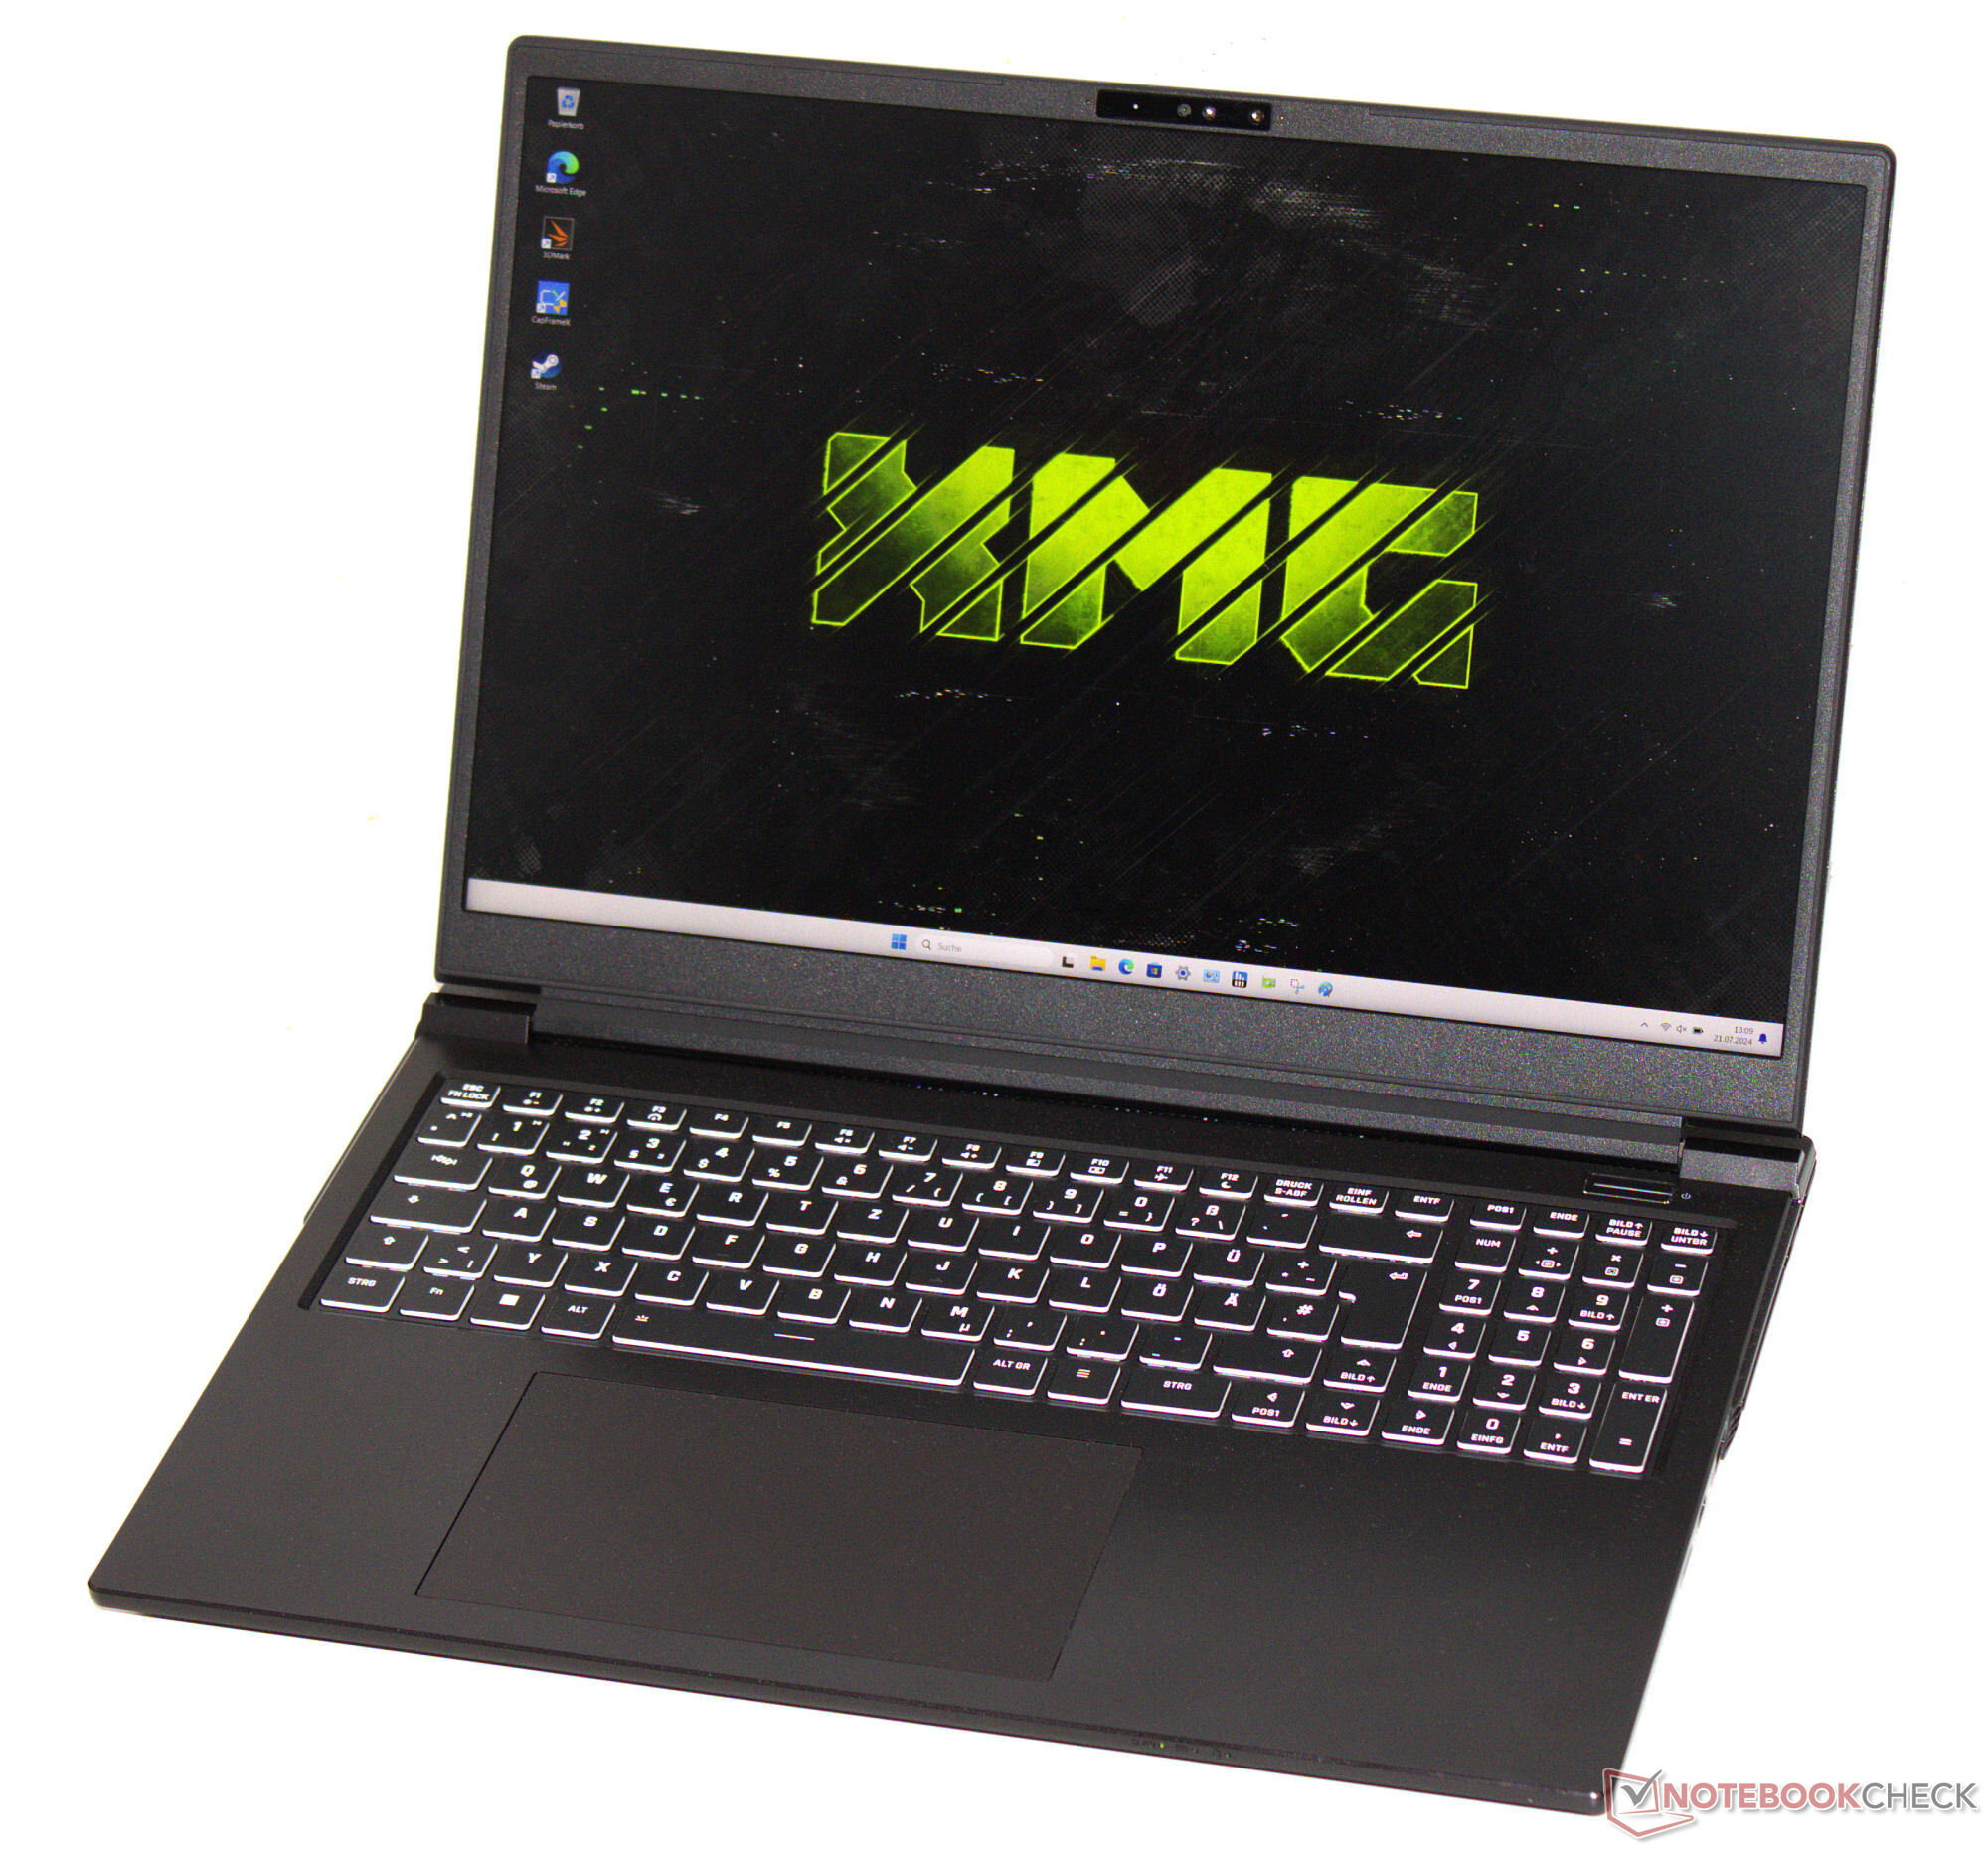
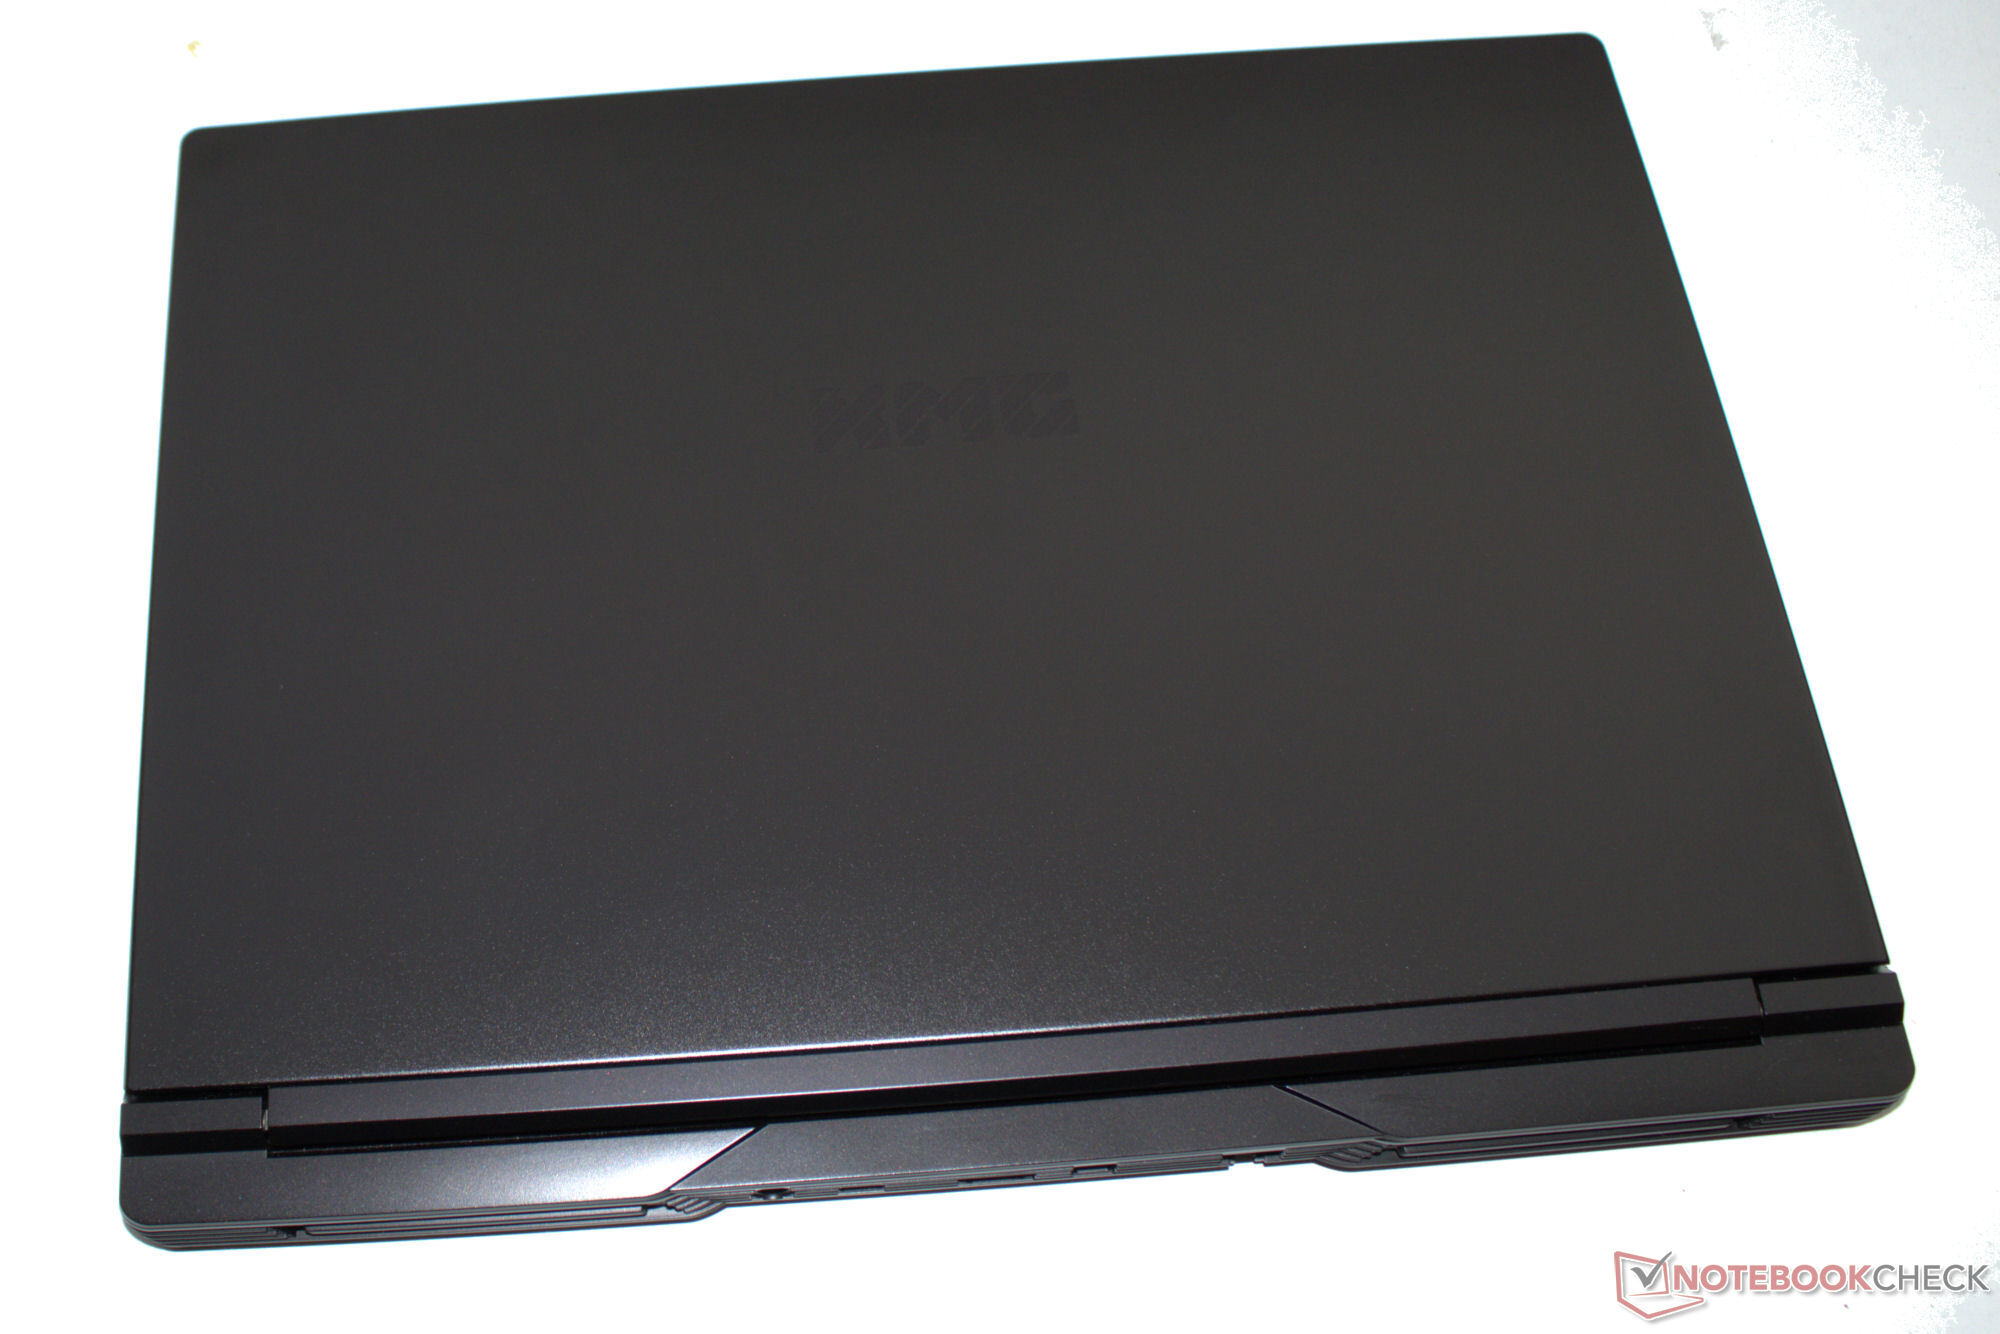
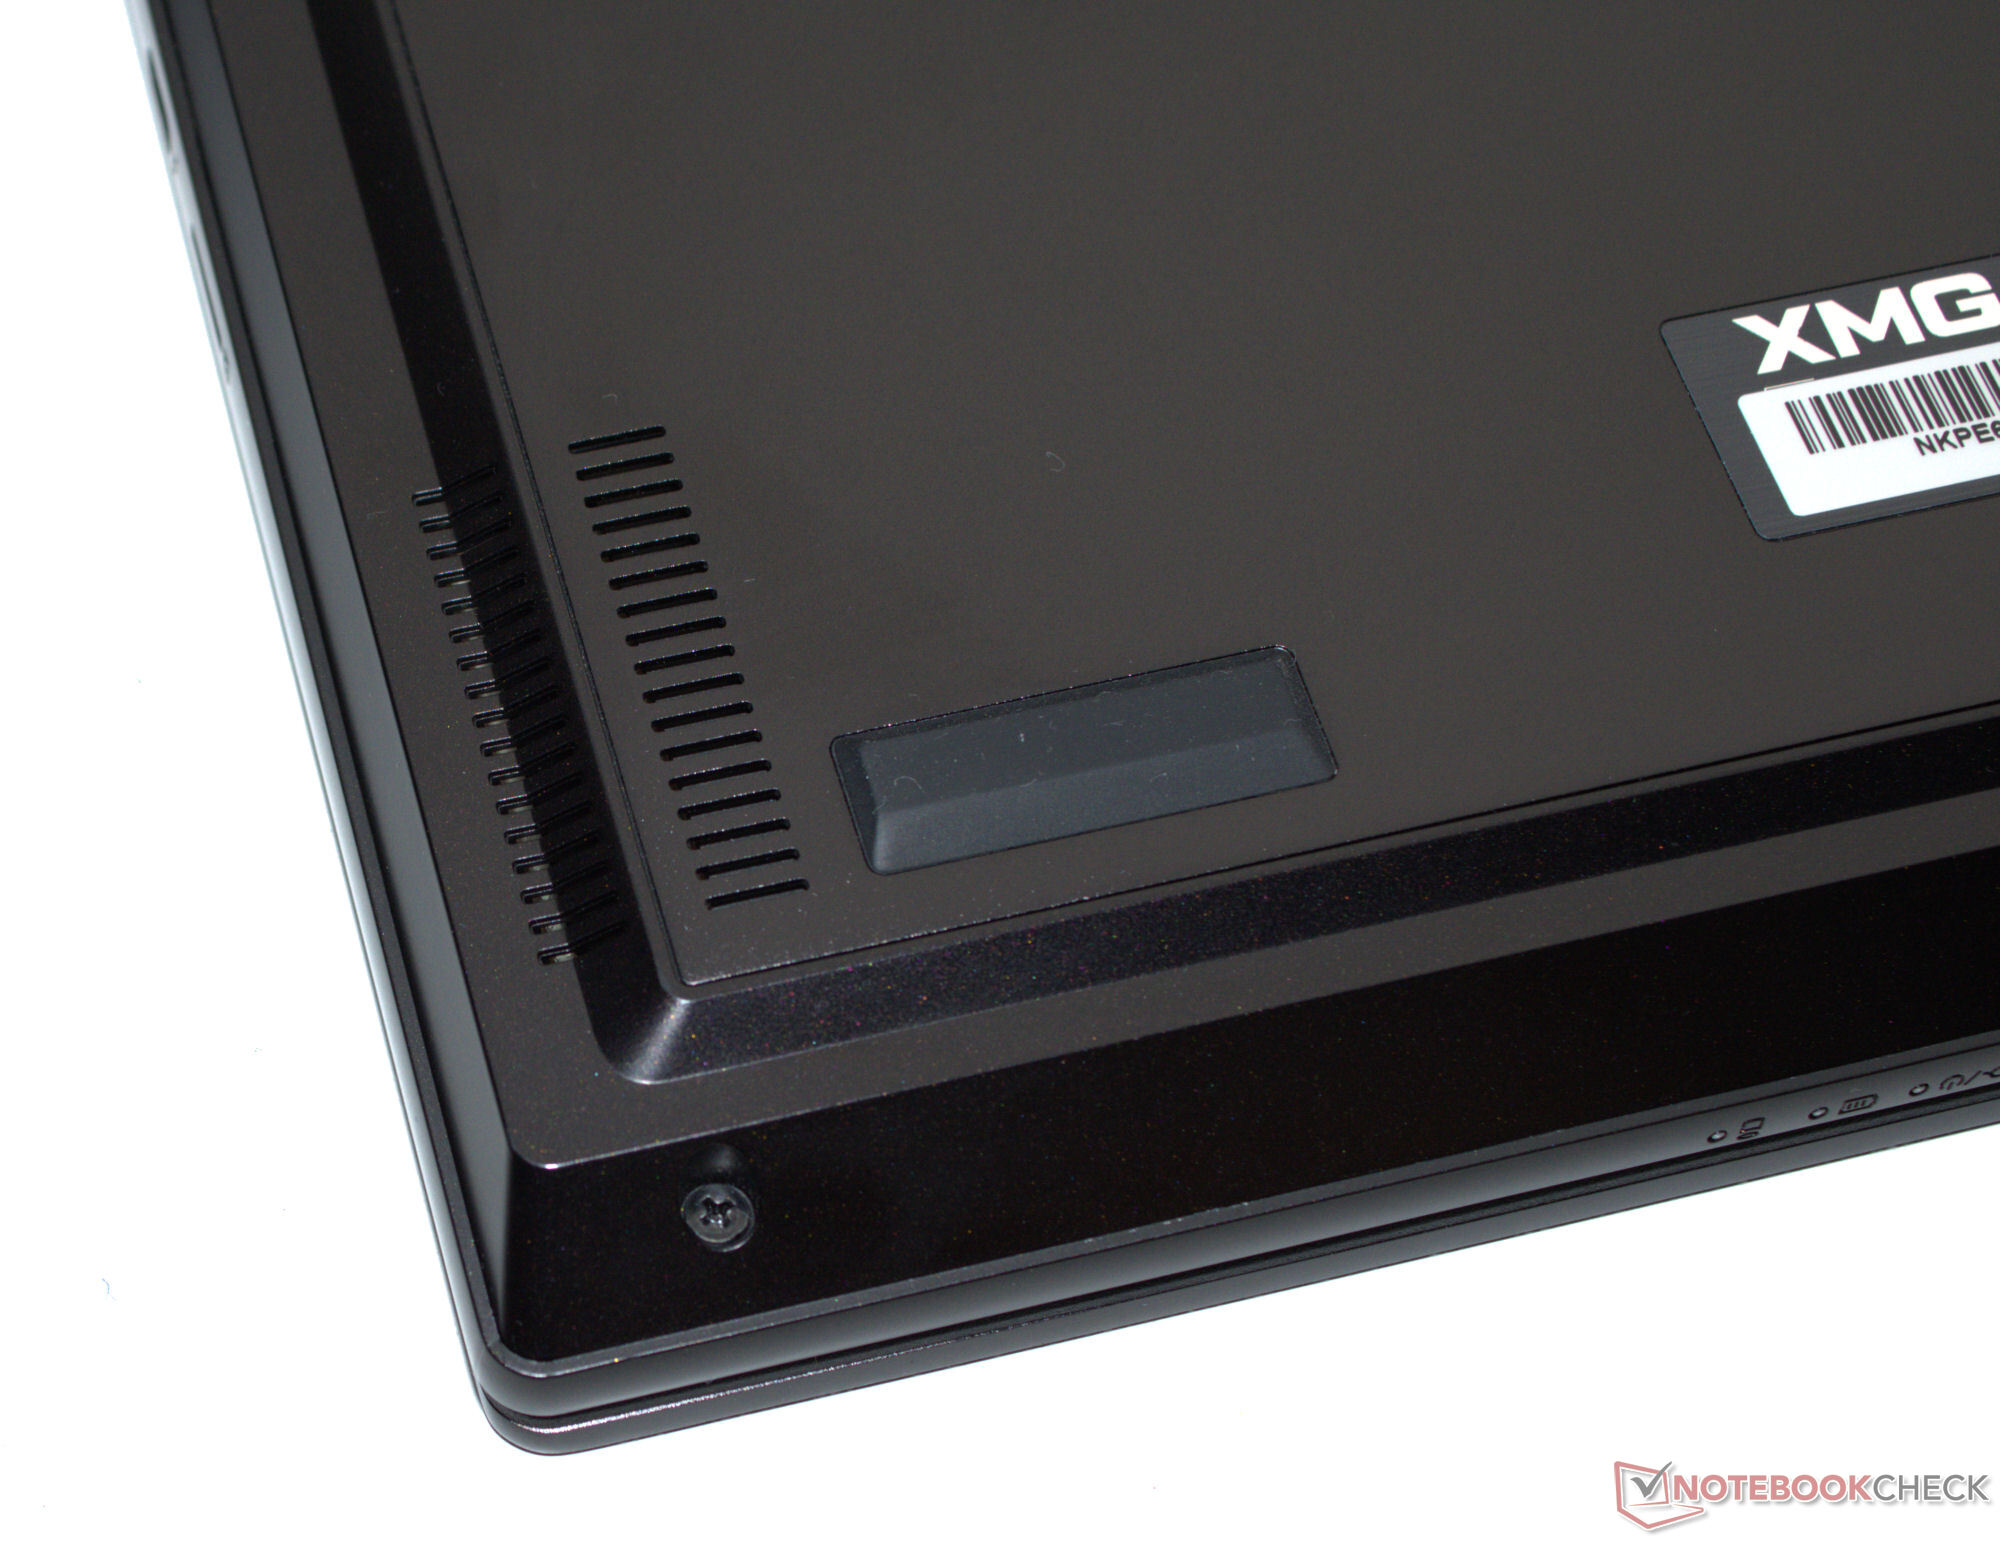
Från utsidan har ingenting förändrats: Den senaste Pro 16 använder samma mattsvarta aluminiumhölje som förra årets modell-om du bara tittar på dess yttre hölje. Basenheten och locket kan vridas något, men deras byggkvalitet är bra. Du kommer att leta förgäves efter LED-remsor på ett så seriöst utseende fodral. Lockets maximala öppningsvinkel är 130 grader.
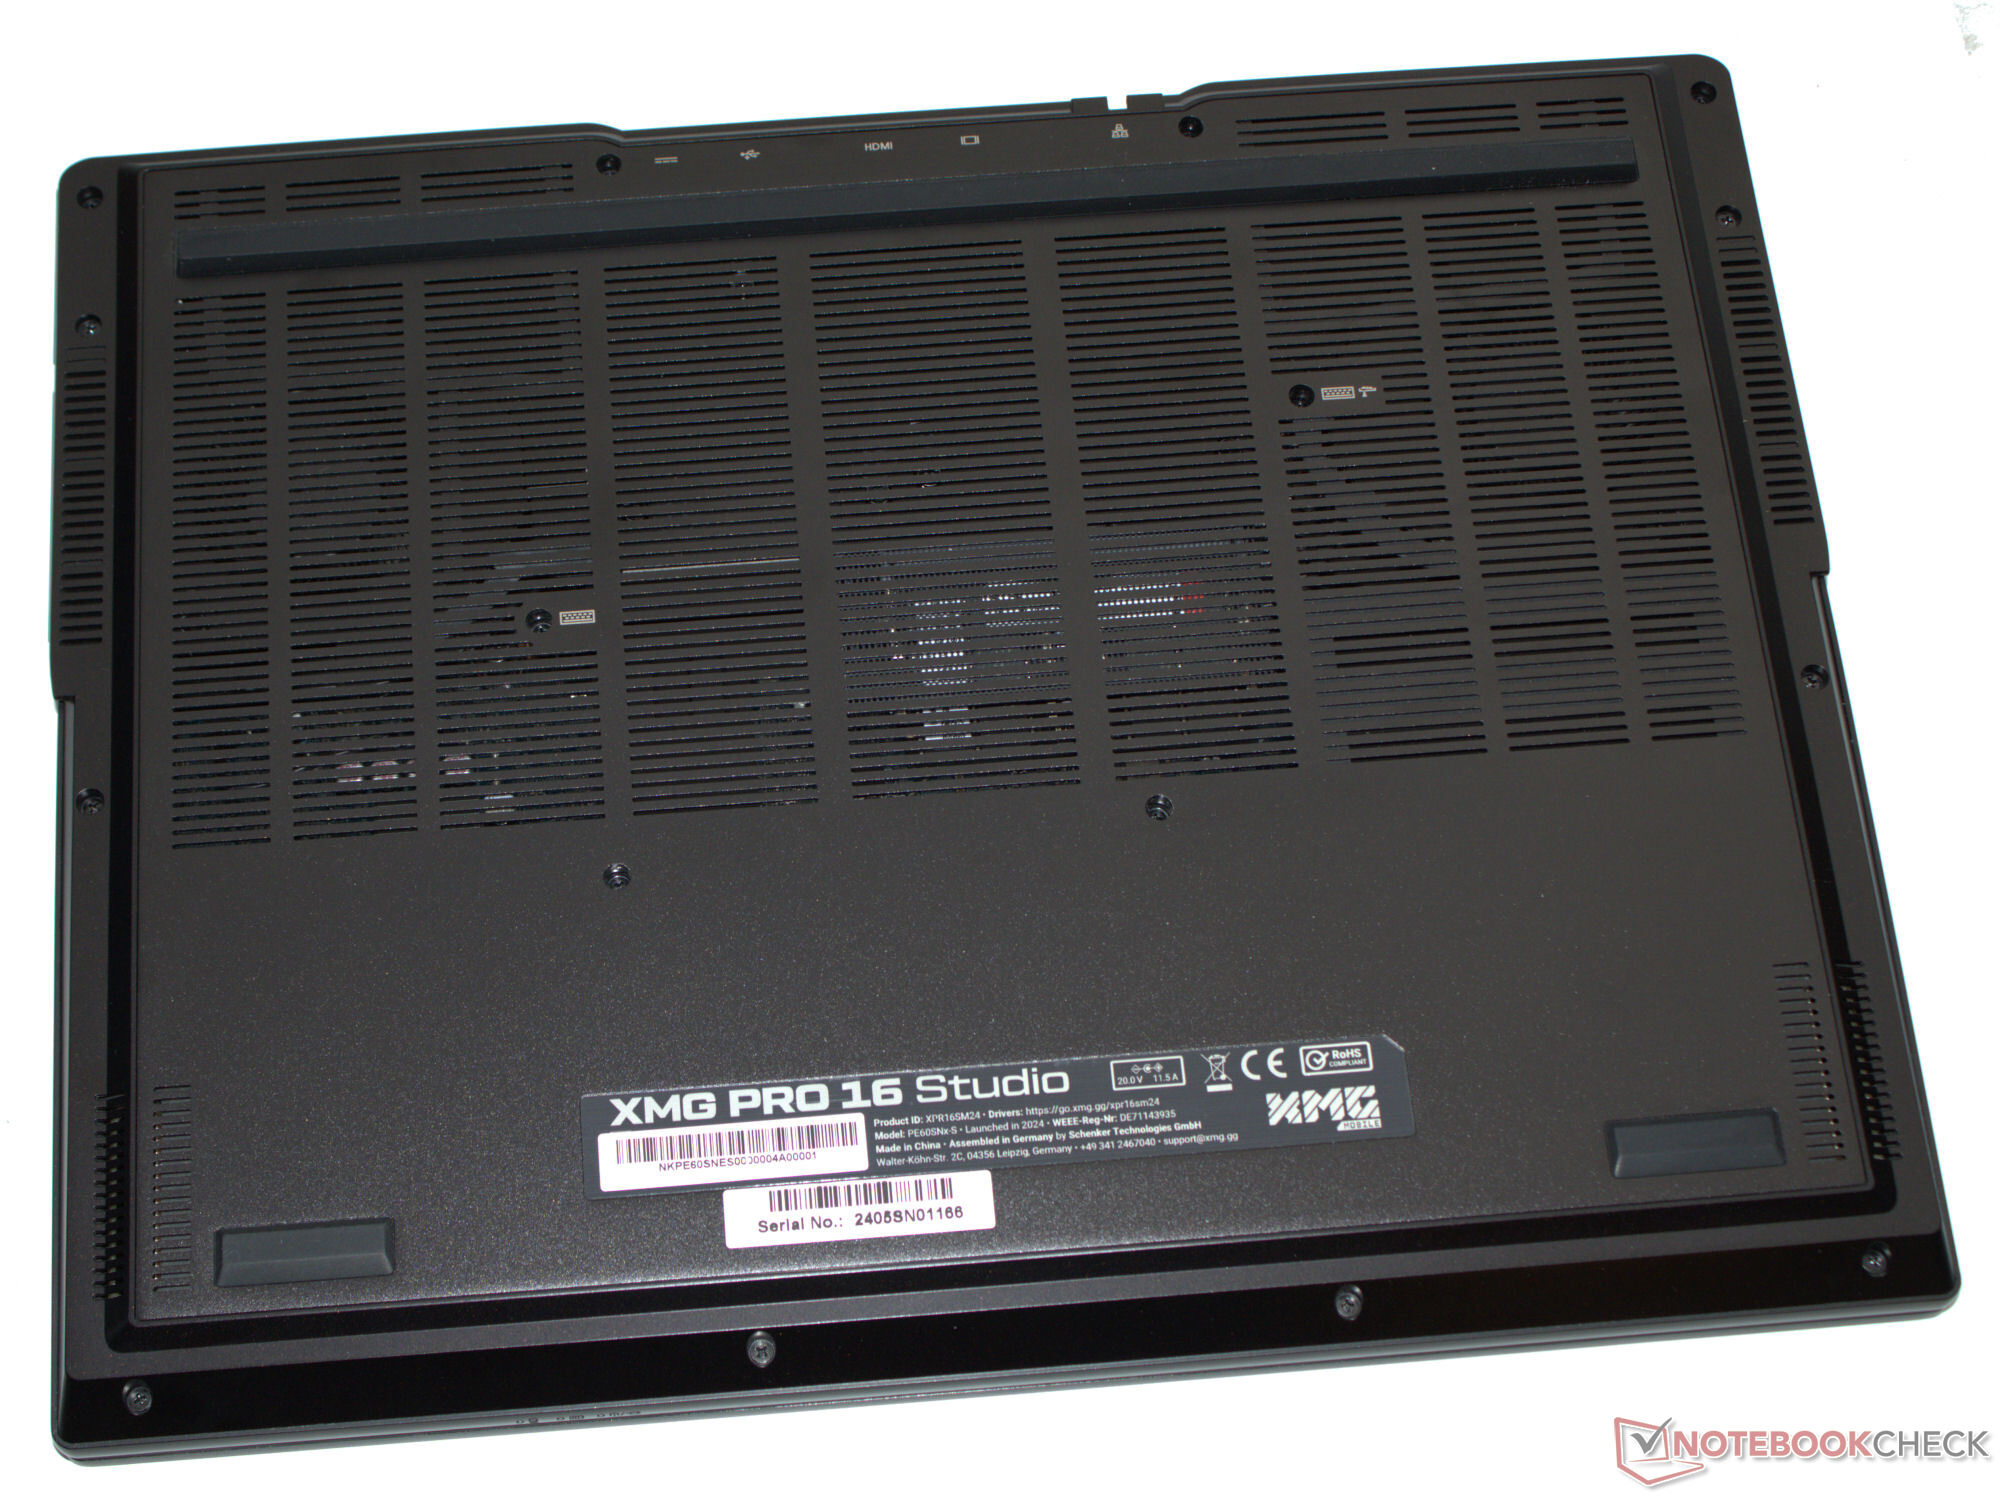
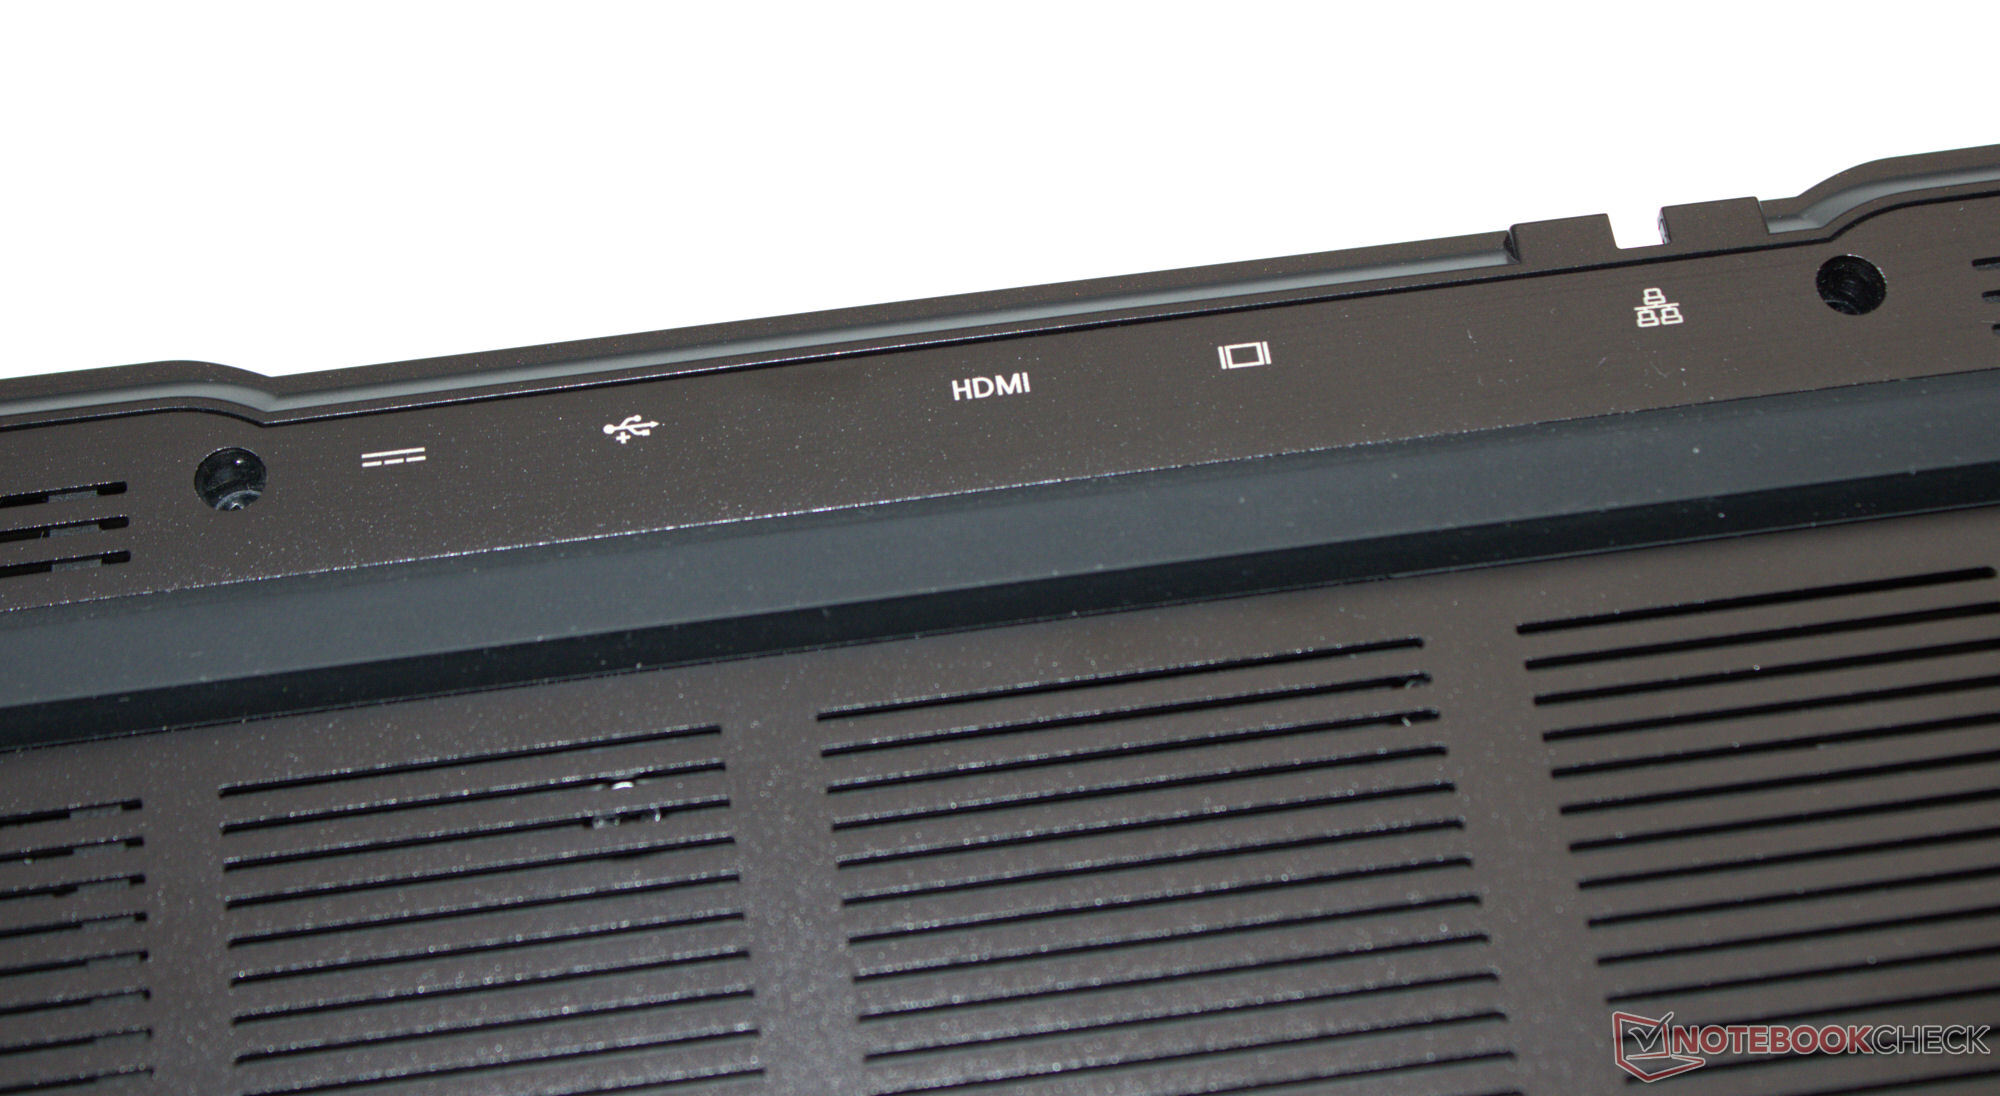
Två USB-A-portar (USB 3.2 Gen 1), två USB-C-portar (1x USB 3.2 Gen 2, 1x TB 4/USB 4) samt tre videoutgångar bör vara tillräckligt för de flesta användare - i värsta fall kanske du måste ta fram en dockningsstation. Power Delivery stöds tack vare TB4-porten. Gigabit Ethernet-porten tillåter datahastigheter på upp till 2,5 Gbit/s.
Under optimala förhållanden (inga WiFi-enheter i närheten, kort avstånd mellan bärbar dator och server-PC) ger Intels WiFi-6E-chip (AX211) bra till mycket bra datahastigheter. FHD-webbkameran (2,1 MP, inget skydd) tar inga överraskande bilder. MicroSD-kortläsaren (referenskort: AV PRO microSD 128 GB V60) har medelhög hastighet.


| SD Card Reader | |
| average JPG Copy Test (av. of 3 runs) | |
| Aorus 16X 2024 (AV PRO microSD 128 GB V60) | |
| Genomsnitt av klass Gaming (19 - 197.3, n=68, senaste 2 åren) | |
| SCHENKER XMG Pro 16 Studio (Mid 23) (AV PRO microSD 128 GB V60) | |
| SCHENKER XMG Pro 16 Studio (Mid 24) (AV PRO microSD 128 GB V60) | |
| Lenovo Legion 7 16 IRX G9 (Angelbird AV Pro V60) | |
| Acer Predator Helios Neo 16 (2024) (AV PRO microSD 128 GB V60) | |
| maximum AS SSD Seq Read Test (1GB) | |
| Aorus 16X 2024 (AV PRO microSD 128 GB V60) | |
| Genomsnitt av klass Gaming (25.8 - 263, n=67, senaste 2 åren) | |
| SCHENKER XMG Pro 16 Studio (Mid 23) (AV PRO microSD 128 GB V60) | |
| Lenovo Legion 7 16 IRX G9 (Angelbird AV Pro V60) | |
| SCHENKER XMG Pro 16 Studio (Mid 24) (AV PRO microSD 128 GB V60) | |
| Acer Predator Helios Neo 16 (2024) (AV PRO microSD 128 GB V60) | |

 NVIDIA GeForce RTX 4070 Laptop GPU, i9-14900HX, Samsung 990 Pro 1 TB")
 NVIDIA GeForce RTX 4070 Laptop GPU, i9-14900HX, Samsung 990 Pro 1 TB")
Hållbarhet
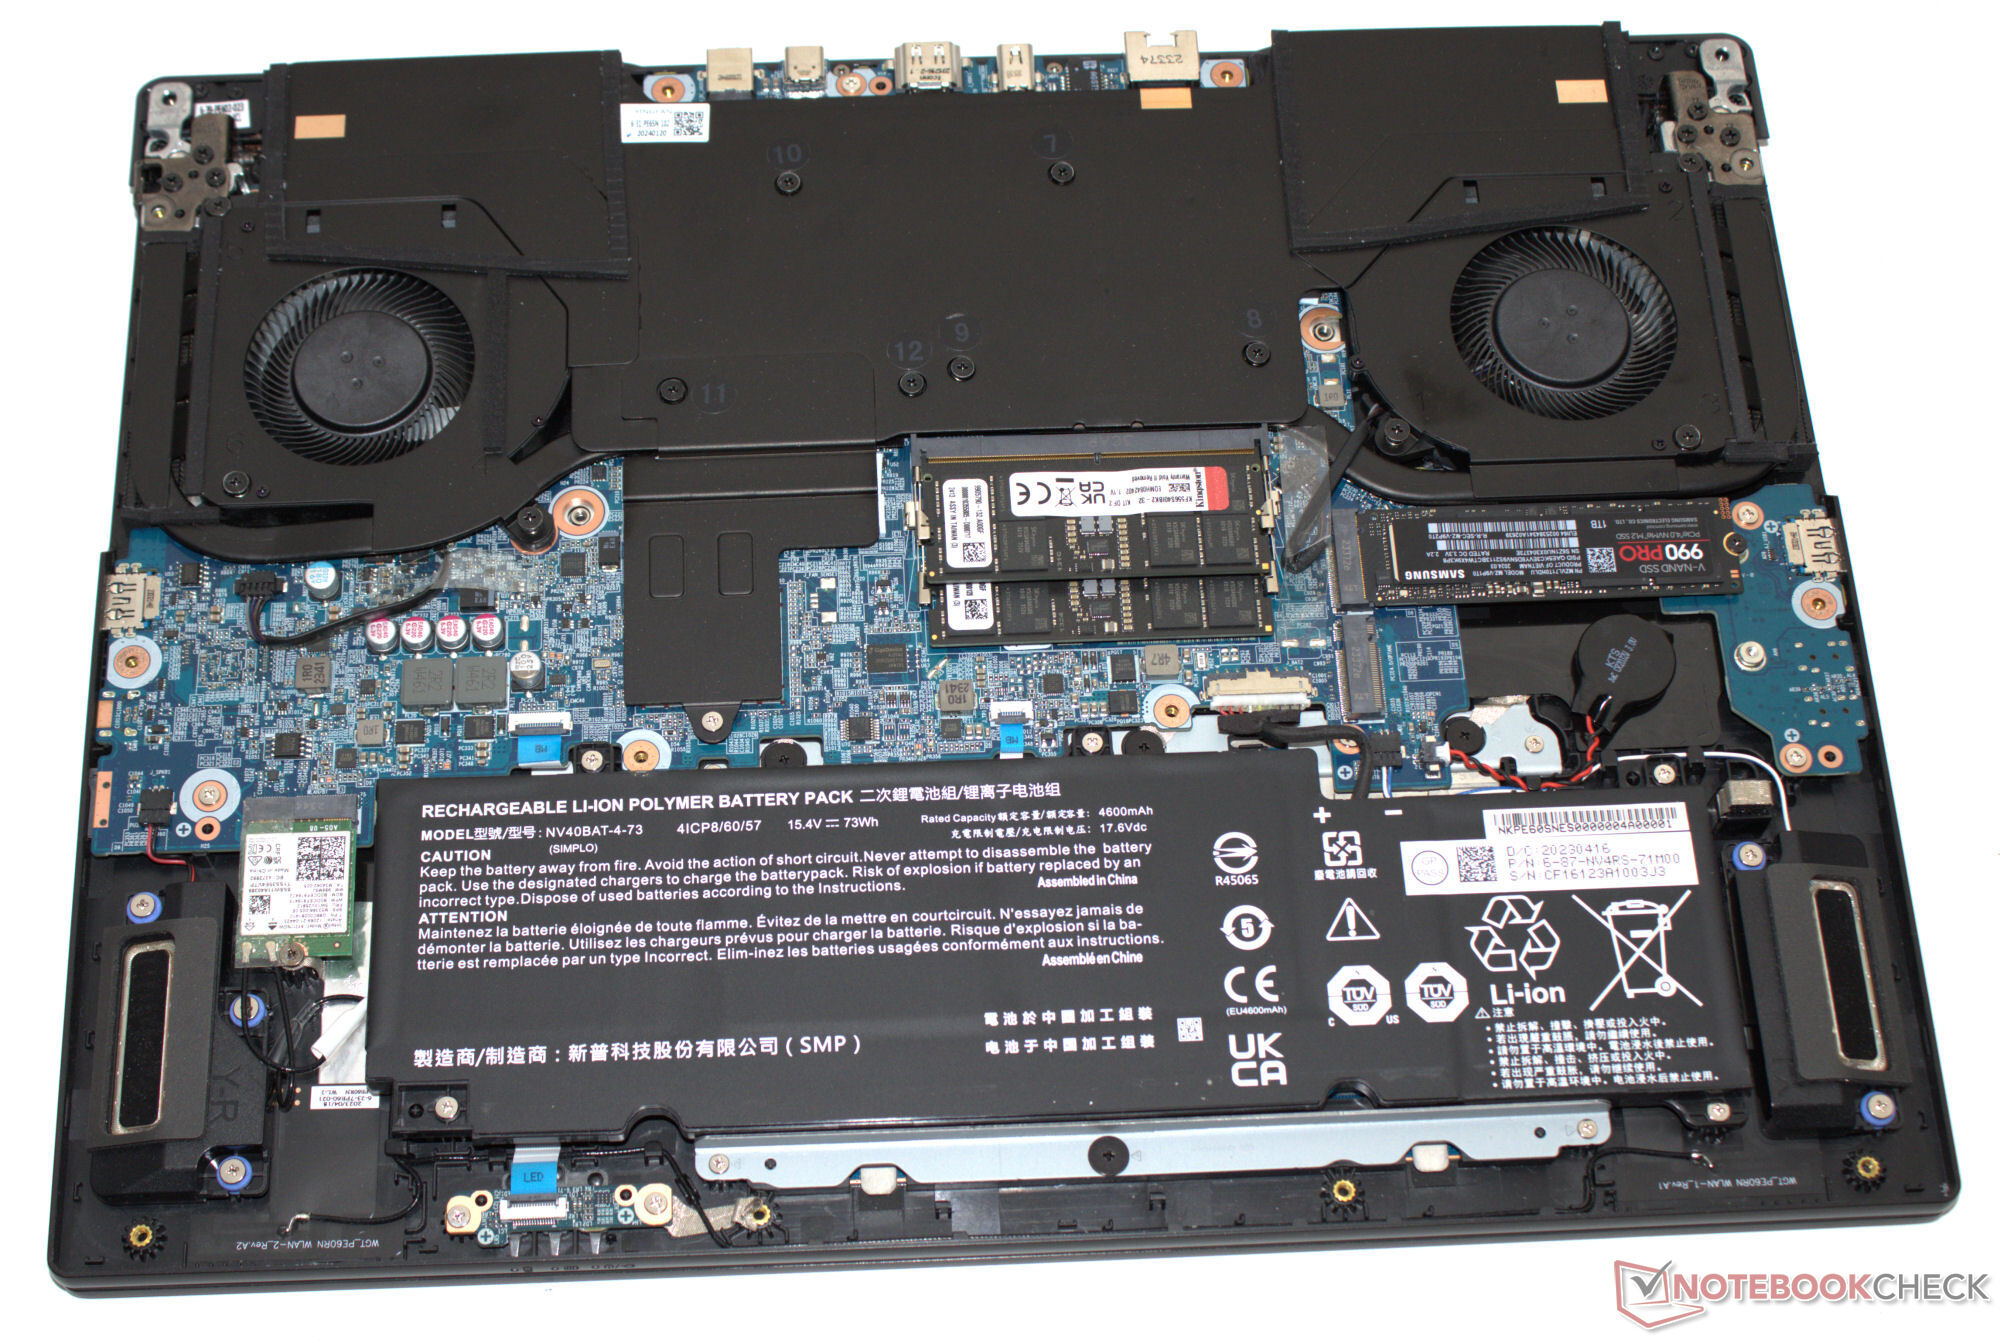
Den bärbara datorn och tillbehören skyddas av alla typer av plasthylsor (skumplast, film, påse). Namnen på de plaster som används är tryckta på dem. Undantag: Det genomskinliga filmskyddet på locket saknar motsvarande information. Enhetens hårdvara är åtkomlig efter att basplattan tagits bort - så att du kan utföra underhålls- och reparationsarbeten. Mjukvaruuppdateringar bör vara säkrade för de närmaste åren.
Inmatningsenheter - Den bärbara datorn XMG med utbytbart tangentbord
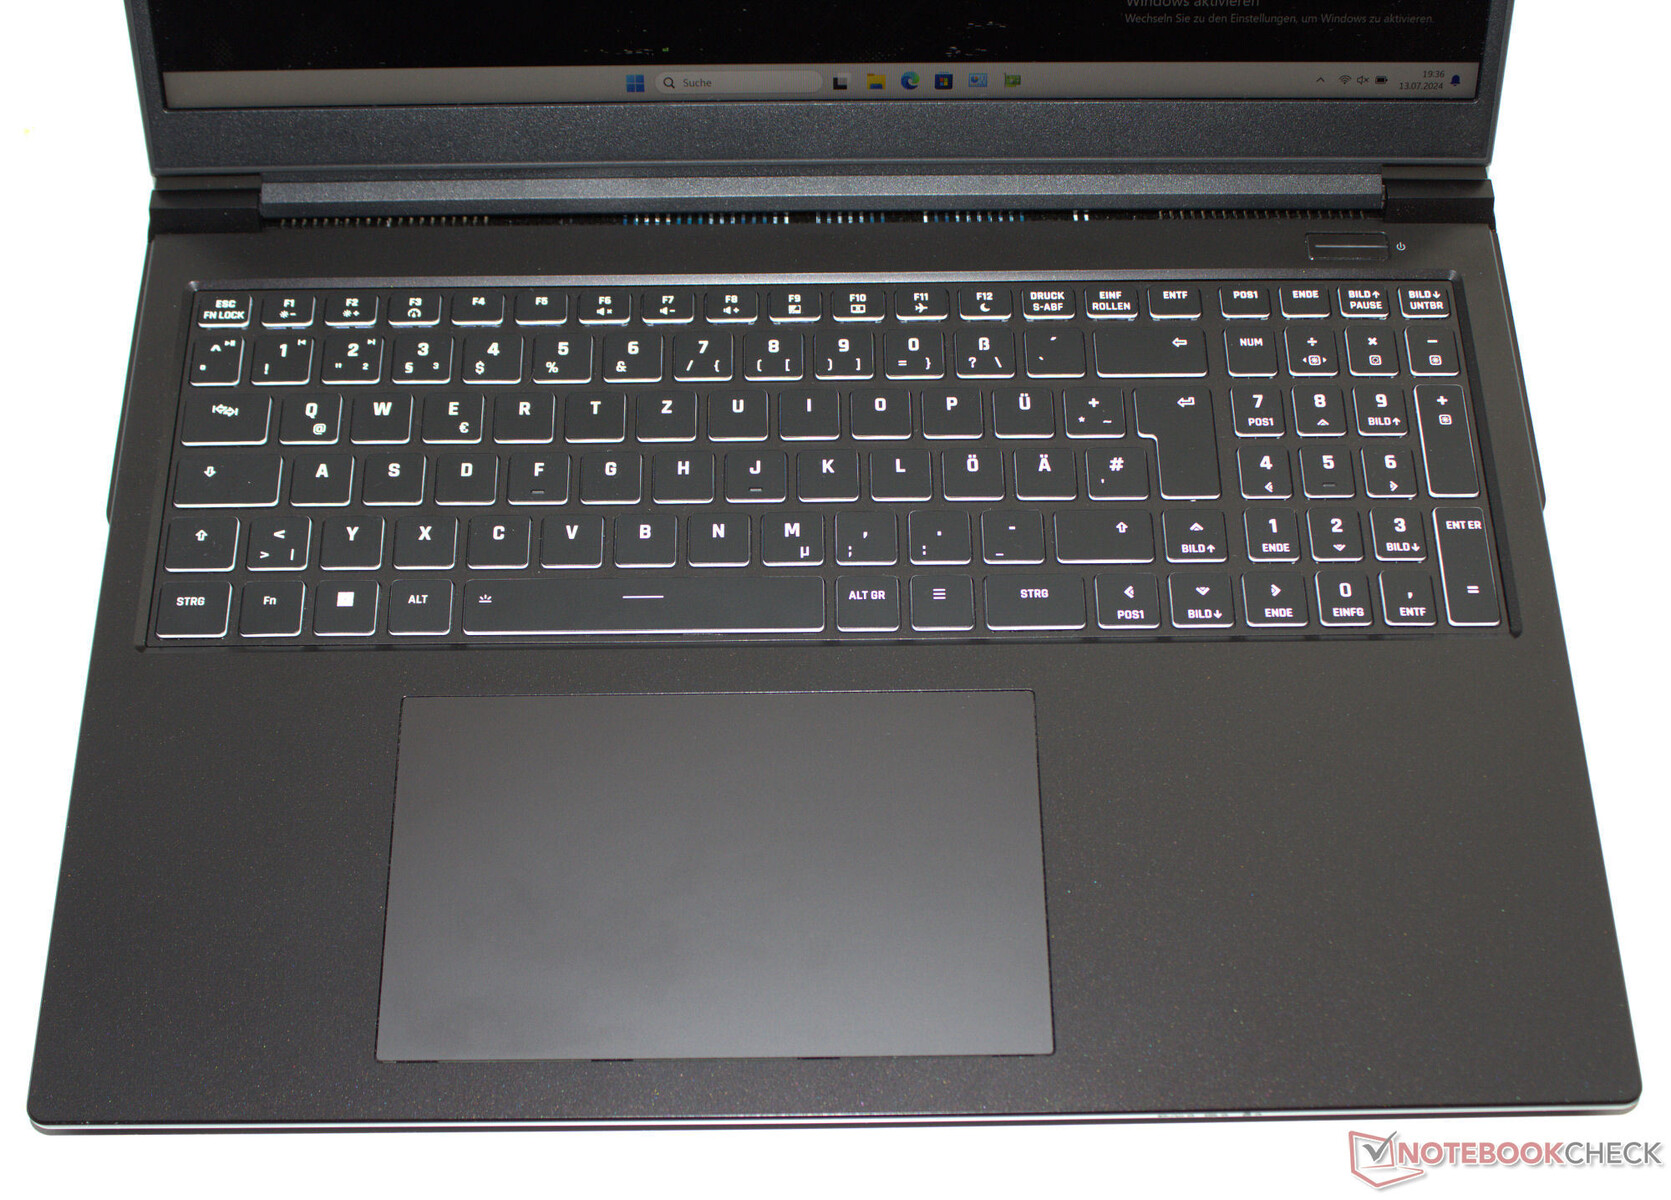
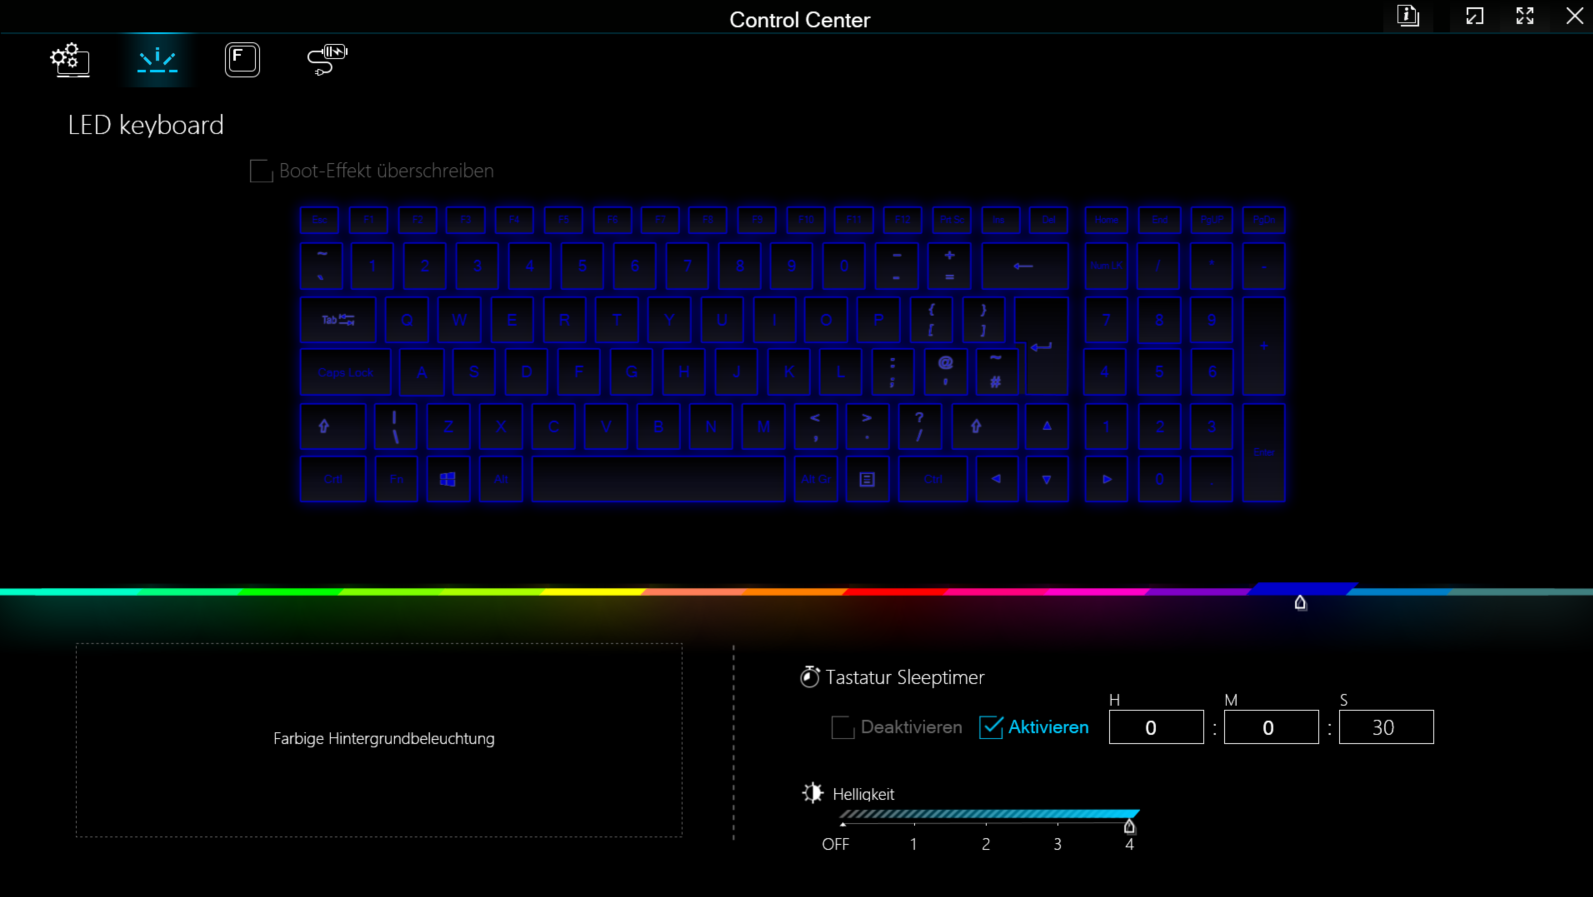
Ofta regeln med Schenker, och ett undantag när det gäller andra tillverkare: Det bakgrundsbelysta (RGB, fyra nivåer) chiclet-tangentbordet kan lätt bytas ut, eftersom det bara hålls på plats av två skruvar (och några clips). Dess platta, släta tangenter har en medelhög rörelse och en tydlig tryckpunkt. Motståndet kunde vara skarpare - men det är en smaksak. En lätt eftergivenhet i tangentbordet bör inte vara i vägen vid daglig användning. Positiva egenskaper: De fyra piltangenterna är i full storlek. En generöst tilltagen multi-touch clickpad (15,1 x 9,1 cm) används för att styra muspekaren.
Skärm - 16:10, IPS, sRGB
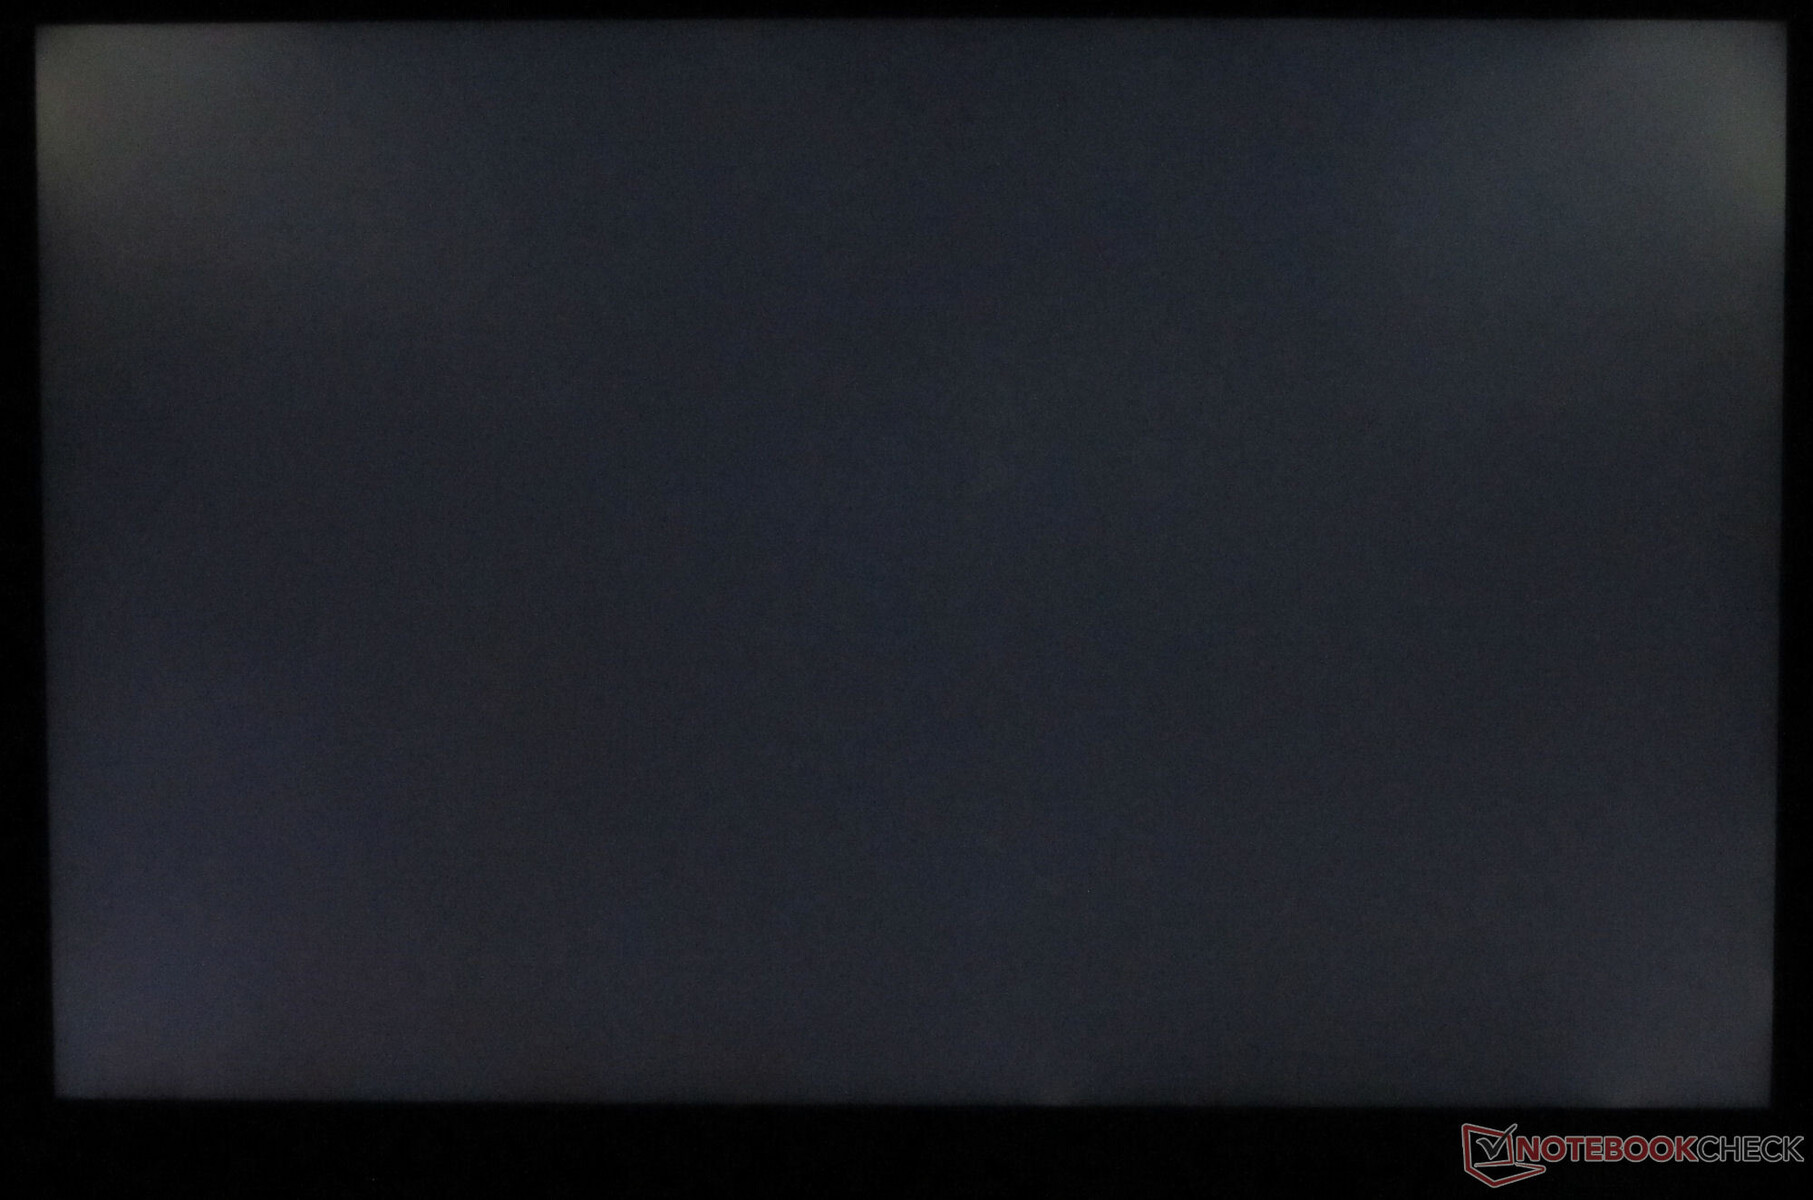
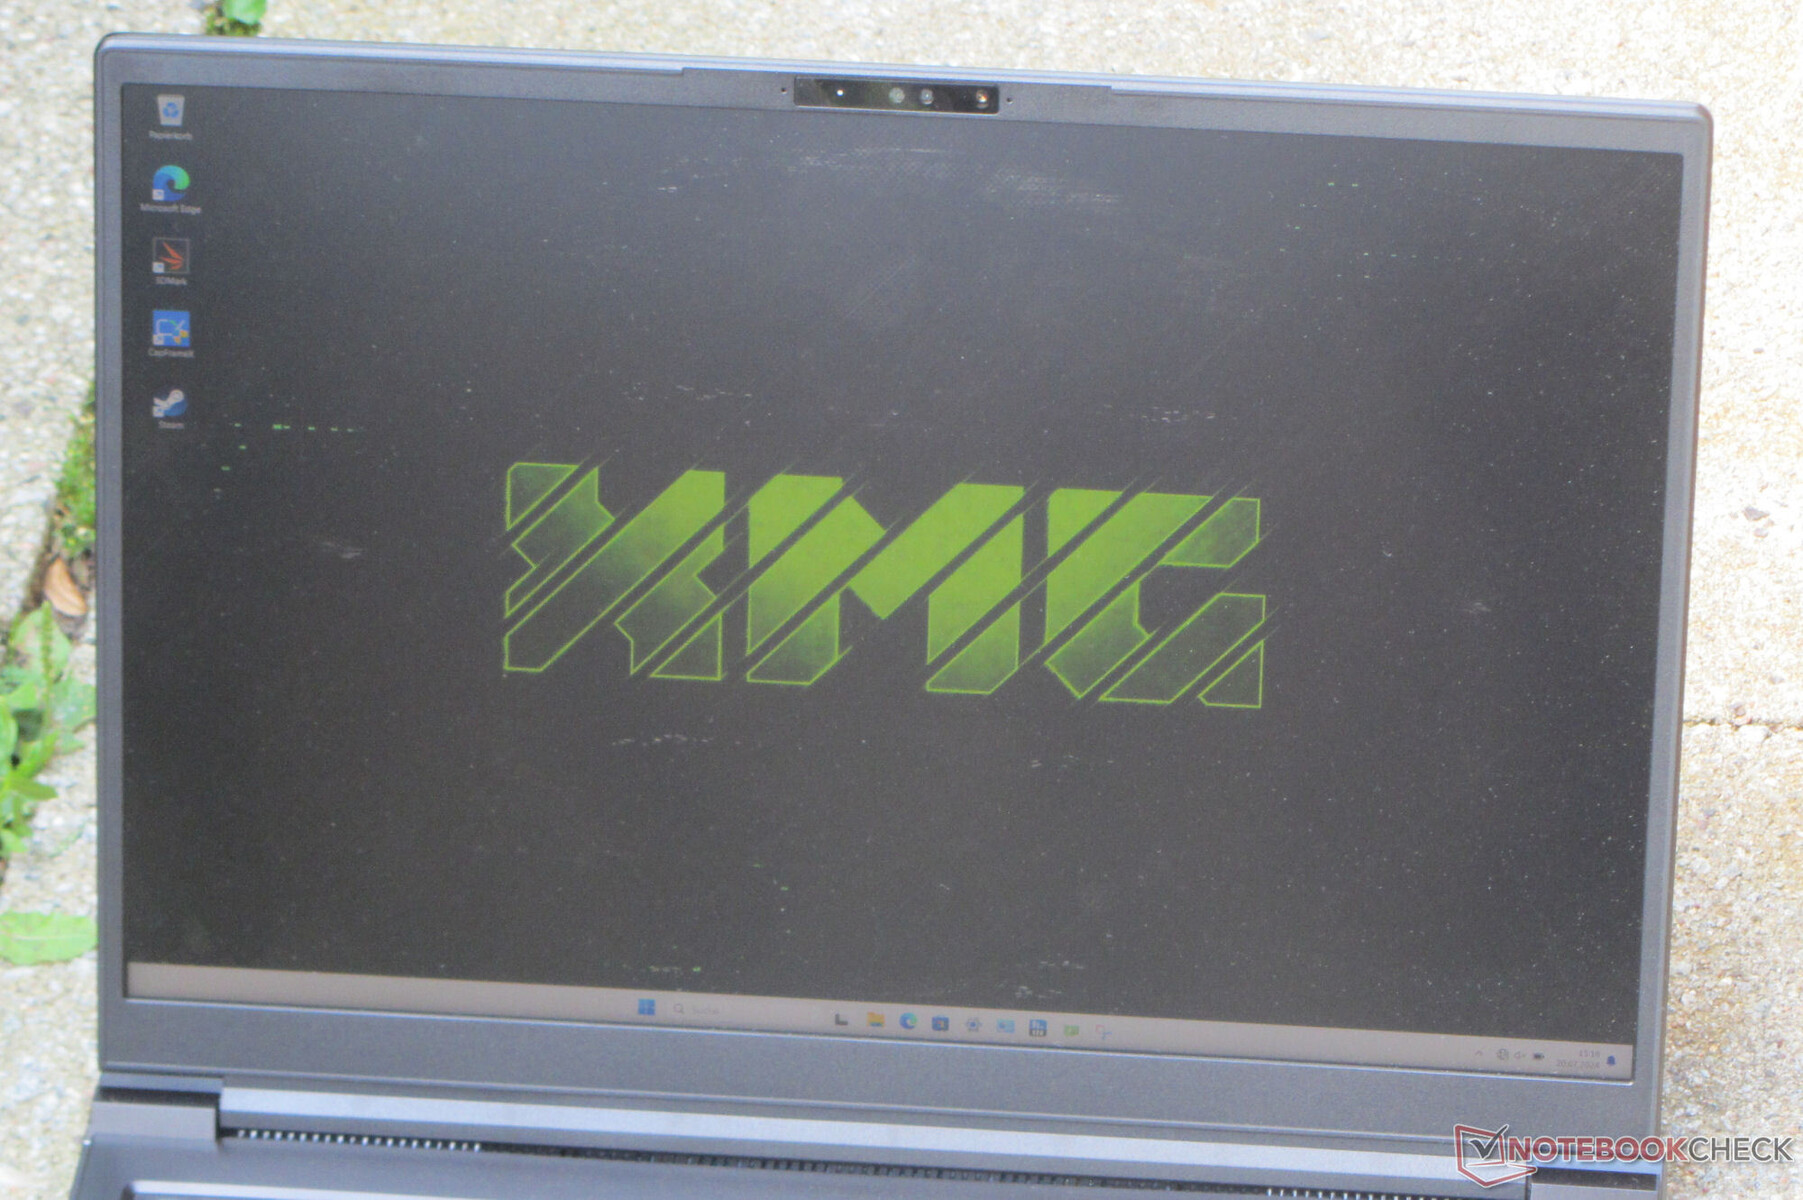
Den 16-tums stora skärmen (2.560 x 1.600 pixlar) med bildförhållandet 16:10 är välbekant: Den bärbara datorn använder sig av samma IPS-panel från BOE som redan användes i 2023 års version av Pro 16. Den drar dock nytta av en något högre maximal ljusstyrka. Allt som allt är skärmens värden som vi mätt upp tillräckliga för inomhusbruk. Att läsa utomhus bör vara möjligt så länge solen inte är för stark. Positivt: Den responsiva 240 Hz-panelen uppvisar inget PWM-flimmer. Alternativa visningsalternativ är inte tillgängliga.
| |||||||||||||||||||||||||
Distribution av ljusstyrkan: 86 %
Mitt på batteriet: 416 cd/m²
Kontrast: 1095:1 (Svärta: 0.38 cd/m²)
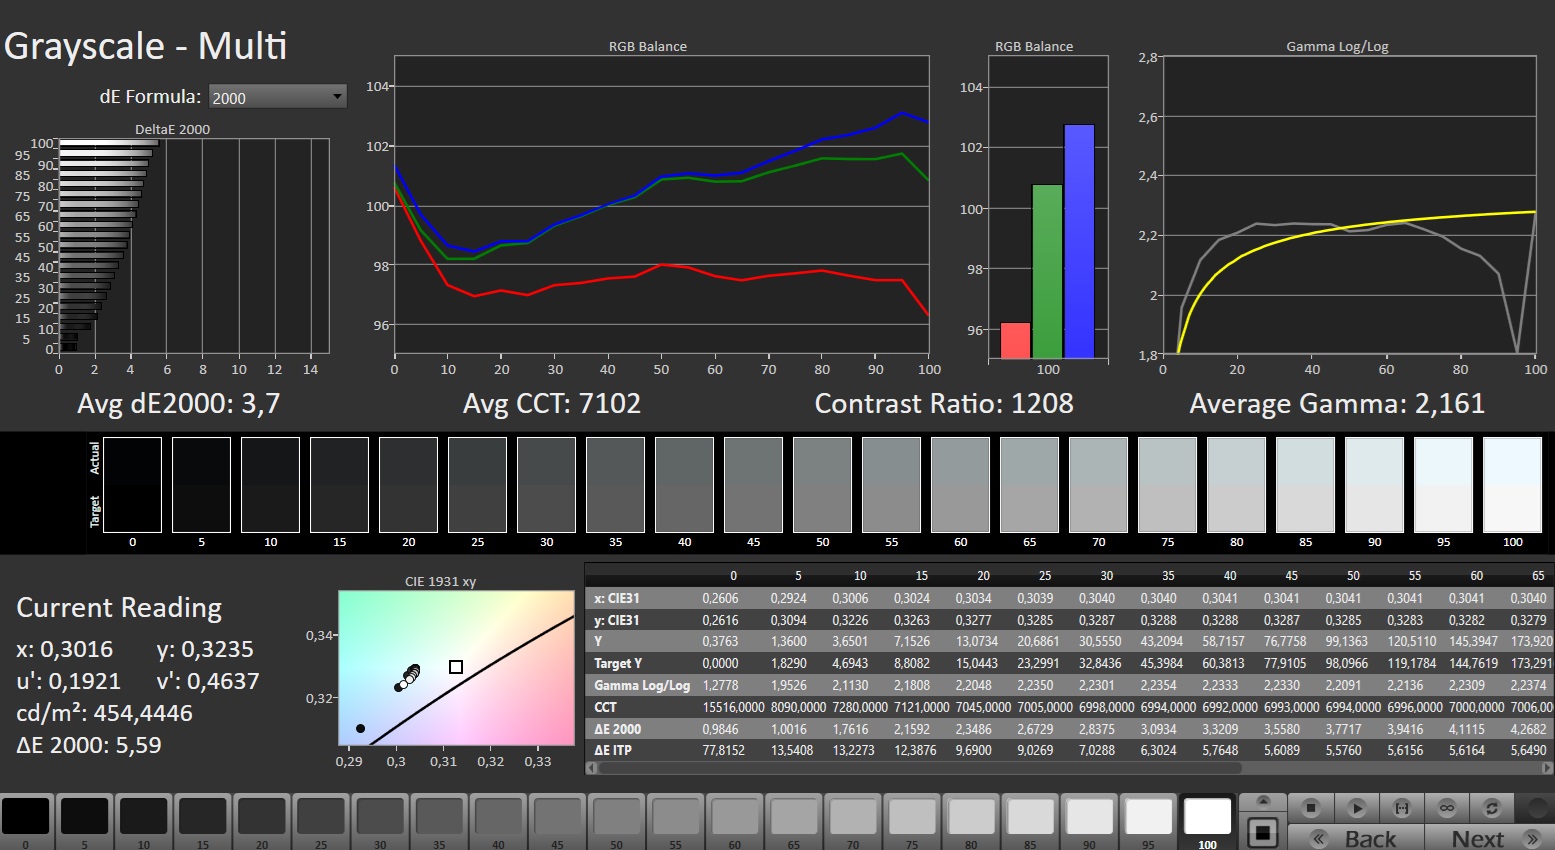
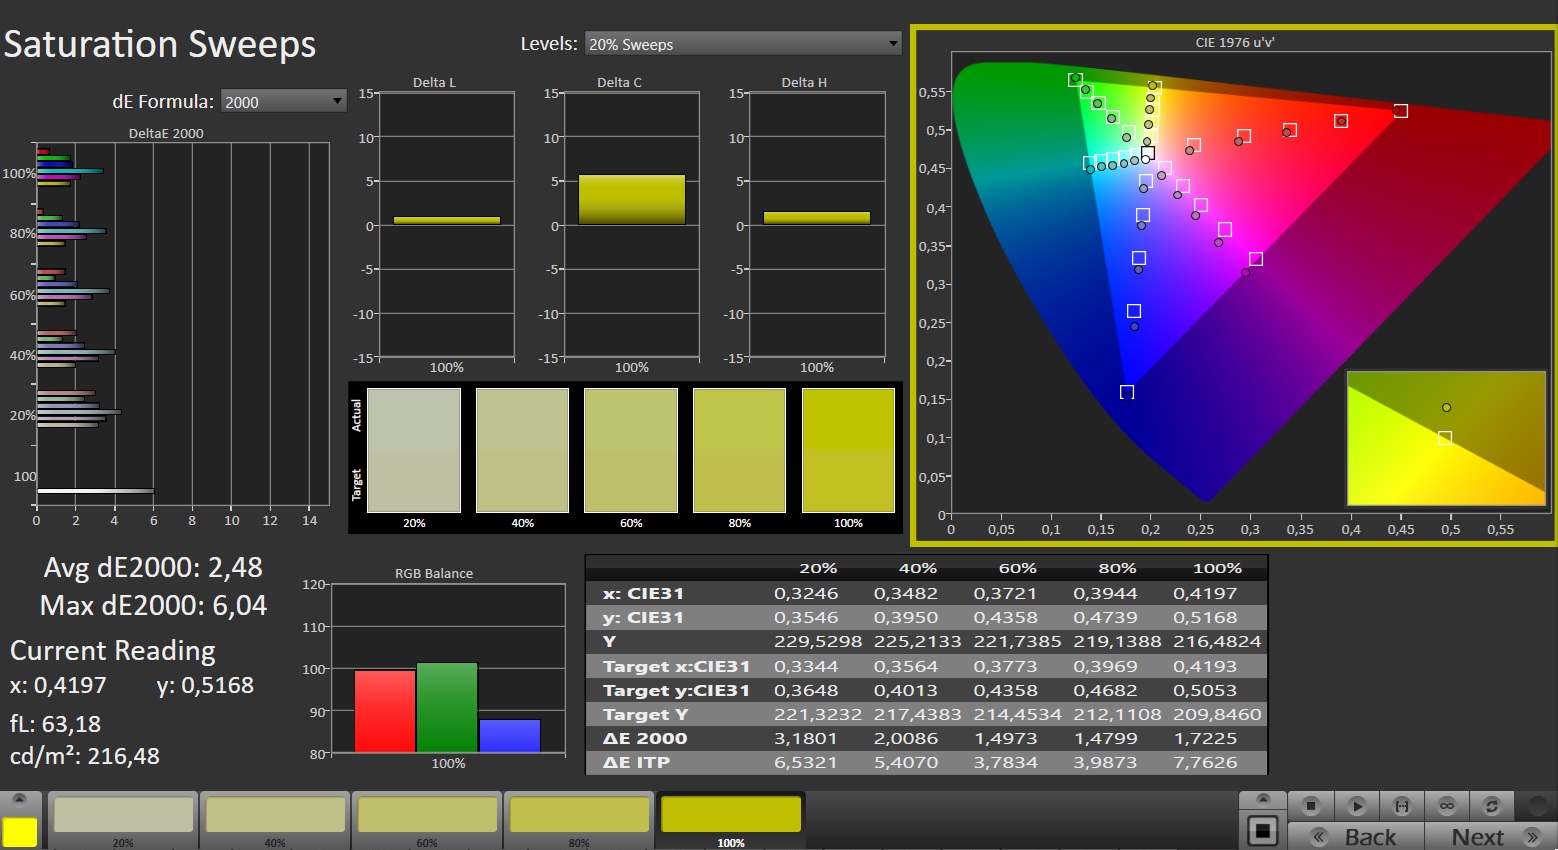
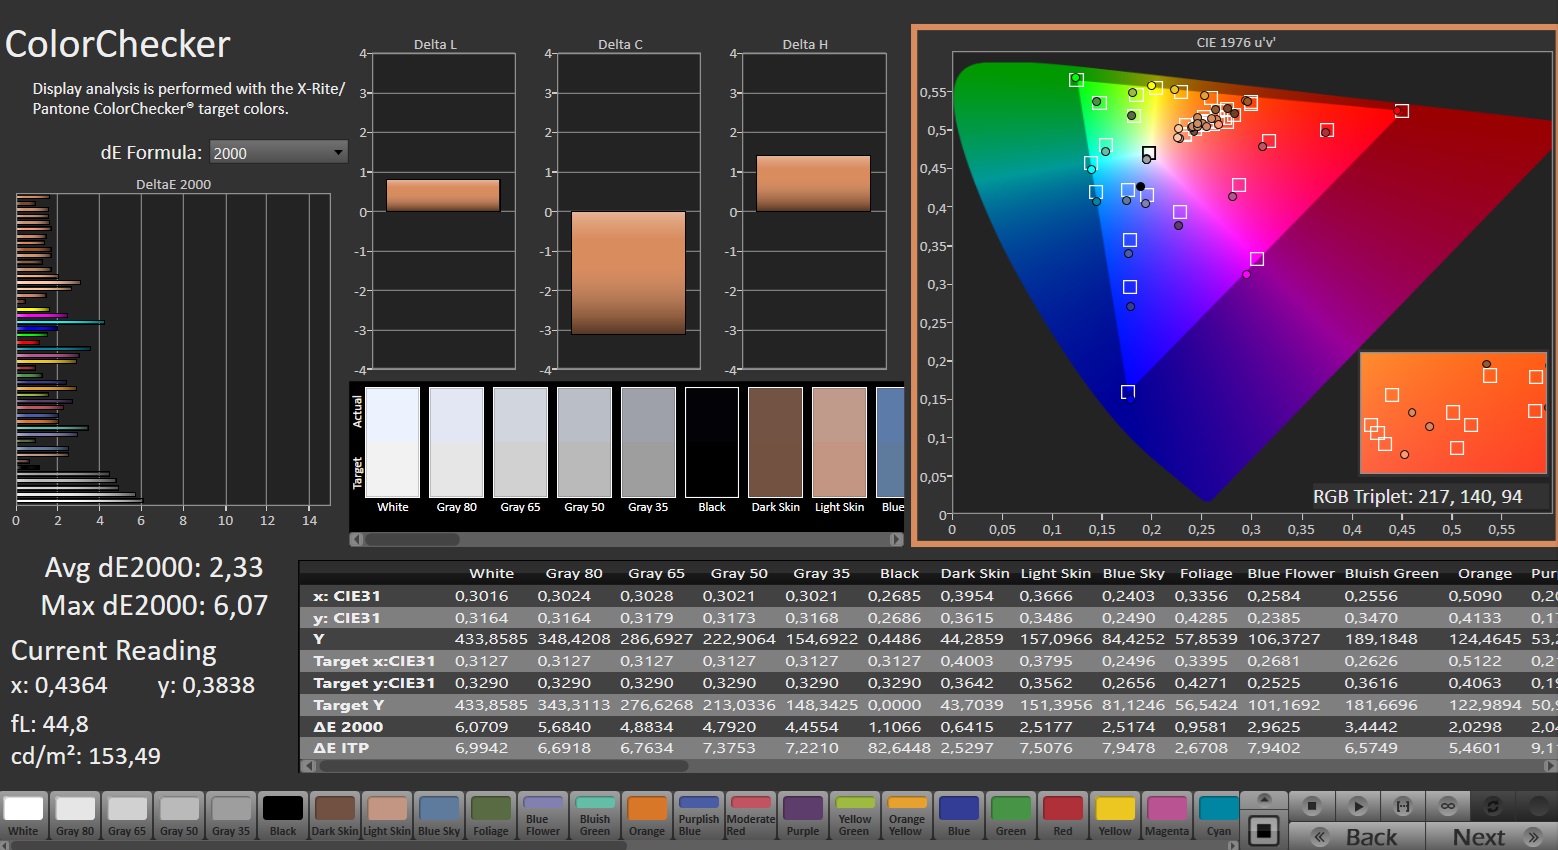
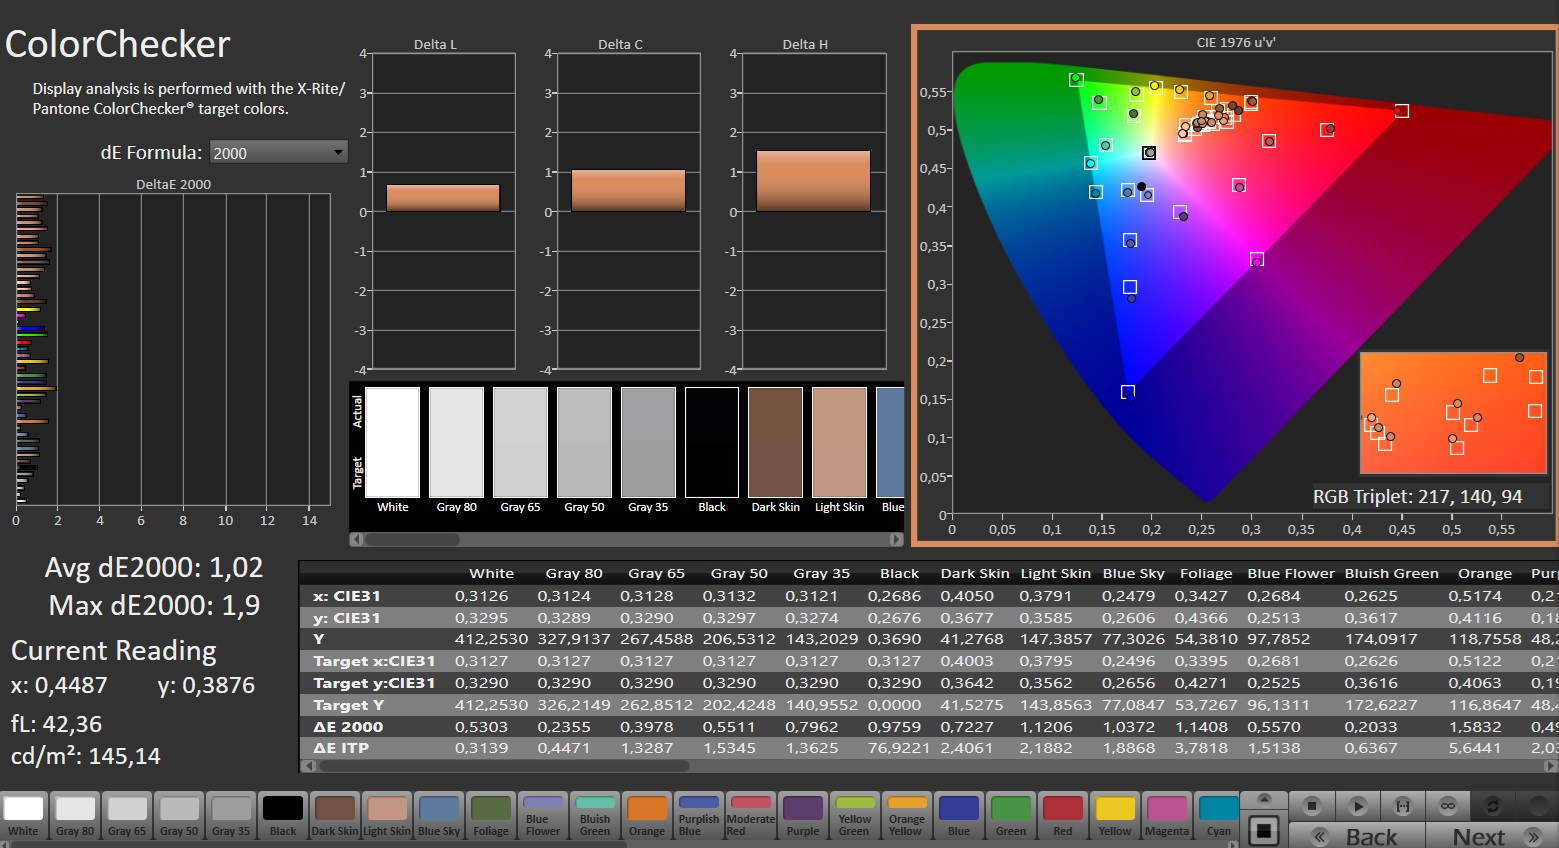
ΔE Color 2.33 | 0.5-29.43 Ø4.87, calibrated: 1.02
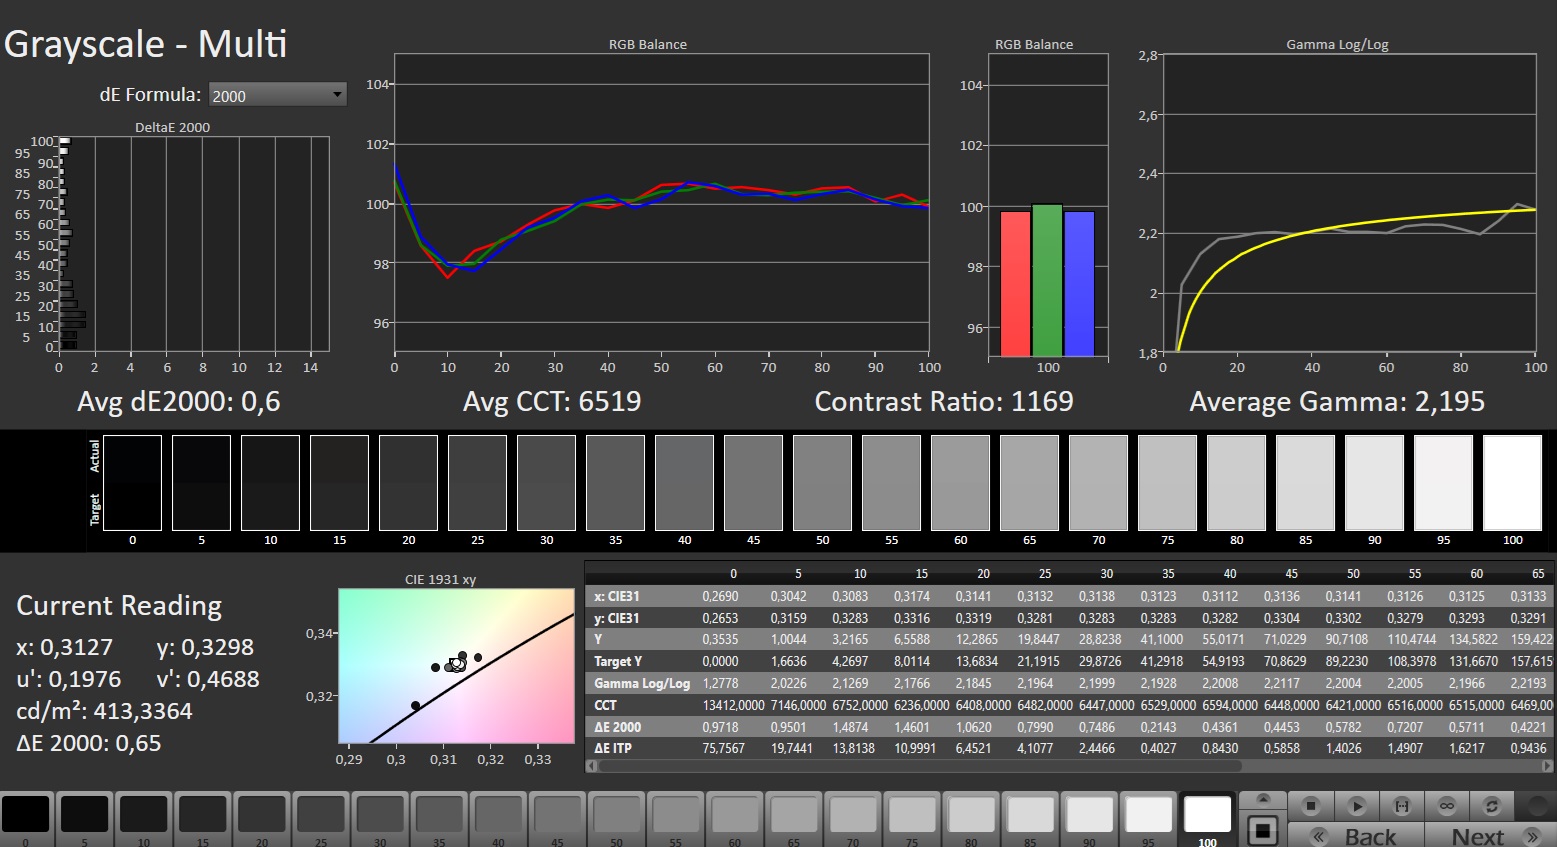
ΔE Greyscale 3.7 | 0.5-98 Ø5.1
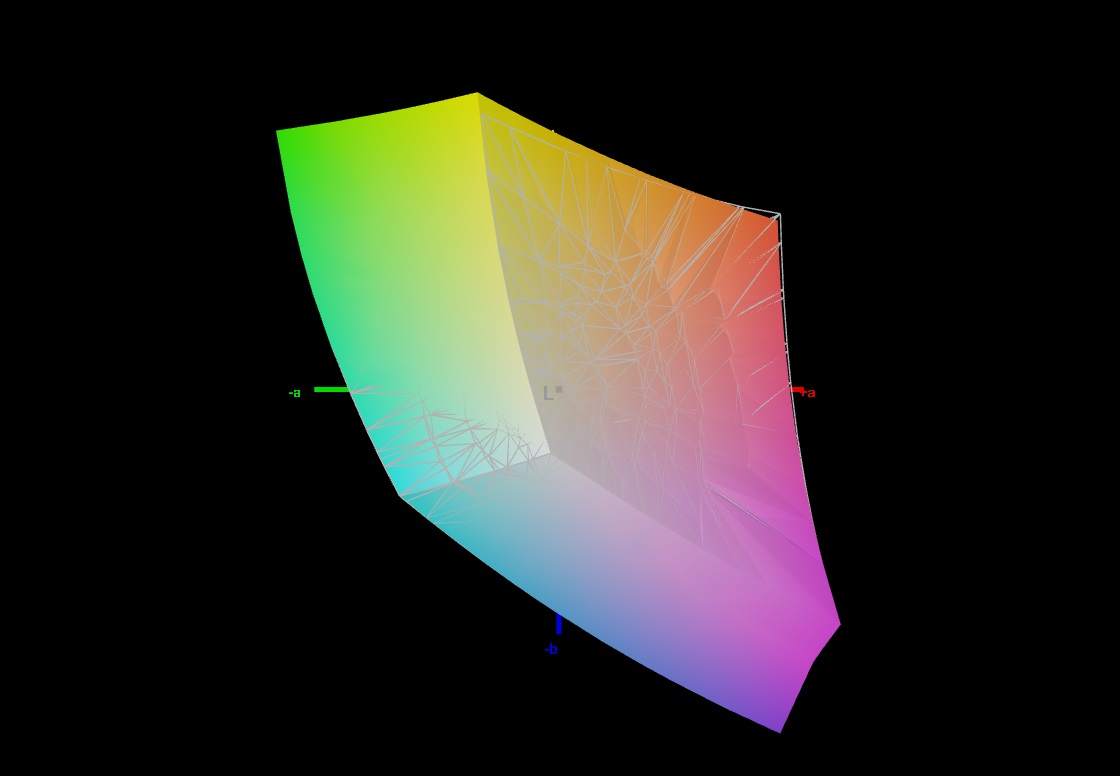
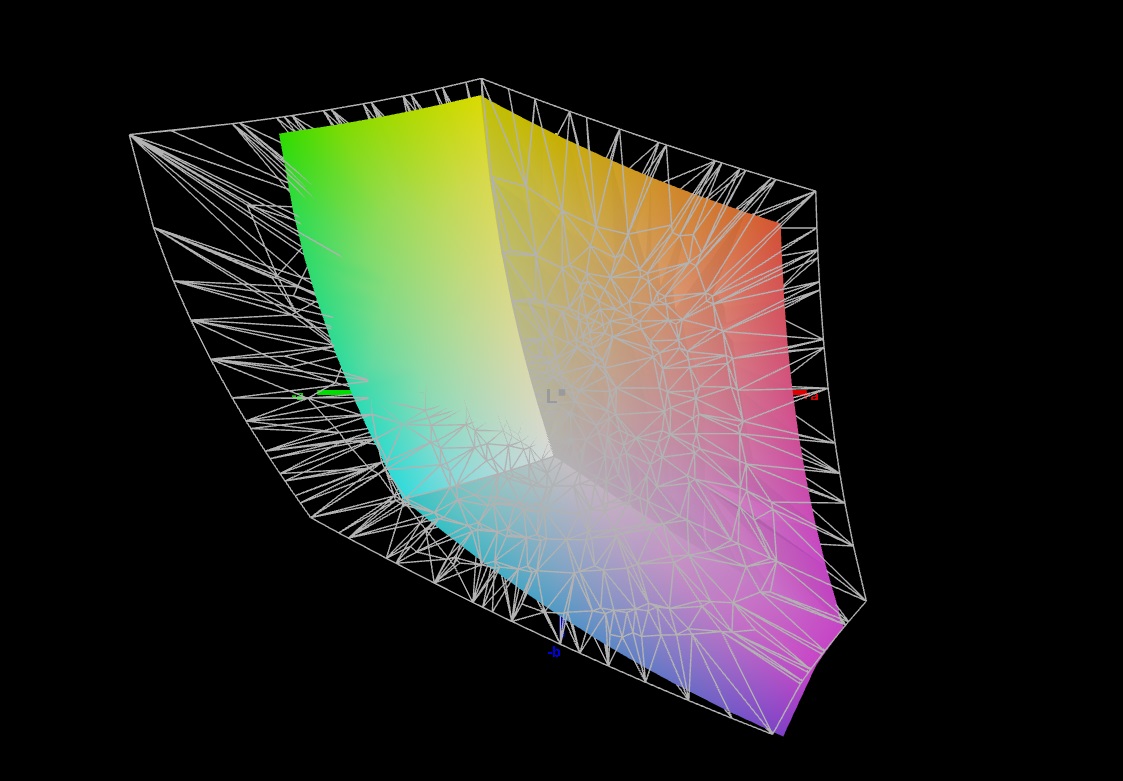
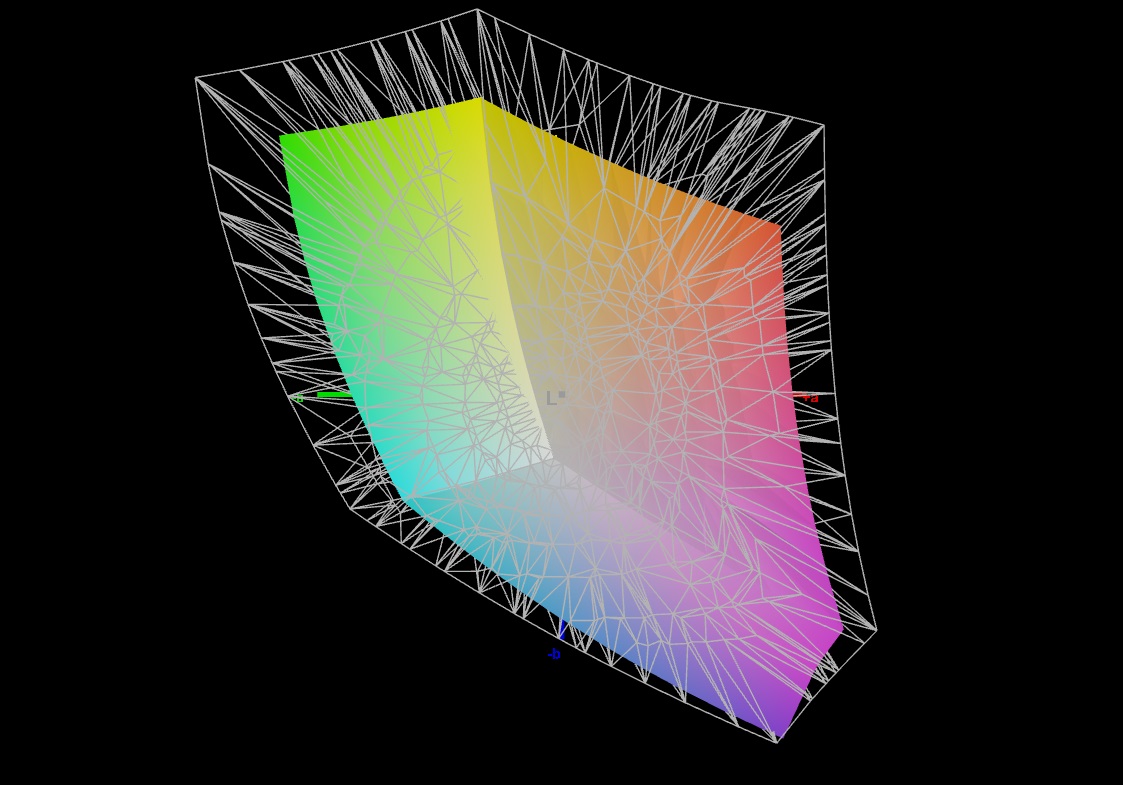
70.8% AdobeRGB 1998 (Argyll 2.2.0 3D)
99.5% sRGB (Argyll 2.2.0 3D)
68.8% Display P3 (Argyll 2.2.0 3D)
Gamma: 2.161
| SCHENKER XMG Pro 16 Studio (Mid 24) BOE CQ NE160QDM-NZ1, IPS, 2560x1600, 16" | Acer Predator Helios Neo 16 (2024) Chi Mei N160GME-GTB, LED, 2560x1600, 16" | Lenovo Legion Pro 5 16IRX9 BOE NE160QDM-NYC, IPS, 2560x1600, 16" | Aorus 16X 2024 BOE CQ NE160QDM-NY1, IPS, 2560x1600, 16" | SCHENKER XMG Pro 16 Studio (Mid 23) BOE CQ NE160QDM-NZ1, IPS, 2560x1600, 16" | Lenovo Legion 7 16 IRX G9 MNG007ZA1-2, IPS, 3200x2000, 16" | |
|---|---|---|---|---|---|---|
| Display | 20% | 0% | -2% | -0% | 21% | |
| Display P3 Coverage | 68.8 | 95.9 39% | 69.3 1% | 67.2 -2% | 69.4 1% | 95 38% |
| sRGB Coverage | 99.5 | 99.8 0% | 99.4 0% | 96.7 -3% | 98.2 -1% | 100 1% |
| AdobeRGB 1998 Coverage | 70.8 | 86.4 22% | 70.1 -1% | 69.3 -2% | 70.1 -1% | 87.2 23% |
| Response Times | 11% | -18% | 28% | -9% | -14% | |
| Response Time Grey 50% / Grey 80% * | 12.7 ? | 5 ? 61% | 11.9 ? 6% | 7.5 ? 41% | 12.2 ? 4% | 14.4 ? -13% |
| Response Time Black / White * | 6.3 ? | 8.8 ? -40% | 8.9 ? -41% | 5.4 ? 14% | 7.7 ? -22% | 7.2 ? -14% |
| PWM Frequency | ||||||
| Screen | 19% | 20% | 4% | -5% | 23% | |
| Brightness middle | 416 | 521 25% | 384 -8% | 542 30% | 349 -16% | 412 -1% |
| Brightness | 392 | 506 29% | 366 -7% | 504 29% | 348 -11% | 396 1% |
| Brightness Distribution | 86 | 85 -1% | 91 6% | 86 0% | 93 8% | 89 3% |
| Black Level * | 0.38 | 0.44 -16% | 0.35 8% | 0.45 -18% | 0.32 16% | 0.43 -13% |
| Contrast | 1095 | 1184 8% | 1097 0% | 1204 10% | 1091 0% | 958 -13% |
| Colorchecker dE 2000 * | 2.33 | 1.74 25% | 0.97 58% | 2.73 -17% | 1.98 15% | 0.9 61% |
| Colorchecker dE 2000 max. * | 6.07 | 3.88 36% | 3.57 41% | 5.29 13% | 7.56 -25% | 2 67% |
| Colorchecker dE 2000 calibrated * | 1.02 | 0.52 49% | 0.77 25% | 1.32 -29% | 1.45 -42% | 0.6 41% |
| Greyscale dE 2000 * | 3.7 | 3 19% | 1.5 59% | 2.9 22% | 3.3 11% | 1.4 62% |
| Gamma | 2.161 102% | 2.164 102% | 2.24 98% | 2.192 100% | 2.137 103% | 2.23 99% |
| CCT | 7102 92% | 6816 95% | 6709 97% | 6173 105% | 6672 97% | 6731 97% |
| Totalt genomsnitt (program/inställningar) | 17% /
18% | 1% /
11% | 10% /
6% | -5% /
-5% | 10% /
17% |
* ... mindre är bättre
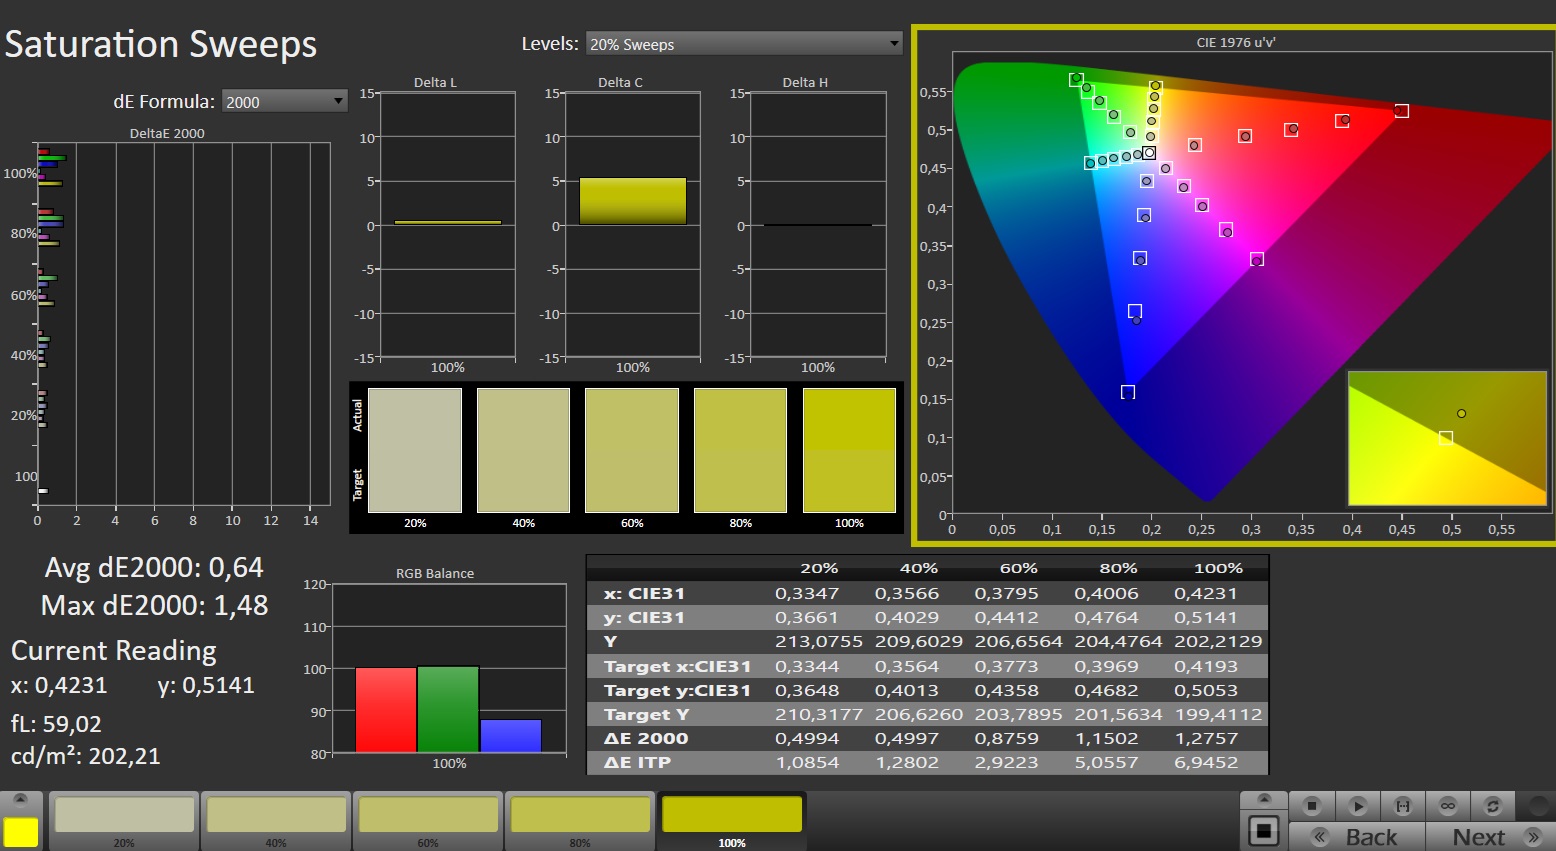
Den installerade panelens färgrymdstäckning är en besvikelse. Endast sRGB-rymden kan återges - inte AdobeRGB- och DCI-P3-rymderna. Detta skiljer sig dock inte från skärmarna hos de flesta konkurrenter. Ändå borde skärmen på en bärbar dator som marknadsförs som en "professionell arbetsstation för innehållsskapande" verkligen erbjuda hela spektrumet. Dess färgåtergivning ser bättre ut: En liten avvikelse på 2,26 (mål: DeltaE < 3) kan minskas till 1,03 genom att utföra en kalibrering.
Visa svarstider
| ↔ Svarstid svart till vitt | ||
|---|---|---|
| 6.3 ms ... stiga ↗ och falla ↘ kombinerat | ↗ 2.5 ms stiga | 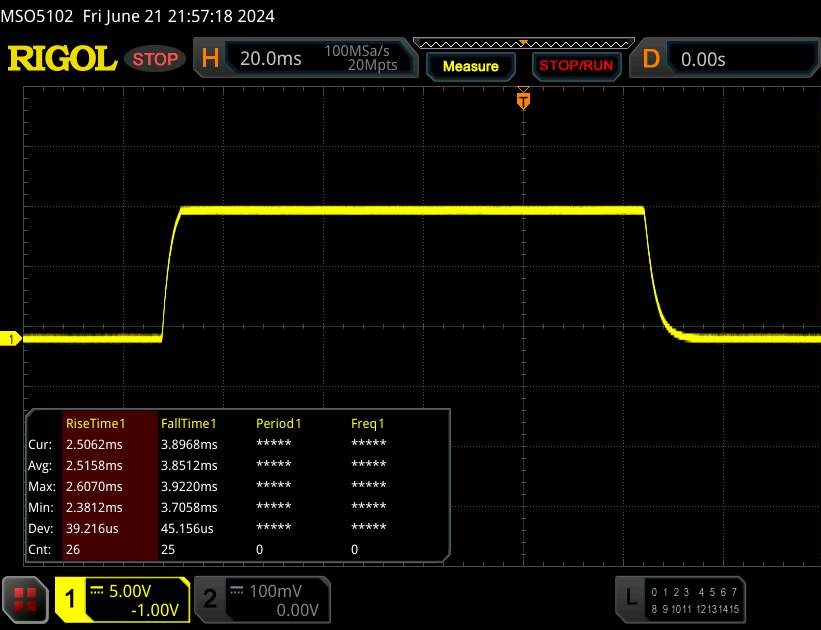 |
| ↘ 3.8 ms hösten | ||
| Skärmen visar väldigt snabba svarsfrekvenser i våra tester och borde vara mycket väl lämpad för fartfyllt spel. I jämförelse sträcker sig alla testade enheter från 0.1 (minst) till 240 (maximalt) ms. » 17 % av alla enheter är bättre. Det betyder att den uppmätta svarstiden är bättre än genomsnittet av alla testade enheter (20.7 ms). | ||
| ↔ Svarstid 50 % grått till 80 % grått | ||
| 12.7 ms ... stiga ↗ och falla ↘ kombinerat | ↗ 6 ms stiga | 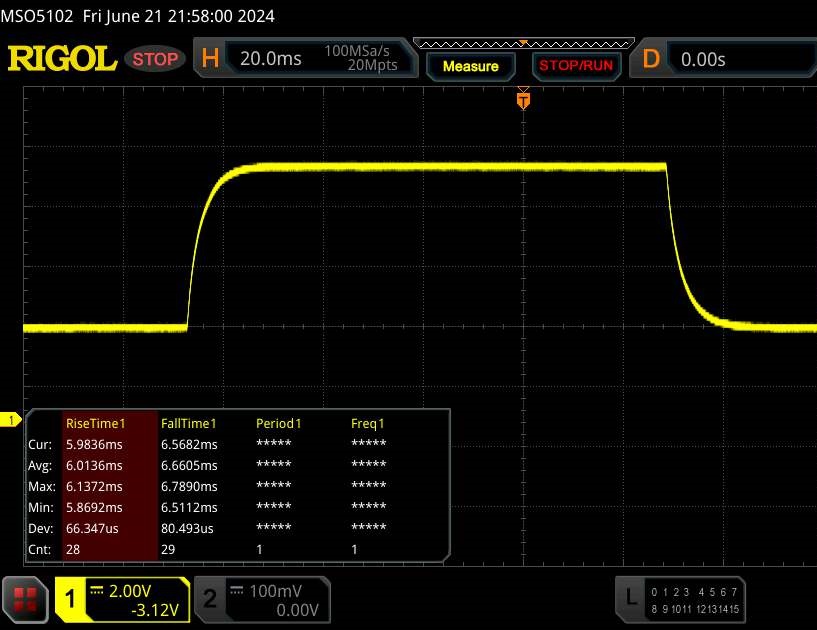 |
| ↘ 6.7 ms hösten | ||
| Skärmen visar bra svarsfrekvens i våra tester, men kan vara för långsam för konkurrenskraftiga spelare. I jämförelse sträcker sig alla testade enheter från 0.165 (minst) till 636 (maximalt) ms. » 23 % av alla enheter är bättre. Det betyder att den uppmätta svarstiden är bättre än genomsnittet av alla testade enheter (32.5 ms). | ||
Skärmflimmer / PWM (Puls-Width Modulation)
| Skärmflimmer / PWM upptäcktes inte |  | ||
Som jämförelse: 53 % av alla testade enheter använder inte PWM för att dämpa skärmen. Om PWM upptäcktes mättes ett medelvärde av 8488 (minst: 5 - maximum: 343500) Hz. | |||
Prestanda - Raptor Lake Uppdatering ersätter Raptor Lake
XMG Pro 16 Studio (Mid 24), som av Schenker beskrivs som en "bärbar dator för innehållsskapande", riktar sig till spelare och kreatörer. Alla modeller har en Core i9-14900HX och det tillgängliga GPU-urvalet inkluderar en RTX 4060 och en RTX 4070 - vår testenhet är utrustad med en RTX 4070. Denna variant är tillgänglig för cirka 2 500 USD. Priserna börjar på cirka 1 800 USD.
Testförhållanden
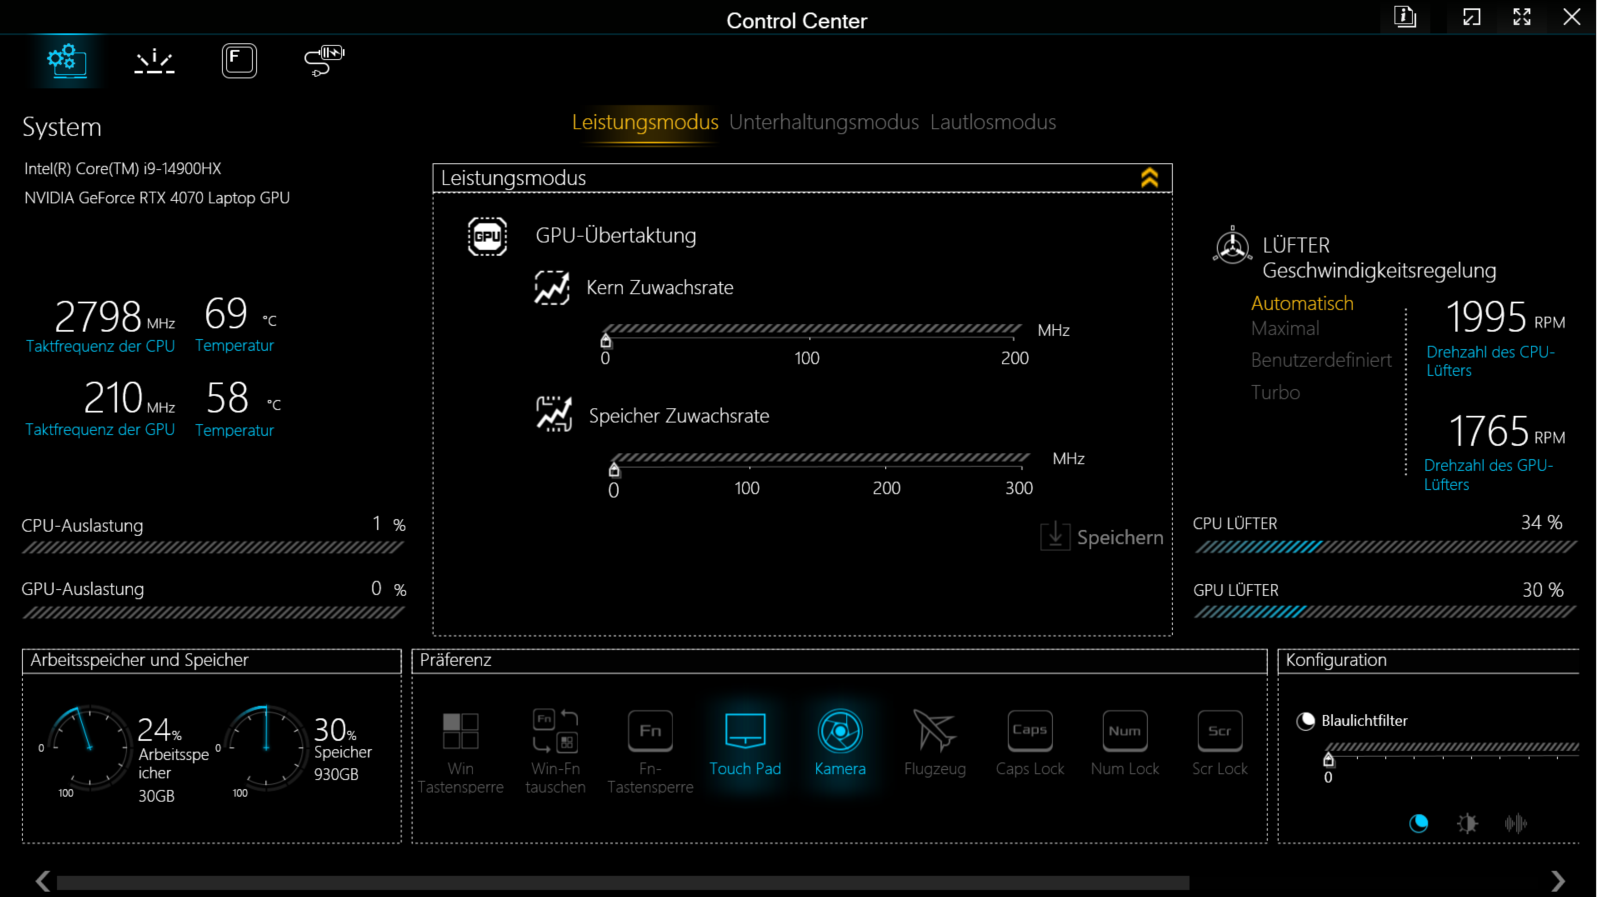
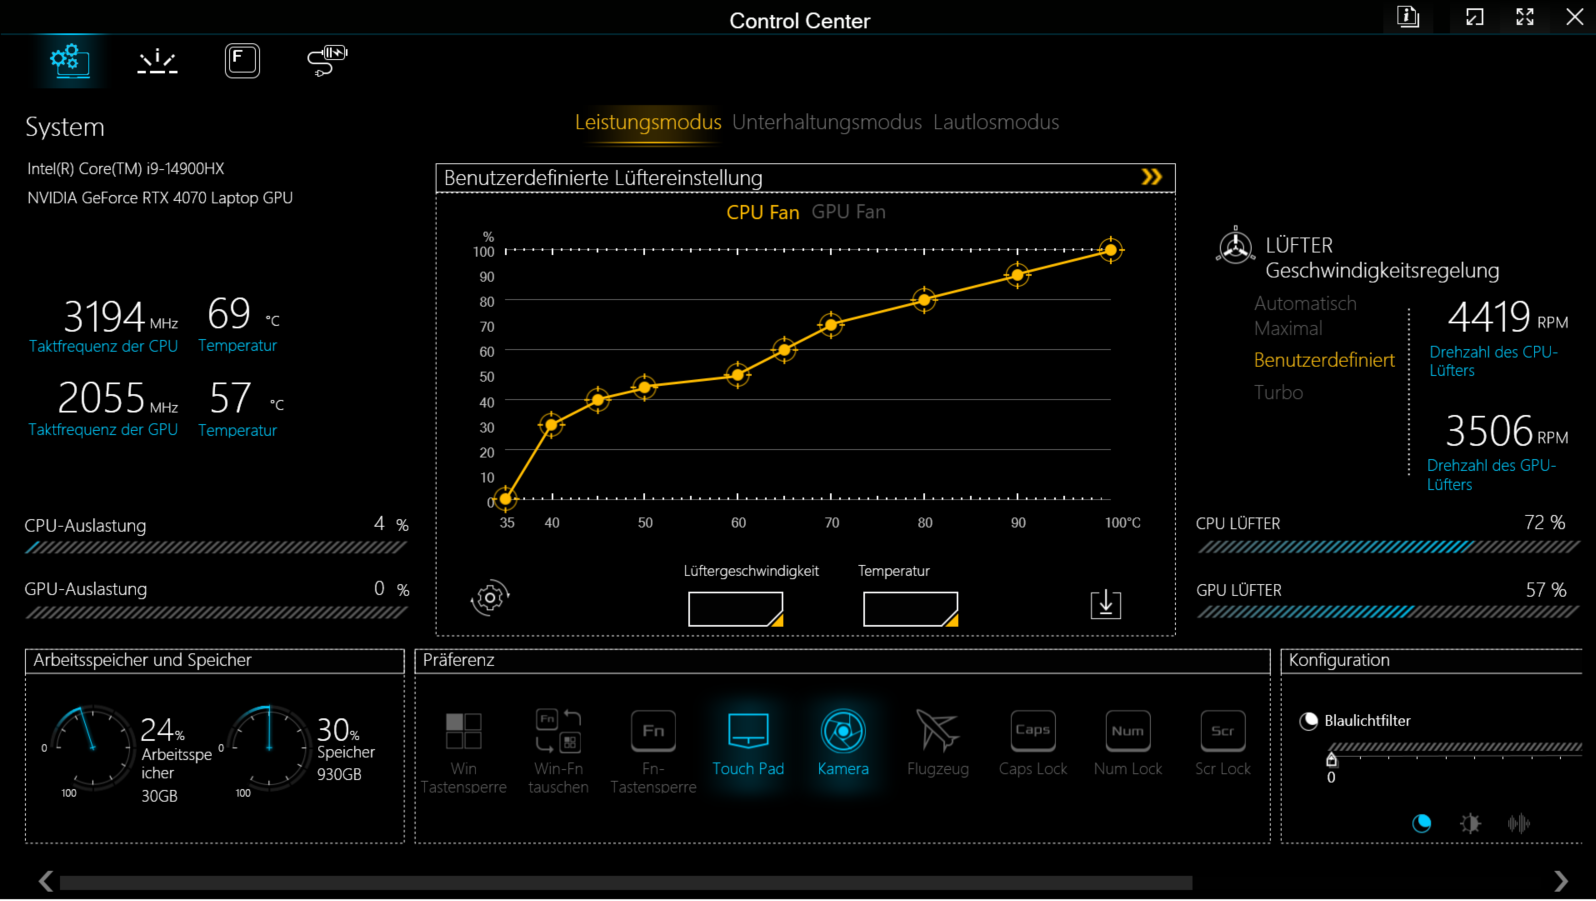
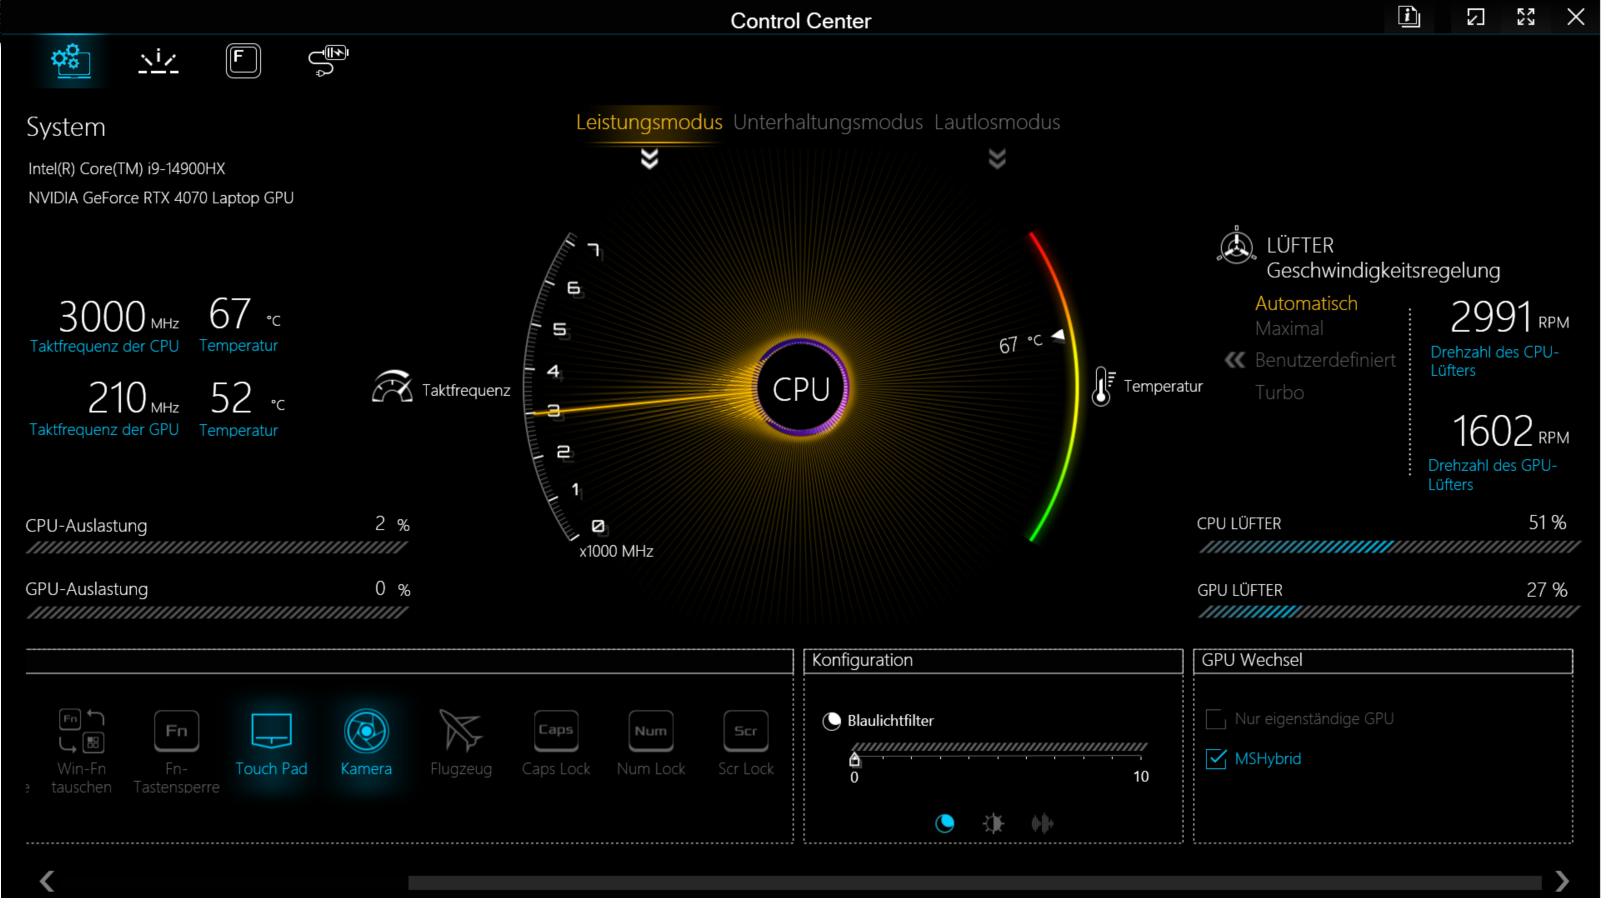
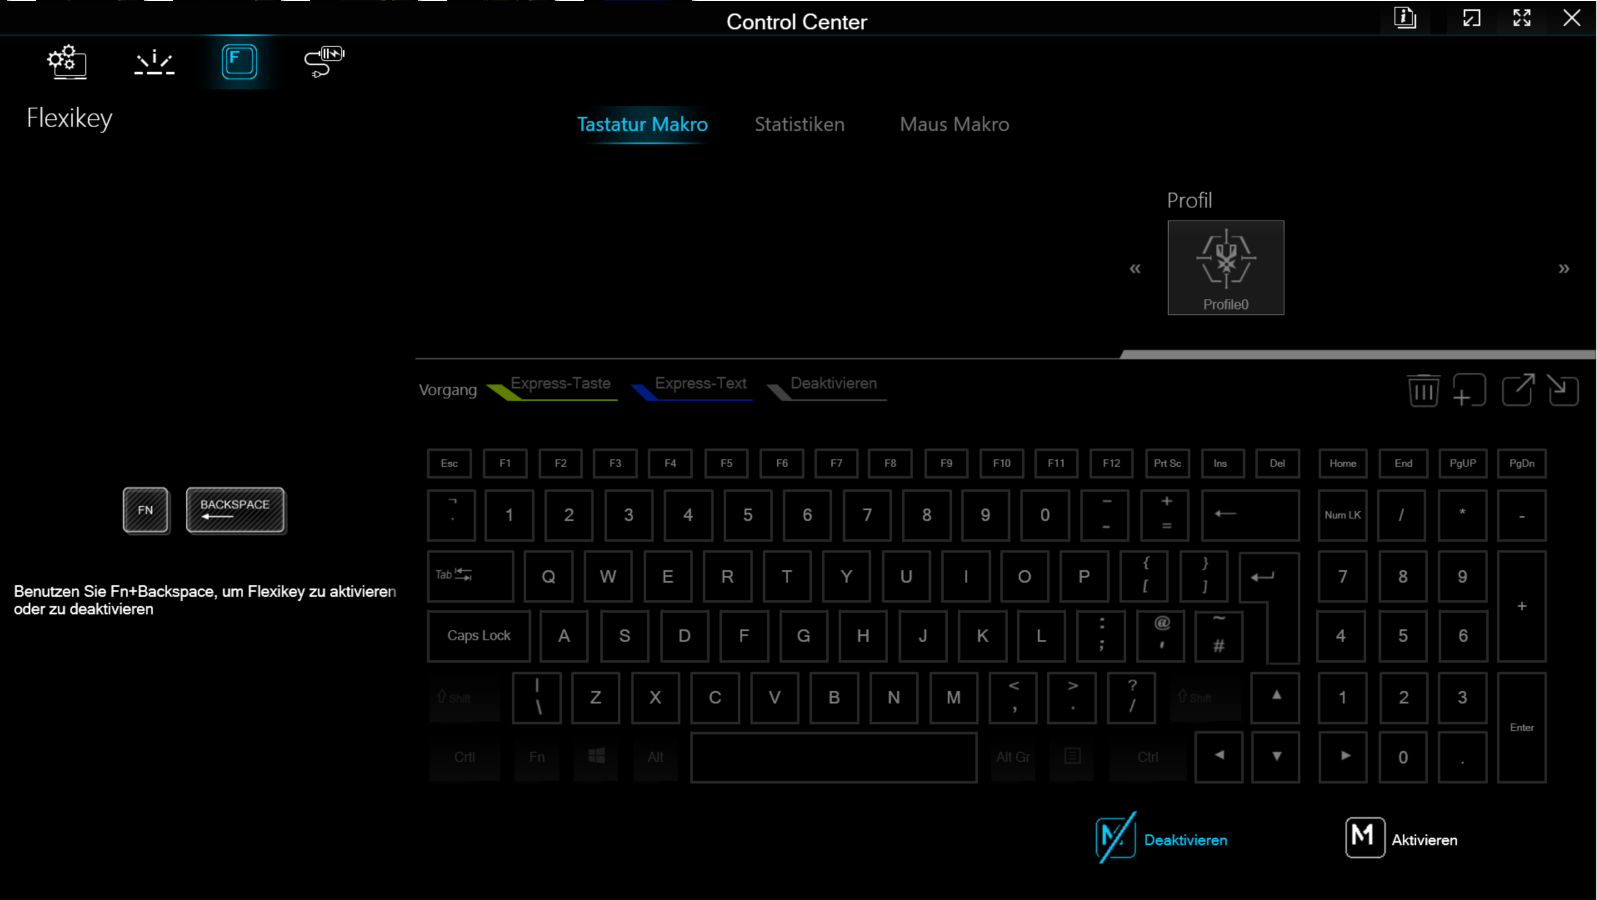
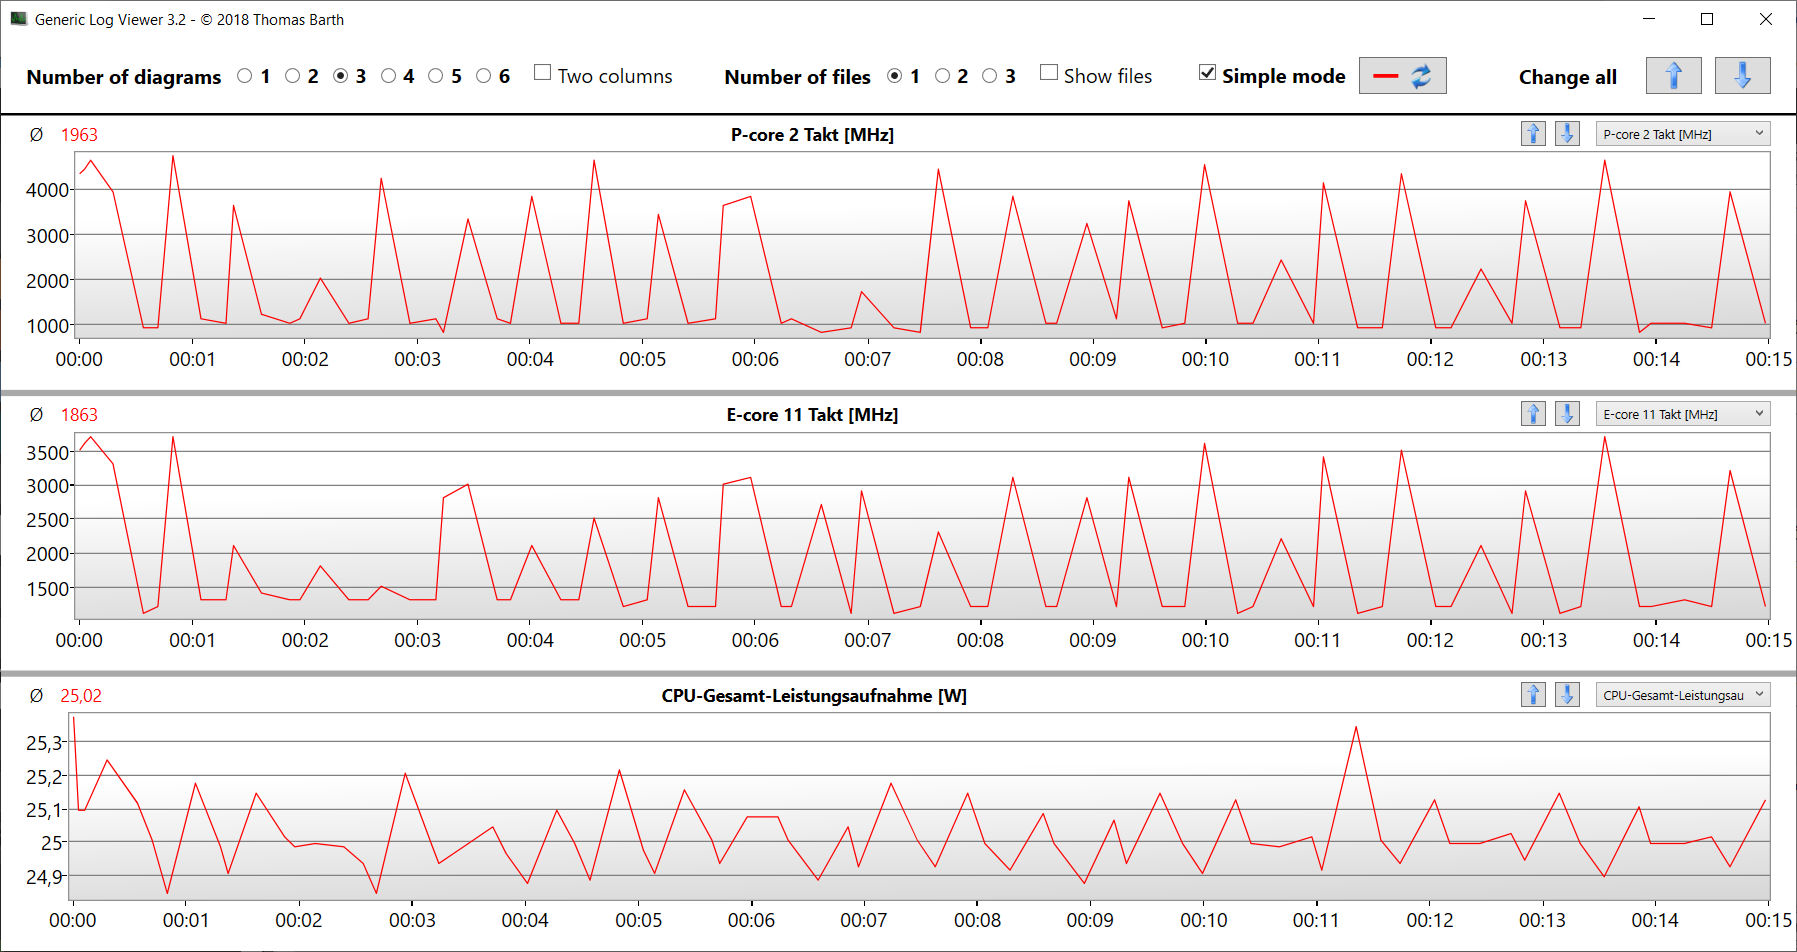
Det finns tre tillverkarspecifika prestandalägen att välja mellan (se tabell), som kan växlas mellan med hjälp av programvaran Control Center (den bärbara datorns kontrollcenter). Vi använde lägena prestanda (benchmarks) och tyst (batteritester). Optimus var aktivt.
| Prestanda-läge | Underhållningsläge | Tyst läge (dGPU av) | |
|---|---|---|---|
| Effektgräns 1 (HWInfo) | 135 watt | 55 watt | 25 watt |
| Effektgräns 2 (HWInfo) | 150 watt | 135 watt | 35 watt |
| Buller (CP 2077 Phantom) | 53 dB (A) | 49 dB (A) | - |
| Prestanda (CP 2077 Phantom) | 78 fps | 73 fps | - |
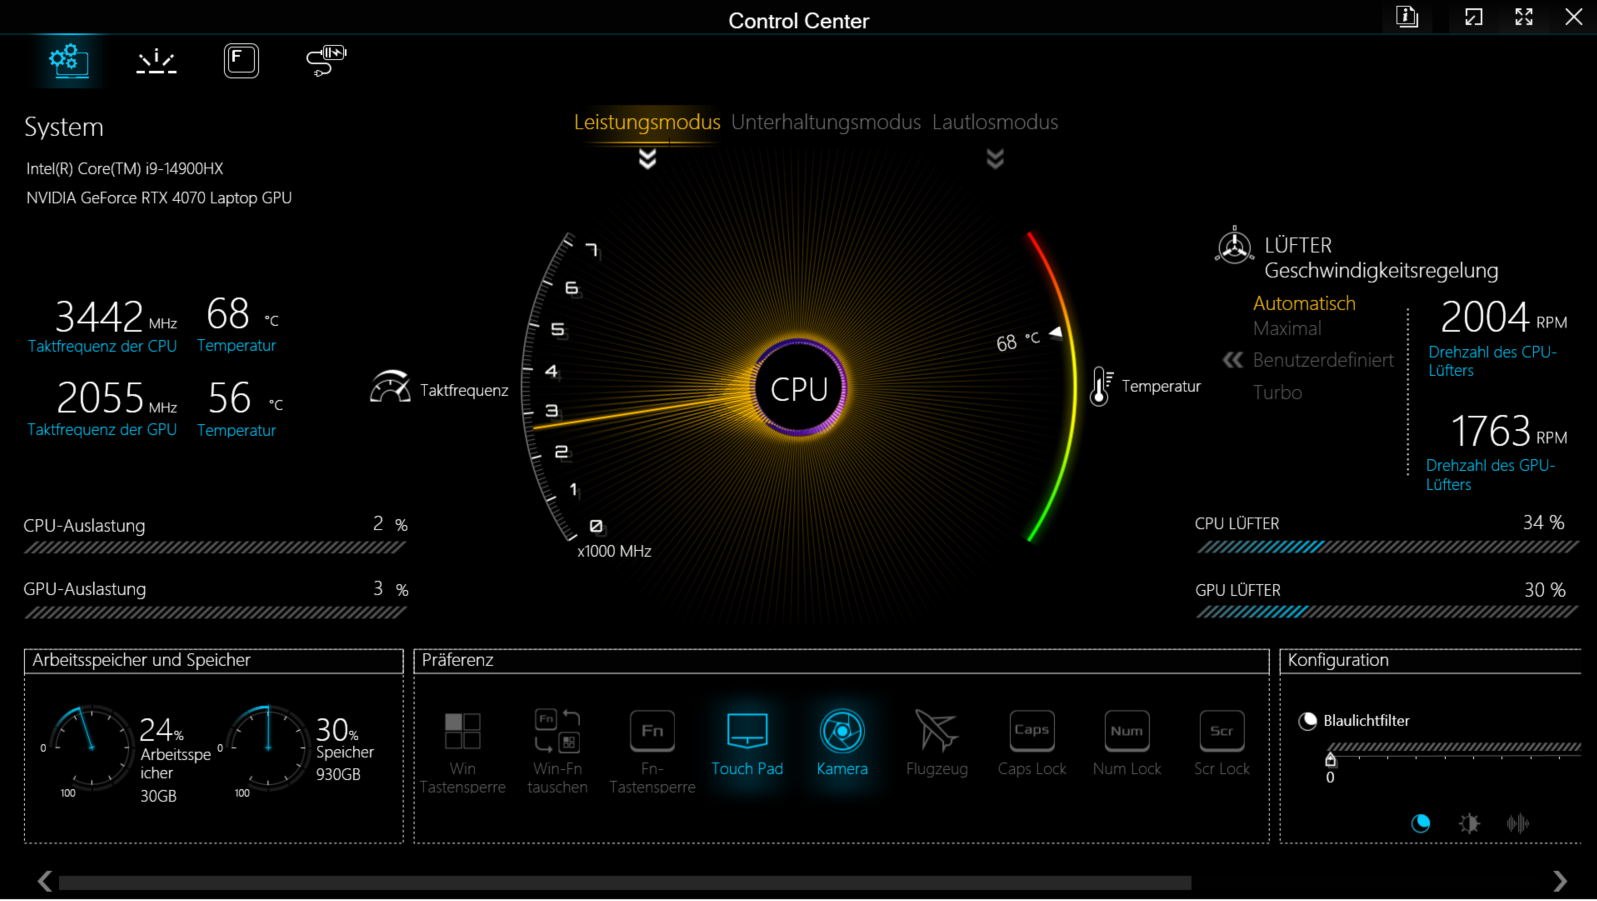
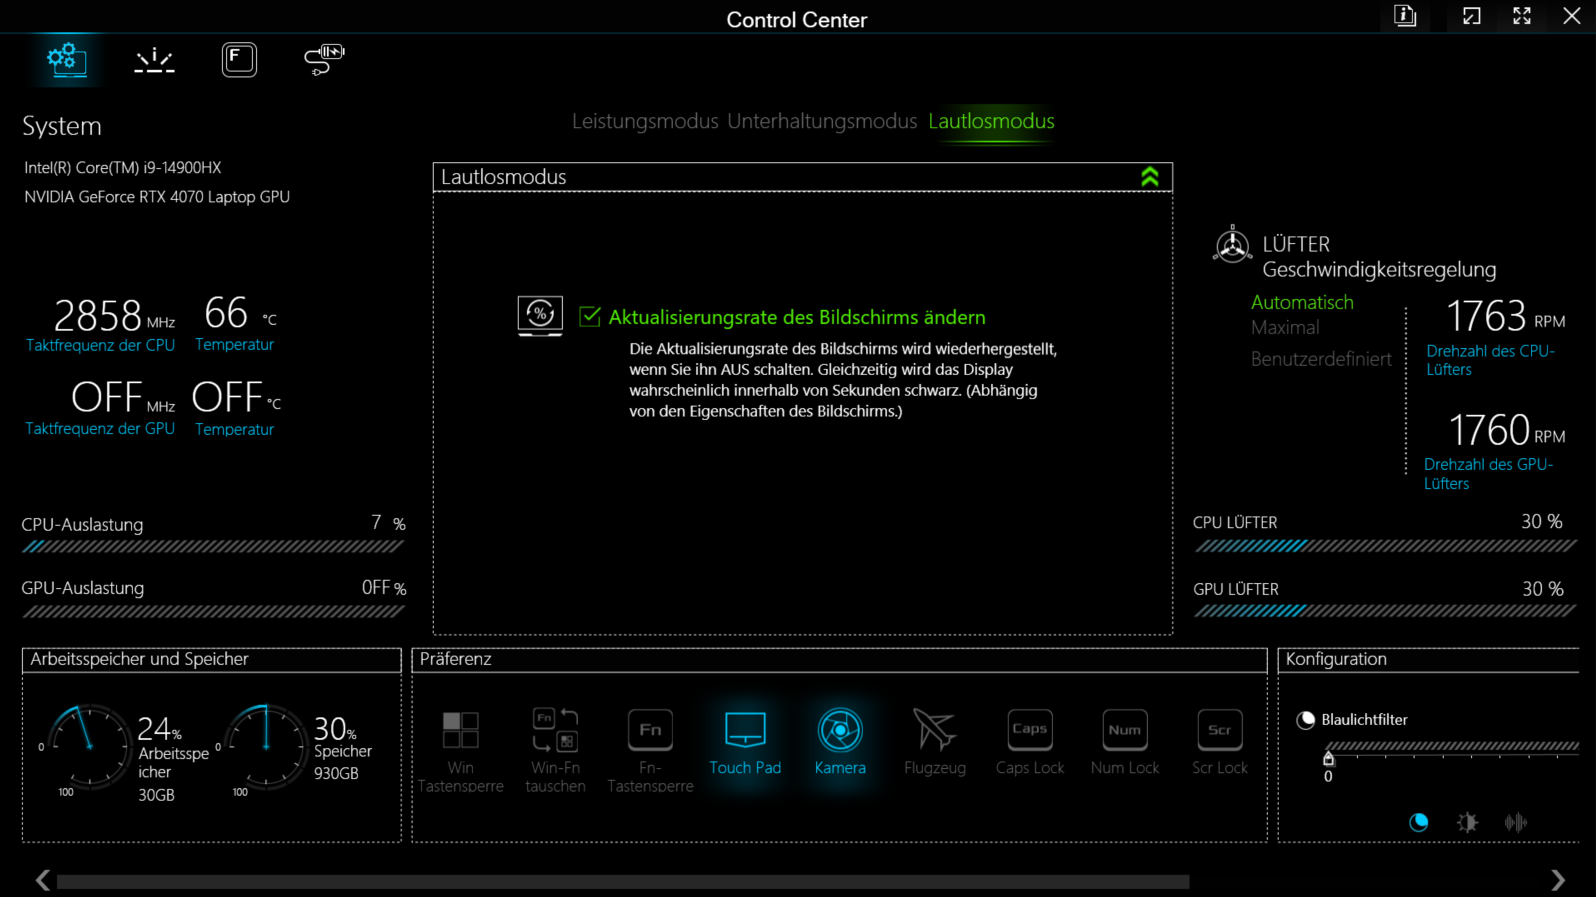
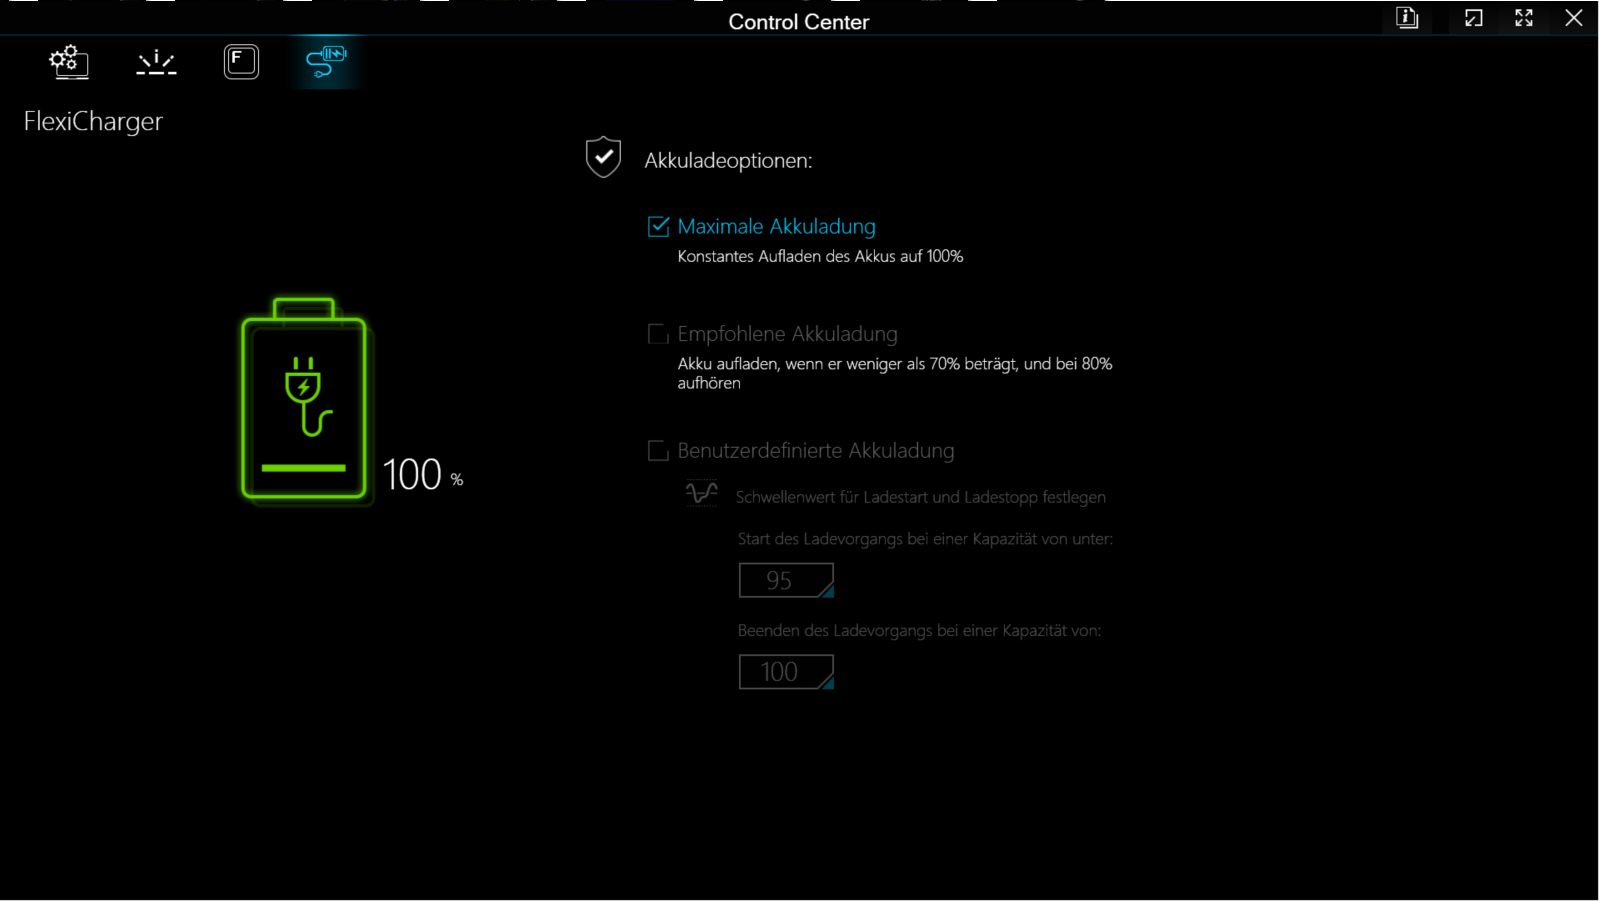
Problem med underhållningsläget
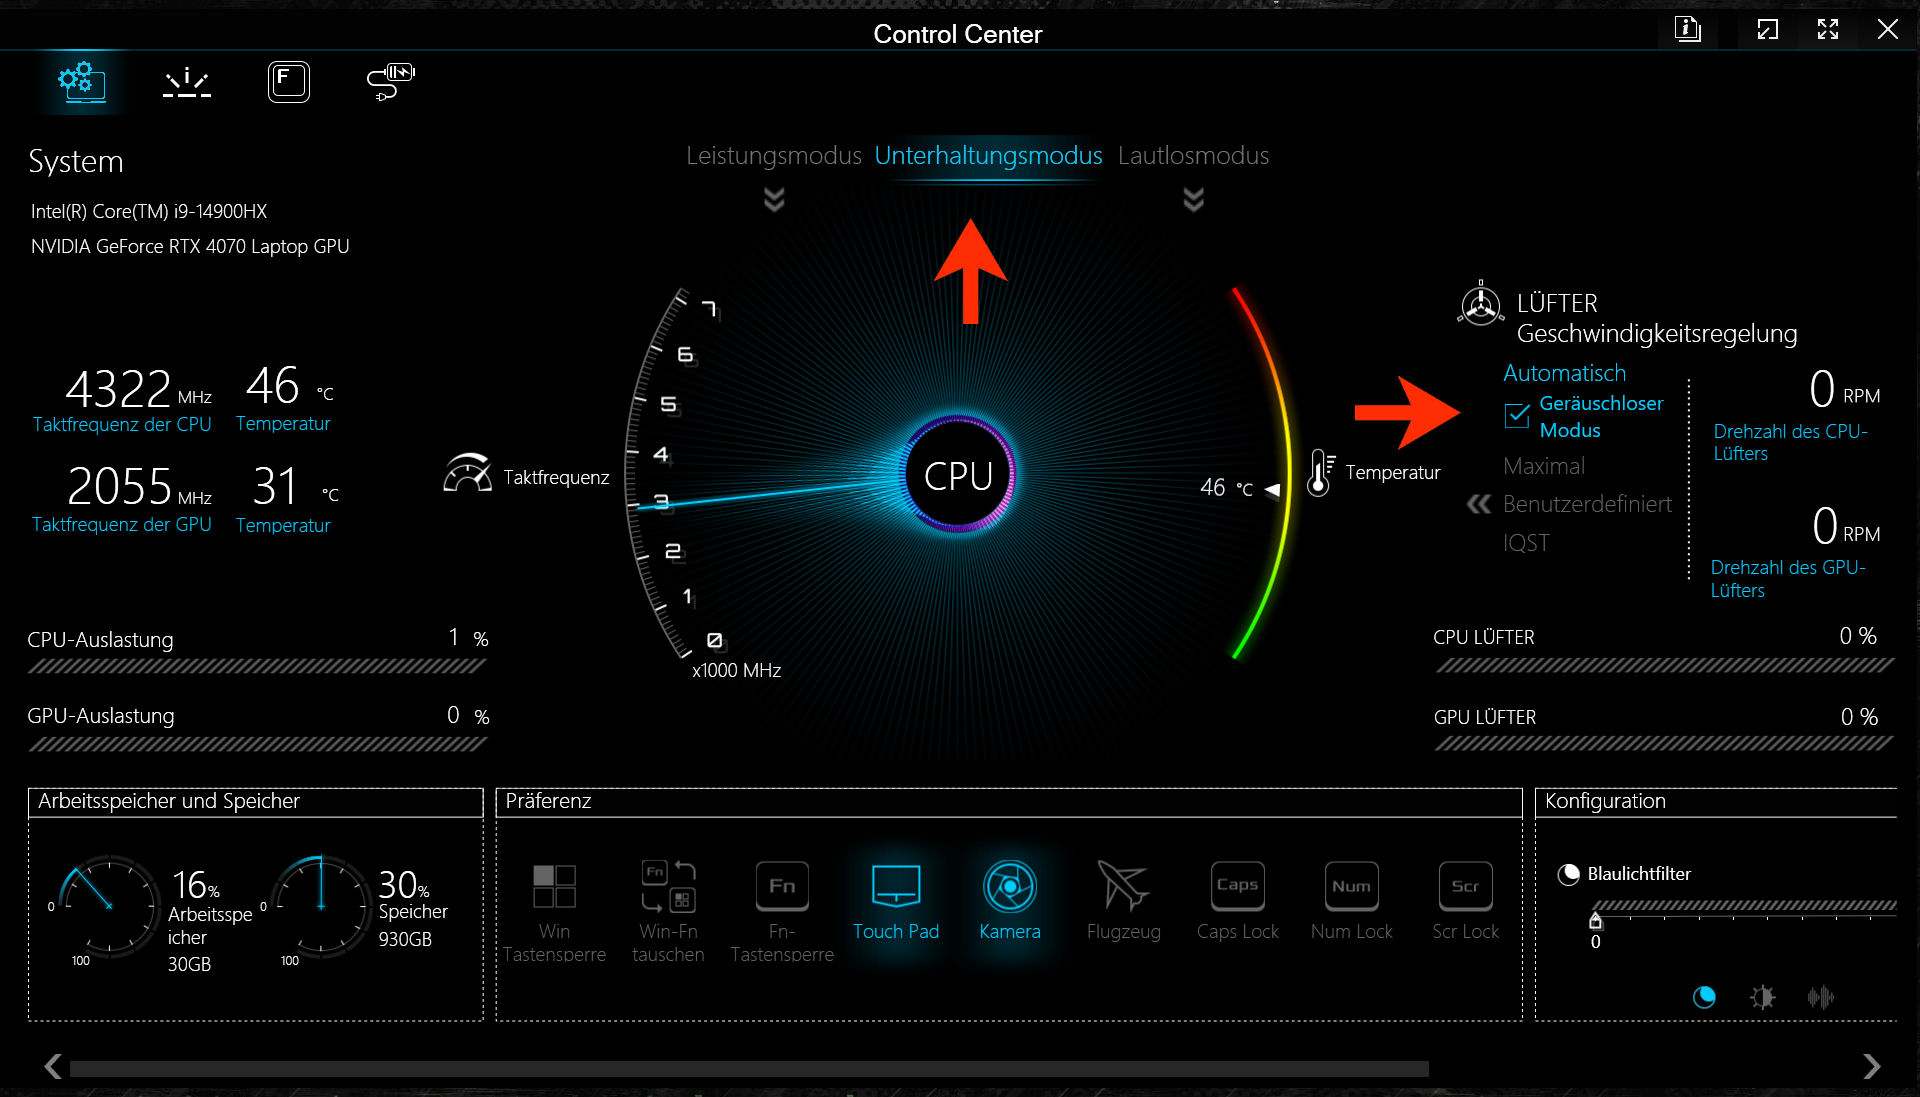
Profilen "underhållning" orsakade betydande fluktuationer i prestanda under vårt test. Som ett resultat avstod vi från att använda den. Under testets gång kunde Schenker konstatera en väg runt problemet: Aktivering av fläktalternativet "tyst läge" i kontrollcentret. En framtida BIOS-uppdatering bör förhoppningsvis åtgärda detta fel.
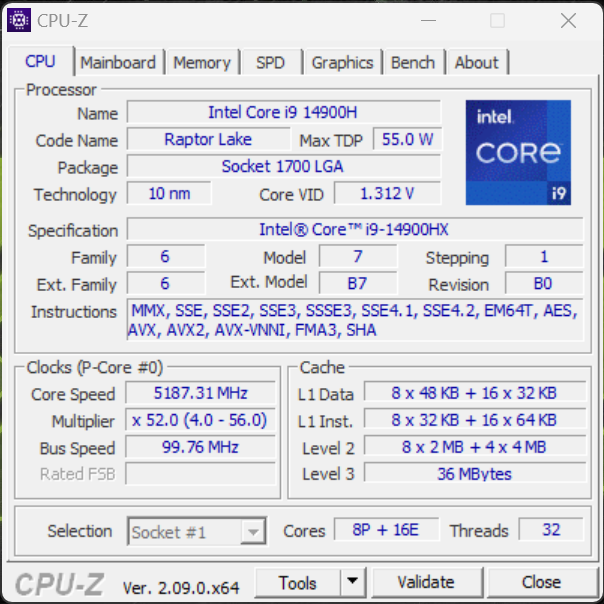
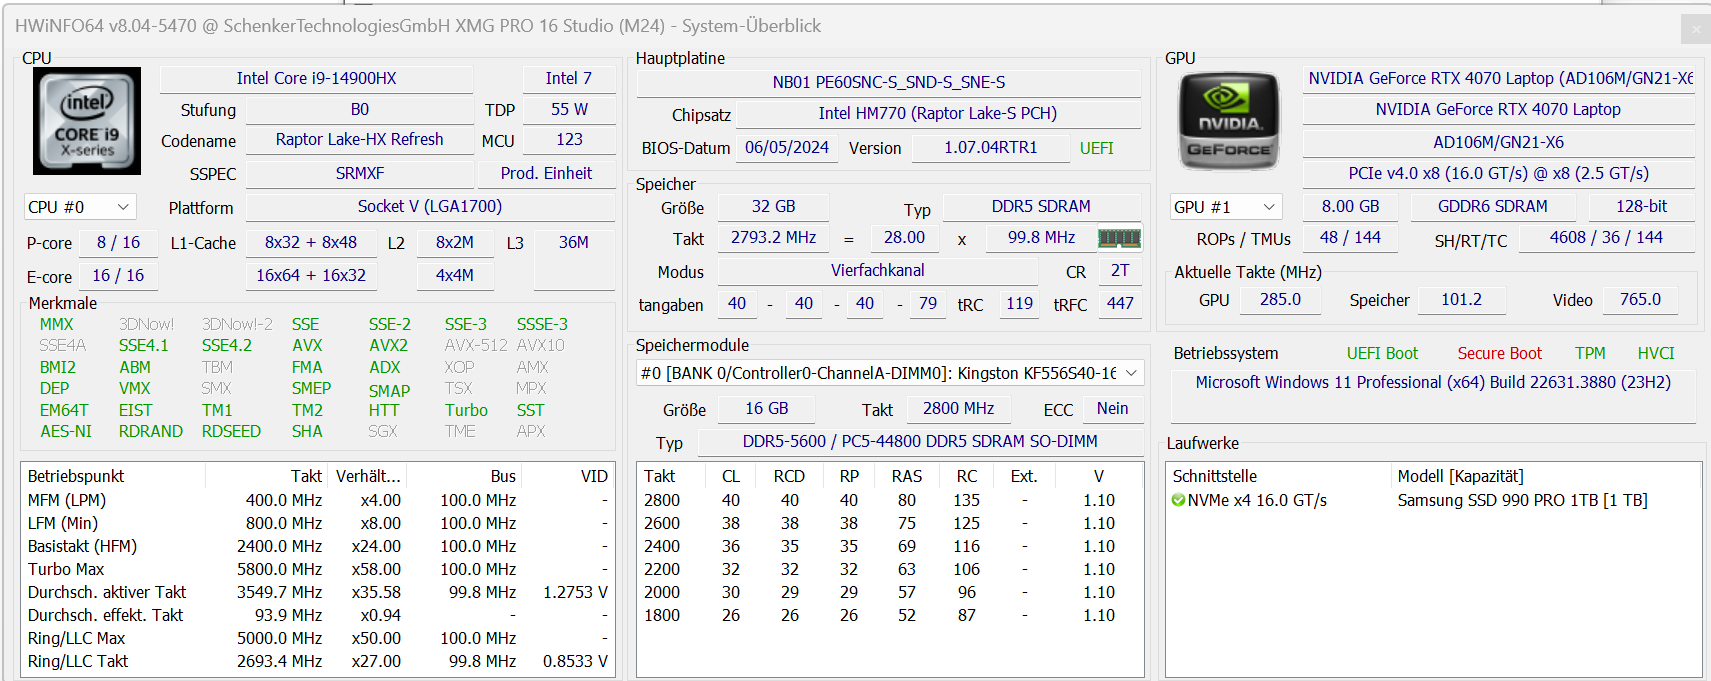
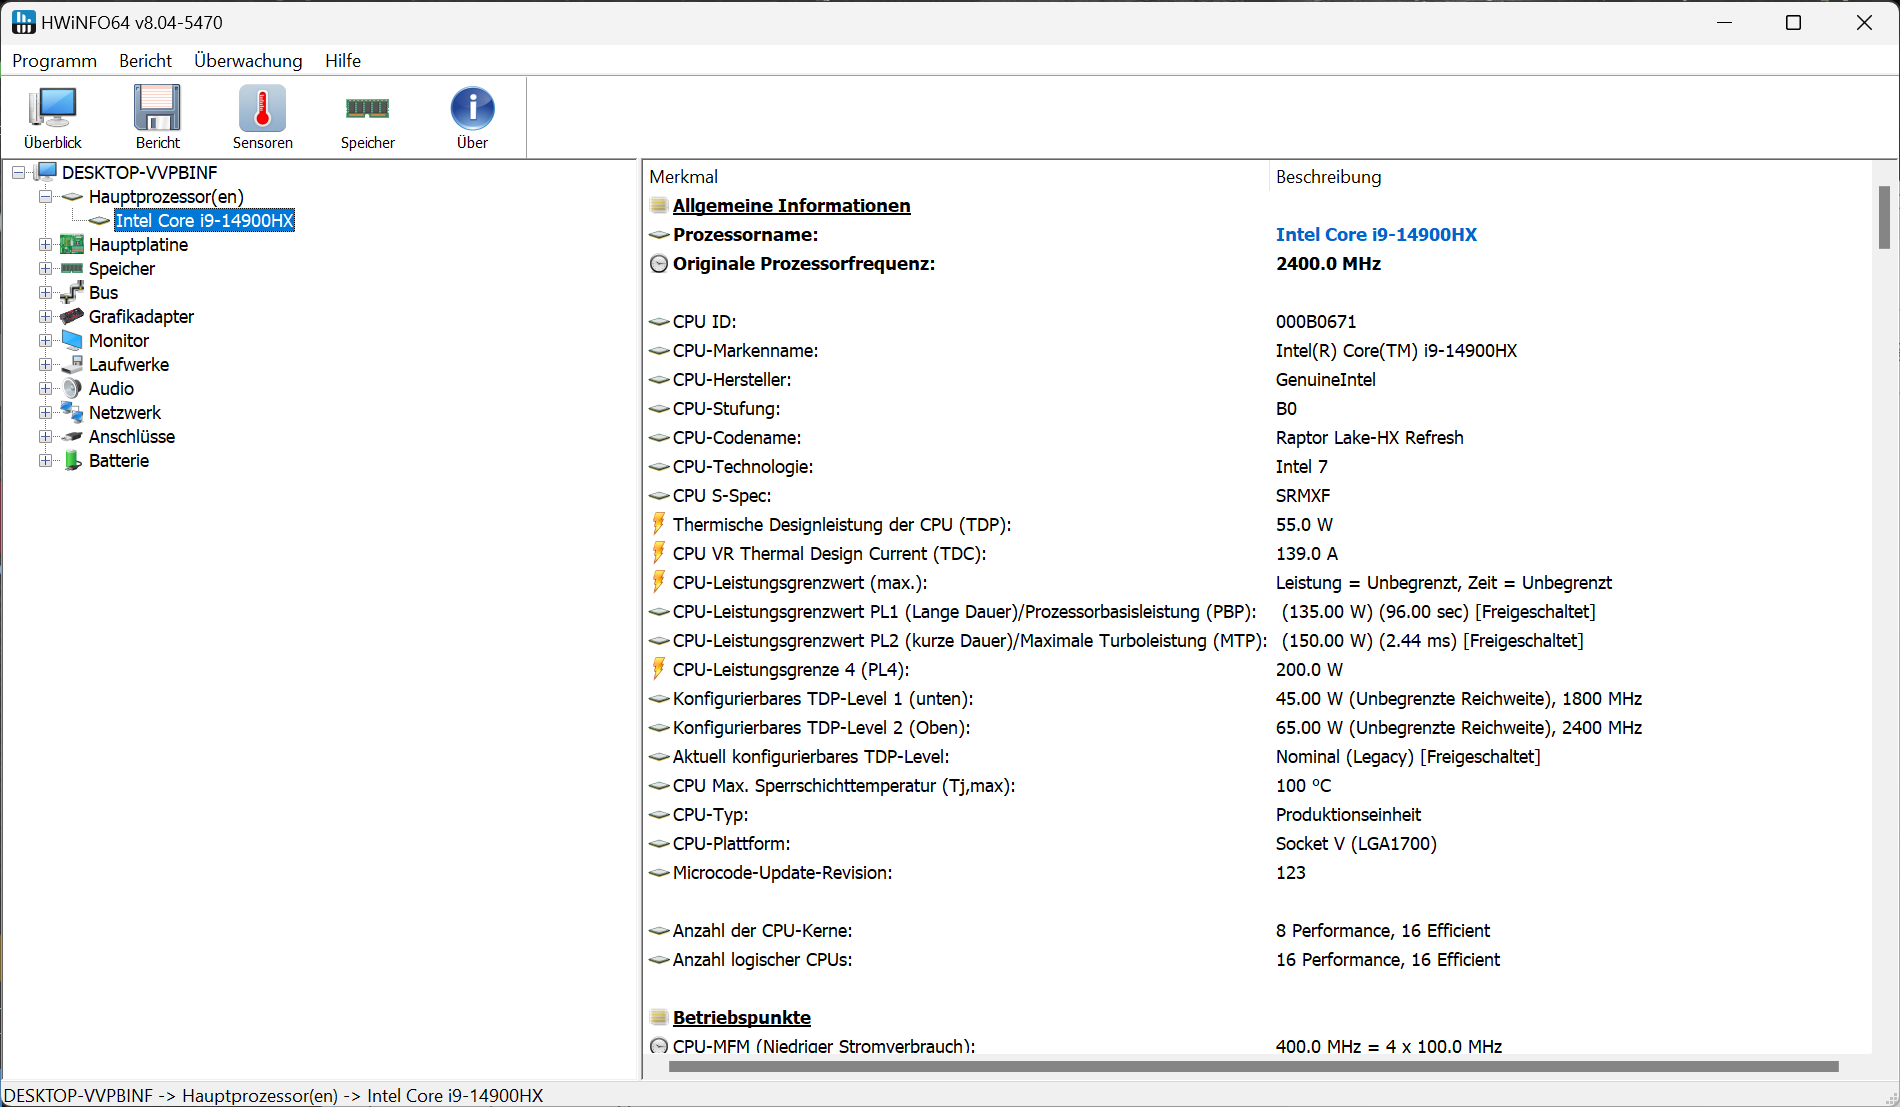
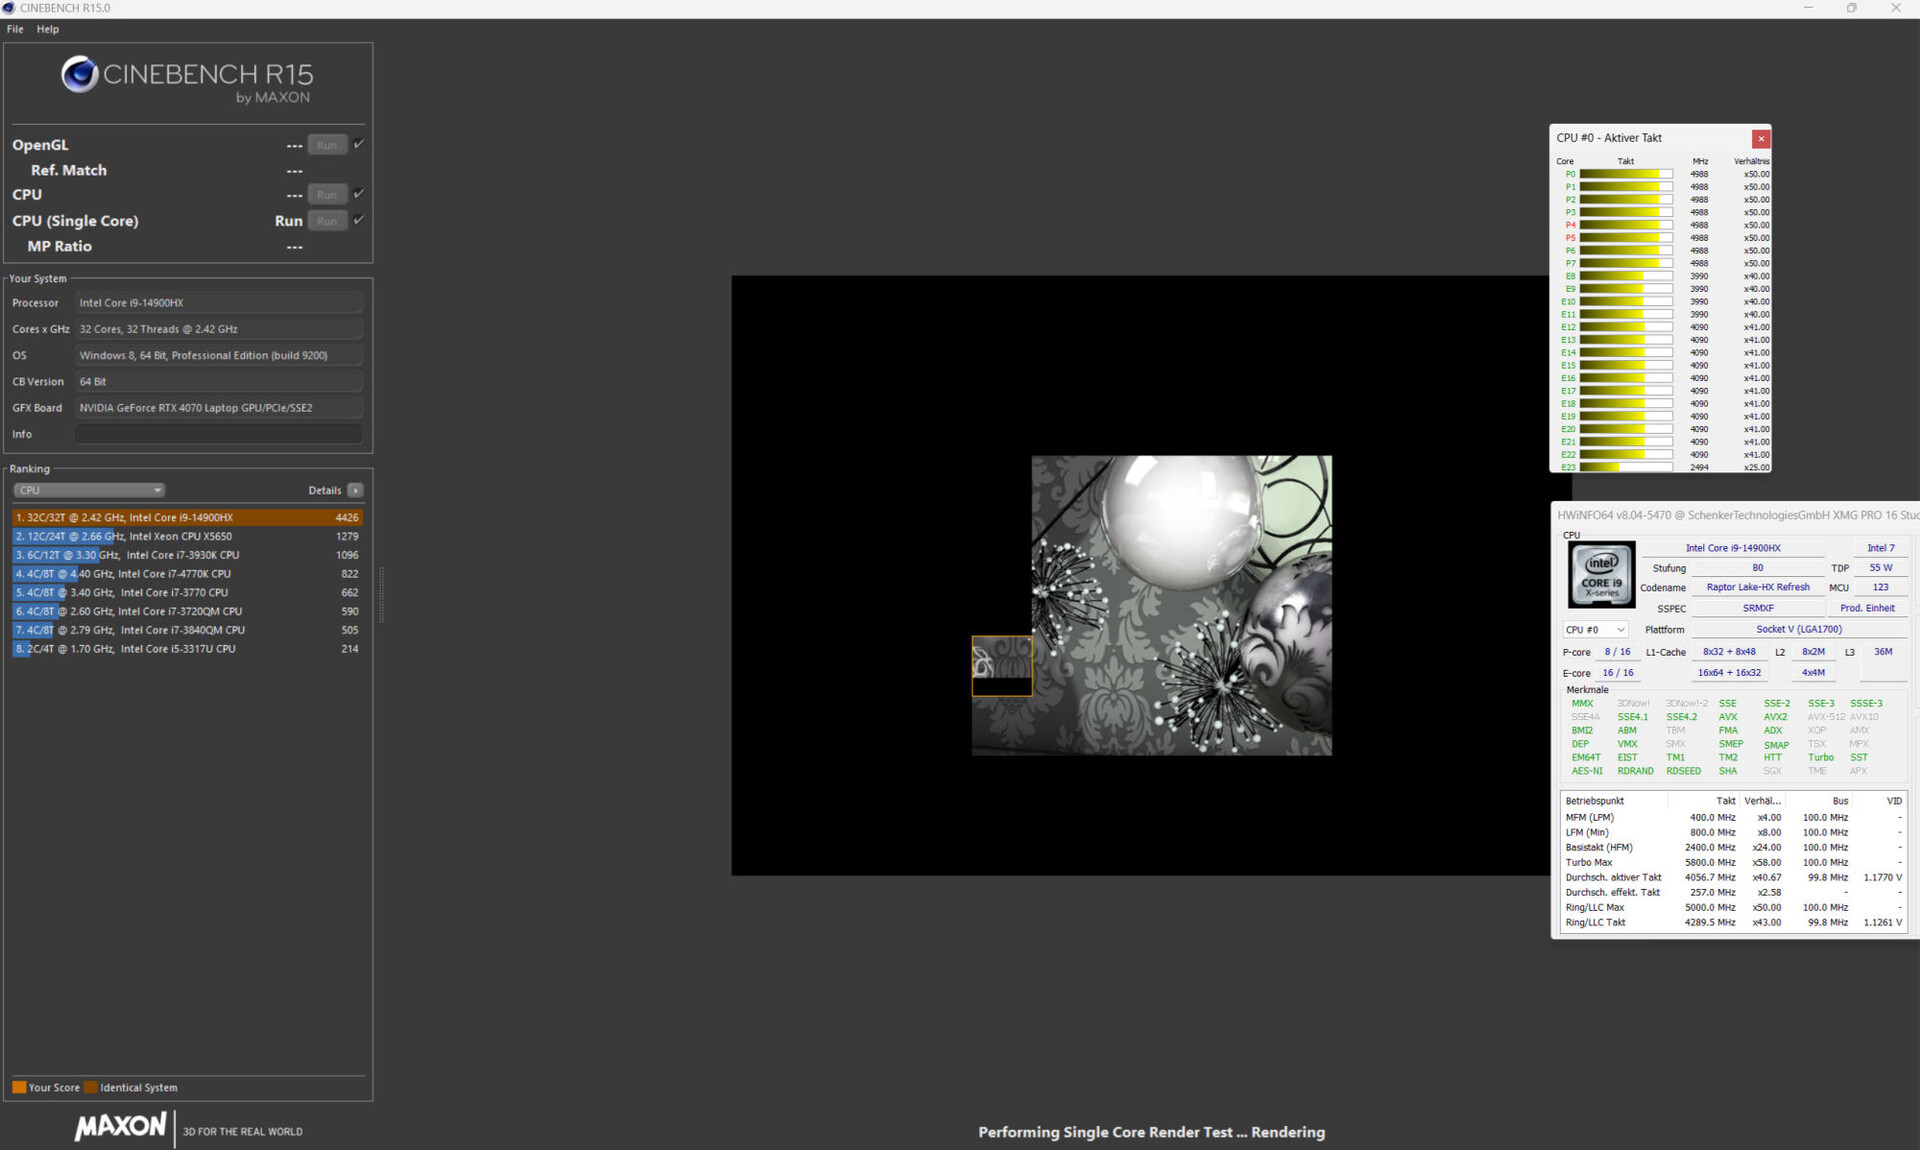
Processor
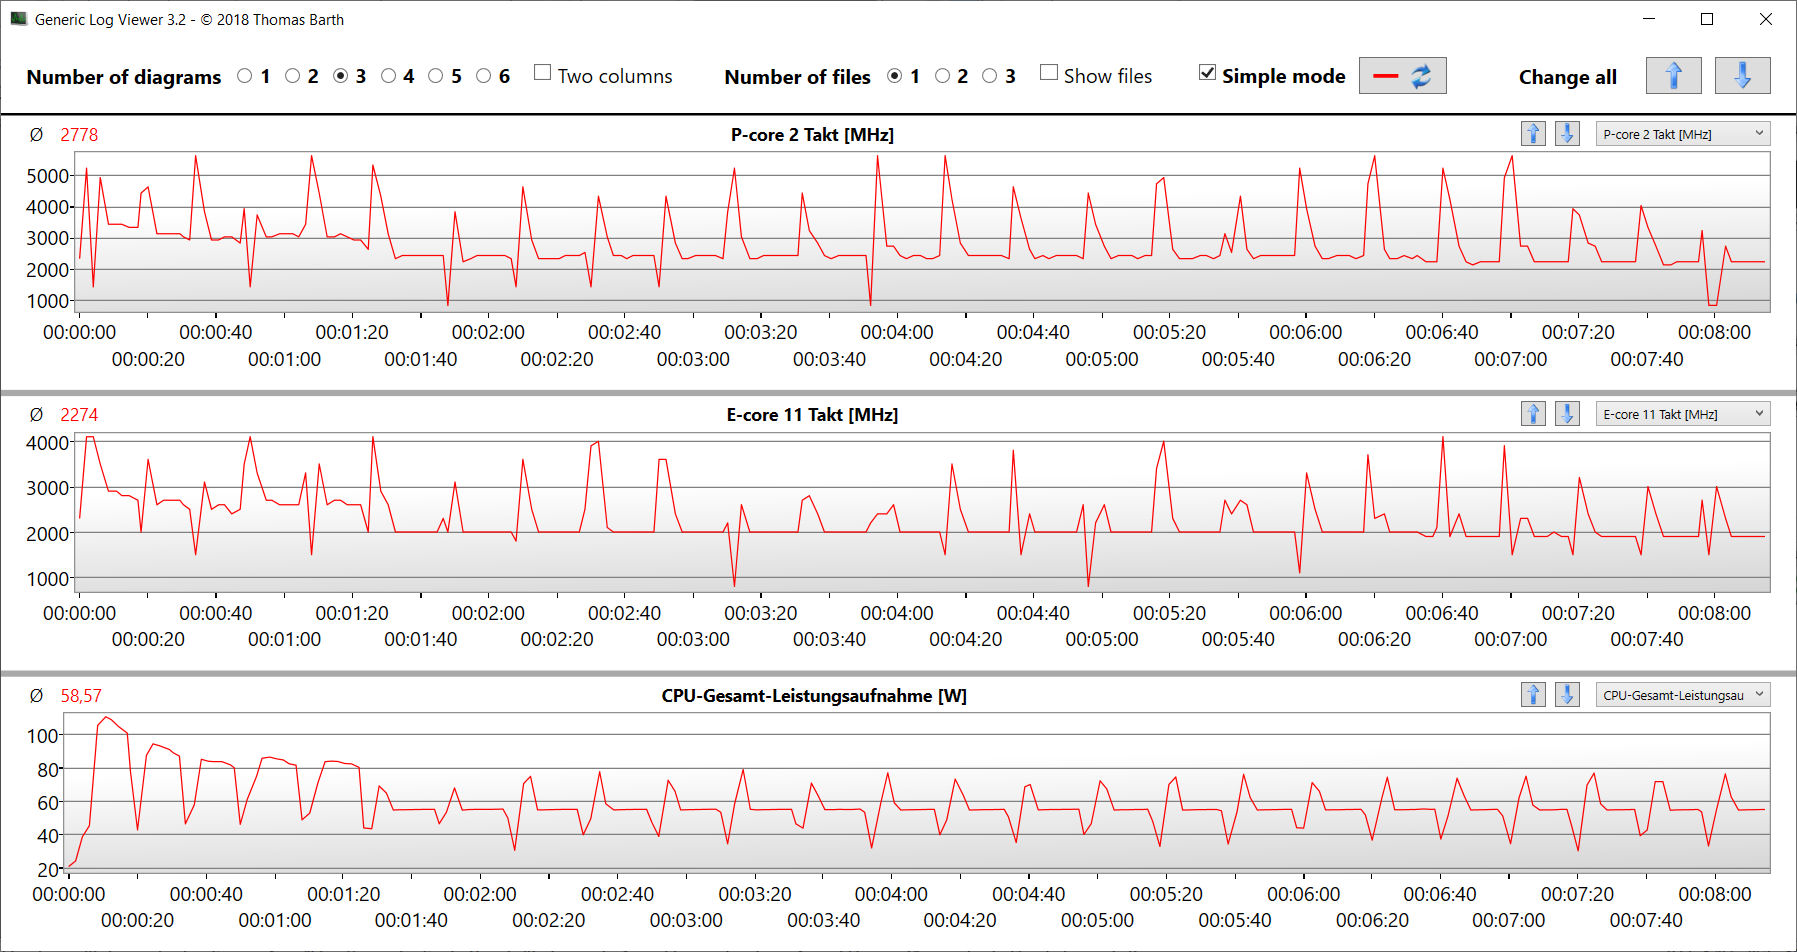
Core Core i9-14900HX (Raptor Lake) används för alla Pro 16-konfigurationsvarianter. Dess 24 kärnor (8P + 16E) kan bearbeta totalt 32 trådar. En överraskning: Även när prestandaläget är aktivt kan processorn inte arbeta med full effekt hela tiden. Kontinuerlig belastning med flera trådar (CB15 Loop) fick CPU-klockan att sjunka avsevärt från den första till den femte körningen. Efter det planade kurvan ut. Dess benchmarkresultat ligger under det tidigare CPU-genomsnittet.
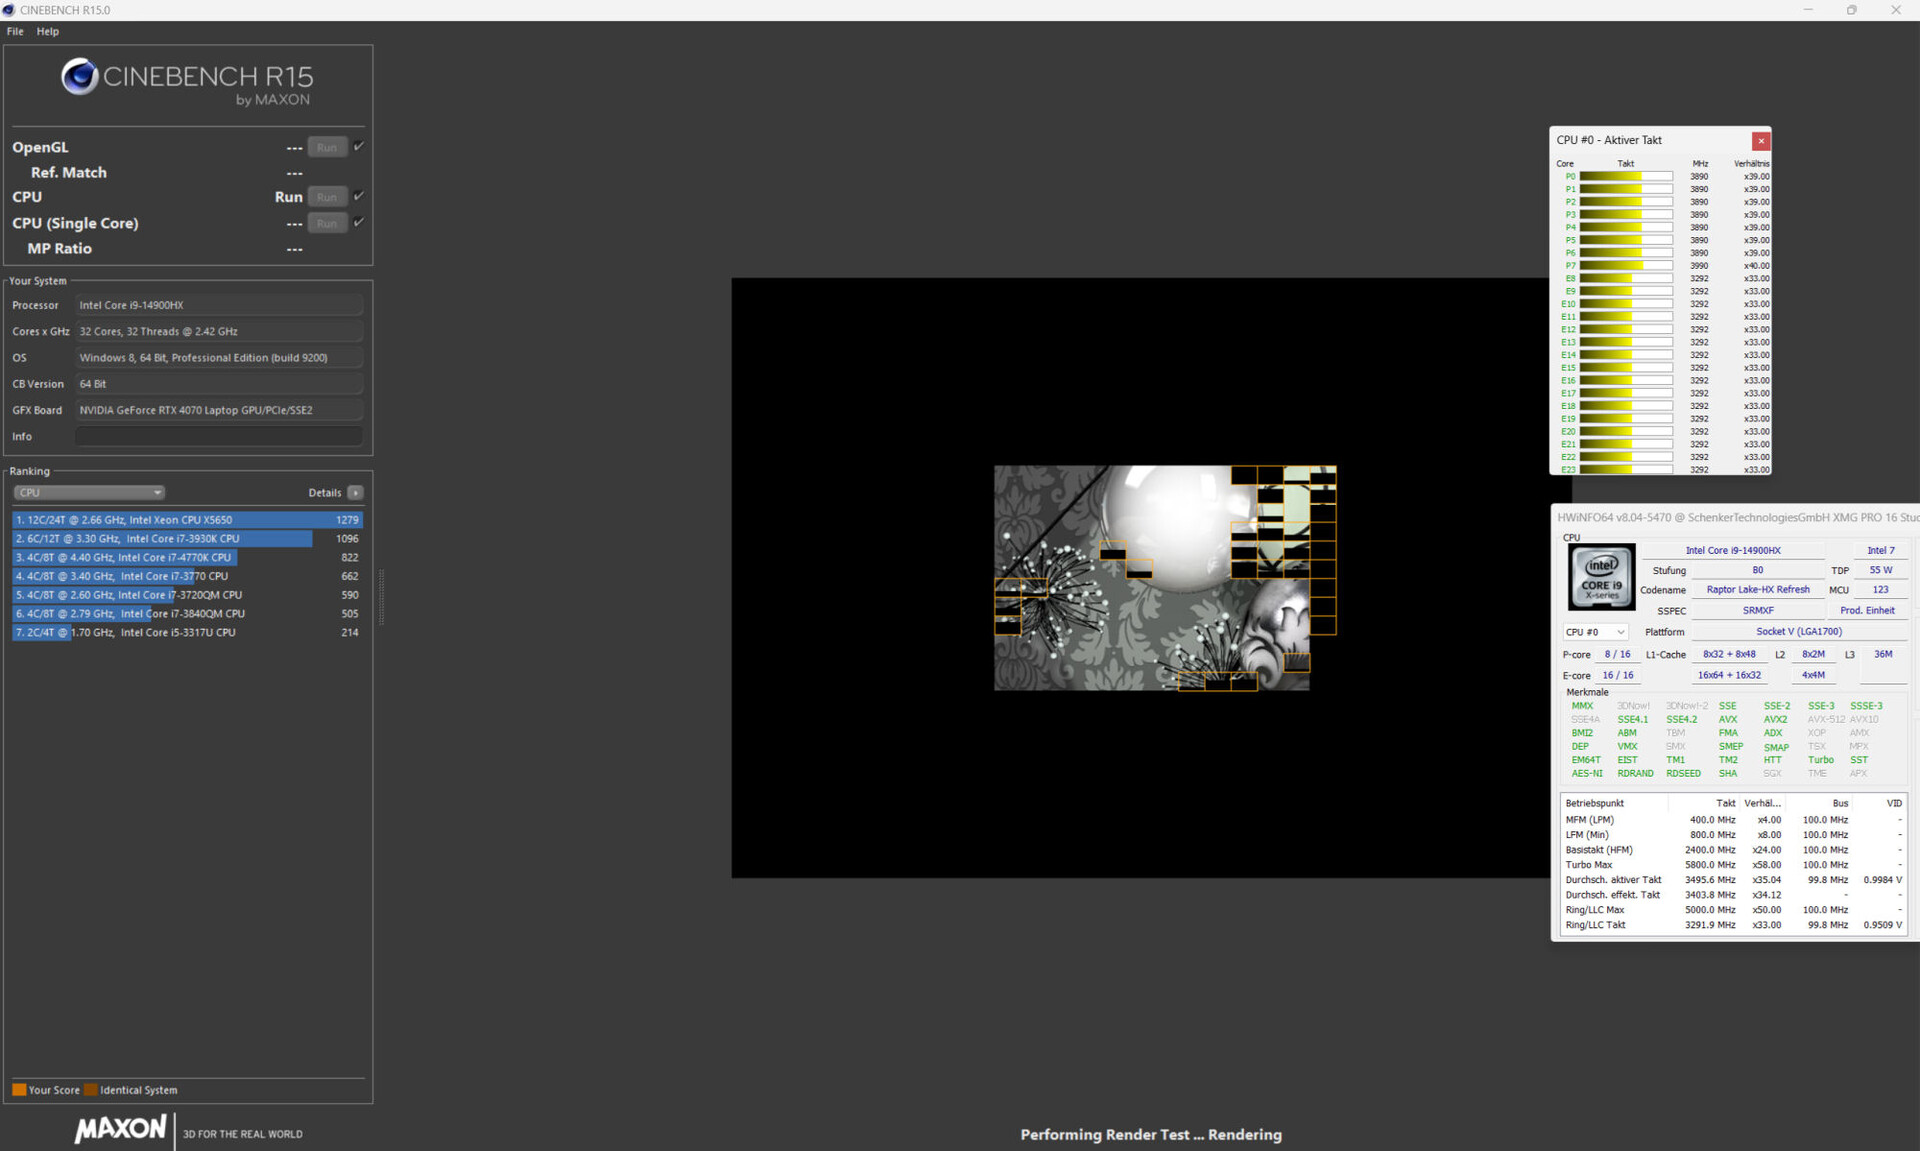
Cinebench R15 Multi continuous test
* ... mindre är bättre
AIDA64: FP32 Ray-Trace | FPU Julia | CPU SHA3 | CPU Queen | FPU SinJulia | FPU Mandel | CPU AES | CPU ZLib | FP64 Ray-Trace | CPU PhotoWorxx
| Performance Rating | |
| Lenovo Legion Pro 5 16IRX9 | |
| Genomsnitt Intel Core i9-14900HX | |
| Aorus 16X 2024 | |
| Lenovo Legion 7 16 IRX G9 | |
| SCHENKER XMG Pro 16 Studio (Mid 24) | |
| Acer Predator Helios Neo 16 (2024) | |
| Genomsnitt av klass Gaming | |
| SCHENKER XMG Pro 16 Studio (Mid 23) | |
Systemets prestanda
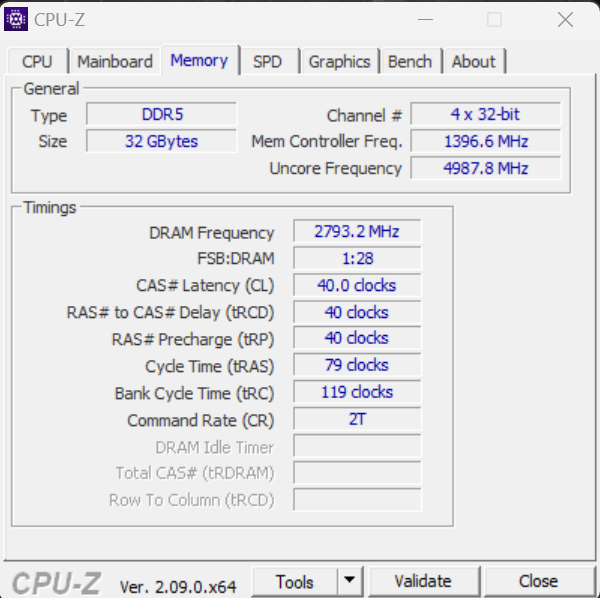
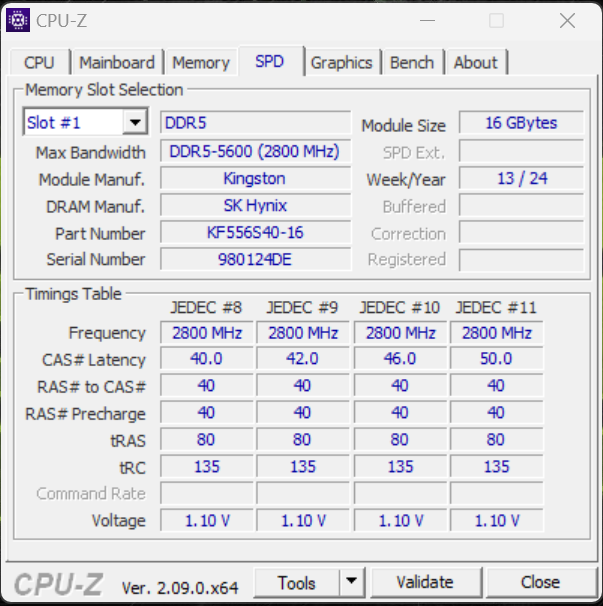
Det välfungerande systemet ger tillräckligt med prestanda för spel, rendering och streaming, men den installerade hårdvaran kan inte sätta några nya rekord. RAM-minnets överföringshastigheter ligger på en normal nivå för DDR5-5600 RAM.

CrossMark: Overall | Productivity | Creativity | Responsiveness
WebXPRT 3: Overall
WebXPRT 4: Overall
Mozilla Kraken 1.1: Total
| PCMark 10 / Score | |
| Lenovo Legion Pro 5 16IRX9 | |
| Aorus 16X 2024 | |
| Acer Predator Helios Neo 16 (2024) | |
| Genomsnitt Intel Core i9-14900HX, NVIDIA GeForce RTX 4070 Laptop GPU (7768 - 8550, n=8) | |
| SCHENKER XMG Pro 16 Studio (Mid 24) | |
| Lenovo Legion 7 16 IRX G9 | |
| SCHENKER XMG Pro 16 Studio (Mid 23) | |
| Genomsnitt av klass Gaming (5776 - 9852, n=134, senaste 2 åren) | |
* ... mindre är bättre
| PCMark 10 Score | 8166 poäng | |
Hjälp | ||
| AIDA64 / Memory Copy | |
| Lenovo Legion Pro 5 16IRX9 | |
| Lenovo Legion 7 16 IRX G9 | |
| Aorus 16X 2024 | |
| SCHENKER XMG Pro 16 Studio (Mid 24) | |
| Acer Predator Helios Neo 16 (2024) | |
| Genomsnitt Intel Core i9-14900HX (38028 - 83392, n=36) | |
| SCHENKER XMG Pro 16 Studio (Mid 23) | |
| Genomsnitt av klass Gaming (21750 - 97515, n=151, senaste 2 åren) | |
* ... mindre är bättre
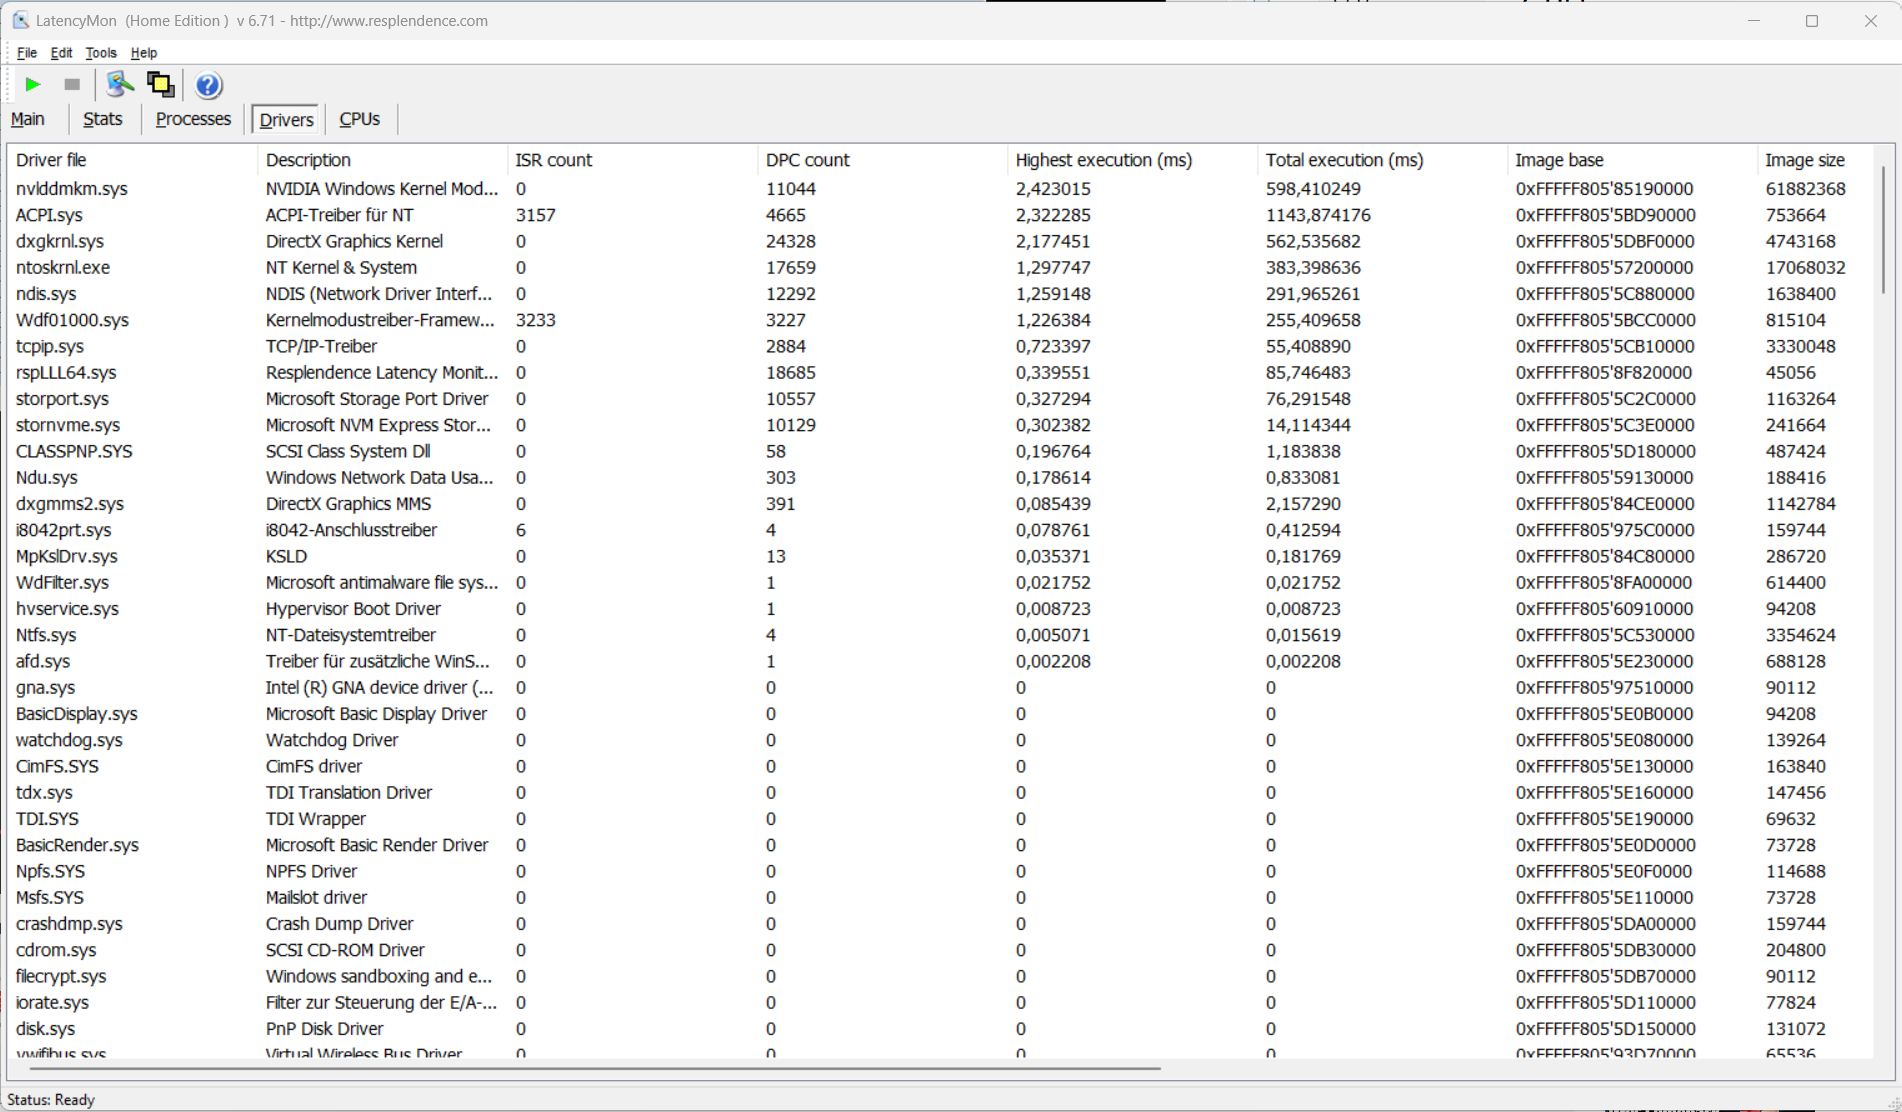
DPC-latenstider
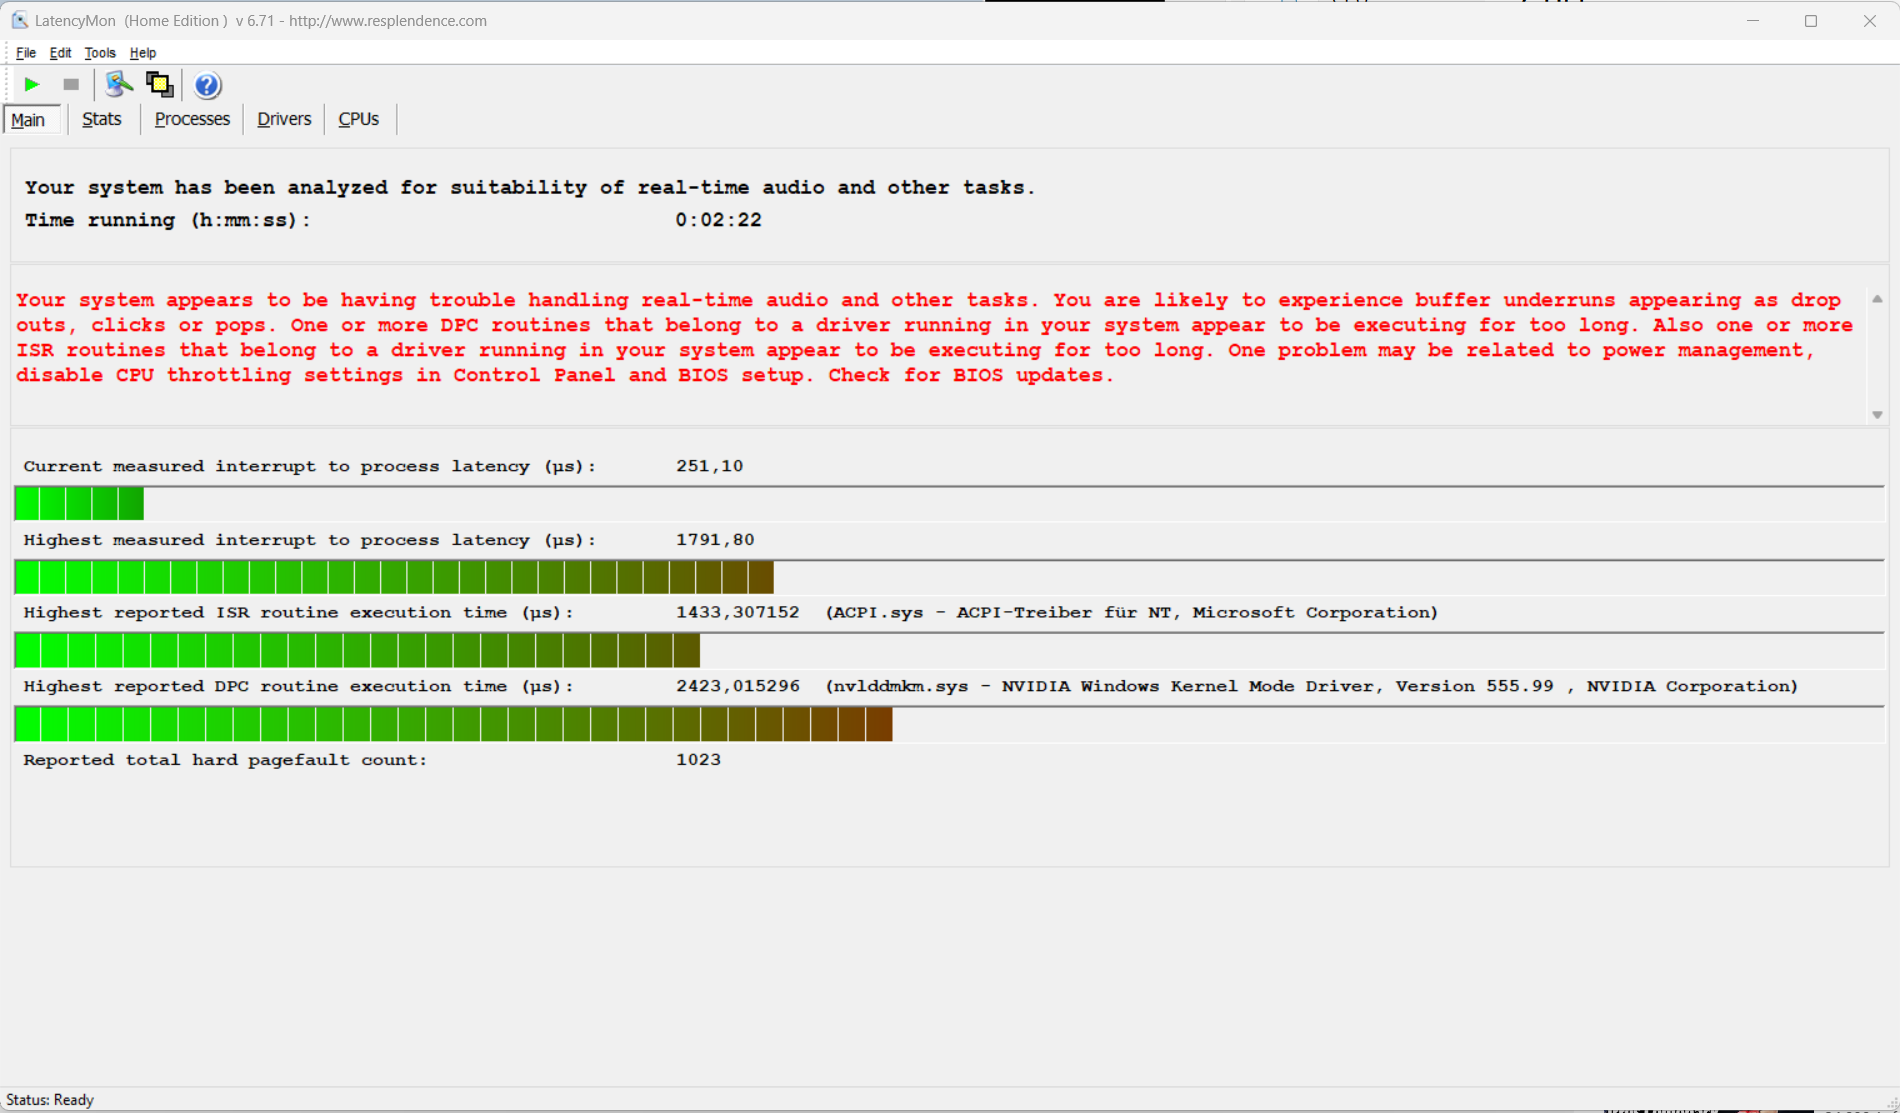
På grund av den bärbara datorns relativt höga latenser är video- och ljudredigering i realtid inte avsedd. Framtida programuppdateringar kan dock leda till förändringar i detta avseende.
| DPC Latencies / LatencyMon - interrupt to process latency (max), Web, Youtube, Prime95 | |
| SCHENKER XMG Pro 16 Studio (Mid 23) | |
| SCHENKER XMG Pro 16 Studio (Mid 24) | |
| Lenovo Legion 7 16 IRX G9 | |
| Acer Predator Helios Neo 16 (2024) | |
| Aorus 16X 2024 | |
| Lenovo Legion Pro 5 16IRX9 | |
* ... mindre är bättre
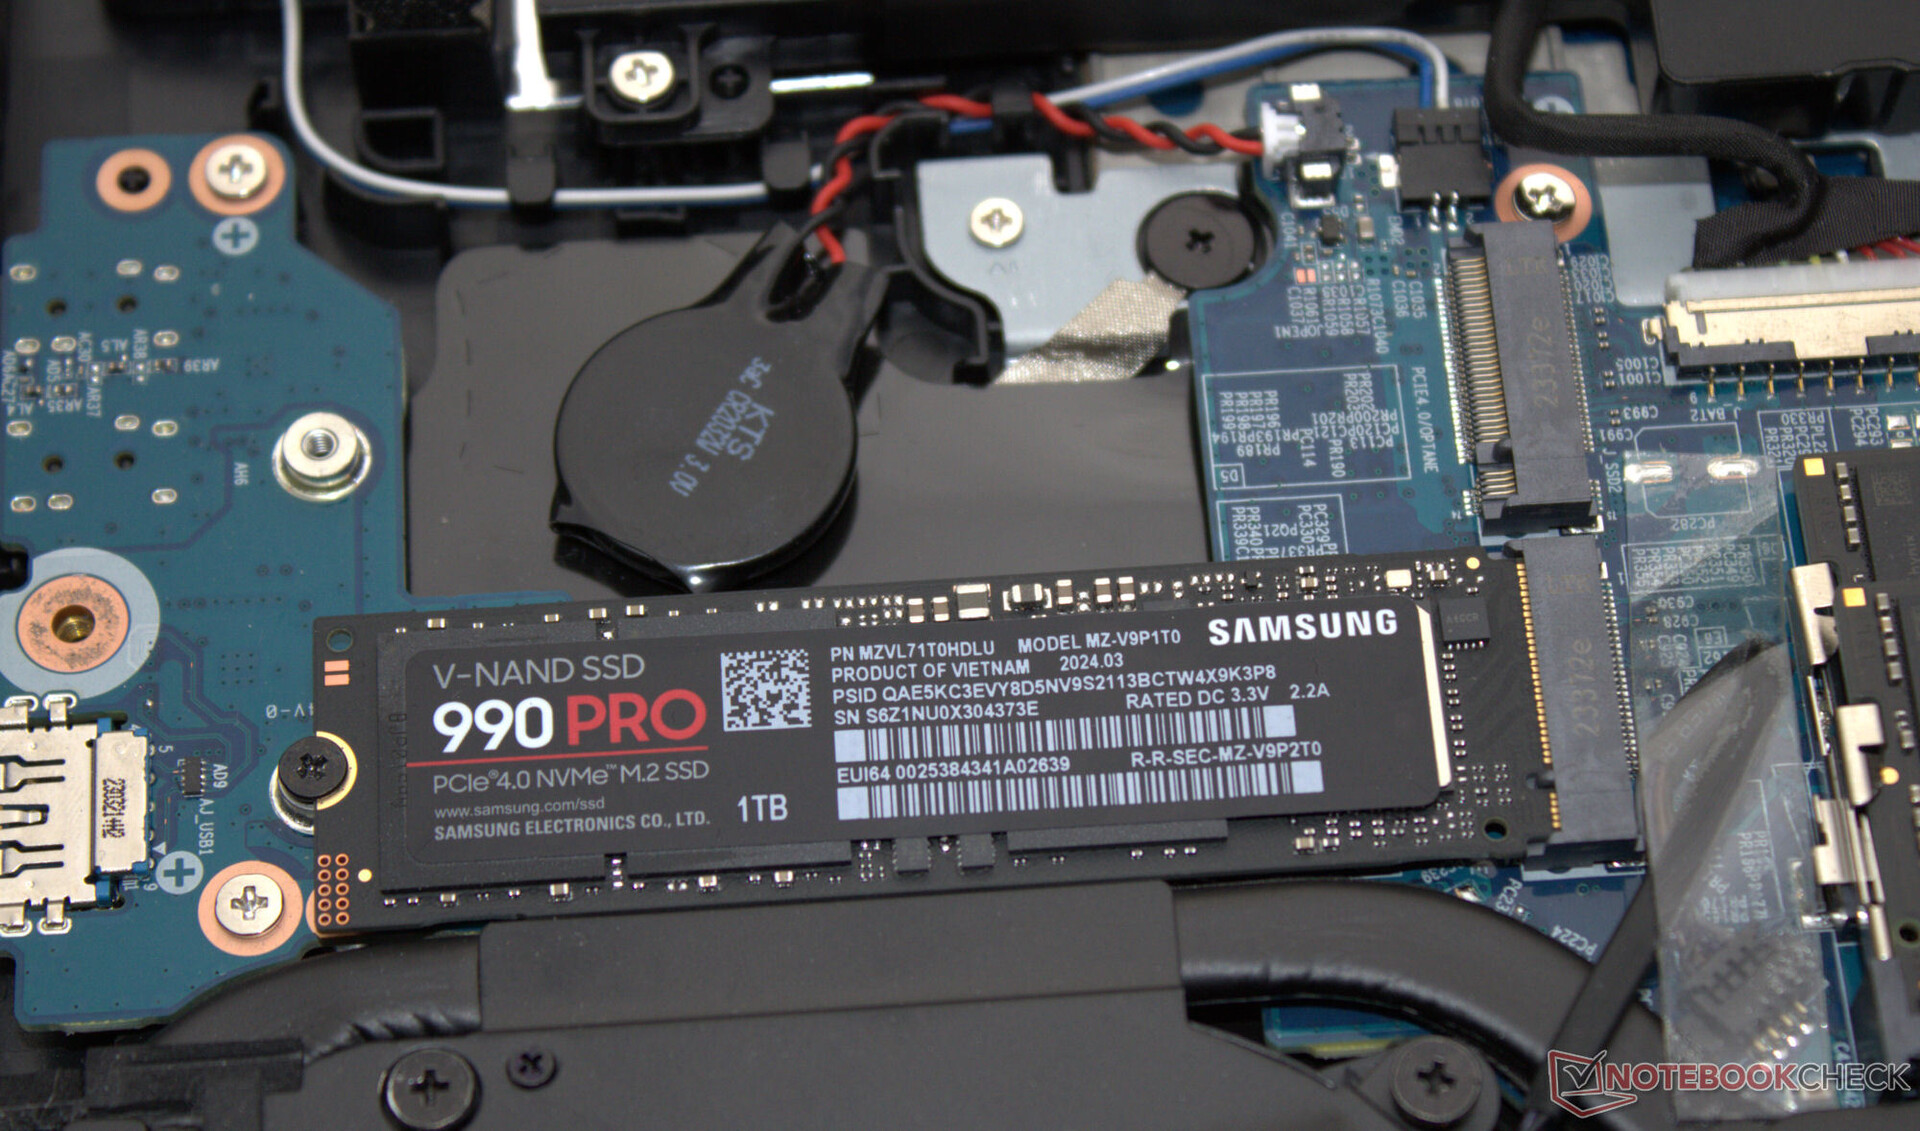
Lagringsenheter
Schenkers webbutik har en mängd olika SSD-enheter att välja mellan - vår testenhet har en blixtsnabb modell (1 TB, PCIe 4, M.2-2280) från Samsung. Positivt: Termiskt inducerad strypning inträffade inte. Den bärbara datorn kan rymma upp till två PCIe 4 SSD-enheter (M.2-2280). RAID-0/1 stöds.

* ... mindre är bättre
Reading continuous performance: DiskSpd Read Loop, Queue Depth 8
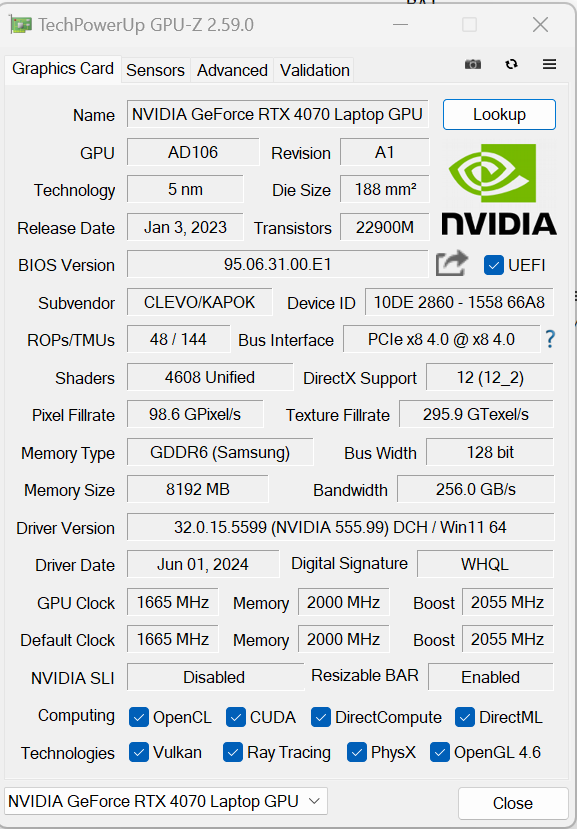
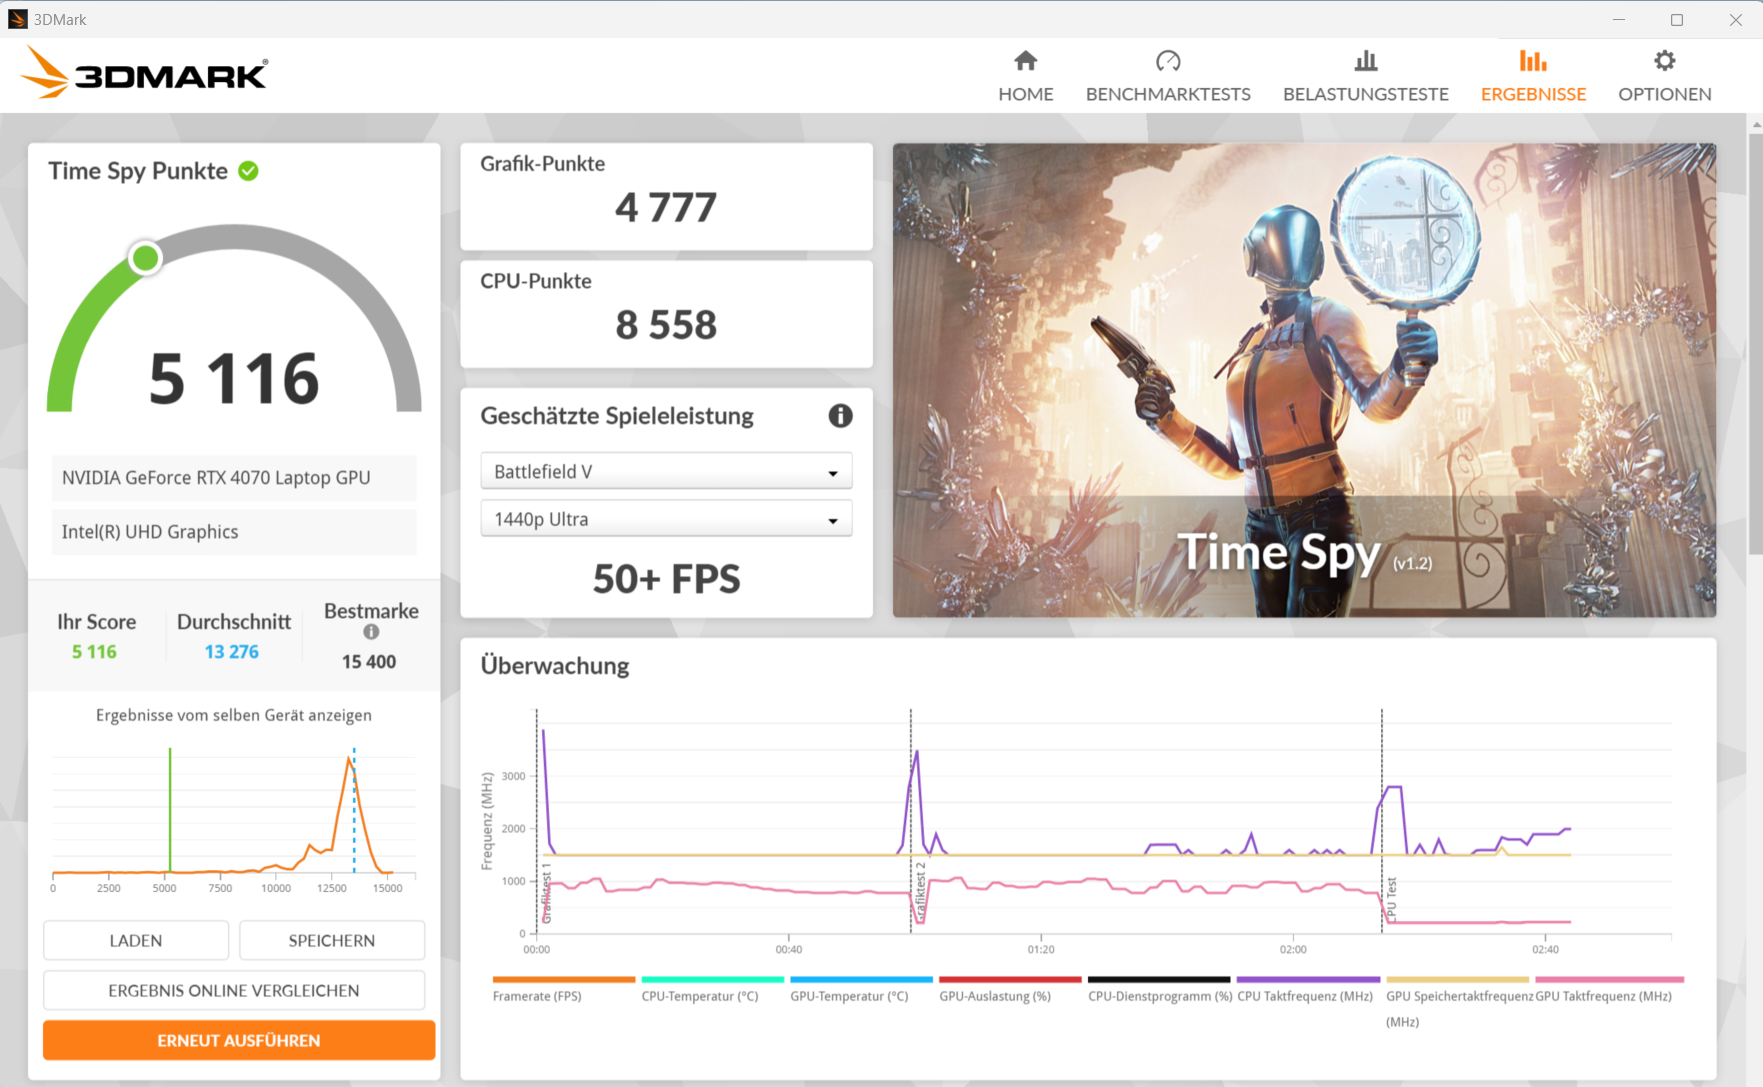
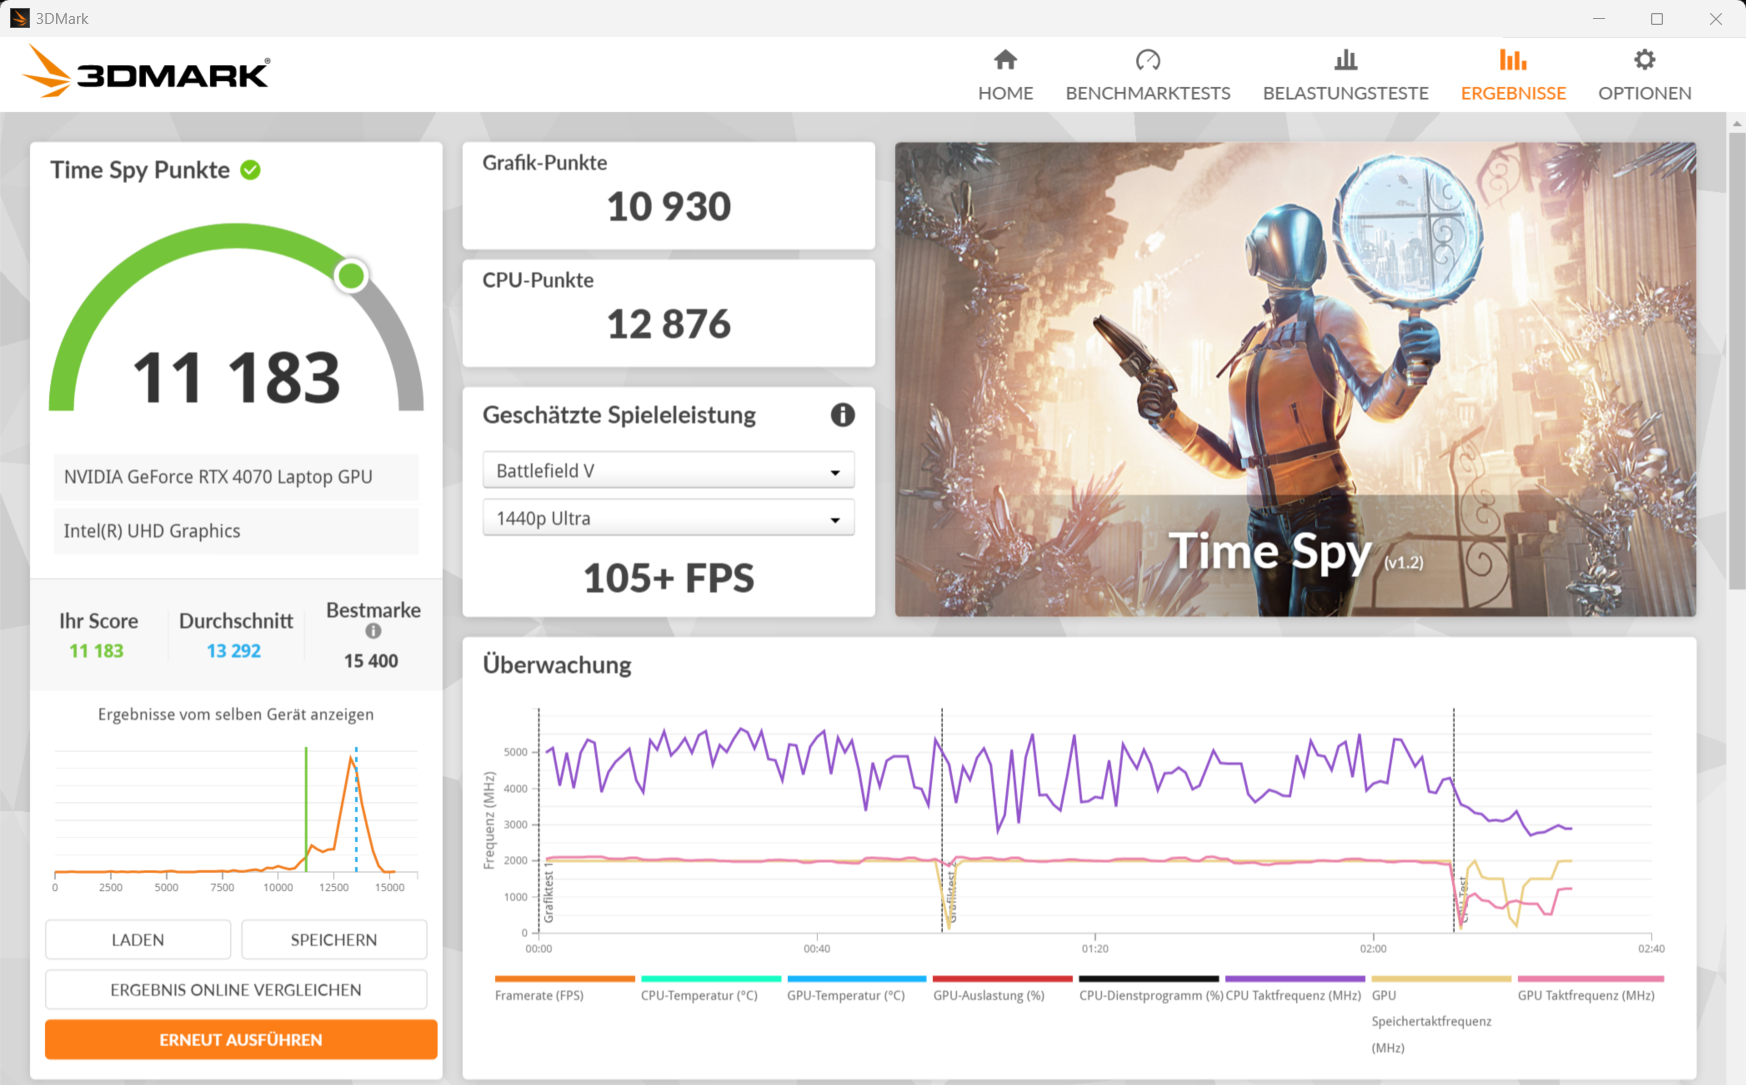
Grafikkort
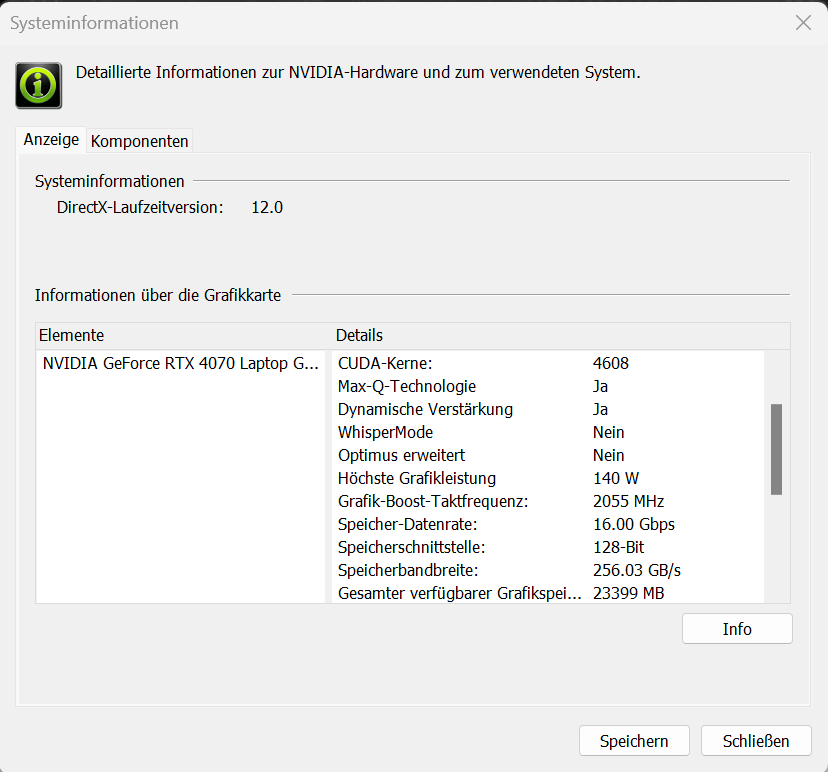
QHD-spel med höga till maximala inställningar är inget problem för den installerade GeForce RTX 4070 (TGP: 140 watt): Den levererar bildfrekvenser (och benchmarkresultat) som ligger något över GPU-genomsnittet. Lite snävt för dagens krav: GPU:n har bara 8 GB VRAM (GDDR6) till sitt förfogande. Växling mellan dGPU och Optimus kräver en omstart.

| 3DMark 11 Performance | 34173 poäng | |
| 3DMark Fire Strike Score | 23584 poäng | |
| 3DMark Time Spy Score | 12286 poäng | |
| 3DMark Steel Nomad Score | 2598 poäng | |
Hjälp | ||
* ... mindre är bättre
Cyberpunk 2077 ultra FPS diagram
| låg | med. | hög | ultra | QHD DLSS | QHD | |
|---|---|---|---|---|---|---|
| GTA V (2015) | 186.7 | 184.9 | 180.9 | 126 | 95.9 | |
| Dota 2 Reborn (2015) | 231 | 196.2 | 181.6 | 160.8 | ||
| Final Fantasy XV Benchmark (2018) | 214 | 163.6 | 119.7 | 86.8 | ||
| X-Plane 11.11 (2018) | 178 | 147.3 | 119.5 | |||
| Strange Brigade (2018) | 457 | 297 | 236 | 206 | 135.9 | |
| Baldur's Gate 3 (2023) | 171.8 | 132 | 115.3 | 111.8 | 77.2 | |
| Cyberpunk 2077 2.2 Phantom Liberty (2023) | 126.3 | 112.1 | 95.5 | 82.5 | 48.6 | |
| Dragon's Dogma 2 (2024) | 81 | 70.4 | 58.5 | |||
| Ghost of Tsushima (2024) | 114.9 | 102.8 | 93 | 73.7 | 74.2 | 56.1 |
| Senua's Saga Hellblade 2 (2024) | 78.3 | 64.9 | 51.2 | 47.8 | 33.3 | |
| F1 24 (2024) | 239 | 238 | 203 | 70.4 | 45.1 | |
| The First Descendant (2024) | 171 | 110.9 | 91.3 | 80 | 51.2 |
Utsläpp & effekt - XMG Pro med hög effektförbrukning
Bullerutsläpp
Cyberpunk 2077 ökar den bärbara datorns ljudutsläpp till upp till 53 dB(A) (prestandaläge ), medan underhållningsprofilen ger något mer måttliga värden. Det tysta läget är inte lämpligt för spel, eftersom dGPU är avstängd. Enhetens ljudnivå är lägre vid tomgångskörning och under daglig användning (kontor, internet): Fläktarna varvar inte upp överdrivet mycket och ibland står de stilla. Ibland hörs ett elektroniskt knastrande från den bärbara datorns insida.
Ljudnivå
| Låg belastning |
| 28 / 31 / 35 dB(A) |
| Hög belastning |
| 52 / 52 dB(A) |
 | ||
30 dB tyst 40 dB(A) hörbar 50 dB(A) högt ljud |
||
min: | ||
| SCHENKER XMG Pro 16 Studio (Mid 24) NVIDIA GeForce RTX 4070 Laptop GPU, i9-14900HX, Samsung 990 Pro 1 TB | Acer Predator Helios Neo 16 (2024) NVIDIA GeForce RTX 4070 Laptop GPU, i7-14700HX, Samsung PM9A1a MZVL21T0HDLU | Lenovo Legion Pro 5 16IRX9 NVIDIA GeForce RTX 4070 Laptop GPU, i9-14900HX, Samsung PM9A1 MZVL21T0HCLR | Aorus 16X 2024 NVIDIA GeForce RTX 4070 Laptop GPU, i9-14900HX, Gigabyte AG450E1024-SI | SCHENKER XMG Pro 16 Studio (Mid 23) NVIDIA GeForce RTX 4070 Laptop GPU, i9-13900H, Samsung 990 Pro 1 TB | Lenovo Legion 7 16 IRX G9 NVIDIA GeForce RTX 4070 Laptop GPU, i9-14900HX, SK Hynix HFS001TEJ9X115N | |
|---|---|---|---|---|---|---|
| Noise | 3% | 10% | -3% | 7% | 16% | |
| av / miljö * | 25 | 25.2 -1% | 23.9 4% | 26 -4% | 25 -0% | 24.5 2% |
| Idle Minimum * | 28 | 27.8 1% | 24.3 13% | 26 7% | 26 7% | 24.5 12% |
| Idle Average * | 31 | 32 -3% | 24.3 22% | 32 -3% | 29 6% | 24.5 21% |
| Idle Maximum * | 35 | 29.6 15% | 28.9 17% | 38 -9% | 34 3% | 24.5 30% |
| Load Average * | 52 | 45.2 13% | 45.8 12% | 54 -4% | 43 17% | 34.8 33% |
| Cyberpunk 2077 ultra * | 53 | |||||
| Load Maximum * | 52 | 55.8 -7% | 56.6 -9% | 55 -6% | 48 8% | 54.1 -4% |
| Witcher 3 ultra * | 51 | 50 | 48 | 54.1 |
* ... mindre är bättre
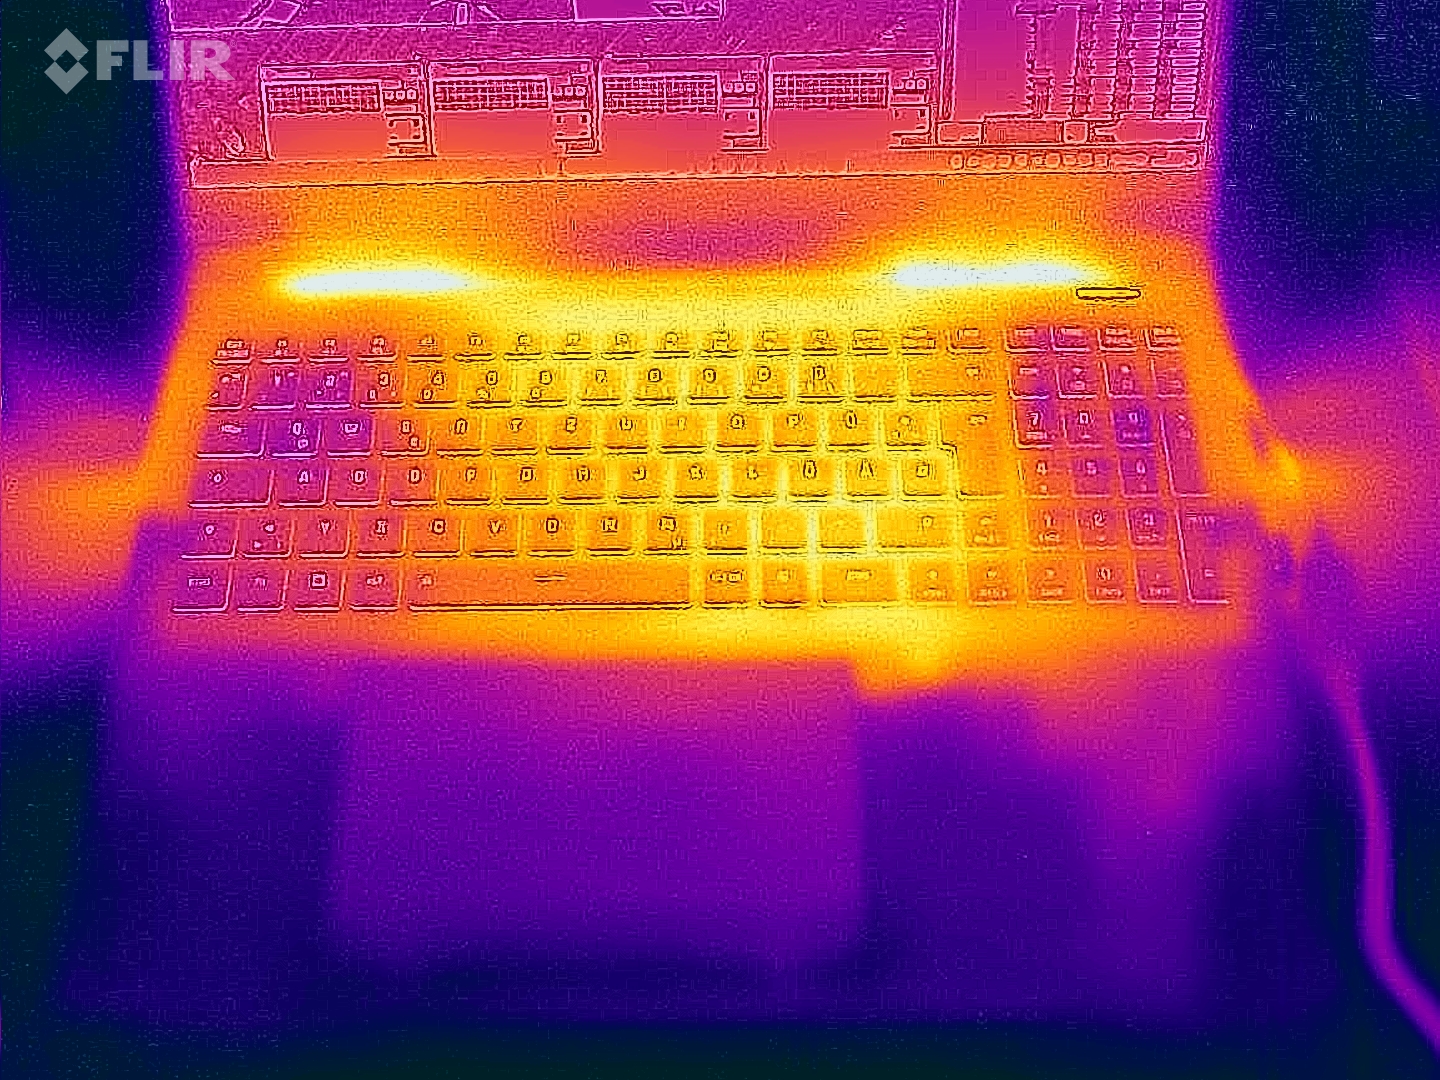
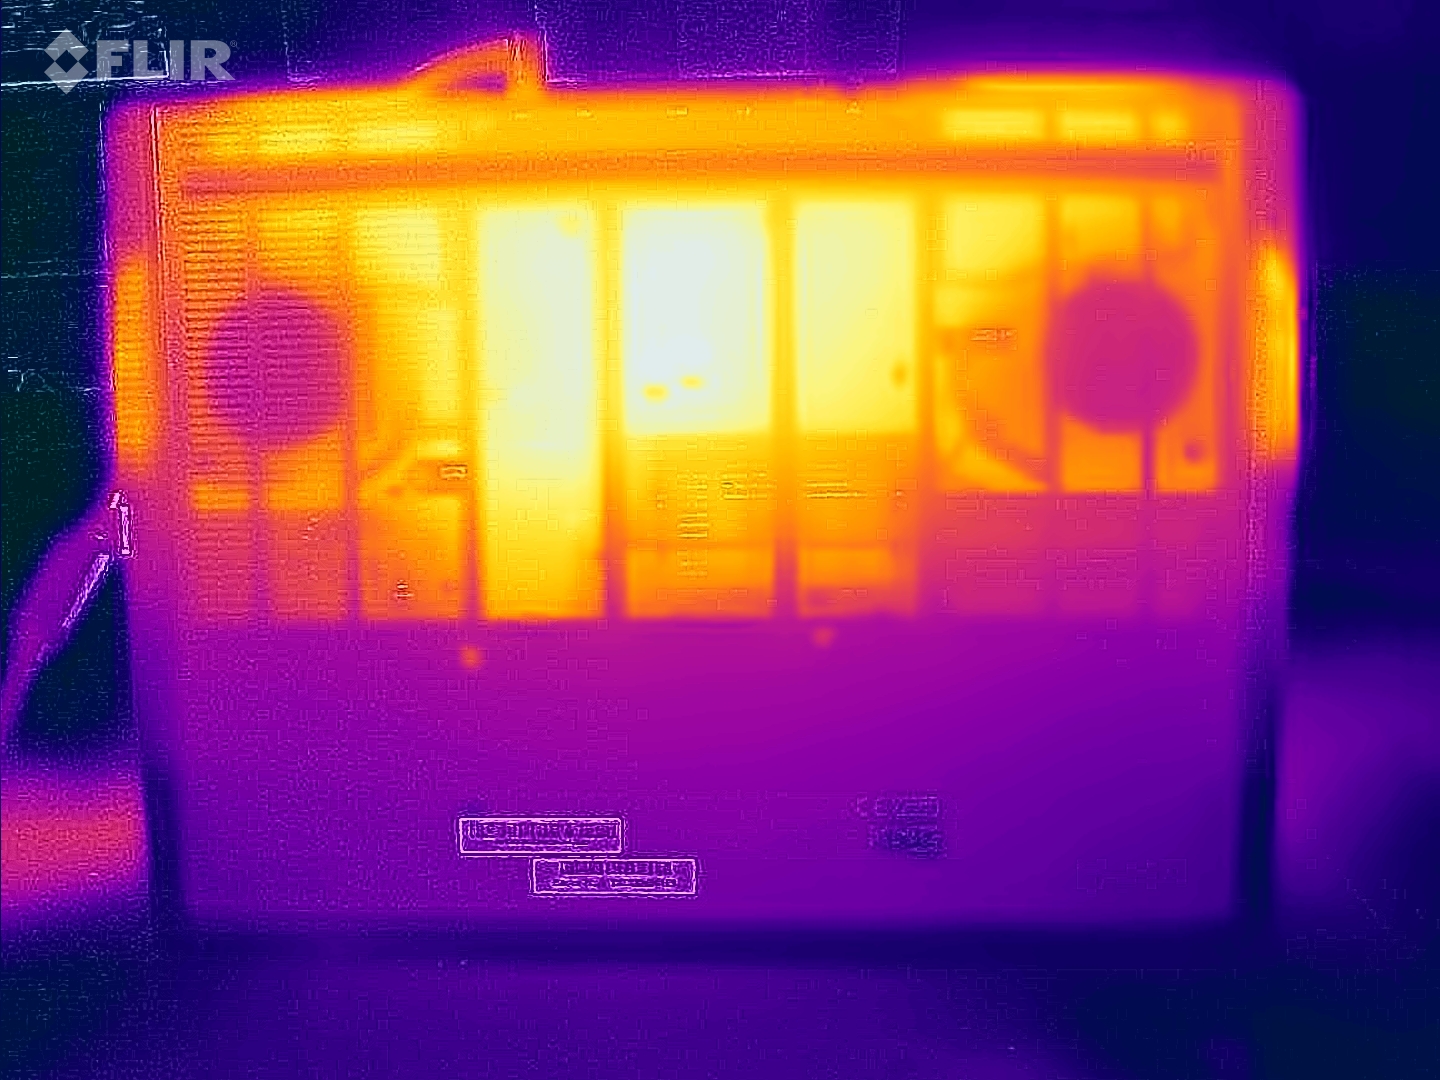
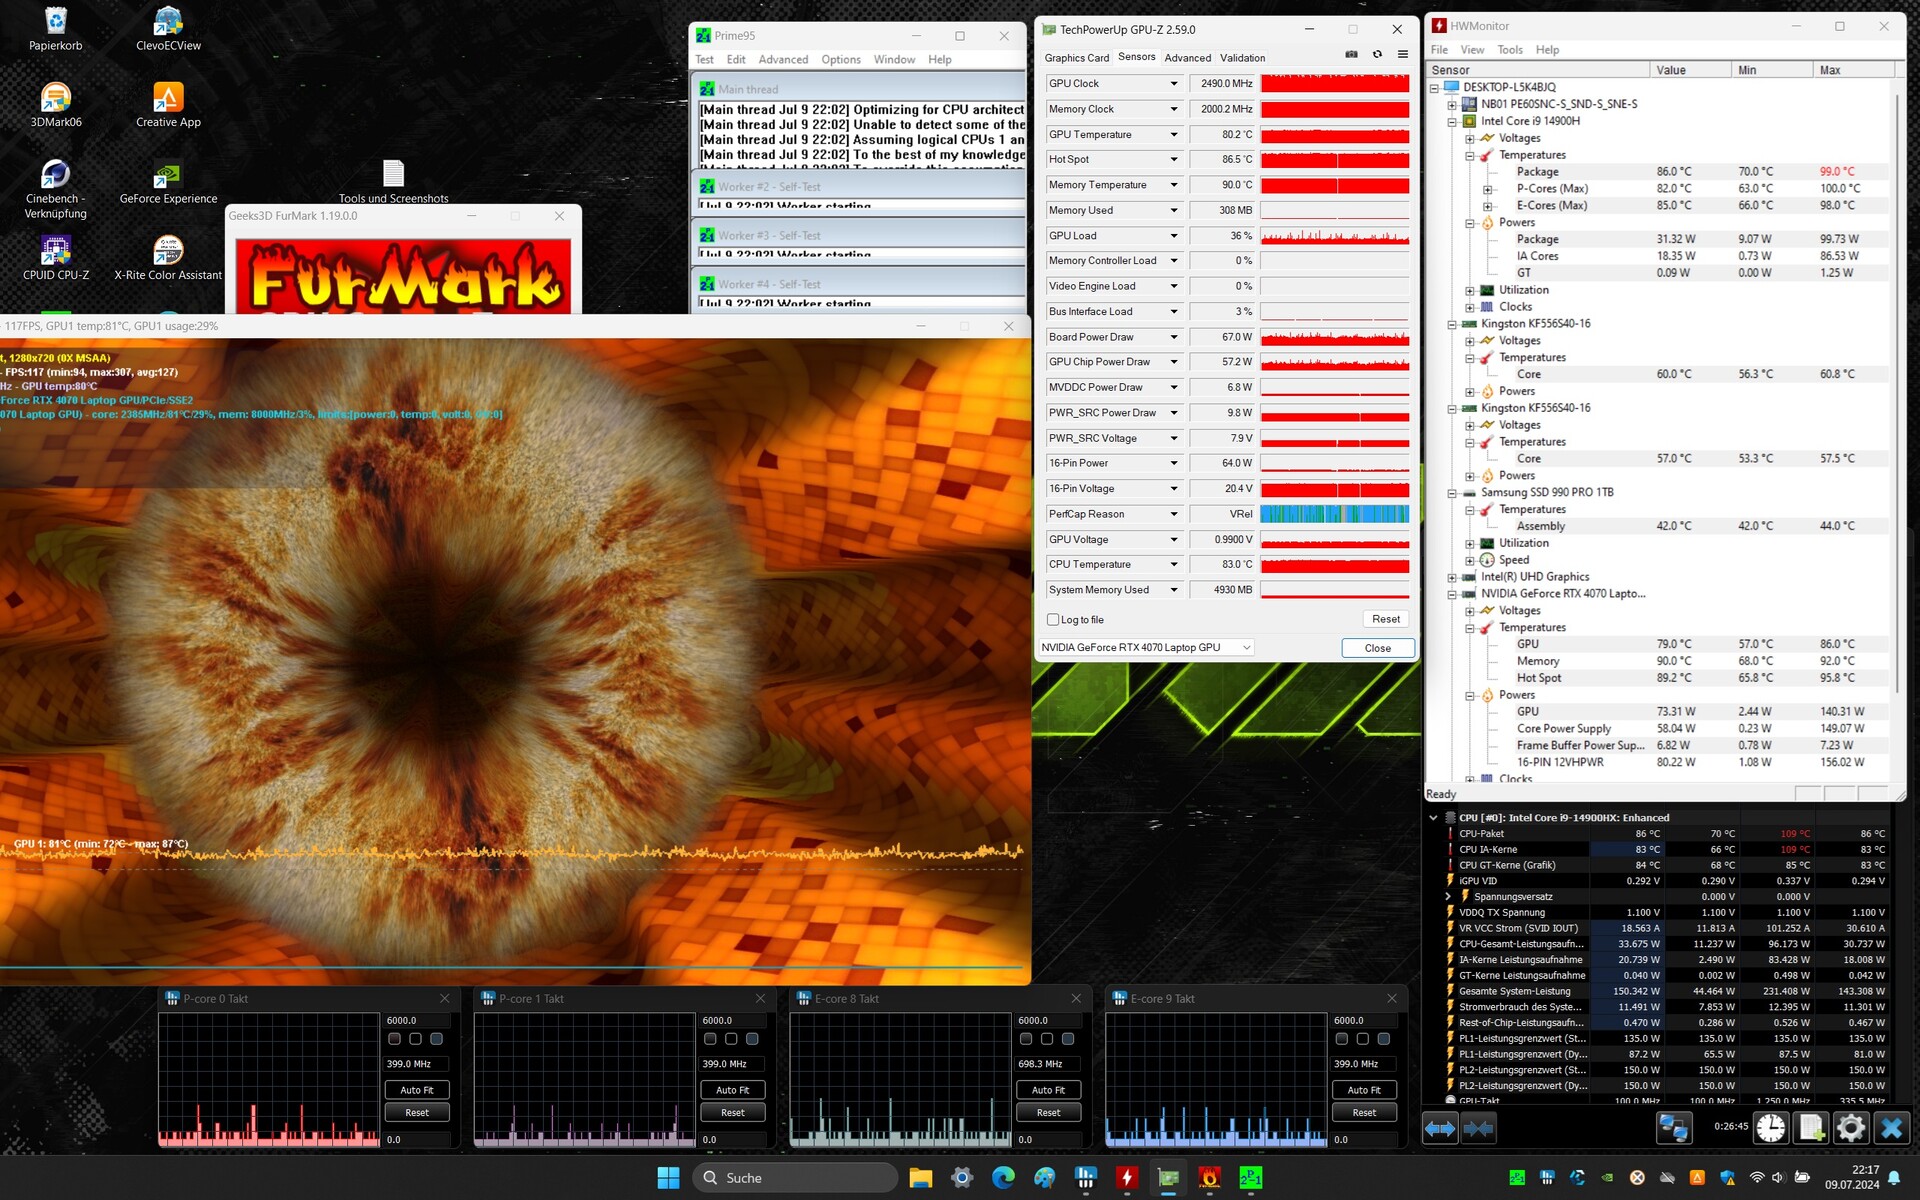
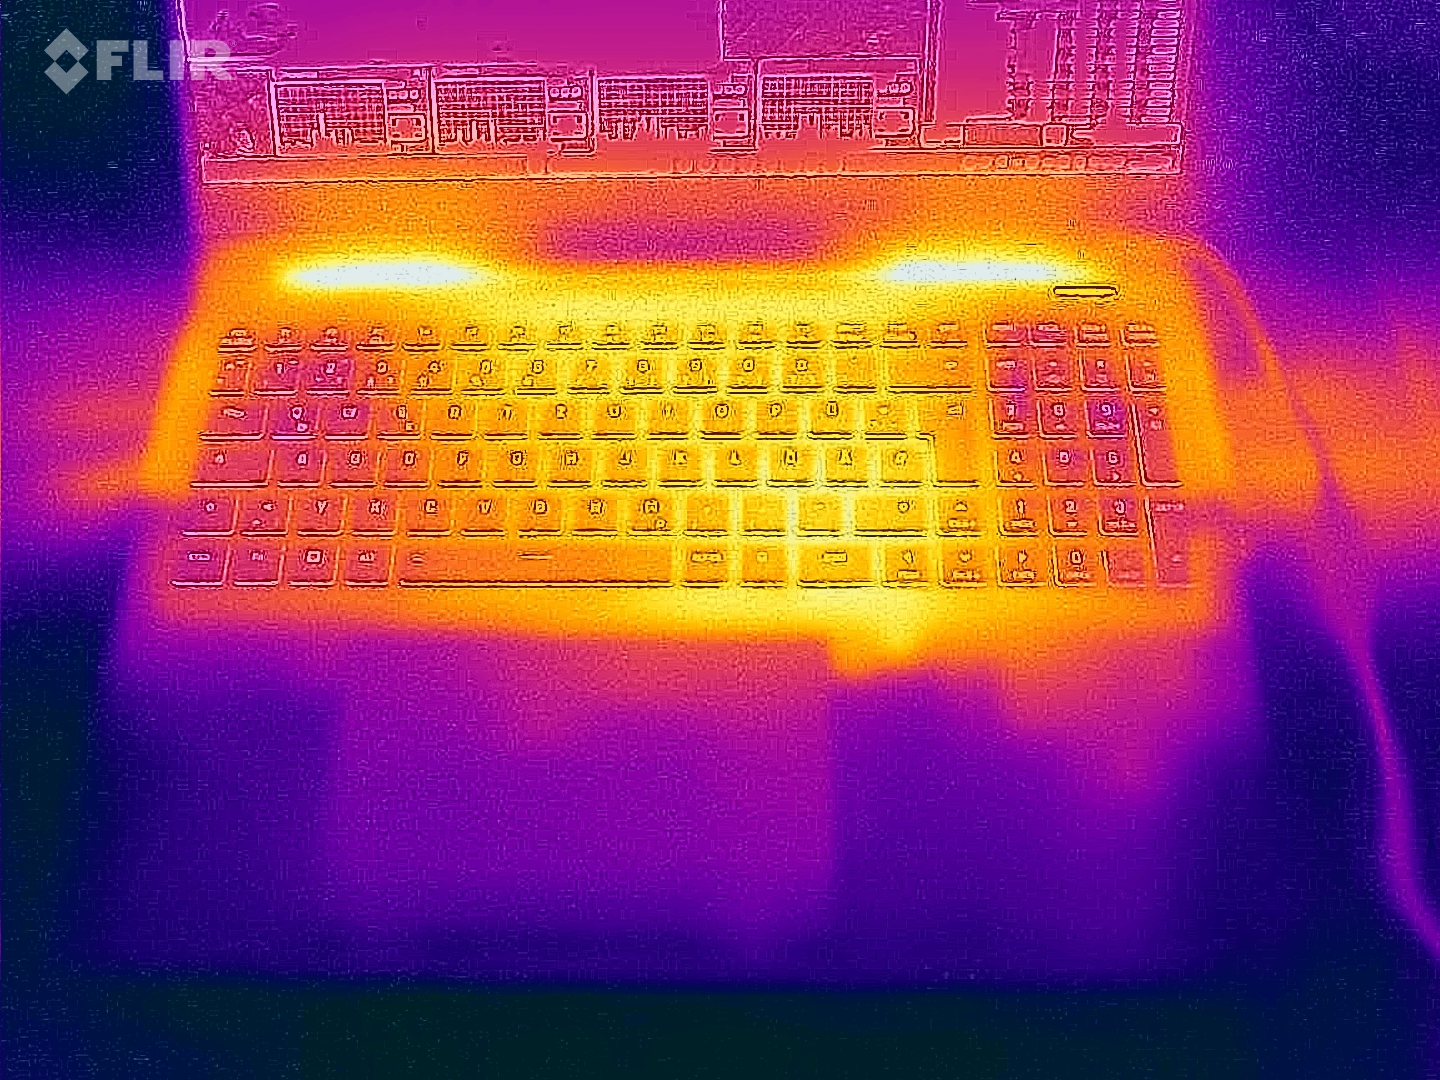
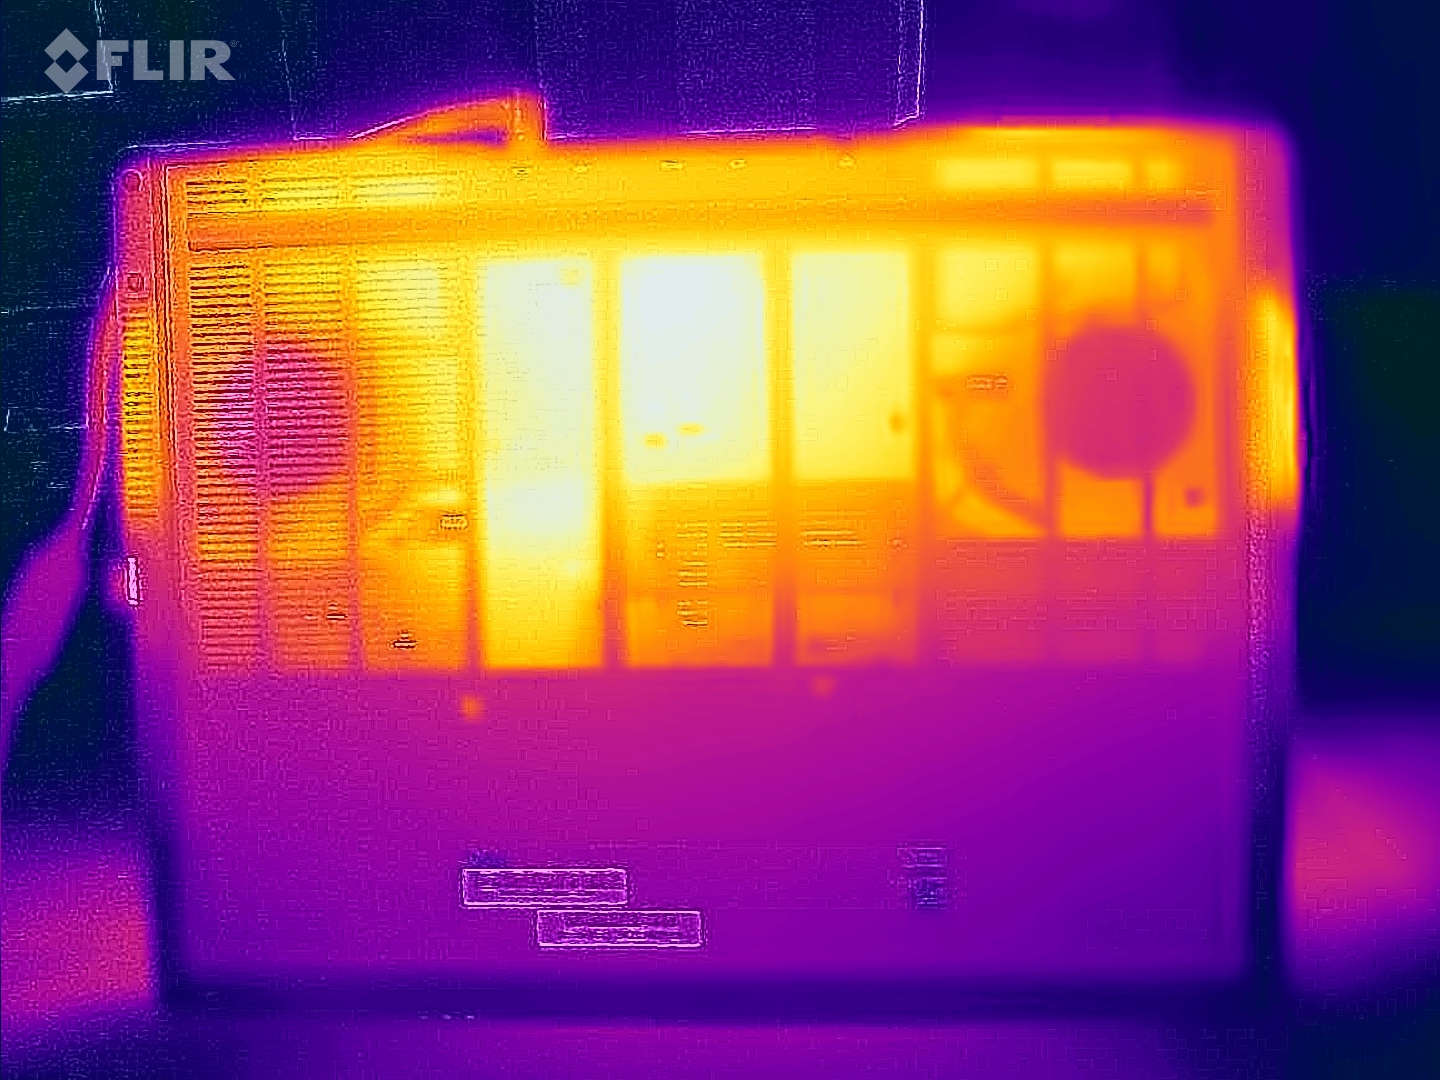
Temperatur
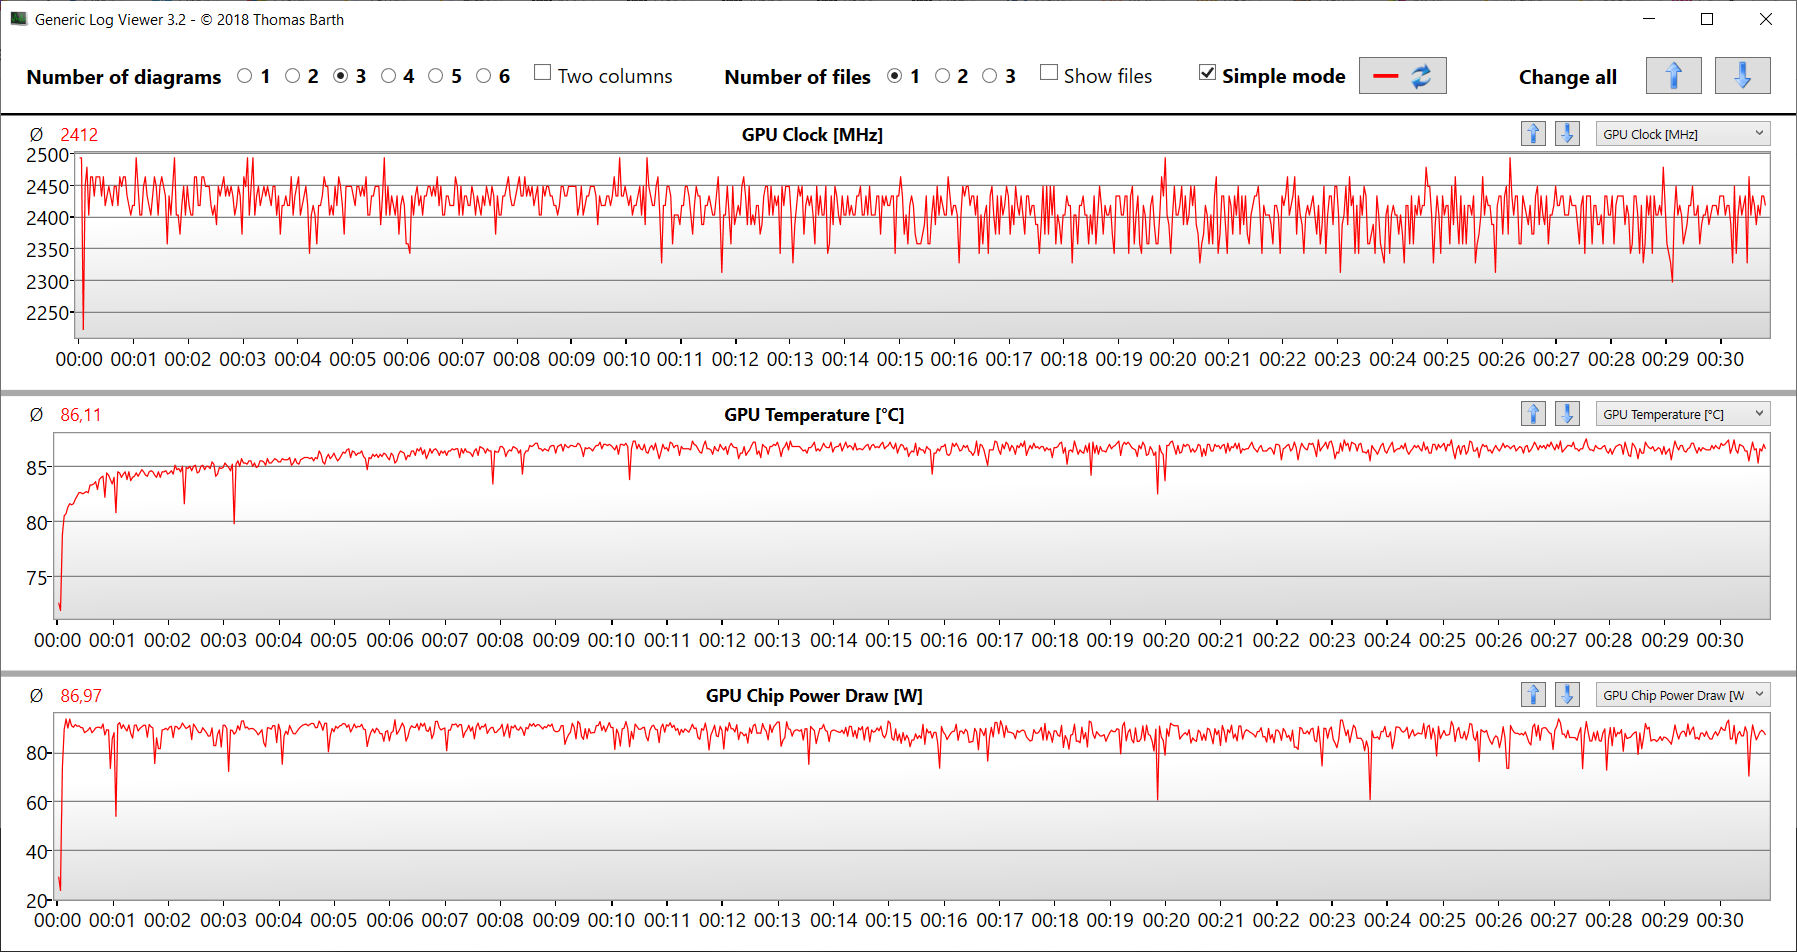
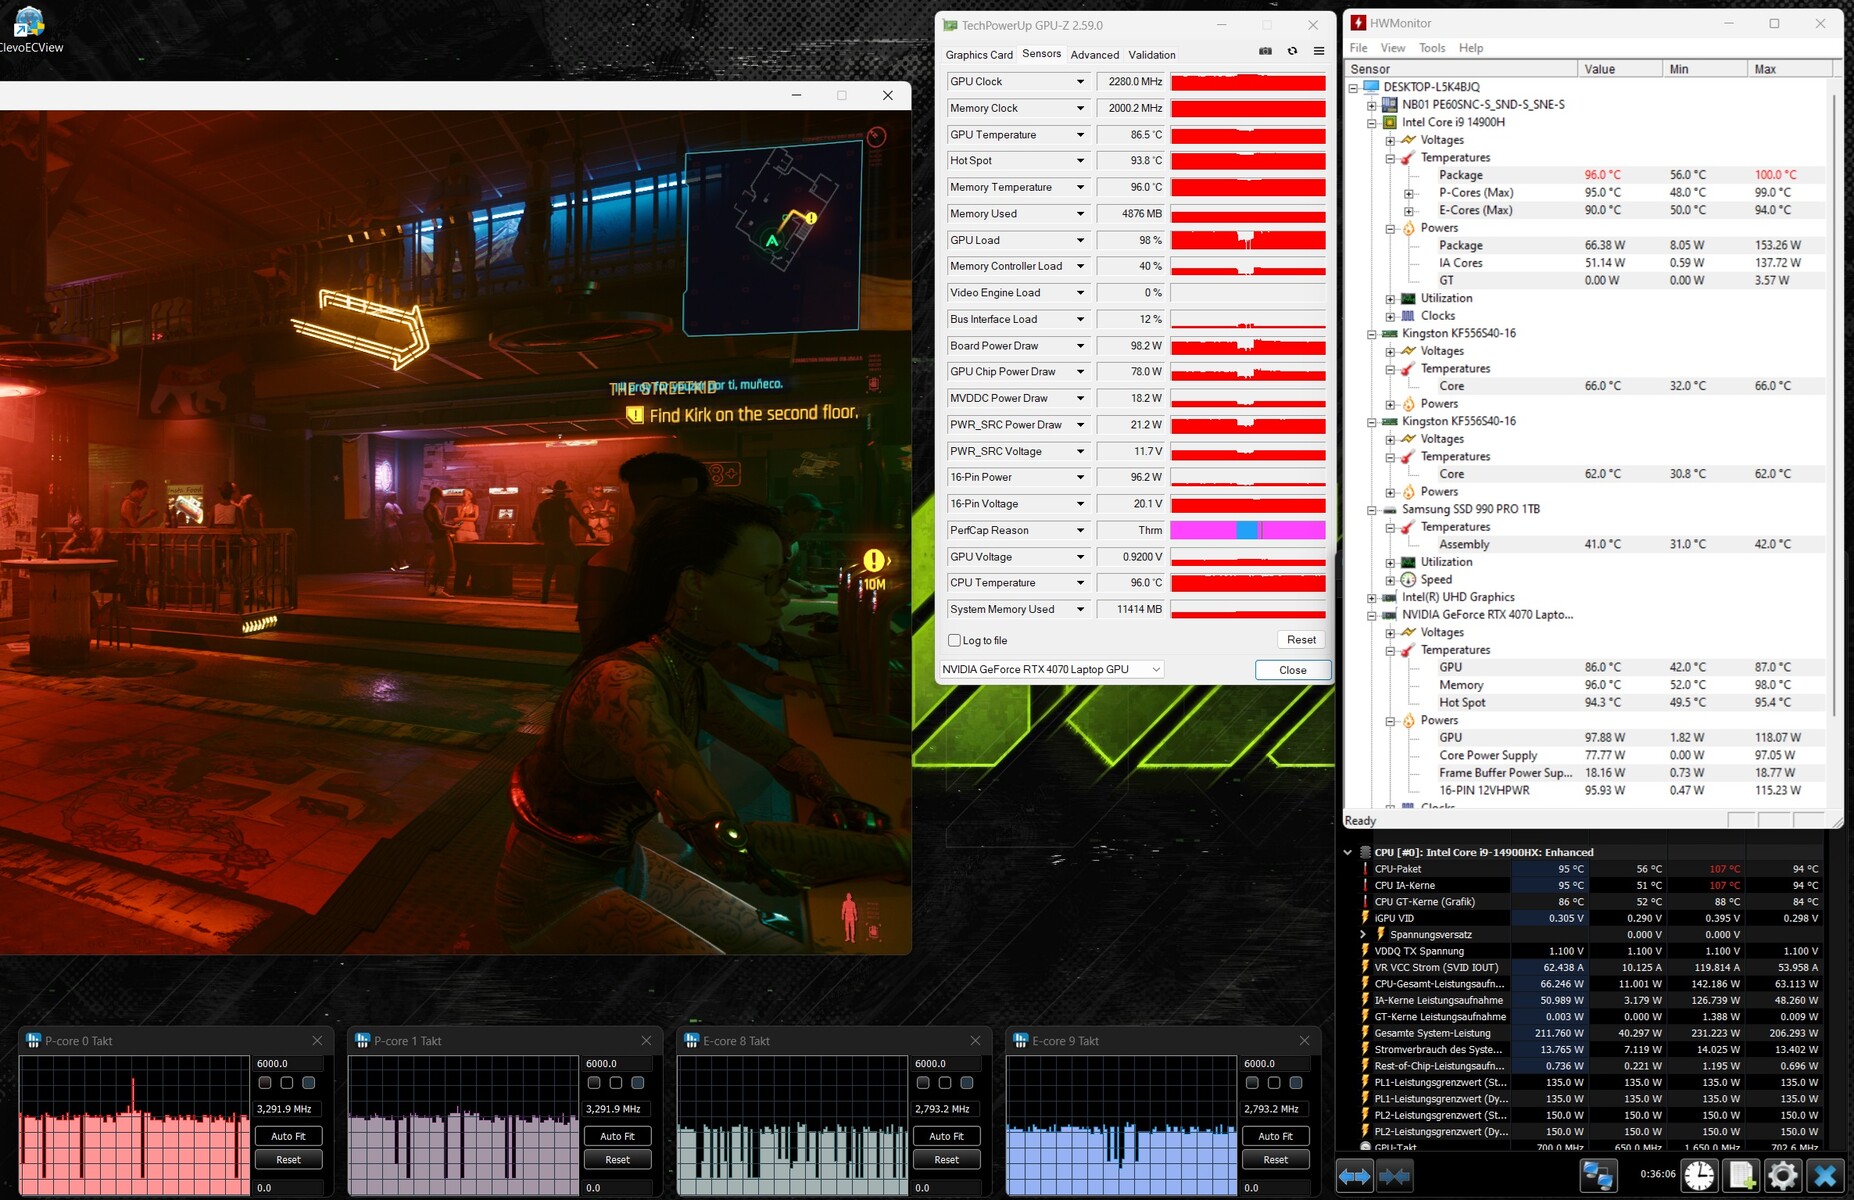
Den bärbara datorn värms upp märkbart: Cyberpunk och stresstesterna resulterade i temperaturer över 60 grader Celsius vid vissa punkter. Värden över genomsnittet kan också nås under vardaglig användning (kontor, internet). Temperaturerna på handledsstödet är inte lika dåliga.
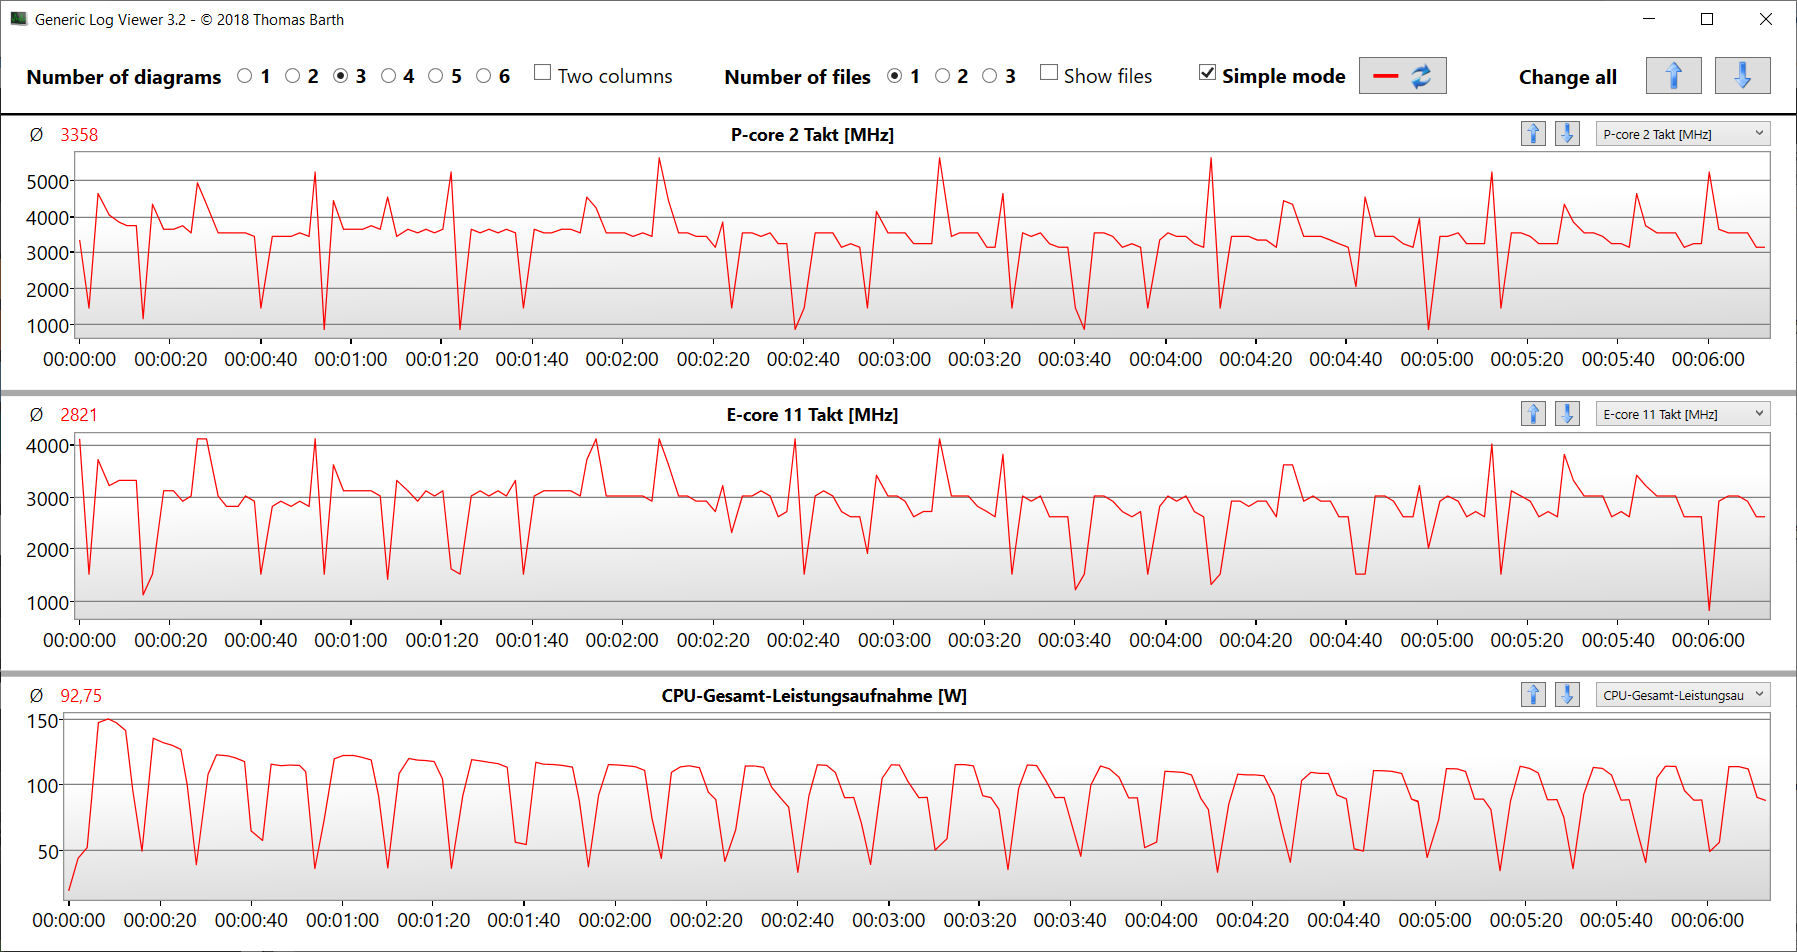
Det extrema stresstestscenariot (Prime95 och Furmark i kontinuerlig drift) kontrollerar systemets stabilitet under full belastning. Enhetens prioriteringar är tydligt fördelade: Medan GPU:n arbetade med full effekt låg CPU-klockan (400 MHz till 2 GHz) under basklockan.
(-) Den maximala temperaturen på ovansidan är 51 °C / 124 F, jämfört med genomsnittet av 40.4 °C / 105 F , allt från 21.2 till 68.8 °C för klassen Gaming.
(-) Botten värms upp till maximalt 66 °C / 151 F, jämfört med genomsnittet av 43.2 °C / 110 F
(±) Vid tomgångsbruk är medeltemperaturen för ovansidan 32.3 °C / 90 F, jämfört med enhetsgenomsnittet på 33.9 °C / ### class_avg_f### F.
(-) 3: The average temperature for the upper side is 42.2 °C / 108 F, compared to the average of 33.9 °C / 93 F for the class Gaming.
(+) Handledsstöden och pekplattan är kallare än hudtemperaturen med maximalt 31 °C / 87.8 F och är därför svala att ta på.
(-) Medeltemperaturen för handledsstödsområdet på liknande enheter var 28.9 °C / 84 F (-2.1 °C / -3.8 F).
| SCHENKER XMG Pro 16 Studio (Mid 24) Intel Core i9-14900HX, NVIDIA GeForce RTX 4070 Laptop GPU | Acer Predator Helios Neo 16 (2024) Intel Core i7-14700HX, NVIDIA GeForce RTX 4070 Laptop GPU | Lenovo Legion Pro 5 16IRX9 Intel Core i9-14900HX, NVIDIA GeForce RTX 4070 Laptop GPU | Aorus 16X 2024 Intel Core i9-14900HX, NVIDIA GeForce RTX 4070 Laptop GPU | SCHENKER XMG Pro 16 Studio (Mid 23) Intel Core i9-13900H, NVIDIA GeForce RTX 4070 Laptop GPU | Lenovo Legion 7 16 IRX G9 Intel Core i9-14900HX, NVIDIA GeForce RTX 4070 Laptop GPU | |
|---|---|---|---|---|---|---|
| Heat | 9% | 11% | 14% | 2% | 22% | |
| Maximum Upper Side * | 51 | 58 -14% | 43.8 14% | 41 20% | 55 -8% | 43.7 14% |
| Maximum Bottom * | 66 | 45.2 32% | 55.4 16% | 41 38% | 66 -0% | 42.9 35% |
| Idle Upper Side * | 35 | 31.1 11% | 32.8 6% | 37 -6% | 33 6% | 29.1 17% |
| Idle Bottom * | 39 | 37.2 5% | 36 8% | 38 3% | 35 10% | 30.6 22% |
* ... mindre är bättre
Högtalare
Det finns en tydlig brist på bas. I övrigt ger stereohögtalarna ett acceptabelt ljud. Deras maxnivå kunde vara något högre.
SCHENKER XMG Pro 16 Studio (Mid 24) ljudanalys
(±) | högtalarljudstyrkan är genomsnittlig men bra (79 dB)
Bas 100 - 315 Hz
(-) | nästan ingen bas - i genomsnitt 15.1% lägre än medianen
(±) | linjäriteten för basen är genomsnittlig (13.6% delta till föregående frekvens)
Mellan 400 - 2000 Hz
(±) | högre mellan - i genomsnitt 5.3% högre än median
(+) | mids är linjära (4.4% delta till föregående frekvens)
Högsta 2 - 16 kHz
(+) | balanserade toppar - endast 4.4% från medianen
(+) | toppar är linjära (4.9% delta till föregående frekvens)
Totalt 100 - 16 000 Hz
(±) | linjäriteten för det totala ljudet är genomsnittlig (17.7% skillnad mot median)
Jämfört med samma klass
» 50% av alla testade enheter i den här klassen var bättre, 10% liknande, 40% sämre
» Den bästa hade ett delta på 6%, genomsnittet var 18%, sämst var 132%
Jämfört med alla testade enheter
» 33% av alla testade enheter var bättre, 8% liknande, 59% sämre
» Den bästa hade ett delta på 4%, genomsnittet var 24%, sämst var 134%
Lenovo Legion Pro 5 16IRX9 ljudanalys
(±) | högtalarljudstyrkan är genomsnittlig men bra (80.7 dB)
Bas 100 - 315 Hz
(-) | nästan ingen bas - i genomsnitt 19% lägre än medianen
(±) | linjäriteten för basen är genomsnittlig (10.1% delta till föregående frekvens)
Mellan 400 - 2000 Hz
(+) | balanserad mellan - endast 4.7% från medianen
(+) | mids är linjära (5.7% delta till föregående frekvens)
Högsta 2 - 16 kHz
(+) | balanserade toppar - endast 3.3% från medianen
(+) | toppar är linjära (5.6% delta till föregående frekvens)
Totalt 100 - 16 000 Hz
(±) | linjäriteten för det totala ljudet är genomsnittlig (17.2% skillnad mot median)
Jämfört med samma klass
» 45% av alla testade enheter i den här klassen var bättre, 11% liknande, 44% sämre
» Den bästa hade ett delta på 6%, genomsnittet var 18%, sämst var 132%
Jämfört med alla testade enheter
» 29% av alla testade enheter var bättre, 8% liknande, 63% sämre
» Den bästa hade ett delta på 4%, genomsnittet var 24%, sämst var 134%
Strömförbrukning
I viloläge är den bärbara datorns strömförbrukning alldeles för hög - betydligt högre än den likadant utrustade föregångarmodellen. Cyberpunk och stresstesterna kördes med något minskande, ständigt fluktuerande strömförbrukning. Strömförsörjningsenheten på 230 watt är fortfarande tillräckligt stor. Kortsiktiga belastningstoppar, som i början av stresstestet, är inget problem för den.
| Av/Standby | |
| Låg belastning | |
| Hög belastning |
|
Förklaring:
min: | |
| SCHENKER XMG Pro 16 Studio (Mid 24) NVIDIA GeForce RTX 4070 Laptop GPU, i9-14900HX, Samsung 990 Pro 1 TB | Acer Predator Helios Neo 16 (2024) NVIDIA GeForce RTX 4070 Laptop GPU, i7-14700HX, Samsung PM9A1a MZVL21T0HDLU | Lenovo Legion Pro 5 16IRX9 NVIDIA GeForce RTX 4070 Laptop GPU, i9-14900HX, Samsung PM9A1 MZVL21T0HCLR | Aorus 16X 2024 NVIDIA GeForce RTX 4070 Laptop GPU, i9-14900HX, Gigabyte AG450E1024-SI | SCHENKER XMG Pro 16 Studio (Mid 23) NVIDIA GeForce RTX 4070 Laptop GPU, i9-13900H, Samsung 990 Pro 1 TB | |
|---|---|---|---|---|---|
| Power Consumption | 11% | 23% | 22% | 43% | |
| Idle Minimum * | 31 | 26.7 14% | 12.5 60% | 13 58% | 8 74% |
| Idle Average * | 33 | 24.4 26% | 24.6 25% | 18 45% | 12 64% |
| Idle Maximum * | 41 | 32.7 20% | 24.8 40% | 35 15% | 23 44% |
| Load Average * | 114 | 122.1 -7% | 109.6 4% | 138 -21% | 94 18% |
| Cyberpunk 2077 ultra * | 218 | ||||
| Cyberpunk 2077 ultra external monitor * | 196.8 | ||||
| Load Maximum * | 250 | 241 4% | 284.9 -14% | 222 11% | 215 14% |
| Witcher 3 ultra * | 190.6 | 218 | 172.6 | 181.5 |
* ... mindre är bättre
Power consumption Cyberpunk / stress test
Power consumption with external monitor
Körtider
Pro 16 kräver också mer ström än sin föregångare vid låg belastning i batteriläge. Som ett resultat av detta uppnådde den en drifttid på 5:37 timmar under WiFi-testet (kartläggning av belastningen vid åtkomst till webbplatser med hjälp av ett skript). Därmed ligger den en dryg timme efter sin föregångare-som hade samma batterikapacitet på 73 Wh.
För
Emot
Omdöme - Ett kraftpaket med problem
Pro 16:s fokus ligger på permanent hög GPU-kraft med prestandavärden som ligger något över GPU:ns genomsnitt. Processorn måste redan efter en kort stund ta det lugnt - CB15 Loop avslöjade detta.
XMG Pro 16 Studio (Mid 24) kan tilldelas avdelningen för modellunderhåll. Bortsett från ett byte från Raptor Lake till Raptor Lake Refresh har den bärbara datorn inga betydande nya funktioner.
Enhetens ljud- och värmeutveckling samt dess strömförbrukning i viloläge är alla (för) höga. Med tanke på hur strömhungrig den bärbara datorn är kan vi inte utesluta att vårt testprov har en defekt. Dess körtider är anständiga.
Den installerade 16:10-panelen (16 tum, 2 560 x 1 600 pixlar, sRGB, IPS, 240 Hz) är bra, men den saknar DCI-P3-färgrymden som är en förutsättning för en bärbar dator för skapare. Enheten kan fortfarande rymma två PCIe 4 SSD-enheter och RAID 0/1 stöds. En TB-4-port ger expansionsalternativ (extern GPU, dockning) och stöder Power Delivery.
Ett alternativ skulle kunna vara Aorus 16X (2024). Den kan få ut lite mer datorkraft ur samma CPU, har en mycket ljusare skärm (inklusive Dolby Vision) - och dessutom har den bättre körtider.
Pris och tillgänglighet
Den nya XMG Pro 16 Studio (Mid 24) kan konfigureras och beställas via bestware.comoch den aktuella testenheten kostar ca 2.500 USD.
Observera: Vi har nyligen uppdaterat vårt betygssystem och resultaten från version 8 är inte jämförbara med resultaten från version 7. Mer information finns tillgänglig här.
SCHENKER XMG Pro 16 Studio (Mid 24)
- 07/23/2024 v8
Sascha Mölck
 Total Sustainability Score:
 Genomskinlighet
Valet av enheter som ska granskas görs av vår redaktion. Testprovet gavs till författaren som ett lån av tillverkaren eller återförsäljaren för denna recension. Långivaren hade inget inflytande på denna recension och inte heller fick tillverkaren en kopia av denna recension innan publiceringen. Det fanns ingen skyldighet att publicera denna recension. Vi accepterar aldrig ersättning eller betalning i utbyte mot våra recensioner. Som ett oberoende medieföretag är Notebookcheck inte föremål för auktoritet från tillverkare, återförsäljare eller förlag.
This is how Notebookcheck is testingEvery year, Notebookcheck independently reviews hundreds of laptops and smartphones using standardized procedures to ensure that all results are comparable. We have continuously developed our test methods for around 20 years and set industry standards in the process. In our test labs, high-quality measuring equipment is utilized by experienced technicians and editors. These tests involve a multi-stage validation process. Our complex rating system is based on hundreds of well-founded measurements and benchmarks, which maintains objectivity.
Price comparison

