Notebookcheck Logo

AMD Ryzen 9 9955HX vs. Intel Core Ultra 9 275HX Analys: Kampen om den snabbaste gaming-CPU:n

Fire Range mot Arrow Lake.

Tillsammans med de nya RTX 5000 GPU:erna för bärbara datorer har även de nya HX-processorerna från AMD och Intel anlänt. Vi jämför AMD Ryzen 9 9955HX med Intel Core Ultra 9 275HX och jämför inte bara den rena CPU-prestandan utan även spelprestandan i kombination med den nya RTX 5090 Laptop GPU:n.
AMD Ryzen 9 9955HX tar upp kampen mot Intel Core Ultra 9 275HX

Både AMD och Nvidia har introducerat sina nya avancerade mobila processorer i HX-klassen tillsammans med Nvidias nya RTX 5000 GPU:er för bärbara datorer. I den här analysartikeln jämför vi AMD Ryzen 9 9955HX med Intel Core Ultra 9 275HX.

Förutom rå CPU-prestanda tittar vi också på olika systembenchmarks tillsammans med spelbenchmarks i samband med den nya 175 W Nvidia GeForce RTX 5090 Laptop GPU.

Översikt: AMD Fire Range vs. Intel Arrow Lake

De nya Intel och AMD SKU:erna presenterades officiellt på CES 2025, och båda tillverkarna hävdar att de erbjuder de bästa mobila processorerna för kreativa applikationer och spel.

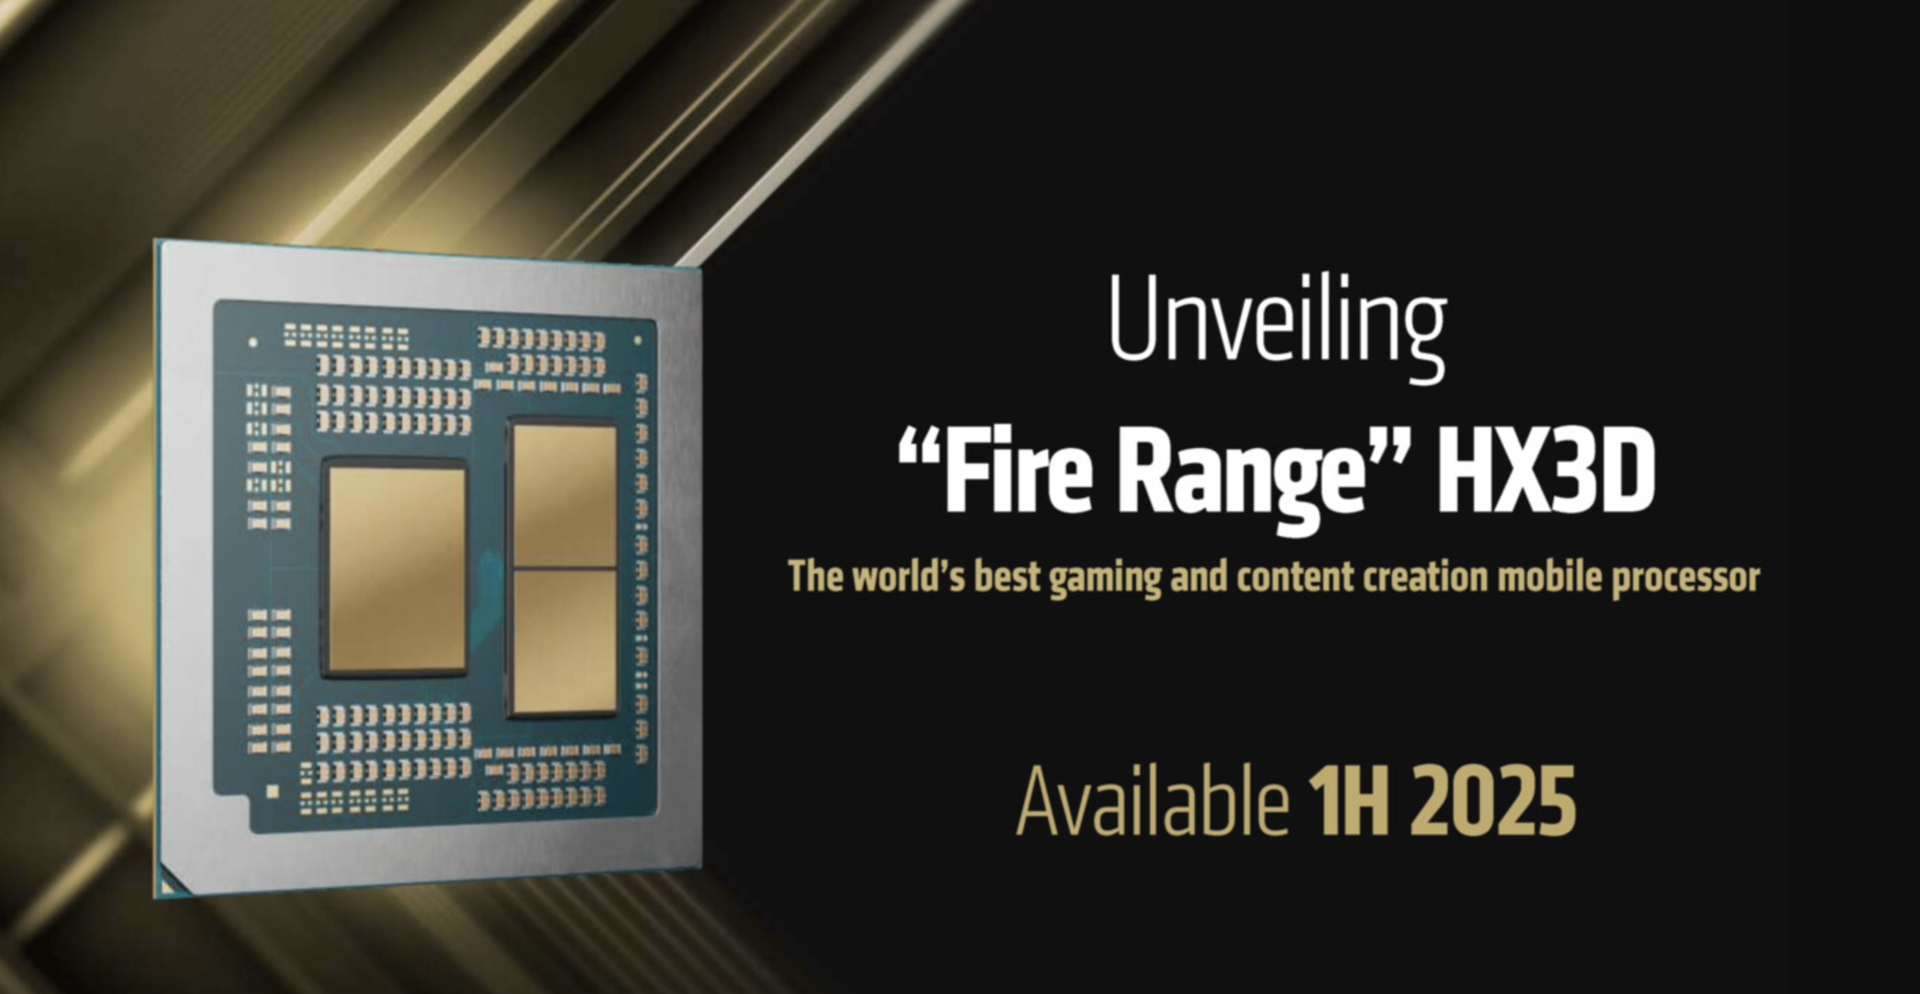
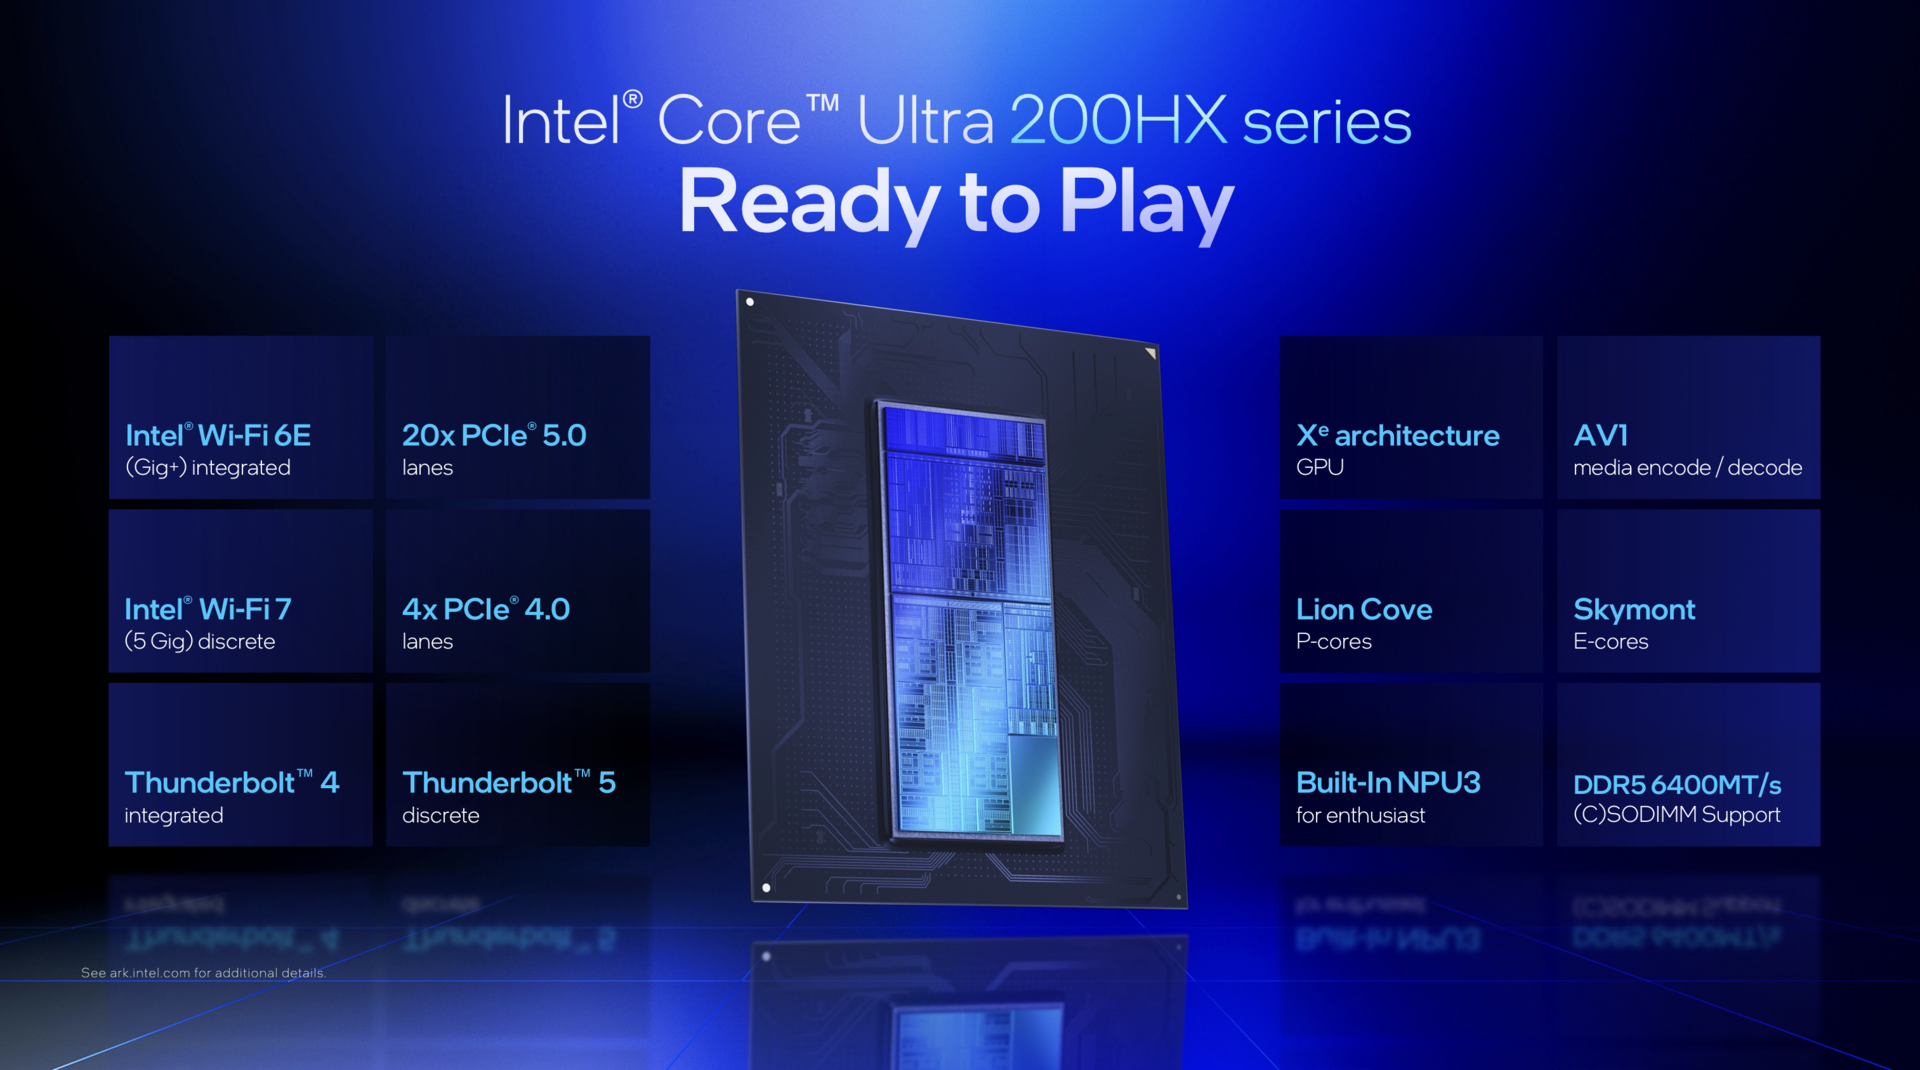
AMD Fire Range APU:erna är baserade på de välkända Zen 5-kärnorna och en variant med 3D-V-cache finns också som tillval. Intel, å andra sidan, förlitar sig på Arrow Lake-arkitekturen.

AMD Fire Range HX
AMD Fire Range HX
Intel Arrow Lake-HX
Intel Arrow Lake-HX

Våra två testprocessorer är AMD Ryzen 9 9955HX och Intel Core Ultra 9 275HXsom inte precis är de snabbaste i sina respektive uppställningar.

Ändå kommer dessa två processorer sannolikt att användas oftast i högpresterande bärbara datorer för spel / skapare. I teorin är TDP för processorerna 54 W för AMD eller 55 W för Intel, men under full belastning kan båda kortvarigt förbruka mer än 150 W.

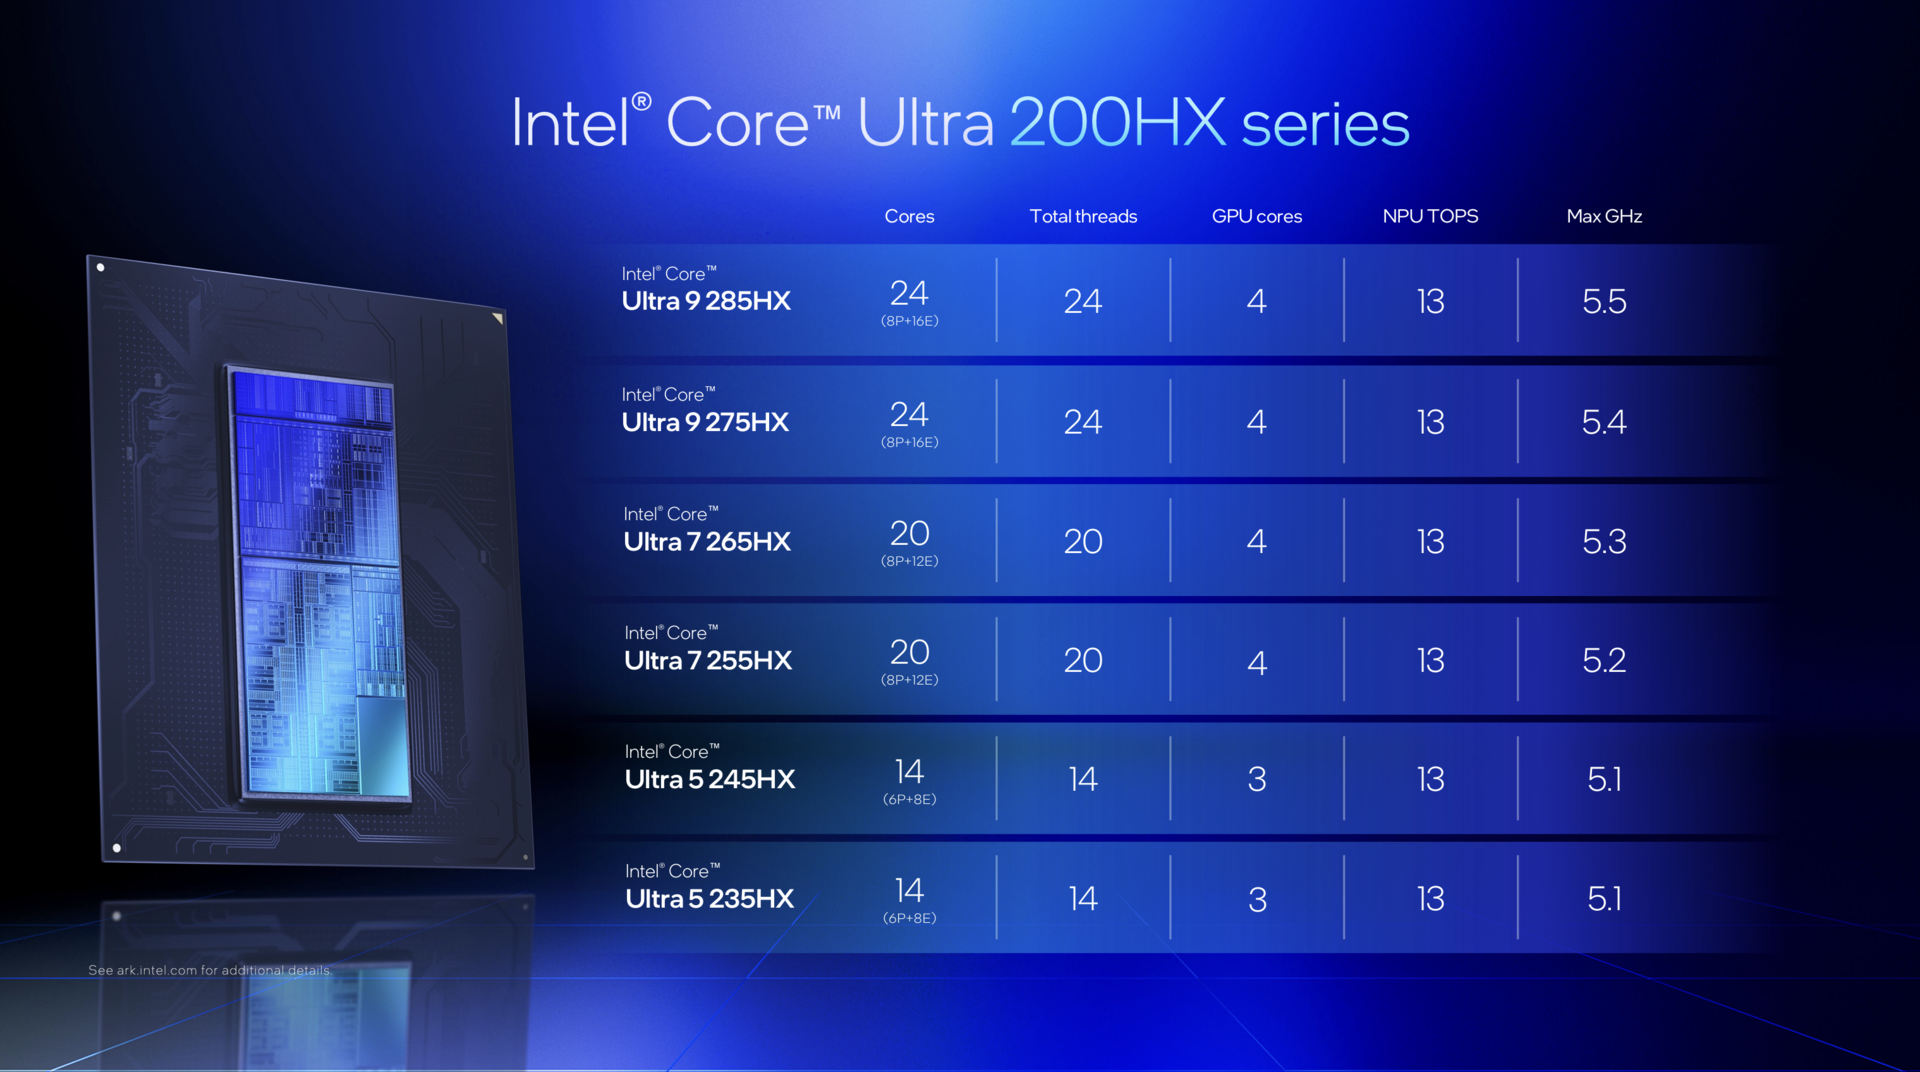
Ryzen 9 9955HX använder 16 kärnor inklusive hyperthreading (32 trådar), medan Core Ultra 9 275HX använder totalt 24 kärnor (8x Performance, 16x Efficiency) utan hyperthreading.

AMD Fire Range 9000HX sortiment
Intel Arrow Lake Core Ultra 200HX-utbud

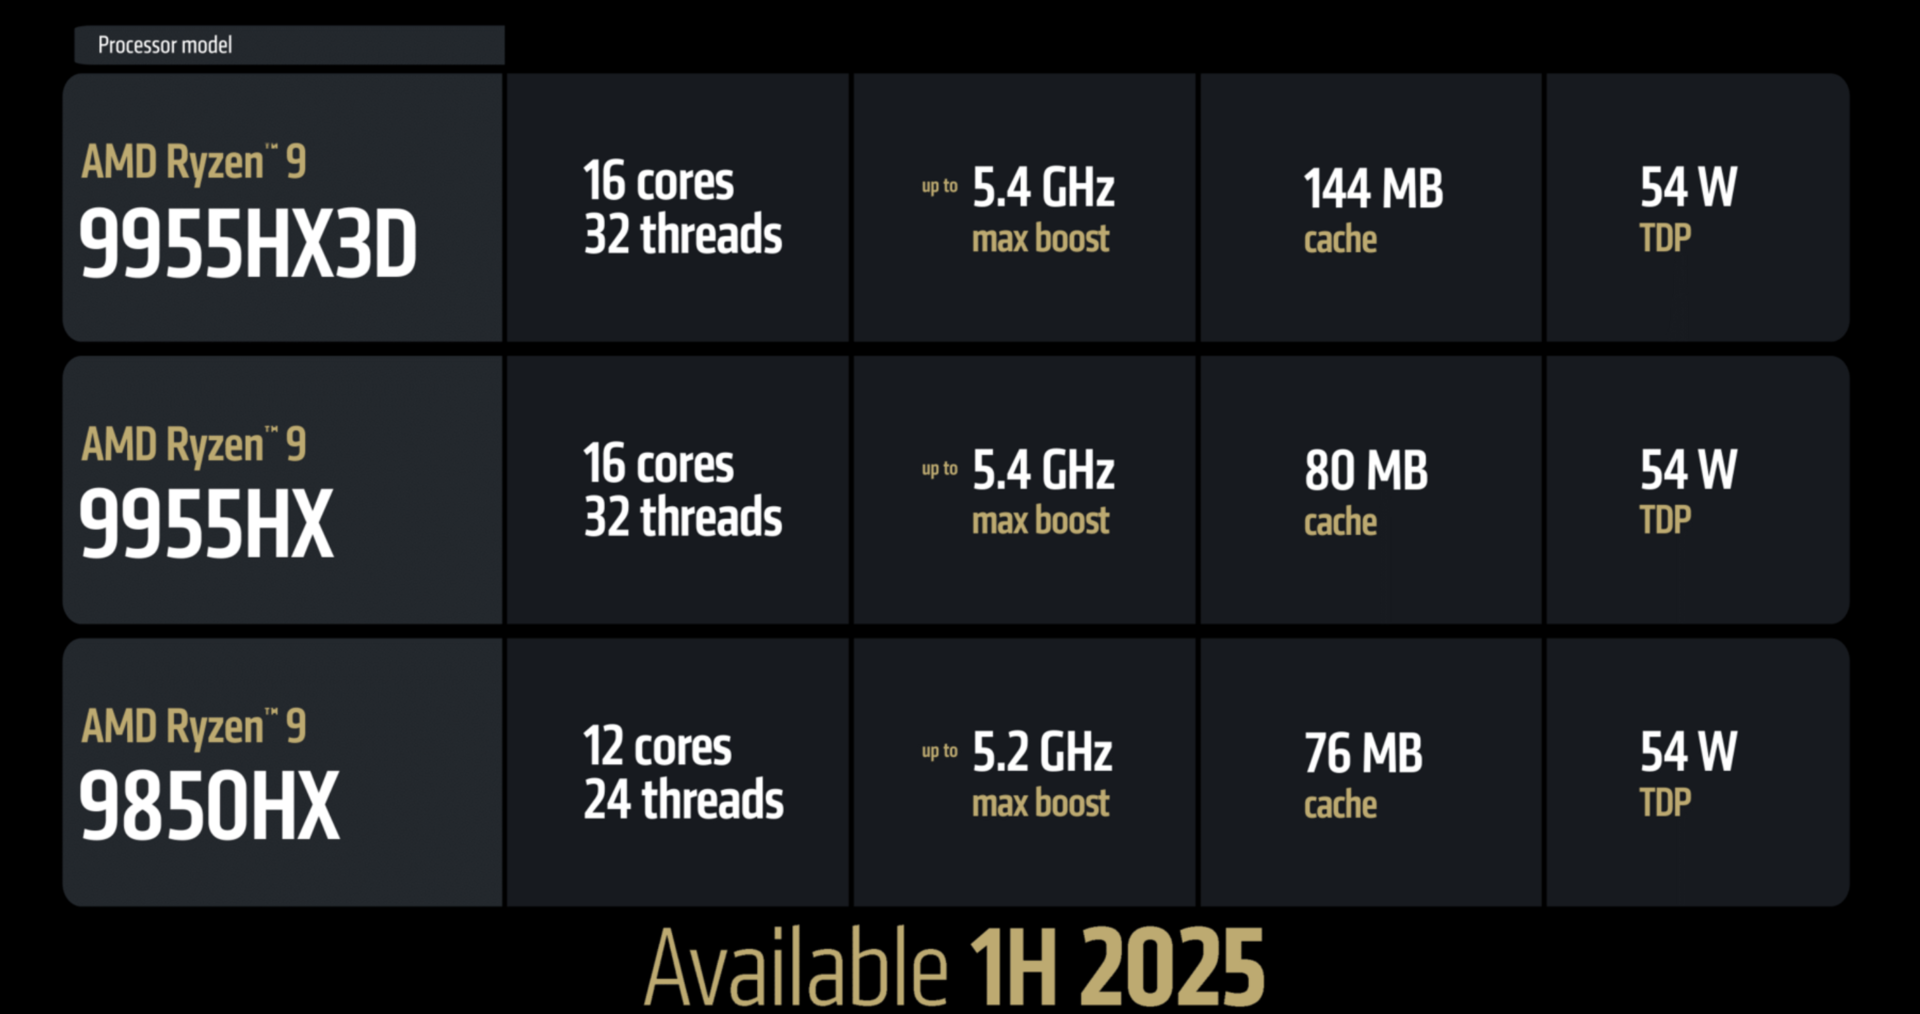
Av särskilt intresse är Ryzen 9 9955HX3D, som tyvärr ännu inte var tillgänglig för testning. Tack vare 3D V-Cache lovar den framför allt en ökad spelprestanda, vilket vi redan har sett mycket tydligt med sin föregångare Ryzen 9 7945HX3D. Vi kan bara hoppas att tillgängligheten blir bättre den här gången.

Testsystem: Asus Strix Scar 18 & XMG Neo 16 A25

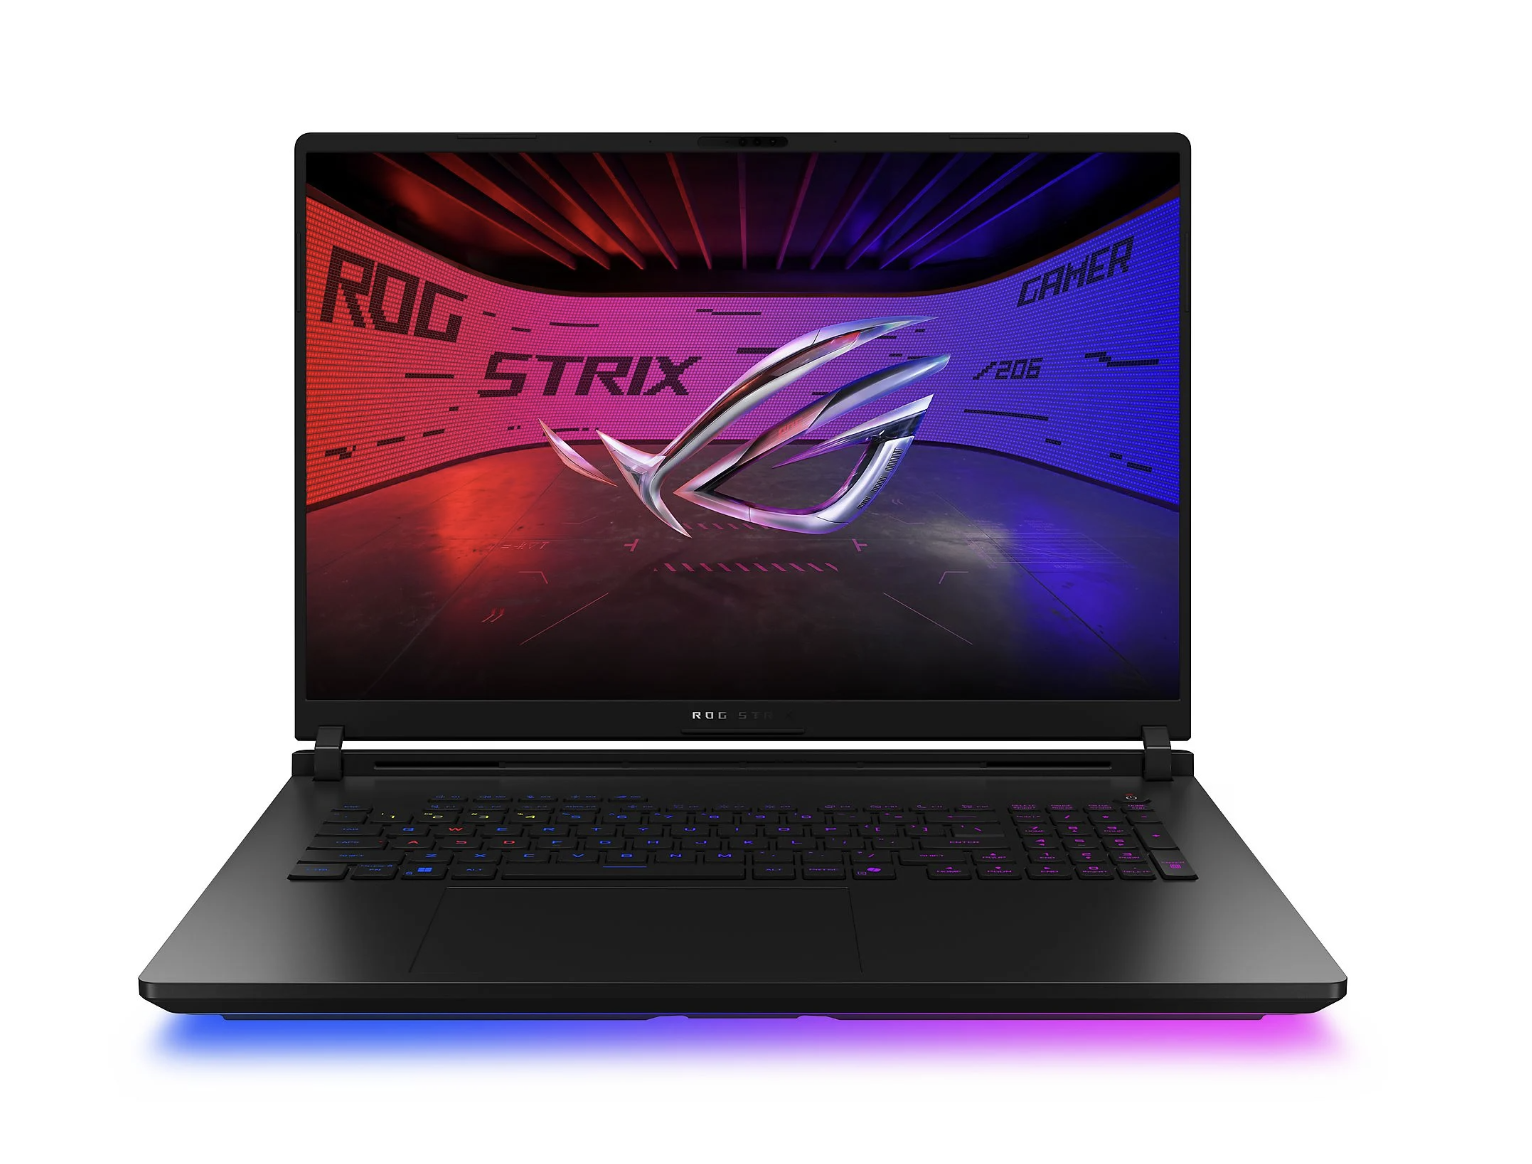
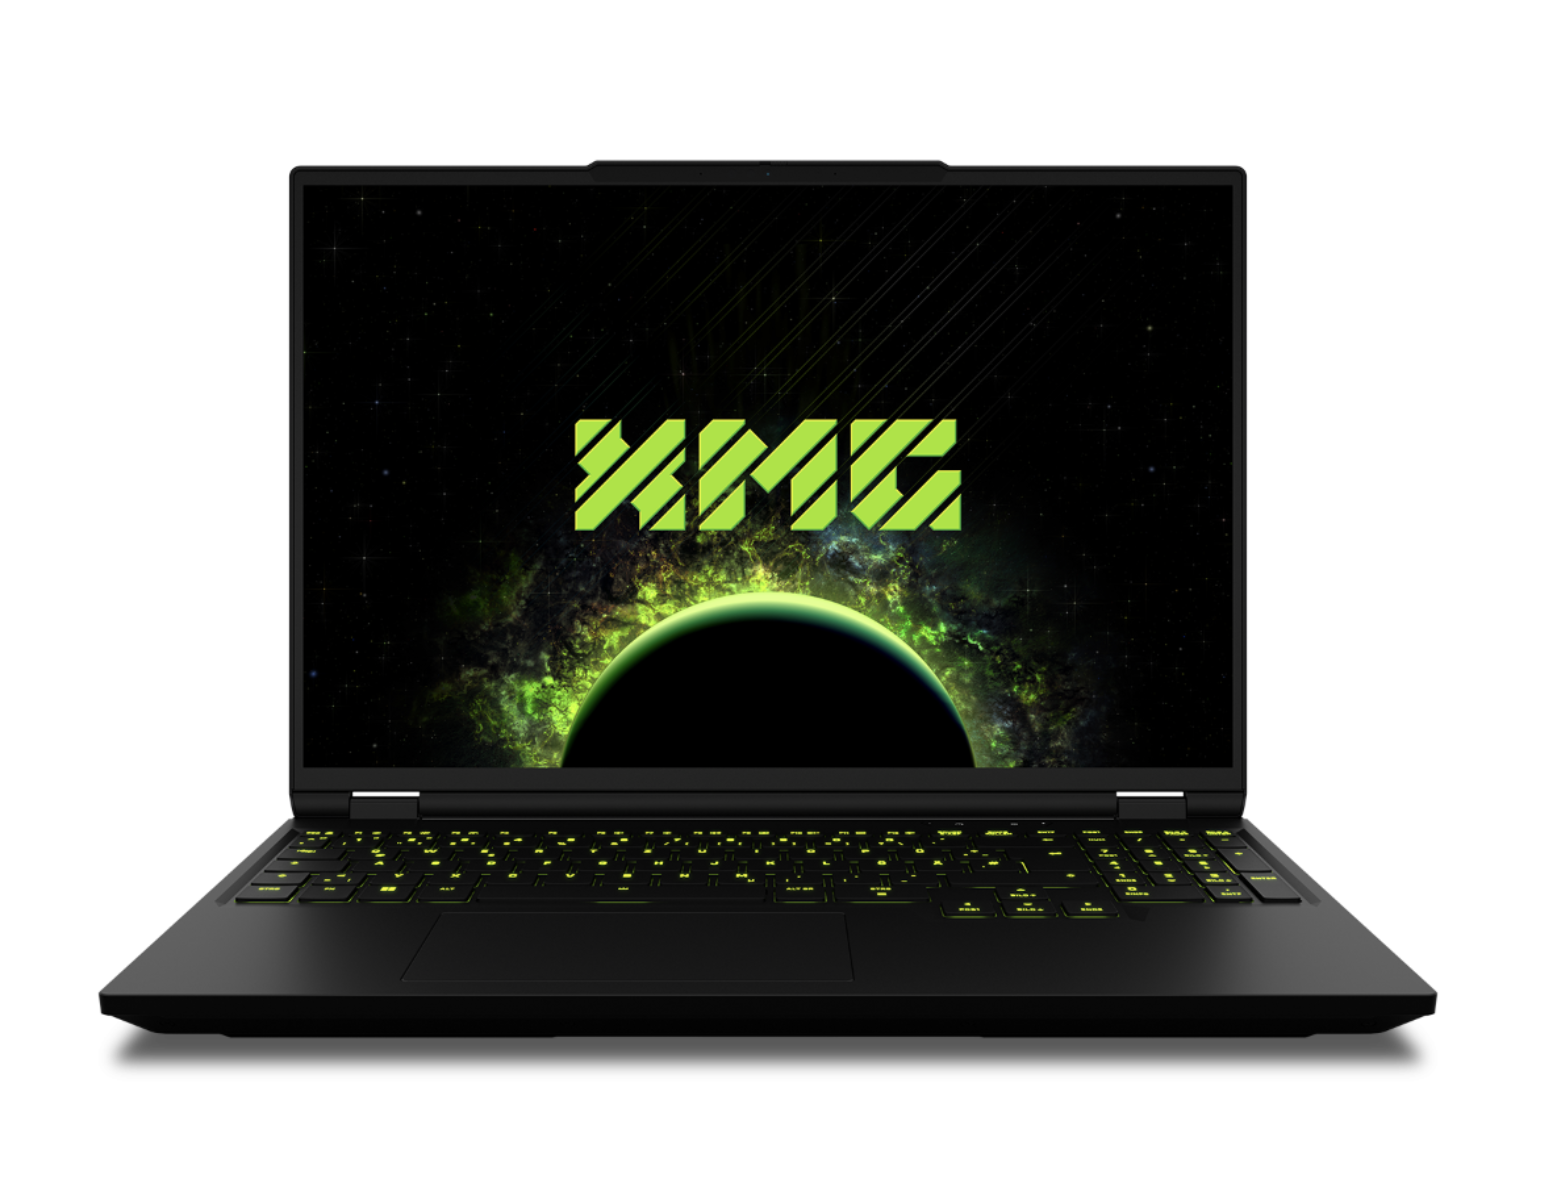
Som testsystem hade vi två extremt kraftfulla bärbara speldatorer till vårt förfogande. Den ena var den nya Asus ROG Strix SCAR 18 G835LX med Intel Core Ultra 9 275HX och 64 GB RAM, och den andra var ett ingenjörsexemplar av den nya XMG Neo 16 A25 med AMD Ryzen 9 9955HX i kombination med 32 GB RAM.

Båda enheterna var utrustade med den nya Nvidia GeForce RTX 5090 Laptop GPU, som kan förbruka upp till 175 W. Vi använde Nvidia Game Ready Driver 572.84 för båda enheterna, vilket gör den idealisk för prestandajämförelser.

Asus Strix Scar 18 G835LX
XMG Neo 16 A25
XMG Neo 16 A25

I nuläget kommer vi dock att avstå från utökade förbrukningsmätningar och effektivitetsöverväganden, eftersom Nvidia GPU alltid kördes på den externa bildskärmen i teknikprovet av XMG Neo 16, vilket naturligtvis skulle öka strömförbrukningen och snedvrida effektivitetsresultaten. Vi kommer att tillhandahålla dessa resultat så snart som möjligt.

Prestanda med en enda kärna

Vi använde Cinebench 2024 och Geekbench 6 för CPU-benchmarks, eftersom dessa två tester körs på alla plattformar och därför möjliggör en mycket bra prestandajämförelse.

I single-core-testerna kunde Core Ultra 9 275HX öka sin prestanda med cirka 6% jämfört med Core i9-14900HX. Ryzen 9 9955HX kunde å andra sidan öka sin prestanda med cirka 11% jämfört med Ryzen 9 7945HX och har därmed kommit ikapp den gamla Core i9-14900HX.

De två mobila avläggarna ligger också något efter sina respektive stationära motsvarigheter och som förväntat har Apple fortfarande en enorm fördel med M4-generationen.

I Geekbench-testet vänder dock vinden och Ryzen 9 9955HX ligger något före Core Ultra 9 275HX.

Performance Rating - Percent
Apple M4 Max (16 cores)
Apple MacBook Pro 16 M4 Max, M4 Max 40-Core GPU
100 pt
Apple M4 Pro (14 cores)
Apple MacBook Pro 16 2024 M4 Pro, M4 Pro 20-Core GPU
99.4 pt
AMD Ryzen 9 9950X3D
AMD Ryzen 9 9950X3D, NVIDIA GeForce RTX 4090
83.1 pt
Intel Core Ultra 9 285K
Intel Core Ultra 9 285K, NVIDIA GeForce RTX 4090
83.1 pt
Apple M3 Max 16-Core
Apple MacBook Pro 14 2023 M3 Max, M3 Max 40-Core GPU
80 pt
Intel Core Ultra 9 275HX
Asus Strix Scar 18 G835LX, GeForce RTX 5090 Laptop
79.5 pt
AMD Ryzen 9 9955HX
SCHENKER Neo 16 A25 5090 Engineering Sample, GeForce RTX 5090 Laptop
77.9 pt
Intel Core i9-14900HX
MSI Raider 18 HX A14V, NVIDIA GeForce RTX 4080 Laptop GPU
75.3 pt
Intel Core Ultra 9 285H
MSI Prestige 16 AI Evo B2HMG, Arc 140T
73.2 pt
Intel Core i9-13900HK
Beelink GTI13 Ultra, Iris Xe G7 96EUs
71.8 pt
AMD Ryzen AI Max+ 395
Asus ROG Flow Z13 GZ302EA-RU073W, Radeon RX 8060S
71.2 pt
Intel Core i7-14700HX
Lenovo ThinkPad P16 Gen 2, NVIDIA RTX 4000 Ada Generation Laptop GPU
71.2 pt
AMD Ryzen 9 7945HX3D
Asus ROG Strix Scar 17 G733PYV-LL053X, NVIDIA GeForce RTX 4090 Laptop GPU
69.9 pt
AMD Ryzen 9 7945HX
Minisforum BD795i SE, Radeon 610M
69.4 pt
Cinebench 2024 - CPU Single Core
Apple M4 Pro (14 cores)
Apple MacBook Pro 16 2024 M4 Pro, M4 Pro 20-Core GPU
178 Points +38%
Apple M4 Max (16 cores)
Apple MacBook Pro 16 M4 Max, M4 Max 40-Core GPU
178 Points +38%
Intel Core Ultra 9 285K
Intel Core Ultra 9 285K, NVIDIA GeForce RTX 4090
144 Points +12%
Apple M3 Max 16-Core
Apple MacBook Pro 14 2023 M3 Max, M3 Max 40-Core GPU
140 Points +9%
AMD Ryzen 9 9950X3D
AMD Ryzen 9 9950X3D, NVIDIA GeForce RTX 4090
138.4 Points +7%
Intel Core Ultra 9 275HX
Asus Strix Scar 18 G835LX, GeForce RTX 5090 Laptop
138 Points +7%
Intel Core i9-14900HX
MSI Raider 18 HX A14V, NVIDIA GeForce RTX 4080 Laptop GPU
129.9 Points +1%
AMD Ryzen 9 9955HX
SCHENKER Neo 16 A25 5090 Engineering Sample, GeForce RTX 5090 Laptop
129 Points
Intel Core Ultra 9 285H
MSI Prestige 16 AI Evo B2HMG, Arc 140T
127 Points -2%
Intel Core i9-13900HK
Beelink GTI13 Ultra, Iris Xe G7 96EUs
123.5 Points -4%
Intel Core i7-14700HX
Lenovo ThinkPad P16 Gen 2, NVIDIA RTX 4000 Ada Generation Laptop GPU
120.7 Points -6%
AMD Ryzen AI Max+ 395
Asus ROG Flow Z13 GZ302EA-RU073W, Radeon RX 8060S
116.8 Points -9%
AMD Ryzen 9 7945HX
Minisforum BD795i SE, Radeon 610M
116 Points -10%
AMD Ryzen 9 7945HX3D
Asus ROG Strix Scar 17 G733PYV-LL053X, NVIDIA GeForce RTX 4090 Laptop GPU
115 Points -11%
Geekbench 6.4 - Single-Core
Apple M4 Max (16 cores)
Apple MacBook Pro 16 M4 Max, M4 Max 40-Core GPU
3880 Points +20%
Apple M4 Pro (14 cores)
Apple MacBook Pro 16 2024 M4 Pro, M4 Pro 20-Core GPU
3836 Points +19%
AMD Ryzen 9 9950X3D
AMD Ryzen 9 9950X3D, NVIDIA GeForce RTX 4090
3434 Points +6%
Intel Core Ultra 9 285K
Intel Core Ultra 9 285K, NVIDIA GeForce RTX 4090
3306 Points +2%
AMD Ryzen 9 9955HX
SCHENKER Neo 16 A25 5090 Engineering Sample, GeForce RTX 5090 Laptop
3230 Points
Intel Core Ultra 9 275HX
Asus Strix Scar 18 G835LX, GeForce RTX 5090 Laptop
3158 Points -2%
Apple M3 Max 16-Core
Apple MacBook Pro 14 2023 M3 Max, M3 Max 40-Core GPU
3157 Points -2%
Intel Core i9-14900HX
MSI Raider 18 HX A14V, NVIDIA GeForce RTX 4080 Laptop GPU
3010 Points -7%
AMD Ryzen AI Max+ 395
Asus ROG Flow Z13 GZ302EA-RU073W, Radeon RX 8060S
2978 Points -8%
AMD Ryzen 9 7945HX3D
Asus ROG Strix Scar 17 G733PYV-LL053X, NVIDIA GeForce RTX 4090 Laptop GPU
2916 Points -10%
Intel Core Ultra 9 285H
MSI Prestige 16 AI Evo B2HMG, Arc 140T
2912 Points -10%
Intel Core i7-14700HX
Lenovo ThinkPad P16 Gen 2, NVIDIA RTX 4000 Ada Generation Laptop GPU
2892 Points -10%
Intel Core i9-13900HK
Beelink GTI13 Ultra, Iris Xe G7 96EUs
2883 Points -11%
AMD Ryzen 9 7945HX
Minisforum BD795i SE, Radeon 610M
2858 Points -12%

Flerkärnig prestanda

I multitestet Cinebench 2024 presterar den nya Core Ultra 9 275HX mycket bra och kan överträffa den gamla Core i9-14900HX med hela 30%. Ultra 9 275HX slår också knappt Apple M4 Max CPU:erna - som dock kräver betydligt mindre ström.

Ryzen 9 9955HX ligger cirka 15 % före sina föregångare och cirka 7 % bakom 275HX. Geekbench multi-test visar en liknande bild, med de två M4 Max SoC: erna som kommer ut på toppen i detta test.

Performance Rating - Percent
Intel Core Ultra 9 285K
Intel Core Ultra 9 285K, NVIDIA GeForce RTX 4090
92.1 pt
AMD Ryzen 9 9950X3D
AMD Ryzen 9 9950X3D, NVIDIA GeForce RTX 4090
92 pt
Apple M4 Max (16 cores)
Apple MacBook Pro 16 M4 Max, M4 Max 40-Core GPU
91.9 pt
Intel Core Ultra 9 275HX
Asus Strix Scar 18 G835LX, GeForce RTX 5090 Laptop
87.7 pt
AMD Ryzen 9 9955HX
SCHENKER Neo 16 A25 5090 Engineering Sample, GeForce RTX 5090 Laptop
80.2 pt
Apple M4 Pro (14 cores)
Apple MacBook Pro 16 2024 M4 Pro, M4 Pro 20-Core GPU
79.2 pt
AMD Ryzen AI Max+ 395
Asus ROG Flow Z13 GZ302EA-RU073W, Radeon RX 8060S
75.1 pt
Apple M3 Max 16-Core
Apple MacBook Pro 14 2023 M3 Max, M3 Max 40-Core GPU
72.7 pt
AMD Ryzen 9 7945HX
Minisforum BD795i SE, Radeon 610M
69.8 pt
AMD Ryzen 9 7945HX3D
Asus ROG Strix Scar 17 G733PYV-LL053X, NVIDIA GeForce RTX 4090 Laptop GPU
69.3 pt
Intel Core i9-14900HX
MSI Raider 18 HX A14V, NVIDIA GeForce RTX 4080 Laptop GPU
68.2 pt
Intel Core i7-14700HX
Lenovo ThinkPad P16 Gen 2, NVIDIA RTX 4000 Ada Generation Laptop GPU
59.3 pt
Intel Core Ultra 9 285H
MSI Prestige 16 AI Evo B2HMG, Arc 140T
53.8 pt
Intel Core i9-13900HK
Beelink GTI13 Ultra, Iris Xe G7 96EUs
45.9 pt
Cinebench 2024 - CPU Multi Core
Intel Core Ultra 9 285K
Intel Core Ultra 9 285K, NVIDIA GeForce RTX 4090
2436 Points +18%
AMD Ryzen 9 9950X3D
AMD Ryzen 9 9950X3D, NVIDIA GeForce RTX 4090
2365 Points +15%
Intel Core Ultra 9 275HX
Asus Strix Scar 18 G835LX, GeForce RTX 5090 Laptop
2223 Points +8%
Apple M4 Max (16 cores)
Apple MacBook Pro 16 M4 Max, M4 Max 40-Core GPU
2069 Points +1%
Apple M4 Max (16 cores)
Apple MacBook Pro 16 M4 Max, M4 Max 40-Core GPU
2015 Points -2%
AMD Ryzen 9 9955HX
SCHENKER Neo 16 A25 5090 Engineering Sample, GeForce RTX 5090 Laptop
2058 Points
AMD Ryzen 9 7945HX
Minisforum BD795i SE, Radeon 610M
1799 Points -13%
AMD Ryzen 9 7945HX3D
Asus ROG Strix Scar 17 G733PYV-LL053X, NVIDIA GeForce RTX 4090 Laptop GPU
1772 Points -14%
Apple M4 Pro (14 cores)
Apple MacBook Pro 16 2024 M4 Pro, M4 Pro 20-Core GPU
1729 Points -16%
Intel Core i9-14900HX
MSI Raider 18 HX A14V, NVIDIA GeForce RTX 4080 Laptop GPU
1728 Points -16%
AMD Ryzen AI Max+ 395
Asus ROG Flow Z13 GZ302EA-RU073W, Radeon RX 8060S
1648 Points -20%
Apple M3 Max 16-Core
Apple MacBook Pro 14 2023 M3 Max, M3 Max 40-Core GPU
1532 Points -26%
Intel Core i7-14700HX
Lenovo ThinkPad P16 Gen 2, NVIDIA RTX 4000 Ada Generation Laptop GPU
1345 Points -35%
Intel Core Ultra 9 285H
MSI Prestige 16 AI Evo B2HMG, Arc 140T
991 Points -52%
Intel Core i9-13900HK
Beelink GTI13 Ultra, Iris Xe G7 96EUs
980 Points -52%
Geekbench 6.4 - Multi-Core
Apple M4 Max (16 cores)
Apple MacBook Pro 16 M4 Max, M4 Max 40-Core GPU
25760 Points +32%
Apple M4 Pro (14 cores)
Apple MacBook Pro 16 2024 M4 Pro, M4 Pro 20-Core GPU
22509 Points +15%
AMD Ryzen 9 9950X3D
AMD Ryzen 9 9950X3D, NVIDIA GeForce RTX 4090
22405 Points +15%
Intel Core Ultra 9 285K
Intel Core Ultra 9 285K, NVIDIA GeForce RTX 4090
21688 Points +11%
Intel Core Ultra 9 275HX
Asus Strix Scar 18 G835LX, GeForce RTX 5090 Laptop
21668 Points +11%
AMD Ryzen AI Max+ 395
Asus ROG Flow Z13 GZ302EA-RU073W, Radeon RX 8060S
21269 Points +9%
Apple M3 Max 16-Core
Apple MacBook Pro 14 2023 M3 Max, M3 Max 40-Core GPU
21264 Points +9%
AMD Ryzen 9 9955HX
SCHENKER Neo 16 A25 5090 Engineering Sample, GeForce RTX 5090 Laptop
19563 Points
Intel Core Ultra 9 285H
MSI Prestige 16 AI Evo B2HMG, Arc 140T
17262 Points -12%
AMD Ryzen 9 7945HX3D
Asus ROG Strix Scar 17 G733PYV-LL053X, NVIDIA GeForce RTX 4090 Laptop GPU
16957 Points -13%
AMD Ryzen 9 7945HX
Minisforum BD795i SE, Radeon 610M
16946 Points -13%
Intel Core i9-14900HX
MSI Raider 18 HX A14V, NVIDIA GeForce RTX 4080 Laptop GPU
16855 Points -14%
Intel Core i7-14700HX
Lenovo ThinkPad P16 Gen 2, NVIDIA RTX 4000 Ada Generation Laptop GPU
16326 Points -17%
Intel Core i9-13900HK
Beelink GTI13 Ultra, Iris Xe G7 96EUs
13309 Points -32%

Benchmarks för system

I systembenchmarks som PCMark 10, CrossMark eller 3DMark Physics-testerna har AMD-processorn nästan alltid en fördel jämfört med Core Ultra 9 275HX.

Men de andra komponenterna har naturligtvis också en inverkan på systemets totala prestanda.

PCMark 10 / Score
AMD Ryzen 9 9950X3D
AMD Ryzen 9 9950X3D, NVIDIA GeForce RTX 4090
10843 Points +15%
Intel Core Ultra 9 285K
Intel Core Ultra 9 285K, NVIDIA GeForce RTX 4090
10514 Points +12%
AMD Ryzen 9 9955HX
SCHENKER Neo 16 A25 5090 Engineering Sample, GeForce RTX 5090 Laptop
9402 Points
Intel Core i9-14900HX
MSI Raider 18 HX A14V, NVIDIA GeForce RTX 4080 Laptop GPU
9223 Points -2%
AMD Ryzen AI Max+ 395
Asus ROG Flow Z13 GZ302EA-RU073W, Radeon RX 8060S
9125 Points -3%
AMD Ryzen 9 7945HX3D
Asus ROG Strix Scar 17 G733PYV-LL053X, NVIDIA GeForce RTX 4090 Laptop GPU
9117 Points -3%
Intel Core Ultra 9 275HX
Asus Strix Scar 18 G835LX, GeForce RTX 5090 Laptop
8623 Points -8%
Intel Core i7-14700HX
Lenovo ThinkPad P16 Gen 2, NVIDIA RTX 4000 Ada Generation Laptop GPU
8353 Points -11%
Intel Core Ultra 9 285H
MSI Prestige 16 AI Evo B2HMG, Arc 140T
7838 Points -17%
Intel Core i9-13900HK
Beelink GTI13 Ultra, Iris Xe G7 96EUs
6791 Points -28%
AMD Ryzen 9 7945HX
Minisforum BD795i SE, Radeon 610M
6558 Points -30%
PCMark 10 / Essentials
AMD Ryzen 9 9950X3D
AMD Ryzen 9 9950X3D, NVIDIA GeForce RTX 4090
12435 Points +10%
AMD Ryzen AI Max+ 395
Asus ROG Flow Z13 GZ302EA-RU073W, Radeon RX 8060S
12005 Points +7%
Intel Core i9-13900HK
Beelink GTI13 Ultra, Iris Xe G7 96EUs
11963 Points +6%
Intel Core i9-14900HX
MSI Raider 18 HX A14V, NVIDIA GeForce RTX 4080 Laptop GPU
11825 Points +5%
Intel Core Ultra 9 285K
Intel Core Ultra 9 285K, NVIDIA GeForce RTX 4090
11613 Points +3%
AMD Ryzen 9 7945HX
Minisforum BD795i SE, Radeon 610M
11584 Points +3%
AMD Ryzen 9 7945HX3D
Asus ROG Strix Scar 17 G733PYV-LL053X, NVIDIA GeForce RTX 4090 Laptop GPU
11561 Points +3%
AMD Ryzen 9 9955HX
SCHENKER Neo 16 A25 5090 Engineering Sample, GeForce RTX 5090 Laptop
11271 Points
Intel Core Ultra 9 285H
MSI Prestige 16 AI Evo B2HMG, Arc 140T
11171 Points -1%
Intel Core i7-14700HX
Lenovo ThinkPad P16 Gen 2, NVIDIA RTX 4000 Ada Generation Laptop GPU
11157 Points -1%
Intel Core Ultra 9 275HX
Asus Strix Scar 18 G835LX, GeForce RTX 5090 Laptop
10966 Points -3%
PCMark 10 / Productivity
AMD Ryzen 9 9950X3D
AMD Ryzen 9 9950X3D, NVIDIA GeForce RTX 4090
12578 Points +19%
Intel Core Ultra 9 285K
Intel Core Ultra 9 285K, NVIDIA GeForce RTX 4090
12340 Points +16%
Intel Core i9-14900HX
MSI Raider 18 HX A14V, NVIDIA GeForce RTX 4080 Laptop GPU
11082 Points +5%
AMD Ryzen 9 7945HX3D
Asus ROG Strix Scar 17 G733PYV-LL053X, NVIDIA GeForce RTX 4090 Laptop GPU
10881 Points +3%
AMD Ryzen 9 9955HX
SCHENKER Neo 16 A25 5090 Engineering Sample, GeForce RTX 5090 Laptop
10601 Points
AMD Ryzen AI Max+ 395
Asus ROG Flow Z13 GZ302EA-RU073W, Radeon RX 8060S
10377 Points -2%
AMD Ryzen 9 7945HX
Minisforum BD795i SE, Radeon 610M
9965 Points -6%
Intel Core i7-14700HX
Lenovo ThinkPad P16 Gen 2, NVIDIA RTX 4000 Ada Generation Laptop GPU
9712 Points -8%
Intel Core Ultra 9 285H
MSI Prestige 16 AI Evo B2HMG, Arc 140T
9594 Points -9%
Intel Core Ultra 9 275HX
Asus Strix Scar 18 G835LX, GeForce RTX 5090 Laptop
9444 Points -11%
Intel Core i9-13900HK
Beelink GTI13 Ultra, Iris Xe G7 96EUs
8203 Points -23%
PCMark 10 / Digital Content Creation
AMD Ryzen 9 9950X3D
AMD Ryzen 9 9950X3D, NVIDIA GeForce RTX 4090
22121 Points +17%
Intel Core Ultra 9 285K
Intel Core Ultra 9 285K, NVIDIA GeForce RTX 4090
22005 Points +17%
AMD Ryzen 9 9955HX
SCHENKER Neo 16 A25 5090 Engineering Sample, GeForce RTX 5090 Laptop
18874 Points
Intel Core Ultra 9 275HX
Asus Strix Scar 18 G835LX, GeForce RTX 5090 Laptop
16802 Points -11%
AMD Ryzen AI Max+ 395
Asus ROG Flow Z13 GZ302EA-RU073W, Radeon RX 8060S
16551 Points -12%
AMD Ryzen 9 7945HX3D
Asus ROG Strix Scar 17 G733PYV-LL053X, NVIDIA GeForce RTX 4090 Laptop GPU
16348 Points -13%
Intel Core i9-14900HX
MSI Raider 18 HX A14V, NVIDIA GeForce RTX 4080 Laptop GPU
16246 Points -14%
Intel Core i7-14700HX
Lenovo ThinkPad P16 Gen 2, NVIDIA RTX 4000 Ada Generation Laptop GPU
14598 Points -23%
Intel Core Ultra 9 285H
MSI Prestige 16 AI Evo B2HMG, Arc 140T
12193 Points -35%
Intel Core i9-13900HK
Beelink GTI13 Ultra, Iris Xe G7 96EUs
8661 Points -54%
AMD Ryzen 9 7945HX
Minisforum BD795i SE, Radeon 610M
6630 Points -65%
CrossMark / Overall
Intel Core Ultra 9 285K
Intel Core Ultra 9 285K, NVIDIA GeForce RTX 4090
2529 Points +12%
AMD Ryzen 9 9950X3D
AMD Ryzen 9 9950X3D, NVIDIA GeForce RTX 4090
2380 Points +5%
AMD Ryzen AI Max+ 395
Asus ROG Flow Z13 GZ302EA-RU073W, Radeon RX 8060S
2274 Points +1%
AMD Ryzen 9 9955HX
SCHENKER Neo 16 A25 5090 Engineering Sample, GeForce RTX 5090 Laptop
2259 Points
Apple M4 Max (16 cores)
Apple MacBook Pro 16 M4 Max, M4 Max 40-Core GPU
2255 Points 0%
Intel Core Ultra 9 275HX
Asus Strix Scar 18 G835LX, GeForce RTX 5090 Laptop
2221 Points -2%
Intel Core Ultra 9 285H
MSI Prestige 16 AI Evo B2HMG, Arc 140T
2173 Points -4%
Intel Core i9-14900HX
MSI Raider 18 HX A14V, NVIDIA GeForce RTX 4080 Laptop GPU
2151 Points -5%
Apple M4 Pro (14 cores)
Apple MacBook Pro 16 2024 M4 Pro, M4 Pro 20-Core GPU
2148 Points -5%
AMD Ryzen 9 7945HX
Minisforum BD795i SE, Radeon 610M
2110 Points -7%
Intel Core i9-13900HK
Beelink GTI13 Ultra, Iris Xe G7 96EUs
2099 Points -7%
AMD Ryzen 9 7945HX3D
Asus ROG Strix Scar 17 G733PYV-LL053X, NVIDIA GeForce RTX 4090 Laptop GPU
2086 Points -8%
Apple M3 Max 16-Core
Apple MacBook Pro 14 2023 M3 Max, M3 Max 40-Core GPU
2032 Points -10%
Intel Core i7-14700HX
Lenovo ThinkPad P16 Gen 2, NVIDIA RTX 4000 Ada Generation Laptop GPU
2011 Points -11%
CrossMark / Productivity
Intel Core Ultra 9 285K
Intel Core Ultra 9 285K, NVIDIA GeForce RTX 4090
2369 Points +18%
AMD Ryzen 9 9950X3D
AMD Ryzen 9 9950X3D, NVIDIA GeForce RTX 4090
2085 Points +4%
Intel Core Ultra 9 285H
MSI Prestige 16 AI Evo B2HMG, Arc 140T
2050 Points +2%
Apple M4 Max (16 cores)
Apple MacBook Pro 16 M4 Max, M4 Max 40-Core GPU
2042 Points +1%
Intel Core Ultra 9 275HX
Asus Strix Scar 18 G835LX, GeForce RTX 5090 Laptop
2025 Points +1%
Intel Core i9-14900HX
MSI Raider 18 HX A14V, NVIDIA GeForce RTX 4080 Laptop GPU
2014 Points 0%
AMD Ryzen 9 9955HX
SCHENKER Neo 16 A25 5090 Engineering Sample, GeForce RTX 5090 Laptop
2014 Points
Intel Core i9-13900HK
Beelink GTI13 Ultra, Iris Xe G7 96EUs
2012 Points 0%
Apple M4 Pro (14 cores)
Apple MacBook Pro 16 2024 M4 Pro, M4 Pro 20-Core GPU
1980 Points -2%
AMD Ryzen 9 7945HX3D
Asus ROG Strix Scar 17 G733PYV-LL053X, NVIDIA GeForce RTX 4090 Laptop GPU
1948 Points -3%
AMD Ryzen 9 7945HX
Minisforum BD795i SE, Radeon 610M
1946 Points -3%
AMD Ryzen AI Max+ 395
Asus ROG Flow Z13 GZ302EA-RU073W, Radeon RX 8060S
1925 Points -4%
Intel Core i7-14700HX
Lenovo ThinkPad P16 Gen 2, NVIDIA RTX 4000 Ada Generation Laptop GPU
1862 Points -8%
Apple M3 Max 16-Core
Apple MacBook Pro 14 2023 M3 Max, M3 Max 40-Core GPU
1832 Points -9%
CrossMark / Creativity
AMD Ryzen 9 9950X3D
AMD Ryzen 9 9950X3D, NVIDIA GeForce RTX 4090
2987 Points +12%
AMD Ryzen AI Max+ 395
Asus ROG Flow Z13 GZ302EA-RU073W, Radeon RX 8060S
2949 Points +11%
Apple M4 Max (16 cores)
Apple MacBook Pro 16 M4 Max, M4 Max 40-Core GPU
2795 Points +5%
Intel Core Ultra 9 285K
Intel Core Ultra 9 285K, NVIDIA GeForce RTX 4090
2766 Points +4%
AMD Ryzen 9 9955HX
SCHENKER Neo 16 A25 5090 Engineering Sample, GeForce RTX 5090 Laptop
2661 Points
Intel Core Ultra 9 275HX
Asus Strix Scar 18 G835LX, GeForce RTX 5090 Laptop
2606 Points -2%
Apple M4 Pro (14 cores)
Apple MacBook Pro 16 2024 M4 Pro, M4 Pro 20-Core GPU
2590 Points -3%
Apple M3 Max 16-Core
Apple MacBook Pro 14 2023 M3 Max, M3 Max 40-Core GPU
2509 Points -6%
AMD Ryzen 9 7945HX3D
Asus ROG Strix Scar 17 G733PYV-LL053X, NVIDIA GeForce RTX 4090 Laptop GPU
2415 Points -9%
Intel Core i9-14900HX
MSI Raider 18 HX A14V, NVIDIA GeForce RTX 4080 Laptop GPU
2388 Points -10%
Intel Core Ultra 9 285H
MSI Prestige 16 AI Evo B2HMG, Arc 140T
2377 Points -11%
AMD Ryzen 9 7945HX
Minisforum BD795i SE, Radeon 610M
2363 Points -11%
Intel Core i7-14700HX
Lenovo ThinkPad P16 Gen 2, NVIDIA RTX 4000 Ada Generation Laptop GPU
2311 Points -13%
Intel Core i9-13900HK
Beelink GTI13 Ultra, Iris Xe G7 96EUs
2192 Points -18%
CrossMark / Responsiveness
Intel Core Ultra 9 285K
Intel Core Ultra 9 285K, NVIDIA GeForce RTX 4090
2351 Points +21%
Intel Core i9-13900HK
Beelink GTI13 Ultra, Iris Xe G7 96EUs
2097 Points +7%
Intel Core Ultra 9 285H
MSI Prestige 16 AI Evo B2HMG, Arc 140T
1981 Points +2%
AMD Ryzen 9 9955HX
SCHENKER Neo 16 A25 5090 Engineering Sample, GeForce RTX 5090 Laptop
1951 Points
AMD Ryzen 9 7945HX
Minisforum BD795i SE, Radeon 610M
1916 Points -2%
Intel Core i9-14900HX
MSI Raider 18 HX A14V, NVIDIA GeForce RTX 4080 Laptop GPU
1913 Points -2%
Intel Core Ultra 9 275HX
Asus Strix Scar 18 G835LX, GeForce RTX 5090 Laptop
1813 Points -7%
AMD Ryzen 9 9950X3D
AMD Ryzen 9 9950X3D, NVIDIA GeForce RTX 4090
1792 Points -8%
AMD Ryzen AI Max+ 395
Asus ROG Flow Z13 GZ302EA-RU073W, Radeon RX 8060S
1719 Points -12%
Intel Core i7-14700HX
Lenovo ThinkPad P16 Gen 2, NVIDIA RTX 4000 Ada Generation Laptop GPU
1666 Points -15%
AMD Ryzen 9 7945HX3D
Asus ROG Strix Scar 17 G733PYV-LL053X, NVIDIA GeForce RTX 4090 Laptop GPU
1649 Points -15%
Apple M4 Max (16 cores)
Apple MacBook Pro 16 M4 Max, M4 Max 40-Core GPU
1595 Points -18%
Apple M4 Pro (14 cores)
Apple MacBook Pro 16 2024 M4 Pro, M4 Pro 20-Core GPU
1566 Points -20%
Apple M3 Max 16-Core
Apple MacBook Pro 14 2023 M3 Max, M3 Max 40-Core GPU
1474 Points -24%
3DMark / Time Spy CPU
Intel Core Ultra 9 285K
Intel Core Ultra 9 285K, NVIDIA GeForce RTX 4090
18322 Points +39%
Intel Core i9-14900HX
MSI Raider 18 HX A14V, NVIDIA GeForce RTX 4080 Laptop GPU
17547 Points +33%
Intel Core Ultra 9 275HX
Asus Strix Scar 18 G835LX, GeForce RTX 5090 Laptop
17285 Points +31%
AMD Ryzen 9 9950X3D
AMD Ryzen 9 9950X3D, NVIDIA GeForce RTX 4090
16950 Points +29%
Intel Core i7-14700HX
Lenovo ThinkPad P16 Gen 2, NVIDIA RTX 4000 Ada Generation Laptop GPU
14526 Points +10%
AMD Ryzen 9 7945HX3D
Asus ROG Strix Scar 17 G733PYV-LL053X, NVIDIA GeForce RTX 4090 Laptop GPU
14131 Points +7%
AMD Ryzen 9 9955HX
SCHENKER Neo 16 A25 5090 Engineering Sample, GeForce RTX 5090 Laptop
13188 Points
Intel Core Ultra 9 285H
MSI Prestige 16 AI Evo B2HMG, Arc 140T
11650 Points -12%
Intel Core i9-13900HK
Beelink GTI13 Ultra, Iris Xe G7 96EUs
11314 Points -14%
AMD Ryzen AI Max+ 395
Asus ROG Flow Z13 GZ302EA-RU073W, Radeon RX 8060S
11285 Points -14%
3DMark / Fire Strike Physics
Intel Core Ultra 9 285K
Intel Core Ultra 9 285K, NVIDIA GeForce RTX 4090
53541 Points +25%
AMD Ryzen 9 9950X3D
AMD Ryzen 9 9950X3D, NVIDIA GeForce RTX 4090
49235 Points +15%
Intel Core Ultra 9 275HX
Asus Strix Scar 18 G835LX, GeForce RTX 5090 Laptop
48219 Points +12%
AMD Ryzen 9 9955HX
SCHENKER Neo 16 A25 5090 Engineering Sample, GeForce RTX 5090 Laptop
42890 Points
Intel Core i9-14900HX
MSI Raider 18 HX A14V, NVIDIA GeForce RTX 4080 Laptop GPU
41396 Points -3%
AMD Ryzen 9 7945HX3D
Asus ROG Strix Scar 17 G733PYV-LL053X, NVIDIA GeForce RTX 4090 Laptop GPU
38826 Points -9%
AMD Ryzen 9 7945HX
Minisforum BD795i SE, Radeon 610M
38792 Points -10%
AMD Ryzen AI Max+ 395
Asus ROG Flow Z13 GZ302EA-RU073W, Radeon RX 8060S
38075 Points -11%
Intel Core Ultra 9 285H
MSI Prestige 16 AI Evo B2HMG, Arc 140T
35044 Points -18%
Intel Core i7-14700HX
Lenovo ThinkPad P16 Gen 2, NVIDIA RTX 4000 Ada Generation Laptop GPU
30534 Points -29%
Intel Core i9-13900HK
Beelink GTI13 Ultra, Iris Xe G7 96EUs
26486 Points -38%

Prestanda för spel

Nu kommer vi till spelprestandan. Vi tog ett antal aktuella titlar och testade dem, även om vi inte använde uppskalningsteknik i varje fall, eftersom vi ville se CPU: ns inflytande.

Vi har medvetet hållit jämförelsegruppen liten här och bara jämfört de två nuvarande testpersonerna och ROG Strix Scar 17som var bland de snabbaste bärbara speldatorerna i den senaste generationen tack vare HX3D-processorn.

I alla tester ligger AMD Ryzen 9 9955HX före Core Ultra 9 275HX och den genomsnittliga fördelen är 5%. Den gamla Strix Scar med Ryzen 9 7945HX3D och RTX 4090 bärbar GPU klarar sig förvånansvärt bra och ligger till och med före i vissa titlar.

1080p Performance Rating - Percent
AMD Ryzen 9 9955HX
SCHENKER Neo 16 A25 5090 Engineering Sample, Nvidia GeForce RTX 5090 Laptop
99.7 pt
Intel Core Ultra 9 275HX
Asus Strix Scar 18 G835LX, Nvidia GeForce RTX 5090 Laptop
95.4 pt
AMD Ryzen 9 7945HX3D
Asus ROG Strix Scar 17 G733PYV-LL053X, NVIDIA GeForce RTX 4090 Laptop GPU
92.7 pt
Cyberpunk 2077 2.2 Phantom Liberty - 1920x1080 Ultra Preset (FSR off)
AMD Ryzen 9 7945HX3D
Asus ROG Strix Scar 17 G733PYV-LL053X, NVIDIA GeForce RTX 4090 Laptop GPU
158 (123.9min - 206max) fps +1%
AMD Ryzen 9 9955HX
SCHENKER Neo 16 A25 5090 Engineering Sample, Nvidia GeForce RTX 5090 Laptop
157 (116.5min - 208max) fps
Intel Core Ultra 9 275HX
Asus Strix Scar 18 G835LX, Nvidia GeForce RTX 5090 Laptop
154.9 (126.3min - 196max) fps -1%
F1 24 - 1920x1080 Ultra High Preset AA:T AF:16x
AMD Ryzen 9 9955HX
SCHENKER Neo 16 A25 5090 Engineering Sample, Nvidia GeForce RTX 5090 Laptop
158.3 (73min, 93P1 - 189max) fps
Intel Core Ultra 9 275HX
Asus Strix Scar 18 G835LX, Nvidia GeForce RTX 5090 Laptop
148 fps -7%
AMD Ryzen 9 7945HX3D
Asus ROG Strix Scar 17 G733PYV-LL053X, NVIDIA GeForce RTX 4090 Laptop GPU
144.9 (85min, 92P1 - 172max) fps -8%
Assassin's Creed Shadows - 1920x1080 Ultra High
AMD Ryzen 9 9955HX
SCHENKER Neo 16 A25 5090 Engineering Sample, Nvidia GeForce RTX 5090 Laptop
74 fps
Intel Core Ultra 9 275HX
Asus Strix Scar 18 G835LX, Nvidia GeForce RTX 5090 Laptop
65 fps -12%
AMD Ryzen 9 7945HX3D
Asus ROG Strix Scar 17 G733PYV-LL053X, NVIDIA GeForce RTX 4090 Laptop GPU
55 fps -26%
Call of Duty Black Ops 6 - 1920x1080 Extreme Preset
AMD Ryzen 9 7945HX3D
Asus ROG Strix Scar 17 G733PYV-LL053X, NVIDIA GeForce RTX 4090 Laptop GPU
150 fps +2%
AMD Ryzen 9 9955HX
SCHENKER Neo 16 A25 5090 Engineering Sample, Nvidia GeForce RTX 5090 Laptop
147 fps
Intel Core Ultra 9 275HX
Asus Strix Scar 18 G835LX, Nvidia GeForce RTX 5090 Laptop
147 fps 0%
Monster Hunter Wilds - 1920x1080 ultra, RT: high, no upscaling
AMD Ryzen 9 9955HX
SCHENKER Neo 16 A25 5090 Engineering Sample, Nvidia GeForce RTX 5090 Laptop
89 fps
Intel Core Ultra 9 275HX
Asus Strix Scar 18 G835LX, Nvidia GeForce RTX 5090 Laptop
87.6 fps -2%
AMD Ryzen 9 7945HX3D
Asus ROG Strix Scar 17 G733PYV-LL053X, NVIDIA GeForce RTX 4090 Laptop GPU
85.6 fps -4%
Indiana Jones and the Great Circle - 1920x1080 Very Ultra Preset
AMD Ryzen 9 9955HX
SCHENKER Neo 16 A25 5090 Engineering Sample, Nvidia GeForce RTX 5090 Laptop
130.6 fps
AMD Ryzen 9 7945HX3D
Asus ROG Strix Scar 17 G733PYV-LL053X, NVIDIA GeForce RTX 4090 Laptop GPU
128.4 fps -2%
Intel Core Ultra 9 275HX
Asus Strix Scar 18 G835LX, Nvidia GeForce RTX 5090 Laptop
127.9 fps -2%
Baldur's Gate 3 - 1920x1080 Ultra Preset
AMD Ryzen 9 9955HX
SCHENKER Neo 16 A25 5090 Engineering Sample, Nvidia GeForce RTX 5090 Laptop
202 fps
Intel Core Ultra 9 275HX
Asus Strix Scar 18 G835LX, Nvidia GeForce RTX 5090 Laptop
193.7 fps -4%
AMD Ryzen 9 7945HX3D
Asus ROG Strix Scar 17 G733PYV-LL053X, NVIDIA GeForce RTX 4090 Laptop GPU
178.8 fps -11%
Alan Wake 2 - 1920x1080 High Preset
AMD Ryzen 9 9955HX
SCHENKER Neo 16 A25 5090 Engineering Sample, Nvidia GeForce RTX 5090 Laptop
124.7 fps
Intel Core Ultra 9 275HX
Asus Strix Scar 18 G835LX, Nvidia GeForce RTX 5090 Laptop
116.4 fps -7%
AMD Ryzen 9 7945HX3D
Asus ROG Strix Scar 17 G733PYV-LL053X, NVIDIA GeForce RTX 4090 Laptop GPU
116.1 fps -7%

I QHD-upplösning ligger Ryzen 9 9955HX fortfarande före Core Ultra 9 275HX i varje spel, och skillnaden är återigen runt 5 %. Det gamla Strix Scar 17 fortsätter att hålla ställningarna men måste ge upp lite mer mark till det nya 2025 Scar 18.

QHD Performance Rating - Percent
AMD Ryzen 9 9955HX
SCHENKER Neo 16 A25 5090 Engineering Sample, Nvidia GeForce RTX 5090 Laptop
100 pt
Intel Core Ultra 9 275HX
Asus Strix Scar 18 G835LX, Nvidia GeForce RTX 5090 Laptop
94.5 pt
AMD Ryzen 9 7945HX3D
Asus ROG Strix Scar 17 G733PYV-LL053X, NVIDIA GeForce RTX 4090 Laptop GPU
91 pt
Cyberpunk 2077 2.2 Phantom Liberty - 2560x1440 Ultra Preset (FSR off)
AMD Ryzen 9 9955HX
SCHENKER Neo 16 A25 5090 Engineering Sample, Nvidia GeForce RTX 5090 Laptop
110.6 (91.2min - 141.1max) fps
Intel Core Ultra 9 275HX
Asus Strix Scar 18 G835LX, Nvidia GeForce RTX 5090 Laptop
106.8 (87.4min - 135.4max) fps -3%
AMD Ryzen 9 7945HX3D
Asus ROG Strix Scar 17 G733PYV-LL053X, NVIDIA GeForce RTX 4090 Laptop GPU
99.5 (80.5min - 128.2max) fps -10%
F1 24 - 2560x1440 Ultra High Preset AA:T AF:16x
AMD Ryzen 9 9955HX
SCHENKER Neo 16 A25 5090 Engineering Sample, Nvidia GeForce RTX 5090 Laptop
105.5 (73min, 83P1 - 126max) fps
Intel Core Ultra 9 275HX
Asus Strix Scar 18 G835LX, Nvidia GeForce RTX 5090 Laptop
100 fps -5%
AMD Ryzen 9 7945HX3D
Asus ROG Strix Scar 17 G733PYV-LL053X, NVIDIA GeForce RTX 4090 Laptop GPU
96.8 (79min, 78P1 - 118max) fps -8%
Assassin's Creed Shadows - 2560x1440 Ultra High
AMD Ryzen 9 9955HX
SCHENKER Neo 16 A25 5090 Engineering Sample, Nvidia GeForce RTX 5090 Laptop
59 fps
Intel Core Ultra 9 275HX
Asus Strix Scar 18 G835LX, Nvidia GeForce RTX 5090 Laptop
51 fps -14%
AMD Ryzen 9 7945HX3D
Asus ROG Strix Scar 17 G733PYV-LL053X, NVIDIA GeForce RTX 4090 Laptop GPU
47 fps -20%
Call of Duty Black Ops 6 - 2560x1440 Extreme Preset
AMD Ryzen 9 9955HX
SCHENKER Neo 16 A25 5090 Engineering Sample, Nvidia GeForce RTX 5090 Laptop
123 fps
AMD Ryzen 9 7945HX3D
Asus ROG Strix Scar 17 G733PYV-LL053X, NVIDIA GeForce RTX 4090 Laptop GPU
119 fps -3%
Intel Core Ultra 9 275HX
Asus Strix Scar 18 G835LX, Nvidia GeForce RTX 5090 Laptop
117 fps -5%
Monster Hunter Wilds - 2560x1440 ultra, RT: high, no upscaling
AMD Ryzen 9 9955HX
SCHENKER Neo 16 A25 5090 Engineering Sample, Nvidia GeForce RTX 5090 Laptop
75 fps
Intel Core Ultra 9 275HX
Asus Strix Scar 18 G835LX, Nvidia GeForce RTX 5090 Laptop
72 fps -4%
AMD Ryzen 9 7945HX3D
Asus ROG Strix Scar 17 G733PYV-LL053X, NVIDIA GeForce RTX 4090 Laptop GPU
69.4 fps -7%
Indiana Jones and the Great Circle - 2560x1440 Very Ultra Preset
AMD Ryzen 9 9955HX
SCHENKER Neo 16 A25 5090 Engineering Sample, Nvidia GeForce RTX 5090 Laptop
105 fps
Intel Core Ultra 9 275HX
Asus Strix Scar 18 G835LX, Nvidia GeForce RTX 5090 Laptop
102.2 fps -3%
AMD Ryzen 9 7945HX3D
Asus ROG Strix Scar 17 G733PYV-LL053X, NVIDIA GeForce RTX 4090 Laptop GPU
100.5 fps -4%
Baldur's Gate 3 - 2560x1440 Ultra Preset
AMD Ryzen 9 9955HX
SCHENKER Neo 16 A25 5090 Engineering Sample, Nvidia GeForce RTX 5090 Laptop
150.5 fps
Intel Core Ultra 9 275HX
Asus Strix Scar 18 G835LX, Nvidia GeForce RTX 5090 Laptop
145.6 fps -3%
AMD Ryzen 9 7945HX3D
Asus ROG Strix Scar 17 G733PYV-LL053X, NVIDIA GeForce RTX 4090 Laptop GPU
133.3 fps -11%
Alan Wake 2 - 2560x1440 High Preset
AMD Ryzen 9 9955HX
SCHENKER Neo 16 A25 5090 Engineering Sample, Nvidia GeForce RTX 5090 Laptop
88.3 fps
Intel Core Ultra 9 275HX
Asus Strix Scar 18 G835LX, Nvidia GeForce RTX 5090 Laptop
82.4 fps -7%
AMD Ryzen 9 7945HX3D
Asus ROG Strix Scar 17 G733PYV-LL053X, NVIDIA GeForce RTX 4090 Laptop GPU
82 fps -7%

Vid 4K-upplösning minskar processorns inflytande ytterligare och skillnaden mellan AMD- och Intel-chip blir mindre, även om AMD lyckas med små ledningar i varje spel.

Strix Scar 17 hamnar nu tydligare på efterkälken här, men det beror på den äldre RTX 4090 Laptop GPU.

4K Performance Rating - Percent
AMD Ryzen 9 9955HX
SCHENKER Neo 16 A25 5090 Engineering Sample, Nvidia GeForce RTX 5090 Laptop
100 pt
Intel Core Ultra 9 275HX
Asus Strix Scar 18 G835LX, Nvidia GeForce RTX 5090 Laptop
96.3 pt
AMD Ryzen 9 7945HX3D
Asus ROG Strix Scar 17 G733PYV-LL053X, NVIDIA GeForce RTX 4090 Laptop GPU
88.9 pt
F1 24 - 3840x2160 Ultra High Preset AA:T AF:16x
AMD Ryzen 9 9955HX
SCHENKER Neo 16 A25 5090 Engineering Sample, Nvidia GeForce RTX 5090 Laptop
54.2 (45min, 45P1 - 65max) fps
Intel Core Ultra 9 275HX
Asus Strix Scar 18 G835LX, Nvidia GeForce RTX 5090 Laptop
52 fps -4%
AMD Ryzen 9 7945HX3D
Asus ROG Strix Scar 17 G733PYV-LL053X, NVIDIA GeForce RTX 4090 Laptop GPU
48.4 (41min, 40P1 - 59max) fps -11%
Assassin's Creed Shadows - 3840x2160 Ultra High
AMD Ryzen 9 9955HX
SCHENKER Neo 16 A25 5090 Engineering Sample, Nvidia GeForce RTX 5090 Laptop
39 fps
Intel Core Ultra 9 275HX
Asus Strix Scar 18 G835LX, Nvidia GeForce RTX 5090 Laptop
36 fps -8%
AMD Ryzen 9 7945HX3D
Asus ROG Strix Scar 17 G733PYV-LL053X, NVIDIA GeForce RTX 4090 Laptop GPU
34 fps -13%
Call of Duty Black Ops 6 - 3840x2160 Extreme Preset
AMD Ryzen 9 9955HX
SCHENKER Neo 16 A25 5090 Engineering Sample, Nvidia GeForce RTX 5090 Laptop
82 fps
Intel Core Ultra 9 275HX
Asus Strix Scar 18 G835LX, Nvidia GeForce RTX 5090 Laptop
79 fps -4%
AMD Ryzen 9 7945HX3D
Asus ROG Strix Scar 17 G733PYV-LL053X, NVIDIA GeForce RTX 4090 Laptop GPU
76 fps -7%
Monster Hunter Wilds - 3840x2160 ultra, RT: high, no upscaling
AMD Ryzen 9 9955HX
SCHENKER Neo 16 A25 5090 Engineering Sample, Nvidia GeForce RTX 5090 Laptop
48.5 fps
Intel Core Ultra 9 275HX
Asus Strix Scar 18 G835LX, Nvidia GeForce RTX 5090 Laptop
46.3 fps -5%
AMD Ryzen 9 7945HX3D
Asus ROG Strix Scar 17 G733PYV-LL053X, NVIDIA GeForce RTX 4090 Laptop GPU
42.8 fps -12%
Indiana Jones and the Great Circle - 3840x2160 Very Ultra Preset
AMD Ryzen 9 9955HX
SCHENKER Neo 16 A25 5090 Engineering Sample, Nvidia GeForce RTX 5090 Laptop
66.6 fps
Intel Core Ultra 9 275HX
Asus Strix Scar 18 G835LX, Nvidia GeForce RTX 5090 Laptop
65 fps -2%
AMD Ryzen 9 7945HX3D
Asus ROG Strix Scar 17 G733PYV-LL053X, NVIDIA GeForce RTX 4090 Laptop GPU
60.6 fps -9%
Baldur's Gate 3 - 3840x2160 Ultra Preset
AMD Ryzen 9 9955HX
SCHENKER Neo 16 A25 5090 Engineering Sample, Nvidia GeForce RTX 5090 Laptop
84.3 fps
Intel Core Ultra 9 275HX
Asus Strix Scar 18 G835LX, Nvidia GeForce RTX 5090 Laptop
82.8 fps -2%
AMD Ryzen 9 7945HX3D
Asus ROG Strix Scar 17 G733PYV-LL053X, NVIDIA GeForce RTX 4090 Laptop GPU
74.6 fps -12%
Alan Wake 2 - 3840x2160 High Preset
AMD Ryzen 9 9955HX
SCHENKER Neo 16 A25 5090 Engineering Sample, Nvidia GeForce RTX 5090 Laptop
47.7 fps
Intel Core Ultra 9 275HX
Asus Strix Scar 18 G835LX, Nvidia GeForce RTX 5090 Laptop
46 fps -4%
AMD Ryzen 9 7945HX3D
Asus ROG Strix Scar 17 G733PYV-LL053X, NVIDIA GeForce RTX 4090 Laptop GPU
43.4 fps -9%
Cyberpunk 2077 2.2 Phantom Liberty - 3840x2160 Ultra Preset (FSR off)
AMD Ryzen 9 9955HX
SCHENKER Neo 16 A25 5090 Engineering Sample, Nvidia GeForce RTX 5090 Laptop
52.9 (42.8min - 66.9max) fps
Intel Core Ultra 9 275HX
Asus Strix Scar 18 G835LX, Nvidia GeForce RTX 5090 Laptop
52.1 (43.9min - 64.8max) fps -2%
AMD Ryzen 9 7945HX3D
Asus ROG Strix Scar 17 G733PYV-LL053X, NVIDIA GeForce RTX 4090 Laptop GPU
44.2 (37min - 55max) fps -16%

Prestanda med olika effektgränser

Vi testade även prestandan hos de två nya processorerna vid fasta effektgränser. Här kan du se att Core Ultra 9 275HX levererar bra prestanda även vid lägre TDP-värden och kan överträffa Ryzen 9 9955HX, men bara i Cinebench 2024.

I den äldre Cinebench R23 ligger AMD före upp till 100 W men hamnar sedan på efterkälken ganska rejält.

Cinebench 2024 Multi
TDP AMD Ryzen 9 9955HX Core Ultra 9 275HX Core i9-14900HX
150 watt 2.061 poäng 2.158 poäng 1.834 poäng
130 watt 2.030 poäng 2.095 poäng 1.757 poäng
115 watt 2,008 poäng 2,015 poäng 1,525 poäng
100 Watt 1,948 poäng 1,963 poäng 1,424 poäng
80 Watt 1,809 poäng 1,875 poäng 1,373 poäng
55 Watt 1,489 poäng 1,633 poäng 1,105 poäng
Cinebench R23 Multi
TDP AMD Ryzen 9 9955HX Core Ultra 9 275HX Ryzen 9 7945HX3D Ryzen 9 7945HX Core i9-14900HX
150 watt 39,537 poäng 38,108 poäng 30,308 poäng
130 watt 38,502 poäng 36,165 poäng 34,202 poäng 28,933
115 watt 37,157 poäng 34,760 poäng 33,361 poäng 27,750
100 watt 35,500 poäng 33,670 poäng 32,977 poäng 32,947 poäng 26,232 poäng
80 watt 31,641 poäng 31,880 poäng 30,804 poäng 30,907 poäng 23,334 poäng
55 Watt 23,849 poäng 27,283 poäng 26,045 poäng 18,258 poäng

Slutsats: AMD har den snabbaste spel-CPU:n för bärbara datorer i väntan på Ryzen 9 9955HX3D:s ankomst

De två nya high-end mobilprocessorerna från AMD och Intel bjuder inte på några överraskningar och är snabbare än sina respektive föregångare i både single-core och multi-core tester. Intel har också en liten fördel i de syntetiska Cinebench-testerna, men det kan inte replikera detta i Geekbench eller systembenchmarks.

I spel är vinnaren ganska uppenbar eftersom med den identiska Nvidia GeForce RTX 5090 Laptop GPU (detaljerad analys här), AMD-processorn kommer ut något snabbare i alla spel vi testade.

Detta ökar preferensen för den kommande Ryzen 9 9955HX3D, som återigen bör leverera betydligt bättre spelprestanda. Vi förväntar oss dock inte att se testenheter med HX3D-chipet på några veckor, och vi kan bara hoppas att tillgängligheten av HX3D-processorn kommer att vara bättre i den här generationen.

Please share our article, every link counts!
Mail Logo
> Bärbara datorer, laptops - tester och nyheter > Tester > AMD Ryzen 9 9955HX vs. Intel Core Ultra 9 275HX Analys: Kampen om den snabbaste gaming-CPU:n
Andreas Osthoff, 2025-04- 7 (Update: 2025-04- 7)