

Dell Latitude 7030 Rugged Extreme recension: Robust surfplatta med fulla sRGB-färger

Latitude 7030 Rugged Extreme är den första surfplattan som kickstartar Dells 10-tums Rugged Extreme-serie. Den kompletterar de befintliga 12-tums Latitude 72xx och 13-tums Latitude 73xx Rugged Extreme-serierna, men med en mindre skärmstorlek för förbättrad mobilitet.
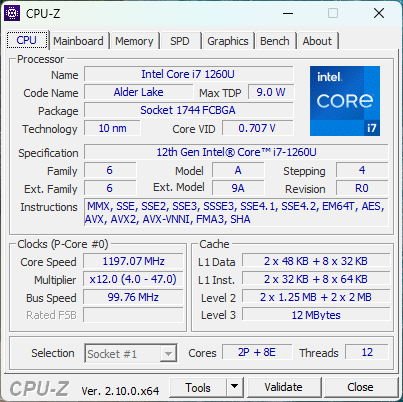
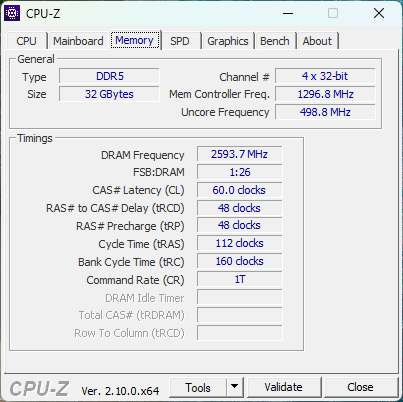
Vår testenhet är en avancerad konfiguration med vPro Core i7-1260U CPU och 32 GB LPDDR5 RAM för strax över $ 3000. Mindre SKU: er börjar med Core i3-1210U parat med mindre lagring och RAM, men alla alternativ levereras med samma 1200p IPS-pekskärm.
Alternativen inkluderar andra fälttestade modeller som Durabook R8 eller Acer Enduro Urban.
Fler recensioner av Dell:
Potentiella konkurrenter i jämförelse
Gradering | Version | Datum | Modell | Vikt | Höjd | Storlek | Upplösning | Pris |
|---|---|---|---|---|---|---|---|---|
| 82.3 % | v8 | 09/2024 | Dell Latitude 7030 Rugged Extreme i7-1260U, Iris Xe G7 96EUs | 1.1 kg | 25.4 mm | 10.00" | 1920x1200 | |
| 83.3 % | v8 | 09/2024 | Dell Latitude 7350 Detachable Ultra 7 164U, Graphics 4-Core | 865 g | 8.9 mm | 13.00" | 2880x1920 | |
| 83.9 % v7 (old) | v7 (old) | 04/2023 | Dell Latitude 7230 Rugged Extreme i5-1240U, Iris Xe G7 80EUs | 1.6 kg | 23.9 mm | 12.00" | 1920x1200 | |
| 79.6 % v7 (old) | v7 (old) | 07/2023 | Durabook R8 Tablet i5-1230U, Iris Xe G7 80EUs | 856 g | 20.6 mm | 8.00" | 1280x800 | |
| 82.4 % v7 (old) | v7 (old) | 12/2021 | Acer Enduro Urban N3 EUN314 i7-1165G7, Iris Xe G7 96EUs | 1.8 kg | 21.95 mm | 14.00" | 1920x1080 | |
v (old) | 05/2022 | Dell Latitude 7330 Rugged Extreme i7-1185G7, Iris Xe G7 96EUs | 2.7 kg | 36.5 mm | 13.30" | 1920x1080 |
Obs: Vi har nyligen uppdaterat vårt betygssystem och resultaten från version 8 är inte jämförbara med resultaten från version 7. Mer information finns tillgänglig här .
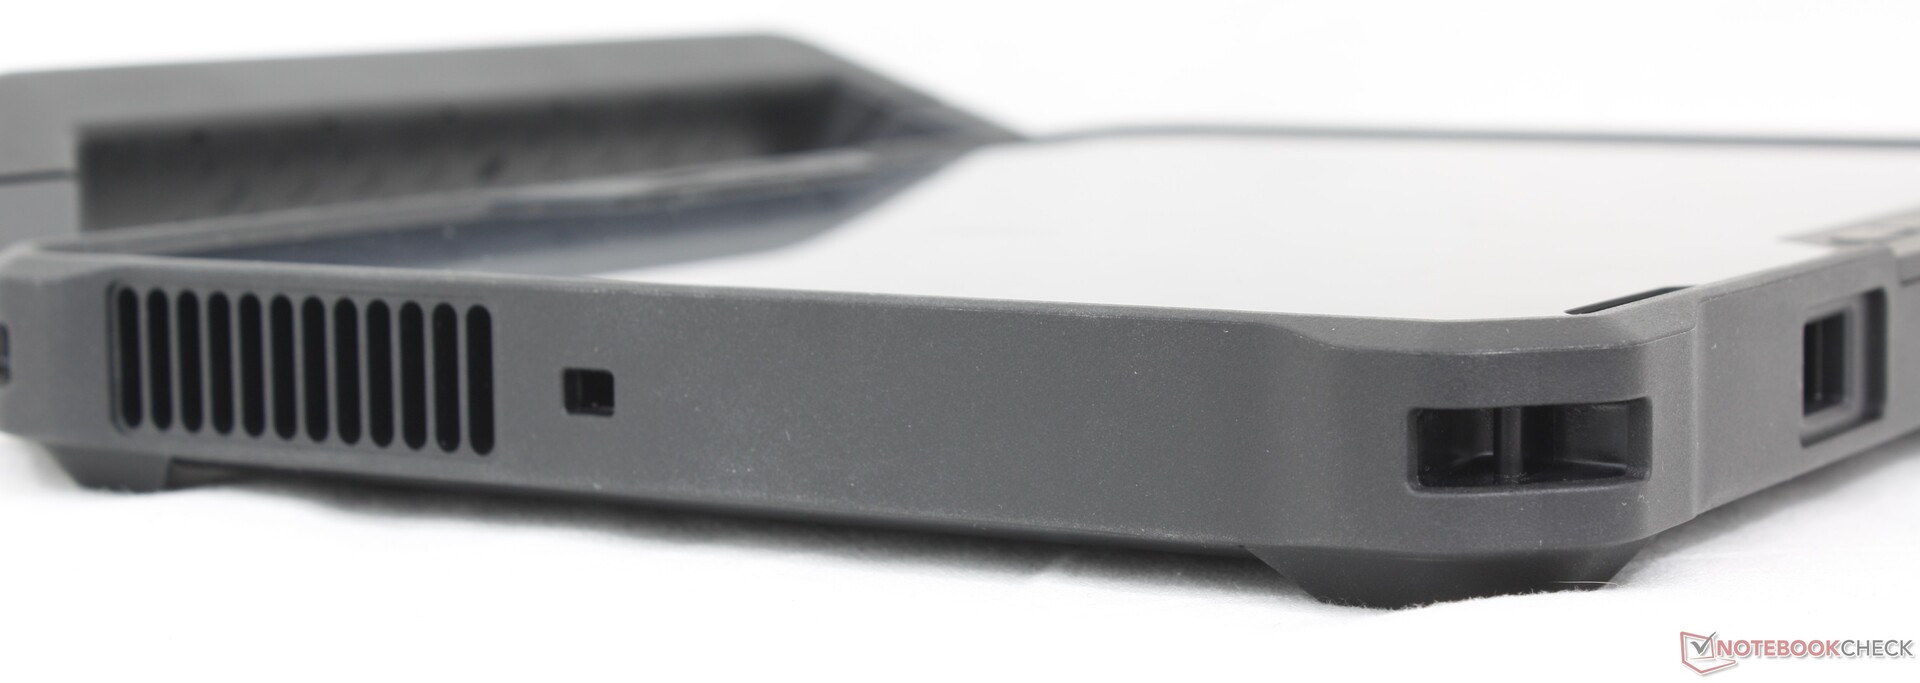
Fodral - MIL-STD-810H-certifierat
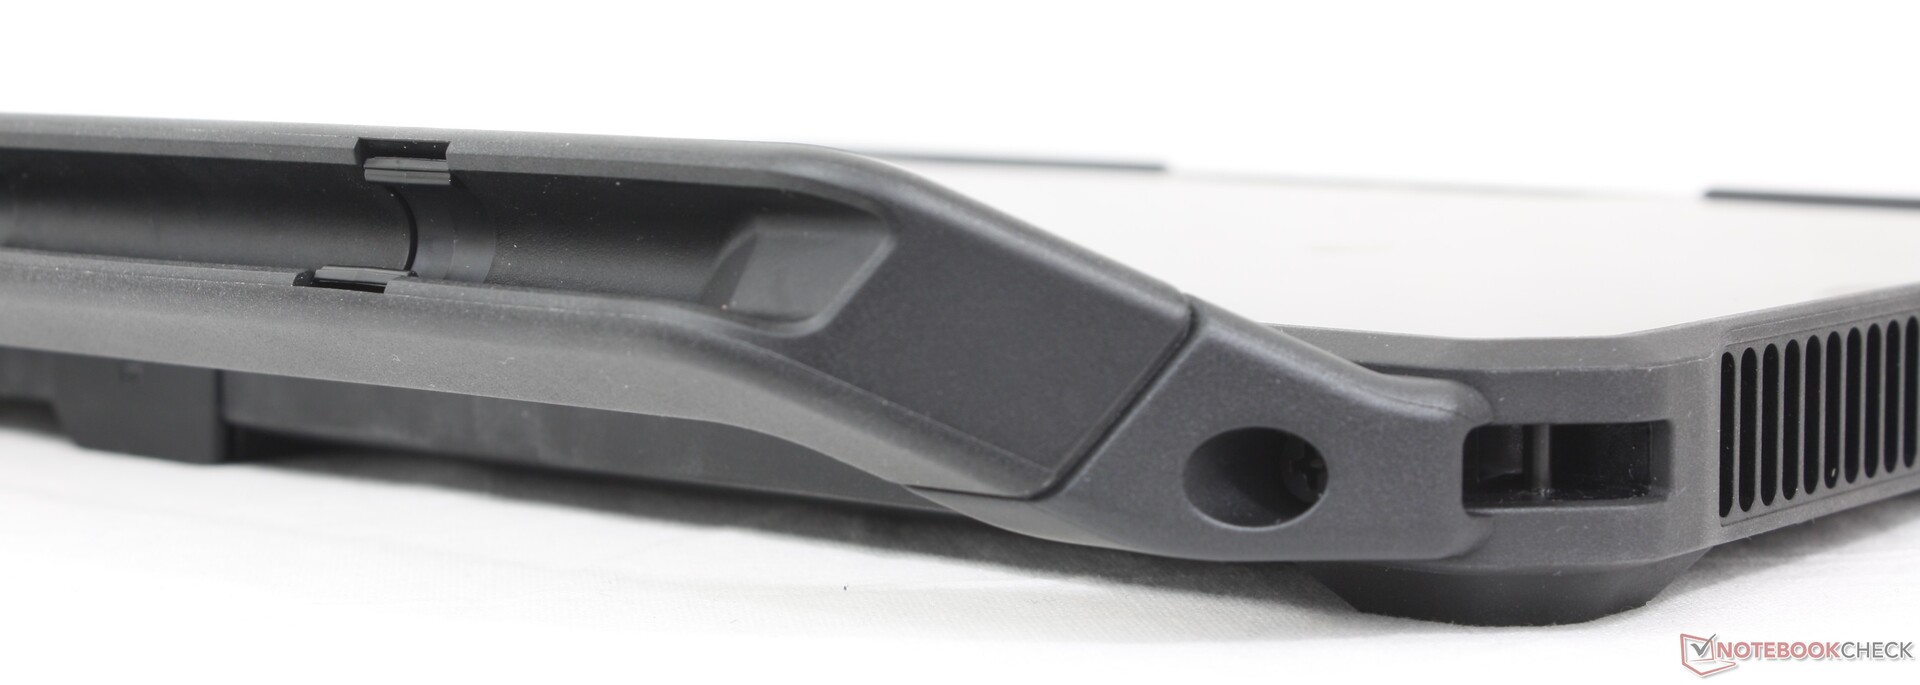
Chassit består av plastharts och termoplastisk elastomer (TPE). Chassits styvhet är utmärkt och det förekommer absolut inga skevheter eller knarr när man försöker böja eller trycka på dess ytor. Det är dock märkbart topptungt när det avtagbara tangentbordet är anslutet; hela enheten kommer att välta i bärbart läge när gångjärnen öppnas till 130 grader eller mer.
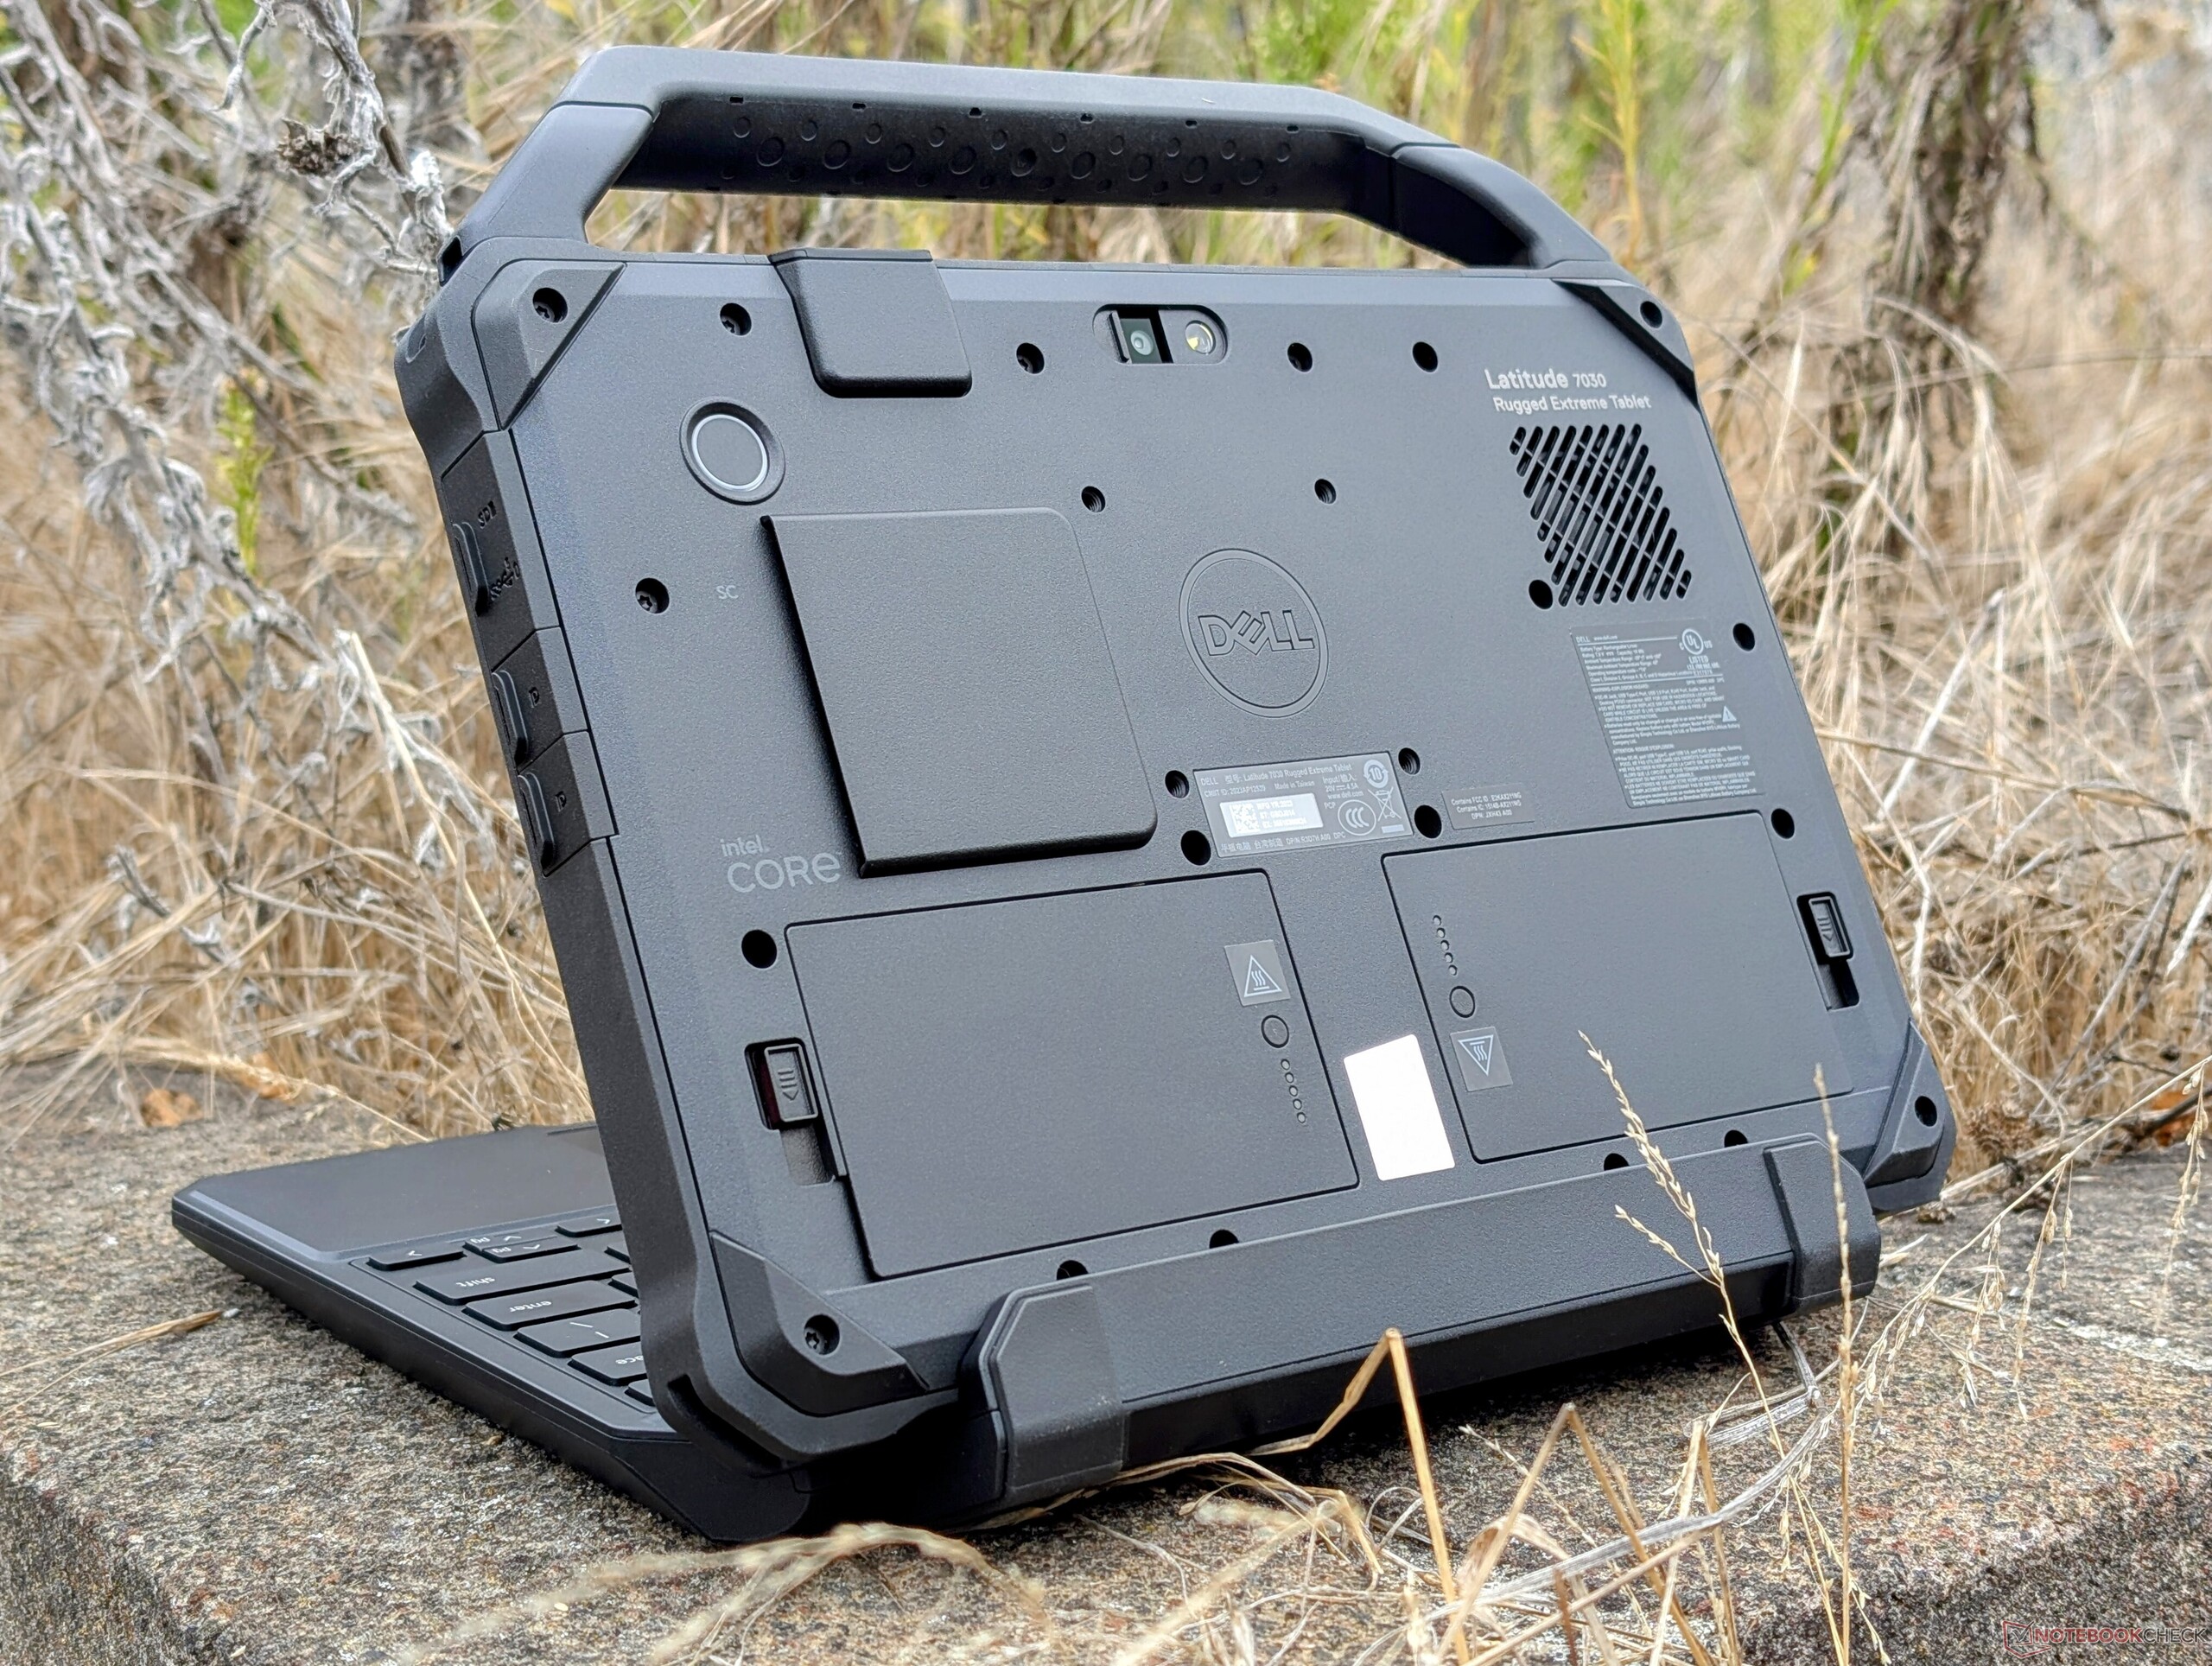
Modellen är relativt tjock, drygt 25 mm, vilket är tjockare än till och med den större 12-tums Latitude 7230 Rugged Extreme. Lyckligtvis är vikten hanterbar på 1,1 kg, vilket är något lättare än den populära XPS 13.
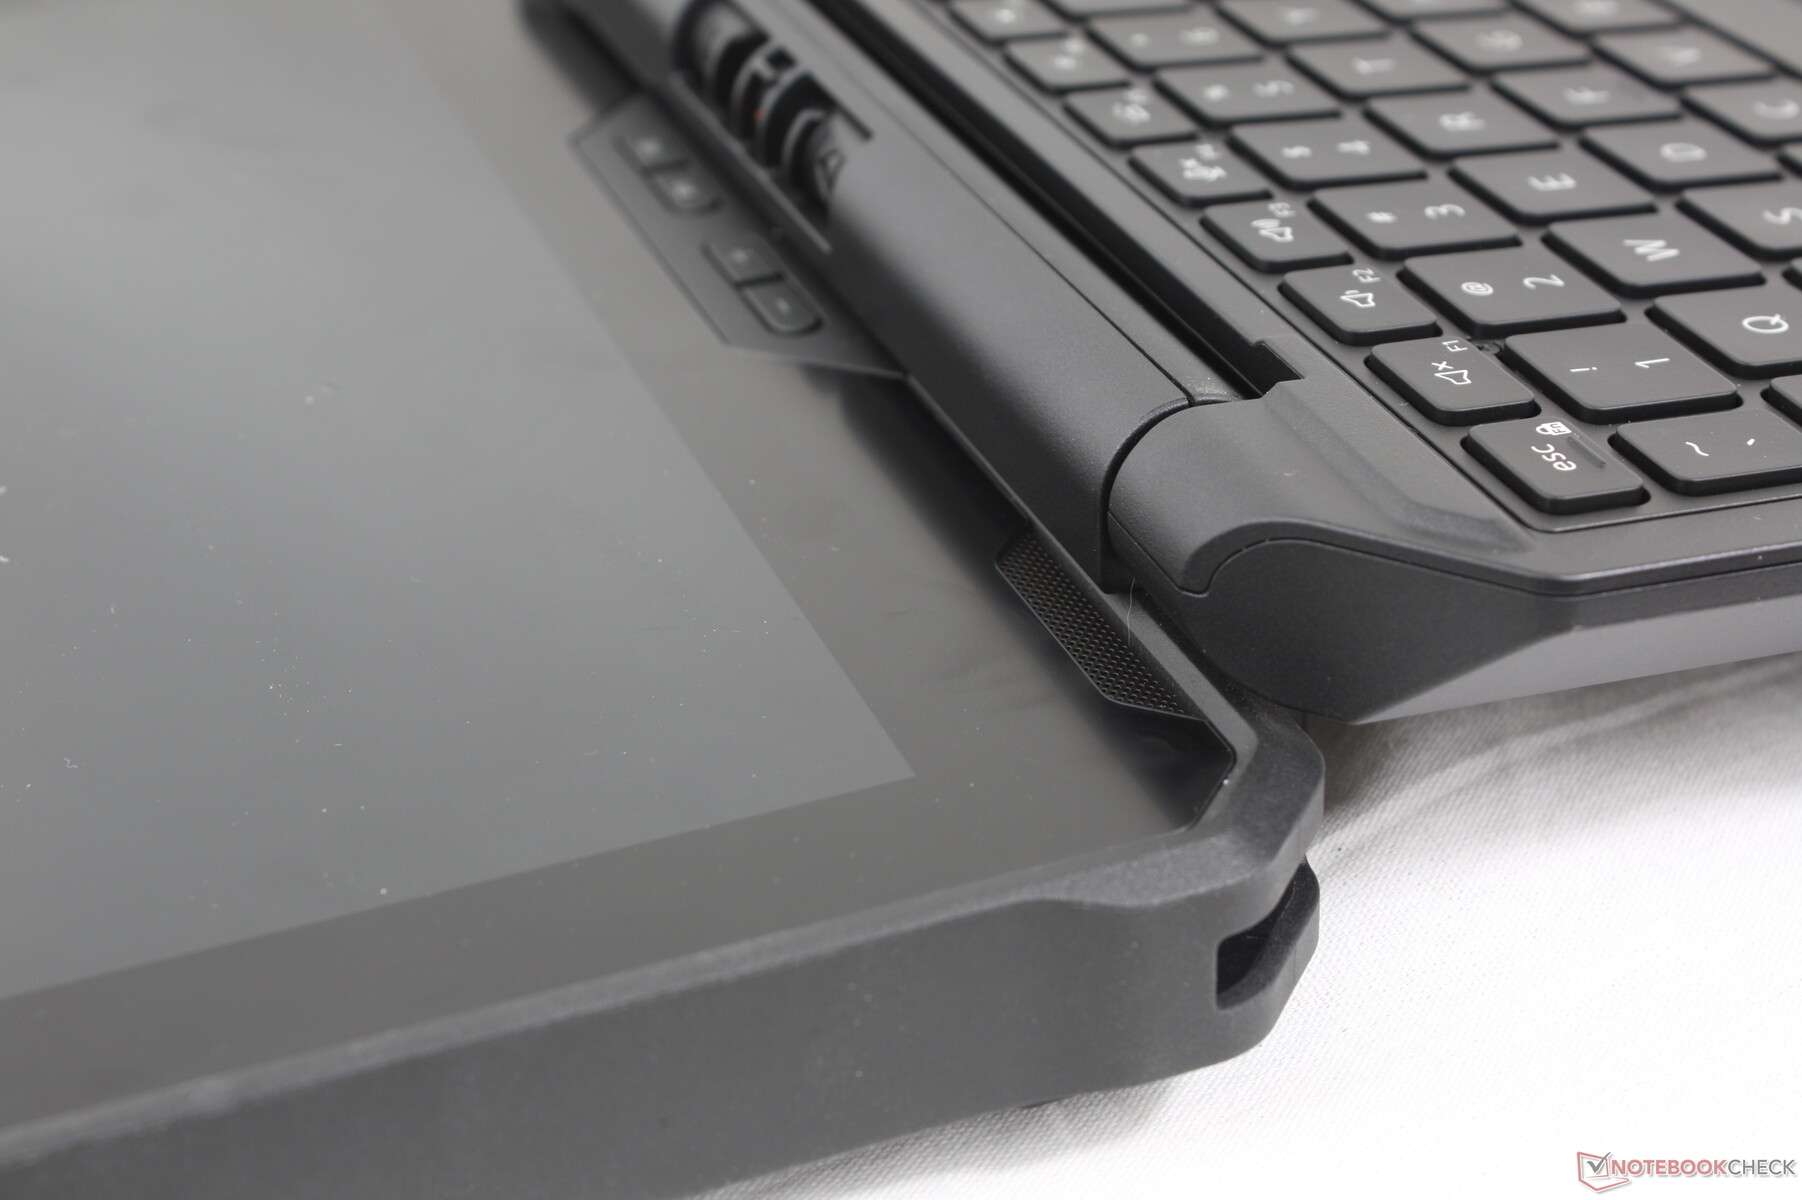
Tjockleken och vikten ökar avsevärt när tangentbordet är anslutet, vilket framgår av tabellen nedan. Med nästan 2 kg är den kombinerade vikten ungefär lika tung som vissa 16-tums bärbara speldatorer. Tangentbordet i sig är ganska stort på grund av dess styva gångjärn och vinklade bas för att förbättra ergonomin. Det är synd att det inte lägger till några ytterligare funktioner som extra portar eller hjälpknappar.
| Latitude 7030 Robust extrem | Surfplatta | Avtagbart tangentbord | Surfplatta + löstagbart tangentbord |
| Tjocklek (mm) | 25.4 | 47 (stängd) | 47 (stängd) |
| Vikt (g) | 1148 | 802 | 1950 |


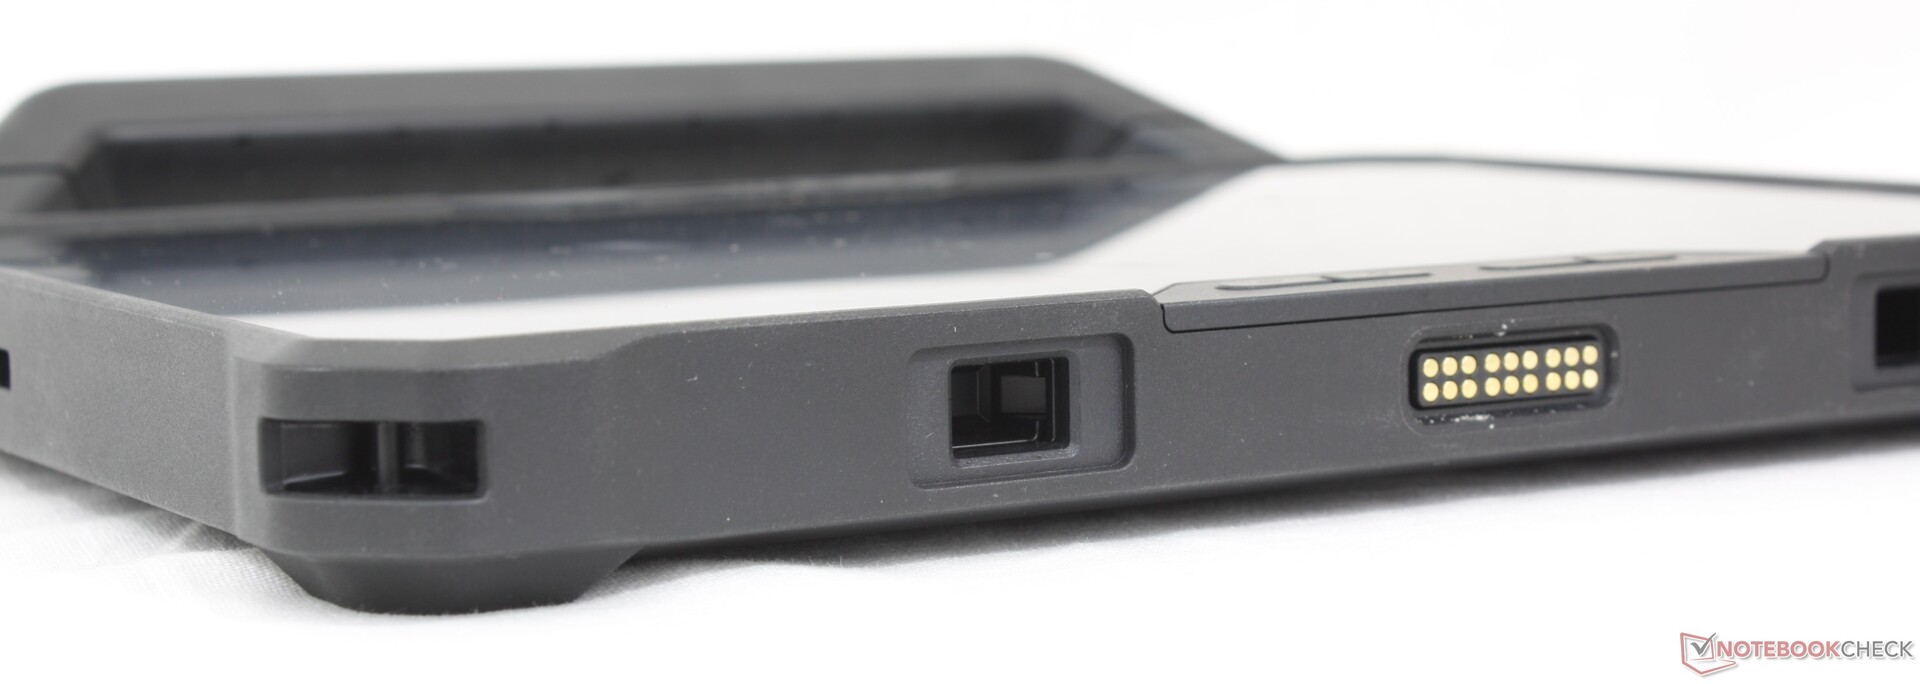
Anslutningsmöjligheter
Laddning sker via universell USB-C istället för att förlita sig på proprietära fatladdare som är vanliga på äldre Rugged-enheter. Den nya Durabook R8levereras till exempel fortfarande med en daterad AC-laddare. Surfplattan integrerar två Thunderbolt 4-portar för att vara kompatibel med ett brett utbud av tillbehör och dockningsstationer.
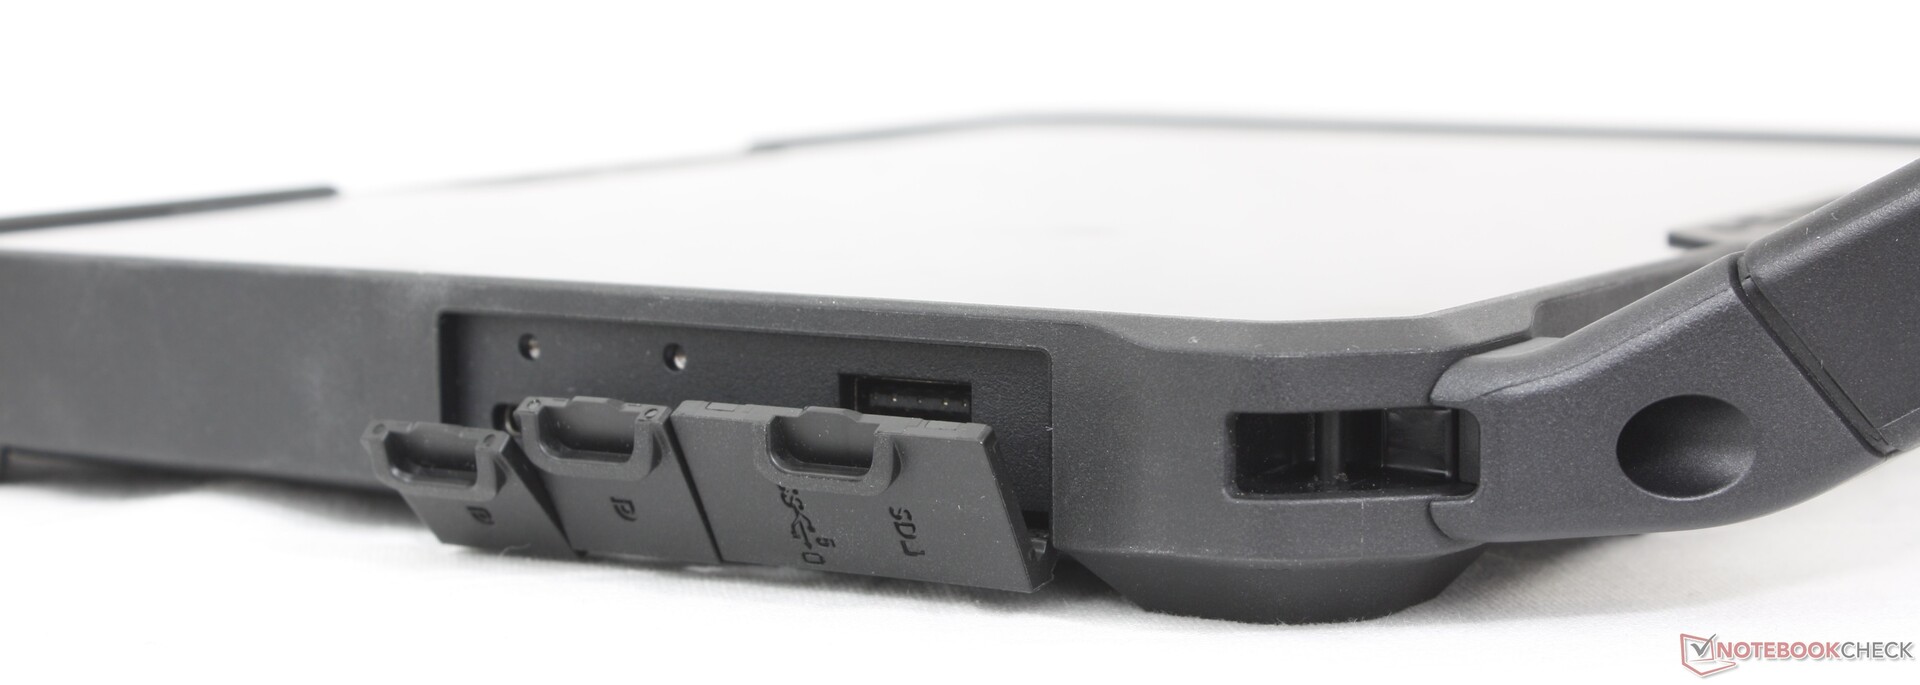
SD-kortläsare
Den integrerade MicroSD-läsaren är mycket snabb med nästan 200 MB/s, precis som på Latitude 5420 Rugged eller Latitude 7424 Rugged. Att flytta 1 GB bilder från vårt UHS-II-testkort till skrivbordet går dock mycket långsammare, bara cirka 50 MB/s, så stora filöverföringar kan fortfarande ta ett tag.
| SD Card Reader | |
| average JPG Copy Test (av. of 3 runs) | |
| Dell Latitude 5420 Rugged-P85G (Toshiba Exceria Pro SDXC 64 GB UHS-II) | |
| Dell Latitude 7424 Rugged Extreme (Toshiba Exceria Pro SDXC 64 GB UHS-II) | |
| Dell Latitude 7330 Rugged Extreme (AV Pro V60) | |
| Dell Latitude 7230 Rugged Extreme (AV Pro V60) | |
| Dell Latitude 7030 Rugged Extreme (AV Pro V60) | |
| Durabook R8 Tablet (AV Pro V60) | |
| Acer Enduro Urban N3 EUN314 (AV Pro V60) | |
| maximum AS SSD Seq Read Test (1GB) | |
| Dell Latitude 5420 Rugged-P85G (Toshiba Exceria Pro SDXC 64 GB UHS-II) | |
| Dell Latitude 7424 Rugged Extreme (Toshiba Exceria Pro SDXC 64 GB UHS-II) | |
| Dell Latitude 7030 Rugged Extreme (AV Pro V60) | |
| Dell Latitude 7330 Rugged Extreme (AV Pro V60) | |
| Dell Latitude 7230 Rugged Extreme (AV Pro V60) | |
| Durabook R8 Tablet (AV Pro V60) | |
| Acer Enduro Urban N3 EUN314 (AV Pro V60) | |
Kommunikation
En Intel AX211 är standard för Bluetooth 5.2 och Wi-Fi 6E-anslutning. Qualcomm är tillval för 4G/5G och GPS-stöd.
| Networking | |
| iperf3 transmit AX12 | |
| Acer Enduro Urban N3 EUN314 | |
| Dell Latitude 7330 Rugged Extreme | |
| iperf3 receive AX12 | |
| Acer Enduro Urban N3 EUN314 | |
| Dell Latitude 7330 Rugged Extreme | |
| iperf3 transmit AXE11000 | |
| Durabook R8 Tablet | |
| Dell Latitude 7230 Rugged Extreme | |
| Dell Latitude 7030 Rugged Extreme | |
| Dell Latitude 7350 Detachable | |
| iperf3 receive AXE11000 | |
| Durabook R8 Tablet | |
| Dell Latitude 7230 Rugged Extreme | |
| Dell Latitude 7030 Rugged Extreme | |
| Dell Latitude 7350 Detachable | |
| iperf3 transmit AXE11000 6GHz | |
| Dell Latitude 7030 Rugged Extreme | |
| Dell Latitude 7350 Detachable | |
| Dell Latitude 7230 Rugged Extreme | |
| Durabook R8 Tablet | |
| iperf3 receive AXE11000 6GHz | |
| Dell Latitude 7030 Rugged Extreme | |
| Dell Latitude 7350 Detachable | |
| Durabook R8 Tablet | |
| Dell Latitude 7230 Rugged Extreme | |
Webbkamera
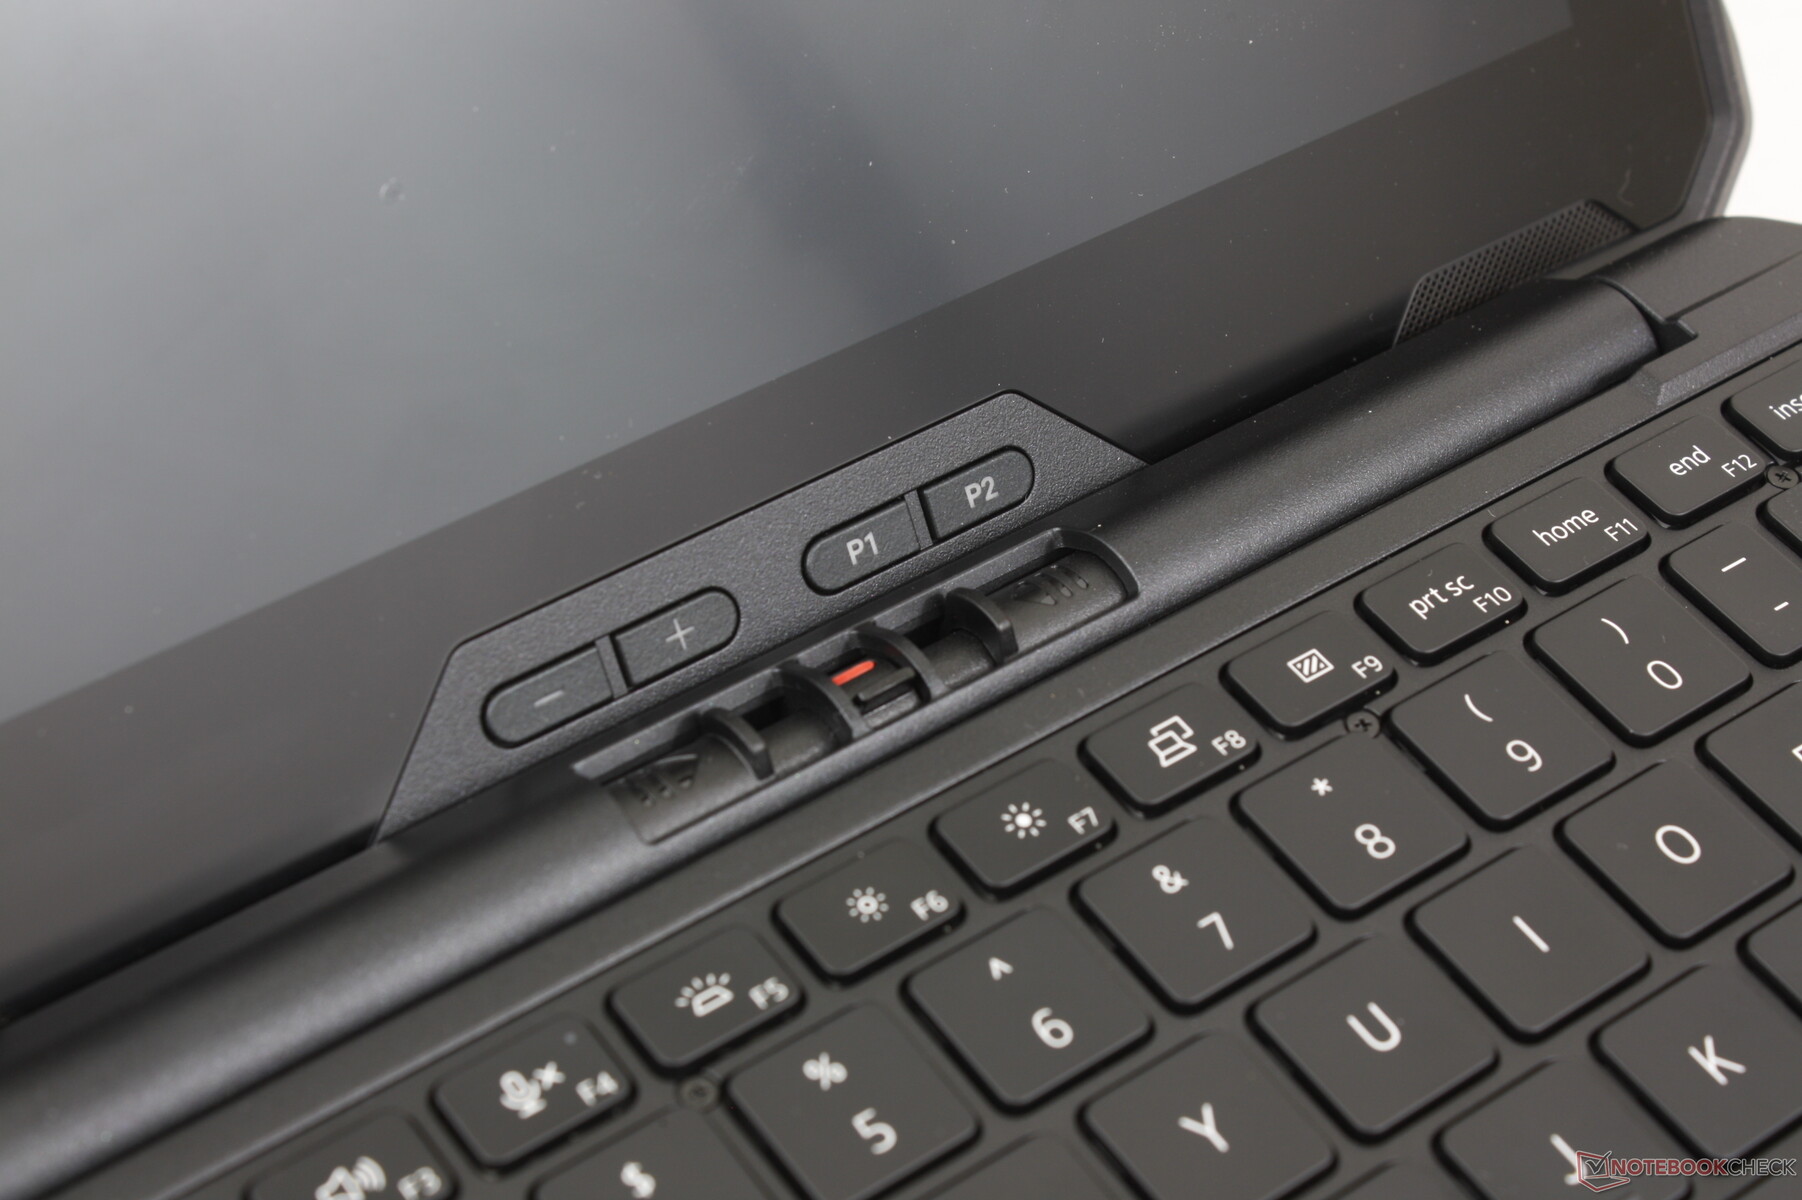
Användare kan konfigurera med antingen inga kameror eller två kameror (5 MP framåtvända plus 11 MP bakåtvända). Om de konfigureras med kameror har båda fysiska reglage för integritet medan den främre har en IR-sensor för Hello-stöd. Intressant nog kan användare bara välja upp till 10 MP via Windows Camera-appen istället för hela 11 MP. Kamerorna på Durabook R8 är suddigare i jämförelse.
Bildkvaliteten är skarp för en Windows-enhet, men färgerna och ljusstyrkan kunde ha varit mer levande.


Underhåll
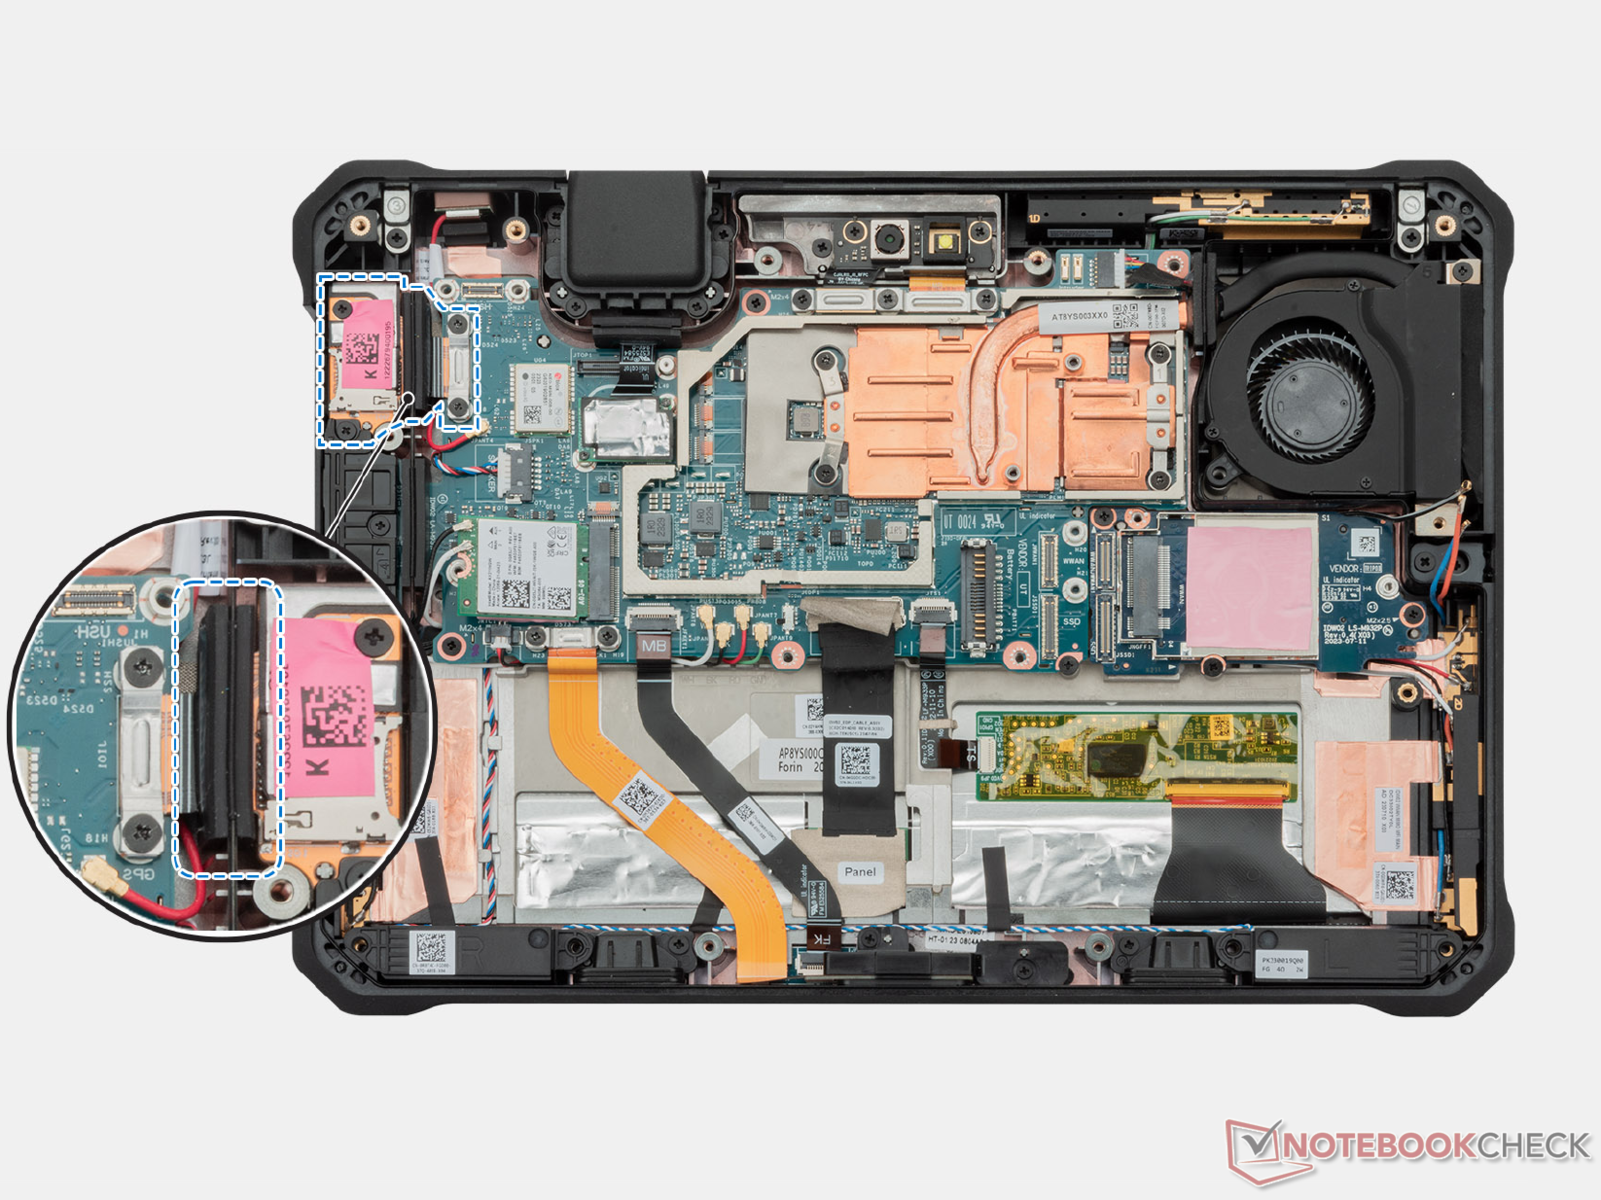
Bakpanelen sitter fast med 19 Torx-skruvar. Var försiktig så att du inte sliter ut bandkabeln som ansluter den löstagbara panelen till moderkortet när du tar bort den.
Väl inne har användarna tillgång till den löstagbara M.2 WLAN-modulen, M.2 WAN-platsen och M.2 2230 SSD-platsen. Det interna batteripaketet kommer också att vara närvarande om det är konfigurerat med ett.
Hållbarhet
USB-C-adaptern består av 50 procent återvunnen plast från konsumentledet medan förpackningen består av kartong, plastfolie och LPDE. Själva surfplattan är EPEAT Gold-certifierad, men Dell uppger att inga återvunna material har använts vid tillverkningen.
Reservdelar finns tillgängliga direkt från Dell samt den officiella servicemanualen här.
Tillbehör och garanti
Dell erbjuder ett stort antal tillbehör, bland annat ett löstagbart tangentbord, handrem, aktiv penna, passiv penna, mobil batteriladdare, mobilställ med mera.
En treårig tillverkargaranti gäller om den köps i USA.
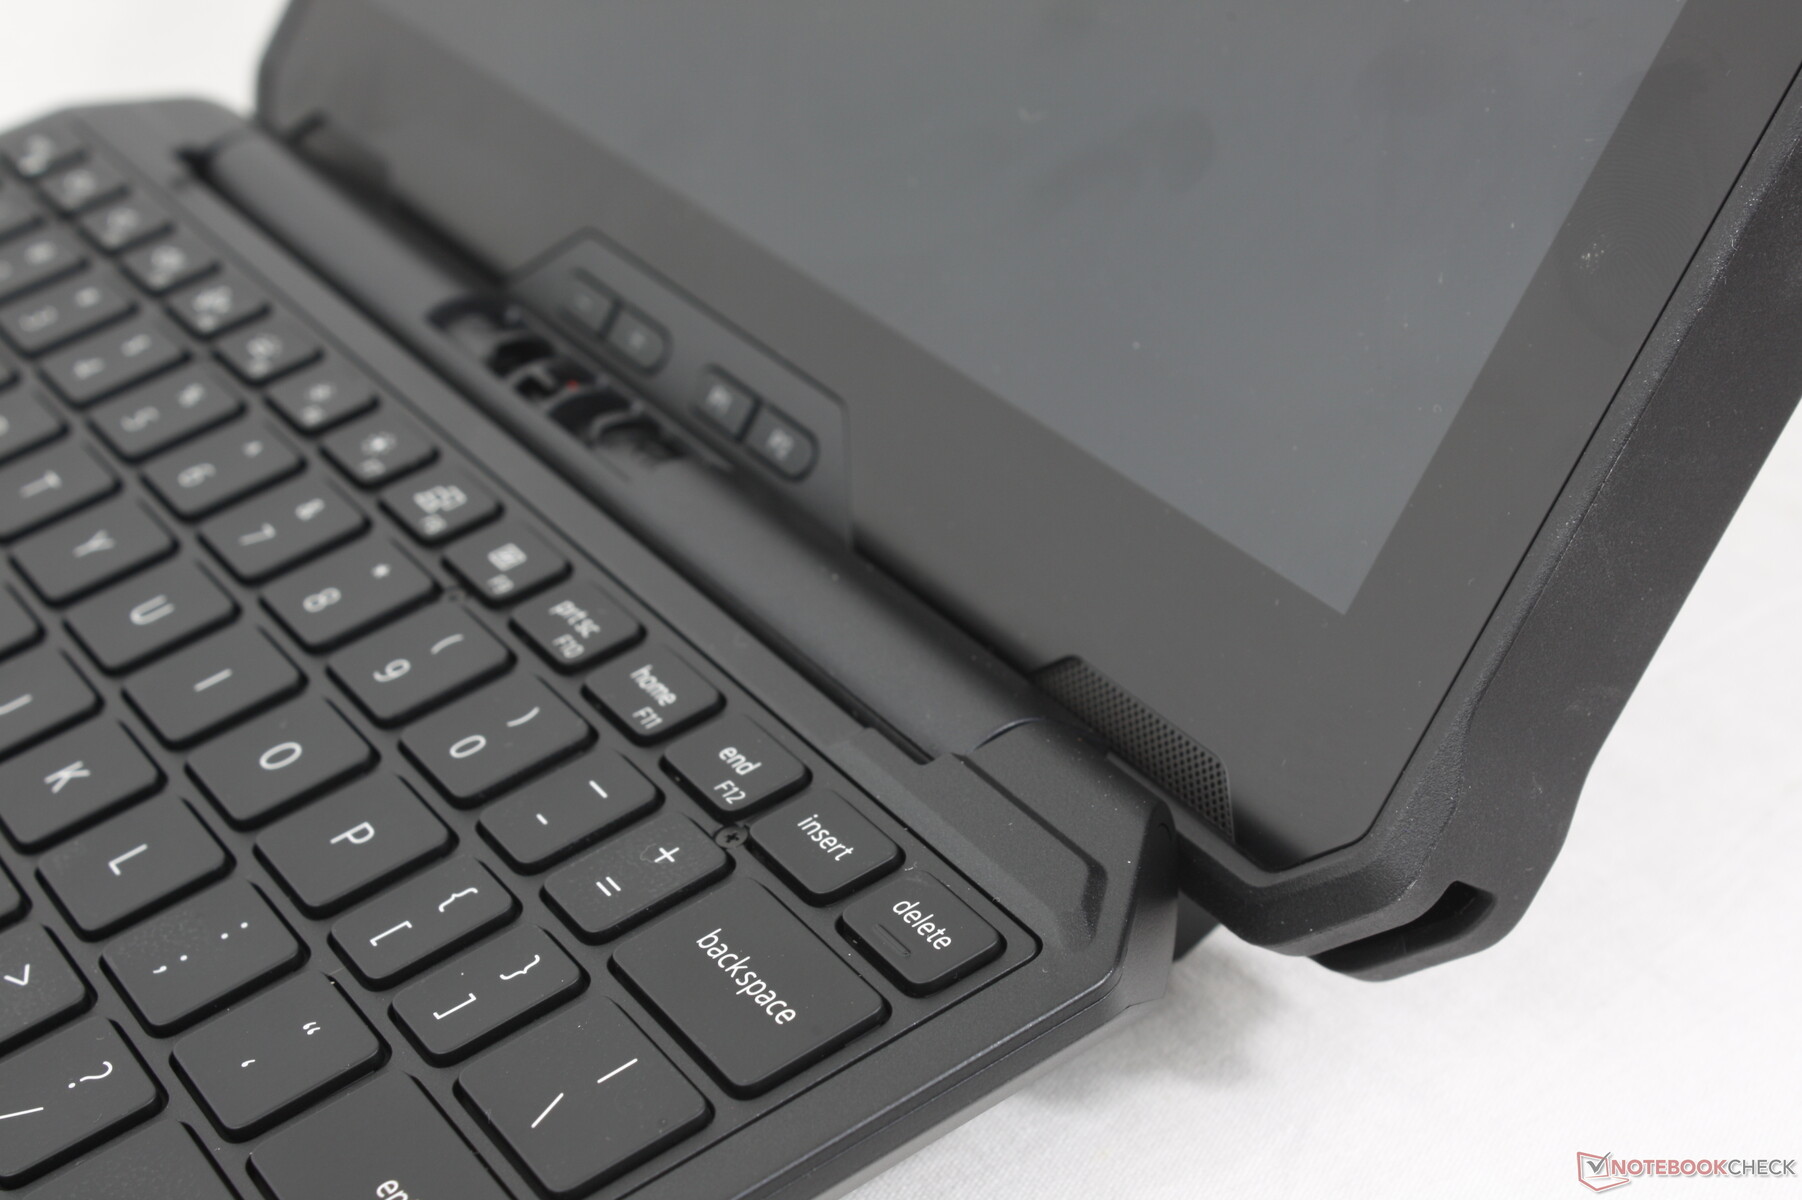
Inmatningsenheter
Tangentbord
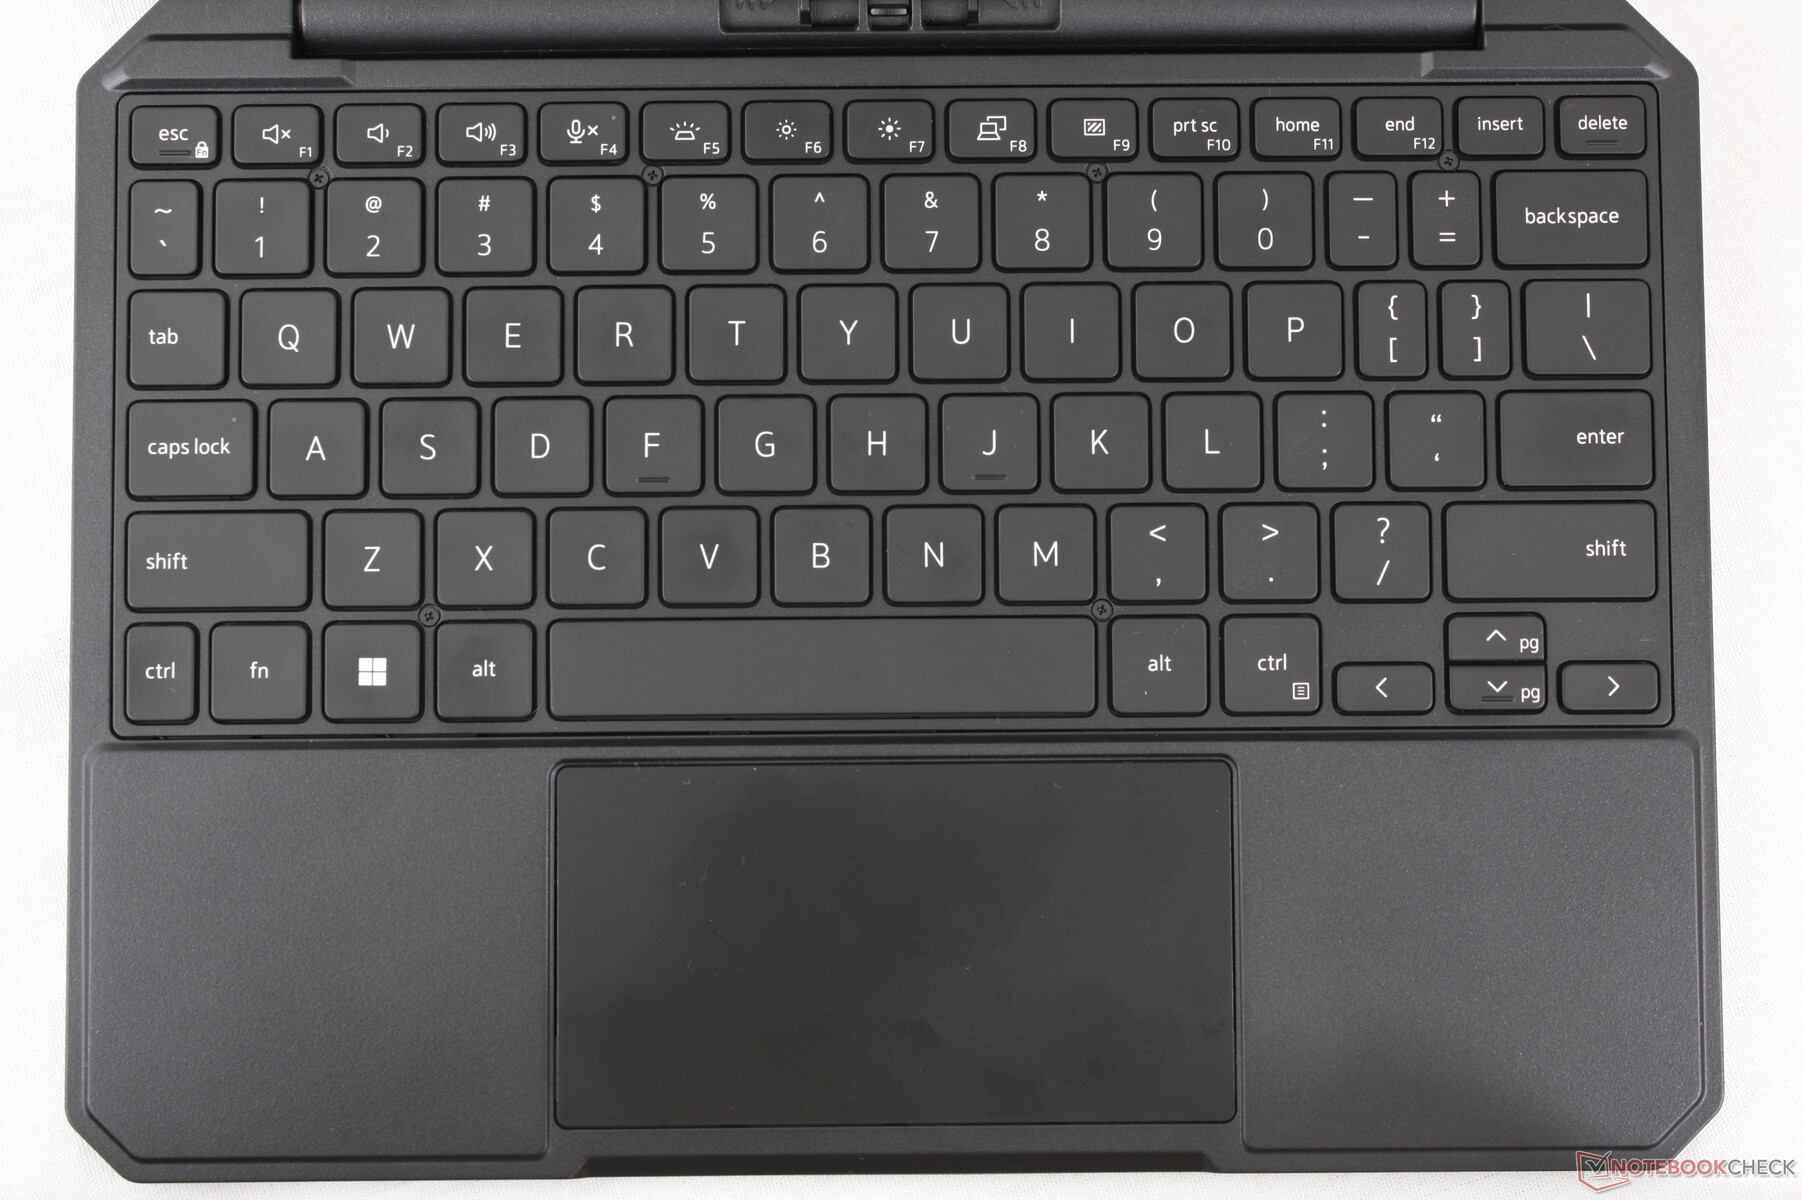
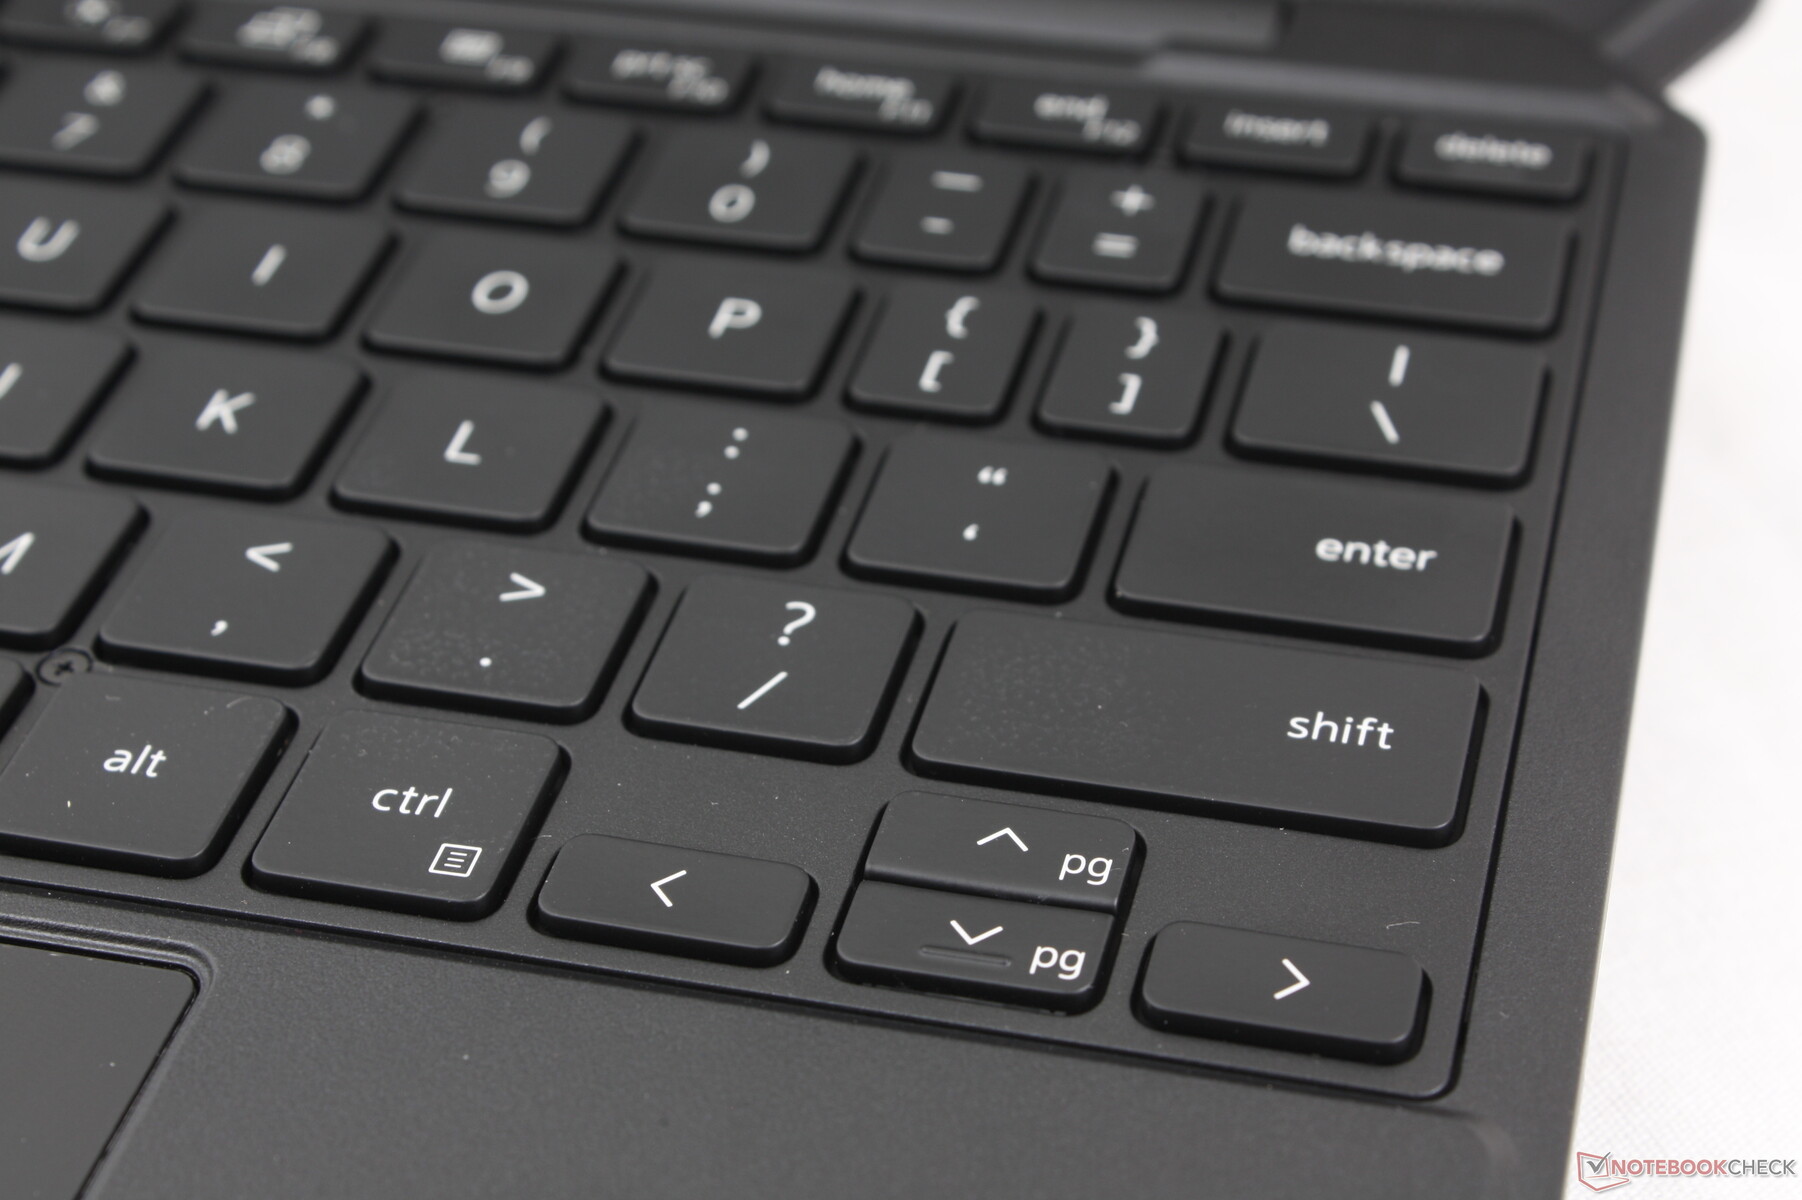
Tangentåterkopplingen är förvånansvärt fast och enhetlig med tanke på att de flesta andra löstagbara tangentbord tenderar att vara mer svampiga och lätta. Detta kan tillskrivas den tjocka basen på vårt avtagbara Dell-tangentbord medan alternativ som Surface Pro är mycket tunnare i jämförelse. Att skriva på Dell känns mer som att skriva på en vanlig clamshell-bärbar dator som ett resultat, om än mer trångt på grund av den mindre formfaktorn.
Smattret är relativt skarpt och högt till följd av den hårdare återkopplingen.
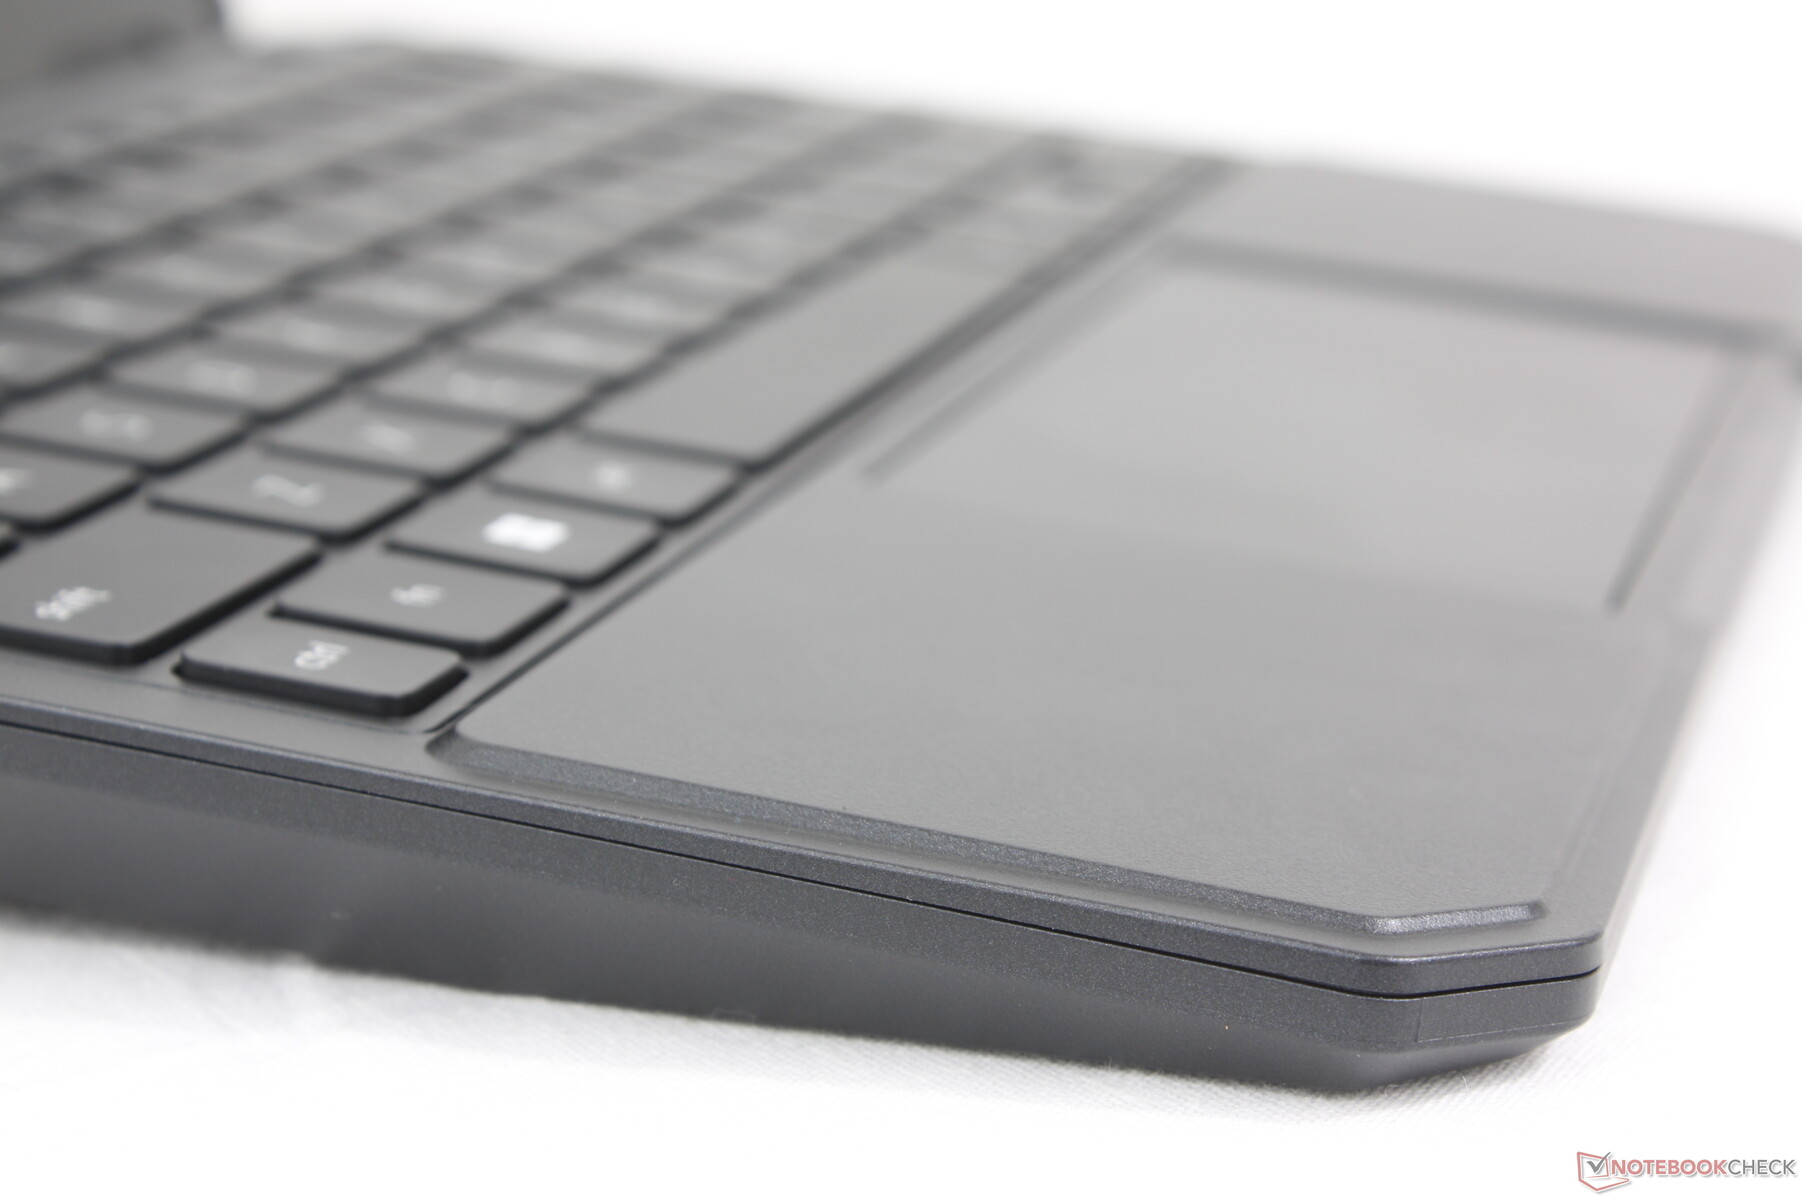
Pekplatta
Klickplattans storlek är förväntat liten, 10,2 x 5,5 cm. Glidningen är smidig, men multi-touch-gester som dra-och-släpp är svåra att utföra på grund av de smala klickdynans dimensioner. Markören hoppar också oväntat oftare.


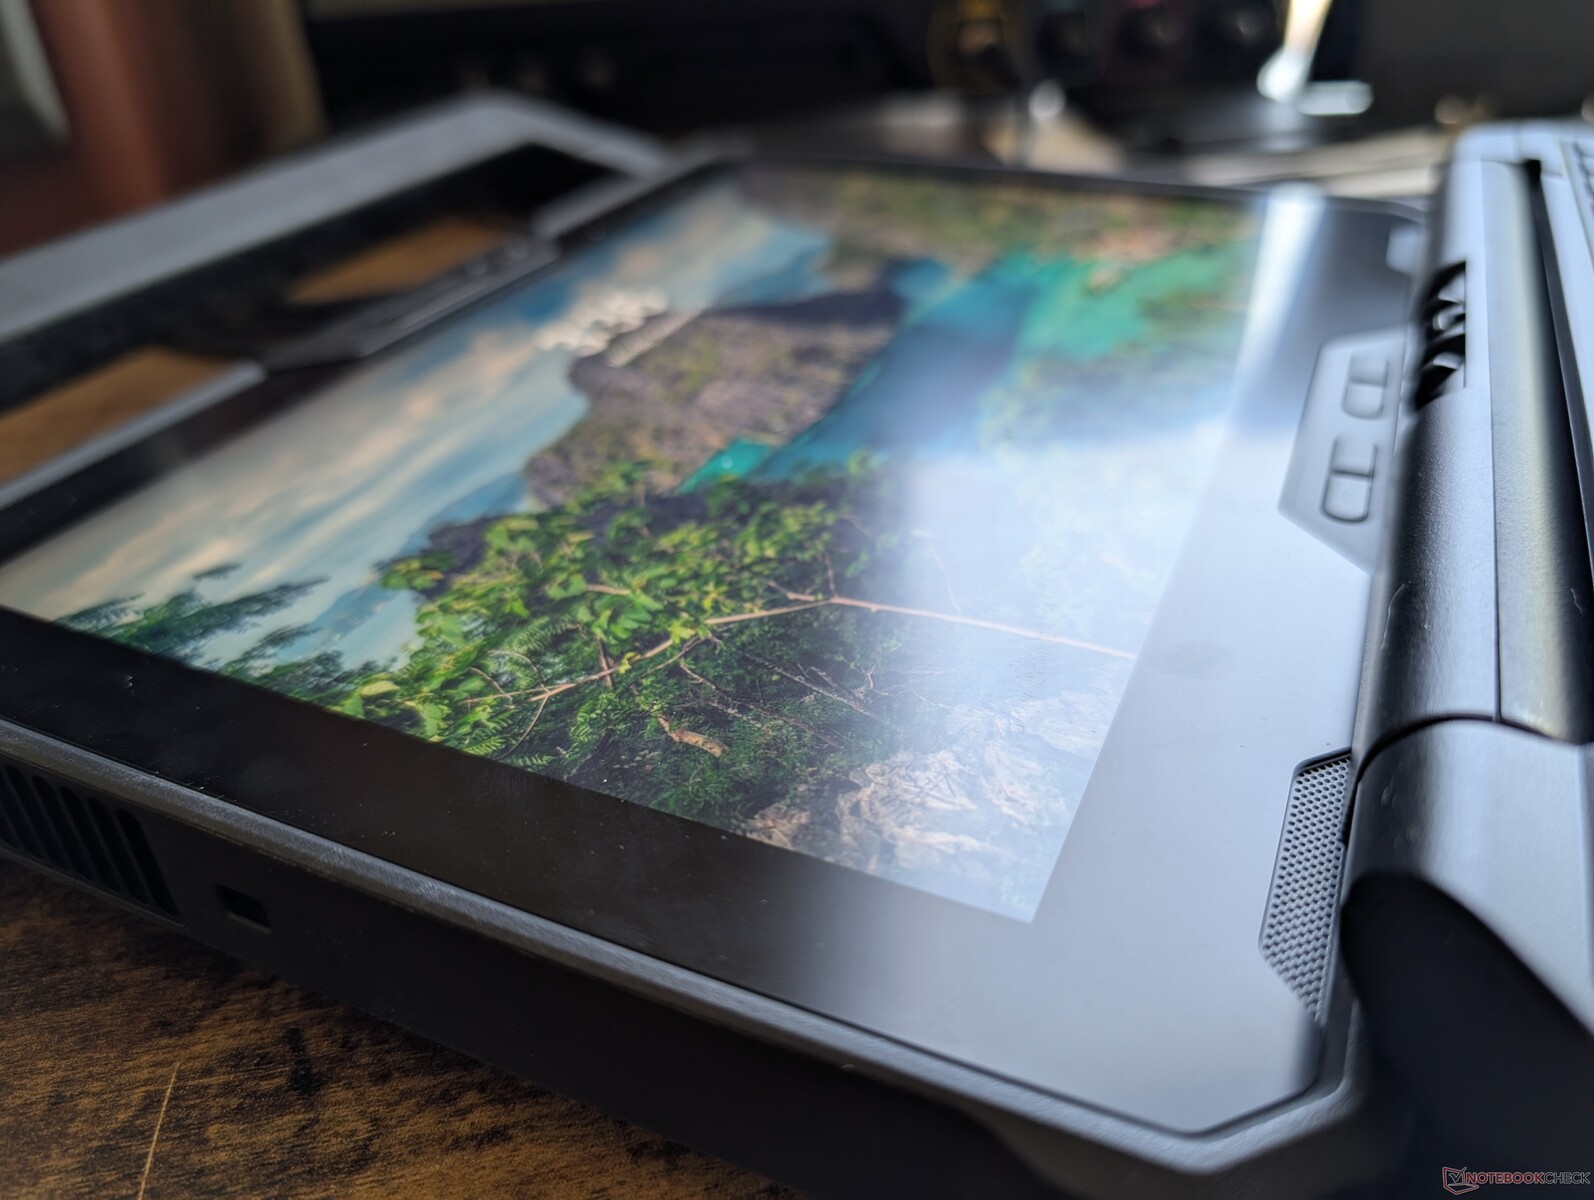
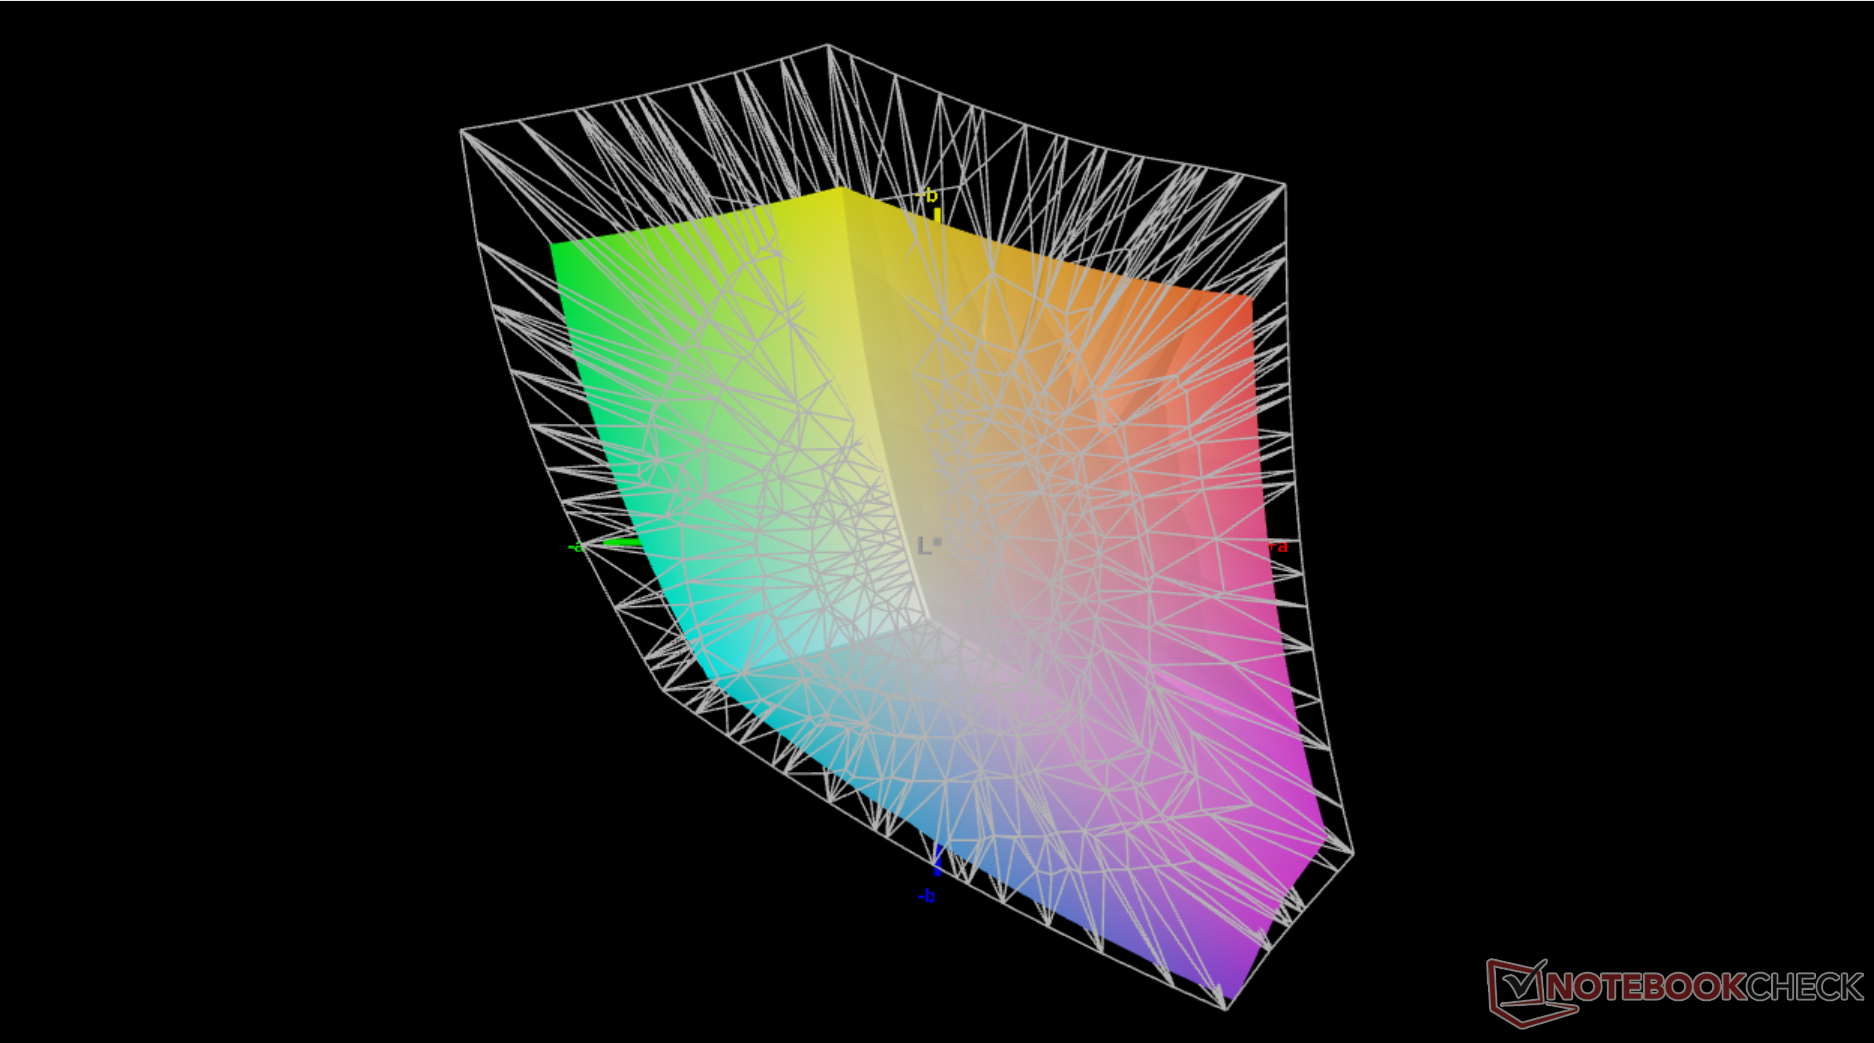
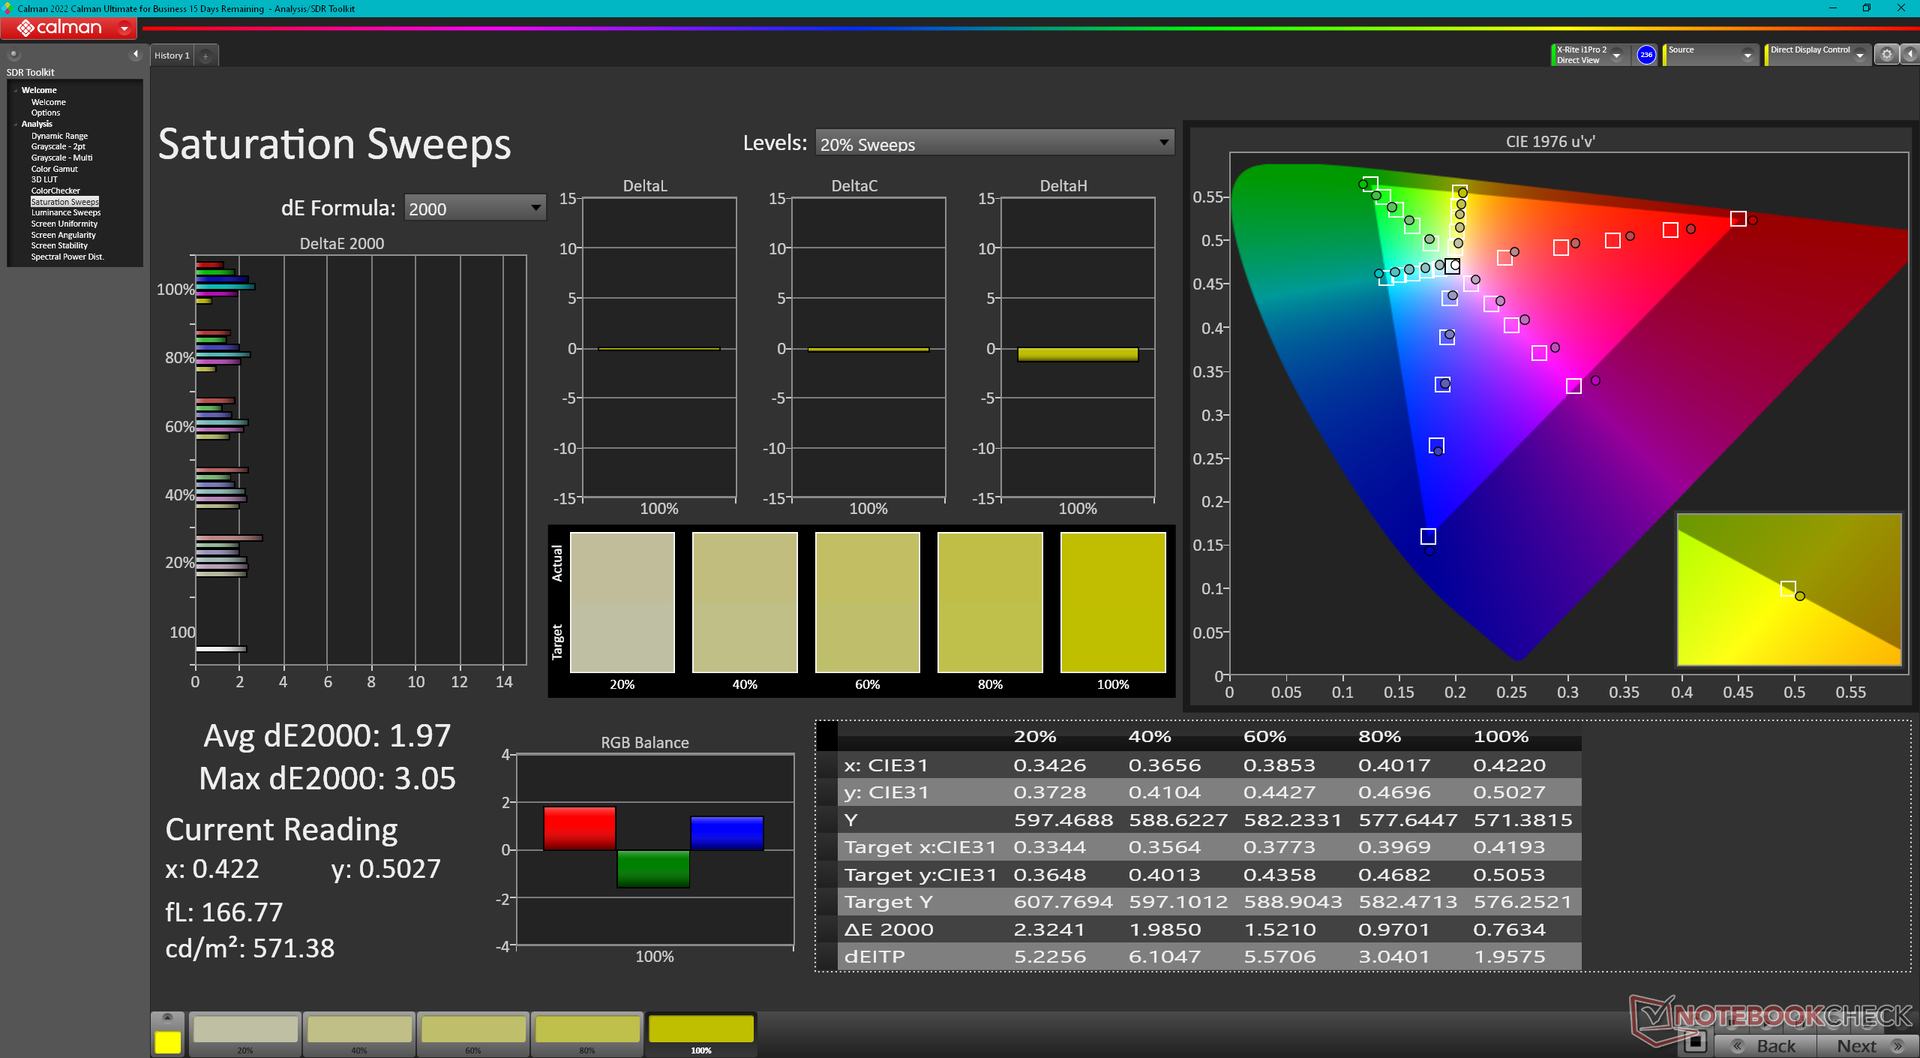
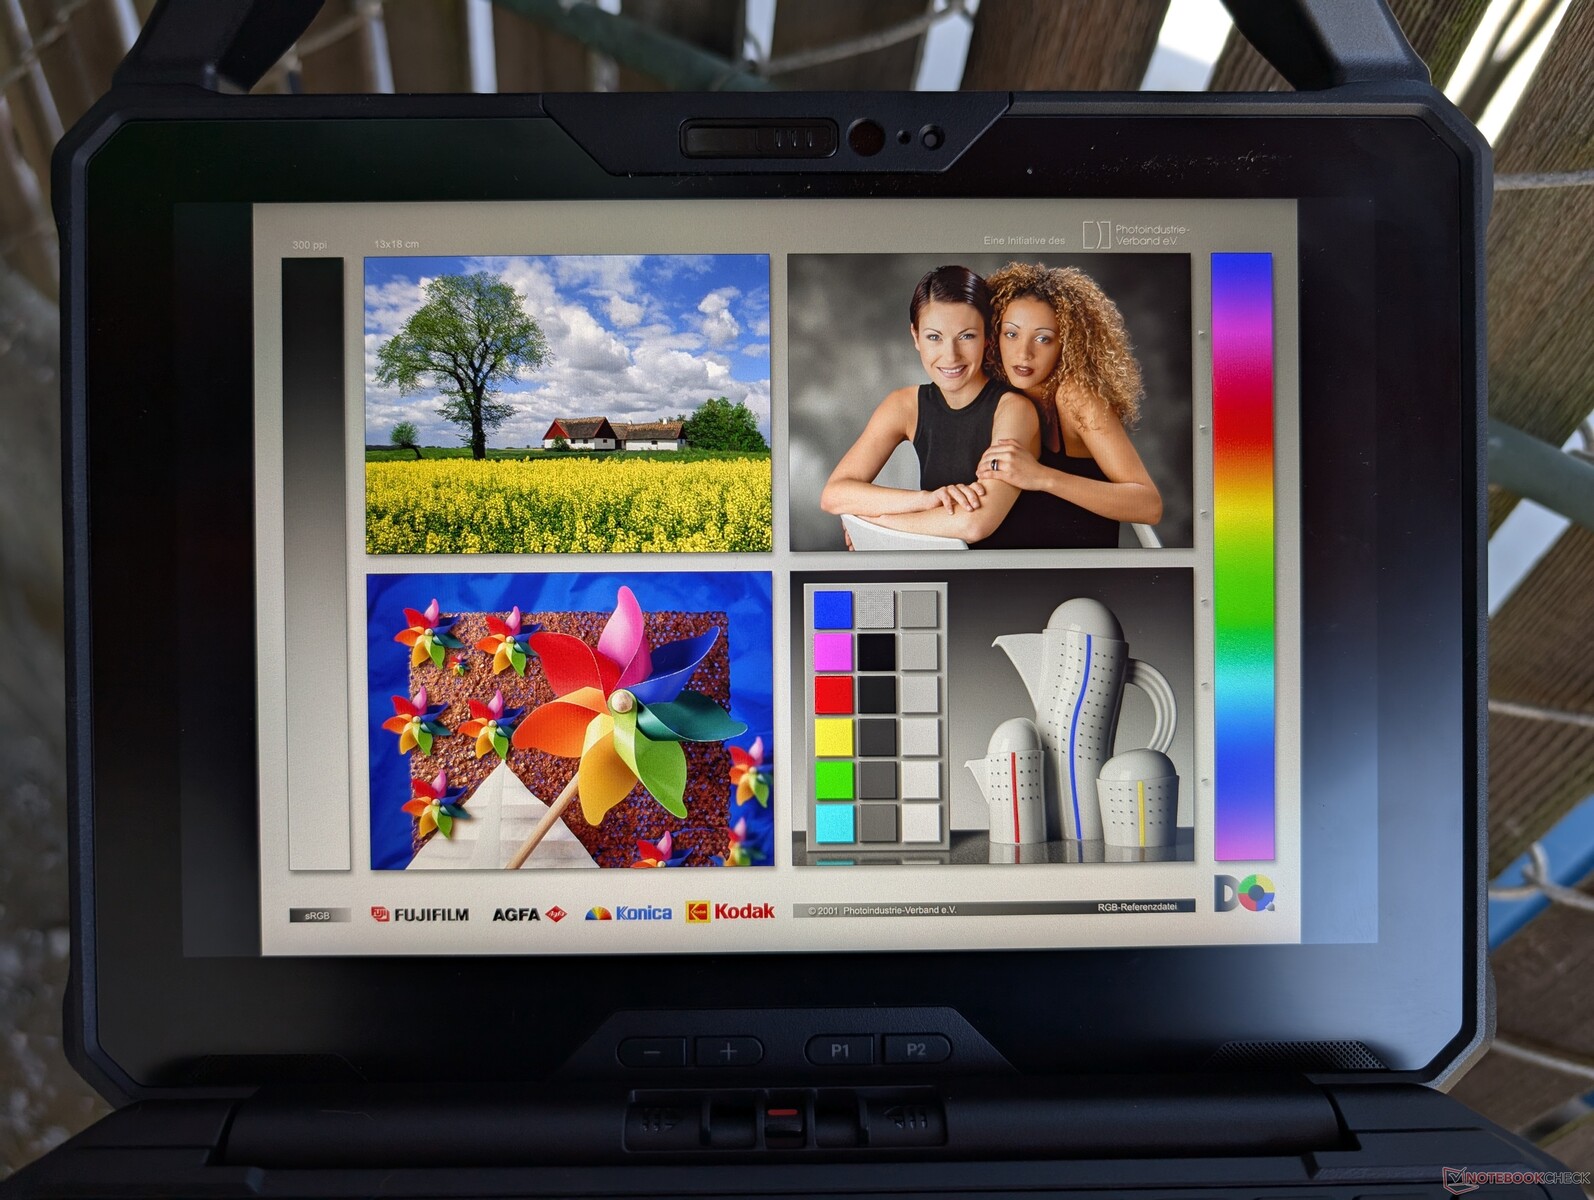
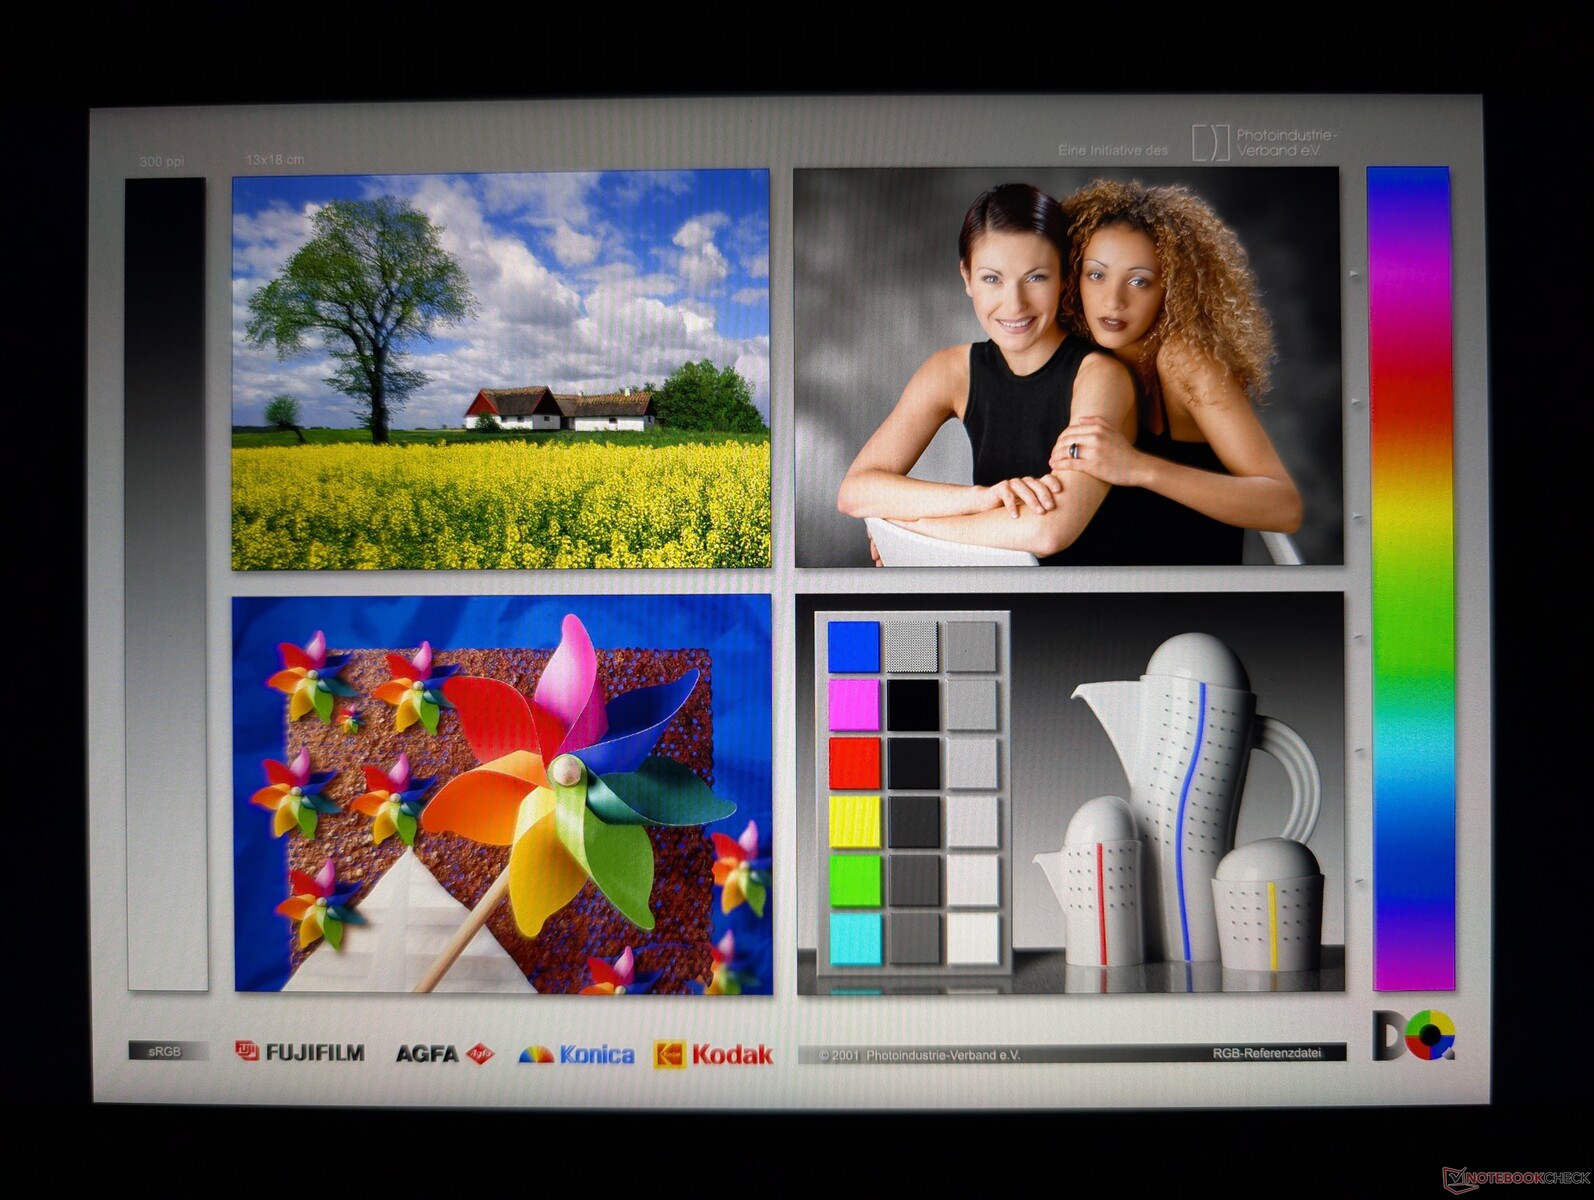
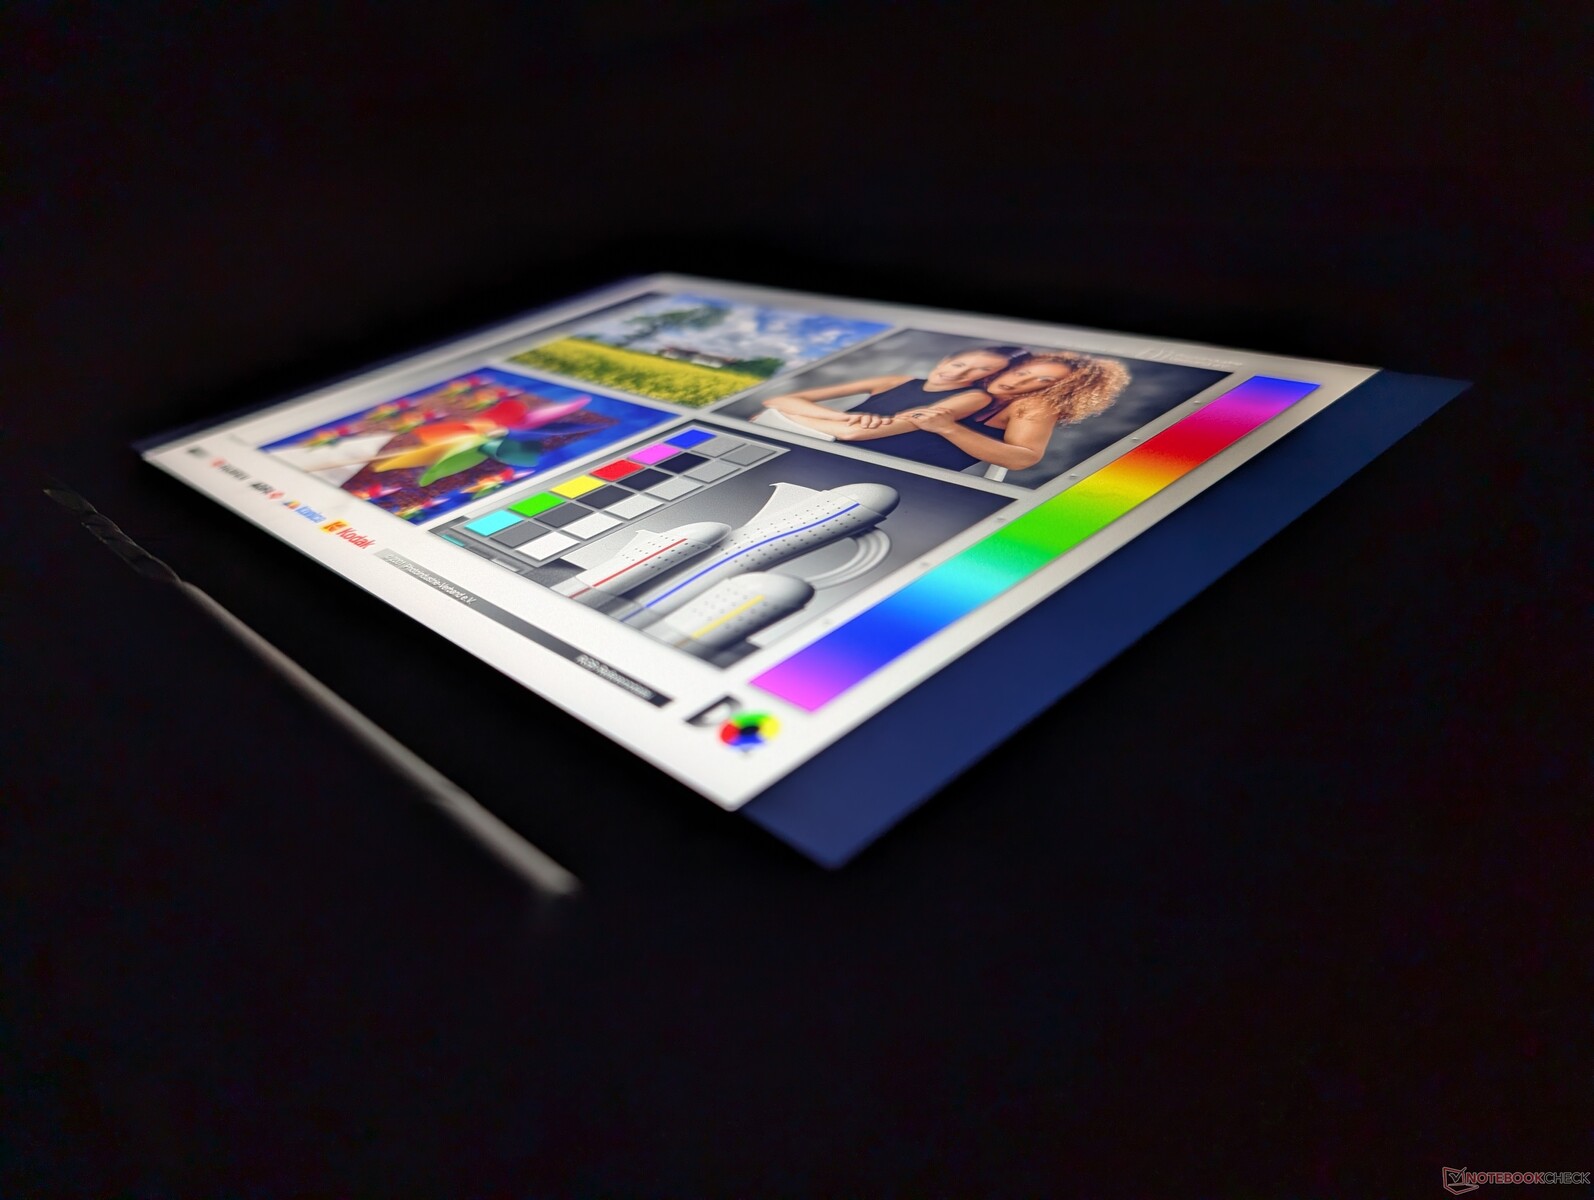
Skärm - fantastiska färger för en robust surfplatta
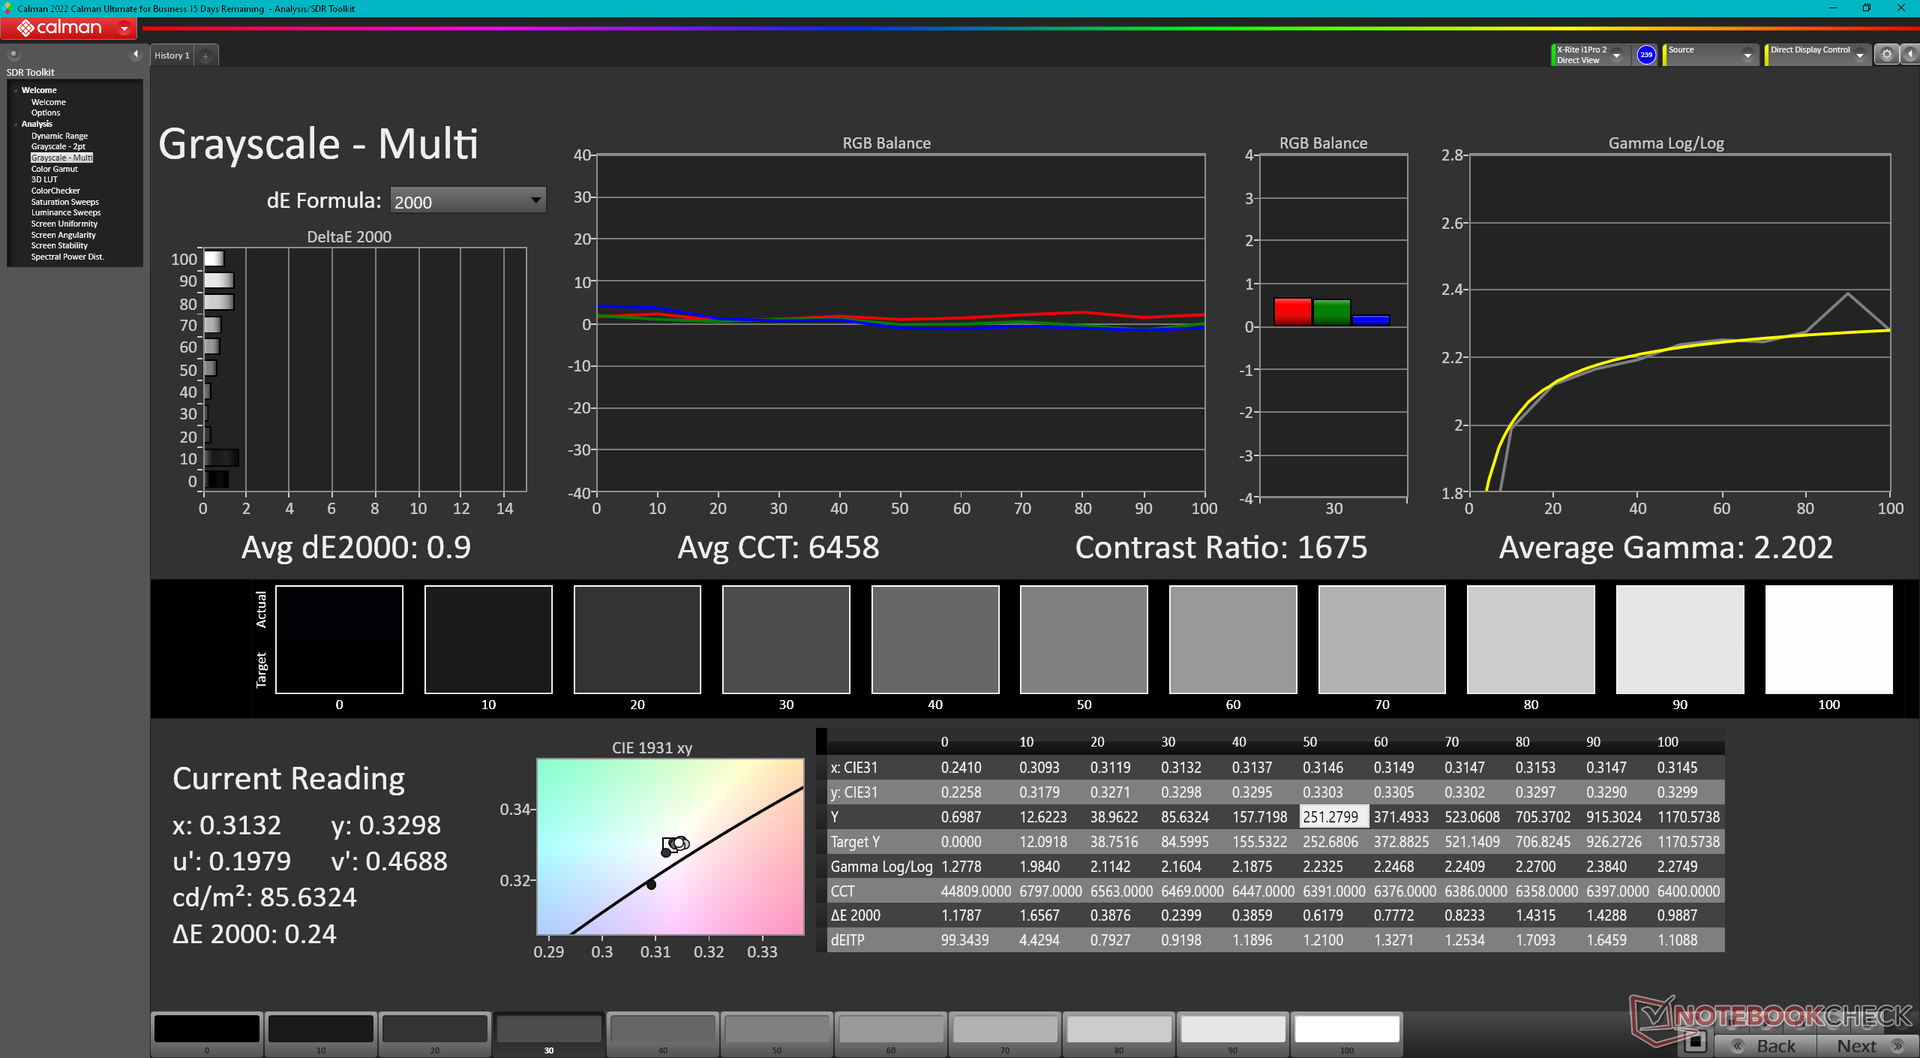
Modellen är utrustad med en av de bästa skärmarna vi har sett på en robust surfplatta. Full sRGB stöds och de mer livfulla färgerna märks direkt. Den ljusstarka bakgrundsbelysningen på 1000 nit och det djupa kontrastförhållandet på ~1500:1 förstärker den visuella upplevelsen ytterligare.
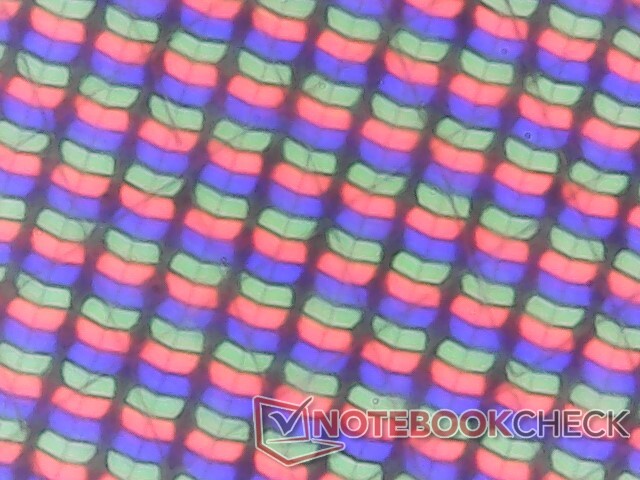
Nackdelarna inkluderar de långsamma svartvita svarstiderna, uppdateringsfrekvensen på 60 Hz och det korniga överlägget. Även om spökbilderna inte är ett problem, förhindrar kornigheten tyvärr att texter och bilder ser skarpa ut på en annars hög PPI-skärm. Detta är vanligt på de flesta robusta surfplattor eftersom deras pekskärmar är under tjockare lager av skydd än en vanlig konsumentmodell.

| |||||||||||||||||||||||||
Distribution av ljusstyrkan: 88 %
Mitt på batteriet: 1183.9 cd/m²
Kontrast: 1600:1 (Svärta: 0.74 cd/m²)
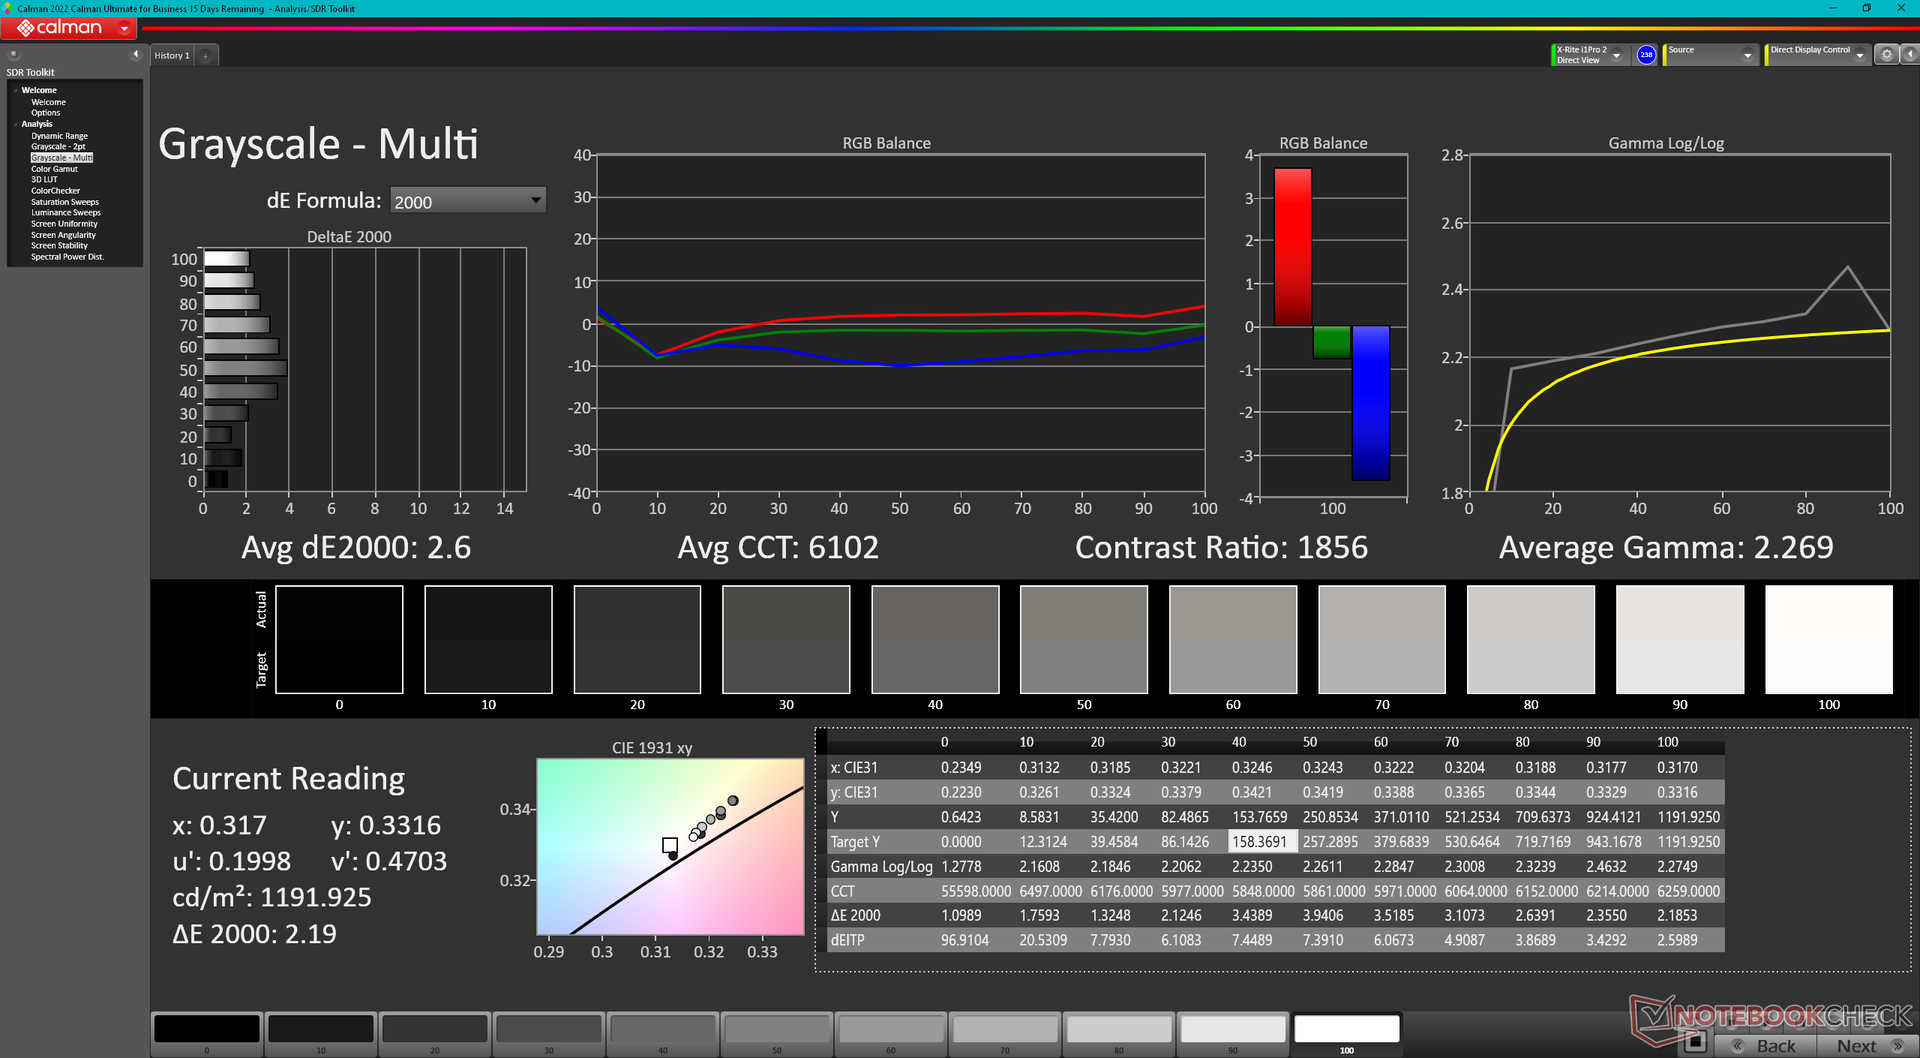
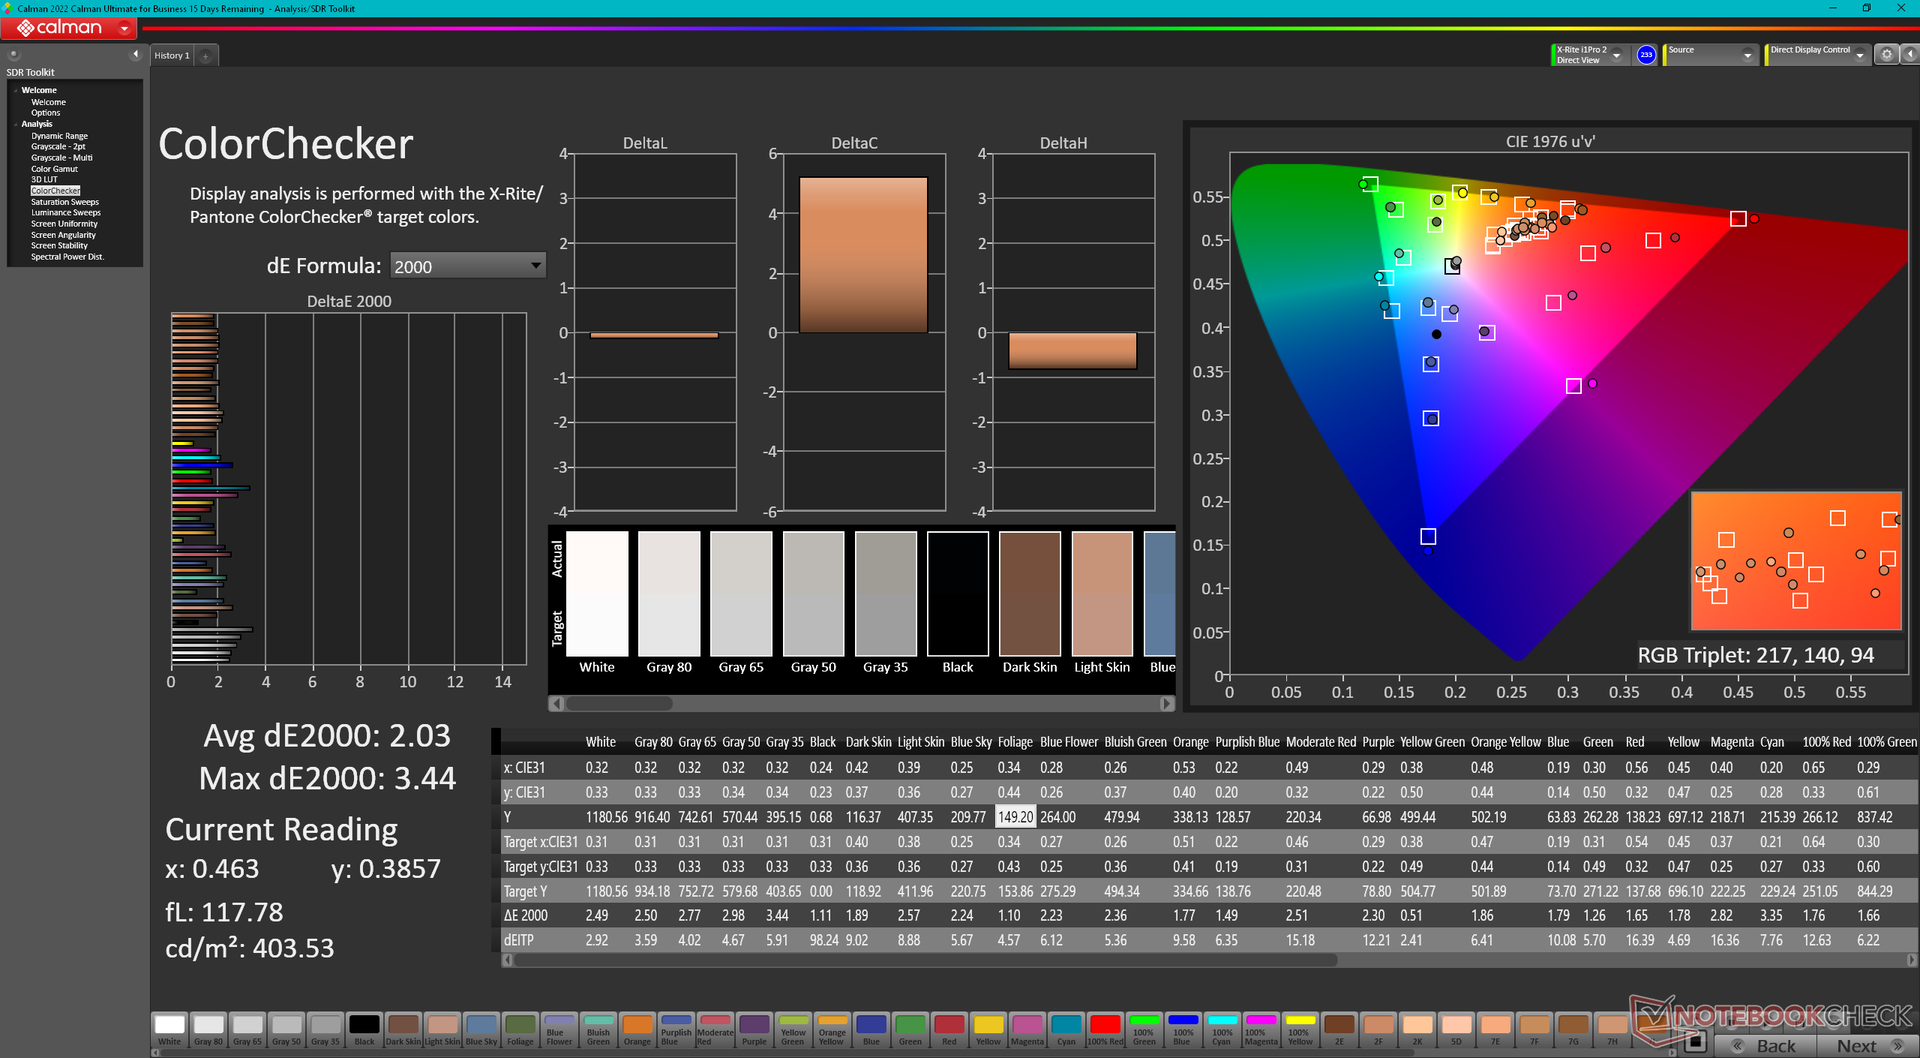
ΔE Color 2.03 | 0.5-29.43 Ø4.88, calibrated: 0.53
ΔE Greyscale 2.6 | 0.5-98 Ø5.1
72.7% AdobeRGB 1998 (Argyll 2.2.0 3D)
99% sRGB (Argyll 2.2.0 3D)
72.2% Display P3 (Argyll 2.2.0 3D)
Gamma: 2.27
| Dell Latitude 7030 Rugged Extreme Sharp LQ101N1, IPS, 1920x1200, 10", 60 Hz | Dell Latitude 7350 Detachable BOE NE13A1M, IPS, 2880x1920, 13", 60 Hz | Dell Latitude 7230 Rugged Extreme Sharp LQ120N1, IPS, 1920x1200, 12", 60 Hz | Durabook R8 Tablet Digital Flat Panel, IPS, 1280x800, 8", 60 Hz | Acer Enduro Urban N3 EUN314 XR140EA6T, IPS, 1920x1080, 14", 60 Hz | Dell Latitude 7330 Rugged Extreme Sharp LQ133M1, IPS, 1920x1080, 13.3", 60 Hz | |
|---|---|---|---|---|---|---|
| Display | -1% | -6% | -26% | -10% | -4% | |
| Display P3 Coverage | 72.2 | 70.2 -3% | 66.2 -8% | 51.5 -29% | 63.5 -12% | 67.1 -7% |
| sRGB Coverage | 99 | 98.9 0% | 96.1 -3% | 77.4 -22% | 91.9 -7% | 98.2 -1% |
| AdobeRGB 1998 Coverage | 72.7 | 72.1 -1% | 68.4 -6% | 53.1 -27% | 65.5 -10% | 69 -5% |
| Response Times | -15% | 17% | 6% | -57% | -98% | |
| Response Time Grey 50% / Grey 80% * | 35.9 ? | 43.8 ? -22% | 28.4 ? 21% | 32.4 ? 10% | 56 ? -56% | 74.4 ? -107% |
| Response Time Black / White * | 22.4 ? | 24.1 ? -8% | 19.4 ? 13% | 21.9 ? 2% | 35.2 ? -57% | 42.4 ? -89% |
| PWM Frequency | 300 ? | 1000 ? | ||||
| Screen | -43% | 4% | -166% | -111% | -3% | |
| Brightness middle | 1183.9 | 508.5 -57% | 1326.7 12% | 943.7 -20% | 487.8 -59% | 1414.1 19% |
| Brightness | 1140 | 507 -56% | 1193 5% | 870 -24% | 464 -59% | 1282 12% |
| Brightness Distribution | 88 | 87 -1% | 82 -7% | 85 -3% | 89 1% | 84 -5% |
| Black Level * | 0.74 | 0.24 68% | 0.85 -15% | 0.85 -15% | 0.48 35% | 0.83 -12% |
| Contrast | 1600 | 2119 32% | 1561 -2% | 1110 -31% | 1016 -36% | 1704 7% |
| Colorchecker dE 2000 * | 2.03 | 3 -48% | 1.06 48% | 6.35 -213% | 6.51 -221% | 1.99 2% |
| Colorchecker dE 2000 max. * | 3.44 | 7.03 -104% | 3.78 -10% | 8.86 -158% | 11.36 -230% | 3.75 -9% |
| Colorchecker dE 2000 calibrated * | 0.53 | 1.28 -142% | 0.71 -34% | 5.1 -862% | 1.77 -234% | 0.72 -36% |
| Greyscale dE 2000 * | 2.6 | 4.6 -77% | 1.5 42% | 6.9 -165% | 7.8 -200% | 2.8 -8% |
| Gamma | 2.27 97% | 2.17 101% | 2.19 100% | 2.65 83% | 2.28 96% | 2.06 107% |
| CCT | 6102 107% | 6929 94% | 6804 96% | 6956 93% | 8102 80% | 6775 96% |
| Totalt genomsnitt (program/inställningar) | -20% /
-30% | 5% /
4% | -62% /
-111% | -59% /
-82% | -35% /
-17% |
* ... mindre är bättre
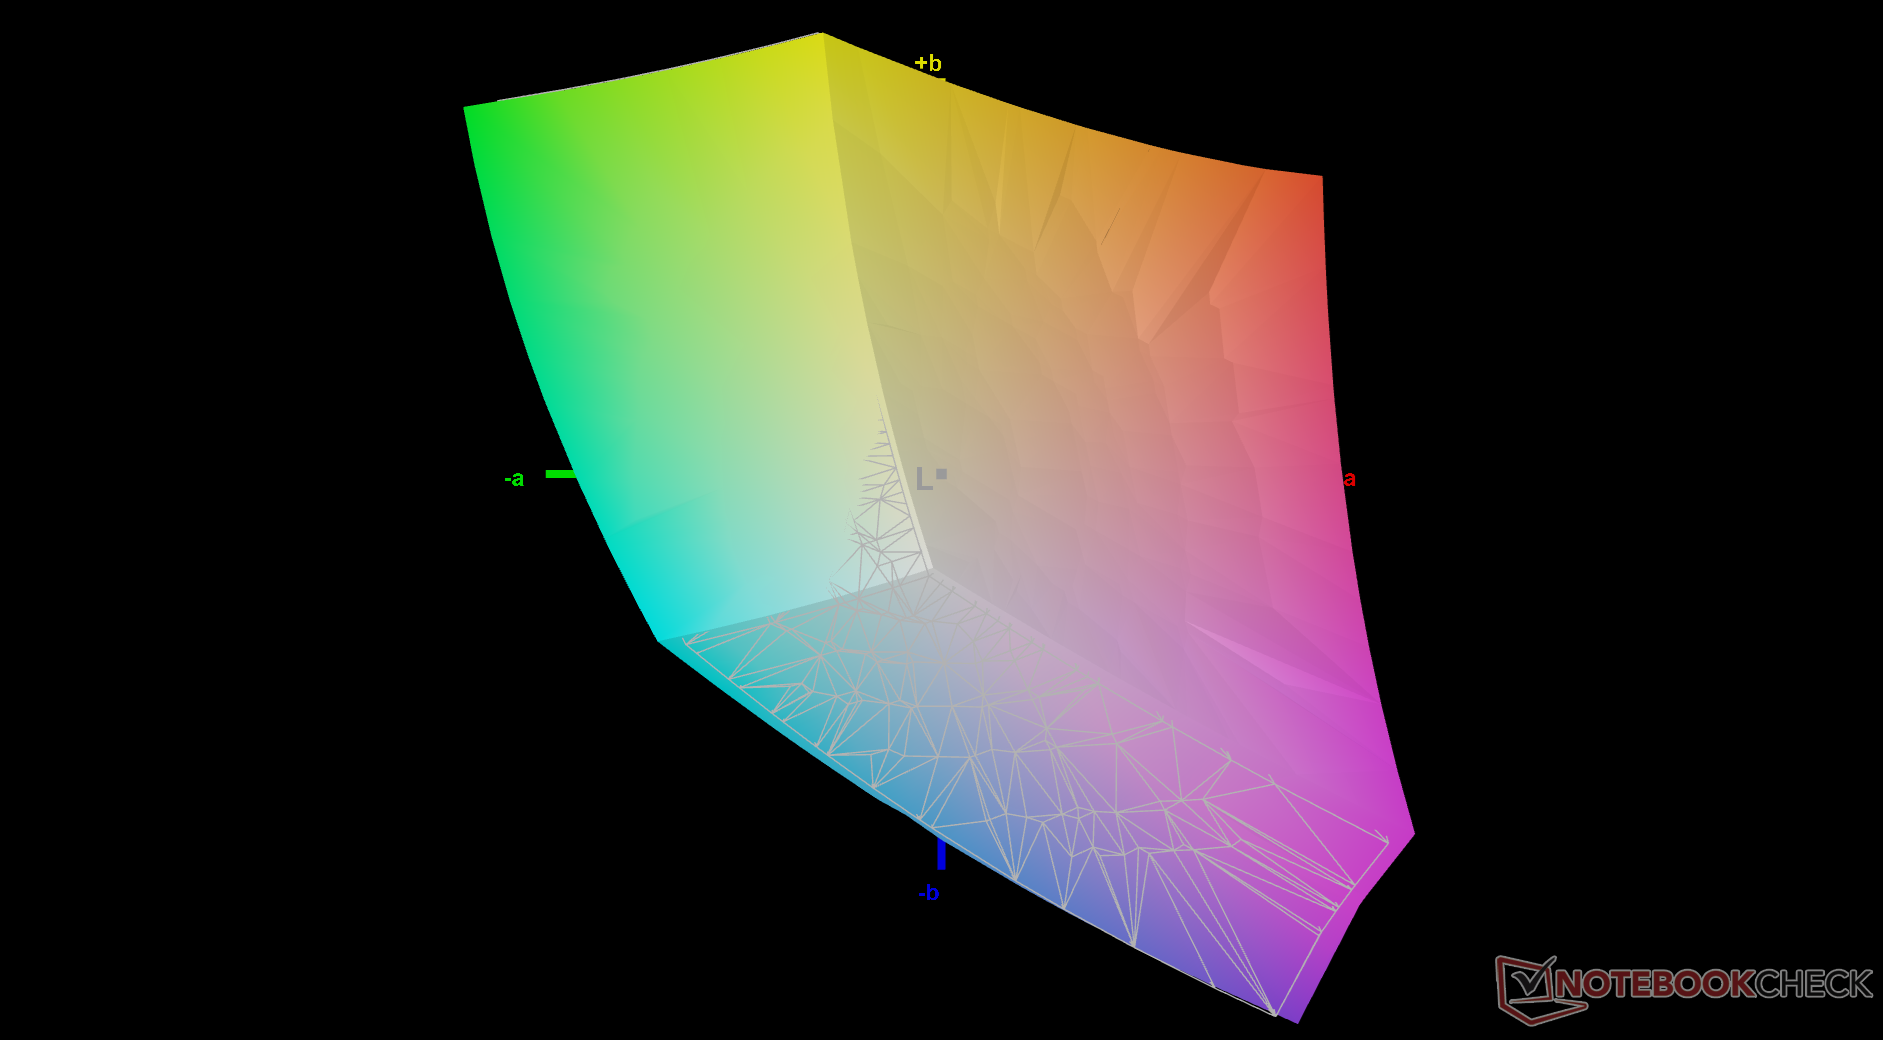
Skärmen är hyfsat kalibrerad direkt från förpackningen med relativt låga genomsnittliga deltaE-värden. Färgtemperaturen är något för varm, men när vi själva kalibrerar skärmen med en X-Rite-kolorimeter åtgärdar vi problemet och får en ännu mer exakt skärm. Vår kalibrerade ICM-profil kan laddas ner gratis ovan.


Visa svarstider
| ↔ Svarstid svart till vitt | ||
|---|---|---|
| 22.4 ms ... stiga ↗ och falla ↘ kombinerat | ↗ 11.7 ms stiga | 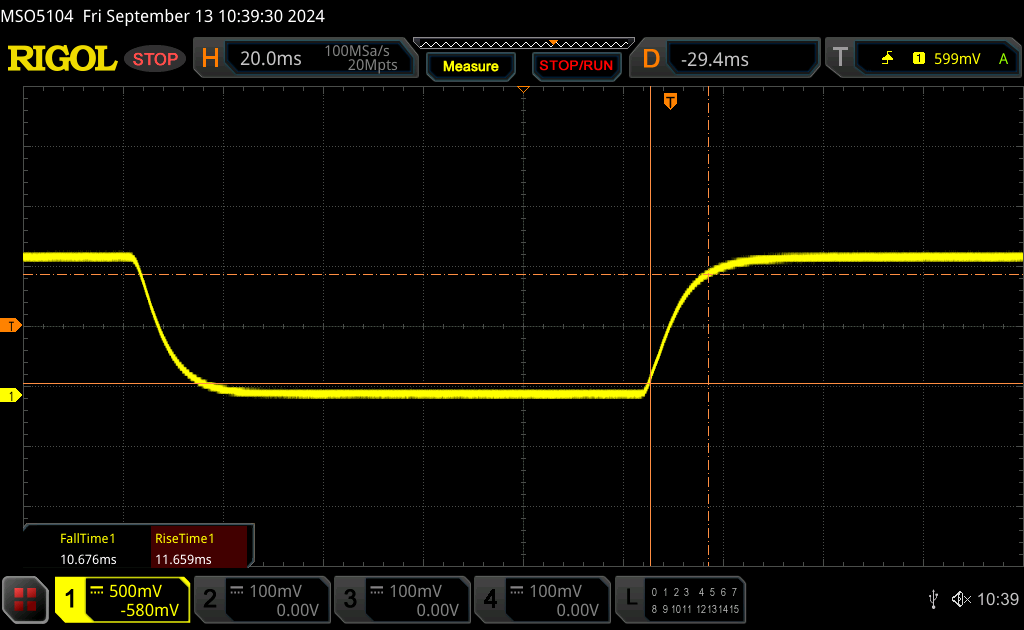 |
| ↘ 10.7 ms hösten | ||
| Skärmen visar bra svarsfrekvens i våra tester, men kan vara för långsam för konkurrenskraftiga spelare. I jämförelse sträcker sig alla testade enheter från 0.1 (minst) till 240 (maximalt) ms. » 47 % av alla enheter är bättre. Det betyder att den uppmätta svarstiden liknar genomsnittet av alla testade enheter (20.8 ms). | ||
| ↔ Svarstid 50 % grått till 80 % grått | ||
| 35.9 ms ... stiga ↗ och falla ↘ kombinerat | ↗ 17.1 ms stiga | 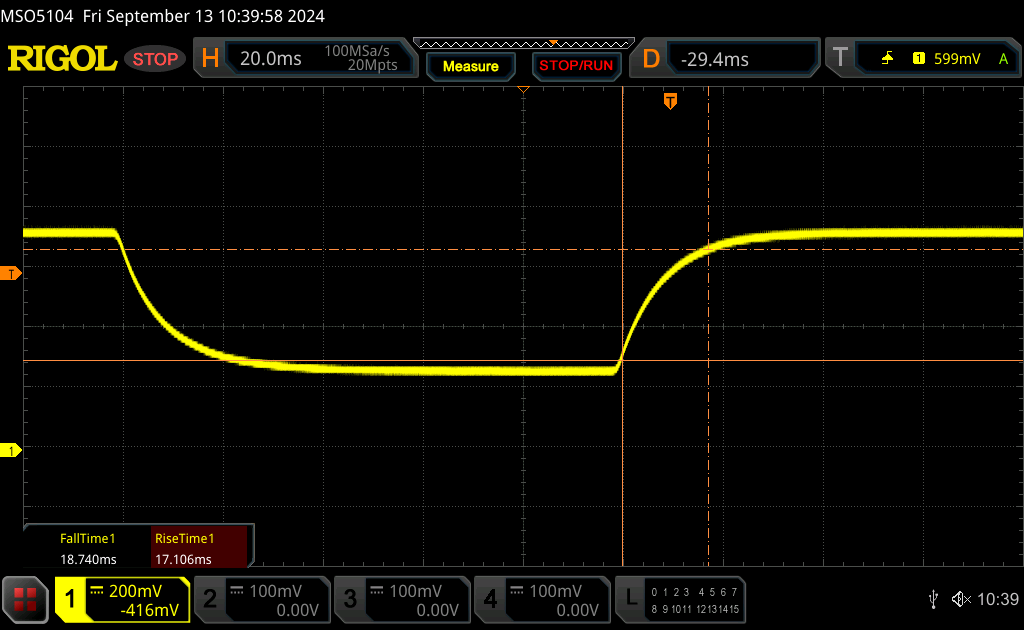 |
| ↘ 18.8 ms hösten | ||
| Skärmen visar långsamma svarsfrekvenser i våra tester och kommer att vara otillfredsställande för spelare. I jämförelse sträcker sig alla testade enheter från 0.165 (minst) till 636 (maximalt) ms. » 47 % av alla enheter är bättre. Detta innebär att den uppmätta svarstiden är sämre än genomsnittet av alla testade enheter (32.5 ms). | ||
Skärmflimmer / PWM (Puls-Width Modulation)
| Skärmflimmer / PWM upptäcktes inte | 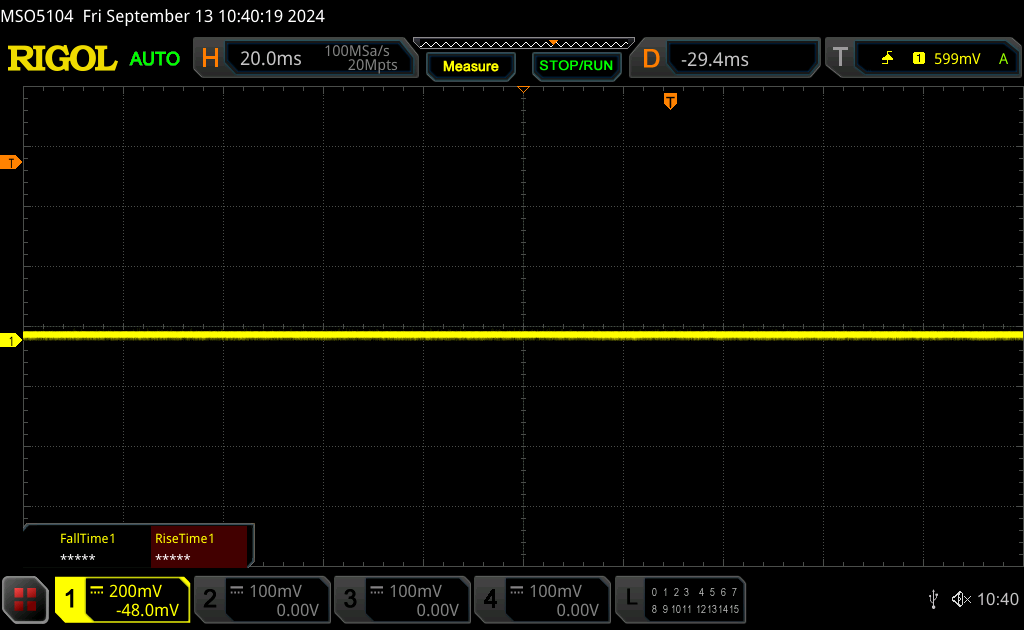 | ||
Som jämförelse: 53 % av alla testade enheter använder inte PWM för att dämpa skärmen. Om PWM upptäcktes mättes ett medelvärde av 8534 (minst: 5 - maximum: 343500) Hz. | |||
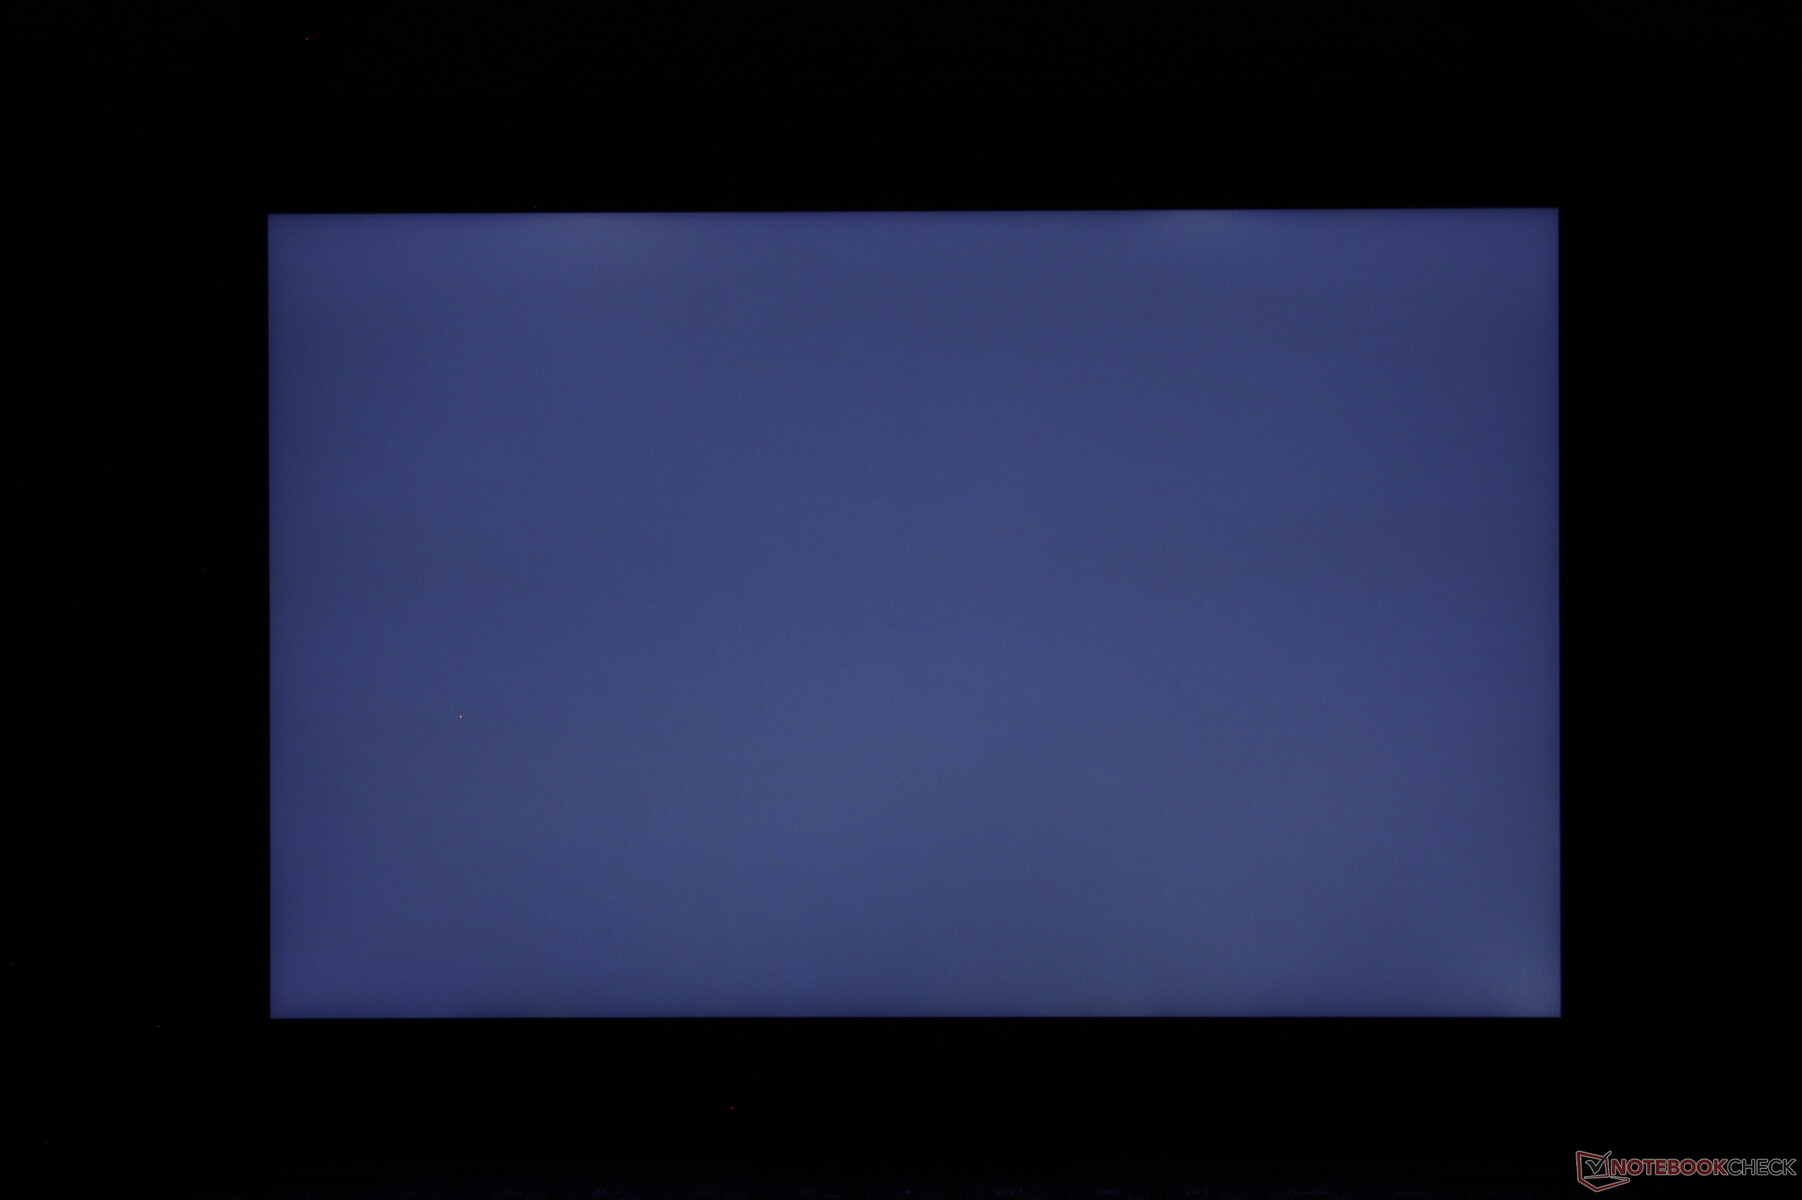
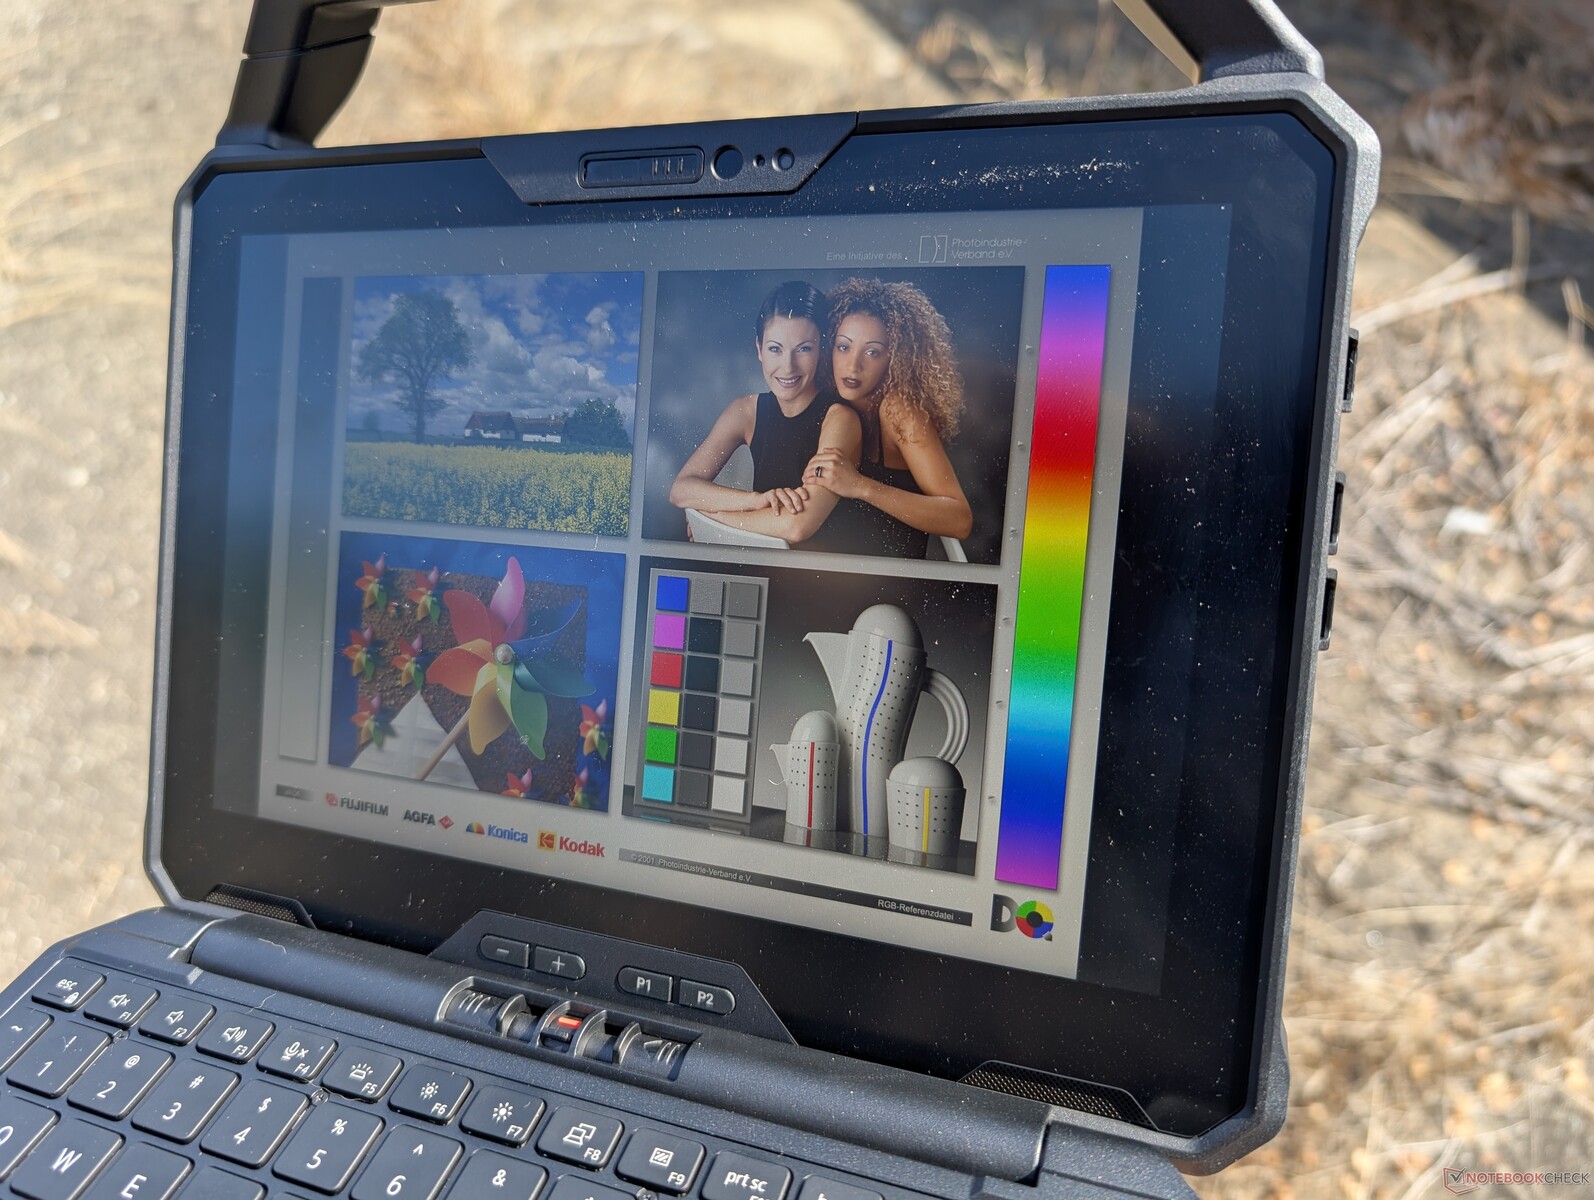
Den extra ljusstarka 1000-nit-skärmen ger god synlighet utomhus även i direkt solljus. Den matta skärmen är fortfarande bländande och färgerna är inte lika levande, men texten förblir synlig och lättläst.

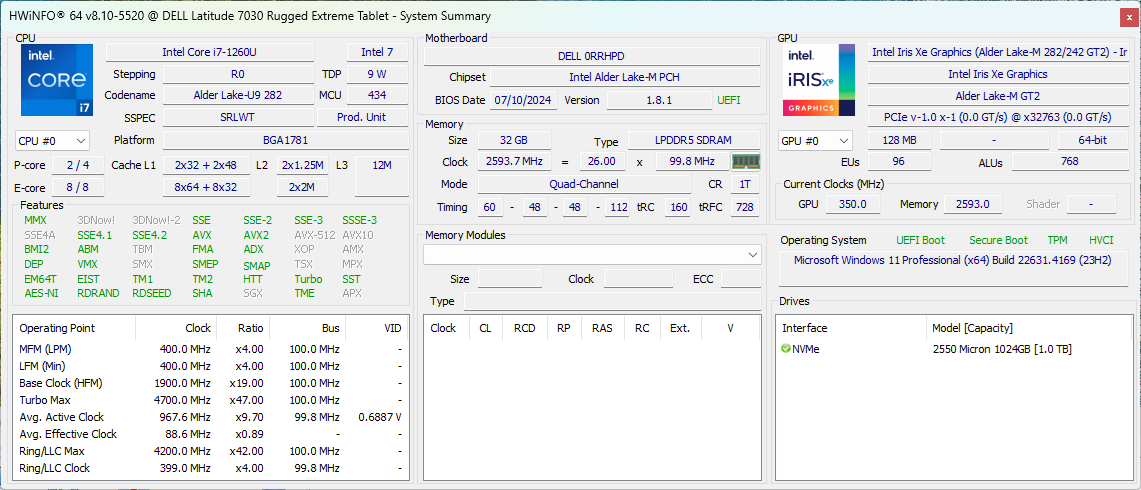
Prestanda - Alder Lake vPro
Testförhållanden
Vi ställde in Windows och Dell Optimizer i prestandaläge innan vi körde nedanstående benchmarks.
Processor
Rå processorprestanda är ganska hög för den robusta kategorin. Den nya Core i7-1260U konkurrerar med Core Ultra 7 164U på den senaste Latitude 7350 Avtagbar samtidigt som den är över 50 procent snabbare än Core i7-1185G7 i den äldre Latitude 7330 Rugged Extreme. Prestandahållbarheten är också respektabel för en surfplatta med ett underskott på bara 9 till 10 procent efter 5 eller 6 loopar i vårt stresstest CineBench R15 xT.
Om vi går ner till Core i5-1240U förväntas endast påverka prestandan med 5 till 10 procent baserat på vår tid med Latitude 7230 Rugged Extreme. Således kan Core i5-alternativet vara mer meningsfullt än vår Core i7 eftersom prestandaförlusten knappt skulle vara märkbar.
Det finns ingen integrerad NPU för lokal AI-acceleration.
Cinebench R15 Multi Loop
Cinebench R23: Multi Core | Single Core
Cinebench R20: CPU (Multi Core) | CPU (Single Core)
Cinebench R15: CPU Multi 64Bit | CPU Single 64Bit
Blender: v2.79 BMW27 CPU
7-Zip 18.03: 7z b 4 | 7z b 4 -mmt1
Geekbench 6.4: Multi-Core | Single-Core
Geekbench 5.5: Multi-Core | Single-Core
HWBOT x265 Benchmark v2.2: 4k Preset
LibreOffice : 20 Documents To PDF
R Benchmark 2.5: Overall mean
| CPU Performance Rating | |
| Dell Latitude 7030 Rugged Extreme | |
| Dell Latitude 7350 Detachable | |
| Genomsnitt Intel Core i7-1260U | |
| Dell Latitude 7230 Rugged Extreme -2! | |
| Dell Latitude 7330 Rugged Extreme -2! | |
| Acer Enduro Urban N3 EUN314 -2! | |
| Dell Latitude 5420 Rugged-P85G -14! | |
| Dell Latitude 7424 Rugged Extreme -14! | |
| Durabook R8 Tablet -2! | |
| Cinebench R23 / Multi Core | |
| Dell Latitude 7350 Detachable | |
| Dell Latitude 7030 Rugged Extreme | |
| Genomsnitt Intel Core i7-1260U (7444 - 8381, n=2) | |
| Dell Latitude 7230 Rugged Extreme | |
| Dell Latitude 7330 Rugged Extreme | |
| Acer Enduro Urban N3 EUN314 | |
| Durabook R8 Tablet | |
| Cinebench R23 / Single Core | |
| Dell Latitude 7030 Rugged Extreme | |
| Genomsnitt Intel Core i7-1260U (1538 - 1664, n=2) | |
| Dell Latitude 7350 Detachable | |
| Dell Latitude 7230 Rugged Extreme | |
| Dell Latitude 7330 Rugged Extreme | |
| Acer Enduro Urban N3 EUN314 | |
| Durabook R8 Tablet | |
| Cinebench R20 / CPU (Multi Core) | |
| Dell Latitude 7350 Detachable | |
| Dell Latitude 7030 Rugged Extreme | |
| Genomsnitt Intel Core i7-1260U (2838 - 3165, n=2) | |
| Dell Latitude 7230 Rugged Extreme | |
| Dell Latitude 7330 Rugged Extreme | |
| Acer Enduro Urban N3 EUN314 | |
| Durabook R8 Tablet | |
| Cinebench R20 / CPU (Single Core) | |
| Dell Latitude 7350 Detachable | |
| Dell Latitude 7230 Rugged Extreme | |
| Dell Latitude 7330 Rugged Extreme | |
| Genomsnitt Intel Core i7-1260U (566 - 588, n=2) | |
| Dell Latitude 7030 Rugged Extreme | |
| Acer Enduro Urban N3 EUN314 | |
| Durabook R8 Tablet | |
| Cinebench R15 / CPU Multi 64Bit | |
| Dell Latitude 7350 Detachable | |
| Dell Latitude 7030 Rugged Extreme | |
| Dell Latitude 7230 Rugged Extreme | |
| Genomsnitt Intel Core i7-1260U (1117 - 1289, n=2) | |
| Acer Enduro Urban N3 EUN314 | |
| Dell Latitude 7330 Rugged Extreme | |
| Dell Latitude 7424 Rugged Extreme | |
| Dell Latitude 5420 Rugged-P85G | |
| Durabook R8 Tablet | |
| Cinebench R15 / CPU Single 64Bit | |
| Dell Latitude 7330 Rugged Extreme | |
| Dell Latitude 7230 Rugged Extreme | |
| Dell Latitude 7350 Detachable | |
| Genomsnitt Intel Core i7-1260U (217 - 222, n=2) | |
| Dell Latitude 7030 Rugged Extreme | |
| Acer Enduro Urban N3 EUN314 | |
| Dell Latitude 5420 Rugged-P85G | |
| Dell Latitude 7424 Rugged Extreme | |
| Durabook R8 Tablet | |
| Blender / v2.79 BMW27 CPU | |
| Durabook R8 Tablet | |
| Acer Enduro Urban N3 EUN314 | |
| Dell Latitude 7330 Rugged Extreme | |
| Genomsnitt Intel Core i7-1260U (393 - 431, n=2) | |
| Dell Latitude 7230 Rugged Extreme | |
| Dell Latitude 7350 Detachable | |
| Dell Latitude 7030 Rugged Extreme | |
| 7-Zip 18.03 / 7z b 4 | |
| Dell Latitude 7030 Rugged Extreme | |
| Genomsnitt Intel Core i7-1260U (32008 - 36480, n=2) | |
| Dell Latitude 7230 Rugged Extreme | |
| Dell Latitude 7350 Detachable | |
| Acer Enduro Urban N3 EUN314 | |
| Dell Latitude 7330 Rugged Extreme | |
| Durabook R8 Tablet | |
| 7-Zip 18.03 / 7z b 4 -mmt1 | |
| Dell Latitude 7330 Rugged Extreme | |
| Acer Enduro Urban N3 EUN314 | |
| Dell Latitude 7030 Rugged Extreme | |
| Genomsnitt Intel Core i7-1260U (4746 - 5047, n=2) | |
| Dell Latitude 7350 Detachable | |
| Dell Latitude 7230 Rugged Extreme | |
| Durabook R8 Tablet | |
| Geekbench 6.4 / Multi-Core | |
| Dell Latitude 7350 Detachable | |
| Dell Latitude 7030 Rugged Extreme | |
| Genomsnitt Intel Core i7-1260U (n=1) | |
| Geekbench 6.4 / Single-Core | |
| Dell Latitude 7030 Rugged Extreme | |
| Genomsnitt Intel Core i7-1260U (n=1) | |
| Dell Latitude 7350 Detachable | |
| Geekbench 5.5 / Multi-Core | |
| Dell Latitude 7350 Detachable | |
| Dell Latitude 7030 Rugged Extreme | |
| Genomsnitt Intel Core i7-1260U (7072 - 7444, n=2) | |
| Dell Latitude 7230 Rugged Extreme | |
| Dell Latitude 7330 Rugged Extreme | |
| Acer Enduro Urban N3 EUN314 | |
| Durabook R8 Tablet | |
| Geekbench 5.5 / Single-Core | |
| Dell Latitude 7030 Rugged Extreme | |
| Genomsnitt Intel Core i7-1260U (1560 - 1662, n=2) | |
| Dell Latitude 7230 Rugged Extreme | |
| Dell Latitude 7330 Rugged Extreme | |
| Acer Enduro Urban N3 EUN314 | |
| Dell Latitude 7350 Detachable | |
| Durabook R8 Tablet | |
| HWBOT x265 Benchmark v2.2 / 4k Preset | |
| Dell Latitude 7030 Rugged Extreme | |
| Dell Latitude 7230 Rugged Extreme | |
| Genomsnitt Intel Core i7-1260U (8.54 - 9.58, n=2) | |
| Dell Latitude 7350 Detachable | |
| Dell Latitude 7330 Rugged Extreme | |
| Acer Enduro Urban N3 EUN314 | |
| Durabook R8 Tablet | |
| LibreOffice / 20 Documents To PDF | |
| Acer Enduro Urban N3 EUN314 | |
| Durabook R8 Tablet | |
| Dell Latitude 7230 Rugged Extreme | |
| Dell Latitude 7330 Rugged Extreme | |
| Genomsnitt Intel Core i7-1260U (45.9 - 51.4, n=2) | |
| Dell Latitude 7350 Detachable | |
| Dell Latitude 7030 Rugged Extreme | |
| R Benchmark 2.5 / Overall mean | |
| Durabook R8 Tablet | |
| Acer Enduro Urban N3 EUN314 | |
| Dell Latitude 7330 Rugged Extreme | |
| Dell Latitude 7230 Rugged Extreme | |
| Dell Latitude 7350 Detachable | |
| Genomsnitt Intel Core i7-1260U (0.494 - 0.53, n=2) | |
| Dell Latitude 7030 Rugged Extreme | |
* ... mindre är bättre
AIDA64: FP32 Ray-Trace | FPU Julia | CPU SHA3 | CPU Queen | FPU SinJulia | FPU Mandel | CPU AES | CPU ZLib | FP64 Ray-Trace | CPU PhotoWorxx
| Performance Rating | |
| Dell Latitude 7330 Rugged Extreme | |
| Dell Latitude 7030 Rugged Extreme | |
| Genomsnitt Intel Core i7-1260U | |
| Acer Enduro Urban N3 EUN314 | |
| Dell Latitude 7230 Rugged Extreme | |
| Dell Latitude 7350 Detachable | |
| Durabook R8 Tablet | |
| AIDA64 / FP32 Ray-Trace | |
| Dell Latitude 7330 Rugged Extreme | |
| Dell Latitude 7030 Rugged Extreme | |
| Genomsnitt Intel Core i7-1260U (6694 - 7261, n=2) | |
| Acer Enduro Urban N3 EUN314 | |
| Dell Latitude 7230 Rugged Extreme | |
| Dell Latitude 7350 Detachable | |
| Durabook R8 Tablet | |
| AIDA64 / FPU Julia | |
| Dell Latitude 7030 Rugged Extreme | |
| Genomsnitt Intel Core i7-1260U (33823 - 37371, n=2) | |
| Dell Latitude 7230 Rugged Extreme | |
| Dell Latitude 7330 Rugged Extreme | |
| Dell Latitude 7350 Detachable | |
| Acer Enduro Urban N3 EUN314 | |
| Durabook R8 Tablet | |
| AIDA64 / CPU SHA3 | |
| Dell Latitude 7330 Rugged Extreme | |
| Acer Enduro Urban N3 EUN314 | |
| Dell Latitude 7030 Rugged Extreme | |
| Genomsnitt Intel Core i7-1260U (1816 - 1949, n=2) | |
| Dell Latitude 7230 Rugged Extreme | |
| Dell Latitude 7350 Detachable | |
| Durabook R8 Tablet | |
| AIDA64 / CPU Queen | |
| Dell Latitude 7030 Rugged Extreme | |
| Dell Latitude 7330 Rugged Extreme | |
| Genomsnitt Intel Core i7-1260U (50854 - 53090, n=2) | |
| Acer Enduro Urban N3 EUN314 | |
| Dell Latitude 7230 Rugged Extreme | |
| Dell Latitude 7350 Detachable | |
| Durabook R8 Tablet | |
| AIDA64 / FPU SinJulia | |
| Dell Latitude 7330 Rugged Extreme | |
| Acer Enduro Urban N3 EUN314 | |
| Dell Latitude 7350 Detachable | |
| Dell Latitude 7030 Rugged Extreme | |
| Genomsnitt Intel Core i7-1260U (4067 - 4155, n=2) | |
| Dell Latitude 7230 Rugged Extreme | |
| Durabook R8 Tablet | |
| AIDA64 / FPU Mandel | |
| Dell Latitude 7330 Rugged Extreme | |
| Dell Latitude 7030 Rugged Extreme | |
| Acer Enduro Urban N3 EUN314 | |
| Genomsnitt Intel Core i7-1260U (16988 - 17918, n=2) | |
| Dell Latitude 7230 Rugged Extreme | |
| Dell Latitude 7350 Detachable | |
| Durabook R8 Tablet | |
| AIDA64 / CPU AES | |
| Dell Latitude 7330 Rugged Extreme | |
| Acer Enduro Urban N3 EUN314 | |
| Dell Latitude 7030 Rugged Extreme | |
| Dell Latitude 7230 Rugged Extreme | |
| Dell Latitude 7350 Detachable | |
| Genomsnitt Intel Core i7-1260U (33289 - 35061, n=2) | |
| Durabook R8 Tablet | |
| AIDA64 / CPU ZLib | |
| Dell Latitude 7030 Rugged Extreme | |
| Genomsnitt Intel Core i7-1260U (506 - 586, n=2) | |
| Dell Latitude 7230 Rugged Extreme | |
| Dell Latitude 7350 Detachable | |
| Dell Latitude 7330 Rugged Extreme | |
| Acer Enduro Urban N3 EUN314 | |
| Durabook R8 Tablet | |
| AIDA64 / FP64 Ray-Trace | |
| Dell Latitude 7330 Rugged Extreme | |
| Dell Latitude 7030 Rugged Extreme | |
| Genomsnitt Intel Core i7-1260U (3666 - 3854, n=2) | |
| Acer Enduro Urban N3 EUN314 | |
| Dell Latitude 7230 Rugged Extreme | |
| Dell Latitude 7350 Detachable | |
| Durabook R8 Tablet | |
| AIDA64 / CPU PhotoWorxx | |
| Dell Latitude 7350 Detachable | |
| Dell Latitude 7330 Rugged Extreme | |
| Dell Latitude 7030 Rugged Extreme | |
| Genomsnitt Intel Core i7-1260U (37448 - 37790, n=2) | |
| Dell Latitude 7230 Rugged Extreme | |
| Acer Enduro Urban N3 EUN314 | |
| Durabook R8 Tablet | |
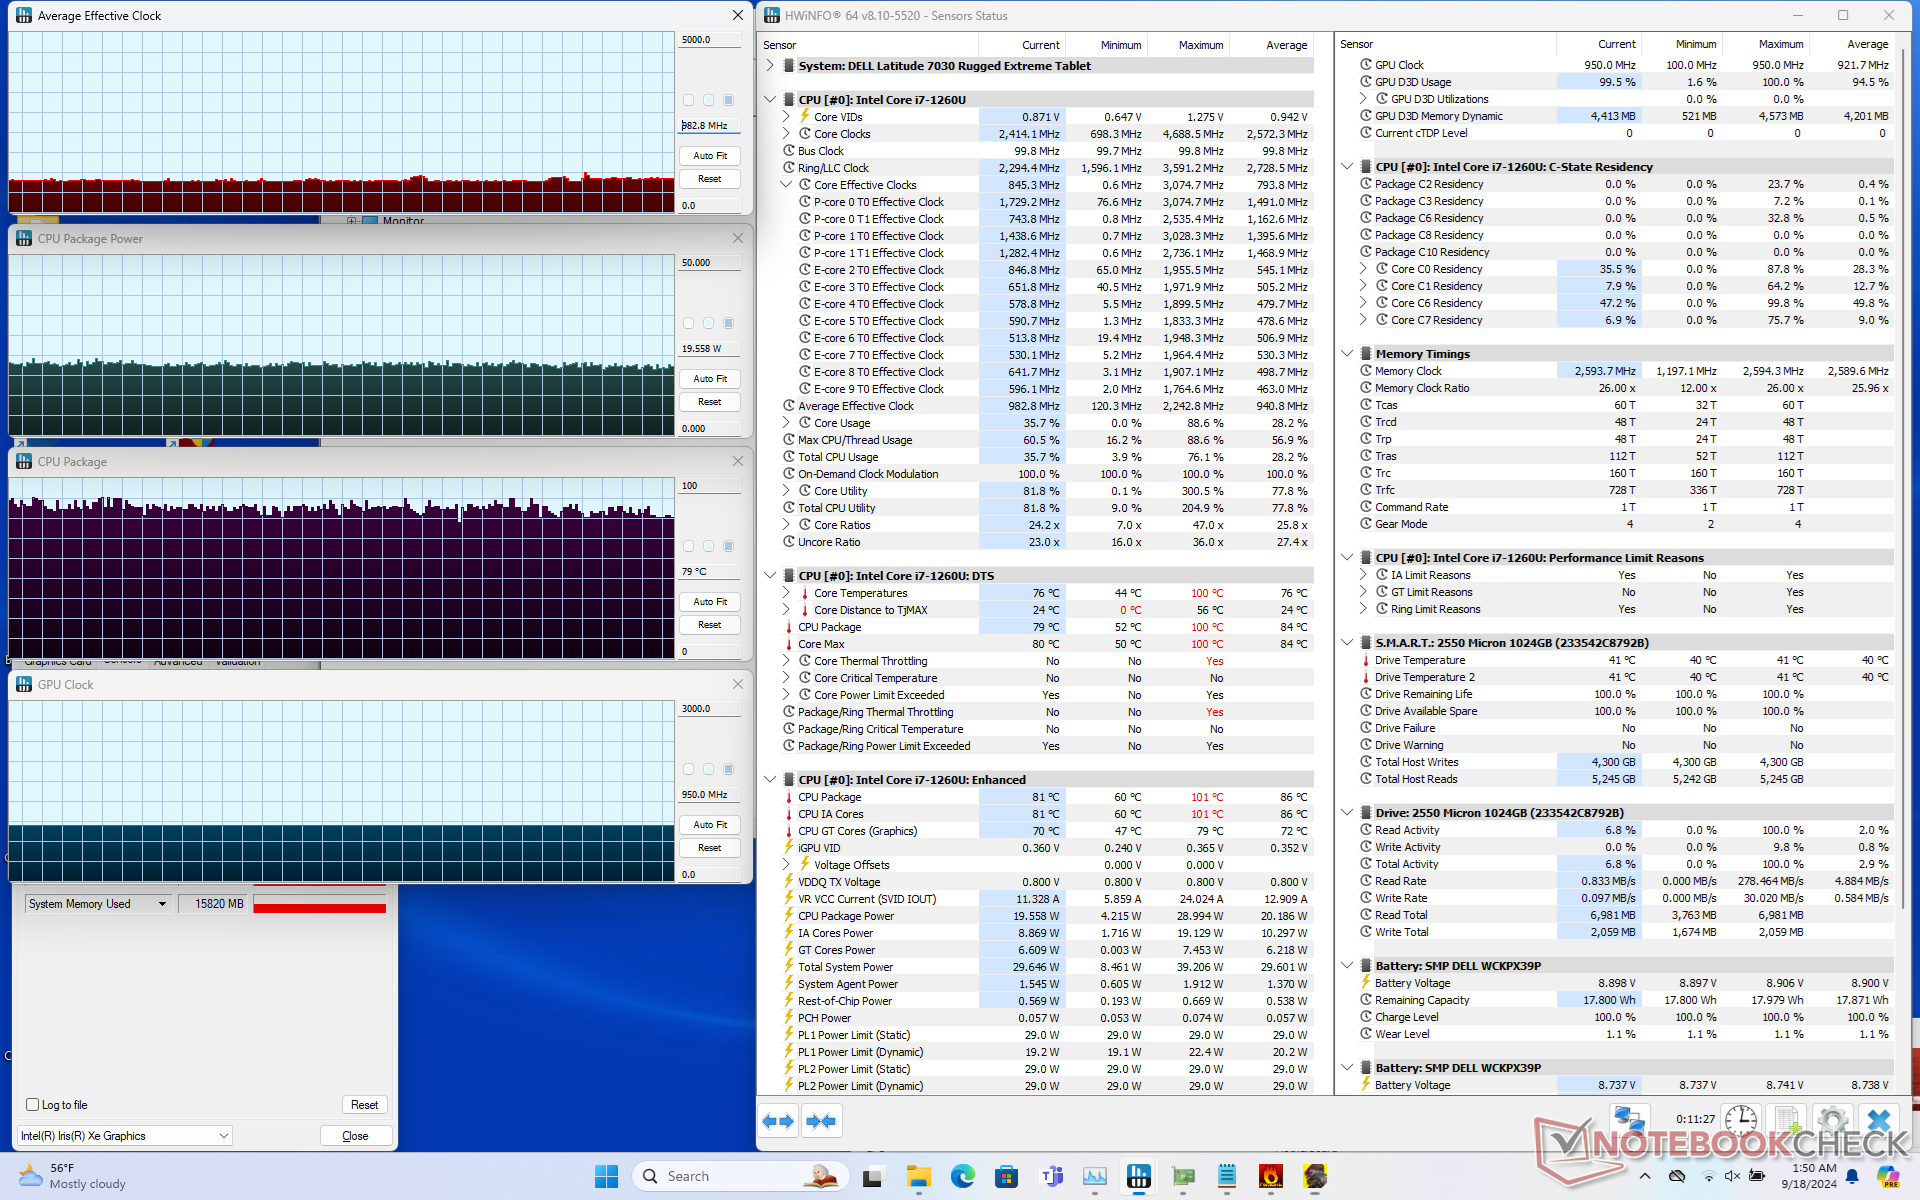
Stresstest
Processorn ökade till 2,4 GHz och 30 W när Prime95-stressen inleddes. Efter att ha nått en kärntemperatur på 100 C ungefär en minut senare skulle dock CPU:n sjunka till 2,2 GHz och 22 W för att bibehålla en mer hanterbar kärntemperatur på 92 C. Hur som helst går CPU:n mycket varm vilket är en bidragande faktor till de mycket varma yttemperaturerna.
Att köra Cyberpunk 2077 för att representera stressiga belastningar skulle visa att CPU stabiliseras vid 79 C för att vara ännu varmare än på Latitude 7350 Avtagbar.
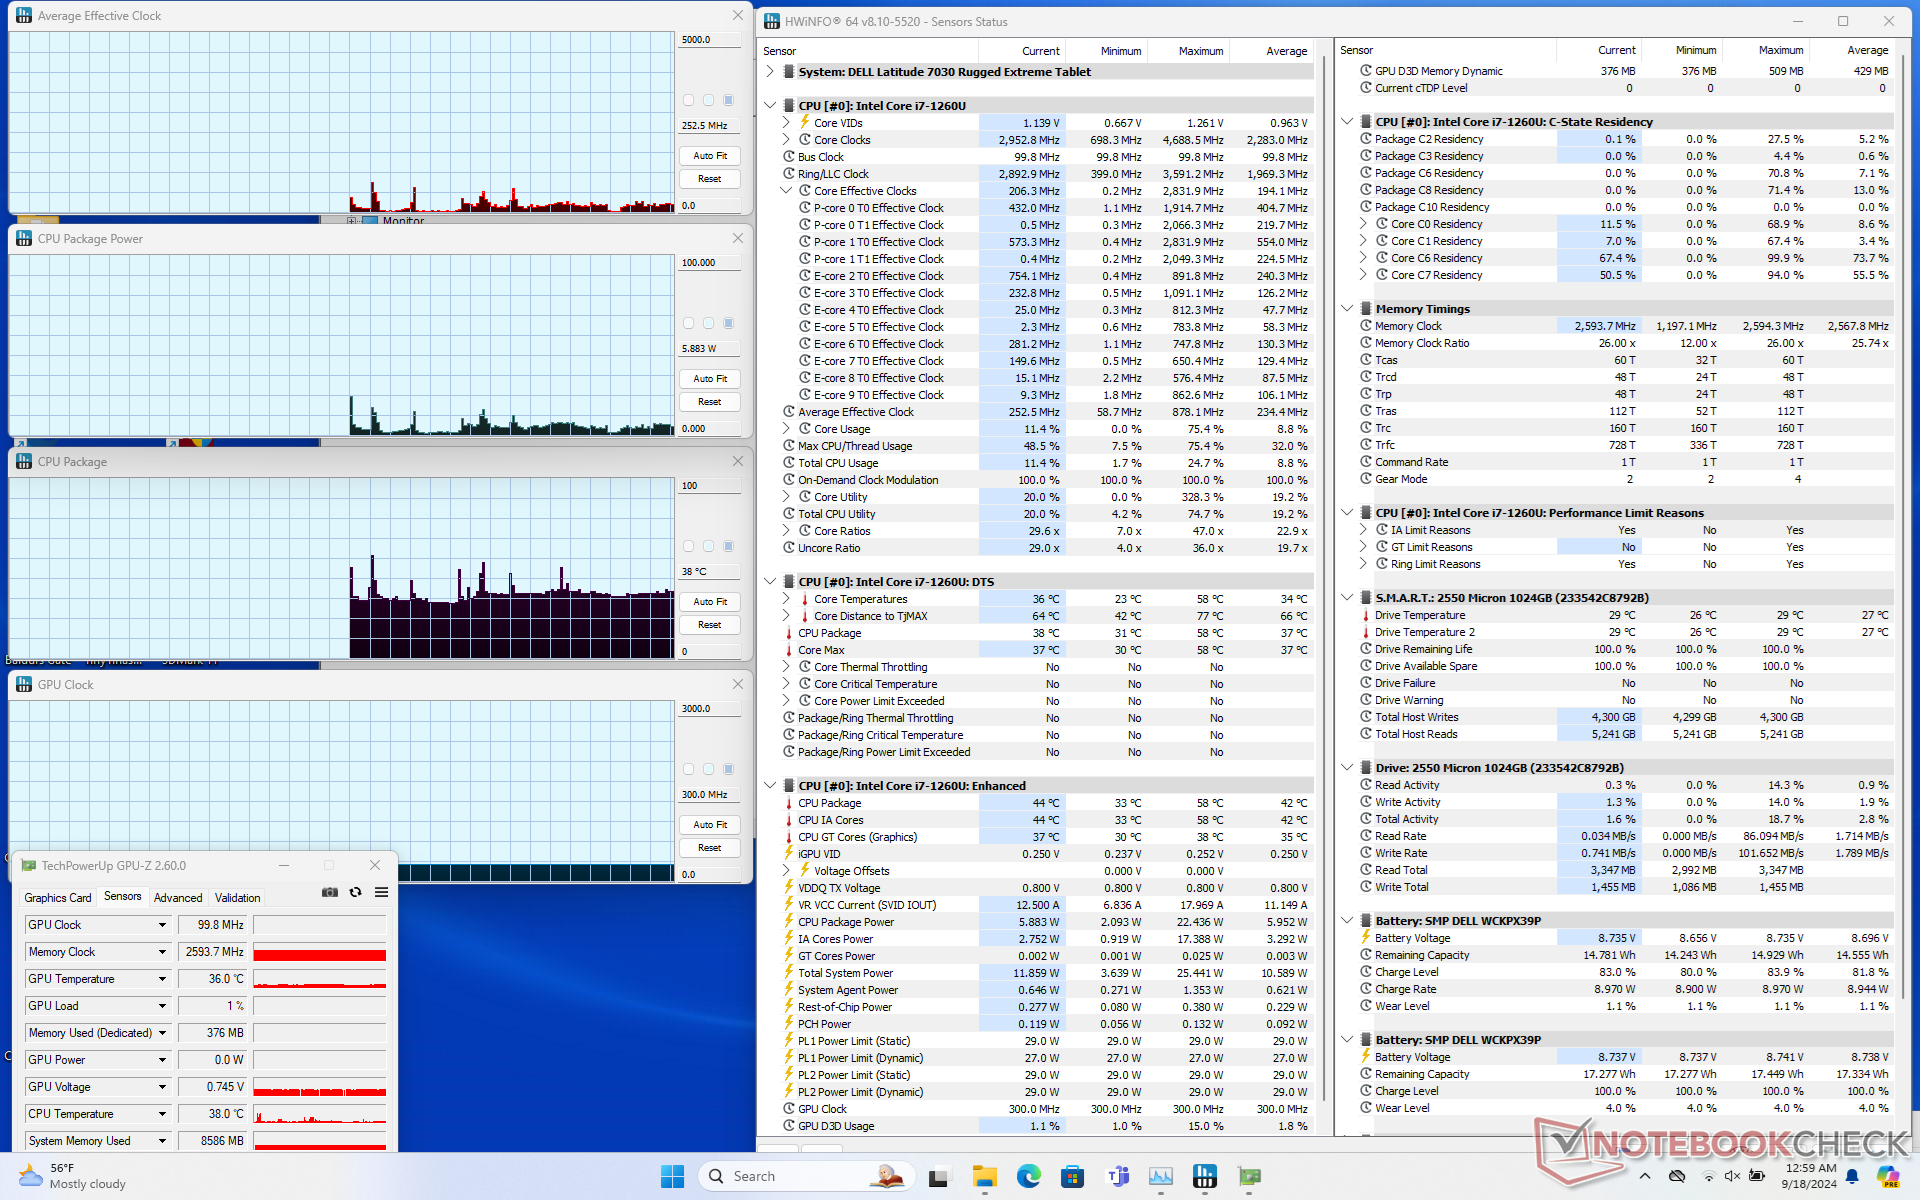
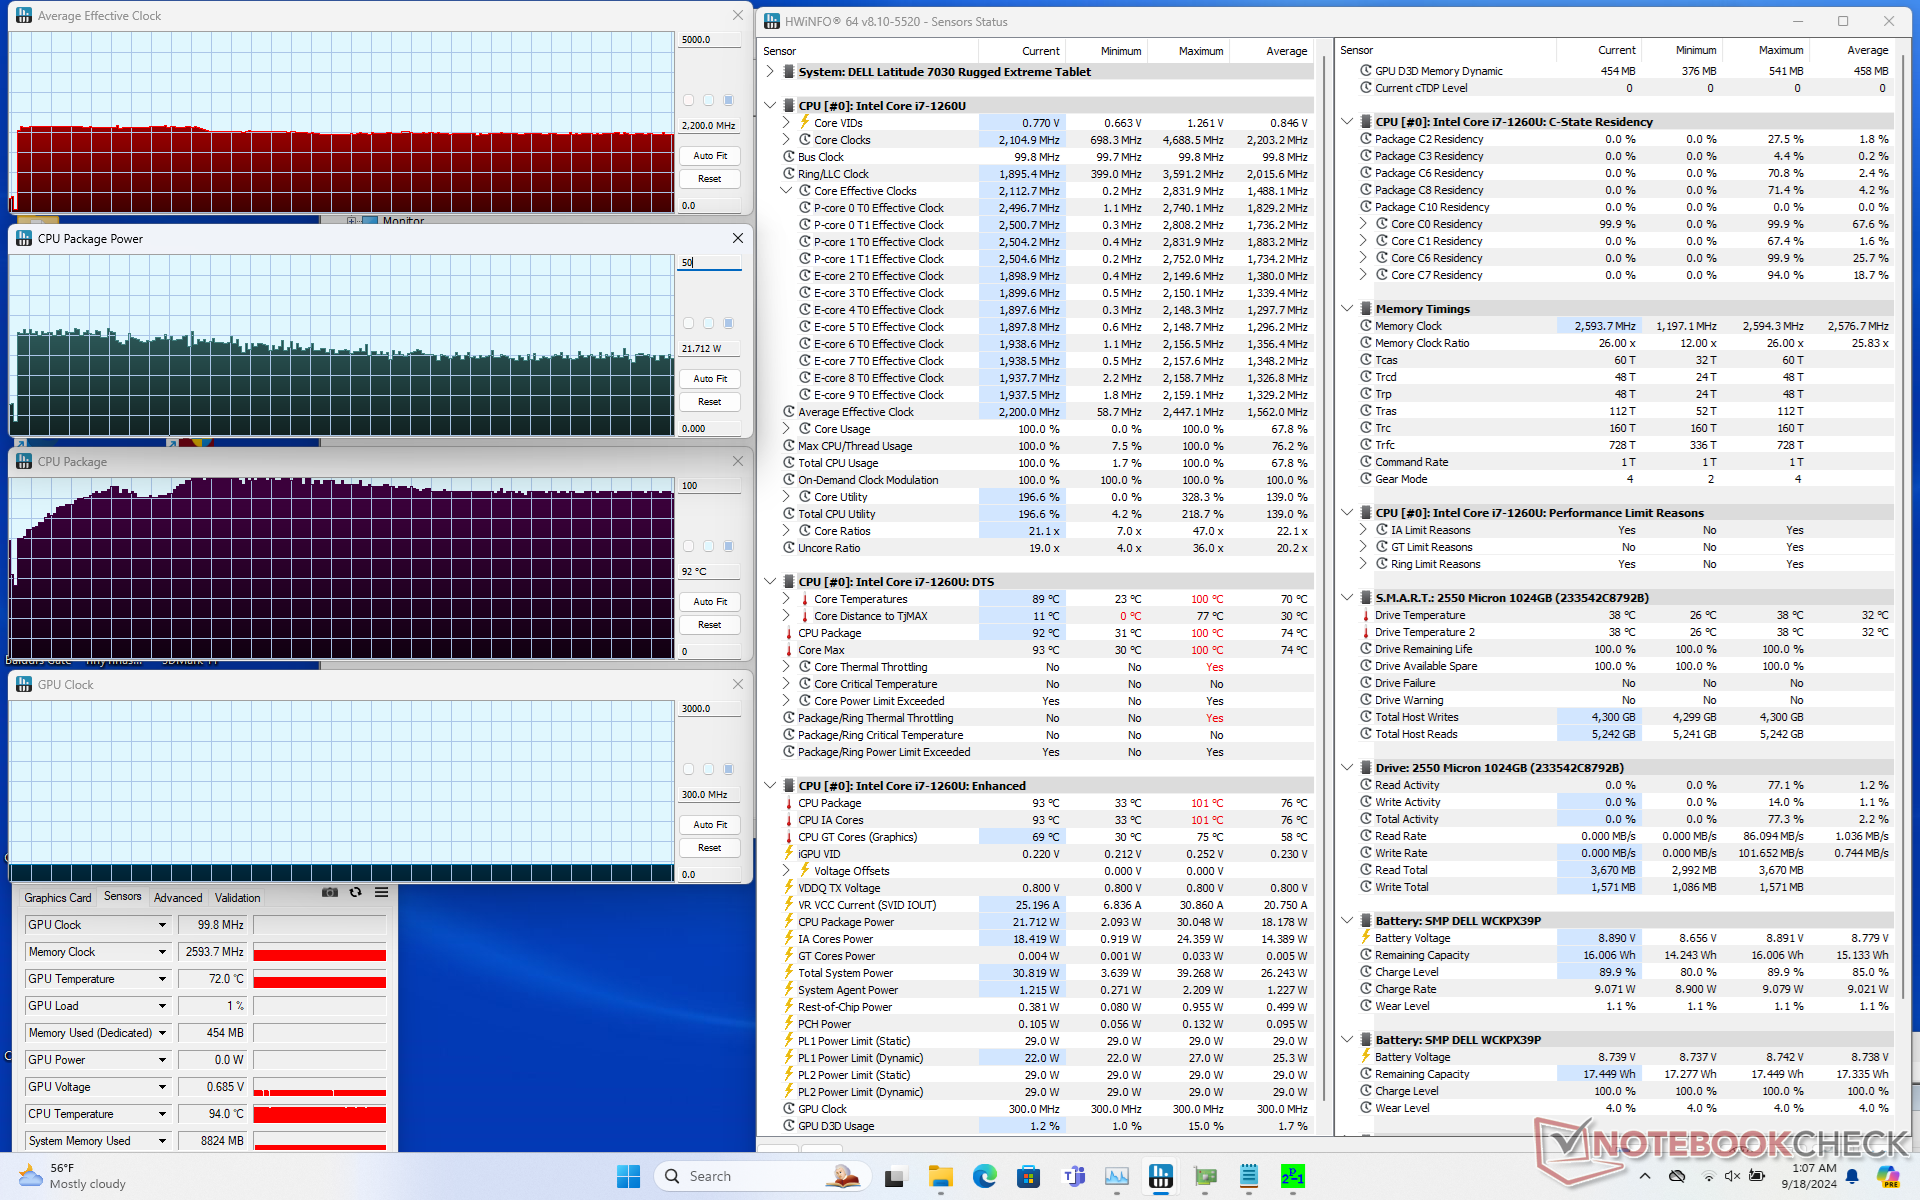
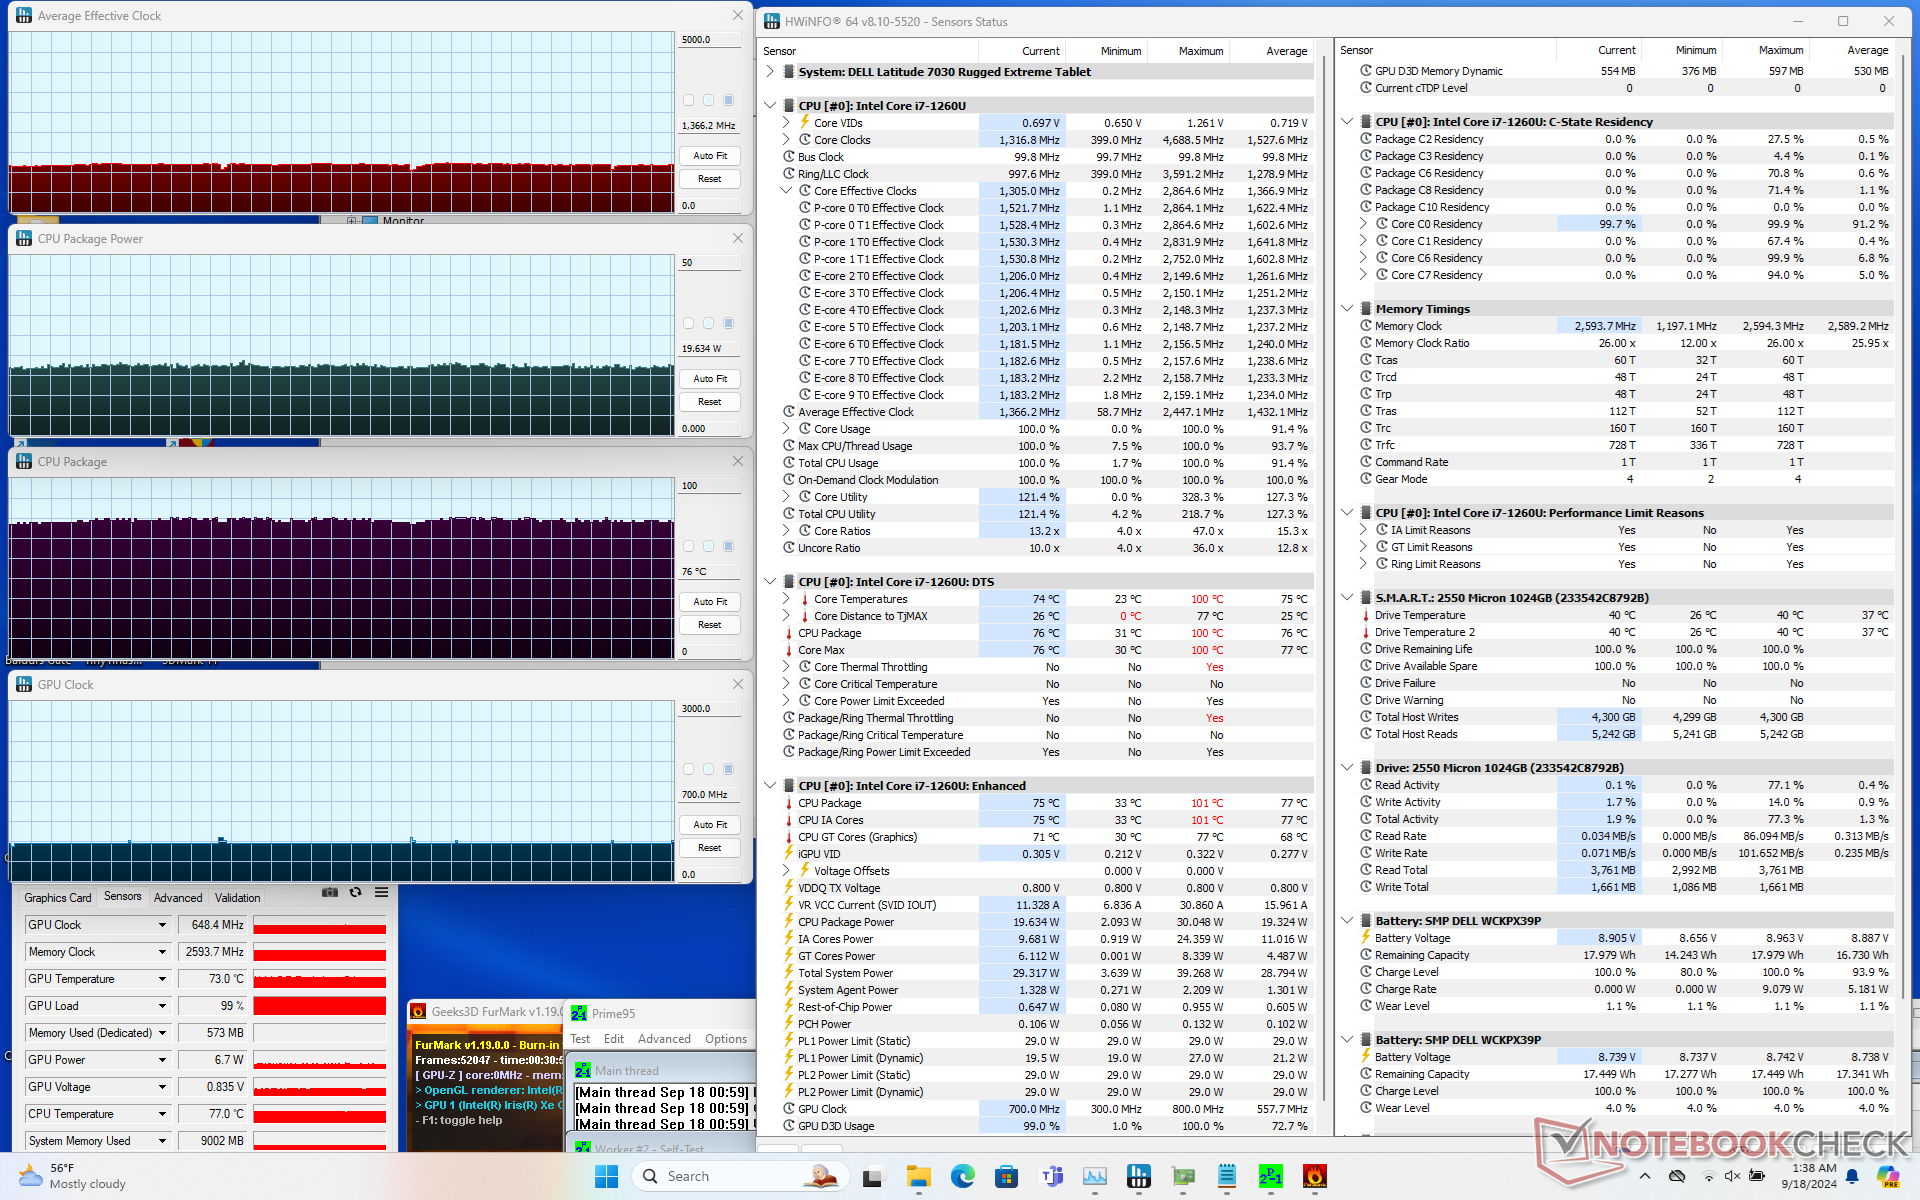
| Genomsnittlig CPU-klocka (GHz) | GPU-klocka (MHz) | Genomsnittlig CPU-temperatur (°C) | |
| System i viloläge | -- | -- | 38 |
| Prime95 Stress | 2.2 | -- | 92 |
| Prime95 + FurMark Stress | 1.4 | 700 | 76 |
| Cyberpunk 2077 Stress | 1.0 | 950 | 79 |
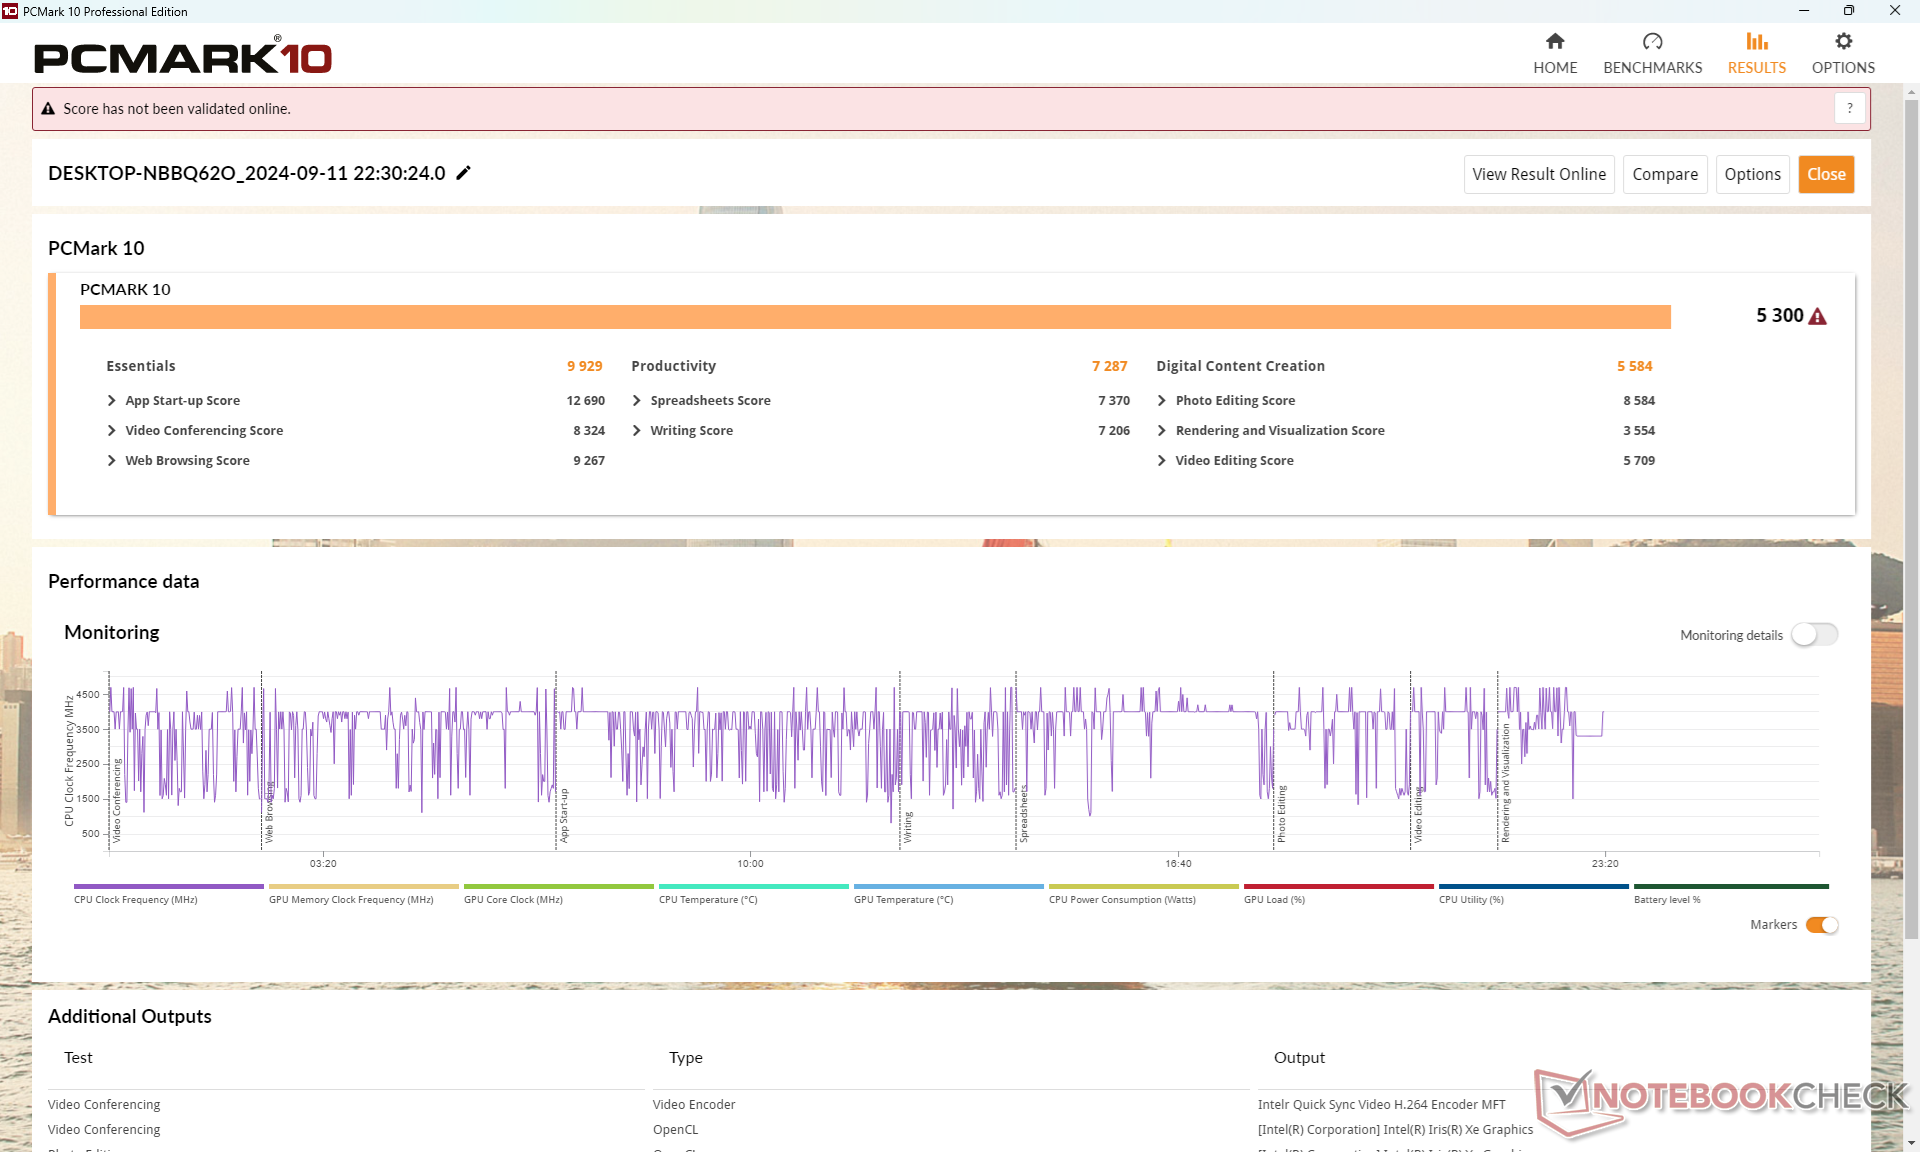
Systemets prestanda
CrossMark: Overall | Productivity | Creativity | Responsiveness
WebXPRT 3: Overall
WebXPRT 4: Overall
Mozilla Kraken 1.1: Total
| PCMark 10 / Score | |
| Dell Latitude 7350 Detachable | |
| Dell Latitude 7030 Rugged Extreme | |
| Dell Latitude 7330 Rugged Extreme | |
| Genomsnitt Intel Core i7-1260U, Intel Iris Xe Graphics G7 96EUs (5182 - 5300, n=2) | |
| Dell Latitude 7230 Rugged Extreme | |
| Acer Enduro Urban N3 EUN314 | |
| Durabook R8 Tablet | |
| PCMark 10 / Essentials | |
| Dell Latitude 7350 Detachable | |
| Dell Latitude 7330 Rugged Extreme | |
| Genomsnitt Intel Core i7-1260U, Intel Iris Xe Graphics G7 96EUs (9929 - 10179, n=2) | |
| Dell Latitude 7030 Rugged Extreme | |
| Dell Latitude 7230 Rugged Extreme | |
| Acer Enduro Urban N3 EUN314 | |
| Durabook R8 Tablet | |
| PCMark 10 / Productivity | |
| Dell Latitude 7350 Detachable | |
| Dell Latitude 7030 Rugged Extreme | |
| Genomsnitt Intel Core i7-1260U, Intel Iris Xe Graphics G7 96EUs (7056 - 7287, n=2) | |
| Dell Latitude 7330 Rugged Extreme | |
| Dell Latitude 7230 Rugged Extreme | |
| Acer Enduro Urban N3 EUN314 | |
| Durabook R8 Tablet | |
| PCMark 10 / Digital Content Creation | |
| Dell Latitude 7350 Detachable | |
| Dell Latitude 7330 Rugged Extreme | |
| Dell Latitude 7030 Rugged Extreme | |
| Genomsnitt Intel Core i7-1260U, Intel Iris Xe Graphics G7 96EUs (5258 - 5584, n=2) | |
| Acer Enduro Urban N3 EUN314 | |
| Dell Latitude 7230 Rugged Extreme | |
| Durabook R8 Tablet | |
| CrossMark / Overall | |
| Dell Latitude 7030 Rugged Extreme | |
| Genomsnitt Intel Core i7-1260U, Intel Iris Xe Graphics G7 96EUs (n=1) | |
| Dell Latitude 7230 Rugged Extreme | |
| Dell Latitude 7350 Detachable | |
| Durabook R8 Tablet | |
| CrossMark / Productivity | |
| Dell Latitude 7030 Rugged Extreme | |
| Genomsnitt Intel Core i7-1260U, Intel Iris Xe Graphics G7 96EUs (n=1) | |
| Dell Latitude 7350 Detachable | |
| Dell Latitude 7230 Rugged Extreme | |
| Durabook R8 Tablet | |
| CrossMark / Creativity | |
| Dell Latitude 7030 Rugged Extreme | |
| Genomsnitt Intel Core i7-1260U, Intel Iris Xe Graphics G7 96EUs (n=1) | |
| Dell Latitude 7230 Rugged Extreme | |
| Dell Latitude 7350 Detachable | |
| Durabook R8 Tablet | |
| CrossMark / Responsiveness | |
| Dell Latitude 7350 Detachable | |
| Dell Latitude 7030 Rugged Extreme | |
| Genomsnitt Intel Core i7-1260U, Intel Iris Xe Graphics G7 96EUs (n=1) | |
| Dell Latitude 7230 Rugged Extreme | |
| Durabook R8 Tablet | |
| WebXPRT 3 / Overall | |
| Dell Latitude 7230 Rugged Extreme | |
| Dell Latitude 7030 Rugged Extreme | |
| Dell Latitude 7330 Rugged Extreme | |
| Genomsnitt Intel Core i7-1260U, Intel Iris Xe Graphics G7 96EUs (236 - 256, n=2) | |
| Dell Latitude 7350 Detachable | |
| Durabook R8 Tablet | |
| Acer Enduro Urban N3 EUN314 | |
| WebXPRT 4 / Overall | |
| Dell Latitude 7350 Detachable | |
| Dell Latitude 7030 Rugged Extreme | |
| Dell Latitude 7230 Rugged Extreme | |
| Genomsnitt Intel Core i7-1260U, Intel Iris Xe Graphics G7 96EUs (213 - 222, n=2) | |
| Durabook R8 Tablet | |
| Mozilla Kraken 1.1 / Total | |
| Acer Enduro Urban N3 EUN314 | |
| Dell Latitude 7330 Rugged Extreme | |
| Durabook R8 Tablet | |
| Dell Latitude 7230 Rugged Extreme | |
| Dell Latitude 7350 Detachable | |
| Dell Latitude 7030 Rugged Extreme | |
| Genomsnitt Intel Core i7-1260U, Intel Iris Xe Graphics G7 96EUs (572 - 583, n=2) | |
* ... mindre är bättre
| PCMark 10 Score | 5300 poäng | |
Hjälp | ||
| AIDA64 / Memory Copy | |
| Dell Latitude 7350 Detachable | |
| Genomsnitt Intel Core i7-1260U (68849 - 69994, n=2) | |
| Dell Latitude 7030 Rugged Extreme | |
| Dell Latitude 7230 Rugged Extreme | |
| Dell Latitude 7330 Rugged Extreme | |
| Acer Enduro Urban N3 EUN314 | |
| Durabook R8 Tablet | |
| AIDA64 / Memory Read | |
| Dell Latitude 7330 Rugged Extreme | |
| Genomsnitt Intel Core i7-1260U (59219 - 60804, n=2) | |
| Dell Latitude 7030 Rugged Extreme | |
| Dell Latitude 7230 Rugged Extreme | |
| Dell Latitude 7350 Detachable | |
| Acer Enduro Urban N3 EUN314 | |
| Durabook R8 Tablet | |
| AIDA64 / Memory Write | |
| Dell Latitude 7330 Rugged Extreme | |
| Genomsnitt Intel Core i7-1260U (62367 - 63786, n=2) | |
| Dell Latitude 7230 Rugged Extreme | |
| Dell Latitude 7030 Rugged Extreme | |
| Dell Latitude 7350 Detachable | |
| Acer Enduro Urban N3 EUN314 | |
| Durabook R8 Tablet | |
| AIDA64 / Memory Latency | |
| Dell Latitude 7350 Detachable | |
| Dell Latitude 7230 Rugged Extreme | |
| Genomsnitt Intel Core i7-1260U (107.2 - 107.7, n=2) | |
| Dell Latitude 7030 Rugged Extreme | |
| Durabook R8 Tablet | |
| Dell Latitude 7330 Rugged Extreme | |
| Acer Enduro Urban N3 EUN314 | |
* ... mindre är bättre
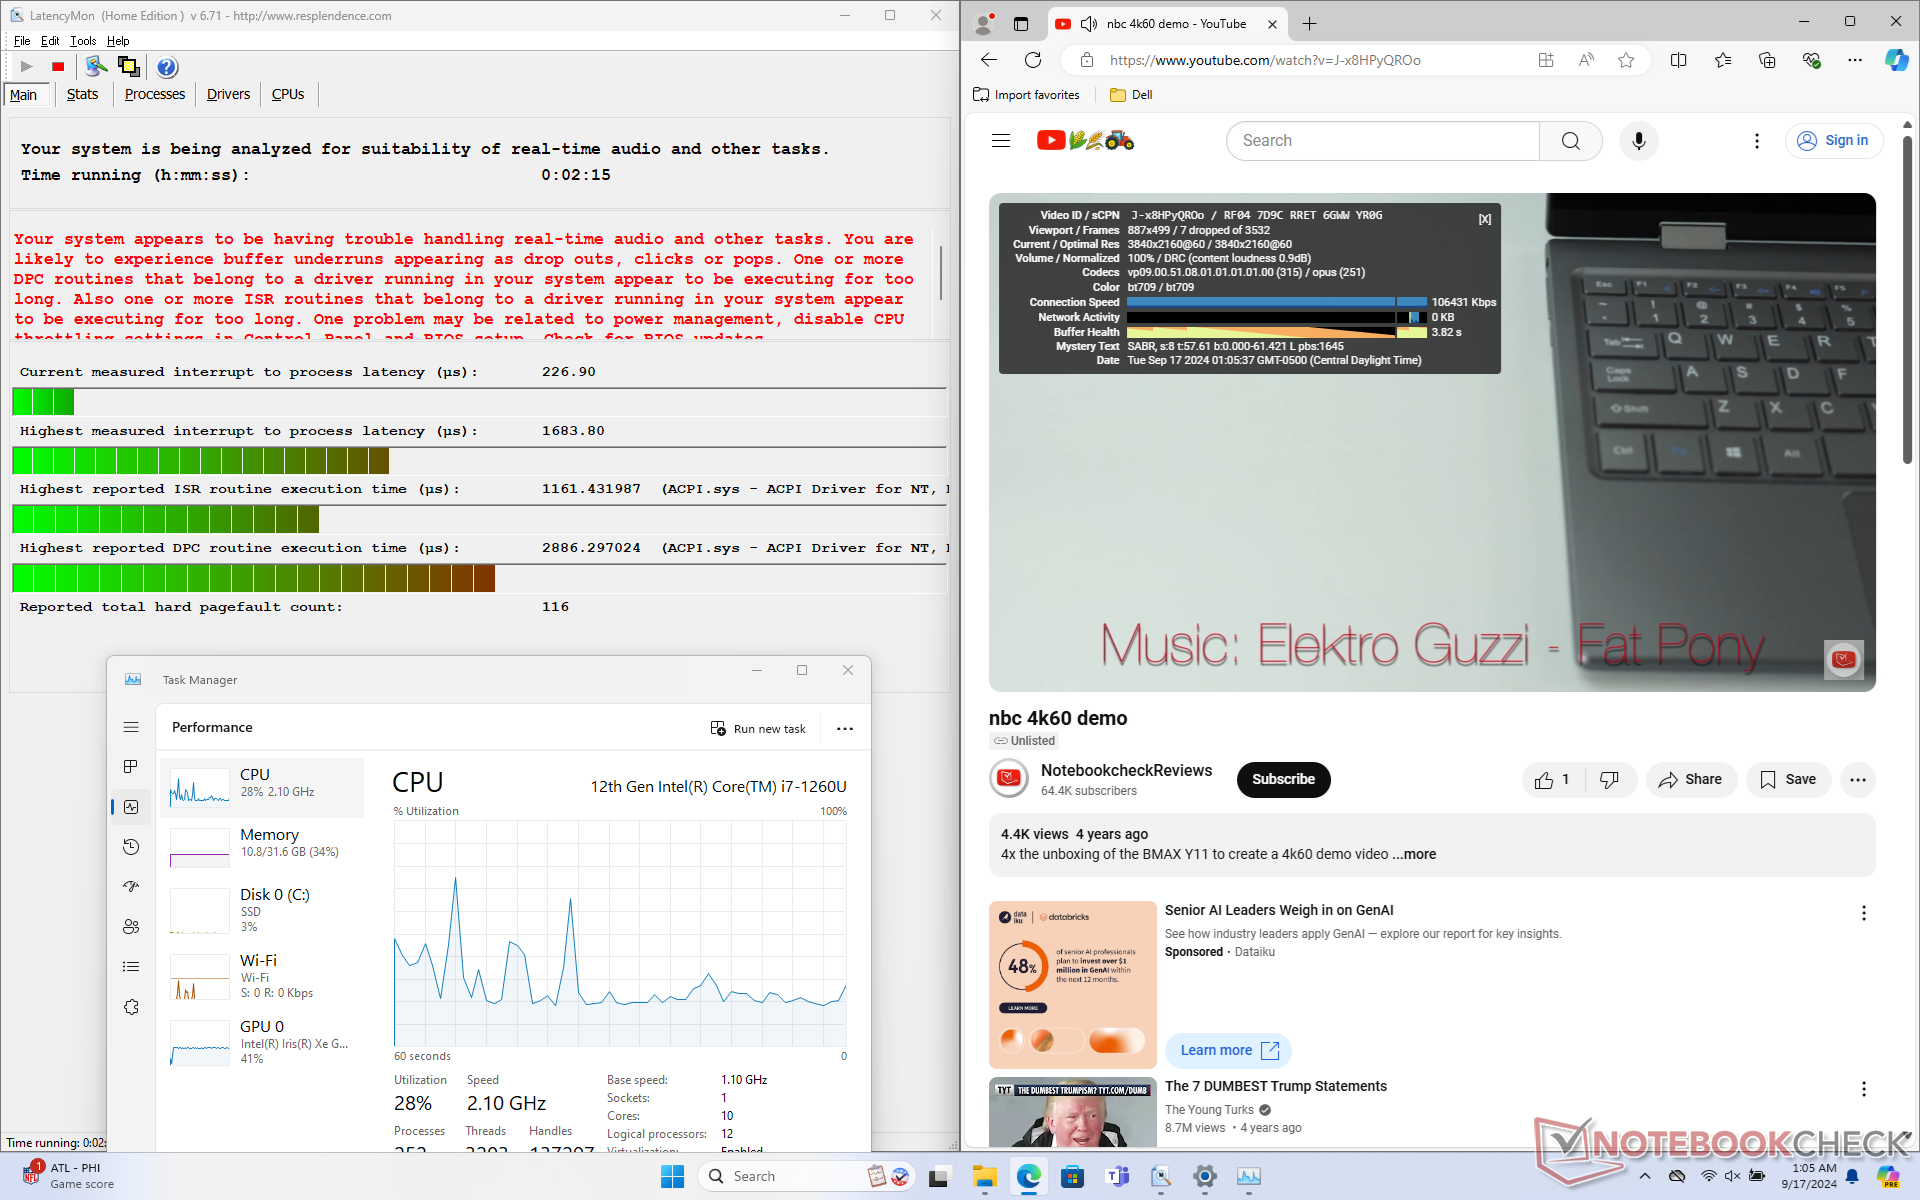
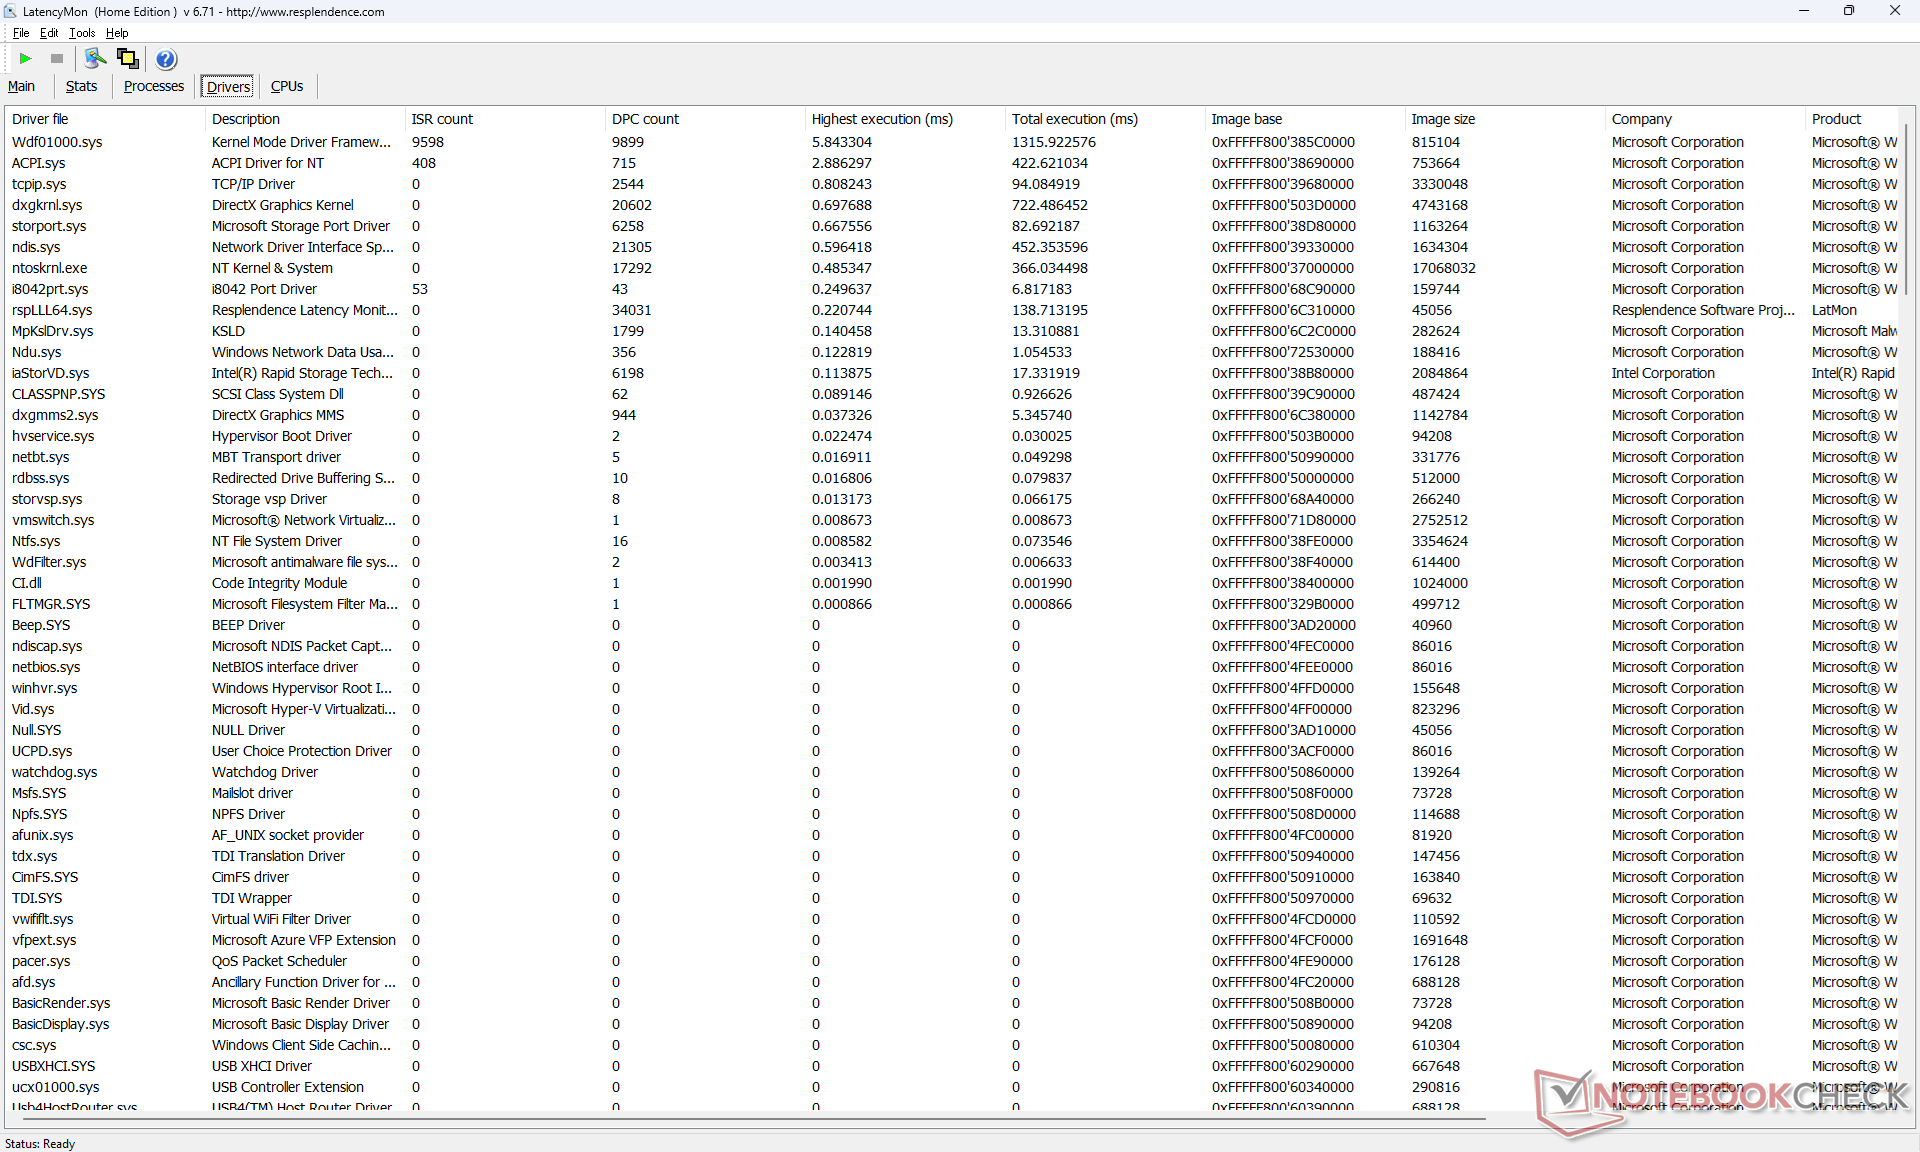
DPC-fördröjning
LatencyMon avslöjar DPC-problem och 7 tappade bildrutor under vårt 60 sekunder långa 4K60-videouppspelningstest.
| DPC Latencies / LatencyMon - interrupt to process latency (max), Web, Youtube, Prime95 | |
| Acer Enduro Urban N3 EUN314 | |
| Dell Latitude 7230 Rugged Extreme | |
| Dell Latitude 7030 Rugged Extreme | |
| Dell Latitude 7350 Detachable | |
| Durabook R8 Tablet | |
| Dell Latitude 7330 Rugged Extreme | |
* ... mindre är bättre
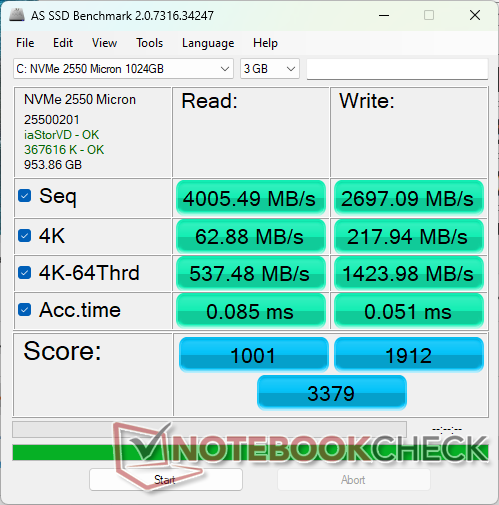
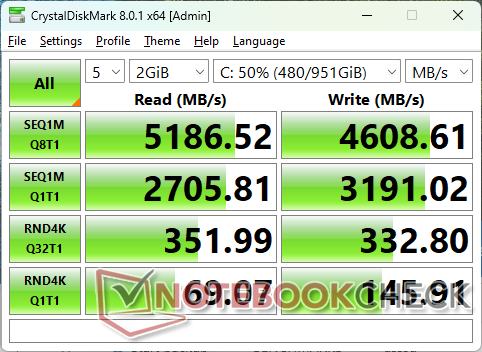
Lagringsenheter
Vår enhet levereras med samma Micron 2550 PCIe4 x4 NVMe SSD som finns på den senaste Latitude 7350 Detachable. Prestandan är snabbare än WD PC SN740 i Latitude 7230 Rugged Extreme och utan någon strypning över tid också.
Endast korta M.2 2230 SSD-enheter stöds med valfria SED-konfigurationer.

* ... mindre är bättre
Disk Throttling: DiskSpd Read Loop, Queue Depth 8
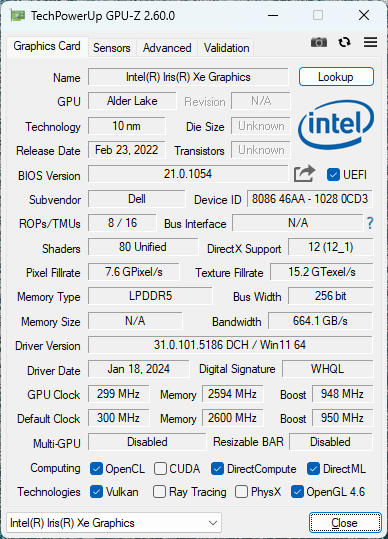
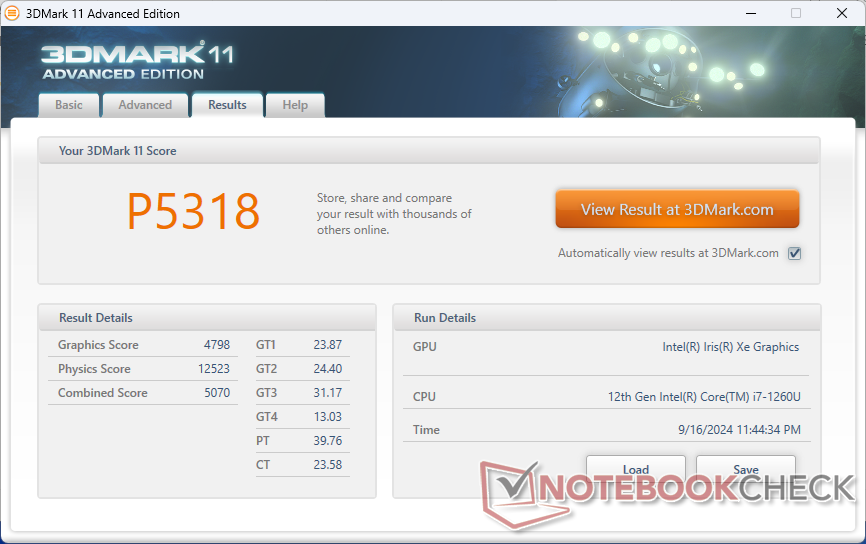
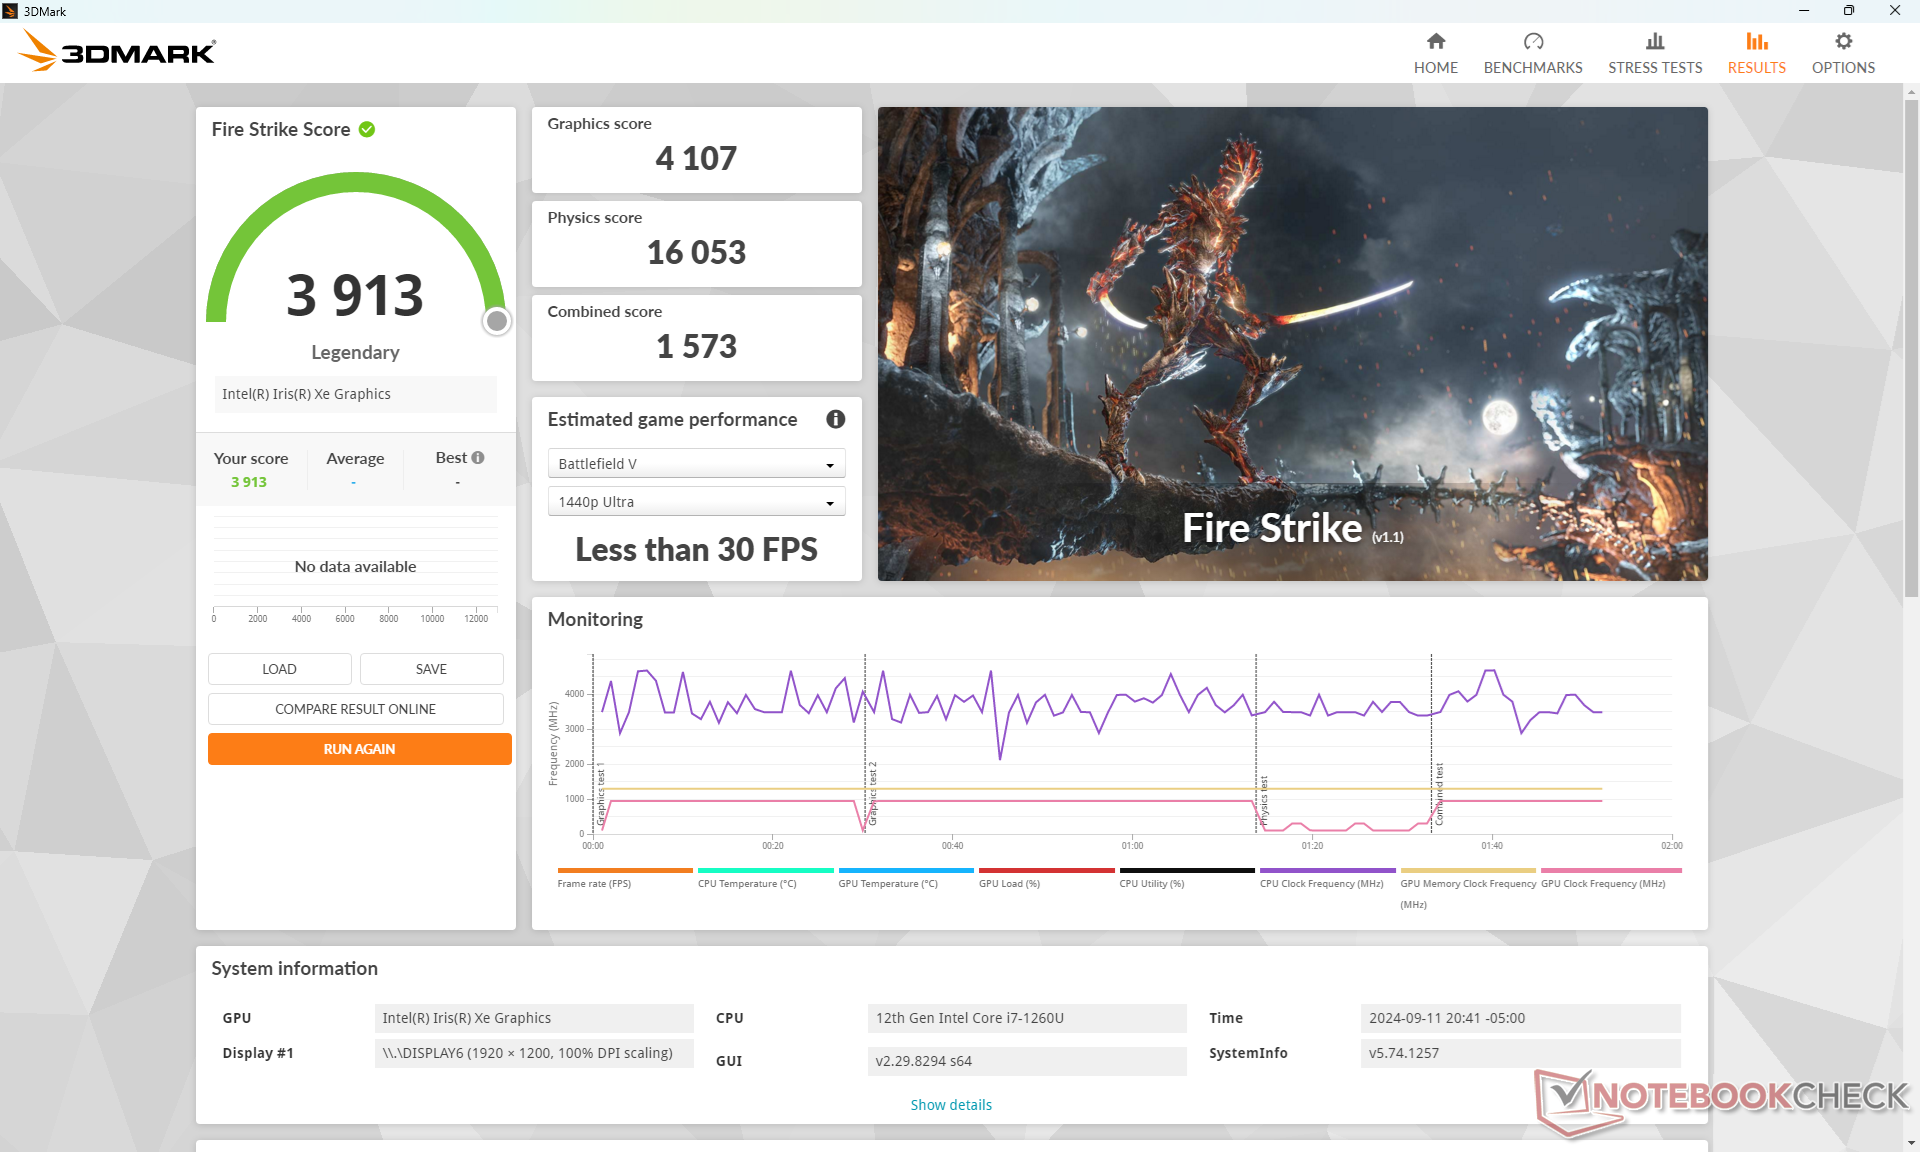
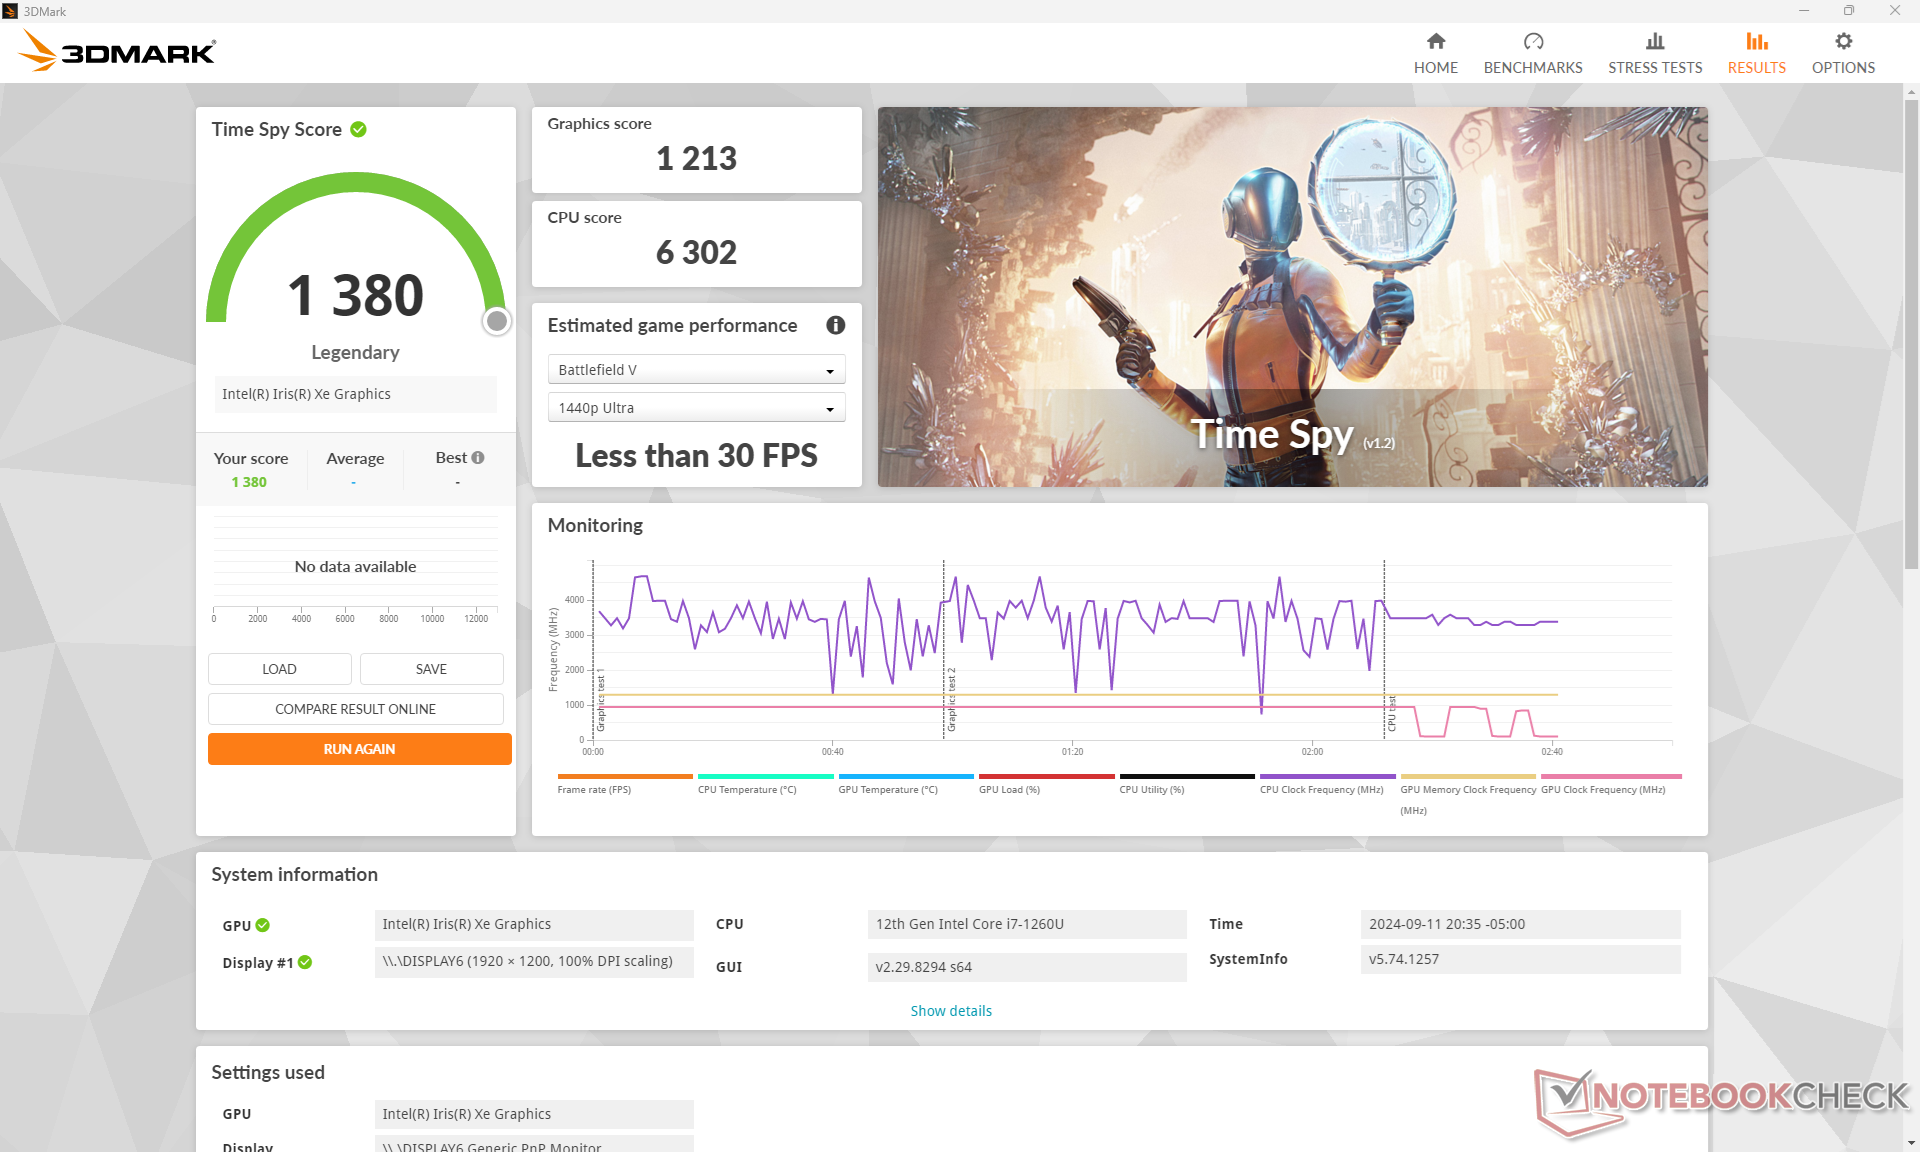
GPU-prestanda
Den integrerade Iris Xe 96 EUs är ingen överraskning eftersom det är en äldre GPU som finns i många andra datorer med processorer i Core-U-serien. På Latitude 7030 Rugged Extreme går den dock cirka 20 procent långsammare än den genomsnittliga bärbara datorn i vår databas som är utrustad med samma GPU.
| Kraftprofil | Grafikpoäng | Fysikpoäng | Kombinerad poäng |
| Prestanda-läge | 4107 | 16053 | 1573 |
| Balanserat läge | 4090 (-0%) | 16077 (-0%) | 1581 (-0%) |
| Batterikraft | 3973 (-3%) | 10424 (-35%) | 1263 (-20%) |
Att köra i balanserat läge istället för prestandaläge påverkar inte prestandan enligt vår Fire Strike resultattabell ovan. Processorns prestanda försämras dock kraftigt om den körs på batteriström.
| 3DMark Performance Rating - Percent | |
| Dell Latitude 7330 Rugged Extreme | |
| Dell Latitude 7350 Detachable | |
| Acer Enduro Urban N3 EUN314 | |
| Genomsnitt Intel Iris Xe Graphics G7 96EUs | |
| Dell Latitude 7424 Rugged Extreme -2! | |
| Dell Latitude 7030 Rugged Extreme | |
| Dell Latitude 7230 Rugged Extreme | |
| Dell Latitude 5420 Rugged-P85G | |
| Durabook R8 Tablet | |
| 3DMark 11 - 1280x720 Performance GPU | |
| Acer Enduro Urban N3 EUN314 | |
| Dell Latitude 7330 Rugged Extreme | |
| Genomsnitt Intel Iris Xe Graphics G7 96EUs (2867 - 7676, n=204) | |
| Dell Latitude 7350 Detachable | |
| Dell Latitude 5420 Rugged-P85G | |
| Dell Latitude 7424 Rugged Extreme | |
| Dell Latitude 7030 Rugged Extreme | |
| Dell Latitude 7230 Rugged Extreme | |
| Durabook R8 Tablet | |
| 3DMark 11 Performance | 5318 poäng | |
| 3DMark Cloud Gate Standard Score | 14930 poäng | |
| 3DMark Fire Strike Score | 3913 poäng | |
| 3DMark Time Spy Score | 1380 poäng | |
Hjälp | ||
| Blender | |
| v3.3 Classroom CPU | |
| Durabook R8 Tablet | |
| Dell Latitude 7350 Detachable | |
| Dell Latitude 7230 Rugged Extreme | |
| Dell Latitude 7030 Rugged Extreme | |
| Genomsnitt Intel Iris Xe Graphics G7 96EUs (336 - 1259, n=103) | |
| v3.3 Classroom oneAPI/Intel | |
| Dell Latitude 7350 Detachable | |
* ... mindre är bättre
| GTA V - 1920x1080 Highest Settings possible AA:4xMSAA + FX AF:16x | |
| Dell Latitude 7030 Rugged Extreme | |
| Acer Enduro Urban N3 EUN314 | |
| Dell Latitude 7230 Rugged Extreme | |
| Dell Latitude 7350 Detachable | |
| Final Fantasy XV Benchmark - 1920x1080 High Quality | |
| Dell Latitude 7330 Rugged Extreme | |
| Acer Enduro Urban N3 EUN314 | |
| Dell Latitude 7350 Detachable | |
| Dell Latitude 7030 Rugged Extreme | |
| Dell Latitude 7230 Rugged Extreme | |
| Strange Brigade - 1920x1080 ultra AA:ultra AF:16 | |
| Dell Latitude 7350 Detachable | |
| Acer Enduro Urban N3 EUN314 | |
| Dell Latitude 7030 Rugged Extreme | |
| Dell Latitude 7230 Rugged Extreme | |
| Dota 2 Reborn - 1920x1080 ultra (3/3) best looking | |
| Dell Latitude 7330 Rugged Extreme | |
| Dell Latitude 7030 Rugged Extreme | |
| Dell Latitude 7350 Detachable | |
| Dell Latitude 7230 Rugged Extreme | |
| Acer Enduro Urban N3 EUN314 | |
| Durabook R8 Tablet | |
| X-Plane 11.11 - 1920x1080 high (fps_test=3) | |
| Acer Enduro Urban N3 EUN314 | |
| Dell Latitude 7350 Detachable | |
| Dell Latitude 7030 Rugged Extreme | |
| Dell Latitude 7330 Rugged Extreme | |
| Dell Latitude 7230 Rugged Extreme | |
| Durabook R8 Tablet | |
| Far Cry 5 - 1920x1080 Ultra Preset AA:T | |
| Dell Latitude 7350 Detachable | |
| Dell Latitude 7030 Rugged Extreme | |
| Acer Enduro Urban N3 EUN314 | |
| Baldur's Gate 3 | |
| 1280x720 Low Preset | |
| Genomsnitt Intel Iris Xe Graphics G7 96EUs (14.5 - 66.1, n=9) | |
| Dell Latitude 7350 Detachable | |
| Dell Latitude 7030 Rugged Extreme | |
| 1920x1080 Low Preset | |
| Genomsnitt Intel Iris Xe Graphics G7 96EUs (9.4 - 29.3, n=9) | |
| Dell Latitude 7350 Detachable | |
| Dell Latitude 7030 Rugged Extreme | |
| Final Fantasy XV Benchmark | |
| 1280x720 Lite Quality | |
| Dell Latitude 7330 Rugged Extreme | |
| Acer Enduro Urban N3 EUN314 | |
| Genomsnitt Intel Iris Xe Graphics G7 96EUs (14.9 - 56.5, n=185) | |
| Dell Latitude 7350 Detachable | |
| Dell Latitude 7030 Rugged Extreme | |
| Dell Latitude 7230 Rugged Extreme | |
| Durabook R8 Tablet | |
| Dell Latitude 5420 Rugged-P85G | |
| 1920x1080 Standard Quality | |
| Dell Latitude 7330 Rugged Extreme | |
| Acer Enduro Urban N3 EUN314 | |
| Genomsnitt Intel Iris Xe Graphics G7 96EUs (10.5 - 31.2, n=181) | |
| Dell Latitude 7350 Detachable | |
| Dell Latitude 7030 Rugged Extreme | |
| Dell Latitude 7230 Rugged Extreme | |
| Dell Latitude 5420 Rugged-P85G | |
| 1920x1080 High Quality | |
| Dell Latitude 7330 Rugged Extreme | |
| Genomsnitt Intel Iris Xe Graphics G7 96EUs (8.15 - 27.8, n=174) | |
| Acer Enduro Urban N3 EUN314 | |
| Dell Latitude 7350 Detachable | |
| Dell Latitude 7030 Rugged Extreme | |
| Dell Latitude 7230 Rugged Extreme | |
| Dell Latitude 5420 Rugged-P85G | |
| Far Cry 5 | |
| 1280x720 Low Preset AA:T | |
| Dell Latitude 7350 Detachable | |
| Acer Enduro Urban N3 EUN314 | |
| Dell Latitude 7030 Rugged Extreme | |
| Genomsnitt Intel Iris Xe Graphics G7 96EUs (23 - 75, n=93) | |
| Dell Latitude 5420 Rugged-P85G | |
| 1920x1080 Medium Preset AA:T | |
| Dell Latitude 7350 Detachable | |
| Genomsnitt Intel Iris Xe Graphics G7 96EUs (14 - 39, n=91) | |
| Dell Latitude 5420 Rugged-P85G | |
| Dell Latitude 7030 Rugged Extreme | |
| Acer Enduro Urban N3 EUN314 | |
| 1920x1080 High Preset AA:T | |
| Dell Latitude 7350 Detachable | |
| Genomsnitt Intel Iris Xe Graphics G7 96EUs (10 - 35, n=89) | |
| Dell Latitude 7030 Rugged Extreme | |
| Dell Latitude 5420 Rugged-P85G | |
| Acer Enduro Urban N3 EUN314 | |
| 1920x1080 Ultra Preset AA:T | |
| Dell Latitude 7350 Detachable | |
| Genomsnitt Intel Iris Xe Graphics G7 96EUs (11 - 33, n=75) | |
| Dell Latitude 7030 Rugged Extreme | |
| Acer Enduro Urban N3 EUN314 | |
| Dell Latitude 5420 Rugged-P85G | |
| Tiny Tina's Wonderlands | |
| 1280x720 Lowest Preset (DX12) | |
| Dell Latitude 7350 Detachable | |
| Genomsnitt Intel Iris Xe Graphics G7 96EUs (25.9 - 67.3, n=32) | |
| Dell Latitude 7030 Rugged Extreme | |
| 1920x1080 Low Preset (DX12) | |
| Genomsnitt Intel Iris Xe Graphics G7 96EUs (22.3 - 53, n=32) | |
| Dell Latitude 7350 Detachable | |
| Dell Latitude 7030 Rugged Extreme | |
| 1920x1080 Medium Preset (DX12) | |
| Genomsnitt Intel Iris Xe Graphics G7 96EUs (17 - 40.1, n=30) | |
| Dell Latitude 7030 Rugged Extreme | |
| 1920x1080 High Preset (DX12) | |
| Genomsnitt Intel Iris Xe Graphics G7 96EUs (10.6 - 24.1, n=29) | |
| Dell Latitude 7030 Rugged Extreme | |
| 1920x1080 Badass Preset (DX12) | |
| Genomsnitt Intel Iris Xe Graphics G7 96EUs (8.4 - 18.4, n=26) | |
| Dell Latitude 7030 Rugged Extreme | |
| F1 22 | |
| 1280x720 Ultra Low Preset AA:T AF:16x | |
| Genomsnitt Intel Iris Xe Graphics G7 96EUs (57.4 - 94.9, n=53) | |
| Dell Latitude 7350 Detachable | |
| Dell Latitude 7030 Rugged Extreme | |
| 1920x1080 Low Preset AA:T AF:16x | |
| Genomsnitt Intel Iris Xe Graphics G7 96EUs (33.3 - 57.2, n=58) | |
| Dell Latitude 7350 Detachable | |
| Dell Latitude 7030 Rugged Extreme | |
| 1920x1080 Medium Preset AA:T AF:16x | |
| Genomsnitt Intel Iris Xe Graphics G7 96EUs (28 - 52.3, n=58) | |
| Dell Latitude 7350 Detachable | |
| Dell Latitude 7030 Rugged Extreme | |
| 1920x1080 High Preset AA:T AF:16x | |
| Genomsnitt Intel Iris Xe Graphics G7 96EUs (21.7 - 37.1, n=58) | |
| Dell Latitude 7350 Detachable | |
| Dell Latitude 7030 Rugged Extreme | |
| Cyberpunk 2077 2.2 Phantom Liberty | |
| 1280x720 Low Preset (FSR off) | |
| Genomsnitt Intel Iris Xe Graphics G7 96EUs (21.4 - 37.3, n=14) | |
| Dell Latitude 7350 Detachable | |
| Dell Latitude 7030 Rugged Extreme | |
| 1920x1080 Low Preset (FSR off) | |
| Dell Latitude 7350 Detachable | |
| Genomsnitt Intel Iris Xe Graphics G7 96EUs (13.1 - 22.5, n=14) | |
| Dell Latitude 7030 Rugged Extreme | |
| 1920x1080 Medium Preset (FSR off) | |
| Dell Latitude 7350 Detachable | |
| Genomsnitt Intel Iris Xe Graphics G7 96EUs (11.4 - 17.7, n=11) | |
| Dell Latitude 7030 Rugged Extreme | |
| 1920x1080 High Preset (FSR off) | |
| Dell Latitude 7350 Detachable | |
| Genomsnitt Intel Iris Xe Graphics G7 96EUs (9.8 - 15, n=11) | |
| Dell Latitude 7030 Rugged Extreme | |
Cyberpunk 2077 ultra FPS Chart
| låg | med. | hög | ultra | |
|---|---|---|---|---|
| GTA V (2015) | 104.9 | 92.1 | 21.8 | 8.86 |
| Dota 2 Reborn (2015) | 98.8 | 78 | 58.6 | 52.7 |
| Final Fantasy XV Benchmark (2018) | 36.3 | 20.8 | 14.3 | |
| X-Plane 11.11 (2018) | 31.6 | 25.6 | 23.5 | |
| Far Cry 5 (2018) | 47 | 25 | 23 | 22 |
| Strange Brigade (2018) | 68.8 | 31.2 | 24.9 | 19.8 |
| Tiny Tina's Wonderlands (2022) | 23.4 | 18.2 | 11.4 | 8.8 |
| F1 22 (2022) | 37.2 | 33.1 | 23.6 | 17.7 |
| Baldur's Gate 3 (2023) | 12.3 | |||
| Cyberpunk 2077 2.2 Phantom Liberty (2023) | 14.4 | 11.4 | 9.8 | 8.56 |
Utsläpp
Systembuller
Fläktljudet är en blandad kompott. Å ena sidan är det knappt hörbart när man kör låga till medelhöga belastningar som surfning, videostreaming eller till och med den första benchmark-scenen i 3DMark 06. Å andra sidan blir Latitude 7030 Rugged Extreme en av de mest högljudda Windows-surfplattorna vi har registrerat på strax över 50 dB(A) när arbetsbelastningar på spelnivå introduceras. Den goda nyheten är att pulseringen är minimal och fläkten är därför inte märkbar under de flesta dagliga arbetsbelastningar, men räkna med att den ökar mycket snabbt när den utsätts för stress.
Ljudnivå
| Låg belastning |
| 23.5 / 23.5 / 23.5 dB(A) |
| Hög belastning |
| 24.1 / 50.6 dB(A) |
 | ||
30 dB tyst 40 dB(A) hörbar 50 dB(A) högt ljud |
||
min: | ||
| Dell Latitude 7030 Rugged Extreme Iris Xe G7 96EUs, i7-1260U, Micron 2550 1TB | Dell Latitude 7350 Detachable Graphics 4-Core, Ultra 7 164U, Micron 2550 1TB | Dell Latitude 7230 Rugged Extreme Iris Xe G7 80EUs, i5-1240U, WD PC SN740 512GB SDDPMQD-512G-1101 | Acer Enduro Urban N3 EUN314 Iris Xe G7 96EUs, i7-1165G7, Samsung PM991 MZVLQ1T0HALB | Dell Latitude 7330 Rugged Extreme Iris Xe G7 96EUs, i7-1185G7 | |
|---|---|---|---|---|---|
| Noise | -1% | 4% | -1% | 3% | |
| av / miljö * | 23 | 22.9 -0% | 22.8 1% | 23.8 -3% | 22.9 -0% |
| Idle Minimum * | 23.5 | 22.9 3% | 22.9 3% | 24.1 -3% | 23.1 2% |
| Idle Average * | 23.5 | 22.9 3% | 22.9 3% | 24.1 -3% | 23.1 2% |
| Idle Maximum * | 23.5 | 24.4 -4% | 22.9 3% | 24.1 -3% | 23.1 2% |
| Load Average * | 24.1 | 29.7 -23% | 24.5 -2% | 27.9 -16% | 28 -16% |
| Cyberpunk 2077 ultra * | 50.5 | 47.2 7% | |||
| Load Maximum * | 50.6 | 47.2 7% | 43.2 15% | 38.6 24% | 36.2 28% |
| Witcher 3 ultra * | 36 | 35.7 | 31.2 |
* ... mindre är bättre
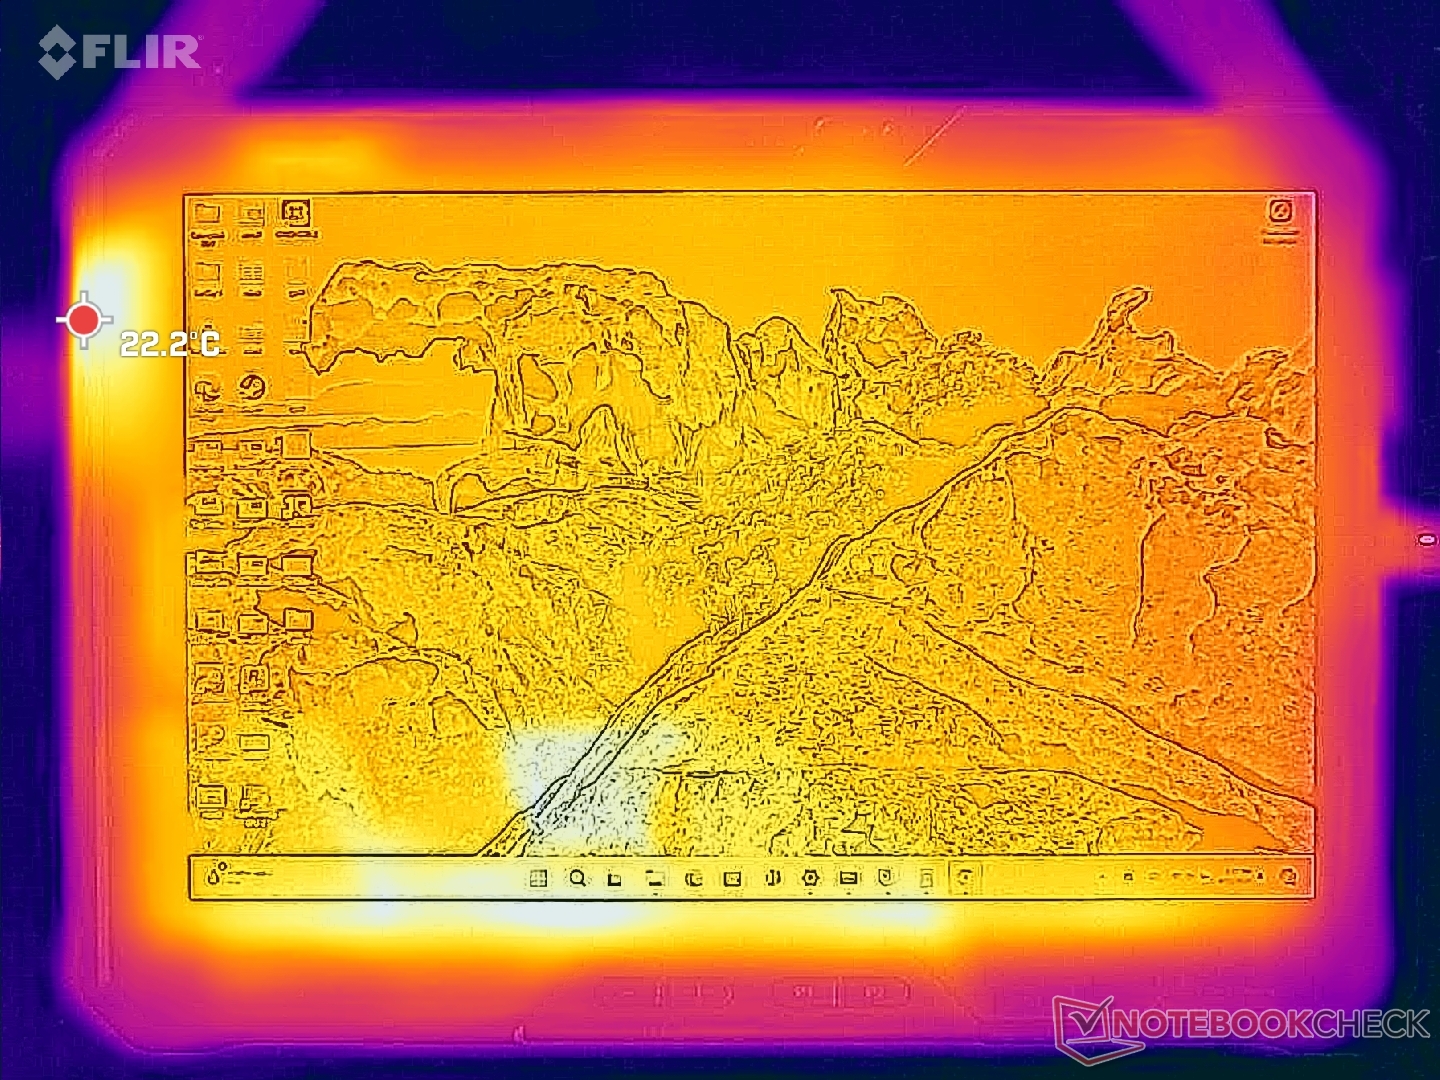
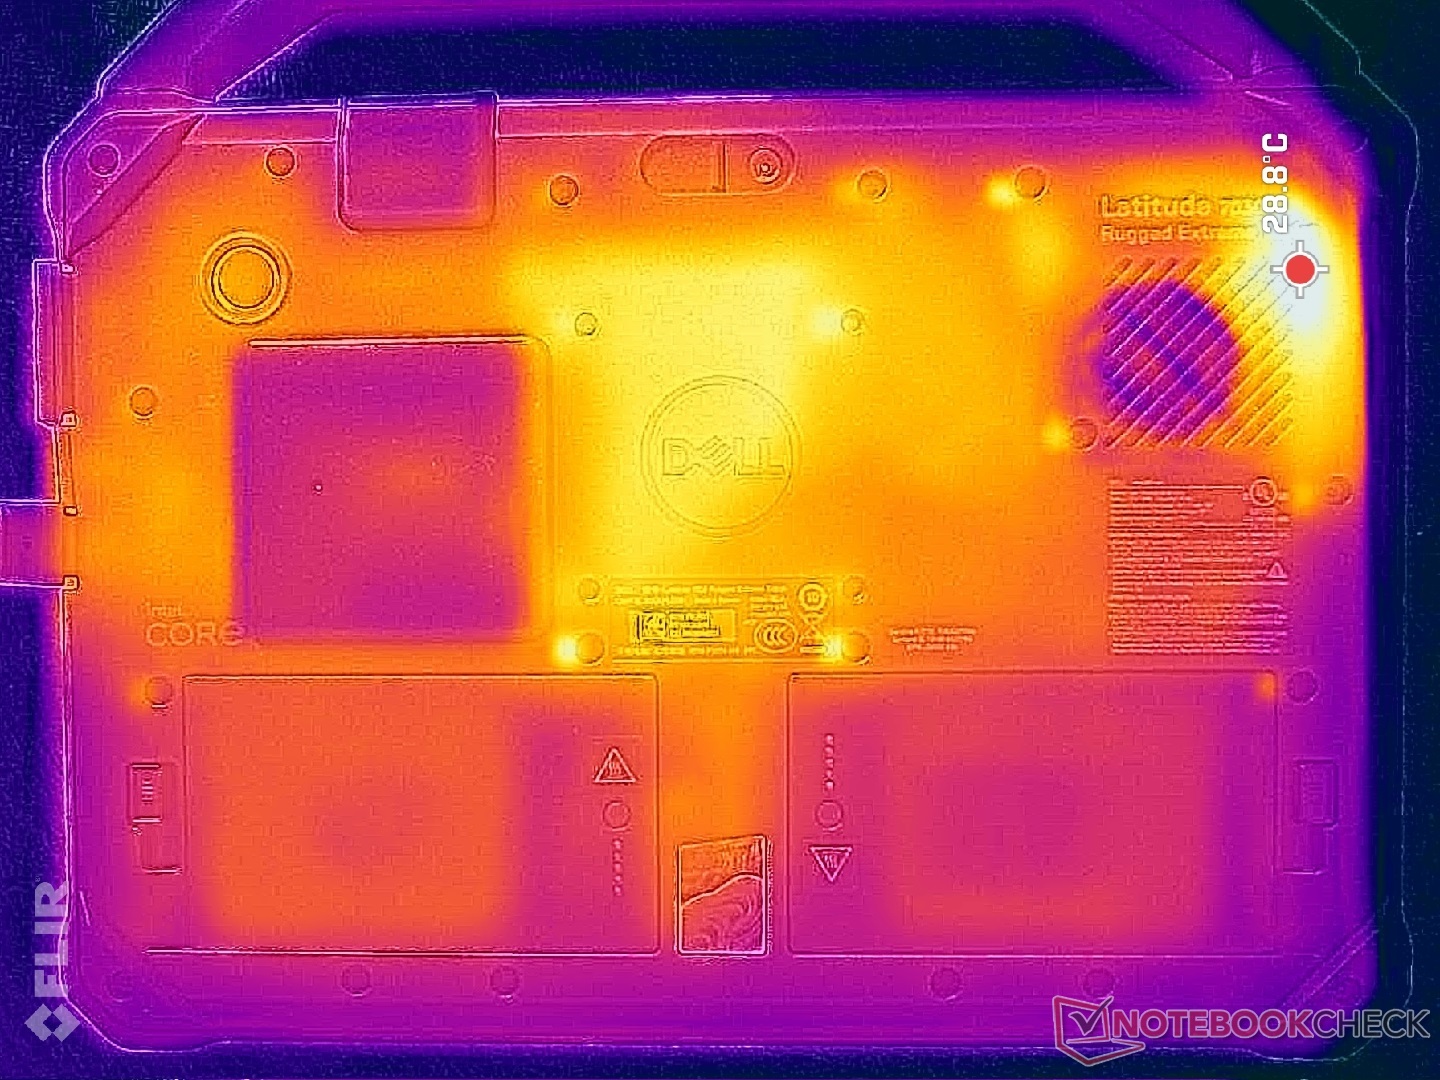
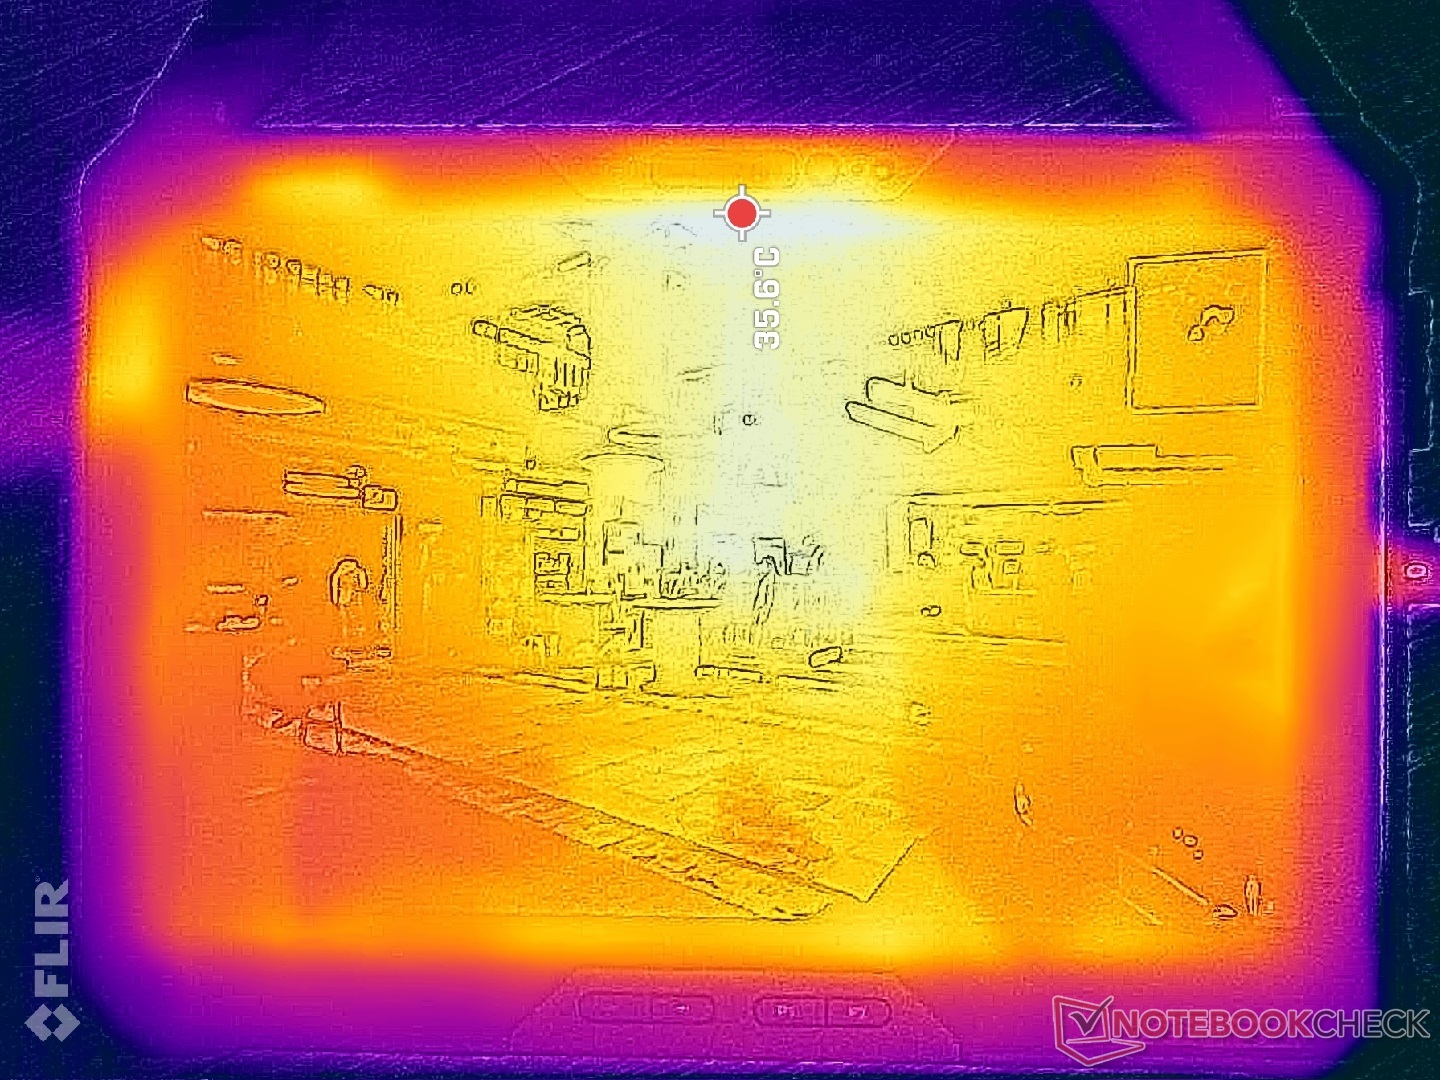
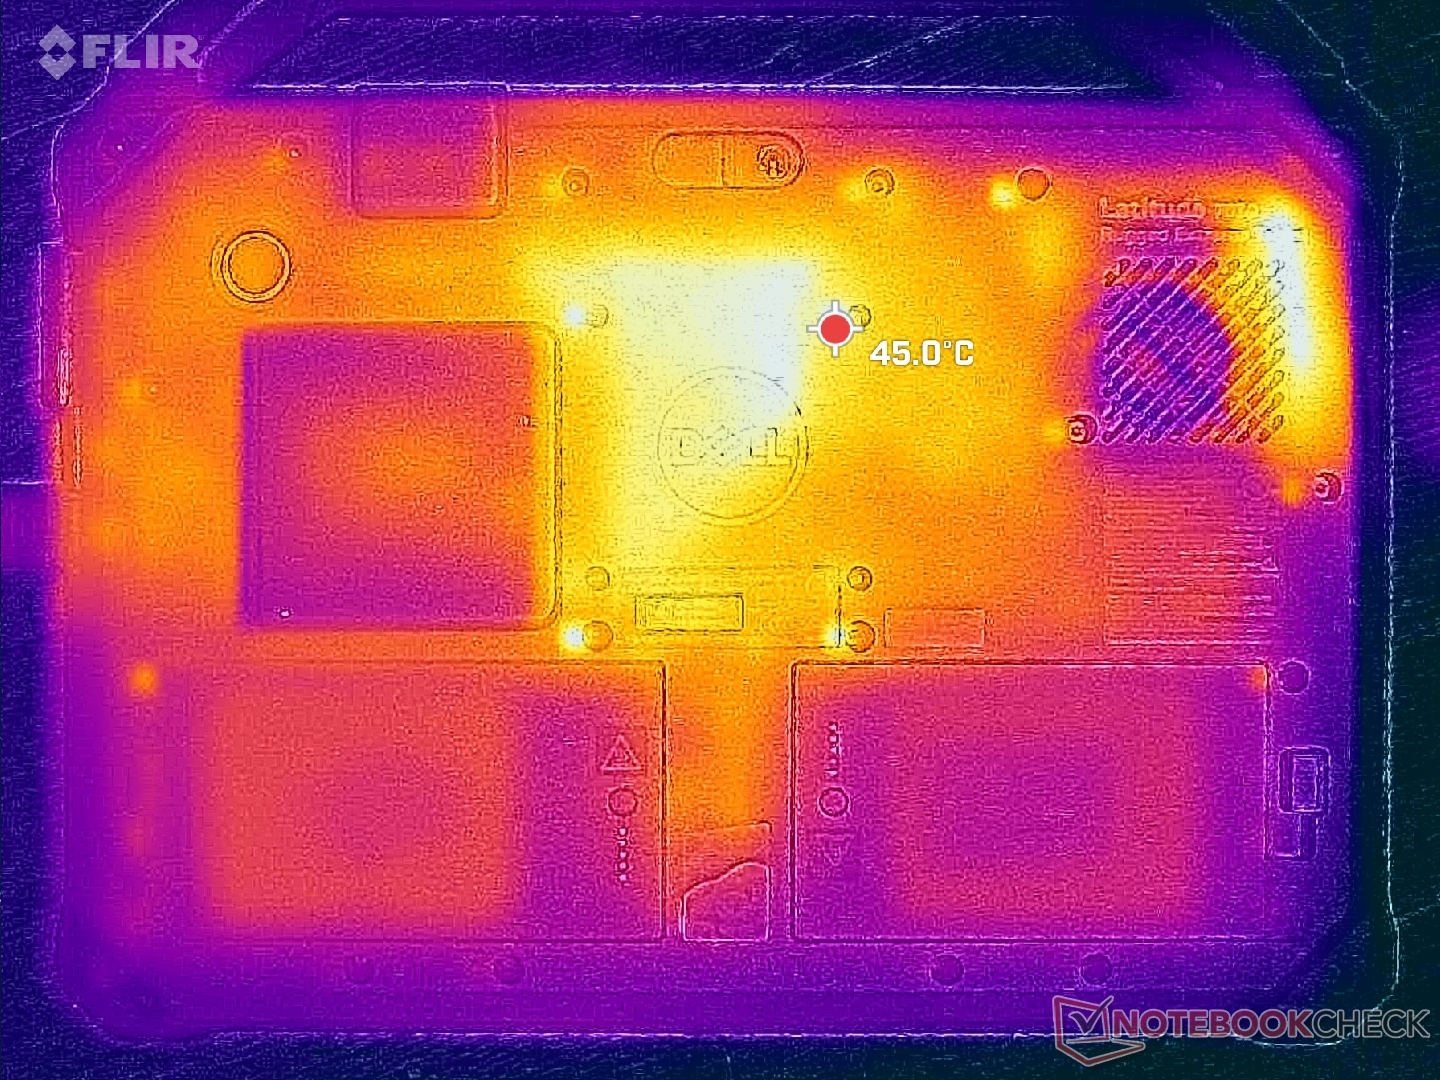
Temperatur
Yttemperaturerna kan bli ganska varma under stress, upp till 38 C och 45 C på fram- respektive baksidan. Detta är märkbart varmare än vad vi registrerade på Latitude 7230 Rugged Extreme och resultaten stämmer överens med de mycket varma kärntemperaturerna som nämns ovan.
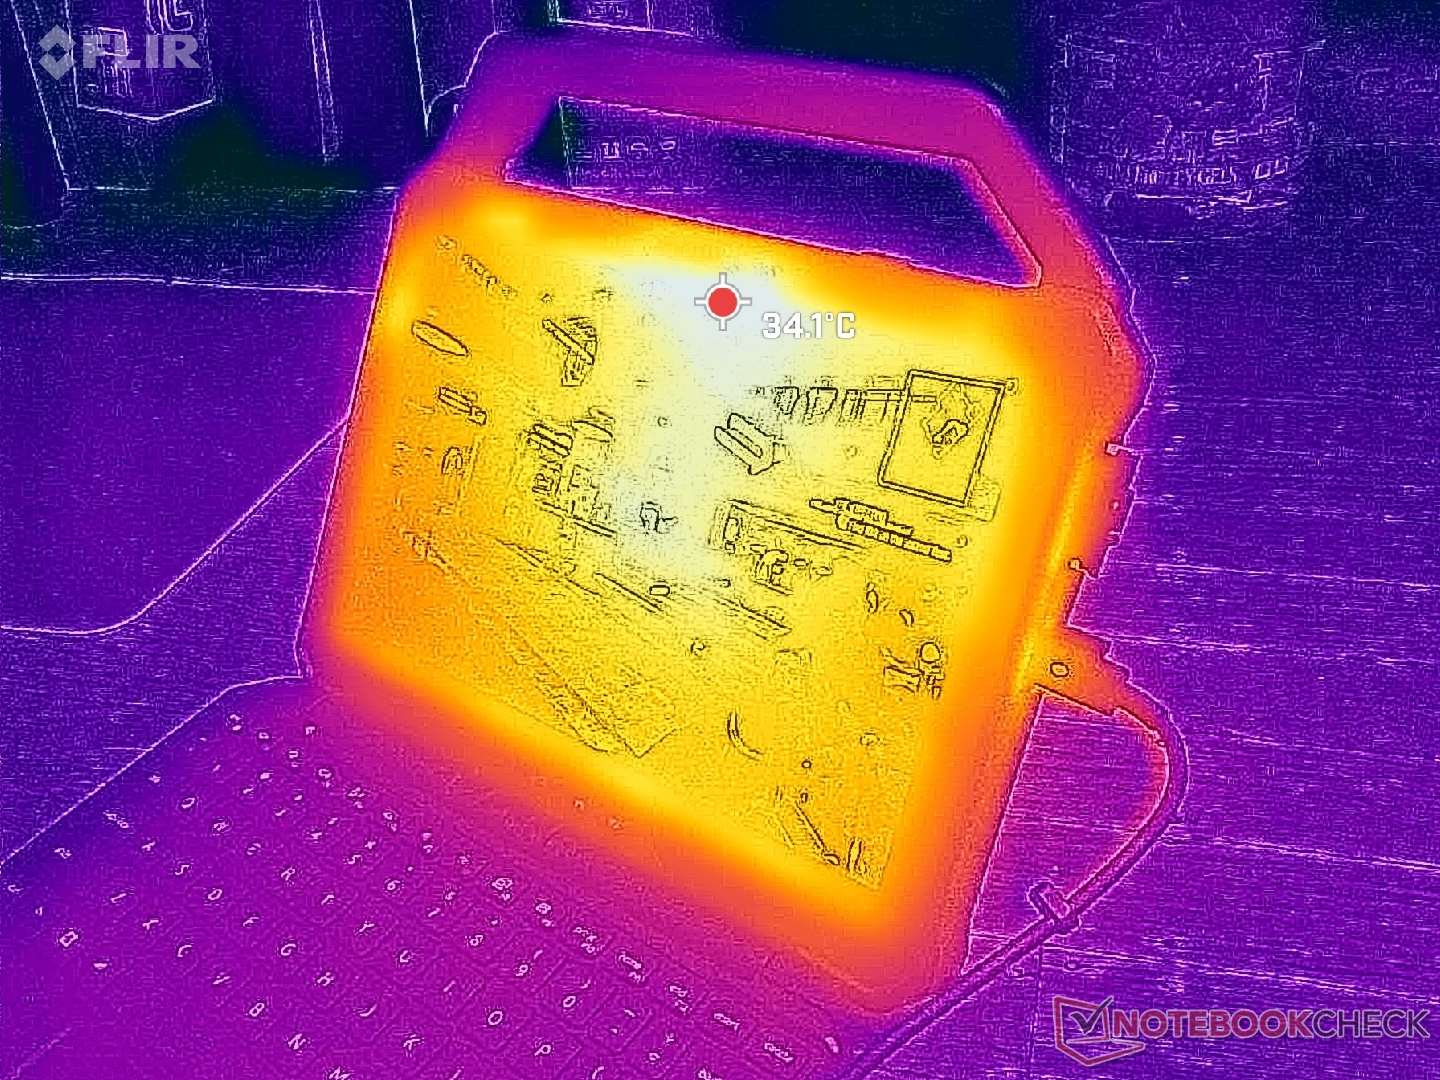
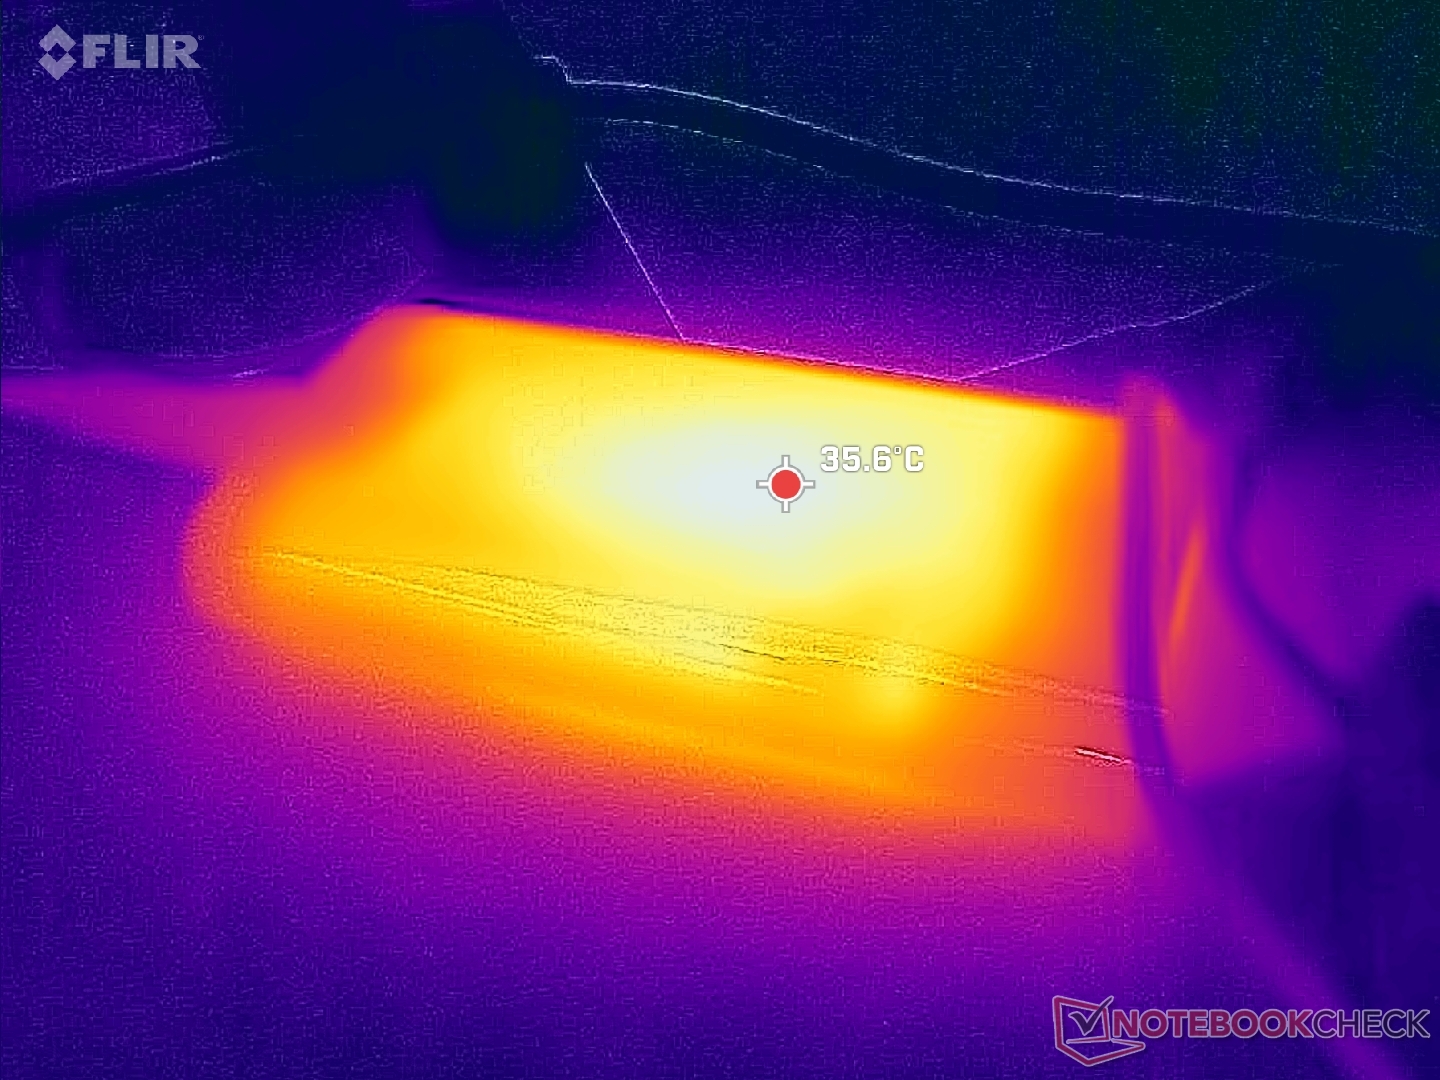
(+) Den maximala temperaturen på ovansidan är 37.2 °C / 99 F, jämfört med genomsnittet av 35.3 °C / 96 F , allt från 19.6 till 60 °C för klassen Convertible.
(±) Botten värms upp till maximalt 43.4 °C / 110 F, jämfört med genomsnittet av 36.8 °C / 98 F
(+) Vid tomgångsbruk är medeltemperaturen för ovansidan 25.7 °C / 78 F, jämfört med enhetsgenomsnittet på 30.2 °C / ### class_avg_f### F.
(+) Handledsstöden och pekplattan når maximal hudtemperatur (35.8 °C / 96.4 F) och är därför inte varma.
(-) Medeltemperaturen för handledsstödsområdet på liknande enheter var 28 °C / 82.4 F (-7.8 °C / -14 F).
| Dell Latitude 7030 Rugged Extreme Intel Core i7-1260U, Intel Iris Xe Graphics G7 96EUs | Dell Latitude 7350 Detachable Intel Core Ultra 7 164U, Intel Graphics 4-Core iGPU (Arc) | Dell Latitude 7230 Rugged Extreme Intel Core i5-1240U, Intel Iris Xe Graphics G7 80EUs | Durabook R8 Tablet Intel Core i5-1230U, Intel Iris Xe Graphics G7 80EUs | Acer Enduro Urban N3 EUN314 Intel Core i7-1165G7, Intel Iris Xe Graphics G7 96EUs | Dell Latitude 7330 Rugged Extreme Intel Core i7-1185G7, Intel Iris Xe Graphics G7 96EUs | |
|---|---|---|---|---|---|---|
| Heat | -0% | -4% | -13% | -3% | 11% | |
| Maximum Upper Side * | 37.2 | 38.4 -3% | 32.6 12% | 38.2 -3% | 37.8 -2% | 34.6 7% |
| Maximum Bottom * | 43.4 | 40.6 6% | 40.2 7% | 49.6 -14% | 45.8 -6% | 36.6 16% |
| Idle Upper Side * | 26.4 | 28.2 -7% | 30.6 -16% | 32.2 -22% | 26.4 -0% | 24.8 6% |
| Idle Bottom * | 29.6 | 28.6 3% | 35 -18% | 33.4 -13% | 30.2 -2% | 25.2 15% |
* ... mindre är bättre
Högtalare
De interna högtalarna är ganska högljudda för den lilla formfaktorn med nästan 92 dB(A), vilket är bra för bullriga utomhusförhållanden. Som jämförelse kan nämnas att de flesta bärbara datorer för konsumenter ligger på mellan 80 och 85 dB(A).
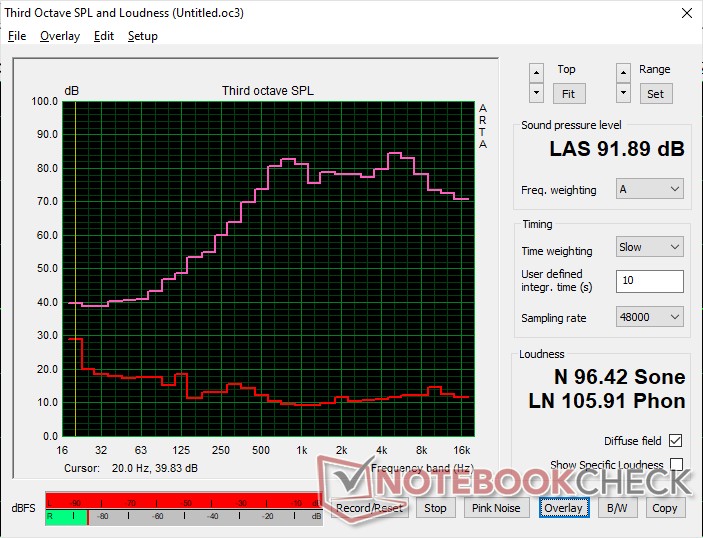
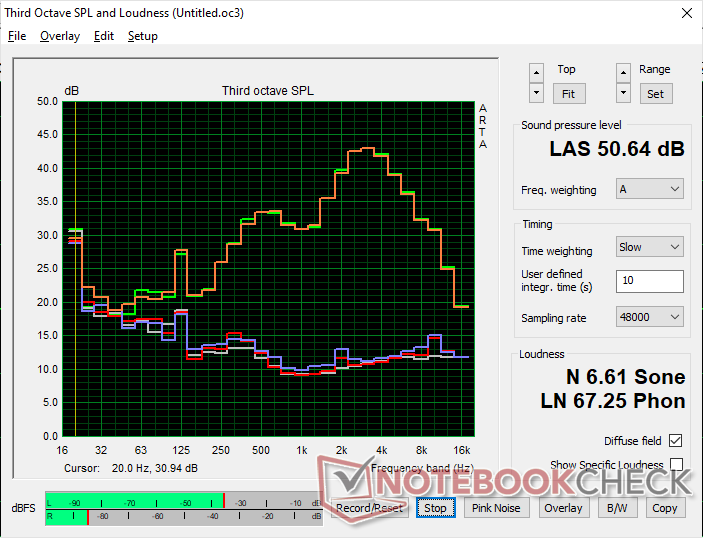
Dell Latitude 7030 Rugged Extreme ljudanalys
(+) | högtalare kan spela relativt högt (91.9 dB)
Bas 100 - 315 Hz
(-) | nästan ingen bas - i genomsnitt 22.6% lägre än medianen
(+) | basen är linjär (5.2% delta till föregående frekvens)
Mellan 400 - 2000 Hz
(+) | balanserad mellan - endast 3.5% från medianen
(+) | mids är linjära (5.7% delta till föregående frekvens)
Högsta 2 - 16 kHz
(+) | balanserade toppar - endast 3% från medianen
(+) | toppar är linjära (4.2% delta till föregående frekvens)
Totalt 100 - 16 000 Hz
(+) | det totala ljudet är linjärt (14% skillnad mot median)
Jämfört med samma klass
» 18% av alla testade enheter i den här klassen var bättre, 4% liknande, 78% sämre
» Den bästa hade ett delta på 6%, genomsnittet var 20%, sämst var 57%
Jämfört med alla testade enheter
» 14% av alla testade enheter var bättre, 4% liknande, 82% sämre
» Den bästa hade ett delta på 4%, genomsnittet var 24%, sämst var 134%
Apple MacBook Pro 16 2021 M1 Pro ljudanalys
(+) | högtalare kan spela relativt högt (84.7 dB)
Bas 100 - 315 Hz
(+) | bra bas - bara 3.8% från medianen
(+) | basen är linjär (5.2% delta till föregående frekvens)
Mellan 400 - 2000 Hz
(+) | balanserad mellan - endast 1.3% från medianen
(+) | mids är linjära (2.1% delta till föregående frekvens)
Högsta 2 - 16 kHz
(+) | balanserade toppar - endast 1.9% från medianen
(+) | toppar är linjära (2.7% delta till föregående frekvens)
Totalt 100 - 16 000 Hz
(+) | det totala ljudet är linjärt (4.6% skillnad mot median)
Jämfört med samma klass
» 0% av alla testade enheter i den här klassen var bättre, 0% liknande, 100% sämre
» Den bästa hade ett delta på 5%, genomsnittet var 18%, sämst var 45%
Jämfört med alla testade enheter
» 0% av alla testade enheter var bättre, 0% liknande, 100% sämre
» Den bästa hade ett delta på 4%, genomsnittet var 24%, sämst var 134%
Energihantering - strömeffektiv med litet batteri
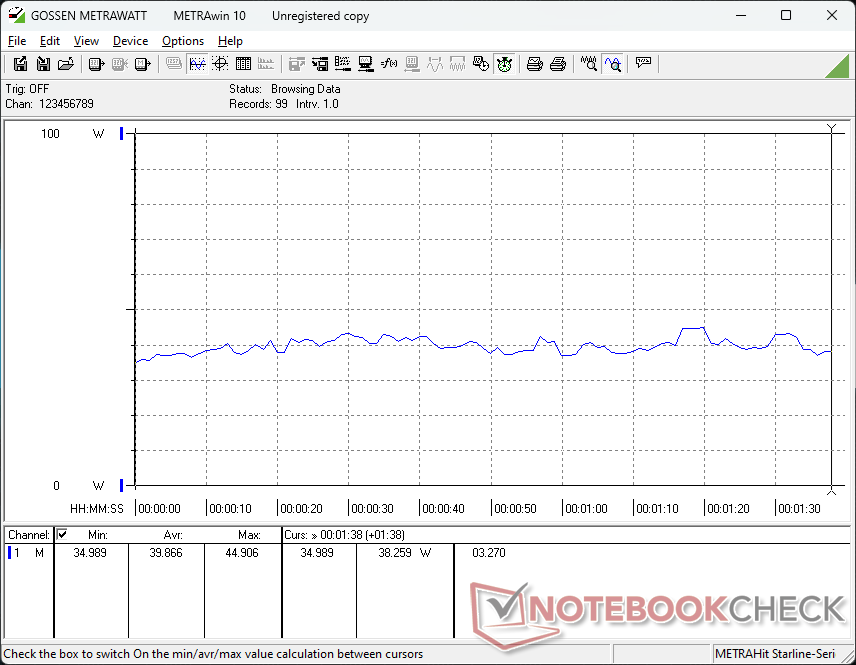
Strömförbrukning
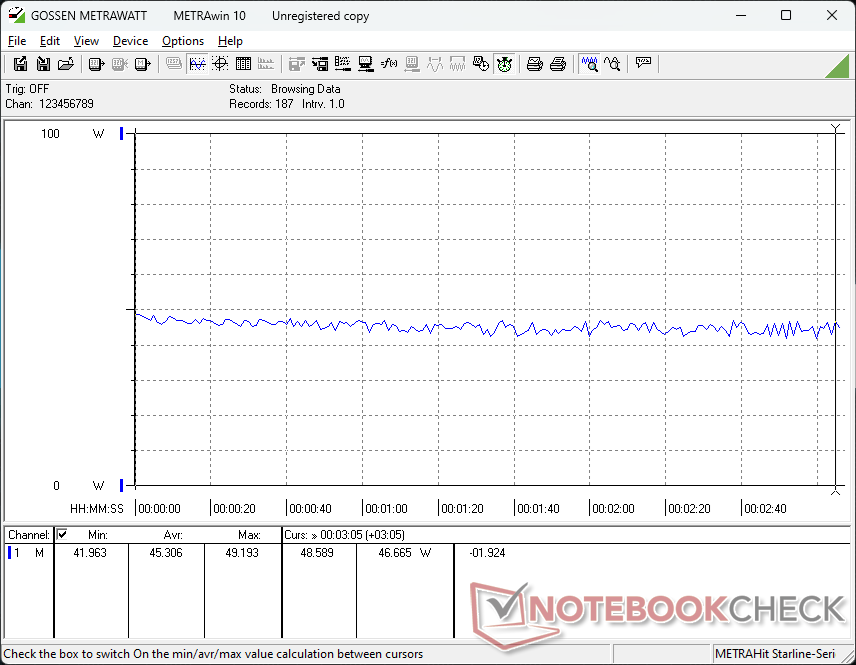
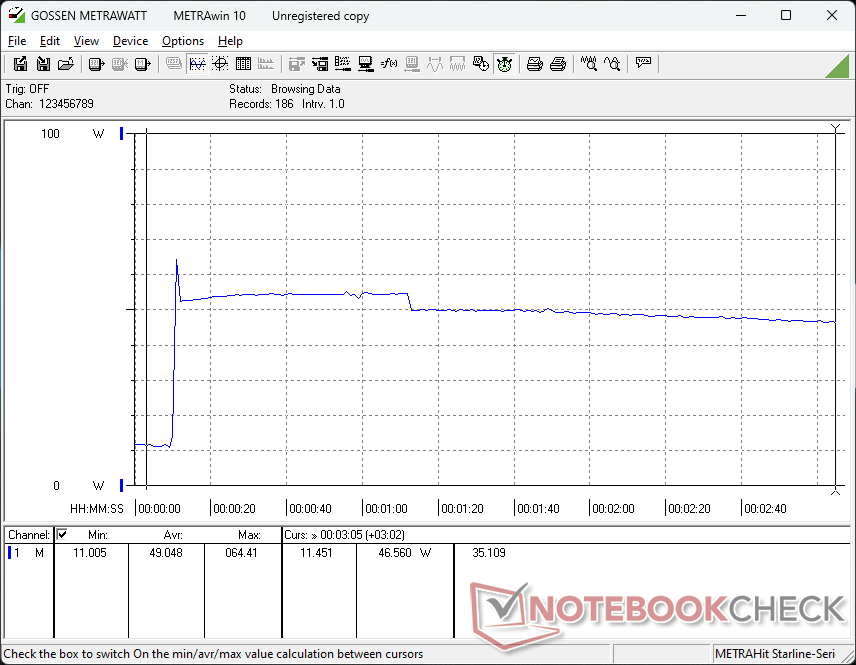
Förbrukningen varierar från 2 W till 9 W vid tomgångskörning på skrivbordet beroende på ljusstyrka. Skillnaden mellan lägsta och högsta ljusstyrka är ungefär 6 W. Mer krävande belastningar som spel skulle kräva över 40 W för att vara jämförbara med Latitude 7230 Robust.
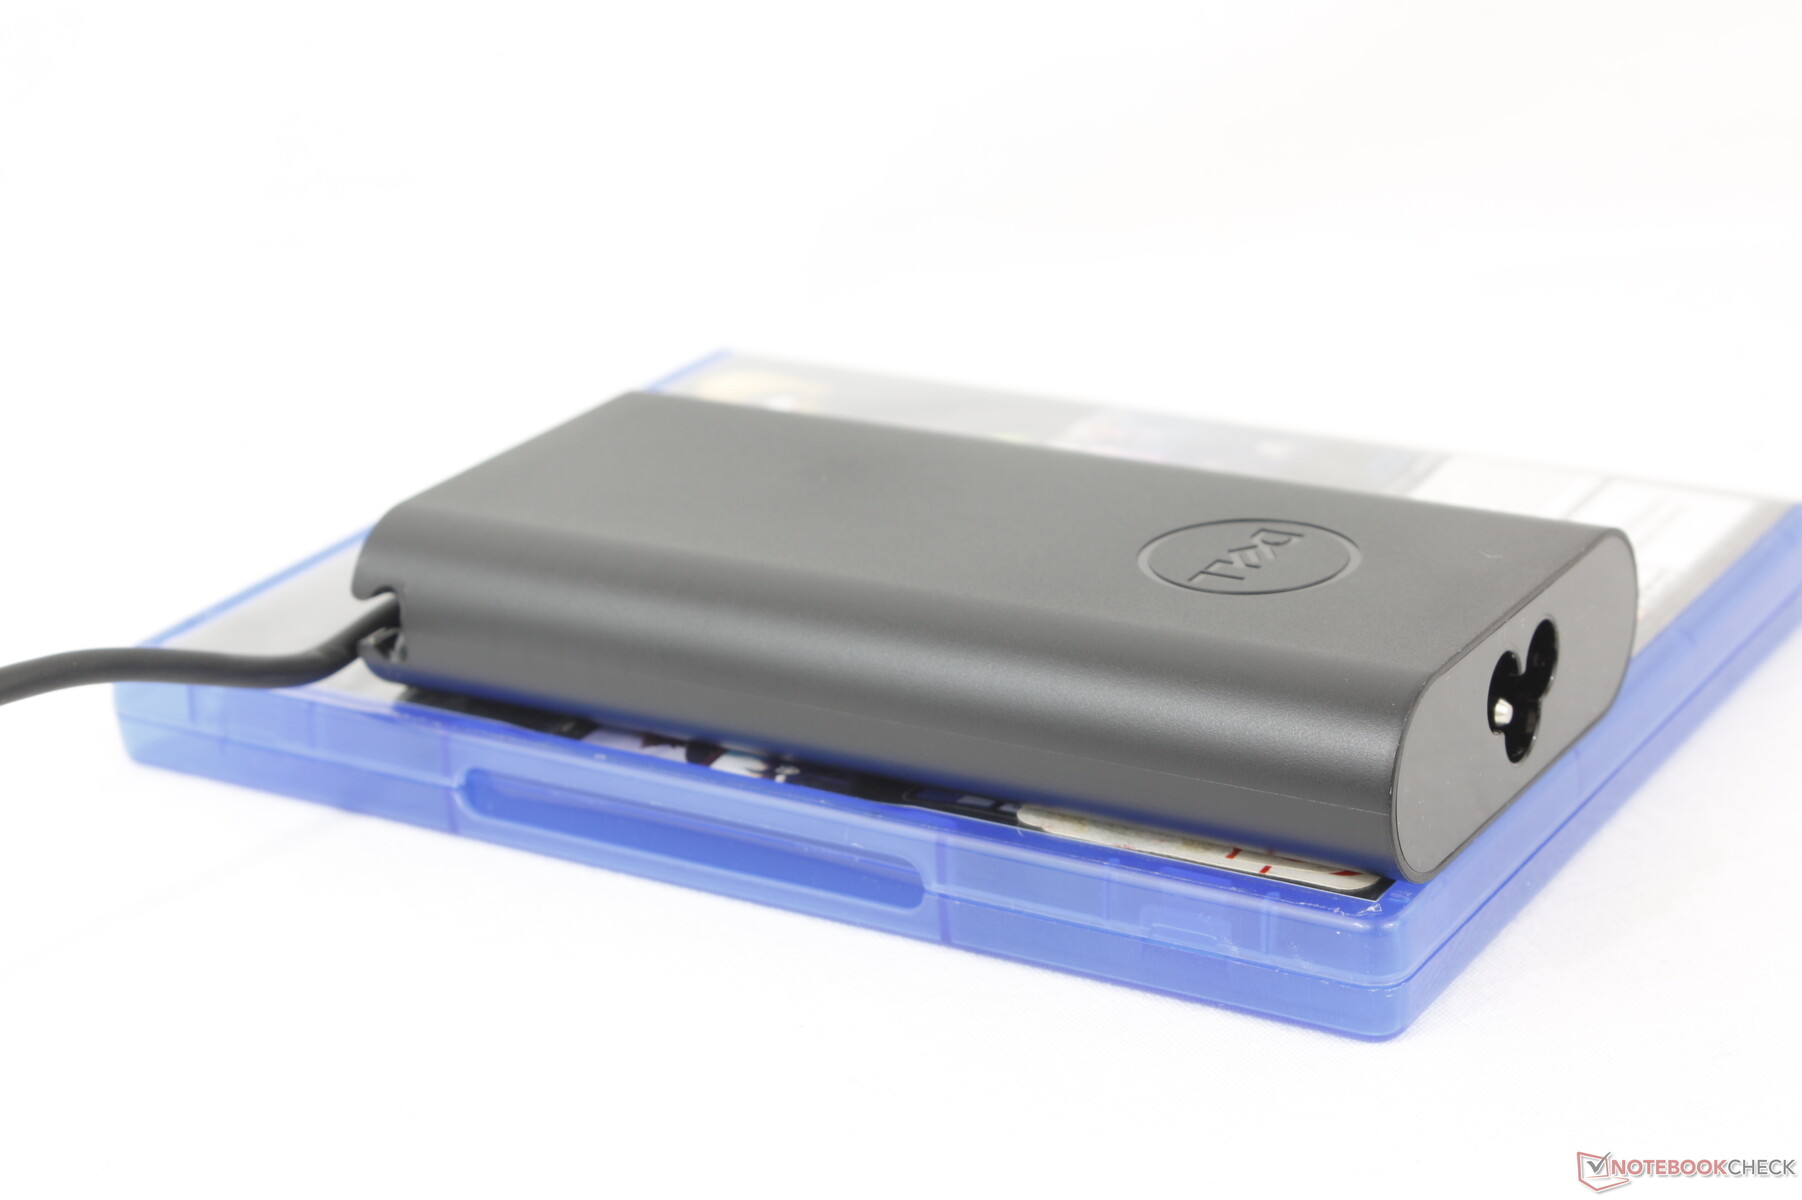
Vi kan registrera ett tillfälligt maximalt uttag på 65 W från den lilla (~13 x 6,6 x 2,2 cm) USB-C AC-adaptern när processorn utnyttjas till 100 procent.

| Av/Standby | |
| Låg belastning | |
| Hög belastning |
|
Förklaring:
min: | |
| Dell Latitude 7030 Rugged Extreme i7-1260U, Iris Xe G7 96EUs, Micron 2550 1TB, IPS, 1920x1200, 10" | Dell Latitude 7350 Detachable Ultra 7 164U, Graphics 4-Core, Micron 2550 1TB, IPS, 2880x1920, 13" | Dell Latitude 7230 Rugged Extreme i5-1240U, Iris Xe G7 80EUs, WD PC SN740 512GB SDDPMQD-512G-1101, IPS, 1920x1200, 12" | Durabook R8 Tablet i5-1230U, Iris Xe G7 80EUs, Silicon Power SP128GIMEA3K5EV0, IPS, 1280x800, 8" | Acer Enduro Urban N3 EUN314 i7-1165G7, Iris Xe G7 96EUs, Samsung PM991 MZVLQ1T0HALB, IPS, 1920x1080, 14" | Dell Latitude 7330 Rugged Extreme i7-1185G7, Iris Xe G7 96EUs, , IPS, 1920x1080, 13.3" | |
|---|---|---|---|---|---|---|
| Power Consumption | 9% | -49% | 17% | -4% | -45% | |
| Idle Minimum * | 2.5 | 3.6 -44% | 6.5 -160% | 2.8 -12% | 3.8 -52% | 4.1 -64% |
| Idle Average * | 7.3 | 6.1 16% | 8.9 -22% | 6.3 14% | 8 -10% | 11.7 -60% |
| Idle Maximum * | 8.6 | 6.7 22% | 14.3 -66% | 10.3 -20% | 8.7 -1% | 11.8 -37% |
| Load Average * | 39.9 | 33.7 16% | 44.9 -13% | 19 52% | 34.6 13% | 48.5 -22% |
| Cyberpunk 2077 ultra external monitor * | 38.8 | 31.8 18% | ||||
| Cyberpunk 2077 ultra * | 45.3 | 37 18% | ||||
| Load Maximum * | 64.4 | 55.1 14% | 54.8 15% | 30.1 53% | 45.4 30% | 91 -41% |
| Witcher 3 ultra * | 43.2 | 15.5 | 35.4 | 44.3 |
* ... mindre är bättre
Power Consumption Cyberpunk / Stress Test
Power Consumption external Monitor
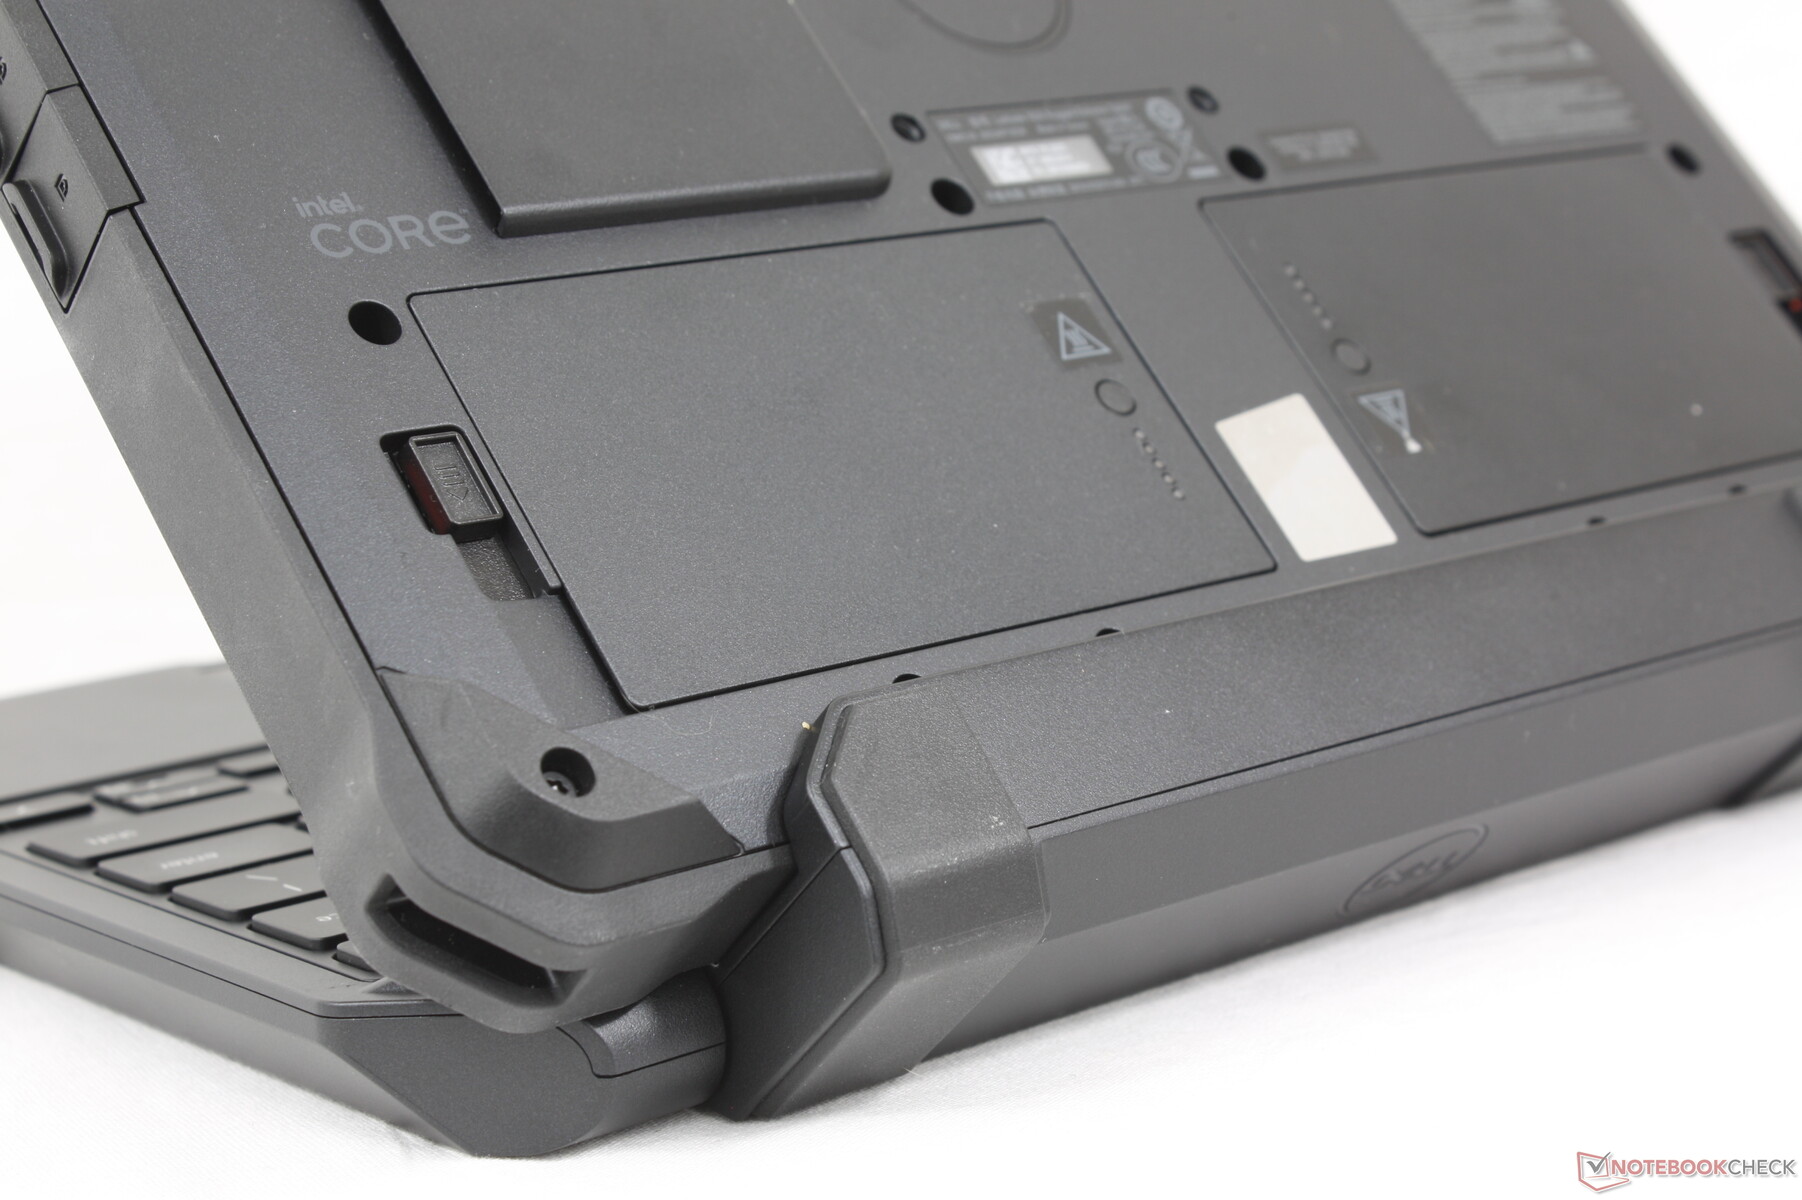
Batteritid
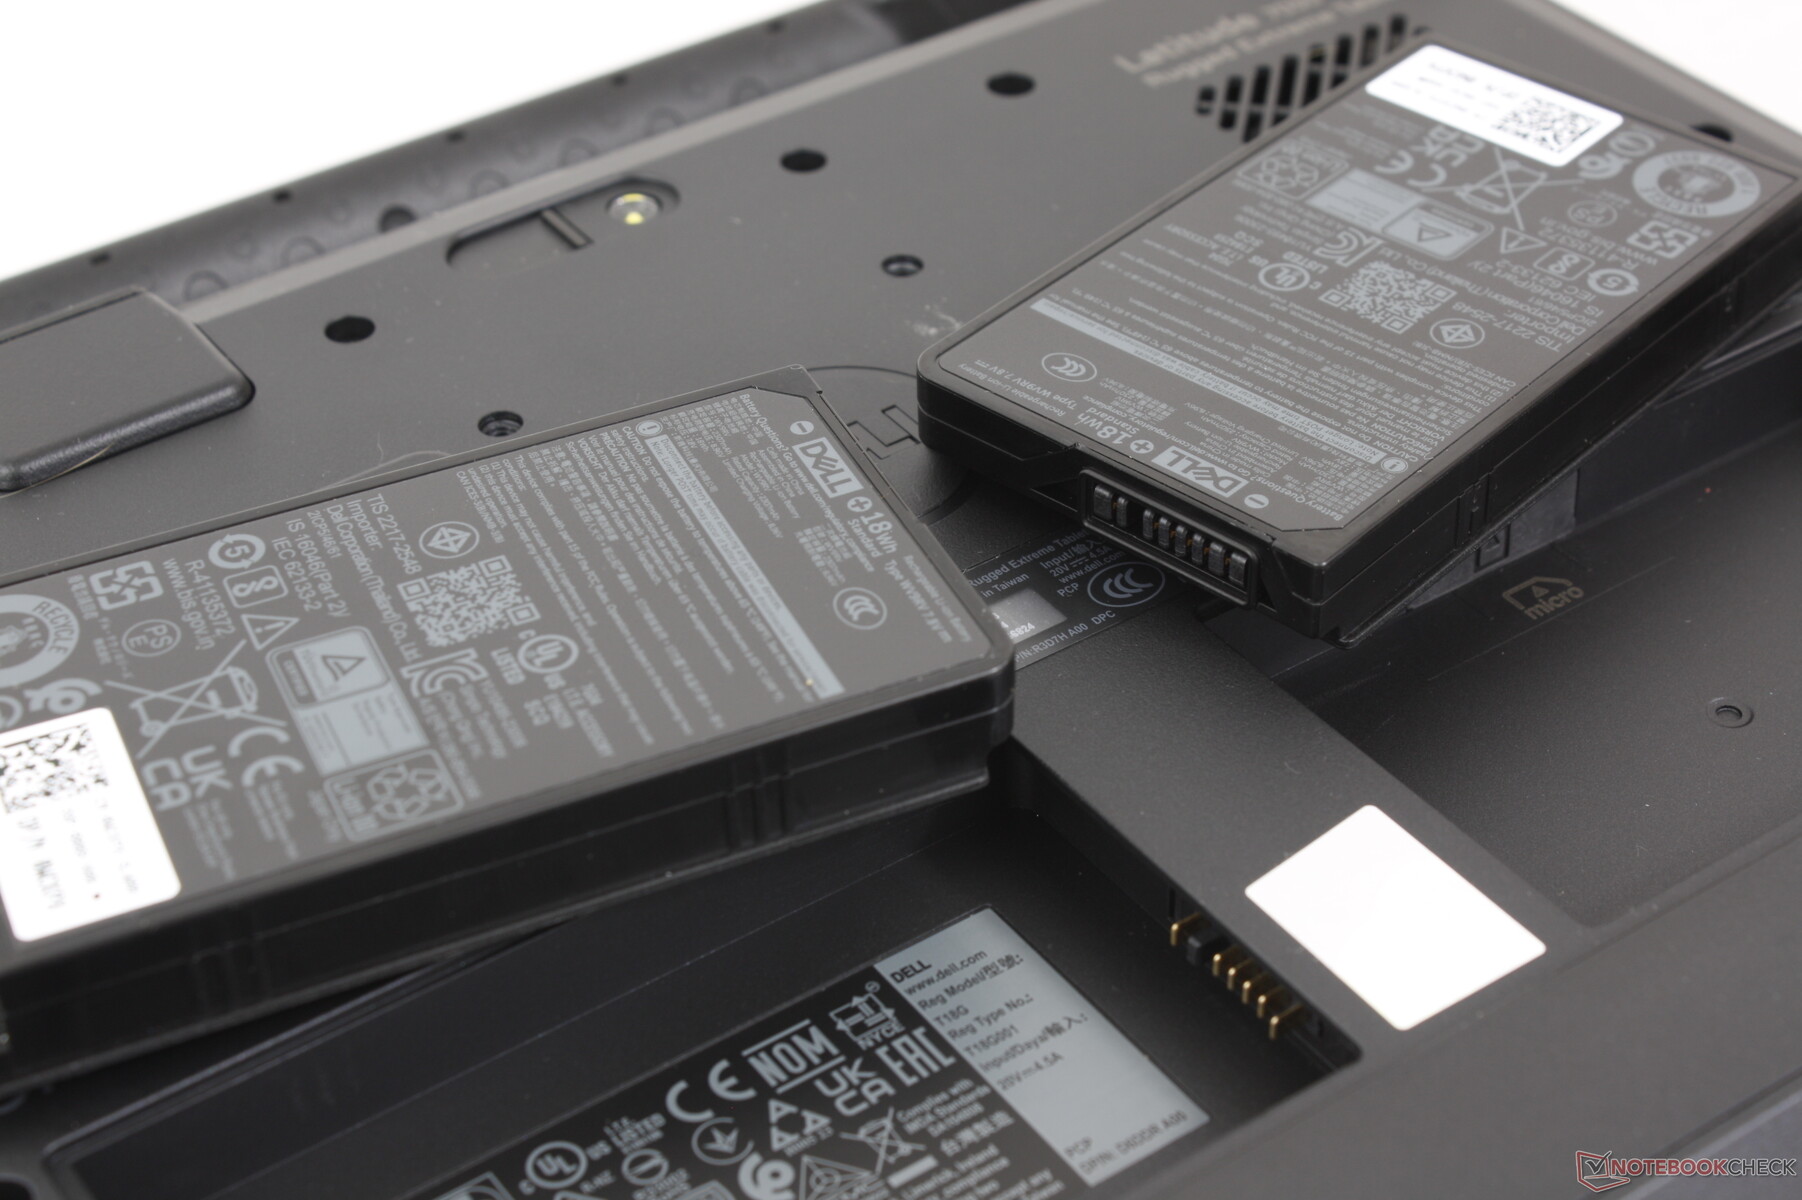
Användare kan konfigurera med antingen ett 36 Wh internt batteri eller två löstagbara 18 Wh batteripaket - inte båda samtidigt. Drifttiden för WLAN i balanserat läge med 150 nits ljusstyrka är kortare än väntat, drygt 6 timmar, eller bara 3 timmar om man använder ett enda 18 Wh-batteri för att spara vikt. Naturligtvis kan användare helt enkelt köpa flera 18 Wh-batteripaket för att förlänga drifttiden, men att bära flera batteripaket är inte precis idealiskt.
Laddningen från tom till full kapacitet är nedslående långsam och tar ungefär 4 timmar när båda 18 Wh-batterierna är installerade.
| Dell Latitude 7030 Rugged Extreme i7-1260U, Iris Xe G7 96EUs, 36 Wh | Dell Latitude 7350 Detachable Ultra 7 164U, Graphics 4-Core, 46.5 Wh | Dell Latitude 7230 Rugged Extreme i5-1240U, Iris Xe G7 80EUs, 72 Wh | Durabook R8 Tablet i5-1230U, Iris Xe G7 80EUs, 27.4 Wh | Acer Enduro Urban N3 EUN314 i7-1165G7, Iris Xe G7 96EUs, 50.3 Wh | Dell Latitude 7330 Rugged Extreme i7-1185G7, Iris Xe G7 96EUs, 107 Wh | |
|---|---|---|---|---|---|---|
| Batteridrifttid | 69% | 112% | -13% | 4% | 193% | |
| WiFi v1.3 | 367 | 619 69% | 779 112% | 319 -13% | 382 4% | 1077 193% |
| Reader / Idle | 1493 | |||||
| Load | 98 | 216 |
För
Emot
Verdict - Stark där det betyder något
Som en industriellt inriktad PC-surfplatta utmärker sig Latitude 7030 Rugged Extreme där det är som viktigast för målgruppen. Aspekter som den solida processorprestandan, de höga interna högtalarna, den superljusstarka skärmen och de många anslutningsmöjligheterna är fantastiska att se och bättre än väntat med tanke på den lilla formfaktorn. Den fullständiga sRGB-täckningen och den fasta tangentbordsfeedbacken är också överraskande eftersom de flesta i den robusta kategorin avstår från precisionsfärger eller bekväma tangenter.
Den 10-tums Latitude 7030 Rugged Extreme överträffar många större konkurrenter samtidigt som den erbjuder en liknande uppsättning extrafunktioner. Det lilla batteriet och de korta drifttiderna är dock lite av en besvikelse.
Nackdelarna inkluderar höga kärntemperaturer, höga yttemperaturer, högt fläktljud under belastning, kort batteritid och minskad CPU-prestanda när den körs på batteriström. Vissa av dessa är inte märkbara i en utomhusmiljö, men den relativt korta drifttiden kan vara ett stort problem, särskilt eftersom laddningshastigheterna är ganska långsamma.
Pris och tillgänglighet
Dell levererar nu Latitude 7030 Rugged Extreme för 2270 USD med basmodellen Core i5-1240U upp till över 3000 USD med extra tillbehör.
Obs: Vi har nyligen uppdaterat vårt betygssystem och resultaten från version 8 är inte jämförbara med resultaten från version 7. Mer information finns tillgänglig här .
Dell Latitude 7030 Rugged Extreme
- 09/20/2024 v8
Allen Ngo
 Total Sustainability Score:
 Genomskinlighet
Valet av enheter som ska granskas görs av vår redaktion. Testprovet gavs till författaren som ett lån av tillverkaren eller återförsäljaren för denna recension. Långivaren hade inget inflytande på denna recension och inte heller fick tillverkaren en kopia av denna recension innan publiceringen. Det fanns ingen skyldighet att publicera denna recension. Vi accepterar aldrig ersättning eller betalning i utbyte mot våra recensioner. Som ett oberoende medieföretag är Notebookcheck inte föremål för auktoritet från tillverkare, återförsäljare eller förlag.
This is how Notebookcheck is testingEvery year, Notebookcheck independently reviews hundreds of laptops and smartphones using standardized procedures to ensure that all results are comparable. We have continuously developed our test methods for around 20 years and set industry standards in the process. In our test labs, high-quality measuring equipment is utilized by experienced technicians and editors. These tests involve a multi-stage validation process. Our complex rating system is based on hundreds of well-founded measurements and benchmarks, which maintains objectivity.
Price comparison

