Notebookcheck Logo

Dell XPS 13 9345 Snapdragon X Elite recension: Underskattar Intel Core Ultra 7
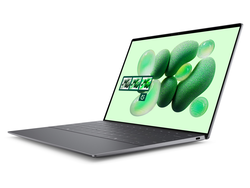
$1300 Snapdragon X Elite vs. $1400 Core Ultra 7.

Satsningen på Windows på ARM blir allt större och den populära XPS 13-serien hoppar nu på Snapdragon Elite-tåget. Det begärda priset på $1300 är faktiskt billigare än Intel Core Ultra 7-modellen, men var beredd på vissa kompromisser relaterade till programvara.
Dell XPS 13 9345
Dell XPS 13 9345

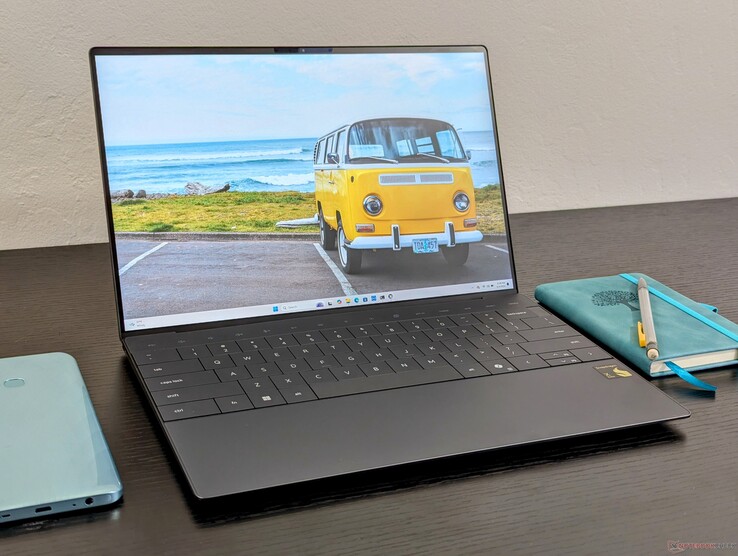
Finns det något bättre sätt att visa upp sin processor än att debutera med den på en av Dells mest populära bärbara datorer för konsumenter? XPS 13 Plus 9320/9340-chassit har fått den senaste Snapdragon X Elite-processorn för att vara bland den lilla handfull Qualcomm-drivna bärbara Windows-datorer som släpps i år. Snapdragon-modellen kallas XPS 13 9345 och är annars visuellt identisk med den befintliga XPS 13 Plus 9320 eller 9340 med traditionella Intel-processorer.

Vår recensionskonfiguration är utrustad med Snapdragon X1 Elite X1E-80-100, 16 GB LPDDR5X-8448 RAM och en 1200p 120 Hz IPS-skärm för cirka 1 300 USD. Högkvalitativa OLED-paneler finns tillgängliga och vissa regioner kan inkludera ett andra Snapdragon X1 Plus X1P-processoralternativ, men den integrerade GPU: n förblir densamma över hela linjen.

Alternativ till XPS 13 9345 inkluderar Microsoft Surface Pro eller Samsung Galaxy Book4 Edge 16 som båda drivs av samma Snapdragon X1 Elite X1E-80-100-processor. Naturligtvis konkurrerar den också direkt med mer konventionella 13-tums och 14-tums subnotebooks för kontor som Lenovo ThinkBook 13x G4, Asus ZenBook S13eller Dells egen XPS 13 9340.

Fler Dell-recensioner:

Dell XPS 13 9345 (XPS 13 Serie)
Processor
Minne
16 GB 
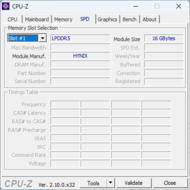
, LPDDR5x, 8448 MT/s, Dual-Channel, soldered
Skärm
13.40 tum 16:10, 1920 x 1200 pixlar 169 PPI, IPS, glansig: nej, 120 Hz, Adaptive Sync
Anslutningar
2 USB 4.0 40 Gbps, USB-C Power Delivery (PD), 2 DisplayPort, Brightness Sensor
Nätverk
Qualcomm FastConnect 7800 (b/g/n = Wi-Fi 4/ac = Wi-Fi 5/ax = Wi-Fi 6/ Wi-Fi 6E 6 GHz be = Wi-Fi 7), Bluetooth 5.4
Storlek
höjd x bredd x djup (i mm) 15.3 x 295.3 x 199.1
Batteri
55 Wh Litiumpolymer
Operativsystem
Microsoft Windows 11 Home
Camera
Webbkamera: 1080p + IR
Primary Camera: 2 MPix
Övrigt
Högtalare: Quad (2x 2 W + 2x 2 W), Tangentbord: Zero-Lattice, Tangentbordsbelysning: ja, Dell Digital Delivery, MyDell, 12 Månader Garanti
Vikt
1.228 kg, Strömförsörjning: 287 g
Pris
1300 USD
Note: The manufacturer may use components from different suppliers including display panels, drives or memory sticks with similar specifications.


Karşılaştırmalı olarak olası rakipler

Rating
Version
Date
Model
Weight
Height
Size
Resolution
Price
84.5 %v8
08/2024
Dell XPS 13 9345
SD X Elite X1E-80-100, Adreno X1-85 3.8 TFLOPS
1.2 kg15.3 mm13.40"1920x1200
86.5 %
v7 (old)
v7 (old)
05/2024
Dell XPS 13 9340 Core Ultra 7
Ultra 7 155H, Arc 8-Core
1.2 kg15.3 mm13.40"1920x1200
86.2 %v8
07/2024
Microsoft Surface Laptop 7 13.8 Copilot+
SD X Elite X1E-80-100, Adreno X1-85 3.8 TFLOPS
1.3 kg17.5 mm13.80"2304x1536
90.1 %
v7 (old)
v7 (old)
05/2024
Lenovo ThinkBook 13x G4 21KR0008GE
Ultra 5 125H, Arc 7-Core
1.2 kg12.9 mm13.50"2880x1920
82.3 %v8
07/2024
HP EliteBook Ultra G1q 14
SD X Elite X1E-78-100, Adreno X1-85 3.8 TFLOPS
1.3 kg11.2 mm14.00"2240x1400
85.4 %
v7 (old)
v7 (old)
05/2023
Asus ZenBook S13 OLED UX5304
i7-1355U, Iris Xe G7 96EUs
1 kg11.8 mm13.30"2880x1800

Information: Vi har nyligen uppdaterat vårt betygssystem och resultaten från version 8 är inte jämförbara med resultaten från version 7. Ytterligare information om detta finns här tillgänglig.

Obs: Vi har nyligen uppdaterat vårt betygssystem och resultaten från version 8 är inte jämförbara med resultaten från version 7. Mer information finns tillgänglig här .

Case - bekant utseende och känsla

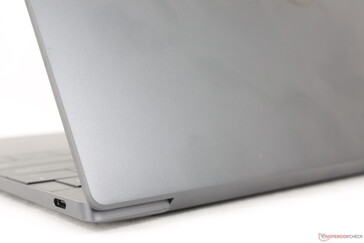
Det finns inga externa skillnader som skiljer Qualcomm-modellen från Intel-modellen och därför våra kommentarer om Intel-modellen gäller även här. Några nya färgalternativ skulle ha varit trevliga, men samma Platinum- och Graphite-alternativ gäller. Vi föredrar Platinum-alternativet något eftersom dess ljusa vita färg döljer fingeravtryck bättre än det mörkare Graphite-alternativet på vår Qualcomm-testenhet, särskilt längs handledsstöden och det yttre locket.

Chassit finns i färgalternativen Graphite gray eller Platinum white
Smidigare matt metallstruktur från förra generationens XPS-design
Den maximala vinkeln på locket är relativt snäv (~140 grader) jämfört med de flesta andra bärbara datorer
Strömknapp med möjlighet till fingeravtryck
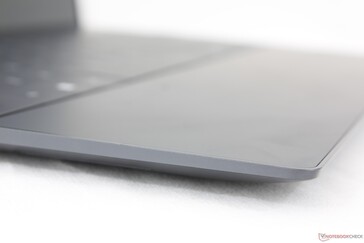
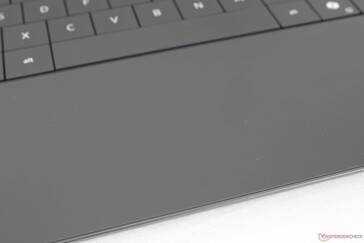
En enda slät glasyta sträcker sig över hela handflatans stödyta
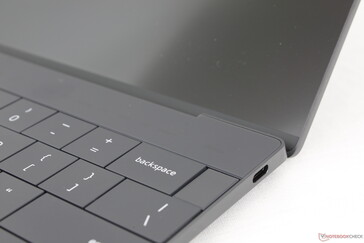
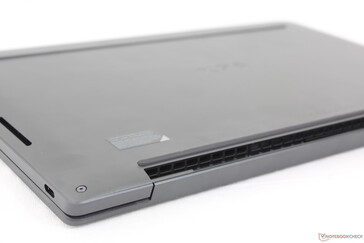
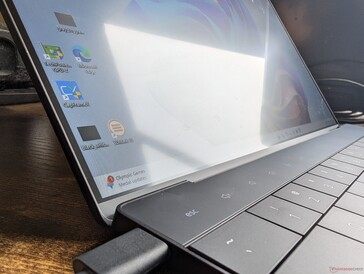
Kanterna är plattare och skarpare än den utgående XPS-designen. Ventilationsgallren är dolda under gångjärnen

Boyut ve ağırlık karşılaştırması

312.7 mm 223.3 mm 11.2 mm 1.3 kg301 mm 220 mm 17.5 mm 1.3 kg295.3 mm 199.1 mm 15.3 mm 1.2 kg295.3 mm 199.1 mm 15.3 mm 1.2 kg296.2 mm 216.3 mm 11.8 mm 1 kg292.9 mm 205 mm 12.9 mm 1.2 kg297 mm 210 mm 1 mm 5.7 g

Anslutningsmöjligheter

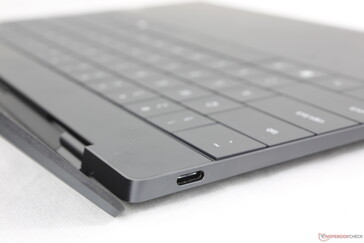
Det finns två USB-C 4.0-portar precis som på Intel-versionen av XPS 13. Portarna här saknar dock Thunderbolt-stöd och därför är eGPU-kompatibilitet inte garanterad. När vi försökte ansluta vår Aorus RTX 2080 Ti Gaming Boxkunde Qualcomms bärbara dator till exempel inte känna igen eGPU:n, medan en Thunderbolt-aktiverad dator skulle känna igen den automatiskt via Enhetshanteraren. Qualcomm har sagt att all support och tillämpliga drivrutiner kommer att vara upp till de enskilda eGPU-tillverkarna, vilket inte är lovande för befintliga eGPU-ägare.

Framåt: Inga portar
Framåt: Inga portar
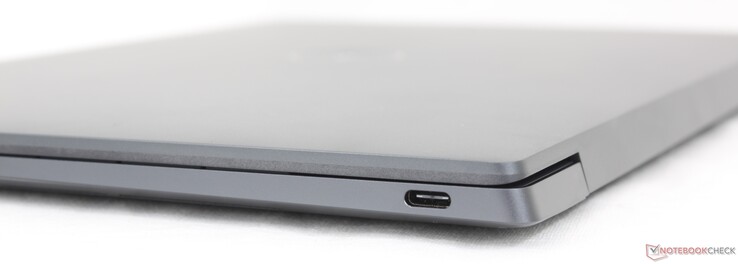
Höger sida: USB-C 4 (40 Gbps) med Power Delivery + DisplayPort
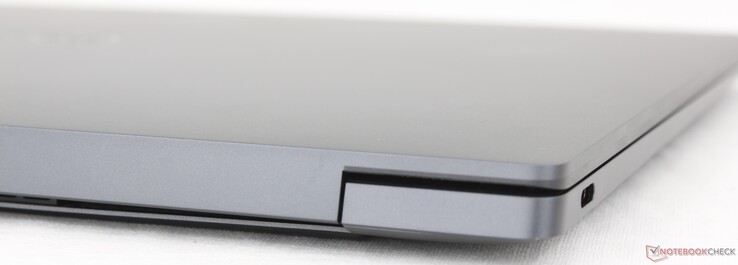
Bakre delen: Inga portar
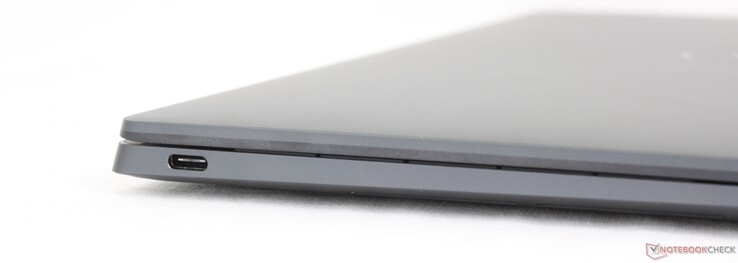
Vänster: USB-C 4 (40 Gbps) med Power Delivery + DisplayPort

Kommunikation

Dell har bytt ut BE200 från Intel XPS 13 mot FastConnect 7800 på Qualcomm XPS 13. Modulen stöder Wi-Fi 7-anslutning, vilket fortfarande är ovanligt i de flesta hushåll. Prestandan är ändå stabil när den kopplas ihop med vår Wi-Fi 6E AXE11000 testrouter.

Lödd WLAN-modul
Lödd WLAN-modul
Networking
iperf3 transmit AXE11000
Lenovo ThinkBook 13x G4 21KR0008GE
Intel Wi-Fi 6E AX211
1666 (1537min, 1551.79P1 - 1751max) MBit/s +98%
Dell XPS 13 9340 Core Ultra 7
Intel Wi-Fi 7 BE200 320MHz
1615 (1517min, 1522.22P1 - 1687max) MBit/s +92%
Asus ZenBook S13 OLED UX5304
Intel Wi-Fi 6E AX211
1555 (1319min - 1613max) MBit/s +85%
Microsoft Surface Laptop 7 13.8 Copilot+
Qualcomm FastConnect 7800
1483 (1390min - 1582max) MBit/s +76%
Dell XPS 13 9345
Qualcomm FastConnect 7800
842 (782min - 873max) MBit/s
HP EliteBook Ultra G1q 14
Qualcomm Fast Connect 6900 Wi-Fi 6E Dual Band Simultaneous
684 (612min - 770max) MBit/s -19%
iperf3 receive AXE11000
Microsoft Surface Laptop 7 13.8 Copilot+
Qualcomm FastConnect 7800
1720 (1619min - 1751max) MBit/s +89%
Lenovo ThinkBook 13x G4 21KR0008GE
Intel Wi-Fi 6E AX211
1709 (1689min, 1690.74P1 - 1723max) MBit/s +88%
Dell XPS 13 9340 Core Ultra 7
Intel Wi-Fi 7 BE200 320MHz
1504 (1431min, 1431.87P1 - 1544max) MBit/s +65%
Asus ZenBook S13 OLED UX5304
Intel Wi-Fi 6E AX211
1439 (1353min - 1469max) MBit/s +58%
HP EliteBook Ultra G1q 14
Qualcomm Fast Connect 6900 Wi-Fi 6E Dual Band Simultaneous
912 (893min - 928max) MBit/s 0%
Dell XPS 13 9345
Qualcomm FastConnect 7800
911 (801min - 946max) MBit/s
iperf3 transmit AXE11000 6GHz
Microsoft Surface Laptop 7 13.8 Copilot+
Qualcomm FastConnect 7800
1546 (1484min - 1644max) MBit/s +59%
HP EliteBook Ultra G1q 14
Qualcomm Fast Connect 6900 Wi-Fi 6E Dual Band Simultaneous
1430 (1268min - 1550max) MBit/s +47%
Dell XPS 13 9345
Qualcomm FastConnect 7800
973 (935min - 1001max) MBit/s
iperf3 receive AXE11000 6GHz
Microsoft Surface Laptop 7 13.8 Copilot+
Qualcomm FastConnect 7800
1775 (1757min - 1789max) MBit/s +23%
HP EliteBook Ultra G1q 14
Qualcomm Fast Connect 6900 Wi-Fi 6E Dual Band Simultaneous
1703 (1611min - 1768max) MBit/s +18%
Dell XPS 13 9345
Qualcomm FastConnect 7800
1447 (1327min - 1488max) MBit/s
0501001502002503003504004505005506006507007508008509009501000105011001150120012501300135014001450Tooltip
Dell XPS 13 9345; iperf3 transmit AXE11000 6GHz; iperf 3.1.3: Ø973 (935-1001)
Dell XPS 13 9345; iperf3 receive AXE11000 6GHz; iperf 3.1.3: Ø1447 (1327-1488)

Webbkamera

Modellen levereras som standard med samma 2 MP webbkamera som finns på XPS 13 9340 istället för 1 MP webbkamera på den ursprungliga XPS 13 9320. IR är också inbyggt för att stödja Windows Hello ansiktsigenkänning. Det finns dock fortfarande inget kameralock eller någon kill switch att tala om.
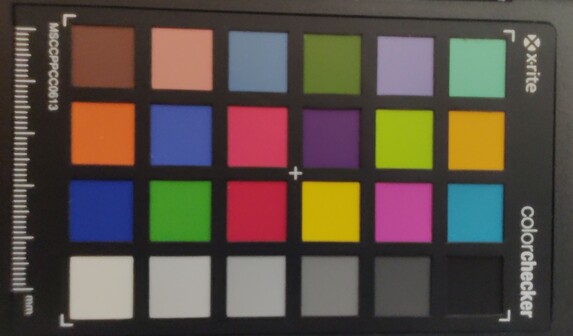
ColorChecker
5.4 ∆E
5.4 ∆E
6 ∆E
8 ∆E
8.4 ∆E
6.5 ∆E
8.5 ∆E
2 ∆E
6.3 ∆E
2.9 ∆E
4.5 ∆E
4.7 ∆E
3.8 ∆E
5.3 ∆E
3.4 ∆E
7.3 ∆E
3.6 ∆E
4.2 ∆E
15 ∆E
9.2 ∆E
2.5 ∆E
1.4 ∆E
2.6 ∆E
5.7 ∆E
ColorChecker Dell XPS 13 9345: 5.53 ∆E min: 1.37 - max: 15.01 ∆E

Underhåll

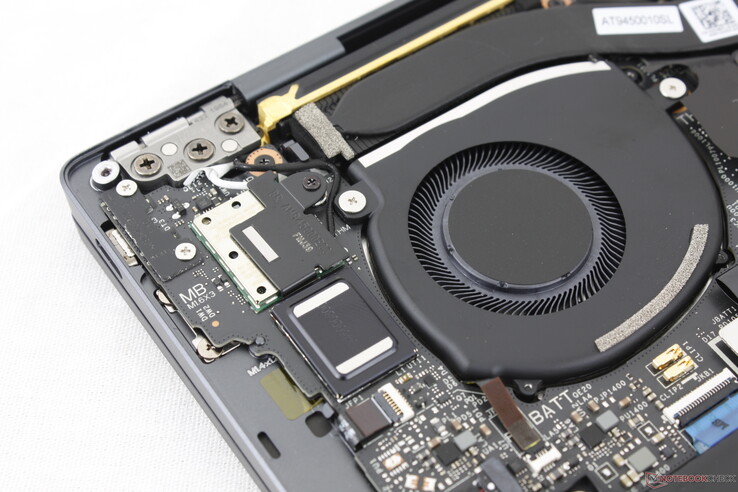
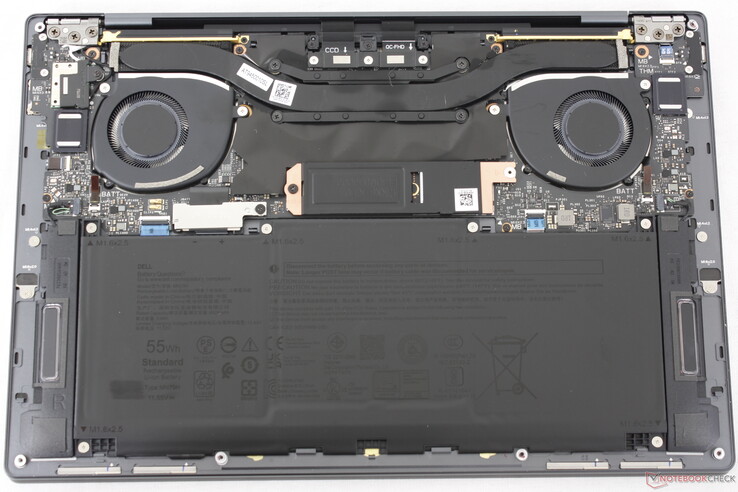
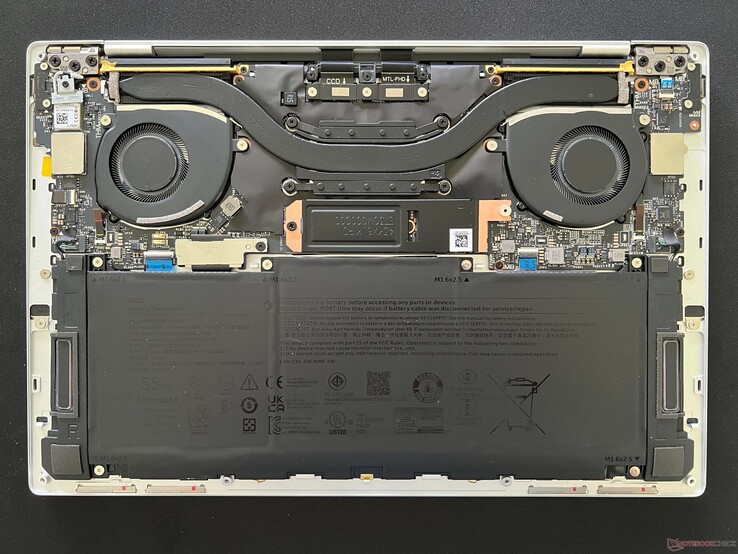
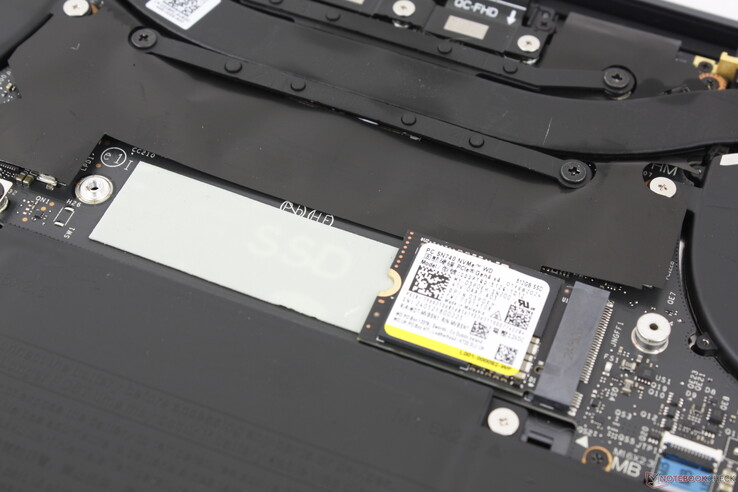
Bottenpanelen kräver endast en Torx-skruvmejsel för att avlägsnas. Det finns annars inget att uppgradera utöver den enda M.2 SSD-enheten eftersom både RAM och WLAN är lödda.

XPS 13 9345
XPS 13 9345
XPS 13 9340 för jämförelse. Det finns inga större interna skillnader mellan Intel- och Qualcomm-varianterna av XPS 13

Hållbarhet

Förpackningen består av 75 procent återvunnet material och 25 procent förnybart material för att vara helt återvinningsbar. Själva den bärbara datorn är tillverkad av minst 20 procent återvunnet aluminium och glas.

Tillbehör och garanti

Det finns inga extra tillbehör i lådan förutom nätadaptern och pappersarbetet, medan de Intel-baserade XPS-modellerna ofta inkluderar en USB-C till USB-A-adapter gratis.

Den vanliga ettåriga begränsade tillverkargarantin gäller om den köps i USA.

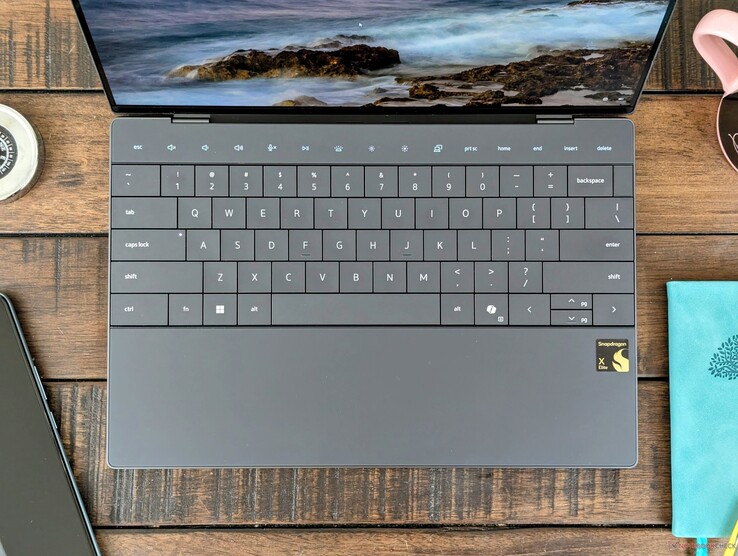
Inmatningsenheter - renare utseende på bekostnad av användbarhet

Tangentbord

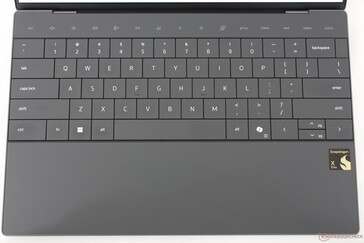
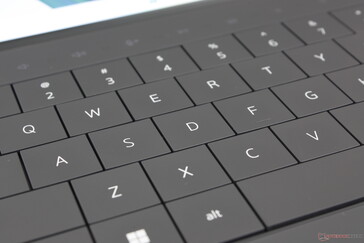
Tangentbordet med noll lameller tar lite tid att vänja sig vid jämfört med de traditionella tangentborden på de flesta andra subnotebooks. Tangentrörelsen är ännu mindre än vanligt, bara 1,0 mm, och återkopplingen är relativt mjuk för en svampigare skrivupplevelse. Skillnaden är natt och dag när man hoppar mellan XPS 13 9345 och de fastare tangenterna på HP Spectre x360 14.

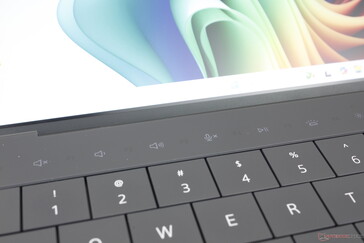
De pekaktiverade funktionstangenterna är också en blandad påse. Lenovo implementerade något mycket liknande på sin ThinkPad-serie för flera år sedan innan de omedelbart tappade det och så det är lite förvånande att se dem dyka upp igen på en konkurrerande tillverkare. Huvudproblemet är att tangenterna är känsliga för även den minsta beröring, vilket kan leda till oavsiktliga inmatningar.

Pekplatta

Den osynliga XPS-klickplattan har blivit ökänd för sin användarovänlighet och trenden fortsätter på Snapdragon-modellen. Medan den användbara ytan är ganska rymlig för en 13-tums formfaktor på cirka 11,5 x 7,5 cm, är det otillfredsställande att klicka på grund av den svaga återkopplingen. Ännu värre är att den kraft som krävs för ett klick är mycket lägre än på de flesta andra bärbara datorer, vilket leder till många oavsiktliga klick och dragningar när du bara försöker flytta markören. Vi hoppades på några förbättringar i det här avseendet efter två år med den här designen, men så är tyvärr inte fallet.

Tangentbord med noll-lattice och välbekant QWERTY-layout
Klickplattan är rymlig, men taktiliteten är dålig och för känslig
Touch-aktiverade funktionsknappar växlar mellan F-funktioner och sekundära funktioner
Tangentrörelsen är liten, bara 1 mm. Återkopplingen kunde ha varit hårdare

Display

Tre displayalternativ finns tillgängliga enligt följande. Vår recensionskonfiguration levereras med det fetmarkerade alternativet.

  • 1920 x 1200, IPS, 120 Hz, beröringsfri, matt
  • 2560 x 1600, IPS, 120 Hz, beröringsfri, glansig
  • 2880 x 1800, OLED, 60 Hz, beröringsfri, blank

Allt tyder på att vår 120 Hz-panel är exakt samma panel som används i den Intel-baserade XPS 13. Allt från VRR-stöd ner till 30 Hz, de adekvata svarstiderna och den maximala ljusstyrkan på 500 nit är liknande funktioner som finns på vår senaste Core Ultra 7 XPS 13-testenhet. Mest anmärkningsvärt är det höga kontrastförhållandet på nästan 2000:1 jämfört med 1000:1 på de flesta IPS-paneler som finns på andra bärbara datorer. Skärmarna på XPS-modellerna har alltid varit några av de bästa i klassen och därför ser även det billigaste IPS-alternativet fortfarande fantastiskt ut.

Färgtäckningen är begränsad till >95% sRGB om den är konfigurerad med basalternativet medan DCI-P3-färger är reserverade för de dyrare 1600p IPS- och 1800p OLED-panelerna. Användare kanske vill inaktivera Adaptive Color för att förhindra små färgförändringar vid fotoredigering.

Något som är värt att nämna om denna panel är dess relativt höga minimala ljusstyrka på 49 nits, vilket är något vi märkte på vår Core i7-modell också. I jämförelse når skärmarna på de flesta andra bärbara datorer vanligtvis 15 nits eller svagare när de är inställda på lägsta ljusstyrka. Den högre ljusstyrkan hos Dell kan vara mer benägen att orsaka ansträngda ögon om man tittar i mörka miljöer. Detta potentiella problem finns inte i OLED-konfigurationen som kan nå mycket svagare ljusstyrkenivåer.

Det matta överdraget från kant till kant är mycket tunt för att färgerna ska framträda tydligare
Smalare sidoramar än de flesta andra modeller
Lätt-måttlig ojämn bakgrundsbelysning med blödning längs de övre hörnen
Skarpa RGB-subpixlar utan problem med kornighet
479.7
cd/m²
481.2
cd/m²
460.8
cd/m²
517.9
cd/m²
518.3
cd/m²
486
cd/m²
493.2
cd/m²
499.9
cd/m²
447.2
cd/m²
Distribution av ljusstyrkan
tested with X-Rite i1Pro 2
Max: 518.3 cd/m² (Nits) Medel: 487.1 cd/m² Minimum: 49 cd/m²
Distribution av ljusstyrkan: 86 %
Mitt på batteriet: 518.3 cd/m²
Kontrast: 1993:1 (Svärta: 0.26 cd/m²)
ΔE Color 3.4 | 0.5-29.43 Ø4.91
ΔE Greyscale 4.2 | 0.5-98 Ø5.2
71.7% AdobeRGB 1998 (Argyll 2.2.0 3D)
97.8% sRGB (Argyll 2.2.0 3D)
69.4% Display P3 (Argyll 2.2.0 3D)
Gamma: 2.29
Dell XPS 13 9345
IPS, 1920x1200, 13.4", 120 Hz
Dell XPS 13 9340 Core Ultra 7
SHP1593, IPS, 1920x1200, 13.4", 120 Hz
Microsoft Surface Laptop 7 13.8 Copilot+
LQ138P1JX61, IPS, 2304x1536, 13.8", 120 Hz
Lenovo ThinkBook 13x G4 21KR0008GE
LEN135WQ+, IPS, 2880x1920, 13.5", 120 Hz
HP EliteBook Ultra G1q 14
IPS, 2240x1400, 14", 60 Hz
Asus ZenBook S13 OLED UX5304
SDC417B, OLED, 2880x1800, 13.3", 60 Hz
Display
0%
21%
-4%
27%
Display P3 Coverage
69.4
69.4
0%
97.8
41%
65.5
-6%
99.7
44%
sRGB Coverage
97.8
97.8
0%
98.2
0%
97.3
-1%
100
2%
AdobeRGB 1998 Coverage
71.7
71.7
0%
87.3
22%
67.7
-6%
96.9
35%
Response Times
-25%
5%
32%
27%
94%
Response Time Grey 50% / Grey 80% *
35.2 ?(15.2, 20)
43.2 ?(21.1, 22.1)
-23%
38.9 ?(17.6, 21.3)
-11%
27.3 ?(12.8, 14.5)
22%
22.8 ?(9.3, 13.5)
35%
2 ?(1.1, 0.9)
94%
Response Time Black / White *
21.8 ?(10.5, 11.3)
27.6 ?(16, 11.6)
-27%
17.4 ?(5.7, 11.7)
20%
12.8 ?(4.4, 8.4)
41%
17.9 ?(10.3, 7.6)
18%
1.6 ?(0.8, 0.8)
93%
PWM Frequency
240 ?(57, 88)
Screen
-6%
16%
10%
-58%
27%
Brightness middle
518.3
429
-17%
606
17%
539
4%
341.4
-34%
361
-30%
Brightness
487
407
-16%
592
22%
513
5%
315
-35%
365
-25%
Brightness Distribution
86
90
5%
94
9%
89
3%
87
1%
98
14%
Black Level *
0.26
0.28
-8%
0.43
-65%
0.38
-46%
0.39
-50%
Contrast
1993
1532
-23%
1409
-29%
1418
-29%
875
-56%
Colorchecker dE 2000 *
3.4
2.6
24%
1.3
62%
1.4
59%
5.63
-66%
1.2
65%
Colorchecker dE 2000 max. *
5.68
6.6
-16%
2.1
63%
3.5
38%
11.94
-110%
1.9
67%
Greyscale dE 2000 *
4.2
4
5%
2.1
50%
2.2
48%
8.8
-110%
1.2
71%
Gamma
2.29 96%
2.23 99%
2.16 102%
2.19 100%
2.14 103%
2.27 97%
CCT
7235 90%
7332 89%
6842 95%
6710 97%
6034 108%
6486 100%
Colorchecker dE 2000 calibrated *
1.4
0.7
Total Average (Program / Settings)
-10% / -7%
14% / 15%
13% / 10%
-16% / -41%
49% / 39%

* ... smaller is better

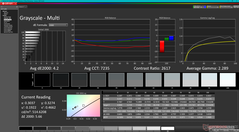
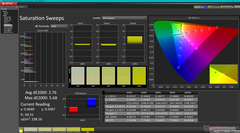
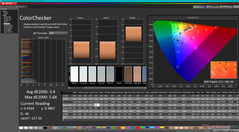
Vår X-Rite-kolorimeter visar att skärmen är inriktad på sRGB med hyfsade genomsnittliga deltaE-värden för gråskala och färg på 4,2 respektive 3,4. Färgtemperaturen är dock något för kall vid 7235, vilket påverkar färgnoggrannheten vid lägre mättnadsnivåer. Det är synd att Dell inte kalibrerar panelen på fabriken eftersom de flesta kalibreringsprogram ännu inte är kompatibla med ARM, inklusive i1Profiler.

Gråskala
Gråskala
Mättnadssvep
Mättnadssvep
Färgkontroll
Färgkontroll

Display Response Times

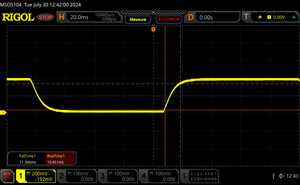
Display response times show how fast the screen is able to change from one color to the next. Slow response times can lead to afterimages and can cause moving objects to appear blurry (ghosting). Gamers of fast-paced 3D titles should pay special attention to fast response times.
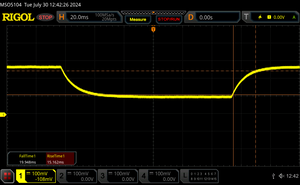
       Response Time Black to White
21.8 ms ... rise ↗ and fall ↘ combined↗ 10.5 ms rise
↘ 11.3 ms fall
The screen shows good response rates in our tests, but may be too slow for competitive gamers.
In comparison, all tested devices range from 0.1 (minimum) to 240 (maximum) ms. » 44 % of all devices are better.
This means that the measured response time is similar to the average of all tested devices (20.9 ms).
       Response Time 50% Grey to 80% Grey
35.2 ms ... rise ↗ and fall ↘ combined↗ 15.2 ms rise
↘ 20 ms fall
The screen shows slow response rates in our tests and will be unsatisfactory for gamers.
In comparison, all tested devices range from 0.165 (minimum) to 636 (maximum) ms. » 45 % of all devices are better.
This means that the measured response time is similar to the average of all tested devices (32.8 ms).

Screen Flickering / PWM (Pulse-Width Modulation)

To dim the screen, some notebooks will simply cycle the backlight on and off in rapid succession - a method called Pulse Width Modulation (PWM) . This cycling frequency should ideally be undetectable to the human eye. If said frequency is too low, users with sensitive eyes may experience strain or headaches or even notice the flickering altogether.
Screen flickering / PWM not detected

In comparison: 53 % of all tested devices do not use PWM to dim the display. If PWM was detected, an average of 8710 (minimum: 5 - maximum: 343500) Hz was measured.

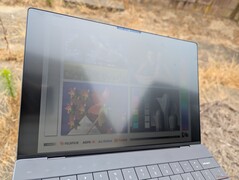
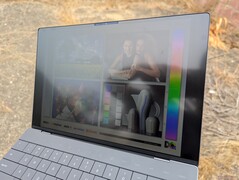
Utomhus under starkt mulet väder
Utomhus i skugga. Skärmen är synlig i skugga med mestadels acceptabel bländning
Utomhus under starkt mulet väder
Breda IPS-betraktningsvinklar

Prestanda

Testförhållanden

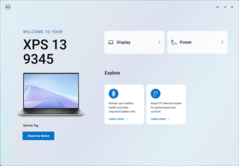
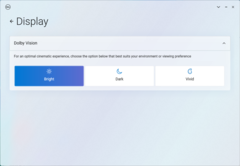
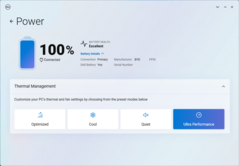
Vi ställde in Windows och MyDell i prestandaläge innan vi körde nedanstående benchmarks. MyDell har fått en ny design på Snapdragon-modellen för att vara enklare att använda jämfört med samma programvara på den Intel-baserade XPS 13. Vissa funktioner som tidigare fanns i programvaran, t.ex. närvarodetektering, har flyttats till Windows Power and Battery-menyn istället.

MyDell startskärm
MyDell startskärm
Visa menyn
Visa menyn
Meny för energiprofil

Processor

Perfekt 4K60-videouppspelning utan tappade bildrutor

Prestanda beror ganska mycket på om applikationen är inbyggd eller emulerad. Processorn utmärker sig till exempel i CineBench 2024 och GeekBench 6, eftersom båda har optimerats för en ARM-miljö. Vår Snapdragon X Elite X1E-80-100 skulle överträffa Core Ultra 7 155H i både flertrådiga och enkeltrådiga operationer under sådana förhållanden. Annars drar emulerade riktmärken tillbaka vår Snapdragon CPU till prestandanivåer som är mer i nivå med den äldre Core i5-1240P eller Core i7-1260P. Med andra ord kan Qualcomm-processorn vara konkurrenskraftig mot Core Ultra 7 155H som tillverkaren vill hävda, men förhållandena och applikationerna måste vara helt rätt för att dessa fördelar ska kunna utvecklas.

Prestandakonsistens kan också vara svårt att mäta mellan Snapdragon-processorer. För vårt exempel skulle vår Snapdragon X Elite X1E-80-100 bekvämt överträffa Snapdragon X Elite X1E-78-100 i EliteBook Ultra G1q 14 i CineBench 2024, men det motsatta gäller i CineBench R23 och R15.

Cinebench R15 Multi Loop

011523034546057569080592010351150126513801495161017251840195520702185Tooltip
Dell XPS 13 9345 Qualcomm Snapdragon X Elite X1E-80-100: Ø1626 (1572.7-1665.14)
Dell XPS 13 9340 Core Ultra 7 Intel Core Ultra 7 155H: Ø1635 (1358.56-2230.28)
Microsoft Surface Laptop 7 13.8 Copilot+ Qualcomm Snapdragon X Elite X1E-80-100: Ø1681 (1597.25-2095.89)
Lenovo ThinkBook 13x G4 21KR0008GE Intel Core Ultra 5 125H: Ø1373 (1247-1702.49)
HP EliteBook Ultra G1q 14 Qualcomm Snapdragon X Elite X1E-78-100: Ø1602 (1524.39-2175.45)
Asus ZenBook S13 OLED UX5304 Intel Core i7-1355U: Ø1024 (989.63-1358.19)
CPU Performance Rating: Percent
Cinebench 2024: CPU Multi Core | CPU Single Core
Cinebench R23: Multi Core | Single Core
Cinebench R20: CPU (Multi Core) | CPU (Single Core)
Cinebench R15: CPU Multi 64Bit | CPU Single 64Bit
Blender: v2.79 BMW27 CPU
7-Zip 18.03: 7z b 4 | 7z b 4 -mmt1
Geekbench 6.3: Multi-Core | Single-Core
HWBOT x265 Benchmark v2.2: 4k Preset
LibreOffice : 20 Documents To PDF
R Benchmark 2.5: Overall mean
CPU Performance Rating
Dell XPS 14 2024 OLED
Intel Core Ultra 7 155H
85 pt
Dell XPS 13 9340 Core Ultra 7
Intel Core Ultra 7 155H
82.2 pt
Dell XPS 13 Plus 9320 Core i7-1360P -4!
Intel Core i7-1360P
78.7 pt
Dell XPS 13 Plus 9320 i7-1280P OLED -4!
Intel Core i7-1280P
75.1 pt
Dell XPS 13 Plus 9320 4K -4!
Intel Core i7-1260P
71.4 pt
Microsoft Surface Laptop 7 13.8 Copilot+
Qualcomm Snapdragon X Elite X1E-80-100
70.5 pt
Dell XPS 13 9345
Qualcomm Snapdragon X Elite X1E-80-100
70 pt
Average Qualcomm Snapdragon X Elite X1E-80-100
 
69.3 pt
HP EliteBook Ultra G1q 14
Qualcomm Snapdragon X Elite X1E-78-100
65.8 pt
Medion SPRCHRGD 14 S1 Elite
Qualcomm Snapdragon X Elite X1E-78-100
65.8 pt
Dell XPS 13 Plus 9320 i5-1240p -4!
Intel Core i5-1240P
65.6 pt
Lenovo ThinkPad T14s Gen 6 21N10007GE
Qualcomm Snapdragon X Elite X1E-78-100
65.1 pt
Dell XPS 13 9315 2-in-1 Core i5-1230U -4!
Intel Core i5-1230U
58 pt
Dell XPS 13 9315, i5-1230U -8!
Intel Core i5-1230U
48.8 pt
Dell XPS 13 9310 Core i7 4K -4!
Intel Core i7-1185G7
48.1 pt
Dell XPS 13 9310 OLED -4!
Intel Core i7-1185G7
46.5 pt
Dell XPS 13 9310 2-in-1 -5!
Intel Core i7-1165G7
45 pt
Dell XPS 13 9305 Core i5 FHD -6!
Intel Core i5-1135G7
42.3 pt
Cinebench 2024 / CPU Multi Core
Dell XPS 13 9345
Qualcomm Snapdragon X Elite X1E-80-100
927 Points
Microsoft Surface Laptop 7 13.8 Copilot+
Qualcomm Snapdragon X Elite X1E-80-100
897 Points -3%
Average Qualcomm Snapdragon X Elite X1E-80-100
  (621 - 927, n=5)
839 Points -9%
Medion SPRCHRGD 14 S1 Elite
Qualcomm Snapdragon X Elite X1E-78-100
794 Points -14%
HP EliteBook Ultra G1q 14
Qualcomm Snapdragon X Elite X1E-78-100
768 Points -17%
Lenovo ThinkPad T14s Gen 6 21N10007GE
Qualcomm Snapdragon X Elite X1E-78-100
746 Points -20%
Dell XPS 13 9340 Core Ultra 7
Intel Core Ultra 7 155H
675 Points -27%
Dell XPS 14 2024 OLED
Intel Core Ultra 7 155H
667 Points -28%
Cinebench 2024 / CPU Single Core
Microsoft Surface Laptop 7 13.8 Copilot+
Qualcomm Snapdragon X Elite X1E-80-100
123 Points 0%
Average Qualcomm Snapdragon X Elite X1E-80-100
  (122 - 123, n=5)
122.7 Points 0%
Dell XPS 13 9345
Qualcomm Snapdragon X Elite X1E-80-100
122.5 Points
Lenovo ThinkPad T14s Gen 6 21N10007GE
Qualcomm Snapdragon X Elite X1E-78-100
108 Points -12%
Medion SPRCHRGD 14 S1 Elite
Qualcomm Snapdragon X Elite X1E-78-100
108 Points -12%
HP EliteBook Ultra G1q 14
Qualcomm Snapdragon X Elite X1E-78-100
102.8 Points -16%
Dell XPS 14 2024 OLED
Intel Core Ultra 7 155H
101.8 Points -17%
Dell XPS 13 9340 Core Ultra 7
Intel Core Ultra 7 155H
100 Points -18%
Cinebench R23 / Multi Core
Dell XPS 14 2024 OLED
Intel Core Ultra 7 155H
14166 Points +61%
Dell XPS 13 9340 Core Ultra 7
Intel Core Ultra 7 155H
13511 Points +53%
Dell XPS 13 Plus 9320 i7-1280P OLED
Intel Core i7-1280P
11852 (9209.64min - 11852max) Points +34%
Dell XPS 13 Plus 9320 Core i7-1360P
Intel Core i7-1360P
11503 (9427.43min - 11502.9max) Points +30%
HP EliteBook Ultra G1q 14
Qualcomm Snapdragon X Elite X1E-78-100
10960 (8060.14min - 10959.7max) Points +24%
Microsoft Surface Laptop 7 13.8 Copilot+
Qualcomm Snapdragon X Elite X1E-80-100
10028 Points +14%
Lenovo ThinkPad T14s Gen 6 21N10007GE
Qualcomm Snapdragon X Elite X1E-78-100
9996 Points +13%
Dell XPS 13 Plus 9320 4K
Intel Core i7-1260P
9743 Points +10%
Dell XPS 13 Plus 9320 i5-1240p
Intel Core i5-1240P
9392 Points +6%
Average Qualcomm Snapdragon X Elite X1E-80-100
  (6772 - 10028, n=5)
8991 Points +2%
Dell XPS 13 9345
Qualcomm Snapdragon X Elite X1E-80-100
8819 (8513.51min - 8819.34max) Points
Medion SPRCHRGD 14 S1 Elite
Qualcomm Snapdragon X Elite X1E-78-100
8726 Points -1%
Dell XPS 13 9315 2-in-1 Core i5-1230U
Intel Core i5-1230U
7264 (4444.94min - 7264.12max) Points -18%
Dell XPS 13 9305 Core i5 FHD
Intel Core i5-1135G7
5447 (4192.8min - 5447.26max) Points -38%
Dell XPS 13 9310 Core i7 4K
Intel Core i7-1185G7
5062 (4319.28min - 5062.12max) Points -43%
Dell XPS 13 9310 OLED
Intel Core i7-1185G7
5013 (4398.92min - 5012.66max) Points -43%
Dell XPS 13 9310 2-in-1
Intel Core i7-1165G7
4946 (4082.87min - 4945.54max) Points -44%
Dell XPS 13 9315, i5-1230U
Intel Core i5-1230U
4402 Points -50%
Cinebench R23 / Single Core
Dell XPS 13 Plus 9320 Core i7-1360P
Intel Core i7-1360P
1848 Points +45%
Dell XPS 14 2024 OLED
Intel Core Ultra 7 155H
1775 Points +39%
Dell XPS 13 9340 Core Ultra 7
Intel Core Ultra 7 155H
1685 Points +32%
Dell XPS 13 Plus 9320 4K
Intel Core i7-1260P
1678 Points +31%
Dell XPS 13 Plus 9320 i5-1240p
Intel Core i5-1240P
1621 Points +27%
Dell XPS 13 Plus 9320 i7-1280P OLED
Intel Core i7-1280P
1615 Points +26%
Dell XPS 13 9315 2-in-1 Core i5-1230U
Intel Core i5-1230U
1512 Points +18%
Dell XPS 13 9310 OLED
Intel Core i7-1185G7
1457 Points +14%
Dell XPS 13 9310 Core i7 4K
Intel Core i7-1185G7
1440 Points +13%
Dell XPS 13 9310 2-in-1
Intel Core i7-1165G7
1402 Points +10%
Microsoft Surface Laptop 7 13.8 Copilot+
Qualcomm Snapdragon X Elite X1E-80-100
1321 Points +3%
Dell XPS 13 9315, i5-1230U
Intel Core i5-1230U
1310 Points +3%
Dell XPS 13 9305 Core i5 FHD
Intel Core i5-1135G7
1308 Points +2%
Average Qualcomm Snapdragon X Elite X1E-80-100
  (1273 - 1321, n=5)
1296 Points +1%
Dell XPS 13 9345
Qualcomm Snapdragon X Elite X1E-80-100
1277 Points
Medion SPRCHRGD 14 S1 Elite
Qualcomm Snapdragon X Elite X1E-78-100
1130 Points -12%
Lenovo ThinkPad T14s Gen 6 21N10007GE
Qualcomm Snapdragon X Elite X1E-78-100
1124 Points -12%
HP EliteBook Ultra G1q 14
Qualcomm Snapdragon X Elite X1E-78-100
1111 Points -13%
Cinebench R20 / CPU (Multi Core)
Dell XPS 14 2024 OLED
Intel Core Ultra 7 155H
6099 Points +81%
Dell XPS 13 9340 Core Ultra 7
Intel Core Ultra 7 155H
5181 Points +54%
Dell XPS 13 Plus 9320 i7-1280P OLED
Intel Core i7-1280P
4571 Points +36%
Dell XPS 13 Plus 9320 Core i7-1360P
Intel Core i7-1360P
4424 Points +31%
HP EliteBook Ultra G1q 14
Qualcomm Snapdragon X Elite X1E-78-100
4128 Points +23%
Dell XPS 13 Plus 9320 4K
Intel Core i7-1260P
3909 Points +16%
Microsoft Surface Laptop 7 13.8 Copilot+
Qualcomm Snapdragon X Elite X1E-80-100
3802 Points +13%
Lenovo ThinkPad T14s Gen 6 21N10007GE
Qualcomm Snapdragon X Elite X1E-78-100
3548 Points +5%
Dell XPS 13 Plus 9320 i5-1240p
Intel Core i5-1240P
3424 Points +2%
Average Qualcomm Snapdragon X Elite X1E-80-100
  (2539 - 3802, n=5)
3380 Points 0%
Dell XPS 13 9345
Qualcomm Snapdragon X Elite X1E-80-100
3365 Points
Medion SPRCHRGD 14 S1 Elite
Qualcomm Snapdragon X Elite X1E-78-100
3203 Points -5%
Dell XPS 13 9315 2-in-1 Core i5-1230U
Intel Core i5-1230U
2802 Points -17%
Dell XPS 13 9310 Core i7 4K
Intel Core i7-1185G7
1936 Points -42%
Dell XPS 13 9310 OLED
Intel Core i7-1185G7
1873 Points -44%
Dell XPS 13 9305 Core i5 FHD
Intel Core i5-1135G7
1863 Points -45%
Dell XPS 13 9315, i5-1230U
Intel Core i5-1230U
1653 Points -51%
Dell XPS 13 9310 2-in-1
Intel Core i7-1165G7
1564 Points -54%
Cinebench R20 / CPU (Single Core)
Dell XPS 13 Plus 9320 Core i7-1360P
Intel Core i7-1360P
707 Points +50%
Dell XPS 14 2024 OLED
Intel Core Ultra 7 155H
672 Points +43%
Dell XPS 13 9340 Core Ultra 7
Intel Core Ultra 7 155H
656 Points +40%
Dell XPS 13 Plus 9320 4K
Intel Core i7-1260P
648 Points +38%
Dell XPS 13 Plus 9320 i7-1280P OLED
Intel Core i7-1280P
622 Points +32%
Dell XPS 13 Plus 9320 i5-1240p
Intel Core i5-1240P
616 Points +31%
Dell XPS 13 9315 2-in-1 Core i5-1230U
Intel Core i5-1230U
580 Points +23%
Dell XPS 13 9310 Core i7 4K
Intel Core i7-1185G7
567 Points +21%
Dell XPS 13 9310 OLED
Intel Core i7-1185G7
556 Points +18%
Dell XPS 13 9305 Core i5 FHD
Intel Core i5-1135G7
504 Points +7%
Microsoft Surface Laptop 7 13.8 Copilot+
Qualcomm Snapdragon X Elite X1E-80-100
495 Points +5%
Average Qualcomm Snapdragon X Elite X1E-80-100
  (470 - 495, n=5)
483 Points +3%
Dell XPS 13 9310 2-in-1
Intel Core i7-1165G7
475 Points +1%
Dell XPS 13 9345
Qualcomm Snapdragon X Elite X1E-80-100
470 Points
Dell XPS 13 9315, i5-1230U
Intel Core i5-1230U
469 Points 0%
Medion SPRCHRGD 14 S1 Elite
Qualcomm Snapdragon X Elite X1E-78-100
425 Points -10%
Lenovo ThinkPad T14s Gen 6 21N10007GE
Qualcomm Snapdragon X Elite X1E-78-100
422 Points -10%
HP EliteBook Ultra G1q 14
Qualcomm Snapdragon X Elite X1E-78-100
416 Points -11%
Cinebench R15 / CPU Multi 64Bit
Dell XPS 14 2024 OLED
Intel Core Ultra 7 155H
2620 (1743.3min - 2620.37max) Points +57%
Medion SPRCHRGD 14 S1 Elite
Qualcomm Snapdragon X Elite X1E-78-100
2351 Points +41%
Dell XPS 13 9340 Core Ultra 7
Intel Core Ultra 7 155H
2230 (1358.56min - 2230.28max) Points +34%
Lenovo ThinkPad T14s Gen 6 21N10007GE
Qualcomm Snapdragon X Elite X1E-78-100
2219 (1471.4min - 2218.89max) Points +33%
HP EliteBook Ultra G1q 14
Qualcomm Snapdragon X Elite X1E-78-100
2175 (1524.39min - 2175.45max) Points +31%
Microsoft Surface Laptop 7 13.8 Copilot+
Qualcomm Snapdragon X Elite X1E-80-100
2096 (1597.25min - 2095.89max) Points +26%
Dell XPS 13 Plus 9320 Core i7-1360P
Intel Core i7-1360P
1951 (1397.72min - 1950.55max) Points +17%
Dell XPS 13 Plus 9320 i7-1280P OLED
Intel Core i7-1280P
1905 (1369.16min - 1905.49max) Points +14%
Average Qualcomm Snapdragon X Elite X1E-80-100
  (1476 - 2249, n=5)
1836 Points +10%
Dell XPS 13 Plus 9320 4K
Intel Core i7-1260P
1677 (1481.98min - 1677.36max) Points +1%
Dell XPS 13 Plus 9320 4K
Intel Core i7-1260P
1626 (983.94min - 1625.95max) Points -2%
Dell XPS 13 9345
Qualcomm Snapdragon X Elite X1E-80-100
1665 (1572.7min - 1665.14max) Points
Dell XPS 13 Plus 9320 i5-1240p
Intel Core i5-1240P
1592 Points -4%
Dell XPS 13 9315 2-in-1 Core i5-1230U
Intel Core i5-1230U
1254 (632min - 1254.35max) Points -25%
Dell XPS 13 9310 Core i7 4K
Intel Core i7-1185G7
871 (631.55min - 870.74max) Points -48%
Dell XPS 13 9310 OLED
Intel Core i7-1185G7
766 (607.28min - 765.86max) Points -54%
Dell XPS 13 9310 2-in-1
Intel Core i7-1165G7
763 (481.71min - 762.89max) Points -54%
Dell XPS 13 9305 Core i5 FHD
Intel Core i5-1135G7
733 (584.31min - 733.42max) Points -56%
Dell XPS 13 9315, i5-1230U
Intel Core i5-1230U
514 (482min - 513.59max) Points -69%
Cinebench R15 / CPU Single 64Bit
Dell XPS 13 Plus 9320 Core i7-1360P
Intel Core i7-1360P
263 Points +14%
Dell XPS 14 2024 OLED
Intel Core Ultra 7 155H
255 Points +11%
Dell XPS 13 9340 Core Ultra 7
Intel Core Ultra 7 155H
253 Points +10%
Microsoft Surface Laptop 7 13.8 Copilot+
Qualcomm Snapdragon X Elite X1E-80-100
243 Points +6%
Dell XPS 13 Plus 9320 4K
Intel Core i7-1260P
240 Points +4%
Average Qualcomm Snapdragon X Elite X1E-80-100
  (230 - 248, n=5)
239 Points +4%
Dell XPS 13 9345
Qualcomm Snapdragon X Elite X1E-80-100
230 Points
Dell XPS 13 Plus 9320 i7-1280P OLED
Intel Core i7-1280P
229 Points 0%
Dell XPS 13 Plus 9320 i5-1240p
Intel Core i5-1240P
226 Points -2%
Dell XPS 13 9310 OLED
Intel Core i7-1185G7
221 Points -4%
Dell XPS 13 9315 2-in-1 Core i5-1230U
Intel Core i5-1230U
221 Points -4%
Dell XPS 13 9310 Core i7 4K
Intel Core i7-1185G7
217.1 Points -6%
Lenovo ThinkPad T14s Gen 6 21N10007GE
Qualcomm Snapdragon X Elite X1E-78-100
216 Points -6%
HP EliteBook Ultra G1q 14
Qualcomm Snapdragon X Elite X1E-78-100
208 Points -10%
Medion SPRCHRGD 14 S1 Elite
Qualcomm Snapdragon X Elite X1E-78-100
208 Points -10%
Dell XPS 13 9315, i5-1230U
Intel Core i5-1230U
186.8 Points -19%
Dell XPS 13 9310 2-in-1
Intel Core i7-1165G7
170 Points -26%
Blender / v2.79 BMW27 CPU
Dell XPS 13 9310 Core i7 4K
Intel Core i7-1185G7
652 Seconds * -86%
Dell XPS 13 9310 2-in-1
Intel Core i7-1165G7
647 Seconds * -84%
Dell XPS 13 9310 OLED
Intel Core i7-1185G7
637 Seconds * -81%
Dell XPS 13 9305 Core i5 FHD
Intel Core i5-1135G7
630 Seconds * -79%
Dell XPS 13 9315 2-in-1 Core i5-1230U
Intel Core i5-1230U
503 Seconds * -43%
Lenovo ThinkPad T14s Gen 6 21N10007GE
Qualcomm Snapdragon X Elite X1E-78-100
428 Seconds * -22%
Medion SPRCHRGD 14 S1 Elite
Qualcomm Snapdragon X Elite X1E-78-100
383 Seconds * -9%
Average Qualcomm Snapdragon X Elite X1E-80-100
  (339 - 510, n=5)
380 Seconds * -8%
Dell XPS 13 Plus 9320 i5-1240p
Intel Core i5-1240P
369 Seconds * -5%
HP EliteBook Ultra G1q 14
Qualcomm Snapdragon X Elite X1E-78-100
356 Seconds * -1%
Dell XPS 13 9345
Qualcomm Snapdragon X Elite X1E-80-100
351 Seconds *
Microsoft Surface Laptop 7 13.8 Copilot+
Qualcomm Snapdragon X Elite X1E-80-100
339 Seconds * +3%
Dell XPS 13 Plus 9320 4K
Intel Core i7-1260P
319 Seconds * +9%
Dell XPS 13 Plus 9320 Core i7-1360P
Intel Core i7-1360P
279 Seconds * +21%
Dell XPS 13 Plus 9320 i7-1280P OLED
Intel Core i7-1280P
268 Seconds * +24%
Dell XPS 14 2024 OLED
Intel Core Ultra 7 155H
253 Seconds * +28%
Dell XPS 13 9340 Core Ultra 7
Intel Core Ultra 7 155H
243 Seconds * +31%
7-Zip 18.03 / 7z b 4
Dell XPS 13 9340 Core Ultra 7
Intel Core Ultra 7 155H
58233 MIPS +38%
Dell XPS 14 2024 OLED
Intel Core Ultra 7 155H
54409 MIPS +29%
Dell XPS 13 Plus 9320 i7-1280P OLED
Intel Core i7-1280P
49572 MIPS +17%
Dell XPS 13 Plus 9320 Core i7-1360P
Intel Core i7-1360P
47737 MIPS +13%
HP EliteBook Ultra G1q 14
Qualcomm Snapdragon X Elite X1E-78-100
46889 MIPS +11%
Microsoft Surface Laptop 7 13.8 Copilot+
Qualcomm Snapdragon X Elite X1E-80-100
45905 MIPS +9%
Medion SPRCHRGD 14 S1 Elite
Qualcomm Snapdragon X Elite X1E-78-100
43999 MIPS +4%
Dell XPS 13 Plus 9320 4K
Intel Core i7-1260P
43056 MIPS +2%
Dell XPS 13 9345
Qualcomm Snapdragon X Elite X1E-80-100
42231 MIPS
Average Qualcomm Snapdragon X Elite X1E-80-100
  (34299 - 45905, n=5)
42121 MIPS 0%
Dell XPS 13 Plus 9320 i5-1240p
Intel Core i5-1240P
40777 MIPS -3%
Lenovo ThinkPad T14s Gen 6 21N10007GE
Qualcomm Snapdragon X Elite X1E-78-100
38047 MIPS -10%
Dell XPS 13 9315 2-in-1 Core i5-1230U
Intel Core i5-1230U
34505 MIPS -18%
Dell XPS 13 9310 2-in-1
Intel Core i7-1165G7
25215 MIPS -40%
Dell XPS 13 9305 Core i5 FHD
Intel Core i5-1135G7
24447 MIPS -42%
Dell XPS 13 9310 Core i7 4K
Intel Core i7-1185G7
20478 MIPS -52%
Dell XPS 13 9315, i5-1230U
Intel Core i5-1230U
20092 MIPS -52%
Dell XPS 13 9310 OLED
Intel Core i7-1185G7
18812 MIPS -55%
7-Zip 18.03 / 7z b 4 -mmt1
Dell XPS 13 Plus 9320 Core i7-1360P
Intel Core i7-1360P
5526 MIPS +4%
Dell XPS 13 9340 Core Ultra 7
Intel Core Ultra 7 155H
5410 MIPS +2%
Dell XPS 14 2024 OLED
Intel Core Ultra 7 155H
5395 MIPS +1%
Microsoft Surface Laptop 7 13.8 Copilot+
Qualcomm Snapdragon X Elite X1E-80-100
5338 MIPS 0%
Dell XPS 13 Plus 9320 4K
Intel Core i7-1260P
5325 MIPS 0%
Dell XPS 13 9345
Qualcomm Snapdragon X Elite X1E-80-100
5318 MIPS
Average Qualcomm Snapdragon X Elite X1E-80-100
  (5242 - 5359, n=5)
5306 MIPS 0%
Dell XPS 13 9310 2-in-1
Intel Core i7-1165G7
5121 MIPS -4%
Dell XPS 13 9310 Core i7 4K
Intel Core i7-1185G7
5099 MIPS -4%
Dell XPS 13 Plus 9320 i7-1280P OLED
Intel Core i7-1280P
4995 MIPS -6%
Dell XPS 13 9315 2-in-1 Core i5-1230U
Intel Core i5-1230U
4870 MIPS -8%
Dell XPS 13 Plus 9320 i5-1240p
Intel Core i5-1240P
4791 MIPS -10%
Medion SPRCHRGD 14 S1 Elite
Qualcomm Snapdragon X Elite X1E-78-100
4701 MIPS -12%
Dell XPS 13 9305 Core i5 FHD
Intel Core i5-1135G7
4579 MIPS -14%
Lenovo ThinkPad T14s Gen 6 21N10007GE
Qualcomm Snapdragon X Elite X1E-78-100
4511 MIPS -15%
HP EliteBook Ultra G1q 14
Qualcomm Snapdragon X Elite X1E-78-100
4341 MIPS -18%
Dell XPS 13 9315, i5-1230U
Intel Core i5-1230U
3873 MIPS -27%
Dell XPS 13 9310 OLED
Intel Core i7-1185G7
3678 MIPS -31%
Geekbench 6.3 / Multi-Core
Lenovo ThinkPad T14s Gen 6 21N10007GE
Qualcomm Snapdragon X Elite X1E-78-100
14767 Points +3%
Average Qualcomm Snapdragon X Elite X1E-80-100
  (14234 - 14646, n=5)
14424 Points 0%
Dell XPS 13 9345
Qualcomm Snapdragon X Elite X1E-80-100
14393 Points
Medion SPRCHRGD 14 S1 Elite
Qualcomm Snapdragon X Elite X1E-78-100
14330 Points 0%
Microsoft Surface Laptop 7 13.8 Copilot+
Qualcomm Snapdragon X Elite X1E-80-100
14234 Points -1%
Dell XPS 14 2024 OLED
Intel Core Ultra 7 155H
13301 Points -8%
HP EliteBook Ultra G1q 14
Qualcomm Snapdragon X Elite X1E-78-100
13287 Points -8%
Dell XPS 13 9340 Core Ultra 7
Intel Core Ultra 7 155H
11982 Points -17%
Geekbench 6.3 / Single-Core
Dell XPS 13 9345
Qualcomm Snapdragon X Elite X1E-80-100
2825 Points
Microsoft Surface Laptop 7 13.8 Copilot+
Qualcomm Snapdragon X Elite X1E-80-100
2805 Points -1%
Average Qualcomm Snapdragon X Elite X1E-80-100
  (2751 - 2845, n=5)
2799 Points -1%
Lenovo ThinkPad T14s Gen 6 21N10007GE
Qualcomm Snapdragon X Elite X1E-78-100
2462 Points -13%
Medion SPRCHRGD 14 S1 Elite
Qualcomm Snapdragon X Elite X1E-78-100
2456 Points -13%
Dell XPS 14 2024 OLED
Intel Core Ultra 7 155H
2440 Points -14%
Dell XPS 13 9340 Core Ultra 7
Intel Core Ultra 7 155H
2408 Points -15%
HP EliteBook Ultra G1q 14
Qualcomm Snapdragon X Elite X1E-78-100
2354 Points -17%
HWBOT x265 Benchmark v2.2 / 4k Preset
Dell XPS 14 2024 OLED
Intel Core Ultra 7 155H
15.6 fps +128%
Dell XPS 13 9340 Core Ultra 7
Intel Core Ultra 7 155H
15.5 fps +127%
Dell XPS 13 Plus 9320 i7-1280P OLED
Intel Core i7-1280P
13.8 fps +102%
Dell XPS 13 Plus 9320 Core i7-1360P
Intel Core i7-1360P
13.2 fps +93%
Dell XPS 13 Plus 9320 4K
Intel Core i7-1260P
11.8 fps +73%
Dell XPS 13 Plus 9320 i5-1240p
Intel Core i5-1240P
11.5 fps +68%
Dell XPS 13 9315 2-in-1 Core i5-1230U
Intel Core i5-1230U
8.33 fps +22%
Microsoft Surface Laptop 7 13.8 Copilot+
Qualcomm Snapdragon X Elite X1E-80-100
7.23 fps +6%
Dell XPS 13 9345
Qualcomm Snapdragon X Elite X1E-80-100
6.83 fps
HP EliteBook Ultra G1q 14
Qualcomm Snapdragon X Elite X1E-78-100
6.65 fps -3%
Medion SPRCHRGD 14 S1 Elite
Qualcomm Snapdragon X Elite X1E-78-100
6.58 fps -4%
Average Qualcomm Snapdragon X Elite X1E-80-100
  (4.74 - 7.23, n=5)
6.47 fps -5%
Lenovo ThinkPad T14s Gen 6 21N10007GE
Qualcomm Snapdragon X Elite X1E-78-100
6.39 fps -6%
Dell XPS 13 9310 OLED
Intel Core i7-1185G7
6.34 fps -7%
Dell XPS 13 9310 2-in-1
Intel Core i7-1165G7
6.32 fps -7%
Dell XPS 13 9310 Core i7 4K
Intel Core i7-1185G7
5.58 fps -18%
LibreOffice / 20 Documents To PDF
Microsoft Surface Laptop 7 13.8 Copilot+
Qualcomm Snapdragon X Elite X1E-80-100
98.5 s * -91%
Dell XPS 13 Plus 9320 i5-1240p
Intel Core i5-1240P
61.8 s * -20%
Average Qualcomm Snapdragon X Elite X1E-80-100
  (51.7 - 98.5, n=5)
61.8 s * -20%
HP EliteBook Ultra G1q 14
Qualcomm Snapdragon X Elite X1E-78-100
59.3 s * -15%
Dell XPS 13 9305 Core i5 FHD
Intel Core i5-1135G7
58.8 s * -14%
Lenovo ThinkPad T14s Gen 6 21N10007GE
Qualcomm Snapdragon X Elite X1E-78-100
57.6 s * -11%
Medion SPRCHRGD 14 S1 Elite
Qualcomm Snapdragon X Elite X1E-78-100
57 s * -10%
Dell XPS 13 9345
Qualcomm Snapdragon X Elite X1E-80-100
51.7 s *
Dell XPS 13 9315 2-in-1 Core i5-1230U
Intel Core i5-1230U
51.2 s * +1%
Dell XPS 14 2024 OLED
Intel Core Ultra 7 155H
49.6 s * +4%
Dell XPS 13 Plus 9320 i7-1280P OLED
Intel Core i7-1280P
49.2 s * +5%
Dell XPS 13 9340 Core Ultra 7
Intel Core Ultra 7 155H
47.8 s * +8%
Dell XPS 13 9310 Core i7 4K
Intel Core i7-1185G7
47.7 s * +8%
Dell XPS 13 Plus 9320 Core i7-1360P
Intel Core i7-1360P
46.5 s * +10%
Dell XPS 13 Plus 9320 4K
Intel Core i7-1260P
44.6 s * +14%
Dell XPS 13 9310 OLED
Intel Core i7-1185G7
43.2 s * +16%
R Benchmark 2.5 / Overall mean
HP EliteBook Ultra G1q 14
Qualcomm Snapdragon X Elite X1E-78-100
0.77 sec * -15%
Medion SPRCHRGD 14 S1 Elite
Qualcomm Snapdragon X Elite X1E-78-100
0.732 sec * -9%
Lenovo ThinkPad T14s Gen 6 21N10007GE
Qualcomm Snapdragon X Elite X1E-78-100
0.724 sec * -8%
Dell XPS 13 9345
Qualcomm Snapdragon X Elite X1E-80-100
0.67 sec *
Average Qualcomm Snapdragon X Elite X1E-80-100
  (0.63 - 0.67, n=5)
0.652 sec * +3%
Dell XPS 13 9305 Core i5 FHD
Intel Core i5-1135G7
0.651 sec * +3%
Microsoft Surface Laptop 7 13.8 Copilot+
Qualcomm Snapdragon X Elite X1E-80-100
0.63 sec * +6%
Dell XPS 13 9310 2-in-1
Intel Core i7-1165G7
0.612 sec * +9%
Dell XPS 13 9310 Core i7 4K
Intel Core i7-1185G7
0.605 sec * +10%
Dell XPS 13 9310 OLED
Intel Core i7-1185G7
0.594 sec * +11%
Dell XPS 13 9315 2-in-1 Core i5-1230U
Intel Core i5-1230U
0.527 sec * +21%
Dell XPS 13 Plus 9320 i5-1240p
Intel Core i5-1240P
0.524 sec * +22%
Dell XPS 13 Plus 9320 i7-1280P OLED
Intel Core i7-1280P
0.4998 sec * +25%
Dell XPS 13 Plus 9320 4K
Intel Core i7-1260P
0.4928 sec * +26%
Dell XPS 13 9340 Core Ultra 7
Intel Core Ultra 7 155H
0.4829 sec * +28%
Dell XPS 14 2024 OLED
Intel Core Ultra 7 155H
0.4711 sec * +30%
Dell XPS 13 Plus 9320 Core i7-1360P
Intel Core i7-1360P
0.4675 sec * +30%
CPU Performance Rating: Percent
Cinebench 2024: CPU Multi Core | CPU Single Core
Cinebench R23: Multi Core | Single Core
Cinebench R20: CPU (Multi Core) | CPU (Single Core)
Cinebench R15: CPU Multi 64Bit | CPU Single 64Bit
Blender: v2.79 BMW27 CPU
7-Zip 18.03: 7z b 4 | 7z b 4 -mmt1
Geekbench 6.3: Multi-Core | Single-Core
HWBOT x265 Benchmark v2.2: 4k Preset
LibreOffice : 20 Documents To PDF
R Benchmark 2.5: Overall mean

* ... smaller is better

Cinebench R15 CPU Multi 64Bit
1665 Points
Cinebench R15 OpenGL 64Bit
25.1 fps
Cinebench R15 Ref. Match 64Bit
98 %
Cinebench R15 CPU Single 64Bit
230 Points
Cinebench R20 CPU (Single Core)
470 Points
Cinebench R20 CPU (Multi Core)
3365 Points
Cinebench R23 Multi Core
8819 Points
Cinebench R23 Single Core
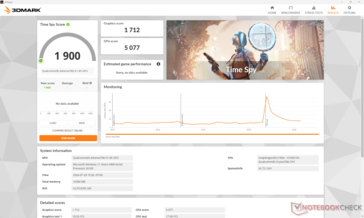
1277 Points
Cinebench 2024 CPU Multi Core
927 Points
Cinebench 2024 CPU Single Core
122.5 Points
Hjälp
Performance Rating
Dell XPS 13 9340 Core Ultra 7
Intel Core Ultra 7 155H, Arc 8-Core
99 pt
Lenovo ThinkBook 13x G4 21KR0008GE
Intel Core Ultra 5 125H, Arc 7-Core
76.1 pt
Microsoft Surface Laptop 7 13.8 Copilot+
Qualcomm Snapdragon X Elite X1E-80-100, Adreno X1-85 3.8 TFLOPS
66.8 pt
Dell XPS 13 9345
Qualcomm Snapdragon X Elite X1E-80-100, Adreno X1-85 3.8 TFLOPS
65.3 pt
HP EliteBook Ultra G1q 14
Qualcomm Snapdragon X Elite X1E-78-100, Adreno X1-85 3.8 TFLOPS
64.4 pt
Average Qualcomm Snapdragon X Elite X1E-80-100
 
61.1 pt
Asus ZenBook S13 OLED UX5304
Intel Core i7-1355U, Iris Xe G7 96EUs
56.5 pt
AIDA64 / FP32 Ray-Trace
Dell XPS 13 9340 Core Ultra 7
Intel Core Ultra 7 155H, Arc 8-Core
11809 KRay/s +64%
Lenovo ThinkBook 13x G4 21KR0008GE
Intel Core Ultra 5 125H, Arc 7-Core
8430 KRay/s +17%
HP EliteBook Ultra G1q 14
Qualcomm Snapdragon X Elite X1E-78-100, Adreno X1-85 3.8 TFLOPS
8083 KRay/s +12%
Microsoft Surface Laptop 7 13.8 Copilot+
Qualcomm Snapdragon X Elite X1E-80-100, Adreno X1-85 3.8 TFLOPS
7339 KRay/s +2%
Dell XPS 13 9345
Qualcomm Snapdragon X Elite X1E-80-100, Adreno X1-85 3.8 TFLOPS
7216 KRay/s
Asus ZenBook S13 OLED UX5304
Intel Core i7-1355U, Iris Xe G7 96EUs
5981 KRay/s -17%
Average Qualcomm Snapdragon X Elite X1E-80-100
  (2184 - 7339, n=5)
5756 KRay/s -20%
AIDA64 / FPU Julia
Dell XPS 13 9340 Core Ultra 7
Intel Core Ultra 7 155H, Arc 8-Core
63371 Points +141%
Lenovo ThinkBook 13x G4 21KR0008GE
Intel Core Ultra 5 125H, Arc 7-Core
44947 Points +71%
Asus ZenBook S13 OLED UX5304
Intel Core i7-1355U, Iris Xe G7 96EUs
31092 Points +18%
Microsoft Surface Laptop 7 13.8 Copilot+
Qualcomm Snapdragon X Elite X1E-80-100, Adreno X1-85 3.8 TFLOPS
26391 Points +1%
Dell XPS 13 9345
Qualcomm Snapdragon X Elite X1E-80-100, Adreno X1-85 3.8 TFLOPS
26253 Points
HP EliteBook Ultra G1q 14
Qualcomm Snapdragon X Elite X1E-78-100, Adreno X1-85 3.8 TFLOPS
24109 Points -8%
Average Qualcomm Snapdragon X Elite X1E-80-100
  (5687 - 26391, n=5)
18279 Points -30%
AIDA64 / CPU SHA3
HP EliteBook Ultra G1q 14
Qualcomm Snapdragon X Elite X1E-78-100, Adreno X1-85 3.8 TFLOPS
3187 MB/s +11%
Microsoft Surface Laptop 7 13.8 Copilot+
Qualcomm Snapdragon X Elite X1E-80-100, Adreno X1-85 3.8 TFLOPS
2949 MB/s +3%
Dell XPS 13 9340 Core Ultra 7
Intel Core Ultra 7 155H, Arc 8-Core
2923 MB/s +2%
Dell XPS 13 9345
Qualcomm Snapdragon X Elite X1E-80-100, Adreno X1-85 3.8 TFLOPS
2871 MB/s
Average Qualcomm Snapdragon X Elite X1E-80-100
  (2607 - 2949, n=5)
2790 MB/s -3%
Lenovo ThinkBook 13x G4 21KR0008GE
Intel Core Ultra 5 125H, Arc 7-Core
2047 MB/s -29%
Asus ZenBook S13 OLED UX5304
Intel Core i7-1355U, Iris Xe G7 96EUs
1632 MB/s -43%
AIDA64 / CPU Queen
Lenovo ThinkBook 13x G4 21KR0008GE
Intel Core Ultra 5 125H, Arc 7-Core
79986 Points +17%
Dell XPS 13 9340 Core Ultra 7
Intel Core Ultra 7 155H, Arc 8-Core
79760 Points +17%
Microsoft Surface Laptop 7 13.8 Copilot+
Qualcomm Snapdragon X Elite X1E-80-100, Adreno X1-85 3.8 TFLOPS
69319 Points +2%
Average Qualcomm Snapdragon X Elite X1E-80-100
  (68253 - 69762, n=5)
68917 Points +1%
Dell XPS 13 9345
Qualcomm Snapdragon X Elite X1E-80-100, Adreno X1-85 3.8 TFLOPS
68253 Points
HP EliteBook Ultra G1q 14
Qualcomm Snapdragon X Elite X1E-78-100, Adreno X1-85 3.8 TFLOPS
67909 Points -1%
Asus ZenBook S13 OLED UX5304
Intel Core i7-1355U, Iris Xe G7 96EUs
66531 Points -3%
AIDA64 / FPU SinJulia
Dell XPS 13 9340 Core Ultra 7
Intel Core Ultra 7 155H, Arc 8-Core
8689 Points +318%
Lenovo ThinkBook 13x G4 21KR0008GE
Intel Core Ultra 5 125H, Arc 7-Core
6588 Points +217%
Asus ZenBook S13 OLED UX5304
Intel Core i7-1355U, Iris Xe G7 96EUs
4216 Points +103%
Microsoft Surface Laptop 7 13.8 Copilot+
Qualcomm Snapdragon X Elite X1E-80-100, Adreno X1-85 3.8 TFLOPS
2130 Points +3%
Dell XPS 13 9345
Qualcomm Snapdragon X Elite X1E-80-100, Adreno X1-85 3.8 TFLOPS
2078 Points
Average Qualcomm Snapdragon X Elite X1E-80-100
  (1521 - 2357, n=5)
1950 Points -6%
HP EliteBook Ultra G1q 14
Qualcomm Snapdragon X Elite X1E-78-100, Adreno X1-85 3.8 TFLOPS
1518 Points -27%
AIDA64 / FPU Mandel
Dell XPS 13 9340 Core Ultra 7
Intel Core Ultra 7 155H, Arc 8-Core
30785 Points +137%
Lenovo ThinkBook 13x G4 21KR0008GE
Intel Core Ultra 5 125H, Arc 7-Core
21210 Points +63%
Asus ZenBook S13 OLED UX5304
Intel Core i7-1355U, Iris Xe G7 96EUs
15222 Points +17%
HP EliteBook Ultra G1q 14
Qualcomm Snapdragon X Elite X1E-78-100, Adreno X1-85 3.8 TFLOPS
14459 Points +11%
Microsoft Surface Laptop 7 13.8 Copilot+
Qualcomm Snapdragon X Elite X1E-80-100, Adreno X1-85 3.8 TFLOPS
13559 Points +4%
Average Qualcomm Snapdragon X Elite X1E-80-100
  (10117 - 15669, n=5)
13537 Points +4%
Dell XPS 13 9345
Qualcomm Snapdragon X Elite X1E-80-100, Adreno X1-85 3.8 TFLOPS
12996 Points
AIDA64 / CPU AES
HP EliteBook Ultra G1q 14
Qualcomm Snapdragon X Elite X1E-78-100, Adreno X1-85 3.8 TFLOPS
64583 MB/s +8%
Dell XPS 13 9340 Core Ultra 7
Intel Core Ultra 7 155H, Arc 8-Core
63548 MB/s +7%
Microsoft Surface Laptop 7 13.8 Copilot+
Qualcomm Snapdragon X Elite X1E-80-100, Adreno X1-85 3.8 TFLOPS
60080 MB/s +1%
Average Qualcomm Snapdragon X Elite X1E-80-100
  (39956 - 71089, n=5)
59937 MB/s +1%
Dell XPS 13 9345
Qualcomm Snapdragon X Elite X1E-80-100, Adreno X1-85 3.8 TFLOPS
59559 MB/s
Lenovo ThinkBook 13x G4 21KR0008GE
Intel Core Ultra 5 125H, Arc 7-Core
48373 MB/s -19%
Asus ZenBook S13 OLED UX5304
Intel Core i7-1355U, Iris Xe G7 96EUs
32647 MB/s -45%
AIDA64 / CPU ZLib
Dell XPS 13 9340 Core Ultra 7
Intel Core Ultra 7 155H, Arc 8-Core
883 MB/s +27%
HP EliteBook Ultra G1q 14
Qualcomm Snapdragon X Elite X1E-78-100, Adreno X1-85 3.8 TFLOPS
745 MB/s +8%
Microsoft Surface Laptop 7 13.8 Copilot+
Qualcomm Snapdragon X Elite X1E-80-100, Adreno X1-85 3.8 TFLOPS
721 MB/s +4%
Dell XPS 13 9345
Qualcomm Snapdragon X Elite X1E-80-100, Adreno X1-85 3.8 TFLOPS
693 MB/s
Average Qualcomm Snapdragon X Elite X1E-80-100
  (398 - 802, n=5)
646 MB/s -7%
Lenovo ThinkBook 13x G4 21KR0008GE
Intel Core Ultra 5 125H, Arc 7-Core
612 MB/s -12%
Asus ZenBook S13 OLED UX5304
Intel Core i7-1355U, Iris Xe G7 96EUs
488 MB/s -30%
AIDA64 / FP64 Ray-Trace
Dell XPS 13 9340 Core Ultra 7
Intel Core Ultra 7 155H, Arc 8-Core
6069 KRay/s +58%
Lenovo ThinkBook 13x G4 21KR0008GE
Intel Core Ultra 5 125H, Arc 7-Core
4421 KRay/s +15%
Microsoft Surface Laptop 7 13.8 Copilot+
Qualcomm Snapdragon X Elite X1E-80-100, Adreno X1-85 3.8 TFLOPS
4044 KRay/s +5%
Dell XPS 13 9345
Qualcomm Snapdragon X Elite X1E-80-100, Adreno X1-85 3.8 TFLOPS
3846 KRay/s
Average Qualcomm Snapdragon X Elite X1E-80-100
  (2581 - 4044, n=5)
3531 KRay/s -8%
Asus ZenBook S13 OLED UX5304
Intel Core i7-1355U, Iris Xe G7 96EUs
3134 KRay/s -19%
HP EliteBook Ultra G1q 14
Qualcomm Snapdragon X Elite X1E-78-100, Adreno X1-85 3.8 TFLOPS
2957 KRay/s -23%
AIDA64 / CPU PhotoWorxx
Dell XPS 13 9340 Core Ultra 7
Intel Core Ultra 7 155H, Arc 8-Core
51100 MPixel/s +34%
Lenovo ThinkBook 13x G4 21KR0008GE
Intel Core Ultra 5 125H, Arc 7-Core
47353 MPixel/s +24%
Asus ZenBook S13 OLED UX5304
Intel Core i7-1355U, Iris Xe G7 96EUs
38665 MPixel/s +1%
Microsoft Surface Laptop 7 13.8 Copilot+
Qualcomm Snapdragon X Elite X1E-80-100, Adreno X1-85 3.8 TFLOPS
38204 MPixel/s 0%
Dell XPS 13 9345
Qualcomm Snapdragon X Elite X1E-80-100, Adreno X1-85 3.8 TFLOPS
38096 MPixel/s
Average Qualcomm Snapdragon X Elite X1E-80-100
  (28474 - 38707, n=5)
35539 MPixel/s -7%
HP EliteBook Ultra G1q 14
Qualcomm Snapdragon X Elite X1E-78-100, Adreno X1-85 3.8 TFLOPS
27950 MPixel/s -27%

Systemets prestanda

WebXPRT och Kraken, som körs inbyggt i webbläsaren Edge optimerad för ARM, rankar båda vår Qualcomm XPS före Intel XPS med anständiga marginaler.

CrossMark: Overall | Productivity | Creativity | Responsiveness
WebXPRT 3: Overall
WebXPRT 4: Overall
Mozilla Kraken 1.1: Total
CrossMark / Overall
Dell XPS 13 9340 Core Ultra 7
Arc 8-Core, Ultra 7 155H, Micron 2550 512GB
1680 Points +24%
Asus ZenBook S13 OLED UX5304
Iris Xe G7 96EUs, i7-1355U, Samsung PM9A1 MZVL21T0HCLR
1592 Points +17%
Lenovo ThinkBook 13x G4 21KR0008GE
Arc 7-Core, Ultra 5 125H, Samsung PM9C1a MZAL8512HDLU
1548 Points +14%
Microsoft Surface Laptop 7 13.8 Copilot+
Adreno X1-85 3.8 TFLOPS, SD X Elite X1E-80-100, Samsung MZ9L4512HBLU-00BMV
1402 Points +3%
Average Qualcomm Snapdragon X Elite X1E-80-100, Qualcomm SD X Adreno X1-85 3.8 TFLOPS
  (1356 - 1443, n=5)
1396 Points +3%
Dell XPS 13 9345
Adreno X1-85 3.8 TFLOPS, SD X Elite X1E-80-100
1356 Points
HP EliteBook Ultra G1q 14
Adreno X1-85 3.8 TFLOPS, SD X Elite X1E-78-100, SK hynix PC801 HFS512GEJ9X101N BF
1027 Points -24%
CrossMark / Productivity
Dell XPS 13 9340 Core Ultra 7
Arc 8-Core, Ultra 7 155H, Micron 2550 512GB
1618 Points +27%
Asus ZenBook S13 OLED UX5304
Iris Xe G7 96EUs, i7-1355U, Samsung PM9A1 MZVL21T0HCLR
1566 Points +23%
Lenovo ThinkBook 13x G4 21KR0008GE
Arc 7-Core, Ultra 5 125H, Samsung PM9C1a MZAL8512HDLU
1483 Points +17%
Microsoft Surface Laptop 7 13.8 Copilot+
Adreno X1-85 3.8 TFLOPS, SD X Elite X1E-80-100, Samsung MZ9L4512HBLU-00BMV
1334 Points +5%
Average Qualcomm Snapdragon X Elite X1E-80-100, Qualcomm SD X Adreno X1-85 3.8 TFLOPS
  (1271 - 1375, n=5)
1318 Points +4%
Dell XPS 13 9345
Adreno X1-85 3.8 TFLOPS, SD X Elite X1E-80-100
1271 Points
HP EliteBook Ultra G1q 14
Adreno X1-85 3.8 TFLOPS, SD X Elite X1E-78-100, SK hynix PC801 HFS512GEJ9X101N BF
980 Points -23%
CrossMark / Creativity
Dell XPS 13 9340 Core Ultra 7
Arc 8-Core, Ultra 7 155H, Micron 2550 512GB
1854 Points +24%
Lenovo ThinkBook 13x G4 21KR0008GE
Arc 7-Core, Ultra 5 125H, Samsung PM9C1a MZAL8512HDLU
1727 Points +16%
Asus ZenBook S13 OLED UX5304
Iris Xe G7 96EUs, i7-1355U, Samsung PM9A1 MZVL21T0HCLR
1696 Points +14%
Average Qualcomm Snapdragon X Elite X1E-80-100, Qualcomm SD X Adreno X1-85 3.8 TFLOPS
  (1492 - 1537, n=5)
1513 Points +1%
Microsoft Surface Laptop 7 13.8 Copilot+
Adreno X1-85 3.8 TFLOPS, SD X Elite X1E-80-100, Samsung MZ9L4512HBLU-00BMV
1497 Points 0%
Dell XPS 13 9345
Adreno X1-85 3.8 TFLOPS, SD X Elite X1E-80-100
1492 Points
HP EliteBook Ultra G1q 14
Adreno X1-85 3.8 TFLOPS, SD X Elite X1E-78-100, SK hynix PC801 HFS512GEJ9X101N BF
1102 Points -26%
CrossMark / Responsiveness
Dell XPS 13 9340 Core Ultra 7
Arc 8-Core, Ultra 7 155H, Micron 2550 512GB
1397 Points +13%
Asus ZenBook S13 OLED UX5304
Iris Xe G7 96EUs, i7-1355U, Samsung PM9A1 MZVL21T0HCLR
1386 Points +12%
Microsoft Surface Laptop 7 13.8 Copilot+
Adreno X1-85 3.8 TFLOPS, SD X Elite X1E-80-100, Samsung MZ9L4512HBLU-00BMV
1338 Points +8%
Average Qualcomm Snapdragon X Elite X1E-80-100, Qualcomm SD X Adreno X1-85 3.8 TFLOPS
  (1237 - 1401, n=5)
1305 Points +5%
Lenovo ThinkBook 13x G4 21KR0008GE
Arc 7-Core, Ultra 5 125H, Samsung PM9C1a MZAL8512HDLU
1270 Points +3%
Dell XPS 13 9345
Adreno X1-85 3.8 TFLOPS, SD X Elite X1E-80-100
1238 Points
HP EliteBook Ultra G1q 14
Adreno X1-85 3.8 TFLOPS, SD X Elite X1E-78-100, SK hynix PC801 HFS512GEJ9X101N BF
958 Points -23%
WebXPRT 3 / Overall
Average Qualcomm Snapdragon X Elite X1E-80-100, Qualcomm SD X Adreno X1-85 3.8 TFLOPS
  (430 - 455, n=5)
442 Points +3%
Microsoft Surface Laptop 7 13.8 Copilot+
Adreno X1-85 3.8 TFLOPS, SD X Elite X1E-80-100, Samsung MZ9L4512HBLU-00BMV
434 Points +1%
Dell XPS 13 9345
Adreno X1-85 3.8 TFLOPS, SD X Elite X1E-80-100
430 Points
HP EliteBook Ultra G1q 14
Adreno X1-85 3.8 TFLOPS, SD X Elite X1E-78-100, SK hynix PC801 HFS512GEJ9X101N BF
395 Points -8%
Asus ZenBook S13 OLED UX5304
Iris Xe G7 96EUs, i7-1355U, Samsung PM9A1 MZVL21T0HCLR
291 Points -32%
Dell XPS 13 9340 Core Ultra 7
Arc 8-Core, Ultra 7 155H, Micron 2550 512GB
272 Points -37%
Lenovo ThinkBook 13x G4 21KR0008GE
Arc 7-Core, Ultra 5 125H, Samsung PM9C1a MZAL8512HDLU
250 Points -42%
WebXPRT 4 / Overall
Dell XPS 13 9345
Adreno X1-85 3.8 TFLOPS, SD X Elite X1E-80-100
324 Points
Average Qualcomm Snapdragon X Elite X1E-80-100, Qualcomm SD X Adreno X1-85 3.8 TFLOPS
  (295 - 324, n=5)
310 Points -4%
Microsoft Surface Laptop 7 13.8 Copilot+
Adreno X1-85 3.8 TFLOPS, SD X Elite X1E-80-100, Samsung MZ9L4512HBLU-00BMV
309 Points -5%
HP EliteBook Ultra G1q 14
Adreno X1-85 3.8 TFLOPS, SD X Elite X1E-78-100, SK hynix PC801 HFS512GEJ9X101N BF
286 Points -12%
Dell XPS 13 9340 Core Ultra 7
Arc 8-Core, Ultra 7 155H, Micron 2550 512GB
257 Points -21%
Asus ZenBook S13 OLED UX5304
Iris Xe G7 96EUs, i7-1355U, Samsung PM9A1 MZVL21T0HCLR
252 Points -22%
Lenovo ThinkBook 13x G4 21KR0008GE
Arc 7-Core, Ultra 5 125H, Samsung PM9C1a MZAL8512HDLU
240 Points -26%
Mozilla Kraken 1.1 / Total
Lenovo ThinkBook 13x G4 21KR0008GE
Arc 7-Core, Ultra 5 125H, Samsung PM9C1a MZAL8512HDLU
560 ms * -36%
Dell XPS 13 9340 Core Ultra 7
Arc 8-Core, Ultra 7 155H, Micron 2550 512GB
528 ms * -28%
Asus ZenBook S13 OLED UX5304
Iris Xe G7 96EUs, i7-1355U, Samsung PM9A1 MZVL21T0HCLR
515 ms * -25%
HP EliteBook Ultra G1q 14
Adreno X1-85 3.8 TFLOPS, SD X Elite X1E-78-100, SK hynix PC801 HFS512GEJ9X101N BF
459.8 ms * -11%
Dell XPS 13 9345
Adreno X1-85 3.8 TFLOPS, SD X Elite X1E-80-100
412.4 ms *
Average Qualcomm Snapdragon X Elite X1E-80-100, Qualcomm SD X Adreno X1-85 3.8 TFLOPS
  (391 - 422, n=5)
406 ms * +2%
Microsoft Surface Laptop 7 13.8 Copilot+
Adreno X1-85 3.8 TFLOPS, SD X Elite X1E-80-100, Samsung MZ9L4512HBLU-00BMV
390.9 ms * +5%

* ... smaller is better

AIDA64 / Memory Copy
Dell XPS 13 9340 Core Ultra 7
Intel Core Ultra 7 155H, Arc 8-Core
96791 MB/s +54%
Lenovo ThinkBook 13x G4 21KR0008GE
Intel Core Ultra 5 125H, Arc 7-Core
87473 MB/s +40%
Dell XPS 13 9345
Qualcomm Snapdragon X Elite X1E-80-100, Adreno X1-85 3.8 TFLOPS
62684 MB/s
Microsoft Surface Laptop 7 13.8 Copilot+
Qualcomm Snapdragon X Elite X1E-80-100, Adreno X1-85 3.8 TFLOPS
62380 MB/s 0%
Asus ZenBook S13 OLED UX5304
Intel Core i7-1355U, Iris Xe G7 96EUs
59942 MB/s -4%
Average Qualcomm Snapdragon X Elite X1E-80-100
  (44795 - 63495, n=5)
59272 MB/s -5%
HP EliteBook Ultra G1q 14
Qualcomm Snapdragon X Elite X1E-78-100, Adreno X1-85 3.8 TFLOPS
45988 MB/s -27%
AIDA64 / Memory Read
Dell XPS 13 9345
Qualcomm Snapdragon X Elite X1E-80-100, Adreno X1-85 3.8 TFLOPS
118956 MB/s
Microsoft Surface Laptop 7 13.8 Copilot+
Qualcomm Snapdragon X Elite X1E-80-100, Adreno X1-85 3.8 TFLOPS
118043 MB/s -1%
Average Qualcomm Snapdragon X Elite X1E-80-100
  (58855 - 125604, n=5)
108255 MB/s -9%
Dell XPS 13 9340 Core Ultra 7
Intel Core Ultra 7 155H, Arc 8-Core
84022 MB/s -29%
Lenovo ThinkBook 13x G4 21KR0008GE
Intel Core Ultra 5 125H, Arc 7-Core
76803 MB/s -35%
HP EliteBook Ultra G1q 14
Qualcomm Snapdragon X Elite X1E-78-100, Adreno X1-85 3.8 TFLOPS
60078 MB/s -49%
Asus ZenBook S13 OLED UX5304
Intel Core i7-1355U, Iris Xe G7 96EUs
49758 MB/s -58%
AIDA64 / Memory Write
Dell XPS 13 9340 Core Ultra 7
Intel Core Ultra 7 155H, Arc 8-Core
75665 MB/s +70%
Asus ZenBook S13 OLED UX5304
Intel Core i7-1355U, Iris Xe G7 96EUs
72418 MB/s +62%
Lenovo ThinkBook 13x G4 21KR0008GE
Intel Core Ultra 5 125H, Arc 7-Core
69575 MB/s +56%
Dell XPS 13 9345
Qualcomm Snapdragon X Elite X1E-80-100, Adreno X1-85 3.8 TFLOPS
44638 MB/s
Microsoft Surface Laptop 7 13.8 Copilot+
Qualcomm Snapdragon X Elite X1E-80-100, Adreno X1-85 3.8 TFLOPS
43959 MB/s -2%
Average Qualcomm Snapdragon X Elite X1E-80-100
  (37270 - 45265, n=5)
43175 MB/s -3%
HP EliteBook Ultra G1q 14
Qualcomm Snapdragon X Elite X1E-78-100, Adreno X1-85 3.8 TFLOPS
37763 MB/s -15%
AIDA64 / Memory Latency
Lenovo ThinkBook 13x G4 21KR0008GE
Intel Core Ultra 5 125H, Arc 7-Core
133.4 ns * -1655%
Dell XPS 13 9340 Core Ultra 7
Intel Core Ultra 7 155H, Arc 8-Core
131.8 ns * -1634%
Asus ZenBook S13 OLED UX5304
Intel Core i7-1355U, Iris Xe G7 96EUs
90.1 ns * -1086%
Average Qualcomm Snapdragon X Elite X1E-80-100
  (7.4 - 8.8, n=5)
7.9 ns * -4%
HP EliteBook Ultra G1q 14
Qualcomm Snapdragon X Elite X1E-78-100, Adreno X1-85 3.8 TFLOPS
7.8 ns * -3%
Dell XPS 13 9345
Qualcomm Snapdragon X Elite X1E-80-100, Adreno X1-85 3.8 TFLOPS
7.6 ns *
Microsoft Surface Laptop 7 13.8 Copilot+
Qualcomm Snapdragon X Elite X1E-80-100, Adreno X1-85 3.8 TFLOPS
7.4 ns * +3%

* ... smaller is better

Lagringsenheter

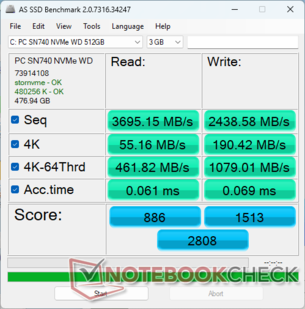
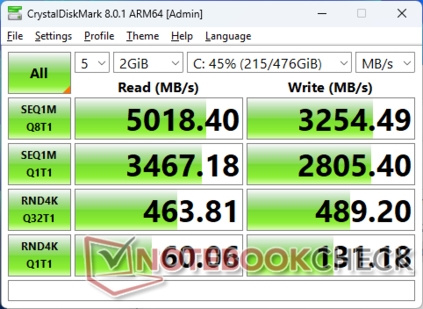
Dell köper sina SSD-enheter från en mängd olika tillverkare och det är därför svårt att veta vilken enhet du får innan du köper den. Vi har till exempel haft enheter från Micron, Samsung, WD, Toshiba och SK Hynix i över 10 olika interna XPS 13-enheter. Vår specifika Qualcomm-enhet levereras med WD SN740 i mellanklassen som erbjuder stabila överföringshastigheter på upp till 5000 MB/s. Vi kan inte observera något strypningsbeteende trots den lilla längden på 42 mm, vilket troligen delvis beror på den medföljande SSD-värmespridaren.

AS SSD
AS SSD
CDM 8
CDM 8
Modellen stöder M.2-enheter med en längd på upp till 80 mm, även om den kan levereras med en kortare enhet
CDM 5/6 Read Seq Q32T1: 4978 MB/s
CDM 5/6 Write Seq Q32T1: 3875 MB/s
CDM 5/6 Read 4K Q32T1: 447.7 MB/s
CDM 5/6 Write 4K Q32T1: 480 MB/s
CDM 5 Read Seq: 3460 MB/s
CDM 5 Write Seq: 2792 MB/s
CDM 5/6 Read 4K: 61.73 MB/s
CDM 5/6 Write 4K: 130.4 MB/s
Drive Performance Rating - Percent
Asus ZenBook S13 OLED UX5304
Samsung PM9A1 MZVL21T0HCLR
84.9 pt
Dell XPS 13 9340 Core Ultra 7
Micron 2550 512GB
80.4 pt
Lenovo ThinkBook 13x G4 21KR0008GE
Samsung PM9C1a MZAL8512HDLU
80 pt
HP EliteBook Ultra G1q 14
SK hynix PC801 HFS512GEJ9X101N BF
76.2 pt
Dell XPS 13 9345
 
70.8 pt
Microsoft Surface Laptop 7 13.8 Copilot+
Samsung MZ9L4512HBLU-00BMV
67.3 pt
DiskSpd
seq read
HP EliteBook Ultra G1q 14
SK hynix PC801 HFS512GEJ9X101N BF
4035 (4021.63min - 4034.92max) MB/s +21%
Asus ZenBook S13 OLED UX5304
Samsung PM9A1 MZVL21T0HCLR
4001 (3943.69min - 4000.53max) MB/s +20%
Dell XPS 13 9345
 
3327 (3292.32min - 3326.71max) MB/s
Lenovo ThinkBook 13x G4 21KR0008GE
Samsung PM9C1a MZAL8512HDLU
2565 (1389.73min - 2564.61max) MB/s -23%
Dell XPS 13 9340 Core Ultra 7
Micron 2550 512GB
2507 (2473.59min - 2507.37max) MB/s -25%
Microsoft Surface Laptop 7 13.8 Copilot+
Samsung MZ9L4512HBLU-00BMV
2423 (2394.98min - 2422.63max) MB/s -27%
seq write
Asus ZenBook S13 OLED UX5304
Samsung PM9A1 MZVL21T0HCLR
3321 (3143.21min - 3321.26max) MB/s +7%
Dell XPS 13 9340 Core Ultra 7
Micron 2550 512GB
3250 (3033.11min - 3250.17max) MB/s +4%
Dell XPS 13 9345
 
3112 (2992.31min - 3112.17max) MB/s
Lenovo ThinkBook 13x G4 21KR0008GE
Samsung PM9C1a MZAL8512HDLU
2983 (2793.48min - 2982.57max) MB/s -4%
Microsoft Surface Laptop 7 13.8 Copilot+
Samsung MZ9L4512HBLU-00BMV
1965 (1920.09min - 1965.09max) MB/s -37%
HP EliteBook Ultra G1q 14
SK hynix PC801 HFS512GEJ9X101N BF
1000 (878.84min - 1000.02max) MB/s -68%
seq q8 t1 read
Asus ZenBook S13 OLED UX5304
Samsung PM9A1 MZVL21T0HCLR
7036 (6223.64min - 7035.55max) MB/s +38%
HP EliteBook Ultra G1q 14
SK hynix PC801 HFS512GEJ9X101N BF
6861 (3940.76min - 6860.95max) MB/s +35%
Lenovo ThinkBook 13x G4 21KR0008GE
Samsung PM9C1a MZAL8512HDLU
6068 (5239.11min - 6068.32max) MB/s +19%
Dell XPS 13 9345
 
5101 (4800.8min - 5101.19max) MB/s
Dell XPS 13 9340 Core Ultra 7
Micron 2550 512GB
4992 (4031.47min - 4991.51max) MB/s -2%
Microsoft Surface Laptop 7 13.8 Copilot+
Samsung MZ9L4512HBLU-00BMV
3592 (3041.29min - 3592.16max) MB/s -30%
seq q8 t1 write
Asus ZenBook S13 OLED UX5304
Samsung PM9A1 MZVL21T0HCLR
5179 (4831.64min - 5178.79max) MB/s +38%
HP EliteBook Ultra G1q 14
SK hynix PC801 HFS512GEJ9X101N BF
4940 (837.81min - 4939.63max) MB/s +32%
Lenovo ThinkBook 13x G4 21KR0008GE
Samsung PM9C1a MZAL8512HDLU
4715 (4689.23min - 4715.24max) MB/s +26%
Dell XPS 13 9340 Core Ultra 7
Micron 2550 512GB
4045 (3979.76min - 4045.08max) MB/s +8%
Dell XPS 13 9345
 
3746 (3722.97min - 3745.57max) MB/s
Microsoft Surface Laptop 7 13.8 Copilot+
Samsung MZ9L4512HBLU-00BMV
2432 (2397.46min - 2432.28max) MB/s -35%
4k q1 t1 read
Asus ZenBook S13 OLED UX5304
Samsung PM9A1 MZVL21T0HCLR
83.3 (77.84min - 83.26max) MB/s +18%
Dell XPS 13 9345
 
70.8 (66.07min - 70.78max) MB/s
Microsoft Surface Laptop 7 13.8 Copilot+
Samsung MZ9L4512HBLU-00BMV
64.9 (63.83min - 64.93max) MB/s -8%
Dell XPS 13 9340 Core Ultra 7
Micron 2550 512GB
63.6 (63.1min - 63.62max) MB/s -10%
Lenovo ThinkBook 13x G4 21KR0008GE
Samsung PM9C1a MZAL8512HDLU
63 (61.94min - 62.98max) MB/s -11%
HP EliteBook Ultra G1q 14
SK hynix PC801 HFS512GEJ9X101N BF
57.1 (56.27min - 57.06max) MB/s -19%
4k q1 t1 write
Dell XPS 13 9345
 
212 (146.41min - 212.44max) MB/s
Dell XPS 13 9340 Core Ultra 7
Micron 2550 512GB
143.5 (142.41min - 143.53max) MB/s -32%
Asus ZenBook S13 OLED UX5304
Samsung PM9A1 MZVL21T0HCLR
140.8 (131.23min - 140.77max) MB/s -34%
HP EliteBook Ultra G1q 14
SK hynix PC801 HFS512GEJ9X101N BF
126.9 (125.92min - 126.89max) MB/s -40%
Microsoft Surface Laptop 7 13.8 Copilot+
Samsung MZ9L4512HBLU-00BMV
125.5 (123.95min - 125.49max) MB/s -41%
Lenovo ThinkBook 13x G4 21KR0008GE
Samsung PM9C1a MZAL8512HDLU
119.2 (114.62min - 119.17max) MB/s -44%
4k q32 t16 read
Dell XPS 13 9345
 
1099 (1072.87min - 1098.5max) MB/s
Microsoft Surface Laptop 7 13.8 Copilot+
Samsung MZ9L4512HBLU-00BMV
1025 (993.39min - 1025.04max) MB/s -7%
HP EliteBook Ultra G1q 14
SK hynix PC801 HFS512GEJ9X101N BF
999 (972.11min - 999.13max) MB/s -9%
Lenovo ThinkBook 13x G4 21KR0008GE
Samsung PM9C1a MZAL8512HDLU
703 (627.88min - 703.14max) MB/s -36%
Dell XPS 13 9340 Core Ultra 7
Micron 2550 512GB
551 (537.25min - 551.44max) MB/s -50%
Asus ZenBook S13 OLED UX5304
Samsung PM9A1 MZVL21T0HCLR
494 (392.19min - 494.04max) MB/s -55%
4k q32 t16 write
Dell XPS 13 9345
 
698 (665.78min - 697.53max) MB/s
Microsoft Surface Laptop 7 13.8 Copilot+
Samsung MZ9L4512HBLU-00BMV
631 (620.68min - 630.94max) MB/s -10%
HP EliteBook Ultra G1q 14
SK hynix PC801 HFS512GEJ9X101N BF
626 (611.56min - 626.31max) MB/s -10%
Lenovo ThinkBook 13x G4 21KR0008GE
Samsung PM9C1a MZAL8512HDLU
397 (338.3min - 396.83max) MB/s -43%
Dell XPS 13 9340 Core Ultra 7
Micron 2550 512GB
382 (370.53min - 381.81max) MB/s -45%
Asus ZenBook S13 OLED UX5304
Samsung PM9A1 MZVL21T0HCLR
372 (323.75min - 372.35max) MB/s -47%
AS SSD
Score Total
Dell XPS 13 9340 Core Ultra 7
Micron 2550 512GB
4347 Points +55%
Lenovo ThinkBook 13x G4 21KR0008GE
Samsung PM9C1a MZAL8512HDLU
4180 Points +49%
Asus ZenBook S13 OLED UX5304
Samsung PM9A1 MZVL21T0HCLR
4048 Points +44%
HP EliteBook Ultra G1q 14
SK hynix PC801 HFS512GEJ9X101N BF
3686 Points +31%
Microsoft Surface Laptop 7 13.8 Copilot+
Samsung MZ9L4512HBLU-00BMV
3044 Points +8%
Dell XPS 13 9345
 
2808 Points
Score Read
Lenovo ThinkBook 13x G4 21KR0008GE
Samsung PM9C1a MZAL8512HDLU
1211 Points +37%
Dell XPS 13 9340 Core Ultra 7
Micron 2550 512GB
1149 Points +30%
Asus ZenBook S13 OLED UX5304
Samsung PM9A1 MZVL21T0HCLR
1040 Points +17%
HP EliteBook Ultra G1q 14
SK hynix PC801 HFS512GEJ9X101N BF
986 Points +11%
Dell XPS 13 9345
 
886 Points
Microsoft Surface Laptop 7 13.8 Copilot+
Samsung MZ9L4512HBLU-00BMV
791 Points -11%
Score Write
Dell XPS 13 9340 Core Ultra 7
Micron 2550 512GB
2661 Points +76%
Asus ZenBook S13 OLED UX5304
Samsung PM9A1 MZVL21T0HCLR
2568 Points +70%
Lenovo ThinkBook 13x G4 21KR0008GE
Samsung PM9C1a MZAL8512HDLU
2426 Points +60%
HP EliteBook Ultra G1q 14
SK hynix PC801 HFS512GEJ9X101N BF
2301 Points +52%
Microsoft Surface Laptop 7 13.8 Copilot+
Samsung MZ9L4512HBLU-00BMV
1875 Points +24%
Dell XPS 13 9345
 
1513 Points
Seq Read
Asus ZenBook S13 OLED UX5304
Samsung PM9A1 MZVL21T0HCLR
5107 MB/s +38%
HP EliteBook Ultra G1q 14
SK hynix PC801 HFS512GEJ9X101N BF
4857.17 MB/s +31%
Lenovo ThinkBook 13x G4 21KR0008GE
Samsung PM9C1a MZAL8512HDLU
4488 MB/s +21%
Dell XPS 13 9340 Core Ultra 7
Micron 2550 512GB
3952 MB/s +7%
Dell XPS 13 9345
 
3695.15 MB/s
Microsoft Surface Laptop 7 13.8 Copilot+
Samsung MZ9L4512HBLU-00BMV
2805 MB/s -24%
Seq Write
Asus ZenBook S13 OLED UX5304
Samsung PM9A1 MZVL21T0HCLR
2849 MB/s +17%
Lenovo ThinkBook 13x G4 21KR0008GE
Samsung PM9C1a MZAL8512HDLU
2595 MB/s +6%
Dell XPS 13 9340 Core Ultra 7
Micron 2550 512GB
2570 MB/s +5%
Dell XPS 13 9345
 
2438.58 MB/s
HP EliteBook Ultra G1q 14
SK hynix PC801 HFS512GEJ9X101N BF
2412.89 MB/s -1%
Microsoft Surface Laptop 7 13.8 Copilot+
Samsung MZ9L4512HBLU-00BMV
1865 MB/s -24%
4K Read
Lenovo ThinkBook 13x G4 21KR0008GE
Samsung PM9C1a MZAL8512HDLU
65.3 MB/s +18%
Asus ZenBook S13 OLED UX5304
Samsung PM9A1 MZVL21T0HCLR
64.1 MB/s +16%
Dell XPS 13 9340 Core Ultra 7
Micron 2550 512GB
63.6 MB/s +15%
Microsoft Surface Laptop 7 13.8 Copilot+
Samsung MZ9L4512HBLU-00BMV
58.7 MB/s +6%
Dell XPS 13 9345
 
55.16 MB/s
HP EliteBook Ultra G1q 14
SK hynix PC801 HFS512GEJ9X101N BF
54.78 MB/s -1%
4K Write
HP EliteBook Ultra G1q 14
SK hynix PC801 HFS512GEJ9X101N BF
216.83 MB/s +14%
Dell XPS 13 9340 Core Ultra 7
Micron 2550 512GB
201 MB/s +6%
Microsoft Surface Laptop 7 13.8 Copilot+
Samsung MZ9L4512HBLU-00BMV
198.9 MB/s +4%
Asus ZenBook S13 OLED UX5304
Samsung PM9A1 MZVL21T0HCLR
198.7 MB/s +4%
Dell XPS 13 9345
 
190.42 MB/s
Lenovo ThinkBook 13x G4 21KR0008GE
Samsung PM9C1a MZAL8512HDLU
156.9 MB/s -18%
4K-64 Read
Lenovo ThinkBook 13x G4 21KR0008GE
Samsung PM9C1a MZAL8512HDLU
697 MB/s +51%
Dell XPS 13 9340 Core Ultra 7
Micron 2550 512GB
690 MB/s +49%
Asus ZenBook S13 OLED UX5304
Samsung PM9A1 MZVL21T0HCLR
466 MB/s +1%
Dell XPS 13 9345
 
461.82 MB/s
Microsoft Surface Laptop 7 13.8 Copilot+
Samsung MZ9L4512HBLU-00BMV
452 MB/s -2%
HP EliteBook Ultra G1q 14
SK hynix PC801 HFS512GEJ9X101N BF
445.94 MB/s -3%
4K-64 Write
Dell XPS 13 9340 Core Ultra 7
Micron 2550 512GB
2203 MB/s +104%
Asus ZenBook S13 OLED UX5304
Samsung PM9A1 MZVL21T0HCLR
2084 MB/s +93%
Lenovo ThinkBook 13x G4 21KR0008GE
Samsung PM9C1a MZAL8512HDLU
2010 MB/s +86%
HP EliteBook Ultra G1q 14
SK hynix PC801 HFS512GEJ9X101N BF
1843.14 MB/s +71%
Microsoft Surface Laptop 7 13.8 Copilot+
Samsung MZ9L4512HBLU-00BMV
1489 MB/s +38%
Dell XPS 13 9345
 
1079.01 MB/s
Access Time Read
Dell XPS 13 9345
 
0.061 ms *
HP EliteBook Ultra G1q 14
SK hynix PC801 HFS512GEJ9X101N BF
0.044 ms * +28%
Lenovo ThinkBook 13x G4 21KR0008GE
Samsung PM9C1a MZAL8512HDLU
0.036 ms * +41%
Dell XPS 13 9340 Core Ultra 7
Micron 2550 512GB
0.032 ms * +48%
Microsoft Surface Laptop 7 13.8 Copilot+
Samsung MZ9L4512HBLU-00BMV
0.031 ms * +49%
Asus ZenBook S13 OLED UX5304
Samsung PM9A1 MZVL21T0HCLR
0.025 ms * +59%
Access Time Write
Dell XPS 13 9345
 
0.069 ms *
HP EliteBook Ultra G1q 14
SK hynix PC801 HFS512GEJ9X101N BF
0.053 ms * +23%
Microsoft Surface Laptop 7 13.8 Copilot+
Samsung MZ9L4512HBLU-00BMV
0.033 ms * +52%
Asus ZenBook S13 OLED UX5304
Samsung PM9A1 MZVL21T0HCLR
0.025 ms * +64%
Lenovo ThinkBook 13x G4 21KR0008GE
Samsung PM9C1a MZAL8512HDLU
0.023 ms * +67%
Dell XPS 13 9340 Core Ultra 7
Micron 2550 512GB
0.02 ms * +71%

* ... smaller is better

Disk Throttling: DiskSpd Read Loop, Queue Depth 8

02605207801040130015601820208023402600286031203380364039004160442046804940Tooltip
Dell XPS 13 9345  ; diskspd 2.0.17 f: Ø5089 (4590.46-5102.16)
Dell XPS 13 9340 Core Ultra 7 Micron 2550 512GB; diskspd 2.0.17 f: Ø4801 (3765.46-4966.19)

GPU-prestanda

Grafikprestanda enligt emulerad 3DMark är i nivå med Iris Xe 96 EUs men långt efter Arc 8 eller Radeon 680M/780M-serien med upp till 20 till 40 procent. Resultaten är dock genomgående bättre än HP EliteBook Ultra G1q 14 även om skillnaderna i genomsnitt är små.

KraftprofilGrafikpoängFysikpoängKombinerad poäng
Prestanda-läge6283173182611
Balanserat läge6209183482643
Batterikraft6287181562687

Det sker ingen betydande försämring av prestandan när man växlar mellan lägena Performance, Balanced eller Battery Power, vilket framgår av resultattabellen Fire Strike ovan.

3DMark 11
3DMark 11
Cloud Gate
Cloud Gate
Fire Strike
Fire Strike
Time Spy
Time Spy
3DMark Performance Rating - Percent
Dell XPS 14 2024 OLED -1!
NVIDIA GeForce RTX 4050 Laptop GPU, Intel Core Ultra 7 155H
100 pt
Dell XPS 13 9340 Core Ultra 7 -1!
Intel Arc 8-Core iGPU, Intel Core Ultra 7 155H
63.2 pt
Dell XPS 13 9345
Qualcomm SD X Adreno X1-85 3.8 TFLOPS, Qualcomm Snapdragon X Elite X1E-80-100
52.5 pt
Average Qualcomm SD X Adreno X1-85 3.8 TFLOPS
 
47.7 pt
Dell XPS 13 Plus 9320 i7-1280P OLED
Intel Iris Xe Graphics G7 96EUs, Intel Core i7-1280P
45.1 pt
Dell XPS 13 9310 2-in-1
Intel Iris Xe Graphics G7 96EUs, Intel Core i7-1165G7
44.2 pt
HP EliteBook Ultra G1q 14
Qualcomm SD X Adreno X1-85 3.8 TFLOPS, Qualcomm Snapdragon X Elite X1E-78-100
42.9 pt
Dell XPS 13 Plus 9320 4K
Intel Iris Xe Graphics G7 96EUs, Intel Core i7-1260P
42.1 pt
Dell XPS 13 9310 Core i7 4K
Intel Iris Xe Graphics G7 96EUs, Intel Core i7-1185G7
42.1 pt
Dell XPS 13 Plus 9320 Core i7-1360P -1!
Intel Iris Xe Graphics G7 96EUs, Intel Core i7-1360P
41.9 pt
Medion SPRCHRGD 14 S1 Elite -1!
Qualcomm SD X Adreno X1-85 3.8 TFLOPS, Qualcomm Snapdragon X Elite X1E-78-100
41.4 pt
Dell XPS 13 9310 OLED
Intel Iris Xe Graphics G7 96EUs, Intel Core i7-1185G7
40.8 pt
Microsoft Surface Laptop 7 13.8 Copilot+ -1!
Qualcomm SD X Adreno X1-85 3.8 TFLOPS, Qualcomm Snapdragon X Elite X1E-80-100
39.7 pt
Lenovo ThinkPad T14s Gen 6 21N10007GE -2!
Qualcomm SD X Adreno X1-85 3.8 TFLOPS, Qualcomm Snapdragon X Elite X1E-78-100
38.9 pt
Dell XPS 13 9305 Core i5 FHD -1!
Intel Iris Xe Graphics G7 80EUs, Intel Core i5-1135G7
33.4 pt
Dell XPS 13 Plus 9320 i5-1240p
Intel Iris Xe Graphics G7 80EUs, Intel Core i5-1240P
30.4 pt
Dell XPS 13 9315, i5-1230U
Intel Iris Xe Graphics G7 80EUs, Intel Core i5-1230U
28 pt
Dell XPS 13 9315 2-in-1 Core i5-1230U
Intel Iris Xe Graphics G7 80EUs, Intel Core i5-1230U
27.3 pt
3DMark 11 - 1280x720 Performance GPU
Dell XPS 14 2024 OLED
NVIDIA GeForce RTX 4050 Laptop GPU, Intel Core Ultra 7 155H
13339 Points +109%
Dell XPS 13 9340 Core Ultra 7
Intel Arc 8-Core iGPU, Intel Core Ultra 7 155H
10624 Points +67%
Dell XPS 13 Plus 9320 i7-1280P OLED
Intel Iris Xe Graphics G7 96EUs, Intel Core i7-1280P
7016 Points +10%
Dell XPS 13 Plus 9320 4K
Intel Iris Xe Graphics G7 96EUs, Intel Core i7-1260P
6956 Points +9%
Dell XPS 13 Plus 9320 Core i7-1360P
Intel Iris Xe Graphics G7 96EUs, Intel Core i7-1360P
6815 Points +7%
Dell XPS 13 9310 OLED
Intel Iris Xe Graphics G7 96EUs, Intel Core i7-1185G7
6647 Points +4%
Dell XPS 13 9310 2-in-1
Intel Iris Xe Graphics G7 96EUs, Intel Core i7-1165G7
6569 Points +3%
Medion SPRCHRGD 14 S1 Elite
Qualcomm SD X Adreno X1-85 3.8 TFLOPS, Qualcomm Snapdragon X Elite X1E-78-100
6459 Points +1%
Dell XPS 13 9345
Qualcomm SD X Adreno X1-85 3.8 TFLOPS, Qualcomm Snapdragon X Elite X1E-80-100
6368 Points
Microsoft Surface Laptop 7 13.8 Copilot+
Qualcomm SD X Adreno X1-85 3.8 TFLOPS, Qualcomm Snapdragon X Elite X1E-80-100
6340 Points 0%
Dell XPS 13 9305 Core i5 FHD
Intel Iris Xe Graphics G7 80EUs, Intel Core i5-1135G7
5978 Points -6%
Average Qualcomm SD X Adreno X1-85 3.8 TFLOPS
  (3163 - 6515, n=11)
5850 Points -8%
Dell XPS 13 9310 Core i7 4K
Intel Iris Xe Graphics G7 96EUs, Intel Core i7-1185G7
5339 Points -16%
Dell XPS 13 Plus 9320 i5-1240p
Intel Iris Xe Graphics G7 80EUs, Intel Core i5-1240P
5104 Points -20%
HP EliteBook Ultra G1q 14
Qualcomm SD X Adreno X1-85 3.8 TFLOPS, Qualcomm Snapdragon X Elite X1E-78-100
4823 Points -24%
Dell XPS 13 9315, i5-1230U
Intel Iris Xe Graphics G7 80EUs, Intel Core i5-1230U
3847 Points -40%
Dell XPS 13 9315 2-in-1 Core i5-1230U
Intel Iris Xe Graphics G7 80EUs, Intel Core i5-1230U
3844 Points -40%
3DMark
1280x720 Cloud Gate Standard Graphics
Dell XPS 13 9345
Qualcomm SD X Adreno X1-85 3.8 TFLOPS, Qualcomm Snapdragon X Elite X1E-80-100
40436 Points
Average Qualcomm SD X Adreno X1-85 3.8 TFLOPS
  (29343 - 40436, n=2)
34890 Points -14%
HP EliteBook Ultra G1q 14
Qualcomm SD X Adreno X1-85 3.8 TFLOPS, Qualcomm Snapdragon X Elite X1E-78-100
29343 Points -27%
Dell XPS 13 9310 2-in-1
Intel Iris Xe Graphics G7 96EUs, Intel Core i7-1165G7
27967 Points -31%
Dell XPS 13 9310 Core i7 4K
Intel Iris Xe Graphics G7 96EUs, Intel Core i7-1185G7
26820 Points -34%
Dell XPS 13 Plus 9320 i7-1280P OLED
Intel Iris Xe Graphics G7 96EUs, Intel Core i7-1280P
25076 Points -38%
Dell XPS 13 9310 OLED
Intel Iris Xe Graphics G7 96EUs, Intel Core i7-1185G7
24591 Points -39%
Dell XPS 13 9315, i5-1230U
Intel Iris Xe Graphics G7 80EUs, Intel Core i5-1230U
19854 Points -51%
Dell XPS 13 Plus 9320 4K
Intel Iris Xe Graphics G7 96EUs, Intel Core i7-1260P
19215 Points -52%
Dell XPS 13 9315 2-in-1 Core i5-1230U
Intel Iris Xe Graphics G7 80EUs, Intel Core i5-1230U
18566 Points -54%
Dell XPS 13 Plus 9320 i5-1240p
Intel Iris Xe Graphics G7 80EUs, Intel Core i5-1240P
15200 Points -62%
1920x1080 Fire Strike Graphics
Dell XPS 14 2024 OLED
NVIDIA GeForce RTX 4050 Laptop GPU, Intel Core Ultra 7 155H
13591 Points +116%
Dell XPS 13 9340 Core Ultra 7
Intel Arc 8-Core iGPU, Intel Core Ultra 7 155H
7946 Points +26%
Medion SPRCHRGD 14 S1 Elite
Qualcomm SD X Adreno X1-85 3.8 TFLOPS, Qualcomm Snapdragon X Elite X1E-78-100
6454 Points +3%
Lenovo ThinkPad T14s Gen 6 21N10007GE
Qualcomm SD X Adreno X1-85 3.8 TFLOPS, Qualcomm Snapdragon X Elite X1E-78-100
6345 Points +1%
Dell XPS 13 9345
Qualcomm SD X Adreno X1-85 3.8 TFLOPS, Qualcomm Snapdragon X Elite X1E-80-100
6283 Points
Dell XPS 13 Plus 9320 Core i7-1360P
Intel Iris Xe Graphics G7 96EUs, Intel Core i7-1360P
5981 Points -5%
Microsoft Surface Laptop 7 13.8 Copilot+
Qualcomm SD X Adreno X1-85 3.8 TFLOPS, Qualcomm Snapdragon X Elite X1E-80-100
5953 Points -5%
Average Qualcomm SD X Adreno X1-85 3.8 TFLOPS
  (3239 - 6454, n=12)
5926 Points -6%
HP EliteBook Ultra G1q 14
Qualcomm SD X Adreno X1-85 3.8 TFLOPS, Qualcomm Snapdragon X Elite X1E-78-100
5569 Points -11%
Dell XPS 13 9310 Core i7 4K
Intel Iris Xe Graphics G7 96EUs, Intel Core i7-1185G7
5498 Points -12%
Dell XPS 13 Plus 9320 4K
Intel Iris Xe Graphics G7 96EUs, Intel Core i7-1260P
5421 Points -14%
Dell XPS 13 Plus 9320 i7-1280P OLED
Intel Iris Xe Graphics G7 96EUs, Intel Core i7-1280P
5393 Points -14%
Dell XPS 13 9310 2-in-1
Intel Iris Xe Graphics G7 96EUs, Intel Core i7-1165G7
5208 Points -17%
Dell XPS 13 9310 OLED
Intel Iris Xe Graphics G7 96EUs, Intel Core i7-1185G7
5191 Points -17%
Dell XPS 13 9305 Core i5 FHD
Intel Iris Xe Graphics G7 80EUs, Intel Core i5-1135G7
4705 Points -25%
Dell XPS 13 Plus 9320 i5-1240p
Intel Iris Xe Graphics G7 80EUs, Intel Core i5-1240P
4086 Points -35%
Dell XPS 13 9315, i5-1230U
Intel Iris Xe Graphics G7 80EUs, Intel Core i5-1230U
3247 Points -48%
Dell XPS 13 9315 2-in-1 Core i5-1230U
Intel Iris Xe Graphics G7 80EUs, Intel Core i5-1230U
3227 Points -49%
2560x1440 Time Spy Graphics
Dell XPS 14 2024 OLED
NVIDIA GeForce RTX 4050 Laptop GPU, Intel Core Ultra 7 155H
5107 Points +198%
Dell XPS 13 9340 Core Ultra 7
Intel Arc 8-Core iGPU, Intel Core Ultra 7 155H
2911 Points +70%
Dell XPS 13 Plus 9320 Core i7-1360P
Intel Iris Xe Graphics G7 96EUs, Intel Core i7-1360P
1791 Points +5%
Dell XPS 13 Plus 9320 i7-1280P OLED
Intel Iris Xe Graphics G7 96EUs, Intel Core i7-1280P
1760 Points +3%
Dell XPS 13 Plus 9320 4K
Intel Iris Xe Graphics G7 96EUs, Intel Core i7-1260P
1758 Points +3%
Lenovo ThinkPad T14s Gen 6 21N10007GE
Qualcomm SD X Adreno X1-85 3.8 TFLOPS, Qualcomm Snapdragon X Elite X1E-78-100
1739 Points +2%
Medion SPRCHRGD 14 S1 Elite
Qualcomm SD X Adreno X1-85 3.8 TFLOPS, Qualcomm Snapdragon X Elite X1E-78-100
1731 Points +1%
Dell XPS 13 9345
Qualcomm SD X Adreno X1-85 3.8 TFLOPS, Qualcomm Snapdragon X Elite X1E-80-100
1712 Points
Microsoft Surface Laptop 7 13.8 Copilot+
Qualcomm SD X Adreno X1-85 3.8 TFLOPS, Qualcomm Snapdragon X Elite X1E-80-100
1678 Points -2%
HP EliteBook Ultra G1q 14
Qualcomm SD X Adreno X1-85 3.8 TFLOPS, Qualcomm Snapdragon X Elite X1E-78-100
1617 Points -6%
Average Qualcomm SD X Adreno X1-85 3.8 TFLOPS
  (804 - 1739, n=12)
1616 Points -6%
Dell XPS 13 9310 Core i7 4K
Intel Iris Xe Graphics G7 96EUs, Intel Core i7-1185G7
1603 Points -6%
Dell XPS 13 9310 2-in-1
Intel Iris Xe Graphics G7 96EUs, Intel Core i7-1165G7
1596 Points -7%
Dell XPS 13 9310 OLED
Intel Iris Xe Graphics G7 96EUs, Intel Core i7-1185G7
1382 Points -19%
Dell XPS 13 9305 Core i5 FHD
Intel Iris Xe Graphics G7 80EUs, Intel Core i5-1135G7
1351 Points -21%
Dell XPS 13 Plus 9320 i5-1240p
Intel Iris Xe Graphics G7 80EUs, Intel Core i5-1240P
1134 Points -34%
Dell XPS 13 9315, i5-1230U
Intel Iris Xe Graphics G7 80EUs, Intel Core i5-1230U
945 Points -45%
Dell XPS 13 9315 2-in-1 Core i5-1230U
Intel Iris Xe Graphics G7 80EUs, Intel Core i5-1230U
936 Points -45%
2560x1440 Time Spy Score
Dell XPS 14 2024 OLED
NVIDIA GeForce RTX 4050 Laptop GPU, Intel Core Ultra 7 155H
5395 Points +184%
Dell XPS 13 9340 Core Ultra 7
Intel Arc 8-Core iGPU, Intel Core Ultra 7 155H
3106 Points +63%
Dell XPS 13 Plus 9320 Core i7-1360P
Intel Iris Xe Graphics G7 96EUs, Intel Core i7-1360P
2021 Points +6%
Dell XPS 13 Plus 9320 i7-1280P OLED
Intel Iris Xe Graphics G7 96EUs, Intel Core i7-1280P
1986 Points +5%
Dell XPS 13 Plus 9320 4K
Intel Iris Xe Graphics G7 96EUs, Intel Core i7-1260P
1974 Points +4%
Lenovo ThinkPad T14s Gen 6 21N10007GE
Qualcomm SD X Adreno X1-85 3.8 TFLOPS, Qualcomm Snapdragon X Elite X1E-78-100
1934 Points +2%
Medion SPRCHRGD 14 S1 Elite
Qualcomm SD X Adreno X1-85 3.8 TFLOPS, Qualcomm Snapdragon X Elite X1E-78-100
1924 Points +1%
Dell XPS 13 9345
Qualcomm SD X Adreno X1-85 3.8 TFLOPS, Qualcomm Snapdragon X Elite X1E-80-100
1900 Points
Microsoft Surface Laptop 7 13.8 Copilot+
Qualcomm SD X Adreno X1-85 3.8 TFLOPS, Qualcomm Snapdragon X Elite X1E-80-100
1868 Points -2%
HP EliteBook Ultra G1q 14
Qualcomm SD X Adreno X1-85 3.8 TFLOPS, Qualcomm Snapdragon X Elite X1E-78-100
1799 Points -5%
Average Qualcomm SD X Adreno X1-85 3.8 TFLOPS
  (899 - 1934, n=12)
1793 Points -6%
Dell XPS 13 9310 2-in-1
Intel Iris Xe Graphics G7 96EUs, Intel Core i7-1165G7
1778 Points -6%
Dell XPS 13 9310 Core i7 4K
Intel Iris Xe Graphics G7 96EUs, Intel Core i7-1185G7
1749 Points -8%
Dell XPS 13 9310 OLED
Intel Iris Xe Graphics G7 96EUs, Intel Core i7-1185G7
1526 Points -20%
Dell XPS 13 9305 Core i5 FHD
Intel Iris Xe Graphics G7 80EUs, Intel Core i5-1135G7
1490 Points -22%
Dell XPS 13 Plus 9320 i5-1240p
Intel Iris Xe Graphics G7 80EUs, Intel Core i5-1240P
1290 Points -32%
Dell XPS 13 9315 2-in-1 Core i5-1230U
Intel Iris Xe Graphics G7 80EUs, Intel Core i5-1230U
1055 Points -44%
Dell XPS 13 9315, i5-1230U
Intel Iris Xe Graphics G7 80EUs, Intel Core i5-1230U
1053 Points -45%
3DMark 11 Performance
6884 poäng
3DMark Cloud Gate Standard Score
24813 poäng
3DMark Fire Strike Score
6012 poäng
3DMark Time Spy Score
1900 poäng
Hjälp
Blender
v3.3 Classroom OPTIX/RTX
Dell XPS 14 2024 OLED
NVIDIA GeForce RTX 4050 Laptop GPU, Intel Core Ultra 7 155H
37 Seconds *
v3.3 Classroom CUDA
Dell XPS 14 2024 OLED
NVIDIA GeForce RTX 4050 Laptop GPU, Intel Core Ultra 7 155H
67 Seconds *
v3.3 Classroom CPU
Dell XPS 13 9315 2-in-1 Core i5-1230U
Intel Iris Xe Graphics G7 80EUs, Intel Core i5-1230U
1023 Seconds * -66%
HP EliteBook Ultra G1q 14
Qualcomm SD X Adreno X1-85 3.8 TFLOPS, Qualcomm Snapdragon X Elite X1E-78-100
676 Seconds * -10%
Average Qualcomm SD X Adreno X1-85 3.8 TFLOPS
  (545 - 899, n=10)
671 Seconds * -9%
Medion SPRCHRGD 14 S1 Elite
Qualcomm SD X Adreno X1-85 3.8 TFLOPS, Qualcomm Snapdragon X Elite X1E-78-100
652 Seconds * -6%
Microsoft Surface Laptop 7 13.8 Copilot+
Qualcomm SD X Adreno X1-85 3.8 TFLOPS, Qualcomm Snapdragon X Elite X1E-80-100
628 Seconds * -2%
Dell XPS 13 9345
Qualcomm SD X Adreno X1-85 3.8 TFLOPS, Qualcomm Snapdragon X Elite X1E-80-100
616 Seconds *
Dell XPS 13 Plus 9320 4K
Intel Iris Xe Graphics G7 96EUs, Intel Core i7-1260P
598 Seconds * +3%
Dell XPS 13 Plus 9320 i7-1280P OLED
Intel Iris Xe Graphics G7 96EUs, Intel Core i7-1280P
537 Seconds * +13%
Dell XPS 13 Plus 9320 Core i7-1360P
Intel Iris Xe Graphics G7 96EUs, Intel Core i7-1360P
531 Seconds * +14%
Dell XPS 13 9340 Core Ultra 7
Intel Arc 8-Core iGPU, Intel Core Ultra 7 155H
481 Seconds * +22%
Dell XPS 14 2024 OLED
NVIDIA GeForce RTX 4050 Laptop GPU, Intel Core Ultra 7 155H
447 Seconds * +27%

* ... smaller is better

Prestanda för spel

Våra något högre 3DMark-resultat jämfört med EliteBook Ultra G1q 14 översätts till något snabbare prestanda i de testade titlarna nedan. Intressant nog kördes vissa titlar på vår Dell-enhet men inte på vår HP-enhet och vice versa. Till exempel Far Cry 5 kördes på vår Dell men inte på HP och Baldur's Gate 3 kördes på vår HP men inte på Dell oavsett DirectX-läge. Skillnaden kan bero på drivrutinsskillnader mellan de två modellerna, men det visar också att mer arbete måste göras när det gäller grafikdrivrutinen.

Performance Rating - Percent
Lenovo ThinkBook 13x G4 21KR0008GE -2!
Intel Core Ultra 5 125H, Intel Arc 7-Core iGPU
92.8 pt
Dell XPS 13 9340 Core Ultra 7 -2!
Intel Core Ultra 7 155H, Intel Arc 8-Core iGPU
90.1 pt
Dell XPS 13 9345
Qualcomm Snapdragon X Elite X1E-80-100, Qualcomm SD X Adreno X1-85 3.8 TFLOPS
85 pt
Microsoft Surface Laptop 7 13.8 Copilot+ -2!
Qualcomm Snapdragon X Elite X1E-80-100, Qualcomm SD X Adreno X1-85 3.8 TFLOPS
84.4 pt
HP EliteBook Ultra G1q 14 -1!
Qualcomm Snapdragon X Elite X1E-78-100, Qualcomm SD X Adreno X1-85 3.8 TFLOPS
77.4 pt
Asus ZenBook S13 OLED UX5304 -1!
Intel Core i7-1355U, Intel Iris Xe Graphics G7 96EUs
59.4 pt
The Witcher 3 - 1920x1080 Ultra Graphics & Postprocessing (HBAO+)
Lenovo ThinkBook 13x G4 21KR0008GE
Intel Core Ultra 5 125H, Intel Arc 7-Core iGPU
23.4 (18min, 20P1) fps +22%
Dell XPS 13 9340 Core Ultra 7
Intel Core Ultra 7 155H, Intel Arc 8-Core iGPU
20.8 (16min, 19P1) fps +8%
Dell XPS 13 9345
Qualcomm Snapdragon X Elite X1E-80-100, Qualcomm SD X Adreno X1-85 3.8 TFLOPS
19.2 (15min) fps
HP EliteBook Ultra G1q 14
Qualcomm Snapdragon X Elite X1E-78-100, Qualcomm SD X Adreno X1-85 3.8 TFLOPS
17.5 (14min) fps -9%
Asus ZenBook S13 OLED UX5304
Intel Core i7-1355U, Intel Iris Xe Graphics G7 96EUs
12.3 (11min, 11P1) fps -36%
GTA V - 1920x1080 Highest Settings possible AA:4xMSAA + FX AF:16x
Microsoft Surface Laptop 7 13.8 Copilot+
Qualcomm Snapdragon X Elite X1E-80-100, Qualcomm SD X Adreno X1-85 3.8 TFLOPS
21.5 (2.47min, 13P1) fps +1%
Dell XPS 13 9345
Qualcomm Snapdragon X Elite X1E-80-100, Qualcomm SD X Adreno X1-85 3.8 TFLOPS
21.2 (2.94min, 12.2P1) fps
Lenovo ThinkBook 13x G4 21KR0008GE
Intel Core Ultra 5 125H, Intel Arc 7-Core iGPU
14.8 (1.279min, 5.78P1) fps -30%
Dell XPS 13 9340 Core Ultra 7
Intel Core Ultra 7 155H, Intel Arc 8-Core iGPU
14.7 (2.21min, 10.8P1) fps -31%
Asus ZenBook S13 OLED UX5304
Intel Core i7-1355U, Intel Iris Xe Graphics G7 96EUs
9.42 (3.26min, 5.92P1) fps -56%
Final Fantasy XV Benchmark - 1920x1080 High Quality
Dell XPS 13 9340 Core Ultra 7
Intel Core Ultra 7 155H, Intel Arc 8-Core iGPU
26.4 fps +67%
Lenovo ThinkBook 13x G4 21KR0008GE
Intel Core Ultra 5 125H, Intel Arc 7-Core iGPU
25.3 fps +60%
Microsoft Surface Laptop 7 13.8 Copilot+
Qualcomm Snapdragon X Elite X1E-80-100, Qualcomm SD X Adreno X1-85 3.8 TFLOPS
15.8 fps 0%
Dell XPS 13 9345
Qualcomm Snapdragon X Elite X1E-80-100, Qualcomm SD X Adreno X1-85 3.8 TFLOPS
15.8 fps
Asus ZenBook S13 OLED UX5304
Intel Core i7-1355U, Intel Iris Xe Graphics G7 96EUs
14.9 fps -6%
HP EliteBook Ultra G1q 14
Qualcomm Snapdragon X Elite X1E-78-100, Qualcomm SD X Adreno X1-85 3.8 TFLOPS
14.3 fps -9%
Strange Brigade - 1920x1080 ultra AA:ultra AF:16
Lenovo ThinkBook 13x G4 21KR0008GE
Intel Core Ultra 5 125H, Intel Arc 7-Core iGPU
44 fps +30%
Dell XPS 13 9340 Core Ultra 7
Intel Core Ultra 7 155H, Intel Arc 8-Core iGPU
41 fps +21%
Microsoft Surface Laptop 7 13.8 Copilot+
Qualcomm Snapdragon X Elite X1E-80-100, Qualcomm SD X Adreno X1-85 3.8 TFLOPS
36 fps +6%
Dell XPS 13 9345
Qualcomm Snapdragon X Elite X1E-80-100, Qualcomm SD X Adreno X1-85 3.8 TFLOPS
33.9 (6.3min, 9.25P1) fps
HP EliteBook Ultra G1q 14
Qualcomm Snapdragon X Elite X1E-78-100, Qualcomm SD X Adreno X1-85 3.8 TFLOPS
32 (6.7min, 9.01P1) fps -6%
Asus ZenBook S13 OLED UX5304
Intel Core i7-1355U, Intel Iris Xe Graphics G7 96EUs
23.6 (5min, 6.37P1) fps -30%
Dota 2 Reborn - 1920x1080 ultra (3/3) best looking
Dell XPS 13 9340 Core Ultra 7
Intel Core Ultra 7 155H, Intel Arc 8-Core iGPU
65.2 (48.8min) fps +29%
Lenovo ThinkBook 13x G4 21KR0008GE
Intel Core Ultra 5 125H, Intel Arc 7-Core iGPU
64.9 (45.5min) fps +28%
Microsoft Surface Laptop 7 13.8 Copilot+
Qualcomm Snapdragon X Elite X1E-80-100, Qualcomm SD X Adreno X1-85 3.8 TFLOPS
53.2 (39min) fps +5%
Asus ZenBook S13 OLED UX5304
Intel Core i7-1355U, Intel Iris Xe Graphics G7 96EUs
51.1 (42.7min) fps +1%
Dell XPS 13 9345
Qualcomm Snapdragon X Elite X1E-80-100, Qualcomm SD X Adreno X1-85 3.8 TFLOPS
50.7 (37.8min) fps
HP EliteBook Ultra G1q 14
Qualcomm Snapdragon X Elite X1E-78-100, Qualcomm SD X Adreno X1-85 3.8 TFLOPS
49.3 (35.9min) fps -3%
Tiny Tina's Wonderlands - 1920x1080 Badass Preset (DX12)
Dell XPS 13 9345
Qualcomm Snapdragon X Elite X1E-80-100, Qualcomm SD X Adreno X1-85 3.8 TFLOPS
18 fps
HP EliteBook Ultra G1q 14
Qualcomm Snapdragon X Elite X1E-78-100, Qualcomm SD X Adreno X1-85 3.8 TFLOPS
16.8 fps -7%
F1 22 - 1920x1080 High Preset AA:T AF:16x
Dell XPS 13 9345
Qualcomm Snapdragon X Elite X1E-80-100, Qualcomm SD X Adreno X1-85 3.8 TFLOPS
38.5 (26min, 26P1) fps
Microsoft Surface Laptop 7 13.8 Copilot+
Qualcomm Snapdragon X Elite X1E-80-100, Qualcomm SD X Adreno X1-85 3.8 TFLOPS
38 (27min, 26P1) fps -1%
HP EliteBook Ultra G1q 14
Qualcomm Snapdragon X Elite X1E-78-100, Qualcomm SD X Adreno X1-85 3.8 TFLOPS
36.2 (24min, 22P1) fps -6%
Asus ZenBook S13 OLED UX5304
Intel Core i7-1355U, Intel Iris Xe Graphics G7 96EUs
27.6 (21min, 21P1) fps -28%
Far Cry 5
1280x720 Low Preset AA:T
Dell XPS 14 2024 OLED
Intel Core Ultra 7 155H, NVIDIA GeForce RTX 4050 Laptop GPU
108 fps +157%
Dell XPS 13 Plus 9320 i5-1240p
Intel Core i5-1240P, Intel Iris Xe Graphics G7 80EUs
61 fps +45%
Dell XPS 13 Plus 9320 4K
Intel Core i7-1260P, Intel Iris Xe Graphics G7 96EUs
59 fps +40%
Dell XPS 13 9340 Core Ultra 7
Intel Core Ultra 7 155H, Intel Arc 8-Core iGPU
57 fps +36%
Dell XPS 13 9310 2-in-1
Intel Core i7-1165G7, Intel Iris Xe Graphics G7 96EUs
49 (43min) fps +17%
Dell XPS 13 9345
Qualcomm Snapdragon X Elite X1E-80-100, Qualcomm SD X Adreno X1-85 3.8 TFLOPS
42 (20min) fps
Average Qualcomm SD X Adreno X1-85 3.8 TFLOPS
  (32 - 44, n=6)
37.8 fps -10%
Lenovo ThinkPad T14s Gen 6 21N10007GE
Qualcomm Snapdragon X Elite X1E-78-100, Qualcomm SD X Adreno X1-85 3.8 TFLOPS
35 (4min) fps -17%
Dell XPS 13 9315, i5-1230U
Intel Core i5-1230U, Intel Iris Xe Graphics G7 80EUs
22 (12min) fps -48%
1920x1080 Low Preset AA:T
Dell XPS 13 9310 2-in-1
Intel Core i7-1165G7, Intel Iris Xe Graphics G7 96EUs
27 (24min) fps
1920x1080 Medium Preset AA:T
Dell XPS 14 2024 OLED
Intel Core Ultra 7 155H, NVIDIA GeForce RTX 4050 Laptop GPU
85 fps +158%
Dell XPS 13 9340 Core Ultra 7
Intel Core Ultra 7 155H, Intel Arc 8-Core iGPU
33 fps 0%
Dell XPS 13 9345
Qualcomm Snapdragon X Elite X1E-80-100, Qualcomm SD X Adreno X1-85 3.8 TFLOPS
33 (19min) fps
Dell XPS 13 Plus 9320 4K
Intel Core i7-1260P, Intel Iris Xe Graphics G7 96EUs
32 fps -3%
Average Qualcomm SD X Adreno X1-85 3.8 TFLOPS
  (25 - 34, n=6)
29.5 fps -11%
Dell XPS 13 Plus 9320 i5-1240p
Intel Core i5-1240P, Intel Iris Xe Graphics G7 80EUs
28 fps -15%
Lenovo ThinkPad T14s Gen 6 21N10007GE
Qualcomm Snapdragon X Elite X1E-78-100, Qualcomm SD X Adreno X1-85 3.8 TFLOPS
26 (5min) fps -21%
Dell XPS 13 9310 2-in-1
Intel Core i7-1165G7, Intel Iris Xe Graphics G7 96EUs
23 (21min) fps -30%
Dell XPS 13 9315, i5-1230U
Intel Core i5-1230U, Intel Iris Xe Graphics G7 80EUs
14 (11min) fps -58%
1920x1080 High Preset AA:T
Dell XPS 14 2024 OLED
Intel Core Ultra 7 155H, NVIDIA GeForce RTX 4050 Laptop GPU
80 fps +158%
Dell XPS 13 9345
Qualcomm Snapdragon X Elite X1E-80-100, Qualcomm SD X Adreno X1-85 3.8 TFLOPS
31 (27min) fps
Dell XPS 13 9340 Core Ultra 7
Intel Core Ultra 7 155H, Intel Arc 8-Core iGPU
30 fps -3%
Dell XPS 13 Plus 9320 4K
Intel Core i7-1260P, Intel Iris Xe Graphics G7 96EUs
29 fps -6%
Average Qualcomm SD X Adreno X1-85 3.8 TFLOPS
  (23 - 31, n=6)
27.5 fps -11%
Lenovo ThinkPad T14s Gen 6 21N10007GE
Qualcomm Snapdragon X Elite X1E-78-100, Qualcomm SD X Adreno X1-85 3.8 TFLOPS
24 (19min) fps -23%
Dell XPS 13 9310 2-in-1
Intel Core i7-1165G7, Intel Iris Xe Graphics G7 96EUs
22 (19min) fps -29%
1920x1080 Ultra Preset AA:T
Dell XPS 14 2024 OLED
Intel Core Ultra 7 155H, NVIDIA GeForce RTX 4050 Laptop GPU
76 fps +171%
Dell XPS 13 9340 Core Ultra 7
Intel Core Ultra 7 155H, Intel Arc 8-Core iGPU
28 fps 0%
Dell XPS 13 9345
Qualcomm Snapdragon X Elite X1E-80-100, Qualcomm SD X Adreno X1-85 3.8 TFLOPS
28 (20min) fps
Dell XPS 13 Plus 9320 4K
Intel Core i7-1260P, Intel Iris Xe Graphics G7 96EUs
26 fps -7%
Average Qualcomm SD X Adreno X1-85 3.8 TFLOPS
  (22 - 29, n=6)
25.5 fps -9%
Dell XPS 13 9310 2-in-1
Intel Core i7-1165G7, Intel Iris Xe Graphics G7 96EUs
22 (19min) fps -21%
Lenovo ThinkPad T14s Gen 6 21N10007GE
Qualcomm Snapdragon X Elite X1E-78-100, Qualcomm SD X Adreno X1-85 3.8 TFLOPS
22 (9min) fps -21%
F1 22
1280x720 Ultra Low Preset AA:T AF:16x
Dell XPS 13 9345
Qualcomm Snapdragon X Elite X1E-80-100, Qualcomm SD X Adreno X1-85 3.8 TFLOPS
101 (66min, 66P1) fps
HP EliteBook Ultra G1q 14
Qualcomm Snapdragon X Elite X1E-78-100, Qualcomm SD X Adreno X1-85 3.8 TFLOPS
94.2 (63min, 49P1) fps -7%
Lenovo ThinkPad T14s Gen 6 21N10007GE
Qualcomm Snapdragon X Elite X1E-78-100, Qualcomm SD X Adreno X1-85 3.8 TFLOPS
92.6 (57min, 60P1) fps -8%
Average Qualcomm SD X Adreno X1-85 3.8 TFLOPS
  (60 - 101, n=4)
87 fps -14%
Dell XPS 13 Plus 9320 Core i7-1360P
Intel Core i7-1360P, Intel Iris Xe Graphics G7 96EUs
81.5 (61min, 60P1) fps -19%
1920x1080 Low Preset AA:T AF:16x
Dell XPS 13 9345
Qualcomm Snapdragon X Elite X1E-80-100, Qualcomm SD X Adreno X1-85 3.8 TFLOPS
62.9 (38min, 39P1) fps
Average Qualcomm SD X Adreno X1-85 3.8 TFLOPS
  (54.7 - 64, n=8)
59.2 fps -6%
HP EliteBook Ultra G1q 14
Qualcomm Snapdragon X Elite X1E-78-100, Qualcomm SD X Adreno X1-85 3.8 TFLOPS
57.6 (35min, 35P1) fps -8%
Microsoft Surface Laptop 7 13.8 Copilot+
Qualcomm Snapdragon X Elite X1E-80-100, Qualcomm SD X Adreno X1-85 3.8 TFLOPS
57 (36min, 36P1) fps -9%
Lenovo ThinkPad T14s Gen 6 21N10007GE
Qualcomm Snapdragon X Elite X1E-78-100, Qualcomm SD X Adreno X1-85 3.8 TFLOPS
55.2 (32min, 33P1) fps -12%
Dell XPS 13 Plus 9320 Core i7-1360P
Intel Core i7-1360P, Intel Iris Xe Graphics G7 96EUs
47.5 (40min, 37P1) fps -24%
1920x1080 Medium Preset AA:T AF:16x
Dell XPS 13 9345
Qualcomm Snapdragon X Elite X1E-80-100, Qualcomm SD X Adreno X1-85 3.8 TFLOPS
55.4 (36min, 36P1) fps
Average Qualcomm SD X Adreno X1-85 3.8 TFLOPS
  (49.6 - 56.6, n=8)
52.8 fps -5%
HP EliteBook Ultra G1q 14
Qualcomm Snapdragon X Elite X1E-78-100, Qualcomm SD X Adreno X1-85 3.8 TFLOPS
51 (32min, 28P1) fps -8%
Microsoft Surface Laptop 7 13.8 Copilot+
Qualcomm Snapdragon X Elite X1E-80-100, Qualcomm SD X Adreno X1-85 3.8 TFLOPS
50.1 (29min, 30P1) fps -10%
Lenovo ThinkPad T14s Gen 6 21N10007GE
Qualcomm Snapdragon X Elite X1E-78-100, Qualcomm SD X Adreno X1-85 3.8 TFLOPS
50.1 (31min, 31P1) fps -10%
Dell XPS 13 Plus 9320 Core i7-1360P
Intel Core i7-1360P, Intel Iris Xe Graphics G7 96EUs
42.8 (37min, 36P1) fps -23%
1920x1080 High Preset AA:T AF:16x
Dell XPS 13 9345
Qualcomm Snapdragon X Elite X1E-80-100, Qualcomm SD X Adreno X1-85 3.8 TFLOPS
38.5 (26min, 26P1) fps
Microsoft Surface Laptop 7 13.8 Copilot+
Qualcomm Snapdragon X Elite X1E-80-100, Qualcomm SD X Adreno X1-85 3.8 TFLOPS
38 (27min, 26P1) fps -1%
Average Qualcomm SD X Adreno X1-85 3.8 TFLOPS
  (35.3 - 38.7, n=8)
37.4 fps -3%
HP EliteBook Ultra G1q 14
Qualcomm Snapdragon X Elite X1E-78-100, Qualcomm SD X Adreno X1-85 3.8 TFLOPS
36.2 (24min, 22P1) fps -6%
Lenovo ThinkPad T14s Gen 6 21N10007GE
Qualcomm Snapdragon X Elite X1E-78-100, Qualcomm SD X Adreno X1-85 3.8 TFLOPS
35.3 (25min, 25P1) fps -8%
Dell XPS 13 Plus 9320 Core i7-1360P
Intel Core i7-1360P, Intel Iris Xe Graphics G7 96EUs
31.9 (24min, 26P1) fps -17%
The Witcher 3
1024x768 Low Graphics & Postprocessing
Dell XPS 13 9340 Core Ultra 7
Intel Core Ultra 7 155H, Intel Arc 8-Core iGPU
152 fps +46%
HP EliteBook Ultra G1q 14
Qualcomm Snapdragon X Elite X1E-78-100, Qualcomm SD X Adreno X1-85 3.8 TFLOPS
109.2 (81min) fps +5%
Dell XPS 13 9310 Core i7 4K
Intel Core i7-1185G7, Intel Iris Xe Graphics G7 96EUs
107 (92min) fps +3%
Dell XPS 13 Plus 9320 i7-1280P OLED
Intel Core i7-1280P, Intel Iris Xe Graphics G7 96EUs
104.8 (61min) fps +1%
Dell XPS 13 9345
Qualcomm Snapdragon X Elite X1E-80-100, Qualcomm SD X Adreno X1-85 3.8 TFLOPS
104 (72min) fps
Lenovo ThinkPad T14s Gen 6 21N10007GE
Qualcomm Snapdragon X Elite X1E-78-100, Qualcomm SD X Adreno X1-85 3.8 TFLOPS
103.7 (6.54min, 21.6P0.1, 60.3P1) fps 0%
Average Qualcomm SD X Adreno X1-85 3.8 TFLOPS
  (79 - 112, n=8)
103.2 fps -1%
Dell XPS 13 Plus 9320 4K
Intel Core i7-1260P, Intel Iris Xe Graphics G7 96EUs
99 fps -5%
Dell XPS 13 9310 OLED
Intel Core i7-1185G7, Intel Iris Xe Graphics G7 96EUs
98.6 (83min) fps -5%
Dell XPS 13 Plus 9320 Core i7-1360P
Intel Core i7-1360P, Intel Iris Xe Graphics G7 96EUs
86.7 (48min) fps -17%
Dell XPS 13 9310 2-in-1
Intel Core i7-1165G7, Intel Iris Xe Graphics G7 96EUs
86.2 (43min) fps -17%
Dell XPS 13 Plus 9320 i5-1240p
Intel Core i5-1240P, Intel Iris Xe Graphics G7 80EUs
75.5 fps -27%
Dell XPS 13 9315, i5-1230U
Intel Core i5-1230U, Intel Iris Xe Graphics G7 80EUs
67 fps -36%
Dell XPS 13 9315 2-in-1 Core i5-1230U
Intel Core i5-1230U, Intel Iris Xe Graphics G7 80EUs
57.7 (15min) fps -45%
1366x768 Medium Graphics & Postprocessing
Dell XPS 13 9340 Core Ultra 7
Intel Core Ultra 7 155H, Intel Arc 8-Core iGPU
89 fps +19%
Dell XPS 13 9345
Qualcomm Snapdragon X Elite X1E-80-100, Qualcomm SD X Adreno X1-85 3.8 TFLOPS
74.5 (68min) fps
HP EliteBook Ultra G1q 14
Qualcomm Snapdragon X Elite X1E-78-100, Qualcomm SD X Adreno X1-85 3.8 TFLOPS
70.9 (68min) fps -5%
Average Qualcomm SD X Adreno X1-85 3.8 TFLOPS
  (54 - 74.5, n=8)
68.2 fps -8%
Dell XPS 13 Plus 9320 i7-1280P OLED
Intel Core i7-1280P, Intel Iris Xe Graphics G7 96EUs
65.7 (62min) fps -12%
Lenovo ThinkPad T14s Gen 6 21N10007GE
Qualcomm Snapdragon X Elite X1E-78-100, Qualcomm SD X Adreno X1-85 3.8 TFLOPS
63.9 (4.88min, 19P0.1, 42.9P1) fps -14%
Dell XPS 13 Plus 9320 4K
Intel Core i7-1260P, Intel Iris Xe Graphics G7 96EUs
62 fps -17%
Dell XPS 13 9310 Core i7 4K
Intel Core i7-1185G7, Intel Iris Xe Graphics G7 96EUs
61.9 (59min) fps -17%
Dell XPS 13 9310 OLED
Intel Core i7-1185G7, Intel Iris Xe Graphics G7 96EUs
61.1 (55min) fps -18%
Dell XPS 13 Plus 9320 Core i7-1360P
Intel Core i7-1360P, Intel Iris Xe Graphics G7 96EUs
56.1 (52min) fps -25%
Dell XPS 13 9310 2-in-1
Intel Core i7-1165G7, Intel Iris Xe Graphics G7 96EUs
54.3 (50min) fps -27%
Dell XPS 13 Plus 9320 i5-1240p
Intel Core i5-1240P, Intel Iris Xe Graphics G7 80EUs
48.1 fps -35%
Dell XPS 13 9305 Core i5 FHD
Intel Core i5-1135G7, Intel Iris Xe Graphics G7 80EUs
47.7 fps -36%
Dell XPS 13 9315, i5-1230U
Intel Core i5-1230U, Intel Iris Xe Graphics G7 80EUs
47 fps -37%
Dell XPS 13 9315 2-in-1 Core i5-1230U
Intel Core i5-1230U, Intel Iris Xe Graphics G7 80EUs
38.9 (36min) fps -48%
1920x1080 High Graphics & Postprocessing (Nvidia HairWorks Off)
Dell XPS 14 2024 OLED
Intel Core Ultra 7 155H, NVIDIA GeForce RTX 4050 Laptop GPU
98 fps +124%
Dell XPS 13 9340 Core Ultra 7
Intel Core Ultra 7 155H, Intel Arc 8-Core iGPU
47 fps +8%
Dell XPS 13 9345
Qualcomm Snapdragon X Elite X1E-80-100, Qualcomm SD X Adreno X1-85 3.8 TFLOPS
43.7 (42min) fps
Lenovo ThinkPad T14s Gen 6 21N10007GE
Qualcomm Snapdragon X Elite X1E-78-100, Qualcomm SD X Adreno X1-85 3.8 TFLOPS
39.9 (1.229min, 13P0.1, 22P1) fps -9%
HP EliteBook Ultra G1q 14
Qualcomm Snapdragon X Elite X1E-78-100, Qualcomm SD X Adreno X1-85 3.8 TFLOPS
39.7 (35min) fps -9%
Average Qualcomm SD X Adreno X1-85 3.8 TFLOPS
  (31 - 43.7, n=8)
39.5 fps -10%
Dell XPS 13 Plus 9320 i7-1280P OLED
Intel Core i7-1280P, Intel Iris Xe Graphics G7 96EUs
36.9 (33min) fps -16%
Dell XPS 13 9310 Core i7 4K
Intel Core i7-1185G7, Intel Iris Xe Graphics G7 96EUs
34.5 (32min) fps -21%
Dell XPS 13 Plus 9320 4K
Intel Core i7-1260P, Intel Iris Xe Graphics G7 96EUs
34 fps -22%
Dell XPS 13 Plus 9320 Core i7-1360P
Intel Core i7-1360P, Intel Iris Xe Graphics G7 96EUs
33.9 (31min) fps -22%
Dell XPS 13 9310 OLED
Intel Core i7-1185G7, Intel Iris Xe Graphics G7 96EUs
32 (29min) fps -27%
Dell XPS 13 Plus 9320 i5-1240p
Intel Core i5-1240P, Intel Iris Xe Graphics G7 80EUs
31.9 fps -27%
Dell XPS 13 9310 2-in-1
Intel Core i7-1165G7, Intel Iris Xe Graphics G7 96EUs
29.9 (27min) fps -32%
Dell XPS 13 9315, i5-1230U
Intel Core i5-1230U, Intel Iris Xe Graphics G7 80EUs
22 fps -50%
Dell XPS 13 9315 2-in-1 Core i5-1230U
Intel Core i5-1230U, Intel Iris Xe Graphics G7 80EUs
19.9 (17min) fps -54%
Dell XPS 13 9305 Core i5 FHD
Intel Core i5-1135G7, Intel Iris Xe Graphics G7 80EUs
18.5 fps -58%
1920x1080 Ultra Graphics & Postprocessing (HBAO+)
Dell XPS 14 2024 OLED
Intel Core Ultra 7 155H, NVIDIA GeForce RTX 4050 Laptop GPU
52.4 (50min, 50.99P1) fps +173%
Dell XPS 13 9340 Core Ultra 7
Intel Core Ultra 7 155H, Intel Arc 8-Core iGPU
20.8 (16min, 19P1) fps +8%
Dell XPS 13 9345
Qualcomm Snapdragon X Elite X1E-80-100, Qualcomm SD X Adreno X1-85 3.8 TFLOPS
19.2 (15min) fps
Average Qualcomm SD X Adreno X1-85 3.8 TFLOPS
  (16 - 20, n=8)
18.5 fps -4%
Lenovo ThinkPad T14s Gen 6 21N10007GE
Qualcomm Snapdragon X Elite X1E-78-100, Qualcomm SD X Adreno X1-85 3.8 TFLOPS
18.1 (8.6min, 8.76P0.1, 14P1) fps -6%
HP EliteBook Ultra G1q 14
Qualcomm Snapdragon X Elite X1E-78-100, Qualcomm SD X Adreno X1-85 3.8 TFLOPS
17.5 (14min) fps -9%
Dell XPS 13 Plus 9320 i7-1280P OLED
Intel Core i7-1280P, Intel Iris Xe Graphics G7 96EUs
16.4 (14min) fps -15%
Dell XPS 13 Plus 9320 Core i7-1360P
Intel Core i7-1360P, Intel Iris Xe Graphics G7 96EUs
15.4 (14min) fps -20%
Dell XPS 13 9310 Core i7 4K
Intel Core i7-1185G7, Intel Iris Xe Graphics G7 96EUs
15.3 (13min) fps -20%
Dell XPS 13 9310 2-in-1
Intel Core i7-1165G7, Intel Iris Xe Graphics G7 96EUs
14.7 (12min) fps -23%
Dell XPS 13 Plus 9320 4K
Intel Core i7-1260P, Intel Iris Xe Graphics G7 96EUs
14.3 (12min, 13P1) fps -26%
Dell XPS 13 9310 OLED
Intel Core i7-1185G7, Intel Iris Xe Graphics G7 96EUs
13.9 (12min) fps -28%
Dell XPS 13 Plus 9320 i5-1240p
Intel Core i5-1240P, Intel Iris Xe Graphics G7 80EUs
13.1 fps -32%
Dell XPS 13 9305 Core i5 FHD
Intel Core i5-1135G7, Intel Iris Xe Graphics G7 80EUs
12 fps -37%
Dell XPS 13 9315 2-in-1 Core i5-1230U
Intel Core i5-1230U, Intel Iris Xe Graphics G7 80EUs
8.5 (7min) fps -56%
Dell XPS 13 9315, i5-1230U
Intel Core i5-1230U, Intel Iris Xe Graphics G7 80EUs
8 fps -58%
Strange Brigade
1280x720 lowest AF:1
Dell XPS 14 2024 OLED
Intel Core Ultra 7 155H, NVIDIA GeForce RTX 4050 Laptop GPU
239 fps +93%
Dell XPS 13 9340 Core Ultra 7
Intel Core Ultra 7 155H, Intel Arc 8-Core iGPU
156 fps +26%
Microsoft Surface Laptop 7 13.8 Copilot+
Qualcomm Snapdragon X Elite X1E-80-100, Qualcomm SD X Adreno X1-85 3.8 TFLOPS
137 fps +11%
Dell XPS 13 9345
Qualcomm Snapdragon X Elite X1E-80-100, Qualcomm SD X Adreno X1-85 3.8 TFLOPS
123.9 (30.8min, 58.7P1) fps
Lenovo ThinkPad T14s Gen 6 21N10007GE
Qualcomm Snapdragon X Elite X1E-78-100, Qualcomm SD X Adreno X1-85 3.8 TFLOPS
121.3 (25.7min, 55.7P1) fps -2%
Average Qualcomm SD X Adreno X1-85 3.8 TFLOPS
  (68 - 140, n=12)
116.9 fps -6%
HP EliteBook Ultra G1q 14
Qualcomm Snapdragon X Elite X1E-78-100, Qualcomm SD X Adreno X1-85 3.8 TFLOPS
114.3 (30.7min, 55.8P1) fps -8%
Dell XPS 13 Plus 9320 i7-1280P OLED
Intel Core i7-1280P, Intel Iris Xe Graphics G7 96EUs
100.2 (22.5min, 36.9P1) fps -19%
Dell XPS 13 Plus 9320 4K
Intel Core i7-1260P, Intel Iris Xe Graphics G7 96EUs
95.2 (21min, 33.1P1) fps -23%
Dell XPS 13 Plus 9320 Core i7-1360P
Intel Core i7-1360P, Intel Iris Xe Graphics G7 96EUs
93.9 (20.3min, 37.7P1) fps -24%
Dell XPS 13 9310 OLED
Intel Core i7-1185G7, Intel Iris Xe Graphics G7 96EUs
88.4 (19.6min, 30.6P1) fps -29%
Medion SPRCHRGD 14 S1 Elite
Qualcomm Snapdragon X Elite X1E-78-100, Qualcomm SD X Adreno X1-85 3.8 TFLOPS
78.8 (31.1min, 33.8P1) fps -36%
Dell XPS 13 9310 2-in-1
Intel Core i7-1165G7, Intel Iris Xe Graphics G7 96EUs
78.1 (16.9min, 28.3P1) fps -37%
Dell XPS 13 9305 Core i5 FHD
Intel Core i5-1135G7, Intel Iris Xe Graphics G7 80EUs
76.1 (16.7min, 22.9P1) fps -39%
Dell XPS 13 Plus 9320 i5-1240p
Intel Core i5-1240P, Intel Iris Xe Graphics G7 80EUs
67.7 (15.5min, 23.7P1) fps -45%
Dell XPS 13 9315, i5-1230U
Intel Core i5-1230U, Intel Iris Xe Graphics G7 80EUs
47.5 (10.8min, 14.4P1) fps -62%
1920x1080 medium AA:medium AF:4
Dell XPS 14 2024 OLED
Intel Core Ultra 7 155H, NVIDIA GeForce RTX 4050 Laptop GPU
130 fps +156%
Dell XPS 13 9340 Core Ultra 7
Intel Core Ultra 7 155H, Intel Arc 8-Core iGPU
68 fps +34%
Microsoft Surface Laptop 7 13.8 Copilot+
Qualcomm Snapdragon X Elite X1E-80-100, Qualcomm SD X Adreno X1-85 3.8 TFLOPS
51 fps 0%
Dell XPS 13 9345
Qualcomm Snapdragon X Elite X1E-80-100, Qualcomm SD X Adreno X1-85 3.8 TFLOPS
50.8 (17.9min, 34.8P1) fps
Medion SPRCHRGD 14 S1 Elite
Qualcomm Snapdragon X Elite X1E-78-100, Qualcomm SD X Adreno X1-85 3.8 TFLOPS
49.3 (19.8min, 29.7P1) fps -3%
Average Qualcomm SD X Adreno X1-85 3.8 TFLOPS
  (41 - 52, n=12)
49.1 fps -3%
Lenovo ThinkPad T14s Gen 6 21N10007GE
Qualcomm Snapdragon X Elite X1E-78-100, Qualcomm SD X Adreno X1-85 3.8 TFLOPS
47.5 (16.6min, 26.7P1) fps -6%
Dell XPS 13 Plus 9320 4K
Intel Core i7-1260P, Intel Iris Xe Graphics G7 96EUs
45.9 (21.6min, 25.1P1) fps -10%
Dell XPS 13 Plus 9320 i7-1280P OLED
Intel Core i7-1280P, Intel Iris Xe Graphics G7 96EUs
45.4 (16.6min, 25.1P1) fps -11%
Dell XPS 13 Plus 9320 Core i7-1360P
Intel Core i7-1360P, Intel Iris Xe Graphics G7 96EUs
43.8 (15.4min, 25.5P1) fps -14%
HP EliteBook Ultra G1q 14
Qualcomm Snapdragon X Elite X1E-78-100, Qualcomm SD X Adreno X1-85 3.8 TFLOPS
43.6 (12.1min, 24.4P1) fps -14%
Dell XPS 13 9310 2-in-1
Intel Core i7-1165G7, Intel Iris Xe Graphics G7 96EUs
36.8 (15.7min, 20.6P1) fps -28%
Dell XPS 13 9310 OLED
Intel Core i7-1185G7, Intel Iris Xe Graphics G7 96EUs
33.2 (8.8min, 17.6P1) fps -35%
Dell XPS 13 Plus 9320 i5-1240p
Intel Core i5-1240P, Intel Iris Xe Graphics G7 80EUs
30.7 (10.4min, 16.6P1) fps -40%
Dell XPS 13 9305 Core i5 FHD
Intel Core i5-1135G7, Intel Iris Xe Graphics G7 80EUs
30.5 (10.6min, 16.5P1) fps -40%
Dell XPS 13 9315, i5-1230U
Intel Core i5-1230U, Intel Iris Xe Graphics G7 80EUs
6 (5min, 5P1) fps -88%
1920x1080 high AA:high AF:8
Dell XPS 14 2024 OLED
Intel Core Ultra 7 155H, NVIDIA GeForce RTX 4050 Laptop GPU
105 fps +151%
Dell XPS 13 9340 Core Ultra 7
Intel Core Ultra 7 155H, Intel Arc 8-Core iGPU
54 fps +29%
Microsoft Surface Laptop 7 13.8 Copilot+
Qualcomm Snapdragon X Elite X1E-80-100, Qualcomm SD X Adreno X1-85 3.8 TFLOPS
43 fps +3%
Dell XPS 13 9345
Qualcomm Snapdragon X Elite X1E-80-100, Qualcomm SD X Adreno X1-85 3.8 TFLOPS
41.8 (10.6min, 14.6P1) fps
Medion SPRCHRGD 14 S1 Elite
Qualcomm Snapdragon X Elite X1E-78-100, Qualcomm SD X Adreno X1-85 3.8 TFLOPS
41.7 (9.9min, 15.9P1) fps 0%
Average Qualcomm SD X Adreno X1-85 3.8 TFLOPS
  (33 - 43, n=12)
40.8 fps -2%
Lenovo ThinkPad T14s Gen 6 21N10007GE
Qualcomm Snapdragon X Elite X1E-78-100, Qualcomm SD X Adreno X1-85 3.8 TFLOPS
39.1 (9.2min, 18.3P1) fps -6%
HP EliteBook Ultra G1q 14
Qualcomm Snapdragon X Elite X1E-78-100, Qualcomm SD X Adreno X1-85 3.8 TFLOPS
36.7 (8.4min, 12.7P1) fps -12%
Dell XPS 13 Plus 9320 i7-1280P OLED
Intel Core i7-1280P, Intel Iris Xe Graphics G7 96EUs
36.5 (18min, 19.9P1) fps -13%
Dell XPS 13 Plus 9320 4K
Intel Core i7-1260P, Intel Iris Xe Graphics G7 96EUs
36.4 (9.7min, 20.1P1) fps -13%
Dell XPS 13 Plus 9320 Core i7-1360P
Intel Core i7-1360P, Intel Iris Xe Graphics G7 96EUs
35.4 (5.4min, 17.4P1) fps -15%
Dell XPS 13 9310 OLED
Intel Core i7-1185G7, Intel Iris Xe Graphics G7 96EUs
29.7 (10.1min, 11.4P1) fps -29%
Dell XPS 13 9310 2-in-1
Intel Core i7-1165G7, Intel Iris Xe Graphics G7 96EUs
29.4 (10.6min, 15.9P1) fps -30%
Dell XPS 13 9305 Core i5 FHD
Intel Core i5-1135G7, Intel Iris Xe Graphics G7 80EUs
26.4 (6.1min, 9.74P1) fps -37%
Dell XPS 13 Plus 9320 i5-1240p
Intel Core i5-1240P, Intel Iris Xe Graphics G7 80EUs
24.4 (8.4min, 13.2P1) fps -42%
Dell XPS 13 9315, i5-1230U
Intel Core i5-1230U, Intel Iris Xe Graphics G7 80EUs
17.8 (6.6min, 9.19P1) fps -57%
1920x1080 ultra AA:ultra AF:16
Dell XPS 14 2024 OLED
Intel Core Ultra 7 155H, NVIDIA GeForce RTX 4050 Laptop GPU
92 fps +171%
Dell XPS 13 9340 Core Ultra 7
Intel Core Ultra 7 155H, Intel Arc 8-Core iGPU
41 fps +21%
Medion SPRCHRGD 14 S1 Elite
Qualcomm Snapdragon X Elite X1E-78-100, Qualcomm SD X Adreno X1-85 3.8 TFLOPS
36.7 (7.1min, 10.9P1) fps +8%
Microsoft Surface Laptop 7 13.8 Copilot+
Qualcomm Snapdragon X Elite X1E-80-100, Qualcomm SD X Adreno X1-85 3.8 TFLOPS
36 fps +6%
Average Qualcomm SD X Adreno X1-85 3.8 TFLOPS
  (30 - 38, n=12)
35.2 fps +4%
Lenovo ThinkPad T14s Gen 6 21N10007GE
Qualcomm Snapdragon X Elite X1E-78-100, Qualcomm SD X Adreno X1-85 3.8 TFLOPS
33.9 (6.3min, 9.52P1) fps 0%
Dell XPS 13 9345
Qualcomm Snapdragon X Elite X1E-80-100, Qualcomm SD X Adreno X1-85 3.8 TFLOPS
33.9 (6.3min, 9.25P1) fps
HP EliteBook Ultra G1q 14
Qualcomm Snapdragon X Elite X1E-78-100, Qualcomm SD X Adreno X1-85 3.8 TFLOPS
32 (6.7min, 9.01P1) fps -6%
Dell XPS 13 Plus 9320 i7-1280P OLED
Intel Core i7-1280P, Intel Iris Xe Graphics G7 96EUs
29.6 (9min, 10.7P1) fps -13%
Dell XPS 13 Plus 9320 4K
Intel Core i7-1260P, Intel Iris Xe Graphics G7 96EUs
29.5 (8.2min, 10.5P1) fps -13%
Dell XPS 13 Plus 9320 Core i7-1360P
Intel Core i7-1360P, Intel Iris Xe Graphics G7 96EUs
27.5 (5.6min, 7.31P1) fps -19%
Dell XPS 13 9310 2-in-1
Intel Core i7-1165G7, Intel Iris Xe Graphics G7 96EUs
24 (5.9min, 7.34P1) fps -29%
Dell XPS 13 9310 OLED
Intel Core i7-1185G7, Intel Iris Xe Graphics G7 96EUs
22.3 (5min, 6.12P1) fps -34%
Dota 2 Reborn
1280x720 min (0/3) fastest
Dell XPS 13 Plus 9320 i5-1240p
Intel Core i5-1240P, Intel Iris Xe Graphics G7 80EUs
134.4 (81.4min) fps +68%
Dell XPS 13 Plus 9320 Core i7-1360P
Intel Core i7-1360P, Intel Iris Xe Graphics G7 96EUs
125.6 (99.1min) fps +57%
Dell XPS 14 2024 OLED
Intel Core Ultra 7 155H, NVIDIA GeForce RTX 4050 Laptop GPU
119.7 (112.3min) fps +50%
Dell XPS 13 Plus 9320 i7-1280P OLED
Intel Core i7-1280P, Intel Iris Xe Graphics G7 96EUs
110.3 (87.2min) fps +38%
Dell XPS 13 Plus 9320 4K
Intel Core i7-1260P, Intel Iris Xe Graphics G7 96EUs
109.9 (88.7min) fps +37%
Dell XPS 13 9310 2-in-1
Intel Core i7-1165G7, Intel Iris Xe Graphics G7 96EUs
109 (93.4min) fps +36%
Dell XPS 13 9340 Core Ultra 7
Intel Core Ultra 7 155H, Intel Arc 8-Core iGPU
106.2 (58min) fps +33%
Dell XPS 13 9315 2-in-1 Core i5-1230U
Intel Core i5-1230U, Intel Iris Xe Graphics G7 80EUs
101.2 (80.9min) fps +27%
Microsoft Surface Laptop 7 13.8 Copilot+
Qualcomm Snapdragon X Elite X1E-80-100, Qualcomm SD X Adreno X1-85 3.8 TFLOPS
85.9 (59.4min) fps +7%
Lenovo ThinkPad T14s Gen 6 21N10007GE
Qualcomm Snapdragon X Elite X1E-78-100, Qualcomm SD X Adreno X1-85 3.8 TFLOPS
81.6 (57.1min) fps +2%
Dell XPS 13 9310 Core i7 4K
Intel Core i7-1185G7, Intel Iris Xe Graphics G7 96EUs
80.7 (45.7min) fps +1%
Dell XPS 13 9345
Qualcomm Snapdragon X Elite X1E-80-100, Qualcomm SD X Adreno X1-85 3.8 TFLOPS
80 (57.7min) fps
Dell XPS 13 9305 Core i5 FHD
Intel Core i5-1135G7, Intel Iris Xe Graphics G7 80EUs
78.9 (46.5min) fps -1%
Average Qualcomm SD X Adreno X1-85 3.8 TFLOPS
  (61.4 - 85.9, n=12)
78.5 fps -2%
HP EliteBook Ultra G1q 14
Qualcomm Snapdragon X Elite X1E-78-100, Qualcomm SD X Adreno X1-85 3.8 TFLOPS
77.9 (55min) fps -3%
Dell XPS 13 9310 OLED
Intel Core i7-1185G7, Intel Iris Xe Graphics G7 96EUs
76.1 (46.6min) fps -5%
Medion SPRCHRGD 14 S1 Elite
Qualcomm Snapdragon X Elite X1E-78-100, Qualcomm SD X Adreno X1-85 3.8 TFLOPS
73.2 (38.1min) fps -8%
1366x768 med (1/3)
Dell XPS 13 Plus 9320 i5-1240p
Intel Core i5-1240P, Intel Iris Xe Graphics G7 80EUs
119.5 (103.4min) fps +97%
Dell XPS 14 2024 OLED
Intel Core Ultra 7 155H, NVIDIA GeForce RTX 4050 Laptop GPU
118.5 (105.9min) fps +95%
Dell XPS 13 Plus 9320 Core i7-1360P
Intel Core i7-1360P, Intel Iris Xe Graphics G7 96EUs
97.7 (75.8min) fps +61%
Dell XPS 13 9340 Core Ultra 7
Intel Core Ultra 7 155H, Intel Arc 8-Core iGPU
89.8 (52.9min) fps +48%
Dell XPS 13 Plus 9320 i7-1280P OLED
Intel Core i7-1280P, Intel Iris Xe Graphics G7 96EUs
86.8 (68min) fps +43%
Dell XPS 13 Plus 9320 4K
Intel Core i7-1260P, Intel Iris Xe Graphics G7 96EUs
85.2 (68min) fps +40%
Dell XPS 13 9315 2-in-1 Core i5-1230U
Intel Core i5-1230U, Intel Iris Xe Graphics G7 80EUs
75.8 (62.3min) fps +25%
Dell XPS 13 9310 OLED
Intel Core i7-1185G7, Intel Iris Xe Graphics G7 96EUs
74.7 (48.1min) fps +23%
Dell XPS 13 9305 Core i5 FHD
Intel Core i5-1135G7, Intel Iris Xe Graphics G7 80EUs
70.5 (47.6min) fps +16%
Microsoft Surface Laptop 7 13.8 Copilot+
Qualcomm Snapdragon X Elite X1E-80-100, Qualcomm SD X Adreno X1-85 3.8 TFLOPS
65.7 (43.9min) fps +8%
Lenovo ThinkPad T14s Gen 6 21N10007GE
Qualcomm Snapdragon X Elite X1E-78-100, Qualcomm SD X Adreno X1-85 3.8 TFLOPS
63.5 (43.8min) fps +5%
Dell XPS 13 9310 2-in-1
Intel Core i7-1165G7, Intel Iris Xe Graphics G7 96EUs
61.4 (45.3min) fps +1%
HP EliteBook Ultra G1q 14
Qualcomm Snapdragon X Elite X1E-78-100, Qualcomm SD X Adreno X1-85 3.8 TFLOPS
60.9 (42.8min) fps 0%
Dell XPS 13 9345
Qualcomm Snapdragon X Elite X1E-80-100, Qualcomm SD X Adreno X1-85 3.8 TFLOPS
60.7 (43.3min) fps
Average Qualcomm SD X Adreno X1-85 3.8 TFLOPS
  (46.3 - 66.6, n=12)
60.6 fps 0%
Medion SPRCHRGD 14 S1 Elite
Qualcomm Snapdragon X Elite X1E-78-100, Qualcomm SD X Adreno X1-85 3.8 TFLOPS
56.2 (36.9min) fps -7%
Dell XPS 13 9310 Core i7 4K
Intel Core i7-1185G7, Intel Iris Xe Graphics G7 96EUs
51.4 (33.4min) fps -15%
1920x1080 high (2/3)
Dell XPS 14 2024 OLED
Intel Core Ultra 7 155H, NVIDIA GeForce RTX 4050 Laptop GPU
116.5 (102.1min) fps +103%
Dell XPS 13 9340 Core Ultra 7
Intel Core Ultra 7 155H, Intel Arc 8-Core iGPU
72 (49.5min) fps +25%
Dell XPS 13 Plus 9320 i5-1240p
Intel Core i5-1240P, Intel Iris Xe Graphics G7 80EUs
70.9 (59.6min) fps +24%
Dell XPS 13 Plus 9320 Core i7-1360P
Intel Core i7-1360P, Intel Iris Xe Graphics G7 96EUs
68.7 (58.6min) fps +20%
Dell XPS 13 Plus 9320 4K
Intel Core i7-1260P, Intel Iris Xe Graphics G7 96EUs
68.2 (59.4min) fps +19%
Dell XPS 13 Plus 9320 i7-1280P OLED
Intel Core i7-1280P, Intel Iris Xe Graphics G7 96EUs
68.1 (57.9min) fps +19%
Microsoft Surface Laptop 7 13.8 Copilot+
Qualcomm Snapdragon X Elite X1E-80-100, Qualcomm SD X Adreno X1-85 3.8 TFLOPS
61.7 (43.5min) fps +7%
Lenovo ThinkPad T14s Gen 6 21N10007GE
Qualcomm Snapdragon X Elite X1E-78-100, Qualcomm SD X Adreno X1-85 3.8 TFLOPS
59.2 (40.8min) fps +3%
Dell XPS 13 9345
Qualcomm Snapdragon X Elite X1E-80-100, Qualcomm SD X Adreno X1-85 3.8 TFLOPS
57.4 (41.1min) fps
Average Qualcomm SD X Adreno X1-85 3.8 TFLOPS
  (46.1 - 61.9, n=12)
56.4 fps -2%
HP EliteBook Ultra G1q 14
Qualcomm Snapdragon X Elite X1E-78-100, Qualcomm SD X Adreno X1-85 3.8 TFLOPS
55.9 (40min) fps -3%
Medion SPRCHRGD 14 S1 Elite
Qualcomm Snapdragon X Elite X1E-78-100, Qualcomm SD X Adreno X1-85 3.8 TFLOPS
54.5 (41.5min) fps -5%
Dell XPS 13 9310 2-in-1
Intel Core i7-1165G7, Intel Iris Xe Graphics G7 96EUs
52.8 (41.6min) fps -8%
Dell XPS 13 9305 Core i5 FHD
Intel Core i5-1135G7, Intel Iris Xe Graphics G7 80EUs
45.8 (29.7min) fps -20%
Dell XPS 13 9310 OLED
Intel Core i7-1185G7, Intel Iris Xe Graphics G7 96EUs
41.6 (16.9min) fps -28%
Dell XPS 13 9310 Core i7 4K
Intel Core i7-1185G7, Intel Iris Xe Graphics G7 96EUs
38.2 (26.2min) fps -33%
Dell XPS 13 9315 2-in-1 Core i5-1230U
Intel Core i5-1230U, Intel Iris Xe Graphics G7 80EUs
37.6 (35min) fps -34%
1920x1080 ultra (3/3) best looking
Dell XPS 14 2024 OLED
Intel Core Ultra 7 155H, NVIDIA GeForce RTX 4050 Laptop GPU
103.6 (85.7min) fps +104%
Dell XPS 13 Plus 9320 i5-1240p
Intel Core i5-1240P, Intel Iris Xe Graphics G7 80EUs
66.1 (49.7min) fps +30%
Dell XPS 13 9340 Core Ultra 7
Intel Core Ultra 7 155H, Intel Arc 8-Core iGPU
65.2 (48.8min) fps +29%
Dell XPS 13 Plus 9320 Core i7-1360P
Intel Core i7-1360P, Intel Iris Xe Graphics G7 96EUs
61.6 (52.9min) fps +21%
Dell XPS 13 Plus 9320 4K
Intel Core i7-1260P, Intel Iris Xe Graphics G7 96EUs
60.6 (52.5min) fps +20%
Dell XPS 13 Plus 9320 i7-1280P OLED
Intel Core i7-1280P, Intel Iris Xe Graphics G7 96EUs
58.7 (50.7min) fps +16%
Microsoft Surface Laptop 7 13.8 Copilot+
Qualcomm Snapdragon X Elite X1E-80-100, Qualcomm SD X Adreno X1-85 3.8 TFLOPS
53.2 (39min) fps +5%
Dell XPS 13 9310 2-in-1
Intel Core i7-1165G7, Intel Iris Xe Graphics G7 96EUs
52.8 (45.1min) fps +4%
Lenovo ThinkPad T14s Gen 6 21N10007GE
Qualcomm Snapdragon X Elite X1E-78-100, Qualcomm SD X Adreno X1-85 3.8 TFLOPS
52 (38.6min) fps +3%
Medion SPRCHRGD 14 S1 Elite
Qualcomm Snapdragon X Elite X1E-78-100, Qualcomm SD X Adreno X1-85 3.8 TFLOPS
50.8 (38.5min) fps 0%
Dell XPS 13 9345
Qualcomm Snapdragon X Elite X1E-80-100, Qualcomm SD X Adreno X1-85 3.8 TFLOPS
50.7 (37.8min) fps
Average Qualcomm SD X Adreno X1-85 3.8 TFLOPS
  (42.9 - 53.8, n=12)
50.4 fps -1%
HP EliteBook Ultra G1q 14
Qualcomm Snapdragon X Elite X1E-78-100, Qualcomm SD X Adreno X1-85 3.8 TFLOPS
49.3 (35.9min) fps -3%
Dell XPS 13 9305 Core i5 FHD
Intel Core i5-1135G7, Intel Iris Xe Graphics G7 80EUs
44 (29.1min) fps -13%
Dell XPS 13 9310 OLED
Intel Core i7-1185G7, Intel Iris Xe Graphics G7 96EUs
43.4 (15.3min) fps -14%
Dell XPS 13 9310 Core i7 4K
Intel Core i7-1185G7, Intel Iris Xe Graphics G7 96EUs
38.6 (23.1min) fps -24%
Dell XPS 13 9315 2-in-1 Core i5-1230U
Intel Core i5-1230U, Intel Iris Xe Graphics G7 80EUs
34.2 (31.2min) fps -33%
Final Fantasy XV Benchmark
1280x720 Lite Quality
Dell XPS 14 2024 OLED
Intel Core Ultra 7 155H, NVIDIA GeForce RTX 4050 Laptop GPU
99.2 fps +77%
Dell XPS 13 9340 Core Ultra 7
Intel Core Ultra 7 155H, Intel Arc 8-Core iGPU
61.3 fps +9%
Microsoft Surface Laptop 7 13.8 Copilot+
Qualcomm Snapdragon X Elite X1E-80-100, Qualcomm SD X Adreno X1-85 3.8 TFLOPS
57.3 fps +2%
Dell XPS 13 9345
Qualcomm Snapdragon X Elite X1E-80-100, Qualcomm SD X Adreno X1-85 3.8 TFLOPS
56.1 fps
Medion SPRCHRGD 14 S1 Elite
Qualcomm Snapdragon X Elite X1E-78-100, Qualcomm SD X Adreno X1-85 3.8 TFLOPS
54.5 fps -3%
Average Qualcomm SD X Adreno X1-85 3.8 TFLOPS
  (43.9 - 57.6, n=12)
53.4 fps -5%
HP EliteBook Ultra G1q 14
Qualcomm Snapdragon X Elite X1E-78-100, Qualcomm SD X Adreno X1-85 3.8 TFLOPS
51 fps -9%
Lenovo ThinkPad T14s Gen 6 21N10007GE
Qualcomm Snapdragon X Elite X1E-78-100, Qualcomm SD X Adreno X1-85 3.8 TFLOPS
46.7 fps -17%
Dell XPS 13 Plus 9320 i7-1280P OLED
Intel Core i7-1280P, Intel Iris Xe Graphics G7 96EUs
46.1 fps -18%
Dell XPS 13 Plus 9320 4K
Intel Core i7-1260P, Intel Iris Xe Graphics G7 96EUs
44.7 fps -20%
Dell XPS 13 Plus 9320 Core i7-1360P
Intel Core i7-1360P, Intel Iris Xe Graphics G7 96EUs
44.5 fps -21%
Dell XPS 13 9310 2-in-1
Intel Core i7-1165G7, Intel Iris Xe Graphics G7 96EUs
36.8 fps -34%
Dell XPS 13 Plus 9320 i5-1240p
Intel Core i5-1240P, Intel Iris Xe Graphics G7 80EUs
36.3 fps -35%
Dell XPS 13 9305 Core i5 FHD
Intel Core i5-1135G7, Intel Iris Xe Graphics G7 80EUs
35.3 fps -37%
Dell XPS 13 9310 OLED
Intel Core i7-1185G7, Intel Iris Xe Graphics G7 96EUs
35 fps -38%
Dell XPS 13 9310 Core i7 4K
Intel Core i7-1185G7, Intel Iris Xe Graphics G7 96EUs
31.3 fps -44%
Dell XPS 13 9315 2-in-1 Core i5-1230U
Intel Core i5-1230U, Intel Iris Xe Graphics G7 80EUs
27 fps -52%
Dell XPS 13 9315, i5-1230U
Intel Core i5-1230U, Intel Iris Xe Graphics G7 80EUs
18.9 fps -66%
1920x1080 Standard Quality
Dell XPS 14 2024 OLED
Intel Core Ultra 7 155H, NVIDIA GeForce RTX 4050 Laptop GPU
70.8 fps +183%
Dell XPS 13 9340 Core Ultra 7
Intel Core Ultra 7 155H, Intel Arc 8-Core iGPU
36.2 fps +45%
Medion SPRCHRGD 14 S1 Elite
Qualcomm Snapdragon X Elite X1E-78-100, Qualcomm SD X Adreno X1-85 3.8 TFLOPS
25.4 fps +2%
Dell XPS 13 Plus 9320 4K
Intel Core i7-1260P, Intel Iris Xe Graphics G7 96EUs
25.3 fps +1%
Dell XPS 13 Plus 9320 i7-1280P OLED
Intel Core i7-1280P, Intel Iris Xe Graphics G7 96EUs
25.3 fps +1%
Dell XPS 13 Plus 9320 Core i7-1360P
Intel Core i7-1360P, Intel Iris Xe Graphics G7 96EUs
25.2 fps +1%
Dell XPS 13 9345
Qualcomm Snapdragon X Elite X1E-80-100, Qualcomm SD X Adreno X1-85 3.8 TFLOPS
25 fps
Microsoft Surface Laptop 7 13.8 Copilot+
Qualcomm Snapdragon X Elite X1E-80-100, Qualcomm SD X Adreno X1-85 3.8 TFLOPS
24.9 fps 0%
Average Qualcomm SD X Adreno X1-85 3.8 TFLOPS
  (20.1 - 25.4, n=12)
24.4 fps -2%
Lenovo ThinkPad T14s Gen 6 21N10007GE
Qualcomm Snapdragon X Elite X1E-78-100, Qualcomm SD X Adreno X1-85 3.8 TFLOPS
23.8 fps -5%
HP EliteBook Ultra G1q 14
Qualcomm Snapdragon X Elite X1E-78-100, Qualcomm SD X Adreno X1-85 3.8 TFLOPS
23 fps -8%
Dell XPS 13 9310 2-in-1
Intel Core i7-1165G7, Intel Iris Xe Graphics G7 96EUs
21.8 fps -13%
Dell XPS 13 9305 Core i5 FHD
Intel Core i5-1135G7, Intel Iris Xe Graphics G7 80EUs
20.3 fps -19%
Dell XPS 13 9310 OLED
Intel Core i7-1185G7, Intel Iris Xe Graphics G7 96EUs
19.9 fps -20%
Dell XPS 13 Plus 9320 i5-1240p
Intel Core i5-1240P, Intel Iris Xe Graphics G7 80EUs
19.7 fps -21%
Dell XPS 13 9310 Core i7 4K
Intel Core i7-1185G7, Intel Iris Xe Graphics G7 96EUs
18.8 fps -25%
Dell XPS 13 9315, i5-1230U
Intel Core i5-1230U, Intel Iris Xe Graphics G7 80EUs
10.8 fps -57%
1920x1080 High Quality
Dell XPS 14 2024 OLED
Intel Core Ultra 7 155H, NVIDIA GeForce RTX 4050 Laptop GPU
52.3 fps +231%
Dell XPS 13 9340 Core Ultra 7
Intel Core Ultra 7 155H, Intel Arc 8-Core iGPU
26.4 fps +67%
Dell XPS 13 Plus 9320 4K
Intel Core i7-1260P, Intel Iris Xe Graphics G7 96EUs
25.3 fps +60%
Dell XPS 13 9305 Core i5 FHD
Intel Core i5-1135G7, Intel Iris Xe Graphics G7 80EUs
20.3 fps +28%
Dell XPS 13 Plus 9320 i7-1280P OLED
Intel Core i7-1280P, Intel Iris Xe Graphics G7 96EUs
17.6 fps +11%
Dell XPS 13 Plus 9320 Core i7-1360P
Intel Core i7-1360P, Intel Iris Xe Graphics G7 96EUs
17.5 fps +11%
Dell XPS 13 9310 2-in-1
Intel Core i7-1165G7, Intel Iris Xe Graphics G7 96EUs
15.9 fps +1%
Medion SPRCHRGD 14 S1 Elite
Qualcomm Snapdragon X Elite X1E-78-100, Qualcomm SD X Adreno X1-85 3.8 TFLOPS
15.9 fps +1%
Microsoft Surface Laptop 7 13.8 Copilot+
Qualcomm Snapdragon X Elite X1E-80-100, Qualcomm SD X Adreno X1-85 3.8 TFLOPS
15.8 fps 0%
Lenovo ThinkPad T14s Gen 6 21N10007GE
Qualcomm Snapdragon X Elite X1E-78-100, Qualcomm SD X Adreno X1-85 3.8 TFLOPS
15.8 fps 0%
Dell XPS 13 9345
Qualcomm Snapdragon X Elite X1E-80-100, Qualcomm SD X Adreno X1-85 3.8 TFLOPS
15.8 fps
Average Qualcomm SD X Adreno X1-85 3.8 TFLOPS
  (12.4 - 15.9, n=12)
15.4 fps -3%
Dell XPS 13 9310 OLED
Intel Core i7-1185G7, Intel Iris Xe Graphics G7 96EUs
15.1 fps -4%
Dell XPS 13 9310 Core i7 4K
Intel Core i7-1185G7, Intel Iris Xe Graphics G7 96EUs
14.6 fps -8%
HP EliteBook Ultra G1q 14
Qualcomm Snapdragon X Elite X1E-78-100, Qualcomm SD X Adreno X1-85 3.8 TFLOPS
14.3 fps -9%
Dell XPS 13 Plus 9320 i5-1240p
Intel Core i5-1240P, Intel Iris Xe Graphics G7 80EUs
11.7 fps -26%
Dell XPS 13 9315, i5-1230U
Intel Core i5-1230U, Intel Iris Xe Graphics G7 80EUs
5.24 fps -67%
X-Plane 11.11 - 1280x720 low (fps_test=1)
Dell XPS 14 2024 OLED
Intel Core Ultra 7 155H, NVIDIA GeForce RTX 4050 Laptop GPU
109.8 fps +189%
Dell XPS 13 Plus 9320 4K
Intel Core i7-1260P, Intel Iris Xe Graphics G7 96EUs
55.5 fps +46%
Dell XPS 13 Plus 9320 i7-1280P OLED
Intel Core i7-1280P, Intel Iris Xe Graphics G7 96EUs
55.2 fps +45%
Dell XPS 13 9340 Core Ultra 7
Intel Core Ultra 7 155H, Intel Arc 8-Core iGPU
53 fps +39%
Dell XPS 13 9305 Core i5 FHD
Intel Core i5-1135G7, Intel Iris Xe Graphics G7 80EUs
43.4 fps +14%
Dell XPS 13 Plus 9320 Core i7-1360P
Intel Core i7-1360P, Intel Iris Xe Graphics G7 96EUs
42.7 fps +12%
Dell XPS 13 9345
Qualcomm Snapdragon X Elite X1E-80-100, Qualcomm SD X Adreno X1-85 3.8 TFLOPS
38 fps
Microsoft Surface Laptop 7 13.8 Copilot+
Qualcomm Snapdragon X Elite X1E-80-100, Qualcomm SD X Adreno X1-85 3.8 TFLOPS
37.8 fps -1%
Lenovo ThinkPad T14s Gen 6 21N10007GE
Qualcomm Snapdragon X Elite X1E-78-100, Qualcomm SD X Adreno X1-85 3.8 TFLOPS
36.9 fps -3%
HP EliteBook Ultra G1q 14
Qualcomm Snapdragon X Elite X1E-78-100, Qualcomm SD X Adreno X1-85 3.8 TFLOPS
36.4 fps -4%
Average Qualcomm SD X Adreno X1-85 3.8 TFLOPS
  (29.5 - 39, n=12)
36.1 fps -5%
Dell XPS 13 9315 2-in-1 Core i5-1230U
Intel Core i5-1230U, Intel Iris Xe Graphics G7 80EUs
31.2 fps -18%
Medion SPRCHRGD 14 S1 Elite
Qualcomm Snapdragon X Elite X1E-78-100, Qualcomm SD X Adreno X1-85 3.8 TFLOPS
29.9 fps -21%
Dell XPS 13 Plus 9320 i5-1240p
Intel Core i5-1240P, Intel Iris Xe Graphics G7 80EUs
28.5 fps -25%
Dell XPS 13 9310 Core i7 4K
Intel Core i7-1185G7, Intel Iris Xe Graphics G7 96EUs
26 fps -32%
Dell XPS 13 9310 OLED
Intel Core i7-1185G7, Intel Iris Xe Graphics G7 96EUs
25.1 fps -34%
Dell XPS 13 9310 2-in-1
Intel Core i7-1165G7, Intel Iris Xe Graphics G7 96EUs
23.5 fps -38%
Tiny Tina's Wonderlands
1280x720 Lowest Preset (DX12)
Dell XPS 13 9345
Qualcomm Snapdragon X Elite X1E-80-100, Qualcomm SD X Adreno X1-85 3.8 TFLOPS
72.9 fps
Average Qualcomm SD X Adreno X1-85 3.8 TFLOPS
  (67.6 - 72.9, n=2)
70.3 fps -4%
HP EliteBook Ultra G1q 14
Qualcomm Snapdragon X Elite X1E-78-100, Qualcomm SD X Adreno X1-85 3.8 TFLOPS
67.6 fps -7%
Dell XPS 13 Plus 9320 Core i7-1360P
Intel Core i7-1360P, Intel Iris Xe Graphics G7 96EUs
53.5 fps -27%
1920x1080 Low Preset (DX12)
Dell XPS 13 9345
Qualcomm Snapdragon X Elite X1E-80-100, Qualcomm SD X Adreno X1-85 3.8 TFLOPS
44.5 fps
Average Qualcomm SD X Adreno X1-85 3.8 TFLOPS
  (41.5 - 44.5, n=2)
43 fps -3%
HP EliteBook Ultra G1q 14
Qualcomm Snapdragon X Elite X1E-78-100, Qualcomm SD X Adreno X1-85 3.8 TFLOPS
41.5 fps -7%
Dell XPS 13 Plus 9320 Core i7-1360P
Intel Core i7-1360P, Intel Iris Xe Graphics G7 96EUs
29.6 fps -33%
1920x1080 Medium Preset (DX12)
Dell XPS 13 9345
Qualcomm Snapdragon X Elite X1E-80-100, Qualcomm SD X Adreno X1-85 3.8 TFLOPS
33.6 fps
Average Qualcomm SD X Adreno X1-85 3.8 TFLOPS
  (30.8 - 33.6, n=2)
32.2 fps -4%
HP EliteBook Ultra G1q 14
Qualcomm Snapdragon X Elite X1E-78-100, Qualcomm SD X Adreno X1-85 3.8 TFLOPS
30.8 fps -8%
Dell XPS 13 Plus 9320 Core i7-1360P
Intel Core i7-1360P, Intel Iris Xe Graphics G7 96EUs
23.7 fps -29%
1920x1080 High Preset (DX12)
Dell XPS 13 9345
Qualcomm Snapdragon X Elite X1E-80-100, Qualcomm SD X Adreno X1-85 3.8 TFLOPS
22.4 fps
Average Qualcomm SD X Adreno X1-85 3.8 TFLOPS
  (20.6 - 22.4, n=2)
21.5 fps -4%
HP EliteBook Ultra G1q 14
Qualcomm Snapdragon X Elite X1E-78-100, Qualcomm SD X Adreno X1-85 3.8 TFLOPS
20.6 fps -8%
Dell XPS 13 Plus 9320 Core i7-1360P
Intel Core i7-1360P, Intel Iris Xe Graphics G7 96EUs
15.2 fps -32%
1920x1080 Badass Preset (DX12)
Dell XPS 13 9345
Qualcomm Snapdragon X Elite X1E-80-100, Qualcomm SD X Adreno X1-85 3.8 TFLOPS
18 fps
Average Qualcomm SD X Adreno X1-85 3.8 TFLOPS
  (16.8 - 18, n=2)
17.4 fps -3%
HP EliteBook Ultra G1q 14
Qualcomm Snapdragon X Elite X1E-78-100, Qualcomm SD X Adreno X1-85 3.8 TFLOPS
16.8 fps -7%
Dell XPS 13 Plus 9320 Core i7-1360P
Intel Core i7-1360P, Intel Iris Xe Graphics G7 96EUs
12.2 fps -32%
Cyberpunk 2077 2.1 Phantom Liberty
1280x720 Low Preset (FSR off)
Lenovo ThinkPad T14s Gen 6 21N10007GE
Qualcomm Snapdragon X Elite X1E-78-100, Qualcomm SD X Adreno X1-85 3.8 TFLOPS
36.3 (26.4min) fps +16%
HP EliteBook Ultra G1q 14
Qualcomm Snapdragon X Elite X1E-78-100, Qualcomm SD X Adreno X1-85 3.8 TFLOPS
34.6 (25.2min) fps +11%
Medion SPRCHRGD 14 S1 Elite
Qualcomm Snapdragon X Elite X1E-78-100, Qualcomm SD X Adreno X1-85 3.8 TFLOPS
34.1 (25.5min) fps +9%
Average Qualcomm SD X Adreno X1-85 3.8 TFLOPS
  (31.3 - 36.3, n=4)
34.1 fps +9%
Dell XPS 13 9345
Qualcomm Snapdragon X Elite X1E-80-100, Qualcomm SD X Adreno X1-85 3.8 TFLOPS
31.3 (22.4min) fps
1920x1080 Low Preset (FSR off)
Dell XPS 14 2024 OLED
Intel Core Ultra 7 155H, NVIDIA GeForce RTX 4050 Laptop GPU
67.2 (55min) fps +179%
Medion SPRCHRGD 14 S1 Elite
Qualcomm Snapdragon X Elite X1E-78-100, Qualcomm SD X Adreno X1-85 3.8 TFLOPS
24.6 (19.1min) fps +2%
Dell XPS 13 9345
Qualcomm Snapdragon X Elite X1E-80-100, Qualcomm SD X Adreno X1-85 3.8 TFLOPS
24.1 (18.8min) fps
Lenovo ThinkPad T14s Gen 6 21N10007GE
Qualcomm Snapdragon X Elite X1E-78-100, Qualcomm SD X Adreno X1-85 3.8 TFLOPS
23.1 (18min) fps -4%
Microsoft Surface Laptop 7 13.8 Copilot+
Qualcomm Snapdragon X Elite X1E-80-100, Qualcomm SD X Adreno X1-85 3.8 TFLOPS
22.7 (17.6min) fps -6%
Average Qualcomm SD X Adreno X1-85 3.8 TFLOPS
  (16.3 - 24.6, n=12)
22.7 fps -6%
HP EliteBook Ultra G1q 14
Qualcomm Snapdragon X Elite X1E-78-100, Qualcomm SD X Adreno X1-85 3.8 TFLOPS
22.1 (17.2min) fps -8%
1920x1080 Medium Preset (FSR off)
Dell XPS 14 2024 OLED
Intel Core Ultra 7 155H, NVIDIA GeForce RTX 4050 Laptop GPU
50.1 (42.7min) fps +157%
Medion SPRCHRGD 14 S1 Elite
Qualcomm Snapdragon X Elite X1E-78-100, Qualcomm SD X Adreno X1-85 3.8 TFLOPS
19.6 (15.6min) fps +1%
Dell XPS 13 9345
Qualcomm Snapdragon X Elite X1E-80-100, Qualcomm SD X Adreno X1-85 3.8 TFLOPS
19.5 (15.4min) fps
Lenovo ThinkPad T14s Gen 6 21N10007GE
Qualcomm Snapdragon X Elite X1E-78-100, Qualcomm SD X Adreno X1-85 3.8 TFLOPS
19 (15.1min) fps -3%
Microsoft Surface Laptop 7 13.8 Copilot+
Qualcomm Snapdragon X Elite X1E-80-100, Qualcomm SD X Adreno X1-85 3.8 TFLOPS
18.9 (15min) fps -3%
Average Qualcomm SD X Adreno X1-85 3.8 TFLOPS
  (14.8 - 19.7, n=12)
18.6 fps -5%
HP EliteBook Ultra G1q 14
Qualcomm Snapdragon X Elite X1E-78-100, Qualcomm SD X Adreno X1-85 3.8 TFLOPS
18.3 (14.4min) fps -6%
1920x1080 High Preset (FSR off)
Dell XPS 14 2024 OLED
Intel Core Ultra 7 155H, NVIDIA GeForce RTX 4050 Laptop GPU
42.4 (36.1min) fps +151%
Medion SPRCHRGD 14 S1 Elite
Qualcomm Snapdragon X Elite X1E-78-100, Qualcomm SD X Adreno X1-85 3.8 TFLOPS
17.3 (13.6min) fps +2%
Dell XPS 13 9345
Qualcomm Snapdragon X Elite X1E-80-100, Qualcomm SD X Adreno X1-85 3.8 TFLOPS
16.9 (13.3min) fps
Microsoft Surface Laptop 7 13.8 Copilot+
Qualcomm Snapdragon X Elite X1E-80-100, Qualcomm SD X Adreno X1-85 3.8 TFLOPS
16.4 (12.8min) fps -3%
Average Qualcomm SD X Adreno X1-85 3.8 TFLOPS
  (12.8 - 17.3, n=11)
16.2 fps -4%
Lenovo ThinkPad T14s Gen 6 21N10007GE
Qualcomm Snapdragon X Elite X1E-78-100, Qualcomm SD X Adreno X1-85 3.8 TFLOPS
16.1 (12.6min) fps -5%
1920x1080 Ultra Preset (FSR off)
Dell XPS 14 2024 OLED
Intel Core Ultra 7 155H, NVIDIA GeForce RTX 4050 Laptop GPU
35.8 (30min) fps +144%
Dell XPS 13 9345
Qualcomm Snapdragon X Elite X1E-80-100, Qualcomm SD X Adreno X1-85 3.8 TFLOPS
14.7 (11.6min) fps
Microsoft Surface Laptop 7 13.8 Copilot+
Qualcomm Snapdragon X Elite X1E-80-100, Qualcomm SD X Adreno X1-85 3.8 TFLOPS
14.3 (11.1min) fps -3%
Medion SPRCHRGD 14 S1 Elite
Qualcomm Snapdragon X Elite X1E-78-100, Qualcomm SD X Adreno X1-85 3.8 TFLOPS
14.3 (11.5min) fps -3%
Average Qualcomm SD X Adreno X1-85 3.8 TFLOPS
  (11.2 - 14.9, n=11)
14.1 fps -4%
Lenovo ThinkPad T14s Gen 6 21N10007GE
Qualcomm Snapdragon X Elite X1E-78-100, Qualcomm SD X Adreno X1-85 3.8 TFLOPS
13.9 (10.2min) fps -5%
GTA V
1024x768 Lowest Settings possible
Dell XPS 13 9340 Core Ultra 7
Intel Core Ultra 7 155H, Intel Arc 8-Core iGPU
157.8 (4.43min, 83.3P1) fps +64%
Dell XPS 13 Plus 9320 Core i7-1360P
Intel Core i7-1360P, Intel Iris Xe Graphics G7 96EUs
130.6 (21.7min, 71.4P1) fps +36%
Dell XPS 13 Plus 9320 i7-1280P OLED
Intel Core i7-1280P, Intel Iris Xe Graphics G7 96EUs
123.7 (11.7min, 76.9P1) fps +28%
Dell XPS 13 Plus 9320 4K
Intel Core i7-1260P, Intel Iris Xe Graphics G7 96EUs
115.1 (17.6min, 76.9P1) fps +20%
Lenovo ThinkPad T14s Gen 6 21N10007GE
Qualcomm Snapdragon X Elite X1E-78-100, Qualcomm SD X Adreno X1-85 3.8 TFLOPS
102.6 (10.7min, 52.6P1) fps +7%
Microsoft Surface Laptop 7 13.8 Copilot+
Qualcomm Snapdragon X Elite X1E-80-100, Qualcomm SD X Adreno X1-85 3.8 TFLOPS
100.6 (1.11min, 33.3P1) fps +4%
Dell XPS 13 9310 2-in-1
Intel Core i7-1165G7, Intel Iris Xe Graphics G7 96EUs
96.7 (16.2min, 58.8P1) fps 0%
Dell XPS 13 9345
Qualcomm Snapdragon X Elite X1E-80-100, Qualcomm SD X Adreno X1-85 3.8 TFLOPS
96.3 (1.239min, 33.3P1) fps
Average Qualcomm SD X Adreno X1-85 3.8 TFLOPS
  (71.8 - 104.2, n=11)
95.6 fps -1%
Medion SPRCHRGD 14 S1 Elite
Qualcomm Snapdragon X Elite X1E-78-100, Qualcomm SD X Adreno X1-85 3.8 TFLOPS
89.8 (1.166min, 32.3P1) fps -7%
Dell XPS 13 9305 Core i5 FHD
Intel Core i5-1135G7, Intel Iris Xe Graphics G7 80EUs
81 fps -16%
Dell XPS 13 9310 Core i7 4K
Intel Core i7-1185G7, Intel Iris Xe Graphics G7 96EUs
80.8 (14.5min, 40P1) fps -16%
Dell XPS 13 9315 2-in-1 Core i5-1230U
Intel Core i5-1230U, Intel Iris Xe Graphics G7 80EUs
60.9 (8.61min, 28.6P1) fps -37%
1920x1080 Lowest Settings possible
Dell XPS 13 Plus 9320 i7-1280P OLED
Intel Core i7-1280P, Intel Iris Xe Graphics G7 96EUs
101.7 (13.1min, 66.7P1) fps +12%
Dell XPS 13 Plus 9320 Core i7-1360P
Intel Core i7-1360P, Intel Iris Xe Graphics G7 96EUs
95.6 (11.2min, 52.6P1) fps +6%
Dell XPS 13 9345
Qualcomm Snapdragon X Elite X1E-80-100, Qualcomm SD X Adreno X1-85 3.8 TFLOPS
90.5 (11min, 50P1) fps
Average Qualcomm SD X Adreno X1-85 3.8 TFLOPS
  (79.3 - 90.5, n=3)
84.2 fps -7%
Lenovo ThinkPad T14s Gen 6 21N10007GE
Qualcomm Snapdragon X Elite X1E-78-100, Qualcomm SD X Adreno X1-85 3.8 TFLOPS
82.7 (10min, 45.5P1) fps -9%
Medion SPRCHRGD 14 S1 Elite
Qualcomm Snapdragon X Elite X1E-78-100, Qualcomm SD X Adreno X1-85 3.8 TFLOPS
79.3 (8.86min, 41.7P1) fps -12%
Dell XPS 13 9310 2-in-1
Intel Core i7-1165G7, Intel Iris Xe Graphics G7 96EUs
79 (14.5min, 52.6P1) fps -13%
Dell XPS 13 9310 Core i7 4K
Intel Core i7-1185G7, Intel Iris Xe Graphics G7 96EUs
64.7 (14.8min, 31.3P1) fps -29%
Dell XPS 13 9315 2-in-1 Core i5-1230U
Intel Core i5-1230U, Intel Iris Xe Graphics G7 80EUs
36.2 (8.37min, 16.9P1) fps -60%
1366x768 Normal/Off AF:4x
Dell XPS 13 9340 Core Ultra 7
Intel Core Ultra 7 155H, Intel Arc 8-Core iGPU
129.8 (4.39min, 58.8P1) fps +38%
Dell XPS 14 2024 OLED
Intel Core Ultra 7 155H, NVIDIA GeForce RTX 4050 Laptop GPU
119.9 (16.5min, 111.1P1) fps +27%
Dell XPS 13 Plus 9320 i7-1280P OLED
Intel Core i7-1280P, Intel Iris Xe Graphics G7 96EUs
108.7 (12.4min, 62.5P1) fps +15%
Dell XPS 13 Plus 9320 Core i7-1360P
Intel Core i7-1360P, Intel Iris Xe Graphics G7 96EUs
105.3 (6.65min, 55.6P1) fps +12%
Dell XPS 13 Plus 9320 4K
Intel Core i7-1260P, Intel Iris Xe Graphics G7 96EUs
102.1 (18.6min, 66.7P1) fps +8%
Microsoft Surface Laptop 7 13.8 Copilot+
Qualcomm Snapdragon X Elite X1E-80-100, Qualcomm SD X Adreno X1-85 3.8 TFLOPS
96.3 (5.13min, 47.6P1) fps +2%
Dell XPS 13 9345
Qualcomm Snapdragon X Elite X1E-80-100, Qualcomm SD X Adreno X1-85 3.8 TFLOPS
94.2 (5.6min, 47.6P1) fps
Dell XPS 13 Plus 9320 i5-1240p
Intel Core i5-1240P, Intel Iris Xe Graphics G7 80EUs
91 fps -3%
Average Qualcomm SD X Adreno X1-85 3.8 TFLOPS
  (66.7 - 97.7, n=11)
89.5 fps -5%
Lenovo ThinkPad T14s Gen 6 21N10007GE
Qualcomm Snapdragon X Elite X1E-78-100, Qualcomm SD X Adreno X1-85 3.8 TFLOPS
89.2 (4.95min, 43.5P1) fps -5%
Medion SPRCHRGD 14 S1 Elite
Qualcomm Snapdragon X Elite X1E-78-100, Qualcomm SD X Adreno X1-85 3.8 TFLOPS
83.2 (5.39min, 40P1) fps -12%
Dell XPS 13 9310 2-in-1
Intel Core i7-1165G7, Intel Iris Xe Graphics G7 96EUs
80.5 (13.1min, 47.6P1) fps -15%
Dell XPS 13 9305 Core i5 FHD
Intel Core i5-1135G7, Intel Iris Xe Graphics G7 80EUs
76 fps -19%
Dell XPS 13 9310 Core i7 4K
Intel Core i7-1185G7, Intel Iris Xe Graphics G7 96EUs
64.6 (14.2min, 29.4P1) fps -31%
Dell XPS 13 9315 2-in-1 Core i5-1230U
Intel Core i5-1230U, Intel Iris Xe Graphics G7 80EUs
38.4 (8.67min, 21.3P1) fps -59%
Dell XPS 13 9315, i5-1230U
Intel Core i5-1230U, Intel Iris Xe Graphics G7 80EUs
31 fps -67%
1920x1080 Normal/Off AF:4x
Dell XPS 13 Plus 9320 i7-1280P OLED
Intel Core i7-1280P, Intel Iris Xe Graphics G7 96EUs
90.7 (13min, 55.6P1) fps +3%
Dell XPS 13 Plus 9320 Core i7-1360P
Intel Core i7-1360P, Intel Iris Xe Graphics G7 96EUs
90.3 (13.3min, 52.6P1) fps +3%
Dell XPS 13 9345
Qualcomm Snapdragon X Elite X1E-80-100, Qualcomm SD X Adreno X1-85 3.8 TFLOPS
87.7 (9.79min, 50P1) fps
Average Qualcomm SD X Adreno X1-85 3.8 TFLOPS
  (72.9 - 87.7, n=3)
79.6 fps -9%
Lenovo ThinkPad T14s Gen 6 21N10007GE
Qualcomm Snapdragon X Elite X1E-78-100, Qualcomm SD X Adreno X1-85 3.8 TFLOPS
78.3 (9.49min, 41.7P1) fps -11%
Medion SPRCHRGD 14 S1 Elite
Qualcomm Snapdragon X Elite X1E-78-100, Qualcomm SD X Adreno X1-85 3.8 TFLOPS
72.9 (10.9min, 40P1) fps -17%
Dell XPS 13 9310 2-in-1
Intel Core i7-1165G7, Intel Iris Xe Graphics G7 96EUs
69.8 (12.6min, 45.5P1) fps -20%
Dell XPS 13 9310 Core i7 4K
Intel Core i7-1185G7, Intel Iris Xe Graphics G7 96EUs
60.7 (13.7min, 27.8P1) fps -31%
Dell XPS 13 9315 2-in-1 Core i5-1230U
Intel Core i5-1230U, Intel Iris Xe Graphics G7 80EUs
30 (8.55min, 15.4P1) fps -66%
1920x1080 High/On (Advanced Graphics Off) AA:2xMSAA + FX AF:8x
Dell XPS 14 2024 OLED
Intel Core Ultra 7 155H, NVIDIA GeForce RTX 4050 Laptop GPU
106 (7.9min, 55.6P1) fps +114%
Microsoft Surface Laptop 7 13.8 Copilot+
Qualcomm Snapdragon X Elite X1E-80-100, Qualcomm SD X Adreno X1-85 3.8 TFLOPS
50 (0.665min, 16.1P1) fps +1%
Dell XPS 13 9345
Qualcomm Snapdragon X Elite X1E-80-100, Qualcomm SD X Adreno X1-85 3.8 TFLOPS
49.5 (0.727min, 15.9P1) fps
Medion SPRCHRGD 14 S1 Elite
Qualcomm Snapdragon X Elite X1E-78-100, Qualcomm SD X Adreno X1-85 3.8 TFLOPS
47.5 (0.653min, 14.3P1) fps -4%
Average Qualcomm SD X Adreno X1-85 3.8 TFLOPS
  (34.7 - 50, n=11)
46.3 fps -6%
Lenovo ThinkPad T14s Gen 6 21N10007GE
Qualcomm Snapdragon X Elite X1E-78-100, Qualcomm SD X Adreno X1-85 3.8 TFLOPS
42.1 (0.601min, 12.2P1) fps -15%
Dell XPS 13 9340 Core Ultra 7
Intel Core Ultra 7 155H, Intel Arc 8-Core iGPU
32.8 (2.29min, 20.8P1) fps -34%
Dell XPS 13 Plus 9320 i5-1240p
Intel Core i5-1240P, Intel Iris Xe Graphics G7 80EUs
32 fps -35%
Dell XPS 13 Plus 9320 i7-1280P OLED
Intel Core i7-1280P, Intel Iris Xe Graphics G7 96EUs
27.6 (7.19min, 18.5P1) fps -44%
Dell XPS 13 Plus 9320 Core i7-1360P
Intel Core i7-1360P, Intel Iris Xe Graphics G7 96EUs
26.6 (7.8min, 18.5P1) fps -46%
Dell XPS 13 Plus 9320 4K
Intel Core i7-1260P, Intel Iris Xe Graphics G7 96EUs
26.2 (8.16min, 20P1) fps -47%
Dell XPS 13 9310 2-in-1
Intel Core i7-1165G7, Intel Iris Xe Graphics G7 96EUs
25.4 (6.93min, 18.5P1) fps -49%
Dell XPS 13 9305 Core i5 FHD
Intel Core i5-1135G7, Intel Iris Xe Graphics G7 80EUs
23 fps -54%
Dell XPS 13 9310 Core i7 4K
Intel Core i7-1185G7, Intel Iris Xe Graphics G7 96EUs
20.5 (5.61min, 13P1) fps -59%
Dell XPS 13 9315 2-in-1 Core i5-1230U
Intel Core i5-1230U, Intel Iris Xe Graphics G7 80EUs
11.7 (3.09min, 5.59P1) fps -76%
Dell XPS 13 9315, i5-1230U
Intel Core i5-1230U, Intel Iris Xe Graphics G7 80EUs
10 fps -80%
1920x1080 Highest Settings possible AA:4xMSAA + FX AF:16x
Dell XPS 14 2024 OLED
Intel Core Ultra 7 155H, NVIDIA GeForce RTX 4050 Laptop GPU
62.7 (6.01min, 40P1) fps +196%
Microsoft Surface Laptop 7 13.8 Copilot+
Qualcomm Snapdragon X Elite X1E-80-100, Qualcomm SD X Adreno X1-85 3.8 TFLOPS
21.5 (2.47min, 13P1) fps +1%
Dell XPS 13 9345
Qualcomm Snapdragon X Elite X1E-80-100, Qualcomm SD X Adreno X1-85 3.8 TFLOPS
21.2 (2.94min, 12.2P1) fps
Medion SPRCHRGD 14 S1 Elite
Qualcomm Snapdragon X Elite X1E-78-100, Qualcomm SD X Adreno X1-85 3.8 TFLOPS
20.9 (3.9min, 12.7P1) fps -1%
Average Qualcomm SD X Adreno X1-85 3.8 TFLOPS
  (16.2 - 21.5, n=10)
20.1 fps -5%
Lenovo ThinkPad T14s Gen 6 21N10007GE
Qualcomm Snapdragon X Elite X1E-78-100, Qualcomm SD X Adreno X1-85 3.8 TFLOPS
18.1 (3.68min, 11.1P1) fps -15%
Dell XPS 13 9340 Core Ultra 7
Intel Core Ultra 7 155H, Intel Arc 8-Core iGPU
14.7 (2.21min, 10.8P1) fps -31%
Dell XPS 13 Plus 9320 Core i7-1360P
Intel Core i7-1360P, Intel Iris Xe Graphics G7 96EUs
11.6 (4.4min, 6.99P1) fps -45%
Dell XPS 13 Plus 9320 i7-1280P OLED
Intel Core i7-1280P, Intel Iris Xe Graphics G7 96EUs
11.5 (4.27min, 7.69P1) fps -46%
Dell XPS 13 Plus 9320 4K
Intel Core i7-1260P, Intel Iris Xe Graphics G7 96EUs
11 (4.3min, 8.62P1) fps -48%
Dell XPS 13 9310 2-in-1
Intel Core i7-1165G7, Intel Iris Xe Graphics G7 96EUs
10 (3.09min, 7.58P1) fps -53%
Dell XPS 13 9310 Core i7 4K
Intel Core i7-1185G7, Intel Iris Xe Graphics G7 96EUs
9.75 (2.72min, 6.99P1) fps -54%
Dell XPS 13 9305 Core i5 FHD
Intel Core i5-1135G7, Intel Iris Xe Graphics G7 80EUs
9.7 fps -54%
Dell XPS 13 9315 2-in-1 Core i5-1230U
Intel Core i5-1230U, Intel Iris Xe Graphics G7 80EUs
6.06 (1.275min, 2.14P1) fps -71%

Cyberpunk 2077 ultra FPS Chart

012345678910111213Tooltip
Dell XPS 13 9345 SD X Elite X1E-80-100, Adreno X1-85 3.8 TFLOPS: Ø12.9 (12.4-13.5)
lågmed.högultra
GTA V (2015) 96.3 94.2 49.5 21.2
The Witcher 3 (2015) 104 74.5 43.7 19.2
Dota 2 Reborn (2015) 80 60.7 57.4 50.7
Final Fantasy XV Benchmark (2018) 56.1 25 15.8
X-Plane 11.11 (2018) 38
Far Cry 5 (2018) 42 33 31 28
Strange Brigade (2018) 123.9 50.8 41.8 33.9
Tiny Tina's Wonderlands (2022) 44.5 33.6 22.4 18
F1 22 (2022) 62.9 55.4 38.5
Cyberpunk 2077 2.1 Phantom Liberty (2023) 24.1 19.5 16.9 14.7

Utsläpp

Systemljud - mer avslappnad fläktaktivitet

Fläktljudet är något tystare än Intel Core Ultra 7-modellen i den meningen att de interna fläktarna ökar långsammare som svar på ökade belastningar. Annars skulle fläktarna mellan de båda modellerna ligga på liknande maximala varvtal när de kör krävande belastningar under längre perioder. Till exempel skulle fläktljudet toppa på 32,8 dB(A) mot slutet av den första 90-sekunders benchmark-scenen i 3DMark 06 jämfört med 37,4 dB(A) på Intel-modellen under liknande förhållanden. När man körde spel som Cyberpunk 2077 skulle dock båda modellerna var och en lägga sig i det låga 40 dB(A)-området. Det Qualcomm-drivna systemet är inte nödvändigtvis tystare när det körs med hög belastning, men det är också mindre troligt att du märker någon fläktaktivitet när du surfar på nätet eller strömmar video.

Dubbla 35-40 mm fläktar med ett värmerör i koppar mellan dem
Vi kan inte märka av något elektroniskt brus eller spolgnissel från vår enhet
Fläktens ljudprofil (Vit: Bakgrund, Röd: System i viloläge, Blå: 3DMark 06, Orange: Cyberpunk 2077, Grön: Prime95+FurMark stress)

Ljudnivå

Låg belastning
22.9 / 22.9 / 22.9 dB(A)
Hög belastning
32.8 / 40.6 dB(A)
  red to green bar
 
 
30 dB
tyst
40 dB(A)
hörbar
50 dB(A)
högt ljud
 
min: dark, med: mid, max: light   Earthworks M23R, Arta (15 cm avstånd)   environment noise: 22.9 dB(A)
dB(A) 0102030405060708090Deep BassMiddle BassHigh BassLower RangeMidsHigher MidsLower HighsMid HighsUpper HighsSuper Highs2036.133.135.933.235.92523.222.524.622.326.93121.321.120.718.424.24019.519.918.417.724.45020.52618.418.521.66318.923.918.819.222.28019.22116.818.123.610019.118.915.617.221.512516.215.613.313.418.116019.819.113.613.120.120019.516.712.712.919.925020.517.311.311.120.531525.32011.610.925.440026.721.91212.126.550028.222.210.41127.663029.221.710.110.128.580027.218.89.71026.9100026.320.29.79.526.6125027.320.19.69.427.6160028.220.79.89.728.5200029.42210.210.329.5250029.521.910.210.429.6315029.322111129400029.221.611.311.429.1500031.121.311.611.530.9630030.32011.811.530.2800025.71611.811.725.5100002412.811.811.723.71250017.412.411.711.517.1160001512.610.910.914.6SPL40.632.822.922.940.5N3.51.70.40.43.5median 26.7median 20median 11.3median 11.1median 26.6Delta4.42.70.80.74.1hearing rangehide median Fan NoiseDell XPS 13 9345
Dell XPS 13 9345
Adreno X1-85 3.8 TFLOPS, SD X Elite X1E-80-100
Dell XPS 13 9340 Core Ultra 7
Arc 8-Core, Ultra 7 155H, Micron 2550 512GB
Microsoft Surface Laptop 7 13.8 Copilot+
Adreno X1-85 3.8 TFLOPS, SD X Elite X1E-80-100, Samsung MZ9L4512HBLU-00BMV
Lenovo ThinkBook 13x G4 21KR0008GE
Arc 7-Core, Ultra 5 125H, Samsung PM9C1a MZAL8512HDLU
HP EliteBook Ultra G1q 14
Adreno X1-85 3.8 TFLOPS, SD X Elite X1E-78-100, SK hynix PC801 HFS512GEJ9X101N BF
Asus ZenBook S13 OLED UX5304
Iris Xe G7 96EUs, i7-1355U, Samsung PM9A1 MZVL21T0HCLR
Noise
-10%
4%
-7%
4%
-4%
off / environment *
22.9
25.1
-10%
23.8
-4%
24.5
-7%
23.4
-2%
23.3
-2%
Idle Minimum *
22.9
25.1
-10%
23.8
-4%
24.5
-7%
23.4
-2%
23.3
-2%
Idle Average *
22.9
25.1
-10%
23.8
-4%
24.5
-7%
23.4
-2%
23.3
-2%
Idle Maximum *
22.9
25.1
-10%
23.8
-4%
27.1
-18%
24.3
-6%
23.3
-2%
Load Average *
32.8
37.4
-14%
26
21%
33.3
-2%
25
24%
37.7
-15%
Cyberpunk 2077 ultra *
40.6
31.5
22%
Load Maximum *
40.6
42.5
-5%
40.3
1%
40.7
-0%
34.8
14%
40.1
1%
Witcher 3 ultra *
42.5
36.8
30.6
40.1

* ... smaller is better

Temperatur

Yttemperaturerna ligger mycket nära vad vi registrerade på den Intel-drivna XPS 13 9340 för att visa att Qualcomm-modellen inte körs märkbart varmare eller kallare trots processorbytet. Heta fläckar mot mitten av systemet kan nå upp till 45 C, vilket är liknande Intel-modellen när båda kör krävande belastningar under längre perioder. Genomsnittstemperaturerna är svalare än vad vi registrerade på Microsoft Surface Laptop 7 13.8 men varmare än på HP EliteBook Ultra G1q 14 båda med liknande Snapdragon Elite-processorer.

Dubbelt bakre avgasrör
AC-adaptern kan bli ganska varm, över 53 °C, när den körs med krävande belastning
Hög belastning
 38.6 °C45.2 °C40.6 °C 
 32 °C36.6 °C31.6 °C 
 34.4 °C33.6 °C32.8 °C 
Max: 45.2 °C
Medel: 36.2 °C
42.4 °C44.2 °C42 °C
37 °C41.4 °C38.8 °C
33.4 °C35.4 °C36.8 °C
Max: 44.2 °C
Medel: 39 °C
Strömförsörjning (max.)  52.6 °C | Rumstemperatur 20 °C | Fluke 62 Mini IR Thermometer
(±) The average temperature for the upper side under maximal load is 36.2 °C / 97 F, compared to the average of 30.8 °C / 87 F for the devices in the class Subnotebook.
(-) The maximum temperature on the upper side is 45.2 °C / 113 F, compared to the average of 35.9 °C / 97 F, ranging from 21.4 to 59 °C for the class Subnotebook.
(±) The bottom heats up to a maximum of 44.2 °C / 112 F, compared to the average of 39.4 °C / 103 F
(+) In idle usage, the average temperature for the upper side is 29.1 °C / 84 F, compared to the device average of 30.8 °C / 87 F.
(+) The palmrests and touchpad are reaching skin temperature as a maximum (34.4 °C / 93.9 F) and are therefore not hot.
(-) The average temperature of the palmrest area of similar devices was 28.3 °C / 82.9 F (-6.1 °C / -11 F).
System i viloläge (C-lock)
System i viloläge (D-lock)
Prime95+FurMark stress (C-omslag)
Prime95+FurMark stress (D-omslag)
Dell XPS 13 9345
Qualcomm Snapdragon X Elite X1E-80-100, Qualcomm SD X Adreno X1-85 3.8 TFLOPS
Dell XPS 13 9340 Core Ultra 7
Intel Core Ultra 7 155H, Intel Arc 8-Core iGPU
Microsoft Surface Laptop 7 13.8 Copilot+
Qualcomm Snapdragon X Elite X1E-80-100, Qualcomm SD X Adreno X1-85 3.8 TFLOPS
Lenovo ThinkBook 13x G4 21KR0008GE
Intel Core Ultra 5 125H, Intel Arc 7-Core iGPU
HP EliteBook Ultra G1q 14
Qualcomm Snapdragon X Elite X1E-78-100, Qualcomm SD X Adreno X1-85 3.8 TFLOPS
Asus ZenBook S13 OLED UX5304
Intel Core i7-1355U, Intel Iris Xe Graphics G7 96EUs
Heat
12%
9%
9%
4%
6%
Maximum Upper Side *
45.2
41
9%
47.1
-4%
43.1
5%
40.8
10%
43.1
5%
Maximum Bottom *
44.2
43.5
2%
44.6
-1%
39.2
11%
40.4
9%
45
-2%
Idle Upper Side *
30.4
25.3
17%
24.7
19%
28.3
7%
32.2
-6%
27.3
10%
Idle Bottom *
31.6
25.5
19%
24.5
22%
28
11%
31.2
1%
27.8
12%

* ... smaller is better

Högtalare

Quad-högtalarna består av 2x 2 W huvudhögtalare + 2x 2 W diskanthögtalare för totalt 8 W
Maxvolymen är hyfsad och ljudkvaliteten är förvånansvärt välbalanserad för en så liten formfaktor
dB(A) 0102030405060708090Deep BassMiddle BassHigh BassLower RangeMidsHigher MidsLower HighsMid HighsUpper HighsSuper Highs2035.935.935.92523.324.623.33120.920.720.94020.618.420.65019.518.419.56321.118.821.18025.916.825.910040.415.640.412554.913.354.916062.213.662.220062.712.762.725064.411.364.431568.611.668.640069.81269.850070.310.470.363068.310.168.380066.69.766.6100072.19.772.1125070.79.670.7160071.69.871.6200070.510.270.5250068.710.268.7315070.71170.7400070.211.370.2500071.811.671.8630068.811.868.8800069.711.869.71000071.711.871.7125006511.7651600062.410.962.4SPL82.322.982.3N58.90.458.9median 68.8median 11.3median 68.8Delta3.70.83.726.325.821.422.12624.925.127.622.532.523.448.72655.818.860.922.167.2267019.372.317.674.217.774.319.575.31571.711.871.311.27410.574.21072.710.17210.67210.97511.374.811.671.71269.71269.612.371.112.669.61270.111.269.824.784.70.666.6median 12median 71.73.42.2hearing rangehide median Pink NoiseDell XPS 13 9345Apple MacBook Pro 16 2021 M1 Pro
Frequency diagram (checkboxes can be checked and unchecked to compare devices)
Dell XPS 13 9345 audio analysis

(+) | speakers can play relatively loud (82.3 dB)
Bass 100 - 315 Hz
(±) | reduced bass - on average 9.9% lower than median
(±) | linearity of bass is average (12.4% delta to prev. frequency)
Mids 400 - 2000 Hz
(+) | balanced mids - only 1.9% away from median
(+) | mids are linear (3.2% delta to prev. frequency)
Highs 2 - 16 kHz
(+) | balanced highs - only 1.5% away from median
(+) | highs are linear (3% delta to prev. frequency)
Overall 100 - 16.000 Hz
(+) | overall sound is linear (8.2% difference to median)
Compared to same class
» 1% of all tested devices in this class were better, 1% similar, 98% worse
» The best had a delta of 5%, average was 19%, worst was 53%
Compared to all devices tested
» 1% of all tested devices were better, 1% similar, 98% worse
» The best had a delta of 4%, average was 25%, worst was 134%

Apple MacBook Pro 16 2021 M1 Pro audio analysis

(+) | speakers can play relatively loud (84.7 dB)
Bass 100 - 315 Hz
(+) | good bass - only 3.8% away from median
(+) | bass is linear (5.2% delta to prev. frequency)
Mids 400 - 2000 Hz
(+) | balanced mids - only 1.3% away from median
(+) | mids are linear (2.1% delta to prev. frequency)
Highs 2 - 16 kHz
(+) | balanced highs - only 1.9% away from median
(+) | highs are linear (2.7% delta to prev. frequency)
Overall 100 - 16.000 Hz
(+) | overall sound is linear (4.6% difference to median)
Compared to same class
» 0% of all tested devices in this class were better, 0% similar, 100% worse
» The best had a delta of 5%, average was 18%, worst was 45%
Compared to all devices tested
» 0% of all tested devices were better, 0% similar, 100% worse
» The best had a delta of 4%, average was 25%, worst was 134%

Energiförvaltning

Strömförbrukning

Mätningar av energiförbrukningen visar några intressanta resultat jämfört med Core Ultra 7 XPS 13. Vid medelhög eller lägre belastning kräver vår Snapdragon XPS 13 genomgående mindre ström än Intel-versionen, vilket banar väg för längre batteritid, vilket exemplifieras i nästa avsnitt nedan. När vi kör mer krävande belastningar som spel är dock den genomsnittliga förbrukningen ungefär densamma på cirka 40 W vardera, även om Core Ultra 7 generellt sett erbjuder snabbare grafikprestanda.

Förbrukningen när Prime95 körs för att stressa processorn visar att Snapdragon-modellen kräver mer ström än Intel-modellen i genomsnitt, eftersom den senare stryps mer brant över tid. Å andra sidan skulle förbrukningen när man kör FurMark för att stressa GPU:n i genomsnitt bara vara 18 W jämfört med 34 W eller högre på Intel-modellen. Detta tyder på att Qualcomm kanske ägnar mindre yta eller kiselbudget åt sin integrerade GPU-design än den konkurrerande Arc 8-serien som både är kraftfullare och mer krävande i genomsnitt.

Maximal förbrukning kan nå 64 W från den extra lilla (~6,5 x 5,5 x 2,3 cm) 65 W USB-C AC-adaptern precis som på Intel-modellen.

3DMark 06 förbrukning
Förbrukningen ökade till 64 W när Prime95-stress initierades för att sedan sjunka till 52 W några sekunder senare, vilket visar att höga klockfrekvenser är kortvariga
Cyberpunk 2077 1080p Ultrakonsumtion
Prime95+FurMark stress initierad vid 10 sekunders markering
Strömförbrukning
Av/Standbydarklight 0.29 / 0.8 Watt
Låg belastningdarkmidlight 2.8 / 4.9 / 5.7 Watt
Hög belastning midlight 40.6 / 64 Watt
 color bar
Förklaring: min: dark, med: mid, max: light        Metrahit Energy
Dell XPS 13 9345
SD X Elite X1E-80-100, Adreno X1-85 3.8 TFLOPS, , IPS, 1920x1200, 13.4"
Dell XPS 13 9340 Core Ultra 7
Ultra 7 155H, Arc 8-Core, Micron 2550 512GB, IPS, 1920x1200, 13.4"
Microsoft Surface Laptop 7 13.8 Copilot+
SD X Elite X1E-80-100, Adreno X1-85 3.8 TFLOPS, Samsung MZ9L4512HBLU-00BMV, IPS, 2304x1536, 13.8"
Lenovo ThinkBook 13x G4 21KR0008GE
Ultra 5 125H, Arc 7-Core, Samsung PM9C1a MZAL8512HDLU, IPS, 2880x1920, 13.5"
HP EliteBook Ultra G1q 14
SD X Elite X1E-78-100, Adreno X1-85 3.8 TFLOPS, SK hynix PC801 HFS512GEJ9X101N BF, IPS, 2240x1400, 14"
Asus ZenBook S13 OLED UX5304
i7-1355U, Iris Xe G7 96EUs, Samsung PM9A1 MZVL21T0HCLR, OLED, 2880x1800, 13.3"
Power Consumption
-27%
11%
-48%
11%
-43%
Idle Minimum *
2.8
3.8
-36%
1.4
50%
5.4
-93%
2.5
11%
5.8
-107%
Idle Average *
4.9
7
-43%
6.3
-29%
7.8
-59%
5.7
-16%
8.5
-73%
Idle Maximum *
5.7
7.3
-28%
7.6
-33%
8.9
-56%
5.8
-2%
8.8
-54%
Load Average *
40.6
52.6
-30%
26.9
34%
49.4
-22%
24.2
40%
35.1
14%
Cyberpunk 2077 ultra external monitor *
39.4
26.8
32%
Cyberpunk 2077 ultra *
40.7
38.5
5%
33.5
18%
Load Maximum *
64
62.7
2%
40.7
36%
68.8
-8%
66.4
-4%
59.5
7%
Witcher 3 ultra *
38.3
44.4
23.1
27.6

* ... smaller is better

Power Consumption Cyberpunk / Stress Test

051015202530354045505560Tooltip
Dell XPS 13 9345 SD X Elite X1E-80-100, Adreno X1-85 3.8 TFLOPS; 1280x720 Prime95 28.10 and Furmark 1.25: Ø57.8 (55-63.6)
Dell XPS 13 9340 Core Ultra 7 Ultra 7 155H, Arc 8-Core; 1280x720 Prime95 28.10 and Furmark 1.25: Ø45.9 (36.1-62.7)
Dell XPS 13 9345 SD X Elite X1E-80-100, Adreno X1-85 3.8 TFLOPS; Idle 150cd/m2: Ø3.37 (2.99-5.36)
Dell XPS 13 9340 Core Ultra 7 Ultra 7 155H, Arc 8-Core; Idle 150cd/m2: Ø5.65 (4.77-8.8)
Dell XPS 13 9345 SD X Elite X1E-80-100, Adreno X1-85 3.8 TFLOPS; Cyberpunk 2077 FHD ultra no FSR 150cd: Ø40.7 (39.3-44.4)

Power Consumption external Monitor

051015202530354045505560Tooltip
Dell XPS 13 9345 SD X Elite X1E-80-100, Adreno X1-85 3.8 TFLOPS; Prime95 V2810 Stress (external Monitor): Ø54.2 (47.8-63.6)
Dell XPS 13 9340 Core Ultra 7 Ultra 7 155H, Arc 8-Core; Prime95 V2810 Stress (external Monitor): Ø47.3 (35.8-62.4)
Dell XPS 13 9345 SD X Elite X1E-80-100, Adreno X1-85 3.8 TFLOPS; Cinebench R15 Multi (external Monitor): Ø57.9 (50.5-63.6)
Dell XPS 13 9340 Core Ultra 7 Ultra 7 155H, Arc 8-Core; Cinebench R15 Multi (external Monitor): Ø60.7 (56.8-61.4)
Dell XPS 13 9345 SD X Elite X1E-80-100, Adreno X1-85 3.8 TFLOPS; 1280x720 FurMark 1.19 GPU Stress Test (external Monitor): Ø19.9 (17.2-24.2)
Dell XPS 13 9340 Core Ultra 7 Ultra 7 155H, Arc 8-Core; 1280x720 FurMark 1.19 GPU Stress Test (external Monitor): Ø40.3 (32.6-57.5)
Dell XPS 13 9345 SD X Elite X1E-80-100, Adreno X1-85 3.8 TFLOPS; Idle 1min (external Monitor): Ø3.06 (2.67-4.66)
Dell XPS 13 9340 Core Ultra 7 Ultra 7 155H, Arc 8-Core; Idle 1min (external Monitor): Ø6.88 (5.99-8.6)
Dell XPS 13 9345 SD X Elite X1E-80-100, Adreno X1-85 3.8 TFLOPS; Cyberpunk 2077 FHD ultra no FSR (external Monitor): Ø39.4 (38-48.6)

Batteritid

Samma 65 W USB-C AC-adapter som levereras med Intel XPS 13

Om det är något som systemet otvetydigt utmärker sig för, så måste det vara batteritiden. Vi kan registrera en verklig körtid för WLAN-surfning på nästan 26,5 timmar eller mer än 2x längre än XPS 13 9340 utrustad med Core Ultra 7 155H och identisk 1200p IPS-skärm. Körtiderna kommer garanterat att vara kortare om de konfigureras med OLED-panelen istället, men de kommer fortfarande att vara otroligt långa ändå och en av de längsta av alla 13-tums subnotebooks inklusive till och med MacBook Air-serien.

Vårt test utfördes efter att vi applicerat den senaste BIOS-uppdateringen från Dell som var speciellt utformad för att förbättra batteritiden på Snapdragon-modellen. Vi rekommenderar att du installerar uppdateringen här.

Laddning från tom till full kapacitet tar lite över 90 minuter vilket är vanligt på de flesta bärbara datorer.

Batteritid
Låg belastning (utan WLAN, min. ljusstyrka)
46tim 25min
WiFi Websurfing
26tim 25min
Hög belastning (maximal ljusstyrka)
0tim 57min
Dell XPS 13 9345
SD X Elite X1E-80-100, Adreno X1-85 3.8 TFLOPS, 55 Wh
Dell XPS 13 9340 Core Ultra 7
Ultra 7 155H, Arc 8-Core, 55 Wh
Microsoft Surface Laptop 7 13.8 Copilot+
SD X Elite X1E-80-100, Adreno X1-85 3.8 TFLOPS, 54 Wh
Lenovo ThinkBook 13x G4 21KR0008GE
Ultra 5 125H, Arc 7-Core, 74 Wh
HP EliteBook Ultra G1q 14
SD X Elite X1E-78-100, Adreno X1-85 3.8 TFLOPS, 59 Wh
Asus ZenBook S13 OLED UX5304
i7-1355U, Iris Xe G7 96EUs, 63 Wh
Battery Runtime
40%
-3%
24%
4%
50%
Reader / Idle
2785
1222
-56%
WiFi v1.3
1585
769
-51%
852
-46%
684
-57%
792
-50%
678
-57%
Load
57
131
130%
80
40%
116
104%
124
118%
146
156%
H.264
1053
1181
1229
829

För

+ prisfördel jämfört med Core Ultra 7 XPS 13
+ bra CPU-prestanda för inbyggda appar
+ längre batteritid än Intel-modellen
+ fläktarna tenderar att vara lite tystare
+ Redo för Co-Pilot+

Emot

- tangentbord och klickplatta med nollgitter kanske inte passar alla
- oundvikliga kompatibilitetsproblem med vissa applikationer
- grafikdrivrutin kan använda lite arbete
- fortfarande ingen webbkamera sekretesslucka
- skakigt Thunderbolt-stöd

Bedömning - Respektabelt alternativ till Intel XPS 13

I recension: Dell XPS 13 9345

Snapdragon XPS 13 på $ 1300 är något billigare än $ 1400 Core Ultra 7 XPS 13 samtidigt som den erbjuder betydligt längre batteritid, Co-Pilot+ integration och identiska hårdvarufunktioner. Den faktiska användarupplevelsen kommer dock att bero mycket på arbetsbelastningen och applikationen. Om den mest används för surfning, ordbehandling, video och streaming tenderar Snapdragon XPS 13 att vara mer effektiv, särskilt när programmen kan köras nativt på ARM. Å andra sidan, mer krävande uppgifter som grafikredigering, videokodning, Thunderbolt-dockning eller specifika applikationer som måste emuleras på ARM passar bäst på den traditionella Intel XPS 13. För detta ändamål ger Intel-modellen en mer förutsägbar prestandanivå över alla användningsscenarier som utan tvekan uppväger de få kantfall där Snapdragon-modellen kan komma framåt.

Snapdragon XPS 13 är ett bra alternativ till Intel XPS 13 dollar för dollar. Användarupplevelsen kommer dock att variera mycket beroende på vilka typer av applikationer och uppgifter du tänker använda systemet för.

Fördelarna med batteritid och Co-Pilot+-kompatibilitet kanske inte räcker för att övertyga köpare när batteritiden med Intel XPS 13 redan är ganska bra och Co-Pilot+ förväntas komma till framtida Intel- och AMD-processorer. Men användare som vill maximera körtiderna och uppleva de senaste Microsoft AI-funktionerna idag kan tycka att Snapdragon XPS 13 är det mer produktiva alternativet.

Pris och tillgänglighet

Dell levererar nu XPS 13 9345 som konfigurerad för $1300 upp till $1800+ om den konfigureras med OLED-panelen.

Information: Vi har nyligen uppdaterat vårt betygssystem och resultaten från version 8 är inte jämförbara med resultaten från version 7. Ytterligare information om detta finns här tillgänglig.

Obs: Vi har nyligen uppdaterat vårt betygssystem och resultaten från version 8 är inte jämförbara med resultaten från version 7. Mer information finns tillgänglig här .

Dell XPS 13 9345 - 08/04/2024 v8
Allen Ngo

Design
87 / 98 → 88%
Tangentbord
78%
Mus
83%
Anslutningar
58 / 74 → 79%
Vikt
72 / 20-77 → 92%
Batteri
94%
Skärm
85%
Spelprestanda
39 / 75 → 52%
Programprestanda
82 / 92 → 89%
Temperatur
88%
Ljudnivå
87%
Audio
85 / 91 → 94%
Camera
33 / 75 → 43%
Medel
66%
85%
Subnotebook - Vägt medel
CO2 Emissions
No Data
Materials
50%
Packaging
100%
Power Use
85.5%
Repairability
40%
Software Updates
22.3%
Recycle Logo Total Sustainability Score: 49.6%

Transparency

The selection of devices to be reviewed is made by our editorial team. The test sample was provided to the author as a loan by the manufacturer or retailer for the purpose of this review. The lender had no influence on this review, nor did the manufacturer receive a copy of this review before publication. There was no obligation to publish this review. We never accept compensation or payment in return for our reviews. As an independent media company, Notebookcheck is not subjected to the authority of manufacturers, retailers or publishers.

This is how Notebookcheck is testing

Every year, Notebookcheck independently reviews hundreds of laptops and smartphones using standardized procedures to ensure that all results are comparable. We have continuously developed our test methods for around 20 years and set industry standards in the process. In our test labs, high-quality measuring equipment is utilized by experienced technicians and editors. These tests involve a multi-stage validation process. Our complex rating system is based on hundreds of well-founded measurements and benchmarks, which maintains objectivity. Further information on our test methods can be found here.
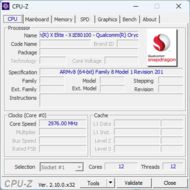
Price comparison

Please share our article, every link counts!
Mail Logo
> Bärbara datorer, laptops - tester och nyheter > Tester > Dell XPS 13 9345 Snapdragon X Elite recension: Underskattar Intel Core Ultra 7
Allen Ngo, 2024-08- 6 (Update: 2024-08- 6)