Notebookcheck Logo

Recension av Dell Precision 5690 arbetsstation: Redo för AI-revolutionen
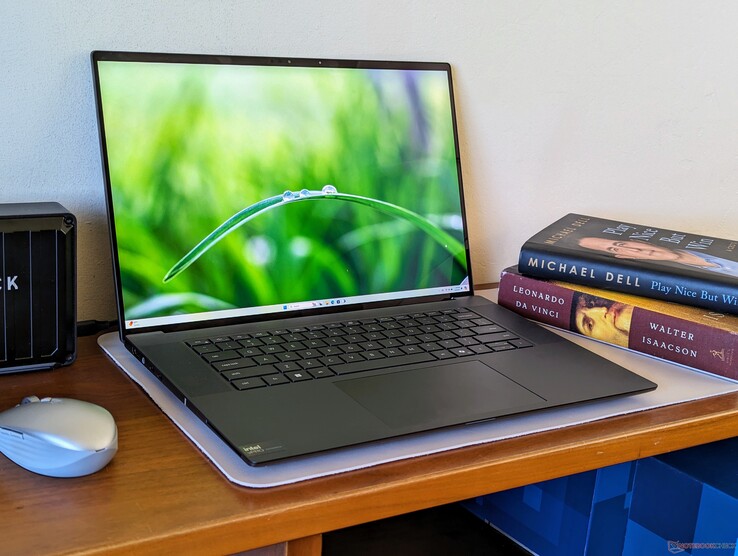
Från Raptor Lake-H till Meteor Lake-H.

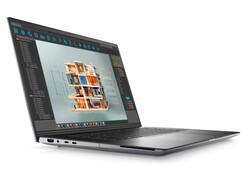
Den XPS-inspirerade Precision har uppdaterats i år med de senaste 14:e generationens Intel Core Ultra-processorer. Det finns tyvärr inga nya GPU-alternativ, men prestanda per volym är ändå imponerande.
2024 Dell Precision 5690

Precision 5690 efterträder förra årets Precision 5680 genom att ersätta de äldre Raptor Lake-H-processorerna med nyare Meteor Lake-H-processorer med integrerade NPU:er. De två modellerna är i övrigt identiska med samma skärm- och GPU-alternativ. Vi rekommenderar att du kollar in vår recension på Precision 5680 för att lära dig mer om de XPS 16-inspirerade fysiska funktionerna i serien.

Vår enhet i recensionen är den mest avancerade konfigurationen med Core Ultra 9 185H vPro CPU, Nvidia 5000 Ada GPU och 16-tums 2400p OLED-pekskärm för cirka 5900 USD. Mindre SKU:er börjar med Core Ultra 5 135H vPro, endast integrerad Arc-grafik och 1200p IPS-skärm för endast $2300.

Alternativ till Precision 5690 inkluderar andra 16-tums arbetsstationer som Lenovo ThinkPad P16 G2, HP ZBook Fury 16 G10eller MSI CreatorPro Z16P.

Fler recensioner av Dell:

Dell Precision 5690 (Precision 5000 Serie)
Processor
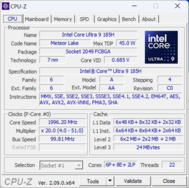
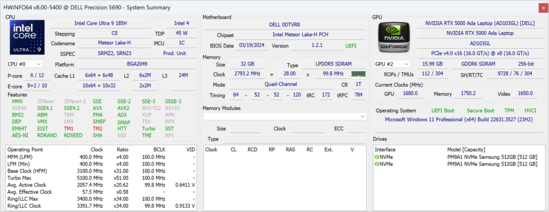
Intel Core Ultra 9 185H 16 x 3.8 - 5.1 GHz, 120 W PL2 / Short Burst, 73 W PL1 / Sustained, Meteor Lake-H
Grafikkort
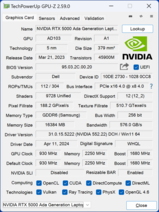
NVIDIA RTX 5000 Ada Generation Laptop GPU - 16 GB VRAM, Kärna: 1680 MHz, Minne: 2250 MHz, 95 W TDP, GDDR6, 552.22, Optimus
Minne
32 GB 
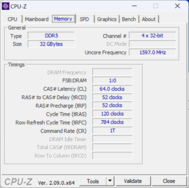
, LPDDR5x, 7467 MT/s, Dual-Channel, Soldered
Skärm
16.00 tum 16:10, 3840 x 2400 pixlar 283 PPI, 10-point capacitive, Samsung 160YV03, OLED, Dell P/N: D3KJF, Controller: SDC4164, glansig: ja, 60 Hz
Moderkort
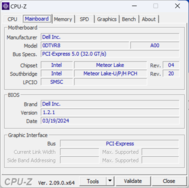
Intel Meteor Lake-U/P/H PCH
Hårddisk
2x Samsung PM9A1 1TB (RAID 0), 2048 GB 
Ljudkort
Intel Meteor Lake-U/P/H PCH - cAVS (Audio, Voice, Speech)
Anslutningar
3 USB 3.0, 2 Thunderbolt, USB-C Power Delivery (PD), 1 HDMI, 3 DisplayPort, 1 Kensingtonlås, Ljudanslutningar: 3.5 mm headset, 1 Fingeravtrycksläsare, Ljusstyrka sensor
Nätverk
Intel Wi-Fi 7 BE200 320MHz (a/b/g/n = Wi-Fi 4/ac = Wi-Fi 5/ax = Wi-Fi 6/ Wi-Fi 6E 6 GHz be = Wi-Fi 7), Bluetooth 5.4
Storlek
höjd x bredd x djup (i mm) 22.17 x 353.68 x 240.33
Batteri
98 Wh Litiumpolymer
Operativsystem
Microsoft Windows 11 Pro
Kamera
Webbkamera: 1080p30
Primär kamera: 2 MPix
Övrigt
Högtalare: Quad (2x 2 W tweeters + 2x 2 W woofers), Tangentbord: Chiclet, Tangentbordsbelysning: ja, Dell Optimizer, Command, PremierColor, Digital Delivery, Display Manager 2.0, 36 Månader Garanti
Vikt
2.31 kg, Strömförsörjning: 479 g
Pris
5900 USD
Amazon
Obs: Tillverkaren kan använda komponenter från olika leverantörer inklusive bildskärmspaneler, enheter eller minnesstickor med liknande specifikationer.


Potentiella konkurrenter i jämförelse

Gradering
Datum
Modell
Vikt
Höjd
Storlek
Upplösning
Pris
88.3 %
v7 (old)
05/2024
Dell Precision 5690
Ultra 9 185H, NVIDIA RTX 5000 Ada Generation Laptop GPU
2.3 kg22.17 mm16.00"3840x2400
89 %
v7 (old)
08/2023
Dell Precision 5000 5680
i9-13900H, NVIDIA RTX 5000 Ada Generation Laptop GPU
2.3 kg22.17 mm16.00"3840x2400
90.2 %
v7 (old)
03/2024
Lenovo ThinkPad P16 G2 21FA000FGE
i7-13700HX, NVIDIA RTX 2000 Ada Generation Laptop GPU
3 kg30.23 mm16.00"2560x1600
91.7 %
v7 (old)
10/2023
Lenovo ThinkPad P1 G6-21FV000DGE
i9-13900H, NVIDIA RTX 2000 Ada Generation Laptop GPU
1.9 kg17.5 mm16.00"2560x1600
92.3 %
v7 (old)
09/2023
HP ZBook Fury 16 G10
i9-13950HX, NVIDIA RTX 5000 Ada Generation Laptop GPU
2.6 kg28.5 mm16.00"3840x2400
84.3 %
v7 (old)
11/2022
MSI CreatorPro Z16P B12UKST
i7-12700H, RTX A3000 Laptop GPU
2.4 kg19 mm16.00"2560x1600

Fodral - Inspirerad av XPS 16

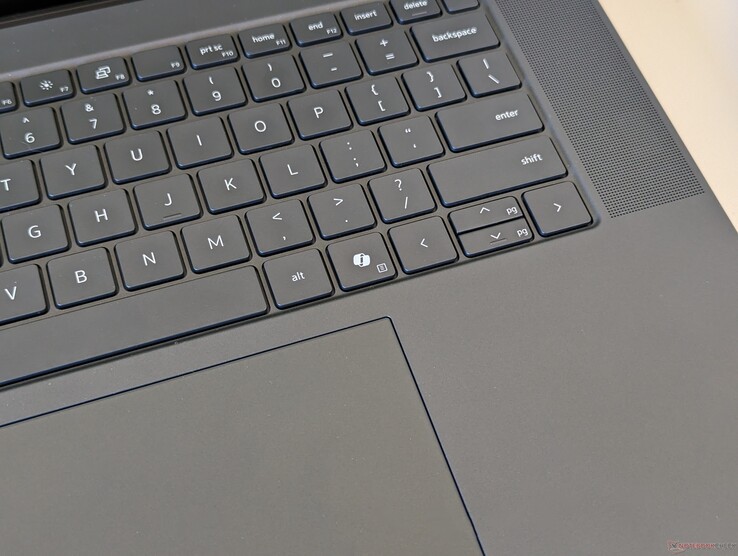
Tangentbordet har nu en särskild Microsoft Co-Pilot-tangent i stället för den högra Ctrl-tangenten för att visuellt skilja Precision 5690 från 5680.

Storleksjämförelse

364 mm 266 mm 30.23 mm 3 kg363 mm 250 mm 28.5 mm 2.6 kg359 mm 256 mm 19 mm 2.4 kg359.5 mm 253.8 mm 17.5 mm 1.9 kg353.68 mm 240.33 mm 22.17 mm 2.3 kg353.68 mm 240.33 mm 22.17 mm 2.3 kg297 mm 210 mm 1 mm 5.7 g

Anslutningsmöjligheter

Framåt: Inga portar
Framåt: Inga portar
Höger sida: SD-läsare (tillval), USB-C med DisplayPort + Power Delivery, Wedge Lock
Bakre delen: Inga portar
Vänster: HDMI 2.0, 3,5 mm headset, 2x Thunderbolt 4 med DisplayPort + Power Delivery, SmartCard-läsare (tillval)

Kommunikation

WLAN har uppgraderats från Intel AX211 till Intel BE200 för att stödja Wi-Fi 7-anslutning. De allra flesta användare är dock fortfarande begränsade till Wi-Fi 6E eller äldre nätverk och de flesta kommer därför inte att märka av några prestandafördelar för tillfället.

Networking
iperf3 transmit AXE11000
Lenovo ThinkPad P1 G6-21FV000DGE
Intel Wi-Fi 6E AX211
1499 (1391min, 1401.15P1 - 1584max) MBit/s +31%
HP ZBook Fury 16 G10
Intel Wi-Fi 6E AX211
1416 (736min - 1514max) MBit/s +24%
Dell Precision 5000 5680
Intel Wi-Fi 6E AX211
1284 (1063min - 1424max) MBit/s +12%
Dell Precision 5690
Intel Wi-Fi 7 BE200 320MHz
1143 (813min - 1407max) MBit/s
Lenovo ThinkPad P16 G2 21FA000FGE
Intel Wi-Fi 6E AX211
565 (508min - 662max) MBit/s -51%
iperf3 receive AXE11000
Lenovo ThinkPad P1 G6-21FV000DGE
Intel Wi-Fi 6E AX211
1682 (1636min, 1639.19P1 - 1708max) MBit/s +15%
Lenovo ThinkPad P16 G2 21FA000FGE
Intel Wi-Fi 6E AX211
1583 (1445min - 1648max) MBit/s +8%
Dell Precision 5690
Intel Wi-Fi 7 BE200 320MHz
1459 (1375min - 1525max) MBit/s
HP ZBook Fury 16 G10
Intel Wi-Fi 6E AX211
1324 (1224min - 1385max) MBit/s -9%
Dell Precision 5000 5680
Intel Wi-Fi 6E AX211
1129 (1055min - 1197max) MBit/s -23%
iperf3 transmit AXE11000 6GHz
MSI CreatorPro Z16P B12UKST
Killer Wi-Fi 6E AX1675i 160MHz Wireless Network Adapter
1659 (1602min, 1605.19P1 - 1702max) MBit/s +35%
HP ZBook Fury 16 G10
Intel Wi-Fi 6E AX211
1440 (730min - 1604max) MBit/s +17%
Dell Precision 5000 5680
Intel Wi-Fi 6E AX211
1411 (1305min - 1472max) MBit/s +15%
Dell Precision 5690
Intel Wi-Fi 7 BE200 320MHz
1228 (666min - 1448max) MBit/s
Lenovo ThinkPad P16 G2 21FA000FGE
Intel Wi-Fi 6E AX211
632 (556min - 717max) MBit/s -49%
iperf3 receive AXE11000 6GHz
Lenovo ThinkPad P16 G2 21FA000FGE
Intel Wi-Fi 6E AX211
1696 (1632min - 1734max) MBit/s +11%
MSI CreatorPro Z16P B12UKST
Killer Wi-Fi 6E AX1675i 160MHz Wireless Network Adapter
1690 (1617min, 1618.16P1 - 1721max) MBit/s +11%
Dell Precision 5690
Intel Wi-Fi 7 BE200 320MHz
1523 (1429min - 1570max) MBit/s
HP ZBook Fury 16 G10
Intel Wi-Fi 6E AX211
1425 (1357min - 1461max) MBit/s -6%
Dell Precision 5000 5680
Intel Wi-Fi 6E AX211
1301 (692min - 1382max) MBit/s -15%
050100150200250300350400450500550600650700750800850900950100010501100115012001250130013501400145015001550Tooltip
Dell Precision 5690; iperf3 transmit AXE11000 6GHz; iperf 3.1.3: Ø1228 (666-1448)
Dell Precision 5690; iperf3 receive AXE11000 6GHz; iperf 3.1.3: Ø1523 (1429-1570)

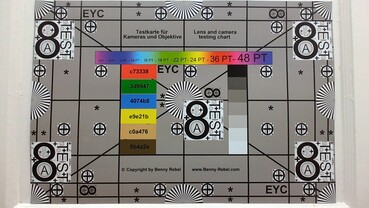
Webbkamera

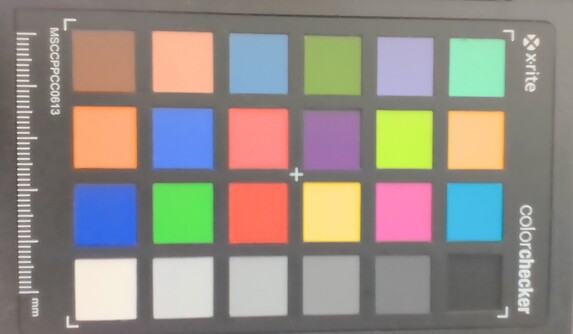
ColorChecker
24.4 ∆E
12.3 ∆E
17.5 ∆E
26.9 ∆E
16.2 ∆E
13.8 ∆E
14.1 ∆E
20.5 ∆E
17.8 ∆E
22.1 ∆E
14.2 ∆E
13.6 ∆E
18.5 ∆E
22.2 ∆E
24.2 ∆E
10.3 ∆E
17.8 ∆E
18.4 ∆E
7 ∆E
5.2 ∆E
11.3 ∆E
15.1 ∆E
23.7 ∆E
15 ∆E
ColorChecker Dell Precision 5690: 16.76 ∆E min: 5.2 - max: 26.88 ∆E

Underhåll

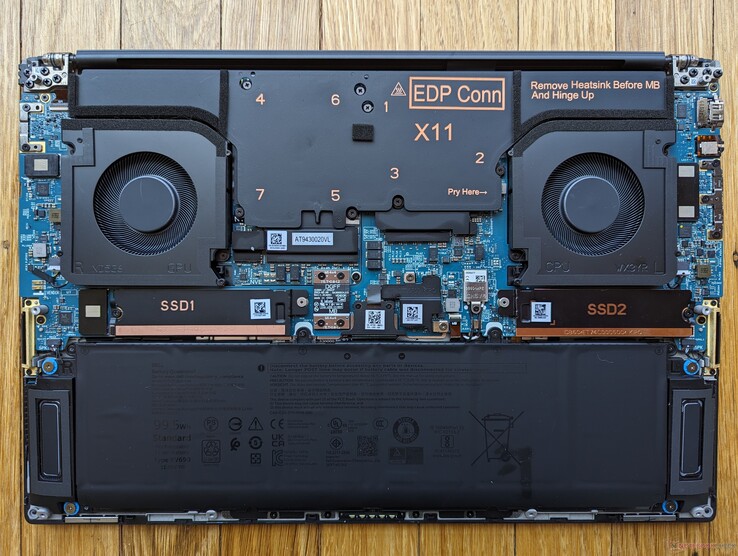
Det finns inga nämnvärda interna skillnader mellan Precision 5690 och den äldre 5680.

Precision 5690 moderkort
Precision 5680 för jämförelse

Skärm - HDR OLED vid 60 Hz

Glänsande OLED-subpixeluppsättning är skarp men något kornig på nära håll

2024-modellen använder samma 4K Samsung 160YV03 OLED-panel och D3KJF-artikelnummer som föregående år för inga förändringar av den visuella upplevelsen. Å ena sidan är detta utmärkt eftersom OLED-panelen levereras förkalibrerad med fullständiga DCI-P3-färger och pekstöd. Å andra sidan skulle det ha varit bra att se högre uppdateringsfrekvenser med adaptiva alternativ eftersom standarduppdateringsfrekvensen på 60 Hz börjar bli gammal.

Maximal ljusstyrka i SDR- och HDR-lägen kan nå 350 nits respektive 600 nits.

355.9
cd/m²
347.9
cd/m²
346.6
cd/m²
354.7
cd/m²
348.1
cd/m²
347.7
cd/m²
355.1
cd/m²
348.4
cd/m²
350.3
cd/m²
Distribution av ljusstyrkan
Samsung 160YV03 testat med X-Rite i1Pro 2
Max: 355.9 cd/m² (Nits) Medel: 350.5 cd/m² Minimum: 3.62 cd/m²
Distribution av ljusstyrkan: 97 %
Mitt på batteriet: 348.1 cd/m²
Kontrast: ∞:1 (Svärta: 0 cd/m²)
ΔE Color 4.18 | 0.5-29.43 Ø4.9, calibrated: 0.97
ΔE Greyscale 1.7 | 0.5-98 Ø5.2
96.6% AdobeRGB 1998 (Argyll 2.2.0 3D)
100% sRGB (Argyll 2.2.0 3D)
99.8% Display P3 (Argyll 2.2.0 3D)
Gamma: 2.2
Dell Precision 5690
Samsung 160YV03, OLED, 3840x2400, 16"
Dell Precision 5000 5680
Samsung 160YV03, OLED, 3840x2400, 16"
Lenovo ThinkPad P16 G2 21FA000FGE
MNG007DA1-9, IPS LED, 2560x1600, 16"
Lenovo ThinkPad P1 G6-21FV000DGE
NE160QDM-NY1, IPS, 2560x1600, 16"
HP ZBook Fury 16 G10
AUO87A8, IPS, 3840x2400, 16"
MSI CreatorPro Z16P B12UKST
B160QAN02.N, IPS, 2560x1600, 16"
Display
0%
-18%
-20%
-4%
-4%
Display P3 Coverage
99.8
99.9
0%
71
-29%
68.1
-32%
98
-2%
97.6
-2%
sRGB Coverage
100
100
0%
99.2
-1%
97.5
-2%
99.9
0%
99.9
0%
AdobeRGB 1998 Coverage
96.6
97.5
1%
73.2
-24%
70.2
-27%
86.2
-11%
87.4
-10%
Response Times
-1%
-574%
-586%
-533%
-494%
Response Time Grey 50% / Grey 80% *
1.7 ?(0.88, 0.82)
1.68 ?(0.97, 0.71)
1%
12.8 ?(61, 6.8)
-653%
13.7 ?(6.7, 7)
-706%
11.9 ?(5.9, 6)
-600%
12.8 ?(6.2, 6.6)
-653%
Response Time Black / White *
1.7 ?(0.74, 0.96)
1.77 ?(0.8, 0.97)
-4%
10.1 ?(5.8, 4.3)
-494%
9.6 ?(4.8, 4.8)
-465%
9.6 ?(5.1, 4.5)
-465%
7.4 ?(3.4, 4)
-335%
PWM Frequency
60 ?(100)
60 ?(100)
0%
Screen
-11%
-15%
33%
36%
22%
Brightness middle
348.1
345.7
-1%
510
47%
521
50%
514.6
48%
407
17%
Brightness
351
349
-1%
517
47%
484
38%
495
41%
388
11%
Brightness Distribution
97
98
1%
89
-8%
89
-8%
90
-7%
88
-9%
Black Level *
0.37
0.36
0.46
0.36
Colorchecker dE 2000 *
4.18
3.59
14%
2.6
38%
1.2
71%
2.4
43%
1.3
69%
Colorchecker dE 2000 max. *
6.68
7.02
-5%
5.2
22%
2.5
63%
4.86
27%
2.5
63%
Colorchecker dE 2000 calibrated *
0.97
0.99
-2%
2.3
-137%
1
-3%
0.4
59%
0.7
28%
Greyscale dE 2000 *
1.7
3.1
-82%
3.6
-112%
1.4
18%
1
41%
2.1
-24%
Gamma
2.2 100%
2.13 103%
2.26 97%
2.25 98%
2.3 96%
2.26 97%
CCT
6198 105%
6448 101%
5969 109%
6682 97%
6553 99%
6437 101%
Contrast
1378
1447
1119
1131
Totalt genomsnitt (program/inställningar)
-4% / -6%
-202% / -109%
-191% / -84%
-167% / -69%
-159% / -70%

* ... mindre är bättre

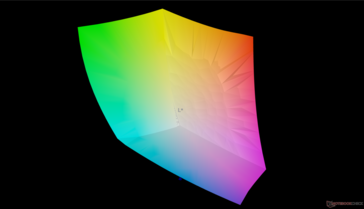
jämfört med sRGB
jämfört med sRGB
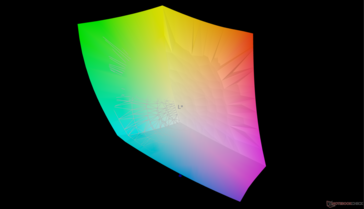
mot P3
mot P3

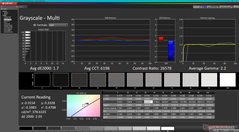
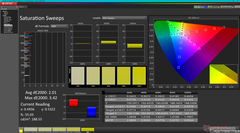
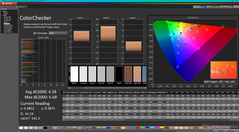
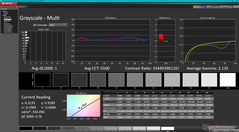
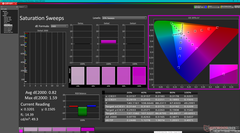
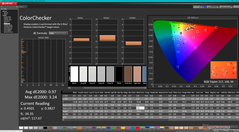
Skärmen är välkalibrerad mot P3-standarden med genomsnittliga DeltaE-värden för gråskala och färg på bara 1,7 respektive 4,18.

Gråskala före kalibrering (P3)
Mättnadssvep före kalibrering (P3)
ColorChecker före kalibrering (P3)
Gråskala efter kalibrering
Mättnadssvep efter kalibrering
ColorChecker efter kalibrering

Visa svarstider

Displayens svarstid visar hur snabbt skärmen kan växla från en färg till en annan. Långsamma svarstider kan leda till efterbilder och kan göra att rörliga föremål ser suddiga ut (spökbilder). Spelare av snabba 3D-titlar bör ägna särskild uppmärksamhet åt snabba svarstider.
       Svarstid svart till vitt
1.7 ms ... stiga ↗ och falla ↘ kombinerat↗ 0.74 ms stiga
↘ 0.96 ms hösten
Skärmen visar väldigt snabba svarsfrekvenser i våra tester och borde vara mycket väl lämpad för fartfyllt spel.
I jämförelse sträcker sig alla testade enheter från 0.1 (minst) till 240 (maximalt) ms. » 7 % av alla enheter är bättre.
Det betyder att den uppmätta svarstiden är bättre än genomsnittet av alla testade enheter (20.9 ms).
       Svarstid 50 % grått till 80 % grått
1.7 ms ... stiga ↗ och falla ↘ kombinerat↗ 0.88 ms stiga
↘ 0.82 ms hösten
Skärmen visar väldigt snabba svarsfrekvenser i våra tester och borde vara mycket väl lämpad för fartfyllt spel.
I jämförelse sträcker sig alla testade enheter från 0.165 (minst) till 636 (maximalt) ms. » 5 % av alla enheter är bättre.
Det betyder att den uppmätta svarstiden är bättre än genomsnittet av alla testade enheter (32.8 ms).

Skärmflimmer / PWM (Puls-Width Modulation)

För att dämpa skärmen kommer vissa bärbara datorer helt enkelt att slå på och av bakgrundsbelysningen i snabb följd - en metod som kallas Pulse Width Modulation (PWM) . Denna cykelfrekvens bör helst vara oupptäckbar för det mänskliga ögat. Om frekvensen är för låg kan användare med känsliga ögon uppleva spänningar eller huvudvärk eller till och med märka flimmer helt och hållet.
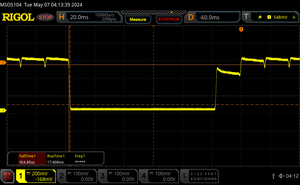
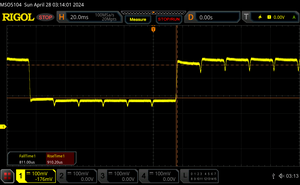
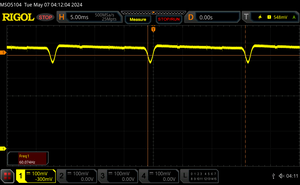
Skärmflimmer / PWM upptäckt 60 Hz ≤ 100 % ljusstyrka inställning

Displayens bakgrundsbelysning flimrar vid 60 Hz (i värsta fall, t.ex. med PWM) Flimrande upptäckt vid en ljusstyrkeinställning på 100 % och lägre. Det ska inte finnas något flimmer eller PWM över denna ljusstyrkeinställning.

Frekvensen för 60 Hz är mycket låg, så flimmer kan orsaka ögon- och huvudvärk efter långvarig användning.

Som jämförelse: 53 % av alla testade enheter använder inte PWM för att dämpa skärmen. Om PWM upptäcktes mättes ett medelvärde av 8684 (minst: 5 - maximum: 343500) Hz.

100 procent ljusstyrka
75 procent ljusstyrka
50 procent ljusstyrka
25 procent ljusstyrka
0 procent ljusstyrka
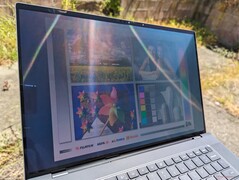
Utomhus under solljus
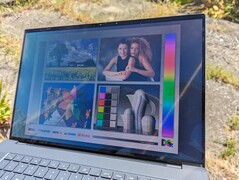
Utomhus under skugga
Utomhus under solljus
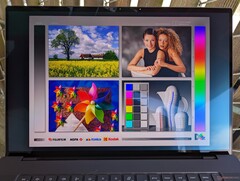
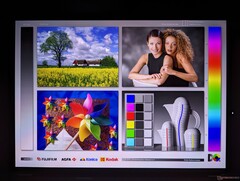
Breda OLED-betraktningsvinklar. Regnbågseffekten blir märkbar

Prestanda


Testförhållanden

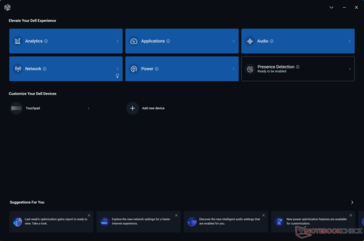
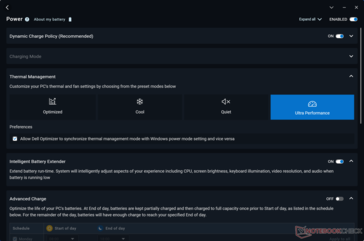
Vi ställde in Dell Optimizer till Ultra Performance-läge innan vi körde nedanstående benchmarks. Vi kopplade också bort ECC VRAM via Nvidia Control Panel. Aktivering av ECC VRAM minskar tillgängligt minne med cirka 1 GB.

Startskärm för Dell Optimizer
Inställningar för energiprofil
IR Presence Detection för handsfree-inloggning stöds
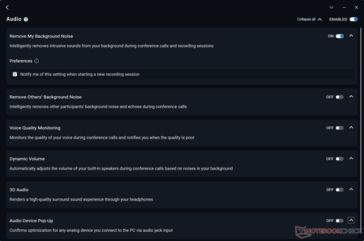
Ljudinställningar
Ljudinställningar

Processor

Core Ultra Core Ultra 9 185H presterar nästan identiskt med Core i9-13900H i både enkel- och flertrådiga arbetsbelastningar. Den drar mer nytta av Turbo Boost för den snabbare initiala hastighetsökningen, men denna fördel är bara tillfällig innan den lägger sig på liknande prestandanivåer som den äldre Core i9 Precision 5680, vilket visas av jämförelsediagrammet nedan.

Nedgradering till Core Ultra 7 165H och Ultra 5 135H förväntas påverka processorns prestanda med 5 till 10 procent respektive 40 till 50 procent, vilket innebär att prestandadeltat är betydligt större mellan Core Ultra 5 och Ultra 7 än mellan Core Ultra 7 och Ultra 9. Precision 5690 innehåller inga 14:e generationens Raptor Lake-HX-processorer, vilket skulle ha ökat prestandan ännu snabbare än Core Ultra 9 185H. I gengäld har Core Ultra-processorerna dock integrerade NPU:er för att accelerera lokala AI-uppgifter när de blir mer lättillgängliga inom en snar framtid.

Cinebench R15 Multi Loop

018537055574092511101295148016651850203522202405259027752960314533303515Tooltip
Dell Precision 5690 Intel Core Ultra 9 185H: Ø2340 (2218.28-3164.56)
Dell Precision 5000 5680 Intel Core i9-13900H: Ø2332 (2200.22-2354.19)
Lenovo ThinkPad P16 G2 21FA000FGE Intel Core i7-13700HX: Ø2785 (2533.57-3082.38)
Lenovo ThinkPad P1 G6-21FV000DGE Intel Core i9-13900H: Ø2448 (2237.64-2626.57)
HP ZBook Fury 16 G10 Intel Core i9-13950HX: Ø3353 (3034.67-3625.49)
MSI CreatorPro Z16P B12UKST Intel Core i7-12700H: Ø2211 (2130.95-2274.54)
CPU Performance Rating: Percent
Cinebench R23: Multi Core | Single Core
Cinebench R20: CPU (Multi Core) | CPU (Single Core)
Cinebench R15: CPU Multi 64Bit | CPU Single 64Bit
Blender: v2.79 BMW27 CPU
7-Zip 18.03: 7z b 4 | 7z b 4 -mmt1
Geekbench 6.3: Multi-Core | Single-Core
Geekbench 5.5: Multi-Core | Single-Core
HWBOT x265 Benchmark v2.2: 4k Preset
LibreOffice : 20 Documents To PDF
R Benchmark 2.5: Overall mean
CPU Performance Rating
Lenovo Legion Pro 7 RTX4090 -2!
Intel Core i9-13900HX
86.4 pt
HP ZBook Fury 16 G10
Intel Core i9-13950HX
80.8 pt
Dell Precision 5000 5680
Intel Core i9-13900H
69.8 pt
Lenovo ThinkPad P1 G6-21FV000DGE
Intel Core i9-13900H
67.7 pt
Lenovo ThinkPad P16 G2 21FA000FGE -2!
Intel Core i7-13700HX
67.4 pt
Dell Precision 5690
Intel Core Ultra 9 185H
67.3 pt
Dell XPS 16 9640
Intel Core Ultra 7 155H
64.9 pt
Genomsnitt Intel Core Ultra 9 185H
 
64.1 pt
HP ZBook Fury 16 G9 -2!
Intel Core i9-12950HX
64 pt
Lenovo ThinkPad P16 G1 21D6001DMB -2!
Intel Core i7-12850HX
62.1 pt
MSI CreatorPro Z16P B12UKST -2!
Intel Core i7-12700H
60.2 pt
Lenovo ThinkPad P16v G1 AMD
AMD Ryzen 7 PRO 7840HS
60.1 pt
Lenovo ThinkPad P16s G2 21K9000CGE
AMD Ryzen 7 PRO 7840U
59.5 pt
Samsung Galaxy Book4 Pro 360 -1!
Intel Core Ultra 5 125H
51 pt
Asus ProArt StudioBook 16 W7600H5A-2BL2 -2!
Intel Xeon W-11955M
48.5 pt
Lenovo ThinkPad P1 G4-20Y30017GE -2!
Intel Core i7-11800H
40.4 pt
Cinebench R23 / Multi Core
Lenovo Legion Pro 7 RTX4090
Intel Core i9-13900HX
31109 Points +62%
HP ZBook Fury 16 G10
Intel Core i9-13950HX
24560 (20848.8min - 24559.5max) Points +28%
Lenovo ThinkPad P16 G2 21FA000FGE
Intel Core i7-13700HX
20479 Points +7%
Dell Precision 5690
Intel Core Ultra 9 185H
19158 (13886.3min - 19158.4max) Points
HP ZBook Fury 16 G9
Intel Core i9-12950HX
19153 (17138min - 19152.9max) Points 0%
Dell Precision 5000 5680
Intel Core i9-13900H
18886 (15052.4min - 18886.3max) Points -1%
Lenovo ThinkPad P1 G6-21FV000DGE
Intel Core i9-13900H
18556 Points -3%
Dell XPS 16 9640
Intel Core Ultra 7 155H
18433 Points -4%
Genomsnitt Intel Core Ultra 9 185H
  (12688 - 19851, n=19)
17767 Points -7%
Lenovo ThinkPad P16 G1 21D6001DMB
Intel Core i7-12850HX
17510 (17033.6min - 17510.5max) Points -9%
MSI CreatorPro Z16P B12UKST
Intel Core i7-12700H
17228 Points -10%
Lenovo ThinkPad P16s G2 21K9000CGE
AMD Ryzen 7 PRO 7840U
15142 Points -21%
Lenovo ThinkPad P16v G1 AMD
AMD Ryzen 7 PRO 7840HS
14240 Points -26%
Asus ProArt StudioBook 16 W7600H5A-2BL2
Intel Xeon W-11955M
10862 (10718min - 10862.2max) Points -43%
Samsung Galaxy Book4 Pro 360
Intel Core Ultra 5 125H
9965 Points -48%
Lenovo ThinkPad P1 G4-20Y30017GE
Intel Core i7-11800H
9376 Points -51%
Cinebench R23 / Single Core
HP ZBook Fury 16 G10
Intel Core i9-13950HX
2106 Points +13%
Lenovo Legion Pro 7 RTX4090
Intel Core i9-13900HX
2039 Points +10%
Lenovo ThinkPad P1 G6-21FV000DGE
Intel Core i9-13900H
2033 Points +9%
Dell Precision 5000 5680
Intel Core i9-13900H
2023 Points +9%
HP ZBook Fury 16 G9
Intel Core i9-12950HX
1922 Points +3%
Lenovo ThinkPad P16 G2 21FA000FGE
Intel Core i7-13700HX
1889 Points +2%
Dell Precision 5690
Intel Core Ultra 9 185H
1858 Points
Lenovo ThinkPad P16 G1 21D6001DMB
Intel Core i7-12850HX
1845 Points -1%
Dell XPS 16 9640
Intel Core Ultra 7 155H
1791 Points -4%
Genomsnitt Intel Core Ultra 9 185H
  (1166 - 1912, n=19)
1787 Points -4%
MSI CreatorPro Z16P B12UKST
Intel Core i7-12700H
1738 Points -6%
Lenovo ThinkPad P16s G2 21K9000CGE
AMD Ryzen 7 PRO 7840U
1716 Points -8%
Samsung Galaxy Book4 Pro 360
Intel Core Ultra 5 125H
1710 Points -8%
Lenovo ThinkPad P16v G1 AMD
AMD Ryzen 7 PRO 7840HS
1691 Points -9%
Asus ProArt StudioBook 16 W7600H5A-2BL2
Intel Xeon W-11955M
1480 Points -20%
Lenovo ThinkPad P1 G4-20Y30017GE
Intel Core i7-11800H
1452 Points -22%
Cinebench R20 / CPU (Multi Core)
Lenovo Legion Pro 7 RTX4090
Intel Core i9-13900HX
11637 Points +58%
HP ZBook Fury 16 G10
Intel Core i9-13950HX
9329 Points +26%
Lenovo ThinkPad P16 G2 21FA000FGE
Intel Core i7-13700HX
7870 Points +7%
Dell Precision 5690
Intel Core Ultra 9 185H
7387 Points
HP ZBook Fury 16 G9
Intel Core i9-12950HX
7364 Points 0%
Dell Precision 5000 5680
Intel Core i9-13900H
7214 Points -2%
Dell XPS 16 9640
Intel Core Ultra 7 155H
7146 Points -3%
Lenovo ThinkPad P1 G6-21FV000DGE
Intel Core i9-13900H
6995 Points -5%
Genomsnitt Intel Core Ultra 9 185H
  (4843 - 7651, n=19)
6862 Points -7%
Lenovo ThinkPad P16 G1 21D6001DMB
Intel Core i7-12850HX
6764 Points -8%
MSI CreatorPro Z16P B12UKST
Intel Core i7-12700H
6742 Points -9%
Lenovo ThinkPad P16s G2 21K9000CGE
AMD Ryzen 7 PRO 7840U
5981 Points -19%
Lenovo ThinkPad P16v G1 AMD
AMD Ryzen 7 PRO 7840HS
5327 Points -28%
Asus ProArt StudioBook 16 W7600H5A-2BL2
Intel Xeon W-11955M
4250 Points -42%
Samsung Galaxy Book4 Pro 360
Intel Core Ultra 5 125H
3870 Points -48%
Lenovo ThinkPad P1 G4-20Y30017GE
Intel Core i7-11800H
3552 Points -52%
Cinebench R20 / CPU (Single Core)
HP ZBook Fury 16 G10
Intel Core i9-13950HX
816 Points +15%
Lenovo ThinkPad P1 G6-21FV000DGE
Intel Core i9-13900H
782 Points +10%
Dell Precision 5000 5680
Intel Core i9-13900H
781 Points +10%
Lenovo Legion Pro 7 RTX4090
Intel Core i9-13900HX
780 Points +10%
HP ZBook Fury 16 G9
Intel Core i9-12950HX
739 Points +4%
Lenovo ThinkPad P16 G2 21FA000FGE
Intel Core i7-13700HX
727 Points +3%
Lenovo ThinkPad P16 G1 21D6001DMB
Intel Core i7-12850HX
708 Points 0%
Dell Precision 5690
Intel Core Ultra 9 185H
708 Points
Genomsnitt Intel Core Ultra 9 185H
  (442 - 735, n=19)
689 Points -3%
MSI CreatorPro Z16P B12UKST
Intel Core i7-12700H
675 Points -5%
Dell XPS 16 9640
Intel Core Ultra 7 155H
672 Points -5%
Lenovo ThinkPad P16s G2 21K9000CGE
AMD Ryzen 7 PRO 7840U
671 Points -5%
Samsung Galaxy Book4 Pro 360
Intel Core Ultra 5 125H
655 Points -7%
Lenovo ThinkPad P16v G1 AMD
AMD Ryzen 7 PRO 7840HS
651 Points -8%
Asus ProArt StudioBook 16 W7600H5A-2BL2
Intel Xeon W-11955M
568 Points -20%
Lenovo ThinkPad P1 G4-20Y30017GE
Intel Core i7-11800H
563 Points -20%
Cinebench R15 / CPU Multi 64Bit
Lenovo Legion Pro 7 RTX4090
Intel Core i9-13900HX
4685 (4358.72min - 4684.94max) Points +48%
HP ZBook Fury 16 G10
Intel Core i9-13950HX
3625 (3034.67min - 3625.49max) Points +15%
Dell Precision 5690
Intel Core Ultra 9 185H
3165 (2218.28min - 3164.56max) Points
Lenovo ThinkPad P16 G2 21FA000FGE
Intel Core i7-13700HX
3082 (2533.57min - 3082.38max) Points -3%
Lenovo ThinkPad P16 G1 21D6001DMB
Intel Core i7-12850HX
2926 Points -8%
Dell XPS 16 9640
Intel Core Ultra 7 155H
2818 (2643.06min - 2817.5max) Points -11%
Genomsnitt Intel Core Ultra 9 185H
  (1582 - 3165, n=21)
2729 Points -14%
Lenovo ThinkPad P1 G6-21FV000DGE
Intel Core i9-13900H
2627 (2237.64min - 2626.57max) Points -17%
HP ZBook Fury 16 G9
Intel Core i9-12950HX
2464 (1905.94min - 2464.42max) Points -22%
Lenovo ThinkPad P16s G2 21K9000CGE
AMD Ryzen 7 PRO 7840U
2418 (2288.98min - 2418.09max) Points -24%
Lenovo ThinkPad P16v G1 AMD
AMD Ryzen 7 PRO 7840HS
2361 (2257.08min - 2361.28max) Points -25%
Dell Precision 5000 5680
Intel Core i9-13900H
2354 (2200.22min - 2354.19max) Points -26%
MSI CreatorPro Z16P B12UKST
Intel Core i7-12700H
2211 (2130.95min, 2137.41P1 - 2274.54max) Points -30%
Asus ProArt StudioBook 16 W7600H5A-2BL2
Intel Xeon W-11955M
1846 (1747.11min - 1845.61max) Points -42%
Samsung Galaxy Book4 Pro 360
Intel Core Ultra 5 125H
1700 (1080.79min - 1700.25max) Points -46%
Lenovo ThinkPad P1 G4-20Y30017GE
Intel Core i7-11800H
1548 (1380.5min - 1547.99max) Points -51%
Cinebench R15 / CPU Single 64Bit
HP ZBook Fury 16 G10
Intel Core i9-13950HX
301 Points +11%
Lenovo Legion Pro 7 RTX4090
Intel Core i9-13900HX
289 Points +7%
Dell Precision 5000 5680
Intel Core i9-13900H
289 Points +7%
Lenovo ThinkPad P1 G6-21FV000DGE
Intel Core i9-13900H
287 Points +6%
Lenovo ThinkPad P16 G2 21FA000FGE
Intel Core i7-13700HX
279 Points +3%
Dell Precision 5690
Intel Core Ultra 9 185H
270 Points
Lenovo ThinkPad P16 G1 21D6001DMB
Intel Core i7-12850HX
268 Points -1%
Lenovo ThinkPad P16s G2 21K9000CGE
AMD Ryzen 7 PRO 7840U
265 Points -2%
Genomsnitt Intel Core Ultra 9 185H
  (191.9 - 281, n=19)
264 Points -2%
Lenovo ThinkPad P16v G1 AMD
AMD Ryzen 7 PRO 7840HS
262 Points -3%
Dell XPS 16 9640
Intel Core Ultra 7 155H
260 Points -4%
Samsung Galaxy Book4 Pro 360
Intel Core Ultra 5 125H
246 Points -9%
MSI CreatorPro Z16P B12UKST
Intel Core i7-12700H
238 Points -12%
Asus ProArt StudioBook 16 W7600H5A-2BL2
Intel Xeon W-11955M
230 Points -15%
Lenovo ThinkPad P1 G4-20Y30017GE
Intel Core i7-11800H
218 Points -19%
HP ZBook Fury 16 G9
Intel Core i9-12950HX
167 Points -38%
Blender / v2.79 BMW27 CPU
Samsung Galaxy Book4 Pro 360
Intel Core Ultra 5 125H
364 Seconds * -75%
Lenovo ThinkPad P1 G4-20Y30017GE
Intel Core i7-11800H
340 Seconds * -63%
Asus ProArt StudioBook 16 W7600H5A-2BL2
Intel Xeon W-11955M
276 Seconds * -33%
Lenovo ThinkPad P16s G2 21K9000CGE
AMD Ryzen 7 PRO 7840U
217 Seconds * -4%
Dell Precision 5690
Intel Core Ultra 9 185H
208 Seconds *
Lenovo ThinkPad P16v G1 AMD
AMD Ryzen 7 PRO 7840HS
205 Seconds * +1%
MSI CreatorPro Z16P B12UKST
Intel Core i7-12700H
201 Seconds * +3%
Dell Precision 5000 5680
Intel Core i9-13900H
199 Seconds * +4%
Lenovo ThinkPad P1 G6-21FV000DGE
Intel Core i9-13900H
193 Seconds * +7%
Genomsnitt Intel Core Ultra 9 185H
  (163 - 285, n=19)
191.1 Seconds * +8%
Lenovo ThinkPad P16 G1 21D6001DMB
Intel Core i7-12850HX
181 Seconds * +13%
Dell XPS 16 9640
Intel Core Ultra 7 155H
179 Seconds * +14%
HP ZBook Fury 16 G9
Intel Core i9-12950HX
176 Seconds * +15%
Lenovo ThinkPad P16 G2 21FA000FGE
Intel Core i7-13700HX
161 Seconds * +23%
HP ZBook Fury 16 G10
Intel Core i9-13950HX
137 Seconds * +34%
Lenovo Legion Pro 7 RTX4090
Intel Core i9-13900HX
105 Seconds * +50%
7-Zip 18.03 / 7z b 4
Lenovo Legion Pro 7 RTX4090
Intel Core i9-13900HX
122148 MIPS +65%
HP ZBook Fury 16 G10
Intel Core i9-13950HX
99351 MIPS +34%
Lenovo ThinkPad P16 G2 21FA000FGE
Intel Core i7-13700HX
78900 MIPS +6%
HP ZBook Fury 16 G9
Intel Core i9-12950HX
76646 MIPS +3%
Dell Precision 5690
Intel Core Ultra 9 185H
74187 MIPS
Lenovo ThinkPad P1 G6-21FV000DGE
Intel Core i9-13900H
70581 MIPS -5%
Dell Precision 5000 5680
Intel Core i9-13900H
70166 MIPS -5%
Dell XPS 16 9640
Intel Core Ultra 7 155H
70074 MIPS -6%
Lenovo ThinkPad P16 G1 21D6001DMB
Intel Core i7-12850HX
69464 MIPS -6%
Genomsnitt Intel Core Ultra 9 185H
  (51738 - 76331, n=19)
69330 MIPS -7%
MSI CreatorPro Z16P B12UKST
Intel Core i7-12700H
66768 MIPS -10%
Lenovo ThinkPad P16v G1 AMD
AMD Ryzen 7 PRO 7840HS
62497 MIPS -16%
Lenovo ThinkPad P16s G2 21K9000CGE
AMD Ryzen 7 PRO 7840U
62320 MIPS -16%
Asus ProArt StudioBook 16 W7600H5A-2BL2
Intel Xeon W-11955M
47264 MIPS -36%
Lenovo ThinkPad P1 G4-20Y30017GE
Intel Core i7-11800H
37641 MIPS -49%
7-Zip 18.03 / 7z b 4 -mmt1
Lenovo Legion Pro 7 RTX4090
Intel Core i9-13900HX
6931 MIPS +39%
HP ZBook Fury 16 G10
Intel Core i9-13950HX
6670 MIPS +34%
Lenovo ThinkPad P1 G6-21FV000DGE
Intel Core i9-13900H
6570 MIPS +32%
Lenovo ThinkPad P16v G1 AMD
AMD Ryzen 7 PRO 7840HS
6498 MIPS +30%
Lenovo ThinkPad P16 G2 21FA000FGE
Intel Core i7-13700HX
6355 MIPS +28%
Dell Precision 5000 5680
Intel Core i9-13900H
6194 MIPS +24%
HP ZBook Fury 16 G9
Intel Core i9-12950HX
6050 MIPS +21%
Lenovo ThinkPad P16 G1 21D6001DMB
Intel Core i7-12850HX
5916 MIPS +19%
Lenovo ThinkPad P16s G2 21K9000CGE
AMD Ryzen 7 PRO 7840U
5900 MIPS +18%
MSI CreatorPro Z16P B12UKST
Intel Core i7-12700H
5765 MIPS +16%
Lenovo ThinkPad P1 G4-20Y30017GE
Intel Core i7-11800H
5513 MIPS +11%
Dell XPS 16 9640
Intel Core Ultra 7 155H
5474 MIPS +10%
Genomsnitt Intel Core Ultra 9 185H
  (4199 - 5781, n=19)
5427 MIPS +9%
Asus ProArt StudioBook 16 W7600H5A-2BL2
Intel Xeon W-11955M
5222 MIPS +5%
Samsung Galaxy Book4 Pro 360
Intel Core Ultra 5 125H
5106 MIPS +3%
Dell Precision 5690
Intel Core Ultra 9 185H
4981 MIPS
Geekbench 6.3 / Multi-Core
HP ZBook Fury 16 G10
Intel Core i9-13950HX
15878 Points +12%
Dell Precision 5000 5680
Intel Core i9-13900H
14404 Points +2%
Dell Precision 5690
Intel Core Ultra 9 185H
14160 Points
Dell XPS 16 9640
Intel Core Ultra 7 155H
13656 Points -4%
Genomsnitt Intel Core Ultra 9 185H
  (9140 - 14540, n=19)
13602 Points -4%
Lenovo ThinkPad P1 G6-21FV000DGE
Intel Core i9-13900H
12578 Points -11%
Lenovo ThinkPad P16s G2 21K9000CGE
AMD Ryzen 7 PRO 7840U
11820 Points -17%
Samsung Galaxy Book4 Pro 360
Intel Core Ultra 5 125H
11571 Points -18%
Lenovo ThinkPad P16v G1 AMD
AMD Ryzen 7 PRO 7840HS
10518 Points -26%
Geekbench 6.3 / Single-Core
HP ZBook Fury 16 G10
Intel Core i9-13950HX
2949 Points +17%
Lenovo ThinkPad P1 G6-21FV000DGE
Intel Core i9-13900H
2728 Points +8%
Dell Precision 5000 5680
Intel Core i9-13900H
2600 Points +3%
Lenovo ThinkPad P16v G1 AMD
AMD Ryzen 7 PRO 7840HS
2581 Points +2%
Dell Precision 5690
Intel Core Ultra 9 185H
2531 Points
Lenovo ThinkPad P16s G2 21K9000CGE
AMD Ryzen 7 PRO 7840U
2455 Points -3%
Genomsnitt Intel Core Ultra 9 185H
  (1490 - 2573, n=19)
2430 Points -4%
Dell XPS 16 9640
Intel Core Ultra 7 155H
2418 Points -4%
Samsung Galaxy Book4 Pro 360
Intel Core Ultra 5 125H
2310 Points -9%
Geekbench 5.5 / Multi-Core
Lenovo Legion Pro 7 RTX4090
Intel Core i9-13900HX
20510 Points +44%
HP ZBook Fury 16 G10
Intel Core i9-13950HX
17487 Points +23%
Dell Precision 5000 5680
Intel Core i9-13900H
14661 Points +3%
Lenovo ThinkPad P16 G2 21FA000FGE
Intel Core i7-13700HX
14422 Points +1%
Dell Precision 5690
Intel Core Ultra 9 185H
14230 Points
HP ZBook Fury 16 G9
Intel Core i9-12950HX
14028 Points -1%
Dell XPS 16 9640
Intel Core Ultra 7 155H
13556 Points -5%
Genomsnitt Intel Core Ultra 9 185H
  (9330 - 14230, n=19)
13179 Points -7%
Lenovo ThinkPad P16 G1 21D6001DMB
Intel Core i7-12850HX
13095 Points -8%
MSI CreatorPro Z16P B12UKST
Intel Core i7-12700H
12125 Points -15%
Lenovo ThinkPad P1 G6-21FV000DGE
Intel Core i9-13900H
11611 Points -18%
Lenovo ThinkPad P16s G2 21K9000CGE
AMD Ryzen 7 PRO 7840U
10907 Points -23%
Lenovo ThinkPad P16v G1 AMD
AMD Ryzen 7 PRO 7840HS
10034 Points -29%
Samsung Galaxy Book4 Pro 360
Intel Core Ultra 5 125H
9696 Points -32%
Asus ProArt StudioBook 16 W7600H5A-2BL2
Intel Xeon W-11955M
8349 Points -41%
Lenovo ThinkPad P1 G4-20Y30017GE
Intel Core i7-11800H
6495 Points -54%
Geekbench 5.5 / Single-Core
HP ZBook Fury 16 G10
Intel Core i9-13950HX
2095 Points +12%
Dell Precision 5000 5680
Intel Core i9-13900H
2041 Points +9%
Lenovo Legion Pro 7 RTX4090
Intel Core i9-13900HX
2012 Points +8%
Lenovo ThinkPad P1 G6-21FV000DGE
Intel Core i9-13900H
1960 Points +5%
HP ZBook Fury 16 G9
Intel Core i9-12950HX
1945 Points +4%
Lenovo ThinkPad P16 G2 21FA000FGE
Intel Core i7-13700HX
1873 Points 0%
Dell Precision 5690
Intel Core Ultra 9 185H
1864 Points
Lenovo ThinkPad P16v G1 AMD
AMD Ryzen 7 PRO 7840HS
1822 Points -2%
MSI CreatorPro Z16P B12UKST
Intel Core i7-12700H
1788 Points -4%
Lenovo ThinkPad P16 G1 21D6001DMB
Intel Core i7-12850HX
1787 Points -4%
Genomsnitt Intel Core Ultra 9 185H
  (986 - 1902, n=19)
1779 Points -5%
Dell XPS 16 9640
Intel Core Ultra 7 155H
1775 Points -5%
Lenovo ThinkPad P16s G2 21K9000CGE
AMD Ryzen 7 PRO 7840U
1749 Points -6%
Samsung Galaxy Book4 Pro 360
Intel Core Ultra 5 125H
1699 Points -9%
Lenovo ThinkPad P1 G4-20Y30017GE
Intel Core i7-11800H
1538 Points -17%
Asus ProArt StudioBook 16 W7600H5A-2BL2
Intel Xeon W-11955M
1487 Points -20%
HWBOT x265 Benchmark v2.2 / 4k Preset
Lenovo Legion Pro 7 RTX4090
Intel Core i9-13900HX
32.2 fps +46%
HP ZBook Fury 16 G10
Intel Core i9-13950HX
26 fps +18%
Lenovo ThinkPad P16 G2 21FA000FGE
Intel Core i7-13700HX
22.2 fps +1%
Dell Precision 5690
Intel Core Ultra 9 185H
22 fps
Dell XPS 16 9640
Intel Core Ultra 7 155H
20.8 fps -5%
Dell Precision 5000 5680
Intel Core i9-13900H
20.2 fps -8%
Genomsnitt Intel Core Ultra 9 185H
  (14.1 - 22.7, n=19)
19.9 fps -10%
HP ZBook Fury 16 G9
Intel Core i9-12950HX
19.6 fps -11%
MSI CreatorPro Z16P B12UKST
Intel Core i7-12700H
19.4 fps -12%
Lenovo ThinkPad P1 G6-21FV000DGE
Intel Core i9-13900H
19.1 fps -13%
Lenovo ThinkPad P16v G1 AMD
AMD Ryzen 7 PRO 7840HS
18.1 fps -18%
Lenovo ThinkPad P16s G2 21K9000CGE
AMD Ryzen 7 PRO 7840U
17.8 fps -19%
Lenovo ThinkPad P16 G1 21D6001DMB
Intel Core i7-12850HX
17.2 fps -22%
Asus ProArt StudioBook 16 W7600H5A-2BL2
Intel Xeon W-11955M
13.4 fps -39%
Lenovo ThinkPad P1 G4-20Y30017GE
Intel Core i7-11800H
10.8 fps -51%
Samsung Galaxy Book4 Pro 360
Intel Core Ultra 5 125H
10.6 fps -52%
LibreOffice / 20 Documents To PDF
Lenovo ThinkPad P16s G2 21K9000CGE
AMD Ryzen 7 PRO 7840U
52 s * -24%
Lenovo ThinkPad P1 G4-20Y30017GE
Intel Core i7-11800H
49 s * -17%
Lenovo ThinkPad P16 G2 21FA000FGE
Intel Core i7-13700HX
49 s * -17%
Lenovo ThinkPad P1 G6-21FV000DGE
Intel Core i9-13900H
47.4 s * -13%
Lenovo ThinkPad P16 G1 21D6001DMB
Intel Core i7-12850HX
46.9 s * -12%
Genomsnitt Intel Core Ultra 9 185H
  (34.5 - 73.5, n=19)
46.1 s * -10%
Lenovo ThinkPad P16v G1 AMD
AMD Ryzen 7 PRO 7840HS
45.9 s * -10%
Dell XPS 16 9640
Intel Core Ultra 7 155H
44.8 s * -7%
HP ZBook Fury 16 G10
Intel Core i9-13950HX
43.7 s * -4%
Samsung Galaxy Book4 Pro 360
Intel Core Ultra 5 125H
42.7 s * -2%
Dell Precision 5690
Intel Core Ultra 9 185H
41.9 s *
Lenovo Legion Pro 7 RTX4090
Intel Core i9-13900HX
40.6 s * +3%
Dell Precision 5000 5680
Intel Core i9-13900H
40.4 s * +4%
MSI CreatorPro Z16P B12UKST
Intel Core i7-12700H
38.2 s * +9%
HP ZBook Fury 16 G9
Intel Core i9-12950HX
36.5 s * +13%
Asus ProArt StudioBook 16 W7600H5A-2BL2
Intel Xeon W-11955M
23 s * +45%
R Benchmark 2.5 / Overall mean
Lenovo ThinkPad P1 G4-20Y30017GE
Intel Core i7-11800H
0.595 sec * -29%
Asus ProArt StudioBook 16 W7600H5A-2BL2
Intel Xeon W-11955M
0.57 sec * -24%
Samsung Galaxy Book4 Pro 360
Intel Core Ultra 5 125H
0.503 sec * -9%
Dell XPS 16 9640
Intel Core Ultra 7 155H
0.4828 sec * -5%
Genomsnitt Intel Core Ultra 9 185H
  (0.4313 - 0.759, n=20)
0.47 sec * -2%
Lenovo ThinkPad P16s G2 21K9000CGE
AMD Ryzen 7 PRO 7840U
0.4658 sec * -1%
Dell Precision 5690
Intel Core Ultra 9 185H
0.4601 sec *
MSI CreatorPro Z16P B12UKST
Intel Core i7-12700H
0.4541 sec * +1%
Lenovo ThinkPad P16 G1 21D6001DMB
Intel Core i7-12850HX
0.45 sec * +2%
Lenovo ThinkPad P16 G2 21FA000FGE
Intel Core i7-13700HX
0.4407 sec * +4%
Lenovo ThinkPad P16v G1 AMD
AMD Ryzen 7 PRO 7840HS
0.44 sec * +4%
HP ZBook Fury 16 G9
Intel Core i9-12950HX
0.4328 sec * +6%
Lenovo ThinkPad P1 G6-21FV000DGE
Intel Core i9-13900H
0.4173 sec * +9%
Dell Precision 5000 5680
Intel Core i9-13900H
0.4115 sec * +11%
Lenovo Legion Pro 7 RTX4090
Intel Core i9-13900HX
0.401 sec * +13%
HP ZBook Fury 16 G10
Intel Core i9-13950HX
0.3876 sec * +16%
CPU Performance Rating: Percent
Cinebench R23: Multi Core | Single Core
Cinebench R20: CPU (Multi Core) | CPU (Single Core)
Cinebench R15: CPU Multi 64Bit | CPU Single 64Bit
Blender: v2.79 BMW27 CPU
7-Zip 18.03: 7z b 4 | 7z b 4 -mmt1
Geekbench 6.3: Multi-Core | Single-Core
Geekbench 5.5: Multi-Core | Single-Core
HWBOT x265 Benchmark v2.2: 4k Preset
LibreOffice : 20 Documents To PDF
R Benchmark 2.5: Overall mean

* ... mindre är bättre

Cinebench R15 CPU Multi 64Bit
3165 Points
Cinebench R15 OpenGL 64Bit
267 fps
Cinebench R15 Ref. Match 64Bit
99.6 %
Cinebench R15 CPU Single 64Bit
270 Points
Cinebench R20 CPU (Multi Core)
7387 Points
Cinebench R20 CPU (Single Core)
708 Points
Cinebench R23 Single Core
1858 Points
Cinebench R23 Multi Core
19158 Points
Hjälp
Performance Rating
HP ZBook Fury 16 G10
Intel Core i9-13950HX, NVIDIA RTX 5000 Ada Generation Laptop GPU
95.4 pt
Dell Precision 5690
Intel Core Ultra 9 185H, NVIDIA RTX 5000 Ada Generation Laptop GPU
86.8 pt
Lenovo ThinkPad P16 G2 21FA000FGE
Intel Core i7-13700HX, NVIDIA RTX 2000 Ada Generation Laptop GPU
83.3 pt
Genomsnitt Intel Core Ultra 9 185H
 
79.4 pt
Dell Precision 5000 5680
Intel Core i9-13900H, NVIDIA RTX 5000 Ada Generation Laptop GPU
76.1 pt
MSI CreatorPro Z16P B12UKST
Intel Core i7-12700H, RTX A3000 Laptop GPU
75.9 pt
Lenovo ThinkPad P1 G6-21FV000DGE
Intel Core i9-13900H, NVIDIA RTX 2000 Ada Generation Laptop GPU
74.8 pt
AIDA64 / FP32 Ray-Trace
HP ZBook Fury 16 G10
Intel Core i9-13950HX, NVIDIA RTX 5000 Ada Generation Laptop GPU
20187 KRay/s +9%
Dell Precision 5690
Intel Core Ultra 9 185H, NVIDIA RTX 5000 Ada Generation Laptop GPU
18502 KRay/s
Lenovo ThinkPad P16 G2 21FA000FGE
Intel Core i7-13700HX, NVIDIA RTX 2000 Ada Generation Laptop GPU
18420 KRay/s 0%
Genomsnitt Intel Core Ultra 9 185H
  (9220 - 18676, n=19)
16396 KRay/s -11%
Lenovo ThinkPad P1 G6-21FV000DGE
Intel Core i9-13900H, NVIDIA RTX 2000 Ada Generation Laptop GPU
16323 KRay/s -12%
Dell Precision 5000 5680
Intel Core i9-13900H, NVIDIA RTX 5000 Ada Generation Laptop GPU
15736 KRay/s -15%
MSI CreatorPro Z16P B12UKST
Intel Core i7-12700H, RTX A3000 Laptop GPU
14572 KRay/s -21%
AIDA64 / FPU Julia
HP ZBook Fury 16 G10
Intel Core i9-13950HX, NVIDIA RTX 5000 Ada Generation Laptop GPU
102591 Points +8%
Dell Precision 5690
Intel Core Ultra 9 185H, NVIDIA RTX 5000 Ada Generation Laptop GPU
94737 Points
Lenovo ThinkPad P16 G2 21FA000FGE
Intel Core i7-13700HX, NVIDIA RTX 2000 Ada Generation Laptop GPU
94499 Points 0%
Genomsnitt Intel Core Ultra 9 185H
  (48865 - 96463, n=19)
85141 Points -10%
Lenovo ThinkPad P1 G6-21FV000DGE
Intel Core i9-13900H, NVIDIA RTX 2000 Ada Generation Laptop GPU
83622 Points -12%
Dell Precision 5000 5680
Intel Core i9-13900H, NVIDIA RTX 5000 Ada Generation Laptop GPU
79013 Points -17%
MSI CreatorPro Z16P B12UKST
Intel Core i7-12700H, RTX A3000 Laptop GPU
73967 Points -22%
AIDA64 / CPU SHA3
HP ZBook Fury 16 G10
Intel Core i9-13950HX, NVIDIA RTX 5000 Ada Generation Laptop GPU
4981 MB/s +14%
Dell Precision 5690
Intel Core Ultra 9 185H, NVIDIA RTX 5000 Ada Generation Laptop GPU
4382 MB/s
Lenovo ThinkPad P16 G2 21FA000FGE
Intel Core i7-13700HX, NVIDIA RTX 2000 Ada Generation Laptop GPU
4265 MB/s -3%
Genomsnitt Intel Core Ultra 9 185H
  (2394 - 4534, n=19)
3982 MB/s -9%
Lenovo ThinkPad P1 G6-21FV000DGE
Intel Core i9-13900H, NVIDIA RTX 2000 Ada Generation Laptop GPU
3716 MB/s -15%
MSI CreatorPro Z16P B12UKST
Intel Core i7-12700H, RTX A3000 Laptop GPU
3648 MB/s -17%
Dell Precision 5000 5680
Intel Core i9-13900H, NVIDIA RTX 5000 Ada Generation Laptop GPU
3554 MB/s -19%
AIDA64 / CPU Queen
HP ZBook Fury 16 G10
Intel Core i9-13950HX, NVIDIA RTX 5000 Ada Generation Laptop GPU
131931 Points +40%
Dell Precision 5000 5680
Intel Core i9-13900H, NVIDIA RTX 5000 Ada Generation Laptop GPU
117117 Points +24%
Lenovo ThinkPad P1 G6-21FV000DGE
Intel Core i9-13900H, NVIDIA RTX 2000 Ada Generation Laptop GPU
115711 Points +23%
Lenovo ThinkPad P16 G2 21FA000FGE
Intel Core i7-13700HX, NVIDIA RTX 2000 Ada Generation Laptop GPU
109246 Points +16%
MSI CreatorPro Z16P B12UKST
Intel Core i7-12700H, RTX A3000 Laptop GPU
101642 Points +8%
Dell Precision 5690
Intel Core Ultra 9 185H, NVIDIA RTX 5000 Ada Generation Laptop GPU
94433 Points
Genomsnitt Intel Core Ultra 9 185H
  (66785 - 95241, n=19)
89708 Points -5%
AIDA64 / FPU SinJulia
HP ZBook Fury 16 G10
Intel Core i9-13950HX, NVIDIA RTX 5000 Ada Generation Laptop GPU
13321 Points +17%
Lenovo ThinkPad P16 G2 21FA000FGE
Intel Core i7-13700HX, NVIDIA RTX 2000 Ada Generation Laptop GPU
12013 Points +6%
Dell Precision 5690
Intel Core Ultra 9 185H, NVIDIA RTX 5000 Ada Generation Laptop GPU
11351 Points
Genomsnitt Intel Core Ultra 9 185H
  (7255 - 11392, n=19)
10546 Points -7%
Lenovo ThinkPad P1 G6-21FV000DGE
Intel Core i9-13900H, NVIDIA RTX 2000 Ada Generation Laptop GPU
10195 Points -10%
Dell Precision 5000 5680
Intel Core i9-13900H, NVIDIA RTX 5000 Ada Generation Laptop GPU
10022 Points -12%
MSI CreatorPro Z16P B12UKST
Intel Core i7-12700H, RTX A3000 Laptop GPU
9475 Points -17%
AIDA64 / FPU Mandel
HP ZBook Fury 16 G10
Intel Core i9-13950HX, NVIDIA RTX 5000 Ada Generation Laptop GPU
50712 Points +8%
Dell Precision 5690
Intel Core Ultra 9 185H, NVIDIA RTX 5000 Ada Generation Laptop GPU
46868 Points
Lenovo ThinkPad P16 G2 21FA000FGE
Intel Core i7-13700HX, NVIDIA RTX 2000 Ada Generation Laptop GPU
45667 Points -3%
Genomsnitt Intel Core Ultra 9 185H
  (24004 - 48020, n=19)
41756 Points -11%
Lenovo ThinkPad P1 G6-21FV000DGE
Intel Core i9-13900H, NVIDIA RTX 2000 Ada Generation Laptop GPU
40649 Points -13%
Dell Precision 5000 5680
Intel Core i9-13900H, NVIDIA RTX 5000 Ada Generation Laptop GPU
39285 Points -16%
MSI CreatorPro Z16P B12UKST
Intel Core i7-12700H, RTX A3000 Laptop GPU
35917 Points -23%
AIDA64 / CPU AES
MSI CreatorPro Z16P B12UKST
Intel Core i7-12700H, RTX A3000 Laptop GPU
132156 MB/s +49%
HP ZBook Fury 16 G10
Intel Core i9-13950HX, NVIDIA RTX 5000 Ada Generation Laptop GPU
99981 MB/s +12%
Genomsnitt Intel Core Ultra 9 185H
  (53116 - 154066, n=19)
91381 MB/s +3%
Dell Precision 5690
Intel Core Ultra 9 185H, NVIDIA RTX 5000 Ada Generation Laptop GPU
88875 MB/s
Lenovo ThinkPad P16 G2 21FA000FGE
Intel Core i7-13700HX, NVIDIA RTX 2000 Ada Generation Laptop GPU
88115 MB/s -1%
Lenovo ThinkPad P1 G6-21FV000DGE
Intel Core i9-13900H, NVIDIA RTX 2000 Ada Generation Laptop GPU
76120 MB/s -14%
Dell Precision 5000 5680
Intel Core i9-13900H, NVIDIA RTX 5000 Ada Generation Laptop GPU
72595 MB/s -18%
AIDA64 / CPU ZLib
HP ZBook Fury 16 G10
Intel Core i9-13950HX, NVIDIA RTX 5000 Ada Generation Laptop GPU
1472 MB/s +10%
Dell Precision 5690
Intel Core Ultra 9 185H, NVIDIA RTX 5000 Ada Generation Laptop GPU
1341 MB/s
Genomsnitt Intel Core Ultra 9 185H
  (678 - 1341, n=19)
1163 MB/s -13%
Lenovo ThinkPad P16 G2 21FA000FGE
Intel Core i7-13700HX, NVIDIA RTX 2000 Ada Generation Laptop GPU
1126 MB/s -16%
Lenovo ThinkPad P1 G6-21FV000DGE
Intel Core i9-13900H, NVIDIA RTX 2000 Ada Generation Laptop GPU
1116 MB/s -17%
MSI CreatorPro Z16P B12UKST
Intel Core i7-12700H, RTX A3000 Laptop GPU
1013 MB/s -24%
Dell Precision 5000 5680
Intel Core i9-13900H, NVIDIA RTX 5000 Ada Generation Laptop GPU
999 MB/s -26%
AIDA64 / FP64 Ray-Trace
HP ZBook Fury 16 G10
Intel Core i9-13950HX, NVIDIA RTX 5000 Ada Generation Laptop GPU
10986 KRay/s +13%
Lenovo ThinkPad P16 G2 21FA000FGE
Intel Core i7-13700HX, NVIDIA RTX 2000 Ada Generation Laptop GPU
9876 KRay/s +2%
Dell Precision 5690
Intel Core Ultra 9 185H, NVIDIA RTX 5000 Ada Generation Laptop GPU
9707 KRay/s
Lenovo ThinkPad P1 G6-21FV000DGE
Intel Core i9-13900H, NVIDIA RTX 2000 Ada Generation Laptop GPU
8810 KRay/s -9%
Genomsnitt Intel Core Ultra 9 185H
  (4428 - 10078, n=19)
8582 KRay/s -12%
Dell Precision 5000 5680
Intel Core i9-13900H, NVIDIA RTX 5000 Ada Generation Laptop GPU
8523 KRay/s -12%
MSI CreatorPro Z16P B12UKST
Intel Core i7-12700H, RTX A3000 Laptop GPU
7829 KRay/s -19%
AIDA64 / CPU PhotoWorxx
Dell Precision 5690
Intel Core Ultra 9 185H, NVIDIA RTX 5000 Ada Generation Laptop GPU
51647 MPixel/s
Genomsnitt Intel Core Ultra 9 185H
  (44547 - 53918, n=19)
48798 MPixel/s -6%
Dell Precision 5000 5680
Intel Core i9-13900H, NVIDIA RTX 5000 Ada Generation Laptop GPU
48038 MPixel/s -7%
MSI CreatorPro Z16P B12UKST
Intel Core i7-12700H, RTX A3000 Laptop GPU
42574 MPixel/s -18%
HP ZBook Fury 16 G10
Intel Core i9-13950HX, NVIDIA RTX 5000 Ada Generation Laptop GPU
40233 MPixel/s -22%
Lenovo ThinkPad P16 G2 21FA000FGE
Intel Core i7-13700HX, NVIDIA RTX 2000 Ada Generation Laptop GPU
35176 MPixel/s -32%
Lenovo ThinkPad P1 G6-21FV000DGE
Intel Core i9-13900H, NVIDIA RTX 2000 Ada Generation Laptop GPU
27270 MPixel/s -47%

Stresstest

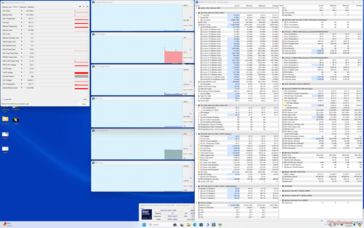
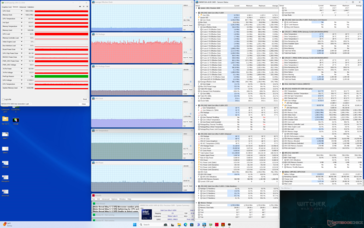
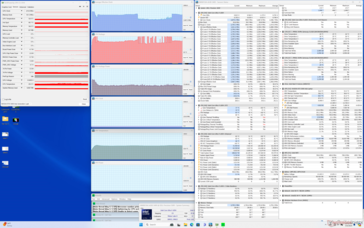
När Prime95-stress initierades ökade processorn till 3,7 GHz och 120 W tills den nådde en kärntemperatur på 100 C bara några sekunder senare. Den skulle sedan sjunka till 3 GHz och 73 W och förbli relativt stabil hela tiden. Både kärntemperaturen och paketets strömuttag skulle vara något högre än vad vi registrerade på Precision 5680.

GPU-kortets strömförbrukning under körning Witcher 3 skulle vara stabilt på 72 W trots att GPU:n är listad som 90 W på Nvidia Control Center. Resultaten liknar vad vi registrerade på förra årets modell.

System på tomgång
System på tomgång
Witcher 3 stress
Witcher 3 stress
Prime95 stress
Prime95 stress
Prime95+FurMark stress
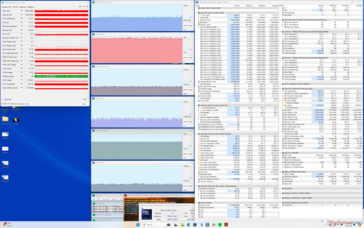
CPU-klocka (GHz) GPU-klocka (MHz) Genomsnittlig CPU-temperatur (°C) Genomsnittlig GPU-temperatur (°C)
System i viloläge -- -- 43 35
Prime95 Stress 3.0 -- 83 53
Prime95 + FurMark Stress ~3.0 ~1680 93 65
Witcher 3 Stress ~0,6 1530 75 62

Systemets prestanda

PCMark 10-resultaten är i stort sett identiska med dem som vi registrerade på Precision 5680, vilket tyder på att det inte finns några större prestandaskillnader mellan de två modellerna när det gäller traditionella uppgifter.

Systemets RAM-minne är något snabbare i år (7467 jämfört med 6000 MT/s) och detta återspeglas i de förbättrade AIDA64-resultaten.

PCMark 10 Standard
PCMark 10 Standard
PCMark 10 / Score
Dell Precision 5000 5680
NVIDIA RTX 5000 Ada Generation Laptop GPU, i9-13900H, 2x SK hynix PC801 HFS512GEJ9X101N RAID 0
8587 Points +6%
HP ZBook Fury 16 G10
NVIDIA RTX 5000 Ada Generation Laptop GPU, i9-13950HX, SK hynix PC801 HFS001TEJ9X101N
8102 Points 0%
Dell Precision 5690
NVIDIA RTX 5000 Ada Generation Laptop GPU, Ultra 9 185H, 2x Samsung PM9A1 1TB (RAID 0)
8065 Points
Genomsnitt Intel Core Ultra 9 185H, NVIDIA RTX 5000 Ada Generation Laptop GPU
  ()
8065 Points 0%
Lenovo ThinkPad P1 G6-21FV000DGE
NVIDIA RTX 2000 Ada Generation Laptop GPU, i9-13900H, SK Hynix PC711 1TB HFS001TDE9X084N
7522 Points -7%
Lenovo ThinkPad P16 G2 21FA000FGE
NVIDIA RTX 2000 Ada Generation Laptop GPU, i7-13700HX, SK hynix PC801 HFS001TEJ9X162N
7154 Points -11%
MSI CreatorPro Z16P B12UKST
RTX A3000 Laptop GPU, i7-12700H, Samsung PM9A1 MZVL21T0HCLR
7086 Points -12%
PCMark 10 / Essentials
Dell Precision 5000 5680
NVIDIA RTX 5000 Ada Generation Laptop GPU, i9-13900H, 2x SK hynix PC801 HFS512GEJ9X101N RAID 0
11760 Points +7%
Lenovo ThinkPad P1 G6-21FV000DGE
NVIDIA RTX 2000 Ada Generation Laptop GPU, i9-13900H, SK Hynix PC711 1TB HFS001TDE9X084N
11105 Points +1%
HP ZBook Fury 16 G10
NVIDIA RTX 5000 Ada Generation Laptop GPU, i9-13950HX, SK hynix PC801 HFS001TEJ9X101N
11072 Points +1%
Dell Precision 5690
NVIDIA RTX 5000 Ada Generation Laptop GPU, Ultra 9 185H, 2x Samsung PM9A1 1TB (RAID 0)
11011 Points
Genomsnitt Intel Core Ultra 9 185H, NVIDIA RTX 5000 Ada Generation Laptop GPU
  ()
11011 Points 0%
Lenovo ThinkPad P16 G2 21FA000FGE
NVIDIA RTX 2000 Ada Generation Laptop GPU, i7-13700HX, SK hynix PC801 HFS001TEJ9X162N
10987 Points 0%
MSI CreatorPro Z16P B12UKST
RTX A3000 Laptop GPU, i7-12700H, Samsung PM9A1 MZVL21T0HCLR
10583 Points -4%
PCMark 10 / Productivity
Dell Precision 5000 5680
NVIDIA RTX 5000 Ada Generation Laptop GPU, i9-13900H, 2x SK hynix PC801 HFS512GEJ9X101N RAID 0
10820 Points +3%
Dell Precision 5690
NVIDIA RTX 5000 Ada Generation Laptop GPU, Ultra 9 185H, 2x Samsung PM9A1 1TB (RAID 0)
10548 Points
Genomsnitt Intel Core Ultra 9 185H, NVIDIA RTX 5000 Ada Generation Laptop GPU
  ()
10548 Points 0%
Lenovo ThinkPad P1 G6-21FV000DGE
NVIDIA RTX 2000 Ada Generation Laptop GPU, i9-13900H, SK Hynix PC711 1TB HFS001TDE9X084N
9779 Points -7%
Lenovo ThinkPad P16 G2 21FA000FGE
NVIDIA RTX 2000 Ada Generation Laptop GPU, i7-13700HX, SK hynix PC801 HFS001TEJ9X162N
9388 Points -11%
MSI CreatorPro Z16P B12UKST
RTX A3000 Laptop GPU, i7-12700H, Samsung PM9A1 MZVL21T0HCLR
9351 Points -11%
HP ZBook Fury 16 G10
NVIDIA RTX 5000 Ada Generation Laptop GPU, i9-13950HX, SK hynix PC801 HFS001TEJ9X101N
9344 Points -11%
PCMark 10 / Digital Content Creation
HP ZBook Fury 16 G10
NVIDIA RTX 5000 Ada Generation Laptop GPU, i9-13950HX, SK hynix PC801 HFS001TEJ9X101N
13947 Points +14%
Dell Precision 5000 5680
NVIDIA RTX 5000 Ada Generation Laptop GPU, i9-13900H, 2x SK hynix PC801 HFS512GEJ9X101N RAID 0
13503 Points +10%
Dell Precision 5690
NVIDIA RTX 5000 Ada Generation Laptop GPU, Ultra 9 185H, 2x Samsung PM9A1 1TB (RAID 0)
12259 Points
Genomsnitt Intel Core Ultra 9 185H, NVIDIA RTX 5000 Ada Generation Laptop GPU
  ()
12259 Points 0%
Lenovo ThinkPad P1 G6-21FV000DGE
NVIDIA RTX 2000 Ada Generation Laptop GPU, i9-13900H, SK Hynix PC711 1TB HFS001TDE9X084N
10633 Points -13%
MSI CreatorPro Z16P B12UKST
RTX A3000 Laptop GPU, i7-12700H, Samsung PM9A1 MZVL21T0HCLR
9757 Points -20%
Lenovo ThinkPad P16 G2 21FA000FGE
NVIDIA RTX 2000 Ada Generation Laptop GPU, i7-13700HX, SK hynix PC801 HFS001TEJ9X162N
9633 Points -21%
CrossMark / Overall
MSI CreatorPro Z16P B12UKST
RTX A3000 Laptop GPU, i7-12700H, Samsung PM9A1 MZVL21T0HCLR
1932 Points +6%
Dell Precision 5000 5680
NVIDIA RTX 5000 Ada Generation Laptop GPU, i9-13900H, 2x SK hynix PC801 HFS512GEJ9X101N RAID 0
1918 Points +5%
HP ZBook Fury 16 G10
NVIDIA RTX 5000 Ada Generation Laptop GPU, i9-13950HX, SK hynix PC801 HFS001TEJ9X101N
1911 Points +5%
Lenovo ThinkPad P1 G6-21FV000DGE
NVIDIA RTX 2000 Ada Generation Laptop GPU, i9-13900H, SK Hynix PC711 1TB HFS001TDE9X084N
1859 Points +2%
Lenovo ThinkPad P16 G2 21FA000FGE
NVIDIA RTX 2000 Ada Generation Laptop GPU, i7-13700HX, SK hynix PC801 HFS001TEJ9X162N
1831 Points 0%
Dell Precision 5690
NVIDIA RTX 5000 Ada Generation Laptop GPU, Ultra 9 185H, 2x Samsung PM9A1 1TB (RAID 0)
1823 Points
Genomsnitt Intel Core Ultra 9 185H, NVIDIA RTX 5000 Ada Generation Laptop GPU
  ()
1823 Points 0%
CrossMark / Productivity
HP ZBook Fury 16 G10
NVIDIA RTX 5000 Ada Generation Laptop GPU, i9-13950HX, SK hynix PC801 HFS001TEJ9X101N
1836 Points +6%
MSI CreatorPro Z16P B12UKST
RTX A3000 Laptop GPU, i7-12700H, Samsung PM9A1 MZVL21T0HCLR
1823 Points +5%
Dell Precision 5000 5680
NVIDIA RTX 5000 Ada Generation Laptop GPU, i9-13900H, 2x SK hynix PC801 HFS512GEJ9X101N RAID 0
1797 Points +3%
Lenovo ThinkPad P1 G6-21FV000DGE
NVIDIA RTX 2000 Ada Generation Laptop GPU, i9-13900H, SK Hynix PC711 1TB HFS001TDE9X084N
1796 Points +3%
Dell Precision 5690
NVIDIA RTX 5000 Ada Generation Laptop GPU, Ultra 9 185H, 2x Samsung PM9A1 1TB (RAID 0)
1739 Points
Genomsnitt Intel Core Ultra 9 185H, NVIDIA RTX 5000 Ada Generation Laptop GPU
  ()
1739 Points 0%
Lenovo ThinkPad P16 G2 21FA000FGE
NVIDIA RTX 2000 Ada Generation Laptop GPU, i7-13700HX, SK hynix PC801 HFS001TEJ9X162N
1704 Points -2%
CrossMark / Creativity
Dell Precision 5000 5680
NVIDIA RTX 5000 Ada Generation Laptop GPU, i9-13900H, 2x SK hynix PC801 HFS512GEJ9X101N RAID 0
2190 Points +8%
Lenovo ThinkPad P16 G2 21FA000FGE
NVIDIA RTX 2000 Ada Generation Laptop GPU, i7-13700HX, SK hynix PC801 HFS001TEJ9X162N
2123 Points +5%
HP ZBook Fury 16 G10
NVIDIA RTX 5000 Ada Generation Laptop GPU, i9-13950HX, SK hynix PC801 HFS001TEJ9X101N
2091 Points +3%
MSI CreatorPro Z16P B12UKST
RTX A3000 Laptop GPU, i7-12700H, Samsung PM9A1 MZVL21T0HCLR
2071 Points +2%
Lenovo ThinkPad P1 G6-21FV000DGE
NVIDIA RTX 2000 Ada Generation Laptop GPU, i9-13900H, SK Hynix PC711 1TB HFS001TDE9X084N
2038 Points +1%
Dell Precision 5690
NVIDIA RTX 5000 Ada Generation Laptop GPU, Ultra 9 185H, 2x Samsung PM9A1 1TB (RAID 0)
2025 Points
Genomsnitt Intel Core Ultra 9 185H, NVIDIA RTX 5000 Ada Generation Laptop GPU
  ()
2025 Points 0%
CrossMark / Responsiveness
MSI CreatorPro Z16P B12UKST
RTX A3000 Laptop GPU, i7-12700H, Samsung PM9A1 MZVL21T0HCLR
1865 Points +22%
HP ZBook Fury 16 G10
NVIDIA RTX 5000 Ada Generation Laptop GPU, i9-13950HX, SK hynix PC801 HFS001TEJ9X101N
1645 Points +7%
Lenovo ThinkPad P1 G6-21FV000DGE
NVIDIA RTX 2000 Ada Generation Laptop GPU, i9-13900H, SK Hynix PC711 1TB HFS001TDE9X084N
1566 Points +2%
Dell Precision 5000 5680
NVIDIA RTX 5000 Ada Generation Laptop GPU, i9-13900H, 2x SK hynix PC801 HFS512GEJ9X101N RAID 0
1565 Points +2%
Dell Precision 5690
NVIDIA RTX 5000 Ada Generation Laptop GPU, Ultra 9 185H, 2x Samsung PM9A1 1TB (RAID 0)
1533 Points
Genomsnitt Intel Core Ultra 9 185H, NVIDIA RTX 5000 Ada Generation Laptop GPU
  ()
1533 Points 0%
Lenovo ThinkPad P16 G2 21FA000FGE
NVIDIA RTX 2000 Ada Generation Laptop GPU, i7-13700HX, SK hynix PC801 HFS001TEJ9X162N
1457 Points -5%
WebXPRT 3 / Overall
Dell Precision 5000 5680
NVIDIA RTX 5000 Ada Generation Laptop GPU, i9-13900H, 2x SK hynix PC801 HFS512GEJ9X101N RAID 0
340 Points +16%
HP ZBook Fury 16 G10
NVIDIA RTX 5000 Ada Generation Laptop GPU, i9-13950HX, SK hynix PC801 HFS001TEJ9X101N
339 Points +16%
Lenovo ThinkPad P16 G2 21FA000FGE
NVIDIA RTX 2000 Ada Generation Laptop GPU, i7-13700HX, SK hynix PC801 HFS001TEJ9X162N
324 Points +11%
Lenovo ThinkPad P1 G6-21FV000DGE
NVIDIA RTX 2000 Ada Generation Laptop GPU, i9-13900H, SK Hynix PC711 1TB HFS001TDE9X084N
319 Points +9%
MSI CreatorPro Z16P B12UKST
RTX A3000 Laptop GPU, i7-12700H, Samsung PM9A1 MZVL21T0HCLR
312 Points +6%
Dell Precision 5690
NVIDIA RTX 5000 Ada Generation Laptop GPU, Ultra 9 185H, 2x Samsung PM9A1 1TB (RAID 0)
293 Points
Genomsnitt Intel Core Ultra 9 185H, NVIDIA RTX 5000 Ada Generation Laptop GPU
  ()
293 Points 0%
WebXPRT 4 / Overall
Lenovo ThinkPad P1 G6-21FV000DGE
NVIDIA RTX 2000 Ada Generation Laptop GPU, i9-13900H, SK Hynix PC711 1TB HFS001TDE9X084N
338 Points +26%
HP ZBook Fury 16 G10
NVIDIA RTX 5000 Ada Generation Laptop GPU, i9-13950HX, SK hynix PC801 HFS001TEJ9X101N
301 Points +12%
Dell Precision 5000 5680
NVIDIA RTX 5000 Ada Generation Laptop GPU, i9-13900H, 2x SK hynix PC801 HFS512GEJ9X101N RAID 0
289 Points +7%
Dell Precision 5690
NVIDIA RTX 5000 Ada Generation Laptop GPU, Ultra 9 185H, 2x Samsung PM9A1 1TB (RAID 0)
269 Points
Genomsnitt Intel Core Ultra 9 185H, NVIDIA RTX 5000 Ada Generation Laptop GPU
  ()
269 Points 0%
MSI CreatorPro Z16P B12UKST
RTX A3000 Laptop GPU, i7-12700H, Samsung PM9A1 MZVL21T0HCLR
267 Points -1%
Mozilla Kraken 1.1 / Total
MSI CreatorPro Z16P B12UKST
RTX A3000 Laptop GPU, i7-12700H, Samsung PM9A1 MZVL21T0HCLR
520 ms * -3%
Dell Precision 5690
NVIDIA RTX 5000 Ada Generation Laptop GPU, Ultra 9 185H, 2x Samsung PM9A1 1TB (RAID 0)
506 ms *
Genomsnitt Intel Core Ultra 9 185H, NVIDIA RTX 5000 Ada Generation Laptop GPU
  ()
506 ms * -0%
Lenovo ThinkPad P16 G2 21FA000FGE
NVIDIA RTX 2000 Ada Generation Laptop GPU, i7-13700HX, SK hynix PC801 HFS001TEJ9X162N
489 ms * +3%
Dell Precision 5000 5680
NVIDIA RTX 5000 Ada Generation Laptop GPU, i9-13900H, 2x SK hynix PC801 HFS512GEJ9X101N RAID 0
472 ms * +7%
Lenovo ThinkPad P1 G6-21FV000DGE
NVIDIA RTX 2000 Ada Generation Laptop GPU, i9-13900H, SK Hynix PC711 1TB HFS001TDE9X084N
467 ms * +8%
HP ZBook Fury 16 G10
NVIDIA RTX 5000 Ada Generation Laptop GPU, i9-13950HX, SK hynix PC801 HFS001TEJ9X101N
451 ms * +11%

* ... mindre är bättre

PCMark 10 Score
8065 poäng
Hjälp
AIDA64 / Memory Copy
Dell Precision 5690
Intel Core Ultra 9 185H, NVIDIA RTX 5000 Ada Generation Laptop GPU
91273 MB/s
Genomsnitt Intel Core Ultra 9 185H
  (69929 - 95718, n=19)
84413 MB/s -8%
Dell Precision 5000 5680
Intel Core i9-13900H, NVIDIA RTX 5000 Ada Generation Laptop GPU
73460 MB/s -20%
MSI CreatorPro Z16P B12UKST
Intel Core i7-12700H, RTX A3000 Laptop GPU
62711 MB/s -31%
HP ZBook Fury 16 G10
Intel Core i9-13950HX, NVIDIA RTX 5000 Ada Generation Laptop GPU
61938 MB/s -32%
Lenovo ThinkPad P16 G2 21FA000FGE
Intel Core i7-13700HX, NVIDIA RTX 2000 Ada Generation Laptop GPU
56335 MB/s -38%
Lenovo ThinkPad P1 G6-21FV000DGE
Intel Core i9-13900H, NVIDIA RTX 2000 Ada Generation Laptop GPU
41392 MB/s -55%
AIDA64 / Memory Read
Dell Precision 5690
Intel Core Ultra 9 185H, NVIDIA RTX 5000 Ada Generation Laptop GPU
86584 MB/s
Genomsnitt Intel Core Ultra 9 185H
  (64619 - 87768, n=19)
79657 MB/s -8%
Dell Precision 5000 5680
Intel Core i9-13900H, NVIDIA RTX 5000 Ada Generation Laptop GPU
67554 MB/s -22%
MSI CreatorPro Z16P B12UKST
Intel Core i7-12700H, RTX A3000 Laptop GPU
65648 MB/s -24%
HP ZBook Fury 16 G10
Intel Core i9-13950HX, NVIDIA RTX 5000 Ada Generation Laptop GPU
62368 MB/s -28%
Lenovo ThinkPad P16 G2 21FA000FGE
Intel Core i7-13700HX, NVIDIA RTX 2000 Ada Generation Laptop GPU
57623 MB/s -33%
Lenovo ThinkPad P1 G6-21FV000DGE
Intel Core i9-13900H, NVIDIA RTX 2000 Ada Generation Laptop GPU
44374 MB/s -49%
AIDA64 / Memory Write
Dell Precision 5000 5680
Intel Core i9-13900H, NVIDIA RTX 5000 Ada Generation Laptop GPU
81621 MB/s +11%
Dell Precision 5690
Intel Core Ultra 9 185H, NVIDIA RTX 5000 Ada Generation Laptop GPU
73682 MB/s
Genomsnitt Intel Core Ultra 9 185H
  (51114 - 93871, n=19)
72498 MB/s -2%
MSI CreatorPro Z16P B12UKST
Intel Core i7-12700H, RTX A3000 Laptop GPU
65459 MB/s -11%
HP ZBook Fury 16 G10
Intel Core i9-13950HX, NVIDIA RTX 5000 Ada Generation Laptop GPU
59501 MB/s -19%
Lenovo ThinkPad P16 G2 21FA000FGE
Intel Core i7-13700HX, NVIDIA RTX 2000 Ada Generation Laptop GPU
57477 MB/s -22%
Lenovo ThinkPad P1 G6-21FV000DGE
Intel Core i9-13900H, NVIDIA RTX 2000 Ada Generation Laptop GPU
39166 MB/s -47%
AIDA64 / Memory Latency
Genomsnitt Intel Core Ultra 9 185H
  (121.4 - 259, n=19)
145.5 ns * -3%
Dell Precision 5690
Intel Core Ultra 9 185H, NVIDIA RTX 5000 Ada Generation Laptop GPU
140.8 ns *
HP ZBook Fury 16 G10
Intel Core i9-13950HX, NVIDIA RTX 5000 Ada Generation Laptop GPU
98.7 ns * +30%
Lenovo ThinkPad P16 G2 21FA000FGE
Intel Core i7-13700HX, NVIDIA RTX 2000 Ada Generation Laptop GPU
97.9 ns * +30%
MSI CreatorPro Z16P B12UKST
Intel Core i7-12700H, RTX A3000 Laptop GPU
95.2 ns * +32%
Dell Precision 5000 5680
Intel Core i9-13900H, NVIDIA RTX 5000 Ada Generation Laptop GPU
91.9 ns * +35%
Lenovo ThinkPad P1 G6-21FV000DGE
Intel Core i9-13900H, NVIDIA RTX 2000 Ada Generation Laptop GPU
83.4 ns * +41%

* ... mindre är bättre

DPC-fördröjning

LatencyMon avslöjar endast mindre DPC-problem när du öppnar flera webbläsarflikar på vår hemsida. uppspelning av 4K-video med 60 FPS är annars perfekt utan några tappade bildrutor.

LatencyMon
LatencyMon
Lista över förare
Lista över förare
DPC Latencies / LatencyMon - interrupt to process latency (max), Web, Youtube, Prime95
HP ZBook Fury 16 G10
NVIDIA RTX 5000 Ada Generation Laptop GPU, i9-13950HX, SK hynix PC801 HFS001TEJ9X101N
2684.8 μs * -431%
Lenovo ThinkPad P1 G6-21FV000DGE
NVIDIA RTX 2000 Ada Generation Laptop GPU, i9-13900H, SK Hynix PC711 1TB HFS001TDE9X084N
2431 μs * -381%
Dell Precision 5000 5680
NVIDIA RTX 5000 Ada Generation Laptop GPU, i9-13900H, 2x SK hynix PC801 HFS512GEJ9X101N RAID 0
1647.9 μs * -226%
Lenovo ThinkPad P16 G2 21FA000FGE
NVIDIA RTX 2000 Ada Generation Laptop GPU, i7-13700HX, SK hynix PC801 HFS001TEJ9X162N
1004.2 μs * -99%
MSI CreatorPro Z16P B12UKST
RTX A3000 Laptop GPU, i7-12700H, Samsung PM9A1 MZVL21T0HCLR
512.3 μs * -1%
Dell Precision 5690
NVIDIA RTX 5000 Ada Generation Laptop GPU, Ultra 9 185H, 2x Samsung PM9A1 1TB (RAID 0)
505.5 μs *

* ... mindre är bättre

Lagringsenheter

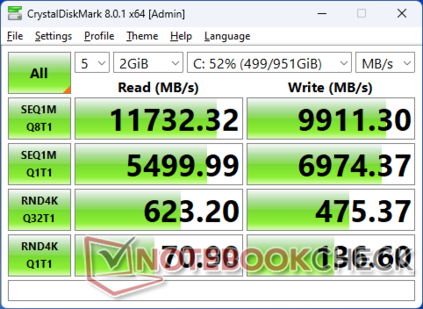
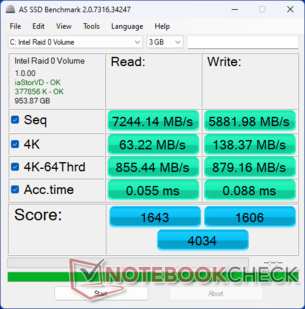
Vår testenhet levereras med två Samsung PM9A1 PCIe4 x4 NVMe SSD-enheter i RAID 0-konfiguration för läs- och skrivhastigheter som överstiger 12000 MB/s respektive 9000 MB/s. Prestandan är stabil utan att någon strypning registreras när DiskSpd körs i en loop.

CDM 8
CDM 8
AS SSD
AS SSD
2x Samsung PM9A1 1TB (RAID 0)
CDM 5/6 Read Seq Q32T1: 9733 MB/s
CDM 5/6 Write Seq Q32T1: 9693 MB/s
CDM 5/6 Read 4K Q32T1: 614.4 MB/s
CDM 5/6 Write 4K Q32T1: 467.8 MB/s
CDM 5 Read Seq: 5492 MB/s
CDM 5 Write Seq: 6963 MB/s
CDM 5/6 Read 4K: 70.31 MB/s
CDM 5/6 Write 4K: 133.2 MB/s
Drive Performance Rating - Percent
MSI CreatorPro Z16P B12UKST -8!
Samsung PM9A1 MZVL21T0HCLR
85.6 pt
Lenovo ThinkPad P1 G6-21FV000DGE
SK Hynix PC711 1TB HFS001TDE9X084N
72.9 pt
Dell Precision 5690
2x Samsung PM9A1 1TB (RAID 0)
69 pt
HP ZBook Fury 16 G10
SK hynix PC801 HFS001TEJ9X101N
65.1 pt
Dell Precision 5000 5680
2x SK hynix PC801 HFS512GEJ9X101N RAID 0
58 pt
Lenovo ThinkPad P16 G2 21FA000FGE
SK hynix PC801 HFS001TEJ9X162N
57.5 pt
DiskSpd
seq read
Dell Precision 5690
2x Samsung PM9A1 1TB (RAID 0)
5715 (5635.1min - 5715.37max) MB/s
Lenovo ThinkPad P16 G2 21FA000FGE
SK hynix PC801 HFS001TEJ9X162N
4658 (4604.53min - 4657.77max) MB/s -18%
Lenovo ThinkPad P1 G6-21FV000DGE
SK Hynix PC711 1TB HFS001TDE9X084N
3679 (3648min - 3679.43max) MB/s -36%
HP ZBook Fury 16 G10
SK hynix PC801 HFS001TEJ9X101N
3491 (3465.76min - 3491.19max) MB/s -39%
Dell Precision 5000 5680
2x SK hynix PC801 HFS512GEJ9X101N RAID 0
2482 (2434.58min - 2482.19max) MB/s -57%
seq write
Dell Precision 5690
2x Samsung PM9A1 1TB (RAID 0)
7289 (7243.34min - 7289.49max) MB/s
Dell Precision 5000 5680
2x SK hynix PC801 HFS512GEJ9X101N RAID 0
4595 (4451.62min - 4594.61max) MB/s -37%
Lenovo ThinkPad P1 G6-21FV000DGE
SK Hynix PC711 1TB HFS001TDE9X084N
3838 (3640.92min - 3837.91max) MB/s -47%
Lenovo ThinkPad P16 G2 21FA000FGE
SK hynix PC801 HFS001TEJ9X162N
3564 (3288.75min - 3564.11max) MB/s -51%
HP ZBook Fury 16 G10
SK hynix PC801 HFS001TEJ9X101N
3329 (3125.64min - 3329.18max) MB/s -54%
seq q8 t1 read
Dell Precision 5690
2x Samsung PM9A1 1TB (RAID 0)
12631 (9772.1min - 12631.4max) MB/s
Lenovo ThinkPad P16 G2 21FA000FGE
SK hynix PC801 HFS001TEJ9X162N
7157 (6238.19min - 7156.53max) MB/s -43%
Lenovo ThinkPad P1 G6-21FV000DGE
SK Hynix PC711 1TB HFS001TDE9X084N
6805 (5894min - 6805.47max) MB/s -46%
HP ZBook Fury 16 G10
SK hynix PC801 HFS001TEJ9X101N
6777 (5485.73min - 6777.16max) MB/s -46%
Dell Precision 5000 5680
2x SK hynix PC801 HFS512GEJ9X101N RAID 0
5532 (5039.88min - 5532.45max) MB/s -56%
seq q8 t1 write
Dell Precision 5690
2x Samsung PM9A1 1TB (RAID 0)
9890 (9840.5min - 9889.75max) MB/s
Dell Precision 5000 5680
2x SK hynix PC801 HFS512GEJ9X101N RAID 0
6850 (6599.93min - 6849.79max) MB/s -31%
Lenovo ThinkPad P1 G6-21FV000DGE
SK Hynix PC711 1TB HFS001TDE9X084N
6133 (6113.62min - 6132.7max) MB/s -38%
Lenovo ThinkPad P16 G2 21FA000FGE
SK hynix PC801 HFS001TEJ9X162N
6125 (6104.39min - 6125.07max) MB/s -38%
HP ZBook Fury 16 G10
SK hynix PC801 HFS001TEJ9X101N
5947 (5906.91min - 5946.83max) MB/s -40%
4k q1 t1 read
Lenovo ThinkPad P1 G6-21FV000DGE
SK Hynix PC711 1TB HFS001TDE9X084N
78.7 (77.55min - 78.68max) MB/s +7%
Dell Precision 5690
2x Samsung PM9A1 1TB (RAID 0)
73.6 (72.71min - 73.64max) MB/s
Dell Precision 5000 5680
2x SK hynix PC801 HFS512GEJ9X101N RAID 0
71.6 (70.11min - 71.64max) MB/s -3%
HP ZBook Fury 16 G10
SK hynix PC801 HFS001TEJ9X101N
67.7 (66.87min - 67.69max) MB/s -8%
Lenovo ThinkPad P16 G2 21FA000FGE
SK hynix PC801 HFS001TEJ9X162N
55.2 (54.95min - 55.23max) MB/s -25%
4k q1 t1 write
Lenovo ThinkPad P1 G6-21FV000DGE
SK Hynix PC711 1TB HFS001TDE9X084N
173.8 (168.32min - 173.76max) MB/s +14%
HP ZBook Fury 16 G10
SK hynix PC801 HFS001TEJ9X101N
168.1 (166.5min - 168.07max) MB/s +10%
Dell Precision 5690
2x Samsung PM9A1 1TB (RAID 0)
152.4 (152.02min - 152.36max) MB/s
Dell Precision 5000 5680
2x SK hynix PC801 HFS512GEJ9X101N RAID 0
150.3 (148.89min - 150.27max) MB/s -1%
Lenovo ThinkPad P16 G2 21FA000FGE
SK hynix PC801 HFS001TEJ9X162N
122.2 (121.67min - 122.17max) MB/s -20%
4k q32 t16 read
Dell Precision 5690
2x Samsung PM9A1 1TB (RAID 0)
1184 (1095.52min - 1183.72max) MB/s
Lenovo ThinkPad P1 G6-21FV000DGE
SK Hynix PC711 1TB HFS001TDE9X084N
1038 (1028.33min - 1037.94max) MB/s -12%
HP ZBook Fury 16 G10
SK hynix PC801 HFS001TEJ9X101N
921 (877.33min - 921.47max) MB/s -22%
Lenovo ThinkPad P16 G2 21FA000FGE
SK hynix PC801 HFS001TEJ9X162N
909 (877.94min - 908.91max) MB/s -23%
Dell Precision 5000 5680
2x SK hynix PC801 HFS512GEJ9X101N RAID 0
729 (721.41min - 729.08max) MB/s -38%
4k q32 t16 write
Dell Precision 5690
2x Samsung PM9A1 1TB (RAID 0)
1146 (1126.09min - 1146.07max) MB/s
HP ZBook Fury 16 G10
SK hynix PC801 HFS001TEJ9X101N
524 (499.38min - 523.63max) MB/s -54%
Dell Precision 5000 5680
2x SK hynix PC801 HFS512GEJ9X101N RAID 0
490 (473.5min - 489.71max) MB/s -57%
Lenovo ThinkPad P1 G6-21FV000DGE
SK Hynix PC711 1TB HFS001TDE9X084N
457 (441.69min - 456.84max) MB/s -60%
Lenovo ThinkPad P16 G2 21FA000FGE
SK hynix PC801 HFS001TEJ9X162N
457 (451.72min - 456.57max) MB/s -60%
AS SSD
Score Total
MSI CreatorPro Z16P B12UKST
Samsung PM9A1 MZVL21T0HCLR
8992 Points +123%
Lenovo ThinkPad P1 G6-21FV000DGE
SK Hynix PC711 1TB HFS001TDE9X084N
6729 Points +67%
HP ZBook Fury 16 G10
SK hynix PC801 HFS001TEJ9X101N
6420 Points +59%
Lenovo ThinkPad P16 G2 21FA000FGE
SK hynix PC801 HFS001TEJ9X162N
5943 Points +47%
Dell Precision 5690
2x Samsung PM9A1 1TB (RAID 0)
4034 Points
Dell Precision 5000 5680
2x SK hynix PC801 HFS512GEJ9X101N RAID 0
3997 Points -1%
Score Read
MSI CreatorPro Z16P B12UKST
Samsung PM9A1 MZVL21T0HCLR
3378 Points +106%
Dell Precision 5000 5680
2x SK hynix PC801 HFS512GEJ9X101N RAID 0
1726 Points +5%
Dell Precision 5690
2x Samsung PM9A1 1TB (RAID 0)
1643 Points
Lenovo ThinkPad P1 G6-21FV000DGE
SK Hynix PC711 1TB HFS001TDE9X084N
1586 Points -3%
HP ZBook Fury 16 G10
SK hynix PC801 HFS001TEJ9X101N
1554 Points -5%
Lenovo ThinkPad P16 G2 21FA000FGE
SK hynix PC801 HFS001TEJ9X162N
1490 Points -9%
Score Write
Lenovo ThinkPad P1 G6-21FV000DGE
SK Hynix PC711 1TB HFS001TDE9X084N
4410 Points +175%
HP ZBook Fury 16 G10
SK hynix PC801 HFS001TEJ9X101N
4189 Points +161%
MSI CreatorPro Z16P B12UKST
Samsung PM9A1 MZVL21T0HCLR
3941 Points +145%
Lenovo ThinkPad P16 G2 21FA000FGE
SK hynix PC801 HFS001TEJ9X162N
3831 Points +139%
Dell Precision 5690
2x Samsung PM9A1 1TB (RAID 0)
1606 Points
Dell Precision 5000 5680
2x SK hynix PC801 HFS512GEJ9X101N RAID 0
1564 Points -3%
Seq Read
Dell Precision 5000 5680
2x SK hynix PC801 HFS512GEJ9X101N RAID 0
7436.8 MB/s +3%
Dell Precision 5690
2x Samsung PM9A1 1TB (RAID 0)
7244.14 MB/s
HP ZBook Fury 16 G10
SK hynix PC801 HFS001TEJ9X101N
5596.17 MB/s -23%
Lenovo ThinkPad P1 G6-21FV000DGE
SK Hynix PC711 1TB HFS001TDE9X084N
5456 MB/s -25%
MSI CreatorPro Z16P B12UKST
Samsung PM9A1 MZVL21T0HCLR
5033 MB/s -31%
Lenovo ThinkPad P16 G2 21FA000FGE
SK hynix PC801 HFS001TEJ9X162N
4939 MB/s -32%
Seq Write
Dell Precision 5690
2x Samsung PM9A1 1TB (RAID 0)
5881.98 MB/s
MSI CreatorPro Z16P B12UKST
Samsung PM9A1 MZVL21T0HCLR
3879 MB/s -34%
Dell Precision 5000 5680
2x SK hynix PC801 HFS512GEJ9X101N RAID 0
3644.52 MB/s -38%
Lenovo ThinkPad P1 G6-21FV000DGE
SK Hynix PC711 1TB HFS001TDE9X084N
3541 MB/s -40%
HP ZBook Fury 16 G10
SK hynix PC801 HFS001TEJ9X101N
2896.03 MB/s -51%
Lenovo ThinkPad P16 G2 21FA000FGE
SK hynix PC801 HFS001TEJ9X162N
2028 MB/s -66%
4K Read
MSI CreatorPro Z16P B12UKST
Samsung PM9A1 MZVL21T0HCLR
84 MB/s +33%
Lenovo ThinkPad P1 G6-21FV000DGE
SK Hynix PC711 1TB HFS001TDE9X084N
72.2 MB/s +14%
HP ZBook Fury 16 G10
SK hynix PC801 HFS001TEJ9X101N
69.7 MB/s +10%
Dell Precision 5000 5680
2x SK hynix PC801 HFS512GEJ9X101N RAID 0
67.05 MB/s +6%
Dell Precision 5690
2x Samsung PM9A1 1TB (RAID 0)
63.22 MB/s
Lenovo ThinkPad P16 G2 21FA000FGE
SK hynix PC801 HFS001TEJ9X162N
46.6 MB/s -26%
4K Write
HP ZBook Fury 16 G10
SK hynix PC801 HFS001TEJ9X101N
252.18 MB/s +82%
Lenovo ThinkPad P1 G6-21FV000DGE
SK Hynix PC711 1TB HFS001TDE9X084N
237 MB/s +71%
MSI CreatorPro Z16P B12UKST
Samsung PM9A1 MZVL21T0HCLR
217.2 MB/s +57%
Dell Precision 5000 5680
2x SK hynix PC801 HFS512GEJ9X101N RAID 0
210.13 MB/s +52%
Dell Precision 5690
2x Samsung PM9A1 1TB (RAID 0)
138.37 MB/s
Lenovo ThinkPad P16 G2 21FA000FGE
SK hynix PC801 HFS001TEJ9X162N
113.7 MB/s -18%
4K-64 Read
MSI CreatorPro Z16P B12UKST
Samsung PM9A1 MZVL21T0HCLR
2790.34 MB/s +226%
Lenovo ThinkPad P1 G6-21FV000DGE
SK Hynix PC711 1TB HFS001TDE9X084N
968 MB/s +13%
Lenovo ThinkPad P16 G2 21FA000FGE
SK hynix PC801 HFS001TEJ9X162N
949 MB/s +11%
HP ZBook Fury 16 G10
SK hynix PC801 HFS001TEJ9X101N
924.95 MB/s +8%
Dell Precision 5000 5680
2x SK hynix PC801 HFS512GEJ9X101N RAID 0
915.38 MB/s +7%
Dell Precision 5690
2x Samsung PM9A1 1TB (RAID 0)
855.44 MB/s
4K-64 Write
Lenovo ThinkPad P1 G6-21FV000DGE
SK Hynix PC711 1TB HFS001TDE9X084N
3818 MB/s +334%
HP ZBook Fury 16 G10
SK hynix PC801 HFS001TEJ9X101N
3646.75 MB/s +315%
Lenovo ThinkPad P16 G2 21FA000FGE
SK hynix PC801 HFS001TEJ9X162N
3514 MB/s +300%
MSI CreatorPro Z16P B12UKST
Samsung PM9A1 MZVL21T0HCLR
3336.29 MB/s +279%
Dell Precision 5000 5680
2x SK hynix PC801 HFS512GEJ9X101N RAID 0
989.47 MB/s +13%
Dell Precision 5690
2x Samsung PM9A1 1TB (RAID 0)
879.16 MB/s
Access Time Read
Lenovo ThinkPad P16 G2 21FA000FGE
SK hynix PC801 HFS001TEJ9X162N
0.067 ms * -22%
Dell Precision 5690
2x Samsung PM9A1 1TB (RAID 0)
0.055 ms *
HP ZBook Fury 16 G10
SK hynix PC801 HFS001TEJ9X101N
0.052 ms * +5%
Dell Precision 5000 5680
2x SK hynix PC801 HFS512GEJ9X101N RAID 0
0.034 ms * +38%
MSI CreatorPro Z16P B12UKST
Samsung PM9A1 MZVL21T0HCLR
0.022 ms * +60%
Lenovo ThinkPad P1 G6-21FV000DGE
SK Hynix PC711 1TB HFS001TDE9X084N
0.017 ms * +69%
Access Time Write
Dell Precision 5690
2x Samsung PM9A1 1TB (RAID 0)
0.088 ms *
Dell Precision 5000 5680
2x SK hynix PC801 HFS512GEJ9X101N RAID 0
0.055 ms * +37%
HP ZBook Fury 16 G10
SK hynix PC801 HFS001TEJ9X101N
0.053 ms * +40%
Lenovo ThinkPad P16 G2 21FA000FGE
SK hynix PC801 HFS001TEJ9X162N
0.034 ms * +61%
MSI CreatorPro Z16P B12UKST
Samsung PM9A1 MZVL21T0HCLR
0.019 ms * +78%
Lenovo ThinkPad P1 G6-21FV000DGE
SK Hynix PC711 1TB HFS001TDE9X084N
0.017 ms * +81%

* ... mindre är bättre

Disk Throttling: DiskSpd Read Loop, Queue Depth 8

06401280192025603200384044805120576064007040768083208960960010240108801152012160Tooltip
Dell Precision 5690 2x Samsung PM9A1 1TB (RAID 0); diskspd 2.0.17 f: Ø12556 (11605.5-12741.67)
Dell Precision 5000 5680 2x SK hynix PC801 HFS512GEJ9X101N RAID 0: Ø5330 (4509.72-5416.31)

GPU-prestanda - upp till RTX 5000 Ada

Nvidias GPU-alternativ har inte förändrats från förr och så RTX 5000 Ada fortsätter att vara det bästa alternativet. Denna GPU härrör från GeForce RTX 4090 och så innehåller den särskilt 16 GB VRAM istället för 12 GB om den konfigureras med den långsammare RTX 4000 Ada eller 3500 Ada. Användare har ett brett utbud av RTX Ada GPU:er att konfigurera från RTX 1000 Ada upp till vår RTX 5000 Ada-konfiguration.

KraftprofilGrafikpoängFysikpoängKombinerad poäng
Prestanda-läge296643041612057
Balanserat läge29771 (-0%)27199 (-11%)11770 (-2%)
Batteriström26674 (-10%)20268 (-33%)9539 (-21%)

Att köra i läget Balanced påverkar processorprestandan medan grafikprestandan förblir densamma, vilket framgår av våra Fire Strike -resultat ovan.

3DMark 11
3DMark 11
Fire Strike
Fire Strike
Fire Strike Ultra
Fire Strike Ultra
Time Spy
Time Spy
Port Royal
Port Royal
Speed Way
Speed Way
3DMark Performance Rating - Percent
HP ZBook Fury 16 G10 -2!
NVIDIA RTX 5000 Ada Generation Laptop GPU, Intel Core i9-13950HX
94.7 pt
Genomsnitt NVIDIA RTX 5000 Ada Generation Laptop GPU
 
90.8 pt
Dell Precision 5690 -2!
NVIDIA RTX 5000 Ada Generation Laptop GPU, Intel Core Ultra 9 185H
88.6 pt
Dell Precision 5000 5680 -2!
NVIDIA RTX 5000 Ada Generation Laptop GPU, Intel Core i9-13900H
87.6 pt
Asus ProArt StudioBook 16 W7600H5A-2BL2 -20!
NVIDIA RTX A5000 Laptop GPU, Intel Xeon W-11955M
66.6 pt
HP ZBook Fury 16 G9 -2!
NVIDIA RTX A5500 Laptop GPU, Intel Core i9-12950HX
62.6 pt
Dell XPS 16 9640 -35!
NVIDIA GeForce RTX 4070 Laptop GPU, Intel Core Ultra 7 155H
62.3 pt
Lenovo ThinkPad P1 G6-21FV000DGE -16!
NVIDIA RTX 2000 Ada Generation Laptop GPU, Intel Core i9-13900H
61.2 pt
Lenovo ThinkPad P16 G2 21FA000FGE -18!
NVIDIA RTX 2000 Ada Generation Laptop GPU, Intel Core i7-13700HX
60.3 pt
MSI CreatorPro Z16P B12UKST -17!
NVIDIA RTX A3000 Laptop GPU, Intel Core i7-12700H
52.1 pt
Lenovo ThinkPad P16v G1 AMD -16!
NVIDIA RTX A1000 Laptop GPU, AMD Ryzen 7 PRO 7840HS
37.2 pt
Lenovo ThinkPad P16 G1 21D6001DMB -18!
NVIDIA RTX A2000 Laptop GPU, Intel Core i7-12850HX
31.5 pt
Lenovo ThinkPad P1 G4-20Y30017GE -18!
NVIDIA T1200 Laptop GPU, Intel Core i7-11800H
30.4 pt
Lenovo ThinkPad P16s G2 21K9000CGE -18!
AMD Radeon 780M, AMD Ryzen 7 PRO 7840U
24.1 pt
3DMark 11 - 1280x720 Performance GPU
HP ZBook Fury 16 G10
NVIDIA RTX 5000 Ada Generation Laptop GPU, Intel Core i9-13950HX
54334 Points +9%
Genomsnitt NVIDIA RTX 5000 Ada Generation Laptop GPU
  (49833 - 54334, n=3)
51979 Points +4%
Dell Precision 5000 5680
NVIDIA RTX 5000 Ada Generation Laptop GPU, Intel Core i9-13900H
51771 Points +4%
Dell Precision 5690
NVIDIA RTX 5000 Ada Generation Laptop GPU, Intel Core Ultra 9 185H
49833 Points
HP ZBook Fury 16 G9
NVIDIA RTX A5500 Laptop GPU, Intel Core i9-12950HX
33715 Points -32%
Dell XPS 16 9640
NVIDIA GeForce RTX 4070 Laptop GPU, Intel Core Ultra 7 155H
33251 Points -33%
Lenovo ThinkPad P16 G2 21FA000FGE
NVIDIA RTX 2000 Ada Generation Laptop GPU, Intel Core i7-13700HX
33001 Points -34%
Lenovo ThinkPad P1 G6-21FV000DGE
NVIDIA RTX 2000 Ada Generation Laptop GPU, Intel Core i9-13900H
30262 Points -39%
MSI CreatorPro Z16P B12UKST
NVIDIA RTX A3000 Laptop GPU, Intel Core i7-12700H
25990 Points -48%
Lenovo ThinkPad P16v G1 AMD
NVIDIA RTX A1000 Laptop GPU, AMD Ryzen 7 PRO 7840HS
15867 Points -68%
Lenovo ThinkPad P16 G1 21D6001DMB
NVIDIA RTX A2000 Laptop GPU, Intel Core i7-12850HX
15412 Points -69%
Lenovo ThinkPad P1 G4-20Y30017GE
NVIDIA T1200 Laptop GPU, Intel Core i7-11800H
14614 Points -71%
Lenovo ThinkPad P16s G2 21K9000CGE
AMD Radeon 780M, AMD Ryzen 7 PRO 7840U
12885 Points -74%
3DMark
1920x1080 Fire Strike Graphics
HP ZBook Fury 16 G10
NVIDIA RTX 5000 Ada Generation Laptop GPU, Intel Core i9-13950HX
35868 Points +21%
Genomsnitt NVIDIA RTX 5000 Ada Generation Laptop GPU
  (29664 - 35868, n=3)
31985 Points +8%
Dell Precision 5000 5680
NVIDIA RTX 5000 Ada Generation Laptop GPU, Intel Core i9-13900H
30422 Points +3%
Dell Precision 5690
NVIDIA RTX 5000 Ada Generation Laptop GPU, Intel Core Ultra 9 185H
29664 Points
Asus ProArt StudioBook 16 W7600H5A-2BL2
NVIDIA RTX A5000 Laptop GPU, Intel Xeon W-11955M
27271 Points -8%
HP ZBook Fury 16 G9
NVIDIA RTX A5500 Laptop GPU, Intel Core i9-12950HX
25713 Points -13%
Lenovo ThinkPad P16 G2 21FA000FGE
NVIDIA RTX 2000 Ada Generation Laptop GPU, Intel Core i7-13700HX
24596 Points -17%
Dell XPS 16 9640
NVIDIA GeForce RTX 4070 Laptop GPU, Intel Core Ultra 7 155H
24235 Points -18%
Lenovo ThinkPad P1 G6-21FV000DGE
NVIDIA RTX 2000 Ada Generation Laptop GPU, Intel Core i9-13900H
22039 Points -26%
MSI CreatorPro Z16P B12UKST
NVIDIA RTX A3000 Laptop GPU, Intel Core i7-12700H
19710 Points -34%
Lenovo ThinkPad P16v G1 AMD
NVIDIA RTX A1000 Laptop GPU, AMD Ryzen 7 PRO 7840HS
11728 Points -60%
Lenovo ThinkPad P16 G1 21D6001DMB
NVIDIA RTX A2000 Laptop GPU, Intel Core i7-12850HX
10415 Points -65%
Lenovo ThinkPad P1 G4-20Y30017GE
NVIDIA T1200 Laptop GPU, Intel Core i7-11800H
10266 Points -65%
Lenovo ThinkPad P16s G2 21K9000CGE
AMD Radeon 780M, AMD Ryzen 7 PRO 7840U
8142 Points -73%
2560x1440 Time Spy Graphics
HP ZBook Fury 16 G10
NVIDIA RTX 5000 Ada Generation Laptop GPU, Intel Core i9-13950HX
16218 Points +12%
Genomsnitt NVIDIA RTX 5000 Ada Generation Laptop GPU
  (14472 - 16218, n=3)
15184 Points +5%
Dell Precision 5000 5680
NVIDIA RTX 5000 Ada Generation Laptop GPU, Intel Core i9-13900H
14861 Points +3%
Dell Precision 5690
NVIDIA RTX 5000 Ada Generation Laptop GPU, Intel Core Ultra 9 185H
14472 Points
Asus ProArt StudioBook 16 W7600H5A-2BL2
NVIDIA RTX A5000 Laptop GPU, Intel Xeon W-11955M
10307 Points -29%
Dell XPS 16 9640
NVIDIA GeForce RTX 4070 Laptop GPU, Intel Core Ultra 7 155H
9638 Points -33%
Lenovo ThinkPad P16 G2 21FA000FGE
NVIDIA RTX 2000 Ada Generation Laptop GPU, Intel Core i7-13700HX
9158 Points -37%
HP ZBook Fury 16 G9
NVIDIA RTX A5500 Laptop GPU, Intel Core i9-12950HX
8940 Points -38%
Lenovo ThinkPad P1 G6-21FV000DGE
NVIDIA RTX 2000 Ada Generation Laptop GPU, Intel Core i9-13900H
8433 Points -42%
MSI CreatorPro Z16P B12UKST
NVIDIA RTX A3000 Laptop GPU, Intel Core i7-12700H
7320 Points -49%
Lenovo ThinkPad P16 G1 21D6001DMB
NVIDIA RTX A2000 Laptop GPU, Intel Core i7-12850HX
4689 Points -68%
Lenovo ThinkPad P16v G1 AMD
NVIDIA RTX A1000 Laptop GPU, AMD Ryzen 7 PRO 7840HS
4410 Points -70%
Lenovo ThinkPad P1 G4-20Y30017GE
NVIDIA T1200 Laptop GPU, Intel Core i7-11800H
3651 Points -75%
Lenovo ThinkPad P16s G2 21K9000CGE
AMD Radeon 780M, AMD Ryzen 7 PRO 7840U
2813 Points -81%
2560x1440 Time Spy Score
HP ZBook Fury 16 G10
NVIDIA RTX 5000 Ada Generation Laptop GPU, Intel Core i9-13950HX
15989 Points +14%
Genomsnitt NVIDIA RTX 5000 Ada Generation Laptop GPU
  (14048 - 15989, n=3)
14894 Points +6%
Dell Precision 5000 5680
NVIDIA RTX 5000 Ada Generation Laptop GPU, Intel Core i9-13900H
14644 Points +4%
Dell Precision 5690
NVIDIA RTX 5000 Ada Generation Laptop GPU, Intel Core Ultra 9 185H
14048 Points
Asus ProArt StudioBook 16 W7600H5A-2BL2
NVIDIA RTX A5000 Laptop GPU, Intel Xeon W-11955M
10157 Points -28%
Dell XPS 16 9640
NVIDIA GeForce RTX 4070 Laptop GPU, Intel Core Ultra 7 155H
9774 Points -30%
Lenovo ThinkPad P16 G2 21FA000FGE
NVIDIA RTX 2000 Ada Generation Laptop GPU, Intel Core i7-13700HX
9628 Points -31%
HP ZBook Fury 16 G9
NVIDIA RTX A5500 Laptop GPU, Intel Core i9-12950HX
9402 Points -33%
Lenovo ThinkPad P1 G6-21FV000DGE
NVIDIA RTX 2000 Ada Generation Laptop GPU, Intel Core i9-13900H
8849 Points -37%
MSI CreatorPro Z16P B12UKST
NVIDIA RTX A3000 Laptop GPU, Intel Core i7-12700H
7703 Points -45%
Lenovo ThinkPad P16 G1 21D6001DMB
NVIDIA RTX A2000 Laptop GPU, Intel Core i7-12850HX
5184 Points -63%
Lenovo ThinkPad P16v G1 AMD
NVIDIA RTX A1000 Laptop GPU, AMD Ryzen 7 PRO 7840HS
4835 Points -66%
Lenovo ThinkPad P1 G4-20Y30017GE
NVIDIA T1200 Laptop GPU, Intel Core i7-11800H
3891 Points -72%
Lenovo ThinkPad P16s G2 21K9000CGE
AMD Radeon 780M, AMD Ryzen 7 PRO 7840U
3126 Points -78%
2560x1440 Speed Way Score
HP ZBook Fury 16 G10
NVIDIA RTX 5000 Ada Generation Laptop GPU, Intel Core i9-13950HX
4196 Points +9%
Genomsnitt NVIDIA RTX 5000 Ada Generation Laptop GPU
  (3866 - 4196, n=3)
3978 Points +3%
Dell Precision 5000 5680
NVIDIA RTX 5000 Ada Generation Laptop GPU, Intel Core i9-13900H
3872 Points 0%
Dell Precision 5690
NVIDIA RTX 5000 Ada Generation Laptop GPU, Intel Core Ultra 9 185H
3866 Points
Lenovo ThinkPad P1 G6-21FV000DGE
NVIDIA RTX 2000 Ada Generation Laptop GPU, Intel Core i9-13900H
2137 Points -45%
HP ZBook Fury 16 G9
NVIDIA RTX A5500 Laptop GPU, Intel Core i9-12950HX
2068 Points -47%
Lenovo ThinkPad P16v G1 AMD
NVIDIA RTX A1000 Laptop GPU, AMD Ryzen 7 PRO 7840HS
973 Points -75%
2560x1440 Port Royal Graphics
HP ZBook Fury 16 G10
NVIDIA RTX 5000 Ada Generation Laptop GPU, Intel Core i9-13950HX
10321 Points +9%
Genomsnitt NVIDIA RTX 5000 Ada Generation Laptop GPU
  (9474 - 10321, n=3)
9827 Points +4%
Dell Precision 5000 5680
NVIDIA RTX 5000 Ada Generation Laptop GPU, Intel Core i9-13900H
9685 Points +2%
Dell Precision 5690
NVIDIA RTX 5000 Ada Generation Laptop GPU, Intel Core Ultra 9 185H
9474 Points
HP ZBook Fury 16 G9
NVIDIA RTX A5500 Laptop GPU, Intel Core i9-12950HX
5830 Points -38%
Lenovo ThinkPad P1 G6-21FV000DGE
NVIDIA RTX 2000 Ada Generation Laptop GPU, Intel Core i9-13900H
4898 Points -48%
MSI CreatorPro Z16P B12UKST
NVIDIA RTX A3000 Laptop GPU, Intel Core i7-12700H
4296 Points -55%
Lenovo ThinkPad P16v G1 AMD
NVIDIA RTX A1000 Laptop GPU, AMD Ryzen 7 PRO 7840HS
2649 Points -72%
SPECviewperf 12
1900x1060 Solidworks (sw-03)
HP ZBook Fury 16 G10
NVIDIA RTX 5000 Ada Generation Laptop GPU, Intel Core i9-13950HX
225.04 fps +18%
Genomsnitt NVIDIA RTX 5000 Ada Generation Laptop GPU
  (189.9 - 225, n=3)
205 fps +8%
Dell Precision 5000 5680
NVIDIA RTX 5000 Ada Generation Laptop GPU, Intel Core i9-13900H
201.1 fps +6%
Dell Precision 5690
NVIDIA RTX 5000 Ada Generation Laptop GPU, Intel Core Ultra 9 185H
189.92 fps
HP ZBook Fury 16 G9
NVIDIA RTX A5500 Laptop GPU, Intel Core i9-12950HX
167.74 fps -12%
1900x1060 Siemens NX (snx-02)
HP ZBook Fury 16 G10
NVIDIA RTX 5000 Ada Generation Laptop GPU, Intel Core i9-13950HX
308.58 fps +6%
Genomsnitt NVIDIA RTX 5000 Ada Generation Laptop GPU
  (292 - 309, n=3)
297 fps +2%
Dell Precision 5690
NVIDIA RTX 5000 Ada Generation Laptop GPU, Intel Core Ultra 9 185H
292 fps
Dell Precision 5000 5680
NVIDIA RTX 5000 Ada Generation Laptop GPU, Intel Core i9-13900H
291.54 fps 0%
HP ZBook Fury 16 G9
NVIDIA RTX A5500 Laptop GPU, Intel Core i9-12950HX
176.66 fps -39%
1900x1060 Showcase (showcase-01)
HP ZBook Fury 16 G10
NVIDIA RTX 5000 Ada Generation Laptop GPU, Intel Core i9-13950HX
172.49 fps +14%
Genomsnitt NVIDIA RTX 5000 Ada Generation Laptop GPU
  (150.7 - 172.5, n=3)
158.8 fps +5%
Dell Precision 5000 5680
NVIDIA RTX 5000 Ada Generation Laptop GPU, Intel Core i9-13900H
153.14 fps +2%
Dell Precision 5690
NVIDIA RTX 5000 Ada Generation Laptop GPU, Intel Core Ultra 9 185H
150.65 fps
HP ZBook Fury 16 G9
NVIDIA RTX A5500 Laptop GPU, Intel Core i9-12950HX
131.53 fps -13%
1900x1060 Maya (maya-04)
HP ZBook Fury 16 G10
NVIDIA RTX 5000 Ada Generation Laptop GPU, Intel Core i9-13950HX
190.08 fps +11%
Dell Precision 5000 5680
NVIDIA RTX 5000 Ada Generation Laptop GPU, Intel Core i9-13900H
181.58 fps +6%
Genomsnitt NVIDIA RTX 5000 Ada Generation Laptop GPU
  (170.7 - 190.1, n=3)
180.8 fps +6%
Dell Precision 5690
NVIDIA RTX 5000 Ada Generation Laptop GPU, Intel Core Ultra 9 185H
170.7 fps
HP ZBook Fury 16 G9
NVIDIA RTX A5500 Laptop GPU, Intel Core i9-12950HX
121.02 fps -29%
1900x1060 Creo (creo-01)
HP ZBook Fury 16 G10
NVIDIA RTX 5000 Ada Generation Laptop GPU, Intel Core i9-13950HX
203.54 fps +14%
Dell Precision 5000 5680
NVIDIA RTX 5000 Ada Generation Laptop GPU, Intel Core i9-13900H
193.92 fps +9%
Genomsnitt NVIDIA RTX 5000 Ada Generation Laptop GPU
  (178.7 - 204, n=3)
192.1 fps +7%
Dell Precision 5690
NVIDIA RTX 5000 Ada Generation Laptop GPU, Intel Core Ultra 9 185H
178.71 fps
HP ZBook Fury 16 G9
NVIDIA RTX A5500 Laptop GPU, Intel Core i9-12950HX
165.88 fps -7%
1900x1060 Catia (catia-04)
HP ZBook Fury 16 G10
NVIDIA RTX 5000 Ada Generation Laptop GPU, Intel Core i9-13950HX
267.81 fps +21%
Genomsnitt NVIDIA RTX 5000 Ada Generation Laptop GPU
  (222 - 268, n=3)
242 fps +9%
Dell Precision 5000 5680
NVIDIA RTX 5000 Ada Generation Laptop GPU, Intel Core i9-13900H
236.39 fps +7%
Dell Precision 5690
NVIDIA RTX 5000 Ada Generation Laptop GPU, Intel Core Ultra 9 185H
221.81 fps
HP ZBook Fury 16 G9
NVIDIA RTX A5500 Laptop GPU, Intel Core i9-12950HX
189.79 fps -14%
SPECviewperf 13
3ds Max (3dsmax-06)
HP ZBook Fury 16 G10
NVIDIA RTX 5000 Ada Generation Laptop GPU, Intel Core i9-13950HX
278.36 fps +8%
Dell Precision 5000 5680
NVIDIA RTX 5000 Ada Generation Laptop GPU, Intel Core i9-13900H
272.05 fps +5%
Genomsnitt NVIDIA RTX 5000 Ada Generation Laptop GPU
  (259 - 278, n=3)
270 fps +4%
Dell Precision 5690
NVIDIA RTX 5000 Ada Generation Laptop GPU, Intel Core Ultra 9 185H
258.63 fps
HP ZBook Fury 16 G9
NVIDIA RTX A5500 Laptop GPU, Intel Core i9-12950HX
223.61 fps -14%
Lenovo ThinkPad P1 G6-21FV000DGE
NVIDIA RTX 2000 Ada Generation Laptop GPU, Intel Core i9-13900H
200.54 fps -22%
MSI CreatorPro Z16P B12UKST
NVIDIA RTX A3000 Laptop GPU, Intel Core i7-12700H
181.04 fps -30%
Lenovo ThinkPad P16 G2 21FA000FGE
NVIDIA RTX 2000 Ada Generation Laptop GPU, Intel Core i7-13700HX
155.94 fps -40%
Lenovo ThinkPad P16v G1 AMD
NVIDIA RTX A1000 Laptop GPU, AMD Ryzen 7 PRO 7840HS
127.82 fps -51%
Lenovo ThinkPad P16 G1 21D6001DMB
NVIDIA RTX A2000 Laptop GPU, Intel Core i7-12850HX
120.47 fps -53%
Lenovo ThinkPad P1 G4-20Y30017GE
NVIDIA T1200 Laptop GPU, Intel Core i7-11800H
107.5 fps -58%
Lenovo ThinkPad P16s G2 21K9000CGE
AMD Radeon 780M, AMD Ryzen 7 PRO 7840U
80.9 fps -69%
Catia (catia-05)
HP ZBook Fury 16 G10
NVIDIA RTX 5000 Ada Generation Laptop GPU, Intel Core i9-13950HX
409.2 fps +16%
Genomsnitt NVIDIA RTX 5000 Ada Generation Laptop GPU
  (352 - 409, n=3)
379 fps +8%
Dell Precision 5000 5680
NVIDIA RTX 5000 Ada Generation Laptop GPU, Intel Core i9-13900H
374.43 fps +6%
Dell Precision 5690
NVIDIA RTX 5000 Ada Generation Laptop GPU, Intel Core Ultra 9 185H
352.35 fps
Lenovo ThinkPad P16 G2 21FA000FGE
NVIDIA RTX 2000 Ada Generation Laptop GPU, Intel Core i7-13700HX
312.95 fps -11%
Lenovo ThinkPad P1 G6-21FV000DGE
NVIDIA RTX 2000 Ada Generation Laptop GPU, Intel Core i9-13900H
309.47 fps -12%
HP ZBook Fury 16 G9
NVIDIA RTX A5500 Laptop GPU, Intel Core i9-12950HX
302.32 fps -14%
MSI CreatorPro Z16P B12UKST
NVIDIA RTX A3000 Laptop GPU, Intel Core i7-12700H
252.25 fps -28%
Lenovo ThinkPad P16v G1 AMD
NVIDIA RTX A1000 Laptop GPU, AMD Ryzen 7 PRO 7840HS
218.18 fps -38%
Lenovo ThinkPad P1 G4-20Y30017GE
NVIDIA T1200 Laptop GPU, Intel Core i7-11800H
171.6 fps -51%
Lenovo ThinkPad P16 G1 21D6001DMB
NVIDIA RTX A2000 Laptop GPU, Intel Core i7-12850HX
159.05 fps -55%
Lenovo ThinkPad P16s G2 21K9000CGE
AMD Radeon 780M, AMD Ryzen 7 PRO 7840U
113.2 fps -68%
Creo (creo-02)
HP ZBook Fury 16 G10
NVIDIA RTX 5000 Ada Generation Laptop GPU, Intel Core i9-13950HX
397.76 fps +12%
Genomsnitt NVIDIA RTX 5000 Ada Generation Laptop GPU
  (355 - 398, n=3)
376 fps +6%
Dell Precision 5000 5680
NVIDIA RTX 5000 Ada Generation Laptop GPU, Intel Core i9-13900H
375.06 fps +6%
Dell Precision 5690
NVIDIA RTX 5000 Ada Generation Laptop GPU, Intel Core Ultra 9 185H
354.77 fps
Lenovo ThinkPad P1 G6-21FV000DGE
NVIDIA RTX 2000 Ada Generation Laptop GPU, Intel Core i9-13900H
265.15 fps -25%
Lenovo ThinkPad P16 G2 21FA000FGE
NVIDIA RTX 2000 Ada Generation Laptop GPU, Intel Core i7-13700HX
261.41 fps -26%
HP ZBook Fury 16 G9
NVIDIA RTX A5500 Laptop GPU, Intel Core i9-12950HX
243.69 fps -31%
MSI CreatorPro Z16P B12UKST
NVIDIA RTX A3000 Laptop GPU, Intel Core i7-12700H
235.49 fps -34%
Lenovo ThinkPad P16v G1 AMD
NVIDIA RTX A1000 Laptop GPU, AMD Ryzen 7 PRO 7840HS
164.76 fps -54%
Lenovo ThinkPad P1 G4-20Y30017GE
NVIDIA T1200 Laptop GPU, Intel Core i7-11800H
138 fps -61%
Lenovo ThinkPad P16 G1 21D6001DMB
NVIDIA RTX A2000 Laptop GPU, Intel Core i7-12850HX
117.06 fps -67%
Lenovo ThinkPad P16s G2 21K9000CGE
AMD Radeon 780M, AMD Ryzen 7 PRO 7840U
84.6 fps -76%
Energy (energy-02)
HP ZBook Fury 16 G10
NVIDIA RTX 5000 Ada Generation Laptop GPU, Intel Core i9-13950HX
109.73 fps +1%
Dell Precision 5690
NVIDIA RTX 5000 Ada Generation Laptop GPU, Intel Core Ultra 9 185H
108.19 fps
Genomsnitt NVIDIA RTX 5000 Ada Generation Laptop GPU
  (105.2 - 109.7, n=3)
107.7 fps 0%
Dell Precision 5000 5680
NVIDIA RTX 5000 Ada Generation Laptop GPU, Intel Core i9-13900H
105.16 fps -3%
HP ZBook Fury 16 G9
NVIDIA RTX A5500 Laptop GPU, Intel Core i9-12950HX
61.15 fps -43%
Lenovo ThinkPad P1 G6-21FV000DGE
NVIDIA RTX 2000 Ada Generation Laptop GPU, Intel Core i9-13900H
49.58 fps -54%
Lenovo ThinkPad P16 G2 21FA000FGE
NVIDIA RTX 2000 Ada Generation Laptop GPU, Intel Core i7-13700HX
49.36 fps -54%
MSI CreatorPro Z16P B12UKST
NVIDIA RTX A3000 Laptop GPU, Intel Core i7-12700H
44.09 fps -59%
Lenovo ThinkPad P16v G1 AMD
NVIDIA RTX A1000 Laptop GPU, AMD Ryzen 7 PRO 7840HS
30.29 fps -72%
Lenovo ThinkPad P16 G1 21D6001DMB
NVIDIA RTX A2000 Laptop GPU, Intel Core i7-12850HX
23.85 fps -78%
Lenovo ThinkPad P16s G2 21K9000CGE
AMD Radeon 780M, AMD Ryzen 7 PRO 7840U
20.7 fps -81%
Lenovo ThinkPad P1 G4-20Y30017GE
NVIDIA T1200 Laptop GPU, Intel Core i7-11800H
19.41 fps -82%
Maya (maya-05)
HP ZBook Fury 16 G10
NVIDIA RTX 5000 Ada Generation Laptop GPU, Intel Core i9-13950HX
424.73 fps +10%
Genomsnitt NVIDIA RTX 5000 Ada Generation Laptop GPU
  (386 - 425, n=3)
401 fps +4%
Dell Precision 5000 5680
NVIDIA RTX 5000 Ada Generation Laptop GPU, Intel Core i9-13900H
391.57 fps +1%
Dell Precision 5690
NVIDIA RTX 5000 Ada Generation Laptop GPU, Intel Core Ultra 9 185H
385.99 fps
Lenovo ThinkPad P1 G6-21FV000DGE
NVIDIA RTX 2000 Ada Generation Laptop GPU, Intel Core i9-13900H
293.61 fps -24%
Lenovo ThinkPad P16 G2 21FA000FGE
NVIDIA RTX 2000 Ada Generation Laptop GPU, Intel Core i7-13700HX
276.68 fps -28%
HP ZBook Fury 16 G9
NVIDIA RTX A5500 Laptop GPU, Intel Core i9-12950HX
265.99 fps -31%
MSI CreatorPro Z16P B12UKST
NVIDIA RTX A3000 Laptop GPU, Intel Core i7-12700H
228.37 fps -41%
Lenovo ThinkPad P16v G1 AMD
NVIDIA RTX A1000 Laptop GPU, AMD Ryzen 7 PRO 7840HS
169 fps -56%
Lenovo ThinkPad P1 G4-20Y30017GE
NVIDIA T1200 Laptop GPU, Intel Core i7-11800H
133.8 fps -65%
Lenovo ThinkPad P16 G1 21D6001DMB
NVIDIA RTX A2000 Laptop GPU, Intel Core i7-12850HX
117.19 fps -70%
Lenovo ThinkPad P16s G2 21K9000CGE
AMD Radeon 780M, AMD Ryzen 7 PRO 7840U
103 fps -73%
Medical (medical-02)
Dell Precision 5690
NVIDIA RTX 5000 Ada Generation Laptop GPU, Intel Core Ultra 9 185H
249.87 fps
Genomsnitt NVIDIA RTX 5000 Ada Generation Laptop GPU
  (169 - 250, n=3)
198.4 fps -21%
Dell Precision 5000 5680
NVIDIA RTX 5000 Ada Generation Laptop GPU, Intel Core i9-13900H
176.21 fps -29%
HP ZBook Fury 16 G10
NVIDIA RTX 5000 Ada Generation Laptop GPU, Intel Core i9-13950HX
169 fps -32%
Lenovo ThinkPad P1 G6-21FV000DGE
NVIDIA RTX 2000 Ada Generation Laptop GPU, Intel Core i9-13900H
165.27 fps -34%
HP ZBook Fury 16 G9
NVIDIA RTX A5500 Laptop GPU, Intel Core i9-12950HX
116.87 fps -53%
Lenovo ThinkPad P16 G2 21FA000FGE
NVIDIA RTX 2000 Ada Generation Laptop GPU, Intel Core i7-13700HX
110.66 fps -56%
Lenovo ThinkPad P16v G1 AMD
NVIDIA RTX A1000 Laptop GPU, AMD Ryzen 7 PRO 7840HS
105.45 fps -58%
MSI CreatorPro Z16P B12UKST
NVIDIA RTX A3000 Laptop GPU, Intel Core i7-12700H
102.82 fps -59%
Lenovo ThinkPad P16s G2 21K9000CGE
AMD Radeon 780M, AMD Ryzen 7 PRO 7840U
66.1 fps -74%
Lenovo ThinkPad P1 G4-20Y30017GE
NVIDIA T1200 Laptop GPU, Intel Core i7-11800H
55 fps -78%
Lenovo ThinkPad P16 G1 21D6001DMB
NVIDIA RTX A2000 Laptop GPU, Intel Core i7-12850HX
54.66 fps -78%
Showcase (showcase-02)
HP ZBook Fury 16 G10
NVIDIA RTX 5000 Ada Generation Laptop GPU, Intel Core i9-13950HX
190.3 fps +26%
Genomsnitt NVIDIA RTX 5000 Ada Generation Laptop GPU
  (150.9 - 190.3, n=3)
165.1 fps +9%
Dell Precision 5000 5680
NVIDIA RTX 5000 Ada Generation Laptop GPU, Intel Core i9-13900H
154.11 fps +2%
Dell Precision 5690
NVIDIA RTX 5000 Ada Generation Laptop GPU, Intel Core Ultra 9 185H
150.88 fps
HP ZBook Fury 16 G9
NVIDIA RTX A5500 Laptop GPU, Intel Core i9-12950HX
132.86 fps -12%
MSI CreatorPro Z16P B12UKST
NVIDIA RTX A3000 Laptop GPU, Intel Core i7-12700H
99.91 fps -34%
Lenovo ThinkPad P1 G6-21FV000DGE
NVIDIA RTX 2000 Ada Generation Laptop GPU, Intel Core i9-13900H
95.04 fps -37%
Lenovo ThinkPad P16 G2 21FA000FGE
NVIDIA RTX 2000 Ada Generation Laptop GPU, Intel Core i7-13700HX
79.97 fps -47%
Lenovo ThinkPad P16 G1 21D6001DMB
NVIDIA RTX A2000 Laptop GPU, Intel Core i7-12850HX
58.79 fps -61%
Lenovo ThinkPad P16v G1 AMD
NVIDIA RTX A1000 Laptop GPU, AMD Ryzen 7 PRO 7840HS
55.66 fps -63%
Lenovo ThinkPad P1 G4-20Y30017GE
NVIDIA T1200 Laptop GPU, Intel Core i7-11800H
51.8 fps -66%
Lenovo ThinkPad P16s G2 21K9000CGE
AMD Radeon 780M, AMD Ryzen 7 PRO 7840U
28.6 fps -81%
Siemens NX (snx-03)
HP ZBook Fury 16 G10
NVIDIA RTX 5000 Ada Generation Laptop GPU, Intel Core i9-13950HX
550.94 fps +5%
Genomsnitt NVIDIA RTX 5000 Ada Generation Laptop GPU
  (525 - 551, n=3)
535 fps +2%
Dell Precision 5000 5680
NVIDIA RTX 5000 Ada Generation Laptop GPU, Intel Core i9-13900H
530.43 fps +1%
Dell Precision 5690
NVIDIA RTX 5000 Ada Generation Laptop GPU, Intel Core Ultra 9 185H
524.73 fps
Lenovo ThinkPad P16 G2 21FA000FGE
NVIDIA RTX 2000 Ada Generation Laptop GPU, Intel Core i7-13700HX
356.29 fps -32%
HP ZBook Fury 16 G9
NVIDIA RTX A5500 Laptop GPU, Intel Core i9-12950HX
334.23 fps -36%
Lenovo ThinkPad P1 G6-21FV000DGE
NVIDIA RTX 2000 Ada Generation Laptop GPU, Intel Core i9-13900H
329.98 fps -37%
MSI CreatorPro Z16P B12UKST
NVIDIA RTX A3000 Laptop GPU, Intel Core i7-12700H
279.21 fps -47%
Lenovo ThinkPad P16v G1 AMD
NVIDIA RTX A1000 Laptop GPU, AMD Ryzen 7 PRO 7840HS
195.81 fps -63%
Lenovo ThinkPad P1 G4-20Y30017GE
NVIDIA T1200 Laptop GPU, Intel Core i7-11800H
171.1 fps -67%
Lenovo ThinkPad P16s G2 21K9000CGE
AMD Radeon 780M, AMD Ryzen 7 PRO 7840U
136.1 fps -74%
Lenovo ThinkPad P16 G1 21D6001DMB
NVIDIA RTX A2000 Laptop GPU, Intel Core i7-12850HX
135.15 fps -74%
Solidworks (sw-04)
HP ZBook Fury 16 G10
NVIDIA RTX 5000 Ada Generation Laptop GPU, Intel Core i9-13950HX
226.6 fps +16%
Genomsnitt NVIDIA RTX 5000 Ada Generation Laptop GPU
  (195.1 - 227, n=3)
210 fps +8%
Dell Precision 5000 5680
NVIDIA RTX 5000 Ada Generation Laptop GPU, Intel Core i9-13900H
209.31 fps +7%
Dell Precision 5690
NVIDIA RTX 5000 Ada Generation Laptop GPU, Intel Core Ultra 9 185H
195.09 fps
Lenovo ThinkPad P1 G6-21FV000DGE
NVIDIA RTX 2000 Ada Generation Laptop GPU, Intel Core i9-13900H
194.75 fps 0%
HP ZBook Fury 16 G9
NVIDIA RTX A5500 Laptop GPU, Intel Core i9-12950HX
186.09 fps -5%
Lenovo ThinkPad P16 G2 21FA000FGE
NVIDIA RTX 2000 Ada Generation Laptop GPU, Intel Core i7-13700HX
174.68 fps -10%
MSI CreatorPro Z16P B12UKST
NVIDIA RTX A3000 Laptop GPU, Intel Core i7-12700H
151.63 fps -22%
Lenovo ThinkPad P16v G1 AMD
NVIDIA RTX A1000 Laptop GPU, AMD Ryzen 7 PRO 7840HS
147.92 fps -24%
Lenovo ThinkPad P16 G1 21D6001DMB
NVIDIA RTX A2000 Laptop GPU, Intel Core i7-12850HX
135.52 fps -31%
Lenovo ThinkPad P1 G4-20Y30017GE
NVIDIA T1200 Laptop GPU, Intel Core i7-11800H
130.7 fps -33%
Lenovo ThinkPad P16s G2 21K9000CGE
AMD Radeon 780M, AMD Ryzen 7 PRO 7840U
91.8 fps -53%
SPECviewperf 2020
3840x2160 3ds Max (3dsmax-07)
Dell Precision 5000 5680
NVIDIA RTX 5000 Ada Generation Laptop GPU, Intel Core i9-13900H
97.75 fps +3%
Dell Precision 5690
NVIDIA RTX 5000 Ada Generation Laptop GPU, Intel Core Ultra 9 185H
94.56 fps
Genomsnitt NVIDIA RTX 5000 Ada Generation Laptop GPU
  (84.9 - 97.8, n=3)
92.4 fps -2%
Asus ProArt StudioBook 16 W7600H5A-2BL2
NVIDIA RTX A5000 Laptop GPU, Intel Xeon W-11955M
87.8 fps -7%
HP ZBook Fury 16 G10
NVIDIA RTX 5000 Ada Generation Laptop GPU, Intel Core i9-13950HX
84.87 fps -10%
HP ZBook Fury 16 G9
NVIDIA RTX A5500 Laptop GPU, Intel Core i9-12950HX
73.53 fps -22%
3840x2160 CATIA (catia-06)
HP ZBook Fury 16 G10
NVIDIA RTX 5000 Ada Generation Laptop GPU, Intel Core i9-13950HX
75.33 fps +12%
Genomsnitt NVIDIA RTX 5000 Ada Generation Laptop GPU
  (67.2 - 75.3, n=3)
70.4 fps +5%
Dell Precision 5000 5680
NVIDIA RTX 5000 Ada Generation Laptop GPU, Intel Core i9-13900H
68.66 fps +2%
Dell Precision 5690
NVIDIA RTX 5000 Ada Generation Laptop GPU, Intel Core Ultra 9 185H
67.17 fps
Asus ProArt StudioBook 16 W7600H5A-2BL2
NVIDIA RTX A5000 Laptop GPU, Intel Xeon W-11955M
57.9 fps -14%
HP ZBook Fury 16 G9
NVIDIA RTX A5500 Laptop GPU, Intel Core i9-12950HX
55.52 fps -17%
3840x2160 Creo (creo-03)
Dell Precision 5000 5680
NVIDIA RTX 5000 Ada Generation Laptop GPU, Intel Core i9-13900H
116.47 fps +15%
HP ZBook Fury 16 G10
NVIDIA RTX 5000 Ada Generation Laptop GPU, Intel Core i9-13950HX
115.93 fps +15%
Genomsnitt NVIDIA RTX 5000 Ada Generation Laptop GPU
  (100.9 - 116.5, n=3)
111.1 fps +10%
Dell Precision 5690
NVIDIA RTX 5000 Ada Generation Laptop GPU, Intel Core Ultra 9 185H
100.9 fps
HP ZBook Fury 16 G9
NVIDIA RTX A5500 Laptop GPU, Intel Core i9-12950HX
91.29 fps -10%
Asus ProArt StudioBook 16 W7600H5A-2BL2
NVIDIA RTX A5000 Laptop GPU, Intel Xeon W-11955M
88.6 fps -12%
3840x2160 Energy (energy-03)
Asus ProArt StudioBook 16 W7600H5A-2BL2
NVIDIA RTX A5000 Laptop GPU, Intel Xeon W-11955M
138.7 fps +264%
Dell Precision 5000 5680
NVIDIA RTX 5000 Ada Generation Laptop GPU, Intel Core i9-13900H
49.16 fps +29%
Genomsnitt NVIDIA RTX 5000 Ada Generation Laptop GPU
  (38.1 - 49.2, n=3)
42.3 fps +11%
HP ZBook Fury 16 G10
NVIDIA RTX 5000 Ada Generation Laptop GPU, Intel Core i9-13950HX
39.61 fps +4%
Dell Precision 5690
NVIDIA RTX 5000 Ada Generation Laptop GPU, Intel Core Ultra 9 185H
38.09 fps
HP ZBook Fury 16 G9
NVIDIA RTX A5500 Laptop GPU, Intel Core i9-12950HX
21.54 fps -43%
3840x2160 Maya (maya-06)
HP ZBook Fury 16 G10
NVIDIA RTX 5000 Ada Generation Laptop GPU, Intel Core i9-13950HX
241.7 fps +31%
Genomsnitt NVIDIA RTX 5000 Ada Generation Laptop GPU
  (184.1 - 242, n=3)
211 fps +15%
Dell Precision 5000 5680
NVIDIA RTX 5000 Ada Generation Laptop GPU, Intel Core i9-13900H
207.19 fps +13%
Dell Precision 5690
NVIDIA RTX 5000 Ada Generation Laptop GPU, Intel Core Ultra 9 185H
184.05 fps
Asus ProArt StudioBook 16 W7600H5A-2BL2
NVIDIA RTX A5000 Laptop GPU, Intel Xeon W-11955M
134.5 fps -27%
HP ZBook Fury 16 G9
NVIDIA RTX A5500 Laptop GPU, Intel Core i9-12950HX
132.18 fps -28%
3840x2160 Medical (medical-03)
Dell Precision 5690
NVIDIA RTX 5000 Ada Generation Laptop GPU, Intel Core Ultra 9 185H
58.46 fps
Genomsnitt NVIDIA RTX 5000 Ada Generation Laptop GPU
  (36.1 - 58.5, n=3)
43.8 fps -25%
Dell Precision 5000 5680
NVIDIA RTX 5000 Ada Generation Laptop GPU, Intel Core i9-13900H
36.81 fps -37%
HP ZBook Fury 16 G10
NVIDIA RTX 5000 Ada Generation Laptop GPU, Intel Core i9-13950HX
36.13 fps -38%
Asus ProArt StudioBook 16 W7600H5A-2BL2
NVIDIA RTX A5000 Laptop GPU, Intel Xeon W-11955M
23.58 fps -60%
HP ZBook Fury 16 G9
NVIDIA RTX A5500 Laptop GPU, Intel Core i9-12950HX
23.31 fps -60%
3840x2160 Siemens NX (snx-04)
HP ZBook Fury 16 G10
NVIDIA RTX 5000 Ada Generation Laptop GPU, Intel Core i9-13950HX
362.19 fps +69%
Genomsnitt NVIDIA RTX 5000 Ada Generation Laptop GPU
  (214 - 362, n=3)
271 fps +27%
Dell Precision 5000 5680
NVIDIA RTX 5000 Ada Generation Laptop GPU, Intel Core i9-13900H
237 fps +11%
Dell Precision 5690
NVIDIA RTX 5000 Ada Generation Laptop GPU, Intel Core Ultra 9 185H
214.15 fps
HP ZBook Fury 16 G9
NVIDIA RTX A5500 Laptop GPU, Intel Core i9-12950HX
195.95 fps -8%
Asus ProArt StudioBook 16 W7600H5A-2BL2
NVIDIA RTX A5000 Laptop GPU, Intel Xeon W-11955M
172.2 fps -20%
3840x2160 Solidworks (solidworks-05)
HP ZBook Fury 16 G10
NVIDIA RTX 5000 Ada Generation Laptop GPU, Intel Core i9-13950HX
140.59 fps
Genomsnitt NVIDIA RTX 5000 Ada Generation Laptop GPU
  (129.3 - 140.6, n=2)
135 fps
Dell Precision 5000 5680
NVIDIA RTX 5000 Ada Generation Laptop GPU, Intel Core i9-13900H
129.32 fps
HP ZBook Fury 16 G9
NVIDIA RTX A5500 Laptop GPU, Intel Core i9-12950HX
93.77 fps
Asus ProArt StudioBook 16 W7600H5A-2BL2
NVIDIA RTX A5000 Laptop GPU, Intel Xeon W-11955M
92.5 fps
1920x1080 3ds Max (3dsmax-07)
HP ZBook Fury 16 G10
NVIDIA RTX 5000 Ada Generation Laptop GPU, Intel Core i9-13950HX
174.72 fps +8%
Genomsnitt NVIDIA RTX 5000 Ada Generation Laptop GPU
  (161.1 - 174.7, n=3)
165.8 fps +3%
Dell Precision 5000 5680
NVIDIA RTX 5000 Ada Generation Laptop GPU, Intel Core i9-13900H
161.47 fps 0%
Dell Precision 5690
NVIDIA RTX 5000 Ada Generation Laptop GPU, Intel Core Ultra 9 185H
161.08 fps
HP ZBook Fury 16 G9
NVIDIA RTX A5500 Laptop GPU, Intel Core i9-12950HX
125.82 fps -22%
Asus ProArt StudioBook 16 W7600H5A-2BL2
NVIDIA RTX A5000 Laptop GPU, Intel Xeon W-11955M
123.1 fps -24%
MSI CreatorPro Z16P B12UKST
NVIDIA RTX A3000 Laptop GPU, Intel Core i7-12700H
103.02 fps -36%
Lenovo ThinkPad P16 G2 21FA000FGE
NVIDIA RTX 2000 Ada Generation Laptop GPU, Intel Core i7-13700HX
95.09 fps -41%
Lenovo ThinkPad P1 G6-21FV000DGE
NVIDIA RTX 2000 Ada Generation Laptop GPU, Intel Core i9-13900H
84.61 fps -47%
Lenovo ThinkPad P16 G1 21D6001DMB
NVIDIA RTX A2000 Laptop GPU, Intel Core i7-12850HX
58.54 fps -64%
Lenovo ThinkPad P16v G1 AMD
NVIDIA RTX A1000 Laptop GPU, AMD Ryzen 7 PRO 7840HS
55.43 fps -66%
Lenovo ThinkPad P1 G4-20Y30017GE
NVIDIA T1200 Laptop GPU, Intel Core i7-11800H
50.1 fps -69%
Lenovo ThinkPad P16s G2 21K9000CGE
AMD Radeon 780M, AMD Ryzen 7 PRO 7840U
36 fps -78%
1920x1080 CATIA (catia-06)
HP ZBook Fury 16 G10
NVIDIA RTX 5000 Ada Generation Laptop GPU, Intel Core i9-13950HX
130.04 fps +7%
Genomsnitt NVIDIA RTX 5000 Ada Generation Laptop GPU
  (121.4 - 130, n=3)
124.7 fps +3%
Dell Precision 5000 5680
NVIDIA RTX 5000 Ada Generation Laptop GPU, Intel Core i9-13900H
122.66 fps +1%
Dell Precision 5690
NVIDIA RTX 5000 Ada Generation Laptop GPU, Intel Core Ultra 9 185H
121.41 fps
Asus ProArt StudioBook 16 W7600H5A-2BL2
NVIDIA RTX A5000 Laptop GPU, Intel Xeon W-11955M
98.8 fps -19%
HP ZBook Fury 16 G9
NVIDIA RTX A5500 Laptop GPU, Intel Core i9-12950HX
96.23 fps -21%
Lenovo ThinkPad P16 G2 21FA000FGE
NVIDIA RTX 2000 Ada Generation Laptop GPU, Intel Core i7-13700HX
91.24 fps -25%
Lenovo ThinkPad P1 G6-21FV000DGE
NVIDIA RTX 2000 Ada Generation Laptop GPU, Intel Core i9-13900H
84.02 fps -31%
MSI CreatorPro Z16P B12UKST
NVIDIA RTX A3000 Laptop GPU, Intel Core i7-12700H
80.27 fps -34%
Lenovo ThinkPad P16v G1 AMD
NVIDIA RTX A1000 Laptop GPU, AMD Ryzen 7 PRO 7840HS
52.17 fps -57%
Lenovo ThinkPad P16 G1 21D6001DMB
NVIDIA RTX A2000 Laptop GPU, Intel Core i7-12850HX
46.02 fps -62%
Lenovo ThinkPad P1 G4-20Y30017GE
NVIDIA T1200 Laptop GPU, Intel Core i7-11800H
41.42 fps -66%
Lenovo ThinkPad P16s G2 21K9000CGE
AMD Radeon 780M, AMD Ryzen 7 PRO 7840U
35.9 fps -70%
1920x1080 Creo (creo-03)
HP ZBook Fury 16 G10
NVIDIA RTX 5000 Ada Generation Laptop GPU, Intel Core i9-13950HX
169.52 fps +10%
Dell Precision 5690
NVIDIA RTX 5000 Ada Generation Laptop GPU, Intel Core Ultra 9 185H
153.83 fps
Genomsnitt NVIDIA RTX 5000 Ada Generation Laptop GPU
  (133 - 169.5, n=3)
152.1 fps -1%
Asus ProArt StudioBook 16 W7600H5A-2BL2
NVIDIA RTX A5000 Laptop GPU, Intel Xeon W-11955M
139.7 fps -9%
Lenovo ThinkPad P1 G6-21FV000DGE
NVIDIA RTX 2000 Ada Generation Laptop GPU, Intel Core i9-13900H
137.93 fps -10%
Dell Precision 5000 5680
NVIDIA RTX 5000 Ada Generation Laptop GPU, Intel Core i9-13900H
133.03 fps -14%
HP ZBook Fury 16 G9
NVIDIA RTX A5500 Laptop GPU, Intel Core i9-12950HX
104.45 fps -32%
MSI CreatorPro Z16P B12UKST
NVIDIA RTX A3000 Laptop GPU, Intel Core i7-12700H
101.07 fps -34%
Lenovo ThinkPad P16 G2 21FA000FGE
NVIDIA RTX 2000 Ada Generation Laptop GPU, Intel Core i7-13700HX
96.6 fps -37%
Lenovo ThinkPad P16v G1 AMD
NVIDIA RTX A1000 Laptop GPU, AMD Ryzen 7 PRO 7840HS
90.91 fps -41%
Lenovo ThinkPad P1 G4-20Y30017GE
NVIDIA T1200 Laptop GPU, Intel Core i7-11800H
80.1 fps -48%
Lenovo ThinkPad P16 G1 21D6001DMB
NVIDIA RTX A2000 Laptop GPU, Intel Core i7-12850HX
65.51 fps -57%
Lenovo ThinkPad P16s G2 21K9000CGE
AMD Radeon 780M, AMD Ryzen 7 PRO 7840U
54.9 fps -64%
1920x1080 Energy (energy-03)
HP ZBook Fury 16 G10
NVIDIA RTX 5000 Ada Generation Laptop GPU, Intel Core i9-13950HX
109.65 fps +1%
Dell Precision 5690
NVIDIA RTX 5000 Ada Generation Laptop GPU, Intel Core Ultra 9 185H
108.18 fps
Genomsnitt NVIDIA RTX 5000 Ada Generation Laptop GPU
  (104.5 - 109.7, n=3)
107.4 fps -1%
Dell Precision 5000 5680
NVIDIA RTX 5000 Ada Generation Laptop GPU, Intel Core i9-13900H
104.5 fps -3%
Asus ProArt StudioBook 16 W7600H5A-2BL2
NVIDIA RTX A5000 Laptop GPU, Intel Xeon W-11955M
67.9 fps -37%
HP ZBook Fury 16 G9
NVIDIA RTX A5500 Laptop GPU, Intel Core i9-12950HX
62.08 fps -43%
Lenovo ThinkPad P16 G2 21FA000FGE
NVIDIA RTX 2000 Ada Generation Laptop GPU, Intel Core i7-13700HX
54.54 fps -50%
Lenovo ThinkPad P1 G6-21FV000DGE
NVIDIA RTX 2000 Ada Generation Laptop GPU, Intel Core i9-13900H
49.66 fps -54%
MSI CreatorPro Z16P B12UKST
NVIDIA RTX A3000 Laptop GPU, Intel Core i7-12700H
44.7 fps -59%
Lenovo ThinkPad P16v G1 AMD
NVIDIA RTX A1000 Laptop GPU, AMD Ryzen 7 PRO 7840HS
30.27 fps -72%
Lenovo ThinkPad P16 G1 21D6001DMB
NVIDIA RTX A2000 Laptop GPU, Intel Core i7-12850HX
26.06 fps -76%
Lenovo ThinkPad P16s G2 21K9000CGE
AMD Radeon 780M, AMD Ryzen 7 PRO 7840U
22.5 fps -79%
Lenovo ThinkPad P1 G4-20Y30017GE
NVIDIA T1200 Laptop GPU, Intel Core i7-11800H
19.45 fps -82%
1920x1080 Maya (maya-06)
HP ZBook Fury 16 G10
NVIDIA RTX 5000 Ada Generation Laptop GPU, Intel Core i9-13950HX
459.91 fps +6%
Genomsnitt NVIDIA RTX 5000 Ada Generation Laptop GPU
  (420 - 460, n=3)
438 fps +1%
Dell Precision 5690
NVIDIA RTX 5000 Ada Generation Laptop GPU, Intel Core Ultra 9 185H
433.58 fps
Dell Precision 5000 5680
NVIDIA RTX 5000 Ada Generation Laptop GPU, Intel Core i9-13900H
419.68 fps -3%
Lenovo ThinkPad P16 G2 21FA000FGE
NVIDIA RTX 2000 Ada Generation Laptop GPU, Intel Core i7-13700HX
355.25 fps -18%
Lenovo ThinkPad P1 G6-21FV000DGE
NVIDIA RTX 2000 Ada Generation Laptop GPU, Intel Core i9-13900H
329.51 fps -24%
HP ZBook Fury 16 G9
NVIDIA RTX A5500 Laptop GPU, Intel Core i9-12950HX
293.35 fps -32%
Asus ProArt StudioBook 16 W7600H5A-2BL2
NVIDIA RTX A5000 Laptop GPU, Intel Xeon W-11955M
290 fps -33%
MSI CreatorPro Z16P B12UKST
NVIDIA RTX A3000 Laptop GPU, Intel Core i7-12700H
286.54 fps -34%
Lenovo ThinkPad P16v G1 AMD
NVIDIA RTX A1000 Laptop GPU, AMD Ryzen 7 PRO 7840HS
201.79 fps -53%
Lenovo ThinkPad P16 G1 21D6001DMB
NVIDIA RTX A2000 Laptop GPU, Intel Core i7-12850HX
174.79 fps -60%
Lenovo ThinkPad P1 G4-20Y30017GE
NVIDIA T1200 Laptop GPU, Intel Core i7-11800H
151.4 fps -65%
Lenovo ThinkPad P16s G2 21K9000CGE
AMD Radeon 780M, AMD Ryzen 7 PRO 7840U
121.6 fps -72%
1920x1080 Medical (medical-03)
Dell Precision 5690
NVIDIA RTX 5000 Ada Generation Laptop GPU, Intel Core Ultra 9 185H
140.89 fps
Genomsnitt NVIDIA RTX 5000 Ada Generation Laptop GPU
  (85.1 - 140.9, n=3)
104.1 fps -26%
Lenovo ThinkPad P1 G6-21FV000DGE
NVIDIA RTX 2000 Ada Generation Laptop GPU, Intel Core i9-13900H
92.01 fps -35%
Dell Precision 5000 5680
NVIDIA RTX 5000 Ada Generation Laptop GPU, Intel Core i9-13900H
86.29 fps -39%
HP ZBook Fury 16 G10
NVIDIA RTX 5000 Ada Generation Laptop GPU, Intel Core i9-13950HX
85.08 fps -40%
HP ZBook Fury 16 G9
NVIDIA RTX A5500 Laptop GPU, Intel Core i9-12950HX
61.01 fps -57%
Asus ProArt StudioBook 16 W7600H5A-2BL2
NVIDIA RTX A5000 Laptop GPU, Intel Xeon W-11955M
58.7 fps -58%
Lenovo ThinkPad P16v G1 AMD
NVIDIA RTX A1000 Laptop GPU, AMD Ryzen 7 PRO 7840HS
57.3 fps -59%
Lenovo ThinkPad P16 G2 21FA000FGE
NVIDIA RTX 2000 Ada Generation Laptop GPU, Intel Core i7-13700HX
57.2 fps -59%
MSI CreatorPro Z16P B12UKST
NVIDIA RTX A3000 Laptop GPU, Intel Core i7-12700H
46.59 fps -67%
Lenovo ThinkPad P16s G2 21K9000CGE
AMD Radeon 780M, AMD Ryzen 7 PRO 7840U
33.3 fps -76%
Lenovo ThinkPad P16 G1 21D6001DMB
NVIDIA RTX A2000 Laptop GPU, Intel Core i7-12850HX
26.96 fps -81%
Lenovo ThinkPad P1 G4-20Y30017GE
NVIDIA T1200 Laptop GPU, Intel Core i7-11800H
24.99 fps -82%
1920x1080 Siemens NX (snx-04)
HP ZBook Fury 16 G10
NVIDIA RTX 5000 Ada Generation Laptop GPU, Intel Core i9-13950HX
554.23 fps +5%
Genomsnitt NVIDIA RTX 5000 Ada Generation Laptop GPU
  (520 - 554, n=3)
533 fps +1%
Dell Precision 5690
NVIDIA RTX 5000 Ada Generation Laptop GPU, Intel Core Ultra 9 185H
525.61 fps
Dell Precision 5000 5680
NVIDIA RTX 5000 Ada Generation Laptop GPU, Intel Core i9-13900H
520.25 fps -1%
Lenovo ThinkPad P16 G2 21FA000FGE
NVIDIA RTX 2000 Ada Generation Laptop GPU, Intel Core i7-13700HX
381.32 fps -27%
Lenovo ThinkPad P1 G6-21FV000DGE
NVIDIA RTX 2000 Ada Generation Laptop GPU, Intel Core i9-13900H
327.89 fps -38%
Asus ProArt StudioBook 16 W7600H5A-2BL2
NVIDIA RTX A5000 Laptop GPU, Intel Xeon W-11955M
309.1 fps -41%
HP ZBook Fury 16 G9
NVIDIA RTX A5500 Laptop GPU, Intel Core i9-12950HX
308.7 fps -41%
MSI CreatorPro Z16P B12UKST
NVIDIA RTX A3000 Laptop GPU, Intel Core i7-12700H
284.49 fps -46%
Lenovo ThinkPad P16v G1 AMD
NVIDIA RTX A1000 Laptop GPU, AMD Ryzen 7 PRO 7840HS
194.8 fps -63%
Lenovo ThinkPad P1 G4-20Y30017GE
NVIDIA T1200 Laptop GPU, Intel Core i7-11800H
169.1 fps -68%
Lenovo ThinkPad P16 G1 21D6001DMB
NVIDIA RTX A2000 Laptop GPU, Intel Core i7-12850HX
136.88 fps -74%
Lenovo ThinkPad P16s G2 21K9000CGE
AMD Radeon 780M, AMD Ryzen 7 PRO 7840U
129.3 fps -75%
1920x1080 Solidworks (solidworks-05)
HP ZBook Fury 16 G10
NVIDIA RTX 5000 Ada Generation Laptop GPU, Intel Core i9-13950HX
340.35 fps
Genomsnitt NVIDIA RTX 5000 Ada Generation Laptop GPU
  (308 - 340, n=2)
324 fps
Dell Precision 5000 5680
NVIDIA RTX 5000 Ada Generation Laptop GPU, Intel Core i9-13900H
307.72 fps
Lenovo ThinkPad P16 G2 21FA000FGE
NVIDIA RTX 2000 Ada Generation Laptop GPU, Intel Core i7-13700HX
225.76 fps
HP ZBook Fury 16 G9
NVIDIA RTX A5500 Laptop GPU, Intel Core i9-12950HX
206.6 fps
Asus ProArt StudioBook 16 W7600H5A-2BL2
NVIDIA RTX A5000 Laptop GPU, Intel Xeon W-11955M
199.4 fps
Lenovo ThinkPad P1 G6-21FV000DGE
NVIDIA RTX 2000 Ada Generation Laptop GPU, Intel Core i9-13900H
198.55 fps
MSI CreatorPro Z16P B12UKST
NVIDIA RTX A3000 Laptop GPU, Intel Core i7-12700H
170.08 fps
Lenovo ThinkPad P16v G1 AMD
NVIDIA RTX A1000 Laptop GPU, AMD Ryzen 7 PRO 7840HS
113.65 fps
Lenovo ThinkPad P16 G1 21D6001DMB
NVIDIA RTX A2000 Laptop GPU, Intel Core i7-12850HX
106.28 fps
Lenovo ThinkPad P1 G4-20Y30017GE
NVIDIA T1200 Laptop GPU, Intel Core i7-11800H
92.3 fps
Lenovo ThinkPad P16s G2 21K9000CGE
AMD Radeon 780M, AMD Ryzen 7 PRO 7840U
67.9 fps
1920x1080 Solidworks (solidworks-07)
Dell Precision 5690
NVIDIA RTX 5000 Ada Generation Laptop GPU, Intel Core Ultra 9 185H
307.21 fps
Genomsnitt NVIDIA RTX 5000 Ada Generation Laptop GPU
  ()
307 fps 0%
3840x2160 Solidworks (solidworks-07) 4k
Dell Precision 5690
NVIDIA RTX 5000 Ada Generation Laptop GPU, Intel Core Ultra 9 185H
128.1 fps
Genomsnitt NVIDIA RTX 5000 Ada Generation Laptop GPU
  ()
128.1 fps 0%
3DMark 11 Performance
38230 poäng
3DMark Fire Strike Score
25968 poäng
3DMark Time Spy Score
14048 poäng
Hjälp
Blender
v3.3 Classroom OPTIX/RTX
Lenovo ThinkPad P16v G1 AMD
NVIDIA RTX A1000 Laptop GPU, AMD Ryzen 7 PRO 7840HS
65 Seconds * -364%
Lenovo ThinkPad P16 G1 21D6001DMB
NVIDIA RTX A2000 Laptop GPU, Intel Core i7-12850HX
54 Seconds * -286%
MSI CreatorPro Z16P B12UKST
NVIDIA RTX A3000 Laptop GPU, Intel Core i7-12700H
34 Seconds * -143%
Lenovo ThinkPad P1 G6-21FV000DGE
NVIDIA RTX 2000 Ada Generation Laptop GPU, Intel Core i9-13900H
28 Seconds * -100%
HP ZBook Fury 16 G9
NVIDIA RTX A5500 Laptop GPU, Intel Core i9-12950HX
25 Seconds * -79%
Lenovo ThinkPad P16 G2 21FA000FGE
NVIDIA RTX 2000 Ada Generation Laptop GPU, Intel Core i7-13700HX
25 Seconds * -79%
Dell XPS 16 9640
NVIDIA GeForce RTX 4070 Laptop GPU, Intel Core Ultra 7 155H
21 Seconds * -50%
Dell Precision 5000 5680
NVIDIA RTX 5000 Ada Generation Laptop GPU, Intel Core i9-13900H
16 Seconds * -14%
HP ZBook Fury 16 G10
NVIDIA RTX 5000 Ada Generation Laptop GPU, Intel Core i9-13950HX
15 Seconds * -7%
Genomsnitt NVIDIA RTX 5000 Ada Generation Laptop GPU
  (14 - 16, n=3)
15 Seconds * -7%
Dell Precision 5690
NVIDIA RTX 5000 Ada Generation Laptop GPU, Intel Core Ultra 9 185H
14 Seconds *
v3.3 Classroom CUDA
Lenovo ThinkPad P16 G2 21FA000FGE
NVIDIA RTX 2000 Ada Generation Laptop GPU, Intel Core i7-13700HX
155 Seconds * -574%
Lenovo ThinkPad P16v G1 AMD
NVIDIA RTX A1000 Laptop GPU, AMD Ryzen 7 PRO 7840HS
108 Seconds * -370%
Lenovo ThinkPad P16 G1 21D6001DMB
NVIDIA RTX A2000 Laptop GPU, Intel Core i7-12850HX
90 Seconds * -291%
MSI CreatorPro Z16P B12UKST
NVIDIA RTX A3000 Laptop GPU, Intel Core i7-12700H
60 Seconds * -161%
Lenovo ThinkPad P1 G6-21FV000DGE
NVIDIA RTX 2000 Ada Generation Laptop GPU, Intel Core i9-13900H
51 Seconds * -122%
HP ZBook Fury 16 G9
NVIDIA RTX A5500 Laptop GPU, Intel Core i9-12950HX
40 Seconds * -74%
Dell XPS 16 9640
NVIDIA GeForce RTX 4070 Laptop GPU, Intel Core Ultra 7 155H
36 Seconds * -57%
Dell Precision 5000 5680
NVIDIA RTX 5000 Ada Generation Laptop GPU, Intel Core i9-13900H
23 Seconds * -0%
Dell Precision 5690
NVIDIA RTX 5000 Ada Generation Laptop GPU, Intel Core Ultra 9 185H
23 Seconds *
Genomsnitt NVIDIA RTX 5000 Ada Generation Laptop GPU
  (21 - 23, n=3)
22.3 Seconds * +3%
HP ZBook Fury 16 G10
NVIDIA RTX 5000 Ada Generation Laptop GPU, Intel Core i9-13950HX
21 Seconds * +9%
v3.3 Classroom CPU
Dell Precision 5690
NVIDIA RTX 5000 Ada Generation Laptop GPU, Intel Core Ultra 9 185H
386 Seconds *
Lenovo ThinkPad P16s G2 21K9000CGE
AMD Radeon 780M, AMD Ryzen 7 PRO 7840U
354 Seconds * +8%
Dell Precision 5000 5680
NVIDIA RTX 5000 Ada Generation Laptop GPU, Intel Core i9-13900H
345 Seconds * +11%
MSI CreatorPro Z16P B12UKST
NVIDIA RTX A3000 Laptop GPU, Intel Core i7-12700H
339 Seconds * +12%
Lenovo ThinkPad P1 G6-21FV000DGE
NVIDIA RTX 2000 Ada Generation Laptop GPU, Intel Core i9-13900H
329 Seconds * +15%
Lenovo ThinkPad P16v G1 AMD
NVIDIA RTX A1000 Laptop GPU, AMD Ryzen 7 PRO 7840HS
329 Seconds * +15%
Genomsnitt NVIDIA RTX 5000 Ada Generation Laptop GPU
  (254 - 386, n=3)
328 Seconds * +15%
Lenovo ThinkPad P16 G1 21D6001DMB
NVIDIA RTX A2000 Laptop GPU, Intel Core i7-12850HX
312 Seconds * +19%
Dell XPS 16 9640
NVIDIA GeForce RTX 4070 Laptop GPU, Intel Core Ultra 7 155H
306 Seconds * +21%
HP ZBook Fury 16 G9
NVIDIA RTX A5500 Laptop GPU, Intel Core i9-12950HX
302 Seconds * +22%
Lenovo ThinkPad P16 G2 21FA000FGE
NVIDIA RTX 2000 Ada Generation Laptop GPU, Intel Core i7-13700HX
291 Seconds * +25%
HP ZBook Fury 16 G10
NVIDIA RTX 5000 Ada Generation Laptop GPU, Intel Core i9-13950HX
254 Seconds * +34%

* ... mindre är bättre

Performance Rating - Percent
HP ZBook Fury 16 G10
Intel Core i9-13950HX, NVIDIA RTX 5000 Ada Generation Laptop GPU
100 pt
Dell Precision 5000 5680 -1!
Intel Core i9-13900H, NVIDIA RTX 5000 Ada Generation Laptop GPU
85.8 pt
Dell Precision 5690
Intel Core Ultra 9 185H, NVIDIA RTX 5000 Ada Generation Laptop GPU
84.4 pt
Lenovo ThinkPad P16 G2 21FA000FGE
Intel Core i7-13700HX, NVIDIA RTX 2000 Ada Generation Laptop GPU
69.6 pt
Lenovo ThinkPad P1 G6-21FV000DGE
Intel Core i9-13900H, NVIDIA RTX 2000 Ada Generation Laptop GPU
66.4 pt
MSI CreatorPro Z16P B12UKST
Intel Core i7-12700H, NVIDIA RTX A3000 Laptop GPU
57.5 pt
The Witcher 3 - 1920x1080 Ultra Graphics & Postprocessing (HBAO+)
HP ZBook Fury 16 G10
Intel Core i9-13950HX, NVIDIA RTX 5000 Ada Generation Laptop GPU
156.5 (147min) fps +14%
Dell Precision 5690
Intel Core Ultra 9 185H, NVIDIA RTX 5000 Ada Generation Laptop GPU
137.6 (127min) fps
Dell Precision 5000 5680
Intel Core i9-13900H, NVIDIA RTX 5000 Ada Generation Laptop GPU
137 (130min) fps 0%
Lenovo ThinkPad P16 G2 21FA000FGE
Intel Core i7-13700HX, NVIDIA RTX 2000 Ada Generation Laptop GPU
95.6 (79min) fps -31%
Lenovo ThinkPad P1 G6-21FV000DGE
Intel Core i9-13900H, NVIDIA RTX 2000 Ada Generation Laptop GPU
79.6 (74min, 76P1) fps -42%
MSI CreatorPro Z16P B12UKST
Intel Core i7-12700H, NVIDIA RTX A3000 Laptop GPU
59.6 (54min, 56P1) fps -57%
Final Fantasy XV Benchmark - 1920x1080 High Quality
HP ZBook Fury 16 G10
Intel Core i9-13950HX, NVIDIA RTX 5000 Ada Generation Laptop GPU
149.1 fps +13%
Dell Precision 5690
Intel Core Ultra 9 185H, NVIDIA RTX 5000 Ada Generation Laptop GPU
132.5 fps
Dell Precision 5000 5680
Intel Core i9-13900H, NVIDIA RTX 5000 Ada Generation Laptop GPU
127.4 fps -4%
Lenovo ThinkPad P16 G2 21FA000FGE
Intel Core i7-13700HX, NVIDIA RTX 2000 Ada Generation Laptop GPU
84.2 fps -36%
Lenovo ThinkPad P1 G6-21FV000DGE
Intel Core i9-13900H, NVIDIA RTX 2000 Ada Generation Laptop GPU
83.5 fps -37%
MSI CreatorPro Z16P B12UKST
Intel Core i7-12700H, NVIDIA RTX A3000 Laptop GPU
64.3 fps -51%
Strange Brigade - 1920x1080 ultra AA:ultra AF:16
HP ZBook Fury 16 G10
Intel Core i9-13950HX, NVIDIA RTX 5000 Ada Generation Laptop GPU
283 (35min, 198.2P1) fps +12%
Dell Precision 5690
Intel Core Ultra 9 185H, NVIDIA RTX 5000 Ada Generation Laptop GPU
252 (95min, 179P1) fps
Lenovo ThinkPad P16 G2 21FA000FGE
Intel Core i7-13700HX, NVIDIA RTX 2000 Ada Generation Laptop GPU
158.4 (22.5min, 117.2P1) fps -37%
Lenovo ThinkPad P1 G6-21FV000DGE
Intel Core i9-13900H, NVIDIA RTX 2000 Ada Generation Laptop GPU
158.2 (36.7min, 115.4P1) fps -37%
MSI CreatorPro Z16P B12UKST
Intel Core i7-12700H, NVIDIA RTX A3000 Laptop GPU
108 fps -57%
Dota 2 Reborn - 1920x1080 ultra (3/3) best looking
HP ZBook Fury 16 G10
Intel Core i9-13950HX, NVIDIA RTX 5000 Ada Generation Laptop GPU
166.7 (137.7min) fps +19%
Lenovo ThinkPad P16 G2 21FA000FGE
Intel Core i7-13700HX, NVIDIA RTX 2000 Ada Generation Laptop GPU
150.2 (130.8min) fps +7%
MSI CreatorPro Z16P B12UKST
Intel Core i7-12700H, NVIDIA RTX A3000 Laptop GPU
147.1 (127.8min) fps +5%
Dell Precision 5000 5680
Intel Core i9-13900H, NVIDIA RTX 5000 Ada Generation Laptop GPU
144 (126.4min) fps +3%
Dell Precision 5690
Intel Core Ultra 9 185H, NVIDIA RTX 5000 Ada Generation Laptop GPU
139.9 (118min) fps
Lenovo ThinkPad P1 G6-21FV000DGE
Intel Core i9-13900H, NVIDIA RTX 2000 Ada Generation Laptop GPU
133.4 (113.4min) fps -5%
X-Plane 11.11 - 1920x1080 high (fps_test=3)
HP ZBook Fury 16 G10
Intel Core i9-13950HX, NVIDIA RTX 5000 Ada Generation Laptop GPU
122.4 fps +38%
Lenovo ThinkPad P1 G6-21FV000DGE
Intel Core i9-13900H, NVIDIA RTX 2000 Ada Generation Laptop GPU
108.9 fps +23%
Lenovo ThinkPad P16 G2 21FA000FGE
Intel Core i7-13700HX, NVIDIA RTX 2000 Ada Generation Laptop GPU
103.4 fps +17%
Dell Precision 5000 5680
Intel Core i9-13900H, NVIDIA RTX 5000 Ada Generation Laptop GPU
102.4 fps +15%
MSI CreatorPro Z16P B12UKST
Intel Core i7-12700H, NVIDIA RTX A3000 Laptop GPU
97.5 fps +10%
Dell Precision 5690
Intel Core Ultra 9 185H, NVIDIA RTX 5000 Ada Generation Laptop GPU
88.7 fps
Baldur's Gate 3
1920x1080 High Preset
Dell Precision 5690
Intel Core Ultra 9 185H, NVIDIA RTX 5000 Ada Generation Laptop GPU
139.2 fps
Genomsnitt NVIDIA RTX 5000 Ada Generation Laptop GPU
  ()
139.2 fps 0%
Dell XPS 16 9640
Intel Core Ultra 7 155H, NVIDIA GeForce RTX 4070 Laptop GPU
93.5 fps -33%
1920x1080 Ultra Preset
Dell Precision 5690
Intel Core Ultra 9 185H, NVIDIA RTX 5000 Ada Generation Laptop GPU
134.6 fps
Genomsnitt NVIDIA RTX 5000 Ada Generation Laptop GPU
  ()
134.6 fps 0%
Dell XPS 16 9640
Intel Core Ultra 7 155H, NVIDIA GeForce RTX 4070 Laptop GPU
91.8 fps -32%
2560x1440 Ultra Preset
Dell Precision 5690
Intel Core Ultra 9 185H, NVIDIA RTX 5000 Ada Generation Laptop GPU
100.5 fps
Genomsnitt NVIDIA RTX 5000 Ada Generation Laptop GPU
  ()
100.5 fps 0%
Dell XPS 16 9640
Intel Core Ultra 7 155H, NVIDIA GeForce RTX 4070 Laptop GPU
63.8 fps -37%
3840x2160 Ultra Preset
Dell Precision 5690
Intel Core Ultra 9 185H, NVIDIA RTX 5000 Ada Generation Laptop GPU
53.3 fps
Genomsnitt NVIDIA RTX 5000 Ada Generation Laptop GPU
  ()
53.3 fps 0%
3840x2160 Ultra Preset + Quality DLSS
Dell Precision 5690
Intel Core Ultra 9 185H, NVIDIA RTX 5000 Ada Generation Laptop GPU
87.8 fps
Genomsnitt NVIDIA RTX 5000 Ada Generation Laptop GPU
  ()
87.8 fps 0%
The Witcher 3
1920x1080 High Graphics & Postprocessing (Nvidia HairWorks Off)
HP ZBook Fury 16 G10
Intel Core i9-13950HX, NVIDIA RTX 5000 Ada Generation Laptop GPU
298.1 (272min) fps +15%
Genomsnitt NVIDIA RTX 5000 Ada Generation Laptop GPU
  (256 - 298, n=3)
271 fps +5%
Dell Precision 5690
Intel Core Ultra 9 185H, NVIDIA RTX 5000 Ada Generation Laptop GPU
258.7 (245min) fps
Dell Precision 5000 5680
Intel Core i9-13900H, NVIDIA RTX 5000 Ada Generation Laptop GPU
256 (236min) fps -1%
Dell XPS 16 9640
Intel Core Ultra 7 155H, NVIDIA GeForce RTX 4070 Laptop GPU
195 fps -25%
Lenovo ThinkPad P16 G2 21FA000FGE
Intel Core i7-13700HX, NVIDIA RTX 2000 Ada Generation Laptop GPU
184.5 (152min) fps -29%
HP ZBook Fury 16 G9
Intel Core i9-12950HX, NVIDIA RTX A5500 Laptop GPU
169.3 (156min) fps -35%
Lenovo ThinkPad P1 G6-21FV000DGE
Intel Core i9-13900H, NVIDIA RTX 2000 Ada Generation Laptop GPU
164 fps -37%
MSI CreatorPro Z16P B12UKST
Intel Core i7-12700H, NVIDIA RTX A3000 Laptop GPU
151 fps -42%
Asus ProArt StudioBook 16 W7600H5A-2BL2
Intel Xeon W-11955M, NVIDIA RTX A5000 Laptop GPU
124 fps -52%
Lenovo ThinkPad P16v G1 AMD
AMD Ryzen 7 PRO 7840HS, NVIDIA RTX A1000 Laptop GPU
87 fps -66%
Lenovo ThinkPad P16 G1 21D6001DMB
Intel Core i7-12850HX, NVIDIA RTX A2000 Laptop GPU
79.7 (47min) fps -69%
Lenovo ThinkPad P1 G4-20Y30017GE
Intel Core i7-11800H, NVIDIA T1200 Laptop GPU
72 fps -72%
Lenovo ThinkPad P16s G2 21K9000CGE
AMD Ryzen 7 PRO 7840U, AMD Radeon 780M
47 fps -82%
1920x1080 Ultra Graphics & Postprocessing (HBAO+)
HP ZBook Fury 16 G10
Intel Core i9-13950HX, NVIDIA RTX 5000 Ada Generation Laptop GPU
156.5 (147min) fps +14%
Genomsnitt NVIDIA RTX 5000 Ada Generation Laptop GPU
  (137 - 156.5, n=3)
143.7 fps +4%
Dell Precision 5690
Intel Core Ultra 9 185H, NVIDIA RTX 5000 Ada Generation Laptop GPU
137.6 (127min) fps
Dell Precision 5000 5680
Intel Core i9-13900H, NVIDIA RTX 5000 Ada Generation Laptop GPU
137 (130min) fps 0%
Lenovo ThinkPad P16 G2 21FA000FGE
Intel Core i7-13700HX, NVIDIA RTX 2000 Ada Generation Laptop GPU
95.6 (79min) fps -31%
HP ZBook Fury 16 G9
Intel Core i9-12950HX, NVIDIA RTX A5500 Laptop GPU
92.8 (84min) fps -33%
Asus ProArt StudioBook 16 W7600H5A-2BL2
Intel Xeon W-11955M, NVIDIA RTX A5000 Laptop GPU
89.9 (87min, 88P1) fps -35%
Dell XPS 16 9640
Intel Core Ultra 7 155H, NVIDIA GeForce RTX 4070 Laptop GPU
87.8 (77min, 83P1) fps -36%
Lenovo ThinkPad P1 G6-21FV000DGE
Intel Core i9-13900H, NVIDIA RTX 2000 Ada Generation Laptop GPU
79.6 (74min, 76P1) fps -42%
MSI CreatorPro Z16P B12UKST
Intel Core i7-12700H, NVIDIA RTX A3000 Laptop GPU
59.6 (54min, 56P1) fps -57%
Lenovo ThinkPad P16 G1 21D6001DMB
Intel Core i7-12850HX, NVIDIA RTX A2000 Laptop GPU
43.6 (33min) fps -68%
Lenovo ThinkPad P16v G1 AMD
AMD Ryzen 7 PRO 7840HS, NVIDIA RTX A1000 Laptop GPU
43.2 (40min, 41P1) fps -69%
Lenovo ThinkPad P1 G4-20Y30017GE
Intel Core i7-11800H, NVIDIA T1200 Laptop GPU
38 (35min, 35P1) fps -72%
Lenovo ThinkPad P16s G2 21K9000CGE
AMD Ryzen 7 PRO 7840U, AMD Radeon 780M
30 fps -78%
3840x2160 High Graphics & Postprocessing (Nvidia HairWorks Off)
HP ZBook Fury 16 G10
Intel Core i9-13950HX, NVIDIA RTX 5000 Ada Generation Laptop GPU
105.2 (96min) fps +1%
Dell Precision 5690
Intel Core Ultra 9 185H, NVIDIA RTX 5000 Ada Generation Laptop GPU
103.9 (98min) fps
Genomsnitt NVIDIA RTX 5000 Ada Generation Laptop GPU
  (97 - 105.2, n=3)
102 fps -2%
Dell Precision 5000 5680
Intel Core i9-13900H, NVIDIA RTX 5000 Ada Generation Laptop GPU
97 (91min) fps -7%
HP ZBook Fury 16 G9
Intel Core i9-12950HX, NVIDIA RTX A5500 Laptop GPU
62.2 (58min) fps -40%
Asus ProArt StudioBook 16 W7600H5A-2BL2
Intel Xeon W-11955M, NVIDIA RTX A5000 Laptop GPU
54.8 fps -47%
Lenovo ThinkPad P16s G2 21K9000CGE
AMD Ryzen 7 PRO 7840U, AMD Radeon 780M
15 fps -86%
Final Fantasy XV Benchmark
1920x1080 High Quality
HP ZBook Fury 16 G10
Intel Core i9-13950HX, NVIDIA RTX 5000 Ada Generation Laptop GPU
149.1 fps +13%
Genomsnitt NVIDIA RTX 5000 Ada Generation Laptop GPU
  (127.4 - 149.1, n=3)
136.3 fps +3%
Dell Precision 5690
Intel Core Ultra 9 185H, NVIDIA RTX 5000 Ada Generation Laptop GPU
132.5 fps
Dell Precision 5000 5680
Intel Core i9-13900H, NVIDIA RTX 5000 Ada Generation Laptop GPU
127.4 fps -4%
HP ZBook Fury 16 G9
Intel Core i9-12950HX, NVIDIA RTX A5500 Laptop GPU
103.5 fps -22%
Dell XPS 16 9640
Intel Core Ultra 7 155H, NVIDIA GeForce RTX 4070 Laptop GPU
93.1 fps -30%
Asus ProArt StudioBook 16 W7600H5A-2BL2
Intel Xeon W-11955M, NVIDIA RTX A5000 Laptop GPU
91.8 fps -31%
Lenovo ThinkPad P16 G2 21FA000FGE
Intel Core i7-13700HX, NVIDIA RTX 2000 Ada Generation Laptop GPU
84.2 fps -36%
Lenovo ThinkPad P1 G6-21FV000DGE
Intel Core i9-13900H, NVIDIA RTX 2000 Ada Generation Laptop GPU
83.5 fps -37%
MSI CreatorPro Z16P B12UKST
Intel Core i7-12700H, NVIDIA RTX A3000 Laptop GPU
64.3 fps -51%
Lenovo ThinkPad P16v G1 AMD
AMD Ryzen 7 PRO 7840HS, NVIDIA RTX A1000 Laptop GPU
48.3 fps -64%
Lenovo ThinkPad P16 G1 21D6001DMB
Intel Core i7-12850HX, NVIDIA RTX A2000 Laptop GPU
38.3 fps -71%
Lenovo ThinkPad P1 G4-20Y30017GE
Intel Core i7-11800H, NVIDIA T1200 Laptop GPU
37 fps -72%
Lenovo ThinkPad P16s G2 21K9000CGE
AMD Ryzen 7 PRO 7840U, AMD Radeon 780M
25.2 fps -81%
2560x1440 High Quality
HP ZBook Fury 16 G10
Intel Core i9-13950HX, NVIDIA RTX 5000 Ada Generation Laptop GPU
120 fps +16%
Genomsnitt NVIDIA RTX 5000 Ada Generation Laptop GPU
  (100.8 - 120, n=3)
108.2 fps +4%
Dell Precision 5690
Intel Core Ultra 9 185H, NVIDIA RTX 5000 Ada Generation Laptop GPU
103.8 fps
Dell Precision 5000 5680
Intel Core i9-13900H, NVIDIA RTX 5000 Ada Generation Laptop GPU
100.8 fps -3%
HP ZBook Fury 16 G9
Intel Core i9-12950HX, NVIDIA RTX A5500 Laptop GPU
75.1 fps -28%
Asus ProArt StudioBook 16 W7600H5A-2BL2
Intel Xeon W-11955M, NVIDIA RTX A5000 Laptop GPU
70.6 fps -32%
Dell XPS 16 9640
Intel Core Ultra 7 155H, NVIDIA GeForce RTX 4070 Laptop GPU
70 fps -33%
Lenovo ThinkPad P1 G6-21FV000DGE
Intel Core i9-13900H, NVIDIA RTX 2000 Ada Generation Laptop GPU
63.7 fps -39%
Lenovo ThinkPad P16 G2 21FA000FGE
Intel Core i7-13700HX, NVIDIA RTX 2000 Ada Generation Laptop GPU
61.3 fps -41%
MSI CreatorPro Z16P B12UKST
Intel Core i7-12700H, NVIDIA RTX A3000 Laptop GPU
45.6 fps -56%
Lenovo ThinkPad P16 G1 21D6001DMB
Intel Core i7-12850HX, NVIDIA RTX A2000 Laptop GPU
31.1 fps -70%
Lenovo ThinkPad P1 G4-20Y30017GE
Intel Core i7-11800H, NVIDIA T1200 Laptop GPU
26 fps -75%
Lenovo ThinkPad P16s G2 21K9000CGE
AMD Ryzen 7 PRO 7840U, AMD Radeon 780M
17.7 fps -83%
3840x2160 High Quality
HP ZBook Fury 16 G10
Intel Core i9-13950HX, NVIDIA RTX 5000 Ada Generation Laptop GPU
68.7 fps +9%
Genomsnitt NVIDIA RTX 5000 Ada Generation Laptop GPU
  (60.4 - 68.7, n=3)
64.1 fps +1%
Dell Precision 5690
Intel Core Ultra 9 185H, NVIDIA RTX 5000 Ada Generation Laptop GPU
63.2 fps
Dell Precision 5000 5680
Intel Core i9-13900H, NVIDIA RTX 5000 Ada Generation Laptop GPU
60.4 fps -4%
Asus ProArt StudioBook 16 W7600H5A-2BL2
Intel Xeon W-11955M, NVIDIA RTX A5000 Laptop GPU
41 fps -35%
HP ZBook Fury 16 G9
Intel Core i9-12950HX, NVIDIA RTX A5500 Laptop GPU
39.4 fps -38%
Lenovo ThinkPad P16s G2 21K9000CGE
AMD Ryzen 7 PRO 7840U, AMD Radeon 780M
11.2 fps -82%
Cyberpunk 2077 2.1 Phantom Liberty
1920x1080 High Preset (FSR off)
Dell Precision 5690
Intel Core Ultra 9 185H, NVIDIA RTX 5000 Ada Generation Laptop GPU
94.6 (39.9min) fps
Genomsnitt NVIDIA RTX 5000 Ada Generation Laptop GPU
  ()
94.6 fps 0%
Dell XPS 16 9640
Intel Core Ultra 7 155H, NVIDIA GeForce RTX 4070 Laptop GPU
74.7 (62.9min) fps -21%
Lenovo ThinkPad P16v G1 AMD
AMD Ryzen 7 PRO 7840HS, NVIDIA RTX A1000 Laptop GPU
41.6 (31.9min) fps -56%
1920x1080 Ultra Preset (FSR off)
Dell Precision 5690
Intel Core Ultra 9 185H, NVIDIA RTX 5000 Ada Generation Laptop GPU
108.5 (48.4min) fps
Genomsnitt NVIDIA RTX 5000 Ada Generation Laptop GPU
  ()
108.5 fps 0%
Dell XPS 16 9640
Intel Core Ultra 7 155H, NVIDIA GeForce RTX 4070 Laptop GPU
64.3 (53.3min) fps -41%
Lenovo ThinkPad P16v G1 AMD
AMD Ryzen 7 PRO 7840HS, NVIDIA RTX A1000 Laptop GPU
34.7 (26.7min) fps -68%
2560x1440 Ultra Preset (FSR off)
Dell Precision 5690
Intel Core Ultra 9 185H, NVIDIA RTX 5000 Ada Generation Laptop GPU
63.7 (28min) fps
Genomsnitt NVIDIA RTX 5000 Ada Generation Laptop GPU
  ()
63.7 fps 0%
Dell XPS 16 9640
Intel Core Ultra 7 155H, NVIDIA GeForce RTX 4070 Laptop GPU
39.6 (32.7min) fps -38%
3840x2160 Ultra Preset (FSR off)
Dell Precision 5690
Intel Core Ultra 9 185H, NVIDIA RTX 5000 Ada Generation Laptop GPU
28.8 (21.2min) fps
Genomsnitt NVIDIA RTX 5000 Ada Generation Laptop GPU
  ()
28.8 fps 0%
1920x1080 Ray Tracing Ultra Preset (DLSS off)
Dell Precision 5690
Intel Core Ultra 9 185H, NVIDIA RTX 5000 Ada Generation Laptop GPU
47.9 (17.5min) fps
Genomsnitt NVIDIA RTX 5000 Ada Generation Laptop GPU
  ()
47.9 fps 0%
F1 22
1920x1080 High Preset AA:T AF:16x
Dell Precision 5690
Intel Core Ultra 9 185H, NVIDIA RTX 5000 Ada Generation Laptop GPU
217 (166min, 110P1) fps
HP ZBook Fury 16 G10
Intel Core i9-13950HX, NVIDIA RTX 5000 Ada Generation Laptop GPU
211 (162min, 86P1) fps -3%
Genomsnitt NVIDIA RTX 5000 Ada Generation Laptop GPU
  (202 - 217, n=3)
210 fps -3%
Dell Precision 5000 5680
Intel Core i9-13900H, NVIDIA RTX 5000 Ada Generation Laptop GPU
202 (158min, 101P1) fps -7%
HP ZBook Fury 16 G9
Intel Core i9-12950HX, NVIDIA RTX A5500 Laptop GPU
170.2 (149min, 97P1) fps -22%
Lenovo ThinkPad P1 G6-21FV000DGE
Intel Core i9-13900H, NVIDIA RTX 2000 Ada Generation Laptop GPU
138.5 (123min, 81P1) fps -36%
MSI CreatorPro Z16P B12UKST
Intel Core i7-12700H, NVIDIA RTX A3000 Laptop GPU
120.9 (90min, 85P1) fps -44%
Lenovo ThinkPad P16v G1 AMD
AMD Ryzen 7 PRO 7840HS, NVIDIA RTX A1000 Laptop GPU
104.3 (88min, 82P1) fps -52%
1920x1080 Ultra High Preset AA:T AF:16x
Dell Precision 5690
Intel Core Ultra 9 185H, NVIDIA RTX 5000 Ada Generation Laptop GPU
91.1 (75min, 64P1) fps
Genomsnitt NVIDIA RTX 5000 Ada Generation Laptop GPU
  (84.5 - 91.1, n=3)
87.3 fps -4%
HP ZBook Fury 16 G10
Intel Core i9-13950HX, NVIDIA RTX 5000 Ada Generation Laptop GPU
86.2 (74min, 37P1) fps -5%
Dell Precision 5000 5680
Intel Core i9-13900H, NVIDIA RTX 5000 Ada Generation Laptop GPU
84.5 (74min, 57P1) fps -7%
HP ZBook Fury 16 G9
Intel Core i9-12950HX, NVIDIA RTX A5500 Laptop GPU
60.9 (51min, 48P1) fps -33%
Lenovo ThinkPad P1 G6-21FV000DGE
Intel Core i9-13900H, NVIDIA RTX 2000 Ada Generation Laptop GPU
52.8 (45min, 39P1) fps -42%
MSI CreatorPro Z16P B12UKST
Intel Core i7-12700H, NVIDIA RTX A3000 Laptop GPU
39 (32min, 31P1) fps -57%
Lenovo ThinkPad P16v G1 AMD
AMD Ryzen 7 PRO 7840HS, NVIDIA RTX A1000 Laptop GPU
30.6 (26min, 25P1) fps -66%
2560x1440 Ultra High Preset AA:T AF:16x
HP ZBook Fury 16 G10
Intel Core i9-13950HX, NVIDIA RTX 5000 Ada Generation Laptop GPU
64.4 (56min, 34P1) fps +7%
Genomsnitt NVIDIA RTX 5000 Ada Generation Laptop GPU
  (56.1 - 64.4, n=3)
60.2 fps 0%
Dell Precision 5690
Intel Core Ultra 9 185H, NVIDIA RTX 5000 Ada Generation Laptop GPU
60.1 (52min, 48P1) fps
Dell Precision 5000 5680
Intel Core i9-13900H, NVIDIA RTX 5000 Ada Generation Laptop GPU
56.1 (49min, 34P1) fps -7%
HP ZBook Fury 16 G9
Intel Core i9-12950HX, NVIDIA RTX A5500 Laptop GPU
37.2 (23min, 29P1) fps -38%
Lenovo ThinkPad P1 G6-21FV000DGE
Intel Core i9-13900H, NVIDIA RTX 2000 Ada Generation Laptop GPU
34.2 (29min, 28P1) fps -43%
MSI CreatorPro Z16P B12UKST
Intel Core i7-12700H, NVIDIA RTX A3000 Laptop GPU
26.2 (21min, 20P1) fps -56%
3840x2160 Ultra High Preset AA:T AF:16x
HP ZBook Fury 16 G10
Intel Core i9-13950HX, NVIDIA RTX 5000 Ada Generation Laptop GPU
33.4 (29min, 27P1) fps +13%
Genomsnitt NVIDIA RTX 5000 Ada Generation Laptop GPU
  (28.8 - 33.4, n=3)
30.6 fps +3%
Dell Precision 5690
Intel Core Ultra 9 185H, NVIDIA RTX 5000 Ada Generation Laptop GPU
29.6 (25min, 24P1) fps
Dell Precision 5000 5680
Intel Core i9-13900H, NVIDIA RTX 5000 Ada Generation Laptop GPU
28.8 (24min, 23P1) fps -3%
HP ZBook Fury 16 G9
Intel Core i9-12950HX, NVIDIA RTX A5500 Laptop GPU
17.6 (15min, 14P1) fps -41%
Tiny Tina's Wonderlands
1920x1080 High Preset (DX12)
HP ZBook Fury 16 G10
Intel Core i9-13950HX, NVIDIA RTX 5000 Ada Generation Laptop GPU
171.7 fps +18%
Genomsnitt NVIDIA RTX 5000 Ada Generation Laptop GPU
  (145.5 - 171.7, n=3)
156.6 fps +8%
Dell Precision 5000 5680
Intel Core i9-13900H, NVIDIA RTX 5000 Ada Generation Laptop GPU
152.6 fps +5%
Dell Precision 5690
Intel Core Ultra 9 185H, NVIDIA RTX 5000 Ada Generation Laptop GPU
145.5 fps
HP ZBook Fury 16 G9
Intel Core i9-12950HX, NVIDIA RTX A5500 Laptop GPU
109.5 fps -25%
1920x1080 Badass Preset (DX12)
HP ZBook Fury 16 G10
Intel Core i9-13950HX, NVIDIA RTX 5000 Ada Generation Laptop GPU
139.4 fps +12%
Genomsnitt NVIDIA RTX 5000 Ada Generation Laptop GPU
  (124 - 139.4, n=3)
129.5 fps +4%
Dell Precision 5000 5680
Intel Core i9-13900H, NVIDIA RTX 5000 Ada Generation Laptop GPU
125 fps +1%
Dell Precision 5690
Intel Core Ultra 9 185H, NVIDIA RTX 5000 Ada Generation Laptop GPU
124 fps
HP ZBook Fury 16 G9
Intel Core i9-12950HX, NVIDIA RTX A5500 Laptop GPU
87.5 fps -29%
2560x1440 Badass Preset (DX12)
HP ZBook Fury 16 G10
Intel Core i9-13950HX, NVIDIA RTX 5000 Ada Generation Laptop GPU
99.4 fps +14%
Genomsnitt NVIDIA RTX 5000 Ada Generation Laptop GPU
  (87.1 - 99.4, n=3)
92.2 fps +6%
Dell Precision 5000 5680
Intel Core i9-13900H, NVIDIA RTX 5000 Ada Generation Laptop GPU
90.1 fps +3%
Dell Precision 5690
Intel Core Ultra 9 185H, NVIDIA RTX 5000 Ada Generation Laptop GPU
87.1 fps
HP ZBook Fury 16 G9
Intel Core i9-12950HX, NVIDIA RTX A5500 Laptop GPU
57.9 fps -34%
3840x2160 Badass Preset (DX12)
HP ZBook Fury 16 G10
Intel Core i9-13950HX, NVIDIA RTX 5000 Ada Generation Laptop GPU
53.9 fps +11%
Genomsnitt NVIDIA RTX 5000 Ada Generation Laptop GPU
  (48.4 - 53.9, n=3)
51.1 fps +6%
Dell Precision 5000 5680
Intel Core i9-13900H, NVIDIA RTX 5000 Ada Generation Laptop GPU
50.9 fps +5%
Dell Precision 5690
Intel Core Ultra 9 185H, NVIDIA RTX 5000 Ada Generation Laptop GPU
48.4 fps
HP ZBook Fury 16 G9
Intel Core i9-12950HX, NVIDIA RTX A5500 Laptop GPU
29.6 fps -39%
Strange Brigade
1920x1080 high AA:high AF:8
HP ZBook Fury 16 G10
Intel Core i9-13950HX, NVIDIA RTX 5000 Ada Generation Laptop GPU
306 (30.3min, 212P1) fps +11%
Genomsnitt NVIDIA RTX 5000 Ada Generation Laptop GPU
  (276 - 306, n=2)
291 fps +5%
Dell Precision 5690
Intel Core Ultra 9 185H, NVIDIA RTX 5000 Ada Generation Laptop GPU
276 (48.4min, 199.7P1) fps
Dell XPS 16 9640
Intel Core Ultra 7 155H, NVIDIA GeForce RTX 4070 Laptop GPU
202 fps -27%
Asus ProArt StudioBook 16 W7600H5A-2BL2
Intel Xeon W-11955M, NVIDIA RTX A5000 Laptop GPU
192 (89.6min, 141P1) fps -30%
HP ZBook Fury 16 G9
Intel Core i9-12950HX, NVIDIA RTX A5500 Laptop GPU
190.2 (118.9min, 142.6P1) fps -31%
Lenovo ThinkPad P16 G2 21FA000FGE
Intel Core i7-13700HX, NVIDIA RTX 2000 Ada Generation Laptop GPU
184.2 (34.3min, 135.2P1) fps -33%
Lenovo ThinkPad P1 G6-21FV000DGE
Intel Core i9-13900H, NVIDIA RTX 2000 Ada Generation Laptop GPU
182.5 (53.7min, 132.1P1) fps -34%
MSI CreatorPro Z16P B12UKST
Intel Core i7-12700H, NVIDIA RTX A3000 Laptop GPU
121 fps -56%
Lenovo ThinkPad P16 G1 21D6001DMB
Intel Core i7-12850HX, NVIDIA RTX A2000 Laptop GPU
91.1 (48.2min, 65.2P1) fps -67%
Lenovo ThinkPad P16v G1 AMD
AMD Ryzen 7 PRO 7840HS, NVIDIA RTX A1000 Laptop GPU
90.2 (61.5min, 70.1P1) fps -67%
Lenovo ThinkPad P1 G4-20Y30017GE
Intel Core i7-11800H, NVIDIA T1200 Laptop GPU
77 fps -72%
Lenovo ThinkPad P16s G2 21K9000CGE
AMD Ryzen 7 PRO 7840U, AMD Radeon 780M
56.1 (39.3min, 43.6P1) fps -80%
1920x1080 ultra AA:ultra AF:16
HP ZBook Fury 16 G10
Intel Core i9-13950HX, NVIDIA RTX 5000 Ada Generation Laptop GPU
283 (35min, 198.2P1) fps +12%
Genomsnitt NVIDIA RTX 5000 Ada Generation Laptop GPU
  (252 - 283, n=2)
268 fps +6%
Dell Precision 5690
Intel Core Ultra 9 185H, NVIDIA RTX 5000 Ada Generation Laptop GPU
252 (95min, 179P1) fps
Dell XPS 16 9640
Intel Core Ultra 7 155H, NVIDIA GeForce RTX 4070 Laptop GPU
175 fps -31%
HP ZBook Fury 16 G9
Intel Core i9-12950HX, NVIDIA RTX A5500 Laptop GPU
168.6 (63.3min, 124.8P1) fps -33%
Asus ProArt StudioBook 16 W7600H5A-2BL2
Intel Xeon W-11955M, NVIDIA RTX A5000 Laptop GPU
160 (89.3min, 114P1) fps -37%
Lenovo ThinkPad P16 G2 21FA000FGE
Intel Core i7-13700HX, NVIDIA RTX 2000 Ada Generation Laptop GPU
158.4 (22.5min, 117.2P1) fps -37%
Lenovo ThinkPad P1 G6-21FV000DGE
Intel Core i9-13900H, NVIDIA RTX 2000 Ada Generation Laptop GPU
158.2 (36.7min, 115.4P1) fps -37%
MSI CreatorPro Z16P B12UKST
Intel Core i7-12700H, NVIDIA RTX A3000 Laptop GPU
108 fps -57%
Lenovo ThinkPad P16v G1 AMD
AMD Ryzen 7 PRO 7840HS, NVIDIA RTX A1000 Laptop GPU
78.4 (57.3min, 61.9P1) fps -69%
Lenovo ThinkPad P16 G1 21D6001DMB
Intel Core i7-12850HX, NVIDIA RTX A2000 Laptop GPU
77.8 (29.5min, 57.1P1) fps -69%
Lenovo ThinkPad P1 G4-20Y30017GE
Intel Core i7-11800H, NVIDIA T1200 Laptop GPU
67 fps -73%
Lenovo ThinkPad P16s G2 21K9000CGE
AMD Ryzen 7 PRO 7840U, AMD Radeon 780M
46.9 (29.8min, 35.7P1) fps -81%
2560x1440 ultra AA:ultra AF:16
HP ZBook Fury 16 G10
Intel Core i9-13950HX, NVIDIA RTX 5000 Ada Generation Laptop GPU
216 (36.8min, 158.7P1) fps +13%
Genomsnitt NVIDIA RTX 5000 Ada Generation Laptop GPU
  (190.6 - 216, n=2)
203 fps +7%
Dell Precision 5690
Intel Core Ultra 9 185H, NVIDIA RTX 5000 Ada Generation Laptop GPU
190.6 (44.7min, 135.8P1) fps
Asus ProArt StudioBook 16 W7600H5A-2BL2
Intel Xeon W-11955M, NVIDIA RTX A5000 Laptop GPU
129 (70.7min, 98.8P1) fps -32%
HP ZBook Fury 16 G9
Intel Core i9-12950HX, NVIDIA RTX A5500 Laptop GPU
122 (88.9min, 98.3P1) fps -36%
Dell XPS 16 9640
Intel Core Ultra 7 155H, NVIDIA GeForce RTX 4070 Laptop GPU
116 fps -39%
Lenovo ThinkPad P1 G6-21FV000DGE
Intel Core i9-13900H, NVIDIA RTX 2000 Ada Generation Laptop GPU
107.5 (57.7min, 86.9P1) fps -44%
Lenovo ThinkPad P16 G2 21FA000FGE
Intel Core i7-13700HX, NVIDIA RTX 2000 Ada Generation Laptop GPU
103.9 (32.8min, 84.8P1) fps -45%
MSI CreatorPro Z16P B12UKST
Intel Core i7-12700H, NVIDIA RTX A3000 Laptop GPU
85 fps -55%
Lenovo ThinkPad P16 G1 21D6001DMB
Intel Core i7-12850HX, NVIDIA RTX A2000 Laptop GPU
54.3 (38.6min, 39.8P1) fps -72%
Lenovo ThinkPad P1 G4-20Y30017GE
Intel Core i7-11800H, NVIDIA T1200 Laptop GPU
47 fps -75%
Lenovo ThinkPad P16s G2 21K9000CGE
AMD Ryzen 7 PRO 7840U, AMD Radeon 780M
31.7 (21.9min, 25.9P1) fps -83%
3840x2160 ultra AA:ultra AF:16
Dell Precision 5690
Intel Core Ultra 9 185H, NVIDIA RTX 5000 Ada Generation Laptop GPU
105.3 (44min, 89.3P1) fps
Genomsnitt NVIDIA RTX 5000 Ada Generation Laptop GPU
  (105.1 - 105.3, n=2)
105.2 fps 0%
HP ZBook Fury 16 G10
Intel Core i9-13950HX, NVIDIA RTX 5000 Ada Generation Laptop GPU
105.1 (42.4min, 85.1P1) fps 0%
HP ZBook Fury 16 G9
Intel Core i9-12950HX, NVIDIA RTX A5500 Laptop GPU
67.6 (35.4min, 56.7P1) fps -36%
Lenovo ThinkPad P16s G2 21K9000CGE
AMD Ryzen 7 PRO 7840U, AMD Radeon 780M
16.3 (12.5min, 13.3P1) fps -85%
Far Cry 5
1920x1080 High Preset AA:T
HP ZBook Fury 16 G10
Intel Core i9-13950HX, NVIDIA RTX 5000 Ada Generation Laptop GPU
138 (102min) fps +9%
Genomsnitt NVIDIA RTX 5000 Ada Generation Laptop GPU
  (127 - 138, n=3)
131.3 fps +3%
Dell Precision 5000 5680
Intel Core i9-13900H, NVIDIA RTX 5000 Ada Generation Laptop GPU
129 (102min) fps +2%
Dell Precision 5690
Intel Core Ultra 9 185H, NVIDIA RTX 5000 Ada Generation Laptop GPU
127 (97min) fps
Dell XPS 16 9640
Intel Core Ultra 7 155H, NVIDIA GeForce RTX 4070 Laptop GPU
122 fps -4%
Lenovo ThinkPad P1 G6-21FV000DGE
Intel Core i9-13900H, NVIDIA RTX 2000 Ada Generation Laptop GPU
120 fps -6%
MSI CreatorPro Z16P B12UKST
Intel Core i7-12700H, NVIDIA RTX A3000 Laptop GPU
117 fps -8%
Lenovo ThinkPad P16v G1 AMD
AMD Ryzen 7 PRO 7840HS, NVIDIA RTX A1000 Laptop GPU
79 fps -38%
Lenovo ThinkPad P1 G4-20Y30017GE
Intel Core i7-11800H, NVIDIA T1200 Laptop GPU
64 fps -50%
Asus ProArt StudioBook 16 W7600H5A-2BL2
Intel Xeon W-11955M, NVIDIA RTX A5000 Laptop GPU
62 fps -51%
Lenovo ThinkPad P16s G2 21K9000CGE
AMD Ryzen 7 PRO 7840U, AMD Radeon 780M
42 (35min) fps -67%
1920x1080 Ultra Preset AA:T
Dell Precision 5000 5680
Intel Core i9-13900H, NVIDIA RTX 5000 Ada Generation Laptop GPU
132 (101min) fps +11%
HP ZBook Fury 16 G10
Intel Core i9-13950HX, NVIDIA RTX 5000 Ada Generation Laptop GPU
131 (98min) fps +10%
Genomsnitt NVIDIA RTX 5000 Ada Generation Laptop GPU
  (119 - 132, n=3)
127.3 fps +7%
Dell Precision 5690
Intel Core Ultra 9 185H, NVIDIA RTX 5000 Ada Generation Laptop GPU
119 (91min) fps
Dell XPS 16 9640
Intel Core Ultra 7 155H, NVIDIA GeForce RTX 4070 Laptop GPU
115 fps -3%
Lenovo ThinkPad P1 G6-21FV000DGE
Intel Core i9-13900H, NVIDIA RTX 2000 Ada Generation Laptop GPU
113 fps -5%
MSI CreatorPro Z16P B12UKST
Intel Core i7-12700H, NVIDIA RTX A3000 Laptop GPU
108 fps -9%
Lenovo ThinkPad P16v G1 AMD
AMD Ryzen 7 PRO 7840HS, NVIDIA RTX A1000 Laptop GPU
73 fps -39%
Asus ProArt StudioBook 16 W7600H5A-2BL2
Intel Xeon W-11955M, NVIDIA RTX A5000 Laptop GPU
60 fps -50%
Lenovo ThinkPad P1 G4-20Y30017GE
Intel Core i7-11800H, NVIDIA T1200 Laptop GPU
60 fps -50%
Lenovo ThinkPad P16s G2 21K9000CGE
AMD Ryzen 7 PRO 7840U, AMD Radeon 780M
40 (27min) fps -66%
2560x1440 Ultra Preset AA:T
HP ZBook Fury 16 G10
Intel Core i9-13950HX, NVIDIA RTX 5000 Ada Generation Laptop GPU
129 (94min) fps +14%
Genomsnitt NVIDIA RTX 5000 Ada Generation Laptop GPU
  (113 - 129, n=3)
118.7 fps +5%
Dell Precision 5000 5680
Intel Core i9-13900H, NVIDIA RTX 5000 Ada Generation Laptop GPU
114 (65min) fps +1%
Dell Precision 5690
Intel Core Ultra 9 185H, NVIDIA RTX 5000 Ada Generation Laptop GPU
113 (88min) fps
Dell XPS 16 9640
Intel Core Ultra 7 155H, NVIDIA GeForce RTX 4070 Laptop GPU
94 fps -17%
Lenovo ThinkPad P1 G6-21FV000DGE
Intel Core i9-13900H, NVIDIA RTX 2000 Ada Generation Laptop GPU
81 fps -28%
MSI CreatorPro Z16P B12UKST
Intel Core i7-12700H, NVIDIA RTX A3000 Laptop GPU
76 fps -33%
Asus ProArt StudioBook 16 W7600H5A-2BL2
Intel Xeon W-11955M, NVIDIA RTX A5000 Laptop GPU
58 fps -49%
Lenovo ThinkPad P1 G4-20Y30017GE
Intel Core i7-11800H, NVIDIA T1200 Laptop GPU
41 fps -64%
Lenovo ThinkPad P16s G2 21K9000CGE
AMD Ryzen 7 PRO 7840U, AMD Radeon 780M
27 (24min) fps -76%
3840x2160 Ultra Preset AA:T
Dell Precision 5690
Intel Core Ultra 9 185H, NVIDIA RTX 5000 Ada Generation Laptop GPU
72 (64min) fps
Genomsnitt NVIDIA RTX 5000 Ada Generation Laptop GPU
  (70 - 72, n=2)
71 fps -1%
Dell Precision 5000 5680
Intel Core i9-13900H, NVIDIA RTX 5000 Ada Generation Laptop GPU
70 (62min) fps -3%
Asus ProArt StudioBook 16 W7600H5A-2BL2
Intel Xeon W-11955M, NVIDIA RTX A5000 Laptop GPU
36 fps -50%
Lenovo ThinkPad P16s G2 21K9000CGE
AMD Ryzen 7 PRO 7840U, AMD Radeon 780M
12 (10min) fps -83%
X-Plane 11.11
1920x1080 high (fps_test=3)
HP ZBook Fury 16 G10
Intel Core i9-13950HX, NVIDIA RTX 5000 Ada Generation Laptop GPU
122.4 fps +38%
Lenovo ThinkPad P1 G6-21FV000DGE
Intel Core i9-13900H, NVIDIA RTX 2000 Ada Generation Laptop GPU
108.9 fps +23%
Genomsnitt NVIDIA RTX 5000 Ada Generation Laptop GPU
  (88.7 - 122.4, n=3)
104.5 fps +18%
HP ZBook Fury 16 G9
Intel Core i9-12950HX, NVIDIA RTX A5500 Laptop GPU
103.6 fps +17%
Lenovo ThinkPad P16 G2 21FA000FGE
Intel Core i7-13700HX, NVIDIA RTX 2000 Ada Generation Laptop GPU
103.4 fps +17%
Dell Precision 5000 5680
Intel Core i9-13900H, NVIDIA RTX 5000 Ada Generation Laptop GPU
102.4 fps +15%
MSI CreatorPro Z16P B12UKST
Intel Core i7-12700H, NVIDIA RTX A3000 Laptop GPU
97.5 fps +10%
Lenovo ThinkPad P16 G1 21D6001DMB
Intel Core i7-12850HX, NVIDIA RTX A2000 Laptop GPU
95.6 fps +8%
Dell Precision 5690
Intel Core Ultra 9 185H, NVIDIA RTX 5000 Ada Generation Laptop GPU
88.7 fps
Dell XPS 16 9640
Intel Core Ultra 7 155H, NVIDIA GeForce RTX 4070 Laptop GPU
84.7 fps -5%
Dell XPS 16 9640
Intel Core Ultra 7 155H, NVIDIA GeForce RTX 4070 Laptop GPU
84.4 fps -5%
Asus ProArt StudioBook 16 W7600H5A-2BL2
Intel Xeon W-11955M, NVIDIA RTX A5000 Laptop GPU
81.6 fps -8%
Lenovo ThinkPad P16v G1 AMD
AMD Ryzen 7 PRO 7840HS, NVIDIA RTX A1000 Laptop GPU
71.9 fps -19%
Lenovo ThinkPad P1 G4-20Y30017GE
Intel Core i7-11800H, NVIDIA T1200 Laptop GPU
66.8 fps -25%
Lenovo ThinkPad P16s G2 21K9000CGE
AMD Ryzen 7 PRO 7840U, AMD Radeon 780M
28.4 fps -68%
Lenovo ThinkPad P16s G2 21K9000CGE
AMD Ryzen 7 PRO 7840U, AMD Radeon 780M
28.1 fps -68%
3840x2160 high (fps_test=3)
HP ZBook Fury 16 G10
Intel Core i9-13950HX, NVIDIA RTX 5000 Ada Generation Laptop GPU
102.6 fps +37%
Genomsnitt NVIDIA RTX 5000 Ada Generation Laptop GPU
  (74.8 - 102.6, n=3)
87.9 fps +18%
Dell Precision 5000 5680
Intel Core i9-13900H, NVIDIA RTX 5000 Ada Generation Laptop GPU
86.2 fps +15%
HP ZBook Fury 16 G9
Intel Core i9-12950HX, NVIDIA RTX A5500 Laptop GPU
81.9 fps +9%
Dell Precision 5690
Intel Core Ultra 9 185H, NVIDIA RTX 5000 Ada Generation Laptop GPU
74.8 fps
Dell XPS 16 9640
Intel Core Ultra 7 155H, NVIDIA GeForce RTX 4070 Laptop GPU
68.9 fps -8%
Lenovo ThinkPad P1 G4-20Y30017GE
Intel Core i7-11800H, NVIDIA T1200 Laptop GPU
52.4 fps -30%
Asus ProArt StudioBook 16 W7600H5A-2BL2
Intel Xeon W-11955M, NVIDIA RTX A5000 Laptop GPU
52 fps -30%
Lenovo ThinkPad P16s G2 21K9000CGE
AMD Ryzen 7 PRO 7840U, AMD Radeon 780M
19.2 fps -74%
Dota 2 Reborn
1920x1080 high (2/3)
HP ZBook Fury 16 G10
Intel Core i9-13950HX, NVIDIA RTX 5000 Ada Generation Laptop GPU
188.2 (149.9min) fps +25%
Genomsnitt NVIDIA RTX 5000 Ada Generation Laptop GPU
  (150.1 - 188.2, n=3)
164.1 fps +9%
HP ZBook Fury 16 G9
Intel Core i9-12950HX, NVIDIA RTX A5500 Laptop GPU
162.4 (139.1min) fps +8%
Lenovo ThinkPad P16 G2 21FA000FGE
Intel Core i7-13700HX, NVIDIA RTX 2000 Ada Generation Laptop GPU
160.7 (139.5min) fps +7%
MSI CreatorPro Z16P B12UKST
Intel Core i7-12700H, NVIDIA RTX A3000 Laptop GPU
155.8 (136min) fps +4%
Dell Precision 5000 5680
Intel Core i9-13900H, NVIDIA RTX 5000 Ada Generation Laptop GPU
154 (135.6min) fps +3%
Dell Precision 5690
Intel Core Ultra 9 185H, NVIDIA RTX 5000 Ada Generation Laptop GPU
150.1 (128.5min) fps
Lenovo ThinkPad P16 G1 21D6001DMB
Intel Core i7-12850HX, NVIDIA RTX A2000 Laptop GPU
149.3 (130.5min) fps -1%
Lenovo ThinkPad P1 G6-21FV000DGE
Intel Core i9-13900H, NVIDIA RTX 2000 Ada Generation Laptop GPU
143.9 (120.2min) fps -4%
Lenovo ThinkPad P16v G1 AMD
AMD Ryzen 7 PRO 7840HS, NVIDIA RTX A1000 Laptop GPU
125 (110.6min) fps -17%
Asus ProArt StudioBook 16 W7600H5A-2BL2
Intel Xeon W-11955M, NVIDIA RTX A5000 Laptop GPU
124 (103.4min) fps -17%
Lenovo ThinkPad P1 G4-20Y30017GE
Intel Core i7-11800H, NVIDIA T1200 Laptop GPU
114 (98.4min) fps -24%
Dell XPS 16 9640
Intel Core Ultra 7 155H, NVIDIA GeForce RTX 4070 Laptop GPU
89.5 (84.4min) fps -40%
Lenovo ThinkPad P16s G2 21K9000CGE
AMD Ryzen 7 PRO 7840U, AMD Radeon 780M
82.1 (69.8min) fps -45%
1920x1080 ultra (3/3) best looking
HP ZBook Fury 16 G10
Intel Core i9-13950HX, NVIDIA RTX 5000 Ada Generation Laptop GPU
166.7 (137.7min) fps +19%
HP ZBook Fury 16 G9
Intel Core i9-12950HX, NVIDIA RTX A5500 Laptop GPU
150.7 (128.4min) fps +8%
Lenovo ThinkPad P16 G2 21FA000FGE
Intel Core i7-13700HX, NVIDIA RTX 2000 Ada Generation Laptop GPU
150.2 (130.8min) fps +7%
Genomsnitt NVIDIA RTX 5000 Ada Generation Laptop GPU
  (139.9 - 166.7, n=3)
150.2 fps +7%
MSI CreatorPro Z16P B12UKST
Intel Core i7-12700H, NVIDIA RTX A3000 Laptop GPU
147.1 (127.8min) fps +5%
Dell Precision 5000 5680
Intel Core i9-13900H, NVIDIA RTX 5000 Ada Generation Laptop GPU
144 (126.4min) fps +3%
Dell Precision 5690
Intel Core Ultra 9 185H, NVIDIA RTX 5000 Ada Generation Laptop GPU
139.9 (118min) fps
Lenovo ThinkPad P16 G1 21D6001DMB
Intel Core i7-12850HX, NVIDIA RTX A2000 Laptop GPU
139.5 (121min) fps 0%
Lenovo ThinkPad P1 G6-21FV000DGE
Intel Core i9-13900H, NVIDIA RTX 2000 Ada Generation Laptop GPU
133.4 (113.4min) fps -5%
Lenovo ThinkPad P16v G1 AMD
AMD Ryzen 7 PRO 7840HS, NVIDIA RTX A1000 Laptop GPU
118.2 (104.2min) fps -16%
Asus ProArt StudioBook 16 W7600H5A-2BL2
Intel Xeon W-11955M, NVIDIA RTX A5000 Laptop GPU
117 (97min) fps -16%
Lenovo ThinkPad P1 G4-20Y30017GE
Intel Core i7-11800H, NVIDIA T1200 Laptop GPU
107 (92min) fps -24%
Dell XPS 16 9640
Intel Core Ultra 7 155H, NVIDIA GeForce RTX 4070 Laptop GPU
89.7 (83.8min) fps -36%
Lenovo ThinkPad P16s G2 21K9000CGE
AMD Ryzen 7 PRO 7840U, AMD Radeon 780M
69.5 (59.8min) fps -50%
3840x2160 ultra (3/3) best looking
HP ZBook Fury 16 G10
Intel Core i9-13950HX, NVIDIA RTX 5000 Ada Generation Laptop GPU
157.3 (129.2min) fps +21%
Genomsnitt NVIDIA RTX 5000 Ada Generation Laptop GPU
  (130 - 157.3, n=3)
143.3 fps +10%
Dell Precision 5000 5680
Intel Core i9-13900H, NVIDIA RTX 5000 Ada Generation Laptop GPU
142.5 (119.6min) fps +10%
Dell Precision 5690
Intel Core Ultra 9 185H, NVIDIA RTX 5000 Ada Generation Laptop GPU
130 (104.9min) fps
Asus ProArt StudioBook 16 W7600H5A-2BL2
Intel Xeon W-11955M, NVIDIA RTX A5000 Laptop GPU
118 (97.8min) fps -9%
HP ZBook Fury 16 G9
Intel Core i9-12950HX, NVIDIA RTX A5500 Laptop GPU
116.1 (86min) fps -11%
Dell XPS 16 9640
Intel Core Ultra 7 155H, NVIDIA GeForce RTX 4070 Laptop GPU
115.7 (100.9min) fps -11%
Lenovo ThinkPad P1 G4-20Y30017GE
Intel Core i7-11800H, NVIDIA T1200 Laptop GPU
109 (93.1min) fps -16%
Lenovo ThinkPad P16s G2 21K9000CGE
AMD Ryzen 7 PRO 7840U, AMD Radeon 780M
31.2 (29.9min) fps -76%

Witcher 3 FPS Chart

0102030405060708090100110120130140Tooltip
Dell Precision 5690 Ultra 9 185H, NVIDIA RTX 5000 Ada Generation Laptop GPU: Ø131 (122-140)
lågmed.högultraQHD4K DLSS4K
The Witcher 3 (2015) 411.3 351.2 258.7 137.6 103.9
Dota 2 Reborn (2015) 169.4 149.2 150.1 139.9 130
Final Fantasy XV Benchmark (2018) 196.6 165.4 132.5 103.8 63.2
X-Plane 11.11 (2018) 132.8 113.9 88.7 74.8
Far Cry 5 (2018) 144 134 127 119 113 72
Strange Brigade (2018) 405 314 276 252 190.6 105.3
Tiny Tina's Wonderlands (2022) 196.5 179.4 145.5 124 87.1 48.4
F1 22 (2022) 228 224 217 91.1 60.1 29.6
Baldur's Gate 3 (2023) 172.3 155.2 139.2 134.6 100.5 87.8 53.3
Cyberpunk 2077 2.1 Phantom Liberty (2023) 125 116.6 94.6 108.5 63.7 28.8

Utsläpp

System Noise - Högt och ansvarsfullt

Fläktljudet är känsligt för den valda effektprofilen. I Quiet-läget, till exempel, tenderar fläktljudet att ligga under 25 dB(A) mot en tyst bakgrund på 23,4 dB(A). Omvänt tenderar fläktarna att pulsera mer, upp till 30 dB(A), om de är inställda på lägena Balanced eller Performance, även under vardagliga uppgifter som att surfa på webben.

Fläktljudstaket är annars detsamma som det vi registrerade på Precision 5680 på 51 dB(A), vilket är lika högt som många bärbara speldatorer. Detta maximum kan nås när man kör GPU-krävande belastningar i mer än flera minuter.

Fläktens ljudprofil (Vit: Bakgrund, Röd: System i viloläge, Blå: 3DMark 06, Orange: Witcher 3, Grön: Prime95+FurMark stress)

Ljudnivå

Låg belastning
23.6 / 24.9 / 30.9 dB(A)
Hög belastning
40.4 / 51.9 dB(A)
  red to green bar
 
 
30 dB
tyst
40 dB(A)
hörbar
50 dB(A)
högt ljud
 
min: dark, med: mid, max: light   Earthworks M23R, Arta (15 cm avstånd)   omgivningsljud: 23.4 dB(A)
dB(A) 0102030405060708090Deep BassMiddle BassHigh BassLower RangeMidsHigher MidsLower HighsMid HighsUpper HighsSuper Highs2029.330.931.130.831.32522.222.123.125.424.3312323.324.624.324.44022.724.524.120.926.65026.527.323.518.533.76327.724.921.820.529.68025.925.821.619.528.410024.324.220.819.125.912526.425.622.415.227.216030.828.422.314.233.120030.829.223.114.532.425034.427.822.213.733.731533.626.421.114.735.840034.227.220.4153750034.326.418.713.136.663034.52819.710.737.480035.328.119.411.738.4100036.929.919.79.940.5125038.931.120.29.442.3160038.629.518.69.943.4200035.928.217.510.240.5250035.627.116.610.439.3315035.927.720.21139.9400035.728.521.91139.9500035.829.316.411.839.4630038.329.91511.740.6800030.520.612.311.634.81000027.31812.711.732.41250027.818.715.31333.61600027.217.212.411.633SPL48.240.430.923.451.9N6.53.61.40.58.3median 34.4median 27.8median 19.7median 11.7median 37Delta2.92.52.81.73.6hearing rangehide median Fan NoiseDell Precision 5690
Dell Precision 5690
NVIDIA RTX 5000 Ada Generation Laptop GPU, Ultra 9 185H, 2x Samsung PM9A1 1TB (RAID 0)
Dell Precision 5000 5680
NVIDIA RTX 5000 Ada Generation Laptop GPU, i9-13900H, 2x SK hynix PC801 HFS512GEJ9X101N RAID 0
Lenovo ThinkPad P16 G2 21FA000FGE
NVIDIA RTX 2000 Ada Generation Laptop GPU, i7-13700HX, SK hynix PC801 HFS001TEJ9X162N
Lenovo ThinkPad P1 G6-21FV000DGE
NVIDIA RTX 2000 Ada Generation Laptop GPU, i9-13900H, SK Hynix PC711 1TB HFS001TDE9X084N
HP ZBook Fury 16 G10
NVIDIA RTX 5000 Ada Generation Laptop GPU, i9-13950HX, SK hynix PC801 HFS001TEJ9X101N
MSI CreatorPro Z16P B12UKST
RTX A3000 Laptop GPU, i7-12700H, Samsung PM9A1 MZVL21T0HCLR
Noise
6%
-1%
3%
6%
-0%
av / miljö *
23.4
22.8
3%
23.5
-0%
24.5
-5%
22.9
2%
24.1
-3%
Idle Minimum *
23.6
23
3%
23.5
-0%
24.5
-4%
22.9
3%
27.1
-15%
Idle Average *
24.9
23
8%
29.2
-17%
24.5
2%
22.9
8%
27.1
-9%
Idle Maximum *
30.9
23
26%
29.5
5%
24.5
21%
28.5
8%
27.1
12%
Load Average *
40.4
37.2
8%
32.7
19%
48
-19%
40.6
-0%
42.9
-6%
Witcher 3 ultra *
48.3
51
-6%
50.6
-5%
40.7
16%
44.1
9%
44
9%
Load Maximum *
51.9
51
2%
56.6
-9%
48
8%
45.8
12%
47
9%

* ... mindre är bättre

Temperatur

Utvecklingen av yttemperaturen är symmetrisk med värmepunkter på mellan 43 C och 47 C nära tangentbordets mitt. Chassits undersida förblir märkbart svalare än tangentbordet även vid krävande belastningar.

Dubbelt bakre avgasrör
AC-adaptern når över 55 C vid krävande belastningar
 32.2 °C46.6 °C37.8 °C 
 27.4 °C42.6 °C27.6 °C 
 25.8 °C25.8 °C23.6 °C 
Max: 46.6 °C
Medel: 32.2 °C
27.4 °C33 °C30.4 °C
24.4 °C28.4 °C26.2 °C
24.2 °C26.4 °C25.8 °C
Max: 33 °C
Medel: 27.4 °C
Strömförsörjning (max.)  50.6 °C | Rumstemperatur 20 °C | Fluke 62 Mini IR Thermometer
(±) Medeltemperaturen för ovansidan under maximal belastning är 32.2 °C / 90 F, jämfört med genomsnittet av 32 °C / ###class_avg_f# ## F för enheterna i klassen Workstation.
(-) Den maximala temperaturen på ovansidan är 46.6 °C / 116 F, jämfört med genomsnittet av 38.2 °C / 101 F , allt från 22.2 till 69.8 °C för klassen Workstation.
(+) Botten värms upp till maximalt 33 °C / 91 F, jämfört med genomsnittet av 41.3 °C / 106 F
(+) Vid tomgångsbruk är medeltemperaturen för ovansidan 29.2 °C / 85 F, jämfört med enhetsgenomsnittet på 32 °C / ### class_avg_f### F.
(±) När du spelar The Witcher 3 är medeltemperaturen för ovansidan 34 °C / 93 F, jämfört med enhetsgenomsnittet på 32 °C / ## #class_avg_f### F.
(+) Handledsstöden och pekplattan är kallare än hudtemperaturen med maximalt 27.6 °C / 81.7 F och är därför svala att ta på.
(±) Medeltemperaturen för handledsstödsområdet på liknande enheter var 27.8 °C / 82 F (+0.2 °C / 0.3 F).
System i viloläge (överst)
System i viloläge (nedtill)
Witcher 3 stress (överst)
Witcher 3 spänning (botten)
Prime95+FurMark stress (överst)
Prime95+FurMark stress (nederst)
Dell Precision 5690
Intel Core Ultra 9 185H, NVIDIA RTX 5000 Ada Generation Laptop GPU
Dell Precision 5000 5680
Intel Core i9-13900H, NVIDIA RTX 5000 Ada Generation Laptop GPU
Lenovo ThinkPad P16 G2 21FA000FGE
Intel Core i7-13700HX, NVIDIA RTX 2000 Ada Generation Laptop GPU
Lenovo ThinkPad P1 G6-21FV000DGE
Intel Core i9-13900H, NVIDIA RTX 2000 Ada Generation Laptop GPU
HP ZBook Fury 16 G10
Intel Core i9-13950HX, NVIDIA RTX 5000 Ada Generation Laptop GPU
MSI CreatorPro Z16P B12UKST
Intel Core i7-12700H, NVIDIA RTX A3000 Laptop GPU
Heat
-7%
2%
-13%
-16%
-24%
Maximum Upper Side *
46.6
50.2
-8%
47.2
-1%
47.1
-1%
44.8
4%
56.3
-21%
Maximum Bottom *
33
32
3%
39.5
-20%
56.5
-71%
50
-52%
68.3
-107%
Idle Upper Side *
32.4
37.4
-15%
28.1
13%
28.1
13%
34.4
-6%
25.2
22%
Idle Bottom *
29.4
31.2
-6%
25.3
14%
27.6
6%
31.8
-8%
25.9
12%

* ... mindre är bättre

Högtalare

Rosa brus vid maximal volym
dB(A) 0102030405060708090Deep BassMiddle BassHigh BassLower RangeMidsHigher MidsLower HighsMid HighsUpper HighsSuper Highs2029.231.129.22519.923.119.93121.724.621.74018.924.118.95022.323.522.36332.421.832.48046.121.646.110053.120.853.112556.722.456.716061.422.361.420063.923.163.92506822.26831569.621.169.640076.120.476.150077.918.777.963075.619.775.680078.919.478.9100076.619.776.612507620.276160073.818.673.8200074.817.574.8250069.816.669.8315074.320.274.340007321.973500071.816.471.8630063.81563.8800063.512.363.51000069.612.769.61250067.315.367.3160006512.465SPL86.130.986.1N71.51.471.5median 71.5median 19.7median 71.5Delta5.62.85.626.325.821.422.12624.925.127.622.532.523.448.72655.818.860.922.167.2267019.372.317.674.217.774.319.575.31571.711.871.311.27410.574.21072.710.17210.67210.97511.374.811.671.71269.71269.612.371.112.669.61270.111.269.824.784.70.666.6median 12median 71.73.42.2hearing rangehide median Pink NoiseDell Precision 5690Apple MacBook Pro 16 2021 M1 Pro
Frekvensdiagram (kryssrutor kan markeras och avmarkeras för att jämföra enheter)
Dell Precision 5690 ljudanalys

(+) | högtalare kan spela relativt högt (86.1 dB)
Bas 100 - 315 Hz
(±) | reducerad bas - i genomsnitt 9.4% lägre än medianen
(±) | linjäriteten för basen är genomsnittlig (7.6% delta till föregående frekvens)
Mellan 400 - 2000 Hz
(+) | balanserad mellan - endast 4.7% från medianen
(+) | mids är linjära (4.8% delta till föregående frekvens)
Högsta 2 - 16 kHz
(+) | balanserade toppar - endast 3.4% från medianen
(±) | linjäriteten för toppar är genomsnittlig (7.3% delta till föregående frekvens)
Totalt 100 - 16 000 Hz
(+) | det totala ljudet är linjärt (11.1% skillnad mot median)
Jämfört med samma klass
» 9% av alla testade enheter i den här klassen var bättre, 3% liknande, 88% sämre
» Den bästa hade ett delta på 7%, genomsnittet var 18%, sämst var 35%
Jämfört med alla testade enheter
» 5% av alla testade enheter var bättre, 2% liknande, 93% sämre
» Den bästa hade ett delta på 4%, genomsnittet var 25%, sämst var 134%

Apple MacBook Pro 16 2021 M1 Pro ljudanalys

(+) | högtalare kan spela relativt högt (84.7 dB)
Bas 100 - 315 Hz
(+) | bra bas - bara 3.8% från medianen
(+) | basen är linjär (5.2% delta till föregående frekvens)
Mellan 400 - 2000 Hz
(+) | balanserad mellan - endast 1.3% från medianen
(+) | mids är linjära (2.1% delta till föregående frekvens)
Högsta 2 - 16 kHz
(+) | balanserade toppar - endast 1.9% från medianen
(+) | toppar är linjära (2.7% delta till föregående frekvens)
Totalt 100 - 16 000 Hz
(+) | det totala ljudet är linjärt (4.6% skillnad mot median)
Jämfört med samma klass
» 0% av alla testade enheter i den här klassen var bättre, 0% liknande, 100% sämre
» Den bästa hade ett delta på 5%, genomsnittet var 18%, sämst var 45%
Jämfört med alla testade enheter
» 0% av alla testade enheter var bättre, 0% liknande, 100% sämre
» Den bästa hade ett delta på 4%, genomsnittet var 25%, sämst var 134%

Energiförvaltning

Strömförbrukning

Tomgångskörning på skrivbordet kan kräva så lite som 8 W på den lägsta ljusstyrkan upp till 29 W på den högsta ljusstyrkan med en helt vit bakgrund. Detta intervall är bredare än på de flesta bärbara IPS-datorer på grund av hur OLED fungerar. Uppgifter som webbsurfning, ordbehandling eller kalkylblad kan tömma batteriet snabbare än vad man kan förvänta sig eftersom dessa fönster oftast är vita i färgen. Att sänka ljusstyrkan eller välja mörkare färger kan bidra till att förlänga batteritiden mer än på ett IPS-alternativ.

Strömförbrukningen vid högre belastningar som Witcher 3 skulle vara nästan densamma som den vi registrerade på den äldre Precision 5680. Detta bekräftar vår benchmarkdata ovan som också visar endast marginella prestandaskillnader i bästa fall mellan de två modellerna.

Konstigt nog skulle förbrukningen fluktuera vilt när man kör Prime95-stress även efter flera omprov. Prestandan verkar annars vara stabil.

Prime95 initieras efter 10 sekunder. Notera hur förbrukningen ökar till 179 W under bara några sekunder innan fluktuationerna börjar
Witcher 3 1080p Ultra strömförbrukning
Strömförbrukning
Av/Standbydarklight 0.02 / 0.25 Watt
Låg belastningdarkmidlight 7.9 / 12 / 28.6 Watt
Hög belastning midlight 98.8 / 174.8 Watt
 color bar
Förklaring: min: dark, med: mid, max: light        Metrahit Energy
Dell Precision 5690
Ultra 9 185H, NVIDIA RTX 5000 Ada Generation Laptop GPU, 2x Samsung PM9A1 1TB (RAID 0), OLED, 3840x2400, 16"
Dell Precision 5000 5680
i9-13900H, NVIDIA RTX 5000 Ada Generation Laptop GPU, 2x SK hynix PC801 HFS512GEJ9X101N RAID 0, OLED, 3840x2400, 16"
Lenovo ThinkPad P16 G2 21FA000FGE
i7-13700HX, NVIDIA RTX 2000 Ada Generation Laptop GPU, SK hynix PC801 HFS001TEJ9X162N, IPS LED, 2560x1600, 16"
Lenovo ThinkPad P1 G6-21FV000DGE
i9-13900H, NVIDIA RTX 2000 Ada Generation Laptop GPU, SK Hynix PC711 1TB HFS001TDE9X084N, IPS, 2560x1600, 16"
HP ZBook Fury 16 G10
i9-13950HX, NVIDIA RTX 5000 Ada Generation Laptop GPU, SK hynix PC801 HFS001TEJ9X101N, IPS, 3840x2400, 16"
MSI CreatorPro Z16P B12UKST
i7-12700H, RTX A3000 Laptop GPU, Samsung PM9A1 MZVL21T0HCLR, IPS, 2560x1600, 16"
Power Consumption
6%
-5%
10%
-39%
-9%
Idle Minimum *
7.9
8
-1%
9.3
-18%
8.3
-5%
15.3
-94%
10.8
-37%
Idle Average *
12
10.4
13%
14.1
-18%
14.5
-21%
18.2
-52%
16.3
-36%
Idle Maximum *
28.6
30.5
-7%
15.5
46%
15.3
47%
28
2%
16.9
41%
Load Average *
98.8
75.4
24%
133.6
-35%
91.8
7%
137.9
-40%
111.7
-13%
Witcher 3 ultra *
144.5
134
7%
144.9
-0%
104.7
28%
189.4
-31%
152.1
-5%
Load Maximum *
174.8
175
-0%
179.6
-3%
164.5
6%
202
-16%
177.4
-1%

* ... mindre är bättre

Power Consumption Witcher 3 / Stresstest

0102030405060708090100110120130140150160170Tooltip
Dell Precision 5690 Ultra 9 185H, NVIDIA RTX 5000 Ada Generation Laptop GPU; Witcher 3 ultra: Ø144.5 (137.5-156.5)
Dell Precision 5000 5680 i9-13900H, NVIDIA RTX 5000 Ada Generation Laptop GPU; Witcher 3 ultra: Ø134 (127-142.7)
Dell Precision 5690 Ultra 9 185H, NVIDIA RTX 5000 Ada Generation Laptop GPU; 1280x720 Prime95 28.10 and Furmark 1.25: Ø142.6 (96.2-177.2)
Dell Precision 5000 5680 i9-13900H, NVIDIA RTX 5000 Ada Generation Laptop GPU; 1280x720 Prime95 28.10 and Furmark 1.25: Ø148.4 (137-174.2)
Dell Precision 5690 Ultra 9 185H, NVIDIA RTX 5000 Ada Generation Laptop GPU; Idle 150cd/m2: Ø28.8 (24.8-47.6)
Dell Precision 5000 5680 i9-13900H, NVIDIA RTX 5000 Ada Generation Laptop GPU; Idle 150cd/m2: Ø8.53 (4.31-12.1)

Power Consumption external Monitor

0102030405060708090100110120130140150160170Tooltip
Dell Precision 5690 Ultra 9 185H, NVIDIA RTX 5000 Ada Generation Laptop GPU; Prime95 V2810 Stress (external Monitor): Ø125.7 (55-178.5)
Dell Precision 5000 5680 i9-13900H, NVIDIA RTX 5000 Ada Generation Laptop GPU; Prime95 V2810 Stress (external Monitor): Ø107.9 (99.2-177.8)
Dell Precision 5690 Ultra 9 185H, NVIDIA RTX 5000 Ada Generation Laptop GPU; Cinebench R15 Multi (external Monitor): Ø171.8 (169.9-173.3)
Dell Precision 5000 5680 i9-13900H, NVIDIA RTX 5000 Ada Generation Laptop GPU; Cinebench R15 Multi (external Monitor): Ø173.7 (172.6-174.1)
Dell Precision 5690 Ultra 9 185H, NVIDIA RTX 5000 Ada Generation Laptop GPU; 1280x720 FurMark 1.19 GPU Stress Test (external Monitor): Ø121.1 (104.2-140.1)
Dell Precision 5000 5680 i9-13900H, NVIDIA RTX 5000 Ada Generation Laptop GPU; 1280x720 FurMark 1.19 GPU Stress Test (external Monitor): Ø133 (123.5-152.9)
Dell Precision 5690 Ultra 9 185H, NVIDIA RTX 5000 Ada Generation Laptop GPU; 1920x1080 The Witcher 3 ultra (external Monitor): Ø140.9 (137.3-144.8)
Dell Precision 5000 5680 i9-13900H, NVIDIA RTX 5000 Ada Generation Laptop GPU; 1920x1080 The Witcher 3 ultra (external Monitor): Ø134.7 (129.4-145.7)
Dell Precision 5690 Ultra 9 185H, NVIDIA RTX 5000 Ada Generation Laptop GPU; Idle 1min (external Monitor): Ø19.2 (8.54-35.3)
Dell Precision 5000 5680 i9-13900H, NVIDIA RTX 5000 Ada Generation Laptop GPU; Idle 1min (external Monitor): Ø8.01 (4.2-15.5)

Batteritid

Drifttiderna är ungefär desamma som tidigare, om inte något kortare. Vårt WLAN-test skulle pågå i drygt 9 timmar medan Precision 5680 skulle pågå i närmare 10 timmar under liknande förhållanden.

Batteritid
WiFi Websurfing
9tim 9min
Dell Precision 5690
Ultra 9 185H, NVIDIA RTX 5000 Ada Generation Laptop GPU, 98 Wh
Dell Precision 5000 5680
i9-13900H, NVIDIA RTX 5000 Ada Generation Laptop GPU, 98 Wh
Lenovo ThinkPad P16 G2 21FA000FGE
i7-13700HX, NVIDIA RTX 2000 Ada Generation Laptop GPU, 94 Wh
Lenovo ThinkPad P1 G6-21FV000DGE
i9-13900H, NVIDIA RTX 2000 Ada Generation Laptop GPU, 90 Wh
HP ZBook Fury 16 G10
i9-13950HX, NVIDIA RTX 5000 Ada Generation Laptop GPU, 95 Wh
MSI CreatorPro Z16P B12UKST
i7-12700H, RTX A3000 Laptop GPU, 90 Wh
Batteridrifttid
8%
-6%
3%
-21%
-37%
WiFi v1.3
549
592
8%
515
-6%
567
3%
435
-21%
348
-37%
Reader / Idle
1072
Load
101
67
H.264
674

För

+ fortfarande en av de snabbaste 16-tums arbetsstationerna i förhållande till storlek och vikt
+ integrerad NPU för lokal AI-acceleration
+ tre års garanti som standard
+ respektabel batteritid
+ snabbare RAM-minne

Emot

- inga större prestandaförbättringar jämfört med Precision 5680
- lödd RAM; inga ECC RAM-alternativ
- överdrivet känslig klickplatta
- kan bli högljudd under belastning
- inga nya skärmalternativ

Verdict - Redo för AI-revolutionen

I recension: Dell Precision 5690

Precision 5680 kom ut med en elegant ny design som härrörde från XPS 16 komplett med vPro-processorer och avancerad Nvidia RTX Ada-grafik. Den skulle senare bli en av de snabbaste 16-tums arbetsstationerna som finns tillgängliga i förhållande till sin storlek och vikt. Problemet här är att Precision 5680 är knappt ett halvt år gammal och fortfarande ganska färsk. Den nyare Precision 5690 erbjuder samma chassi, GPU, skärm, strömförbrukningsnivåer, batteritid och processorprestanda som Precision 5680. Om du vill spara lite pengar kan förra årets Precision 5680 erbjuda i stort sett samma användarupplevelse och prestanda till ett lägre pris.

)(()()

Den viktigaste faktorn som skiljer 2024 Precision 5690 från 2023 Precision 5680 är den integrerade NPU:n på processorerna i Meteor Lake-H-serien. Den nyare Dell-modellen är därför "AI-klar" när Windows blir optimerat för lokala AI-uppgifter. Om du redan använder Co-Pilot eller förväntar dig att köra fler AI-förbättrade applikationer inom en snar framtid, till exempel, bör Precision 5690 ha en anmärkningsvärd fördel på grund av NPU-acceleration. Annars kommer de flesta "traditionella" uppgifter inte att köras märkbart snabbare på den senaste modellen.

Pris och tillgänglighet

Dell levererar nu Precision 5690 från $2290 för Core Ultra 5 135H CPU, endast integrerad grafik och 1200p IPS-skärm upp till långt över $5000 om den konfigureras med Core Ultra 9 185H, RTX 5000 Ada och 2400p OLED-pekskärm.

Dell Precision 5690 - 05/08/2024 v7 (old)
Allen Ngo

Design
86 / 98 → 88%
Tangentbord
89%
Mus
68%
Anslutningar
61 / 80 → 76%
Vikt
61 / 10-66 → 91%
Batteri
86 / 95 → 91%
Skärm
92%
Spelprestanda
99%
Programprestanda
97%
Workstation
99%
Temperatur
91 / 95 → 95%
Ljudnivå
81 / 90 → 90%
Audio
88%
Kamera
42 / 85 → 49%
Medel
81%
88%
Workstation - Vägt medel

Genomskinlighet

Valet av enheter som ska granskas görs av vår redaktion. Testprovet gavs till författaren som ett lån av tillverkaren eller återförsäljaren för denna recension. Långivaren hade inget inflytande på denna recension och inte heller fick tillverkaren en kopia av denna recension innan publiceringen. Det fanns ingen skyldighet att publicera denna recension. Vi accepterar aldrig ersättning eller betalning i utbyte mot våra recensioner. Som ett oberoende medieföretag är Notebookcheck inte föremål för auktoritet från tillverkare, återförsäljare eller förlag.

This is how Notebookcheck is testing

Every year, Notebookcheck independently reviews hundreds of laptops and smartphones using standardized procedures to ensure that all results are comparable. We have continuously developed our test methods for around 20 years and set industry standards in the process. In our test labs, high-quality measuring equipment is utilized by experienced technicians and editors. These tests involve a multi-stage validation process. Our complex rating system is based on hundreds of well-founded measurements and benchmarks, which maintains objectivity.

Price comparison

Please share our article, every link counts!
Mail Logo
> Bärbara datorer, laptops - tester och nyheter > Tester > Recension av Dell Precision 5690 arbetsstation: Redo för AI-revolutionen
Allen Ngo, 2024-05-10 (Update: 2024-05-10)