

Eurocom C315 Blitz recension av bärbar dator: Core i7-1360P är en blandad kompott

C315 Blitz är en tunn och lätt multimedia-laptop från Eurocom baserad på Clevo X170KM-chassidesignen. SKU:erna varierar mellan Core i5-1340P eller Core i7-1360P med antingen en 1080p eller 2160p (4K) skärm. Vår specifika granskningsenhet är en avancerad konfiguration med Core i7 och 4K-alternativ.
Alternativ till C315 Blitz inkluderar andra 15,6-tums bärbara multimedia- eller kontorsdatorer somAcer Aspire 5 A515 ellerAsus VivoBook S15.
Fler recensioner från Eurocom:
Potentiella konkurrenter i jämförelse
Gradering | Datum | Modell | Vikt | Höjd | Storlek | Upplösning | Pris |
|---|---|---|---|---|---|---|---|
| 83.4 % v7 (old) | 11/2023 | Eurocom C315 Blitz i7-1360P, Iris Xe G7 96EUs | 1.7 kg | 19.9 mm | 15.60" | 3840x2160 | |
| 84.3 % v7 (old) | 02/2022 | SCHENKER Work 15 Tiger Lake-H i7-11370H, Iris Xe G7 96EUs | 1.7 kg | 19.9 mm | 15.60" | 1920x1080 | |
| 86.6 % v7 (old) | 12/2023 | Lenovo ThinkPad L15 Gen 4 21H70021GE R7 PRO 7730U, Vega 8 | 1.9 kg | 19.93 mm | 15.60" | 1920x1080 | |
| 82 % v7 (old) | 09/2023 | Acer Aspire 5 A515-58GM-76S8 i7-1355U, GeForce RTX 2050 Mobile | 1.8 kg | 19.7 mm | 15.60" | 1920x1080 | |
| 83.2 % v7 (old) | 02/2023 | Asus VivoBook S15 M3502RA-L1029W R7 6800H, Radeon 680M | 1.9 kg | 18.8 mm | 15.60" | 1920x1080 | |
| 79.8 % v7 (old) | 08/2022 | Samsung Galaxy Book2 15 i7-1260P, A350M | 1.6 kg | 15 mm | 15.60" | 1920x1080 |
Fall
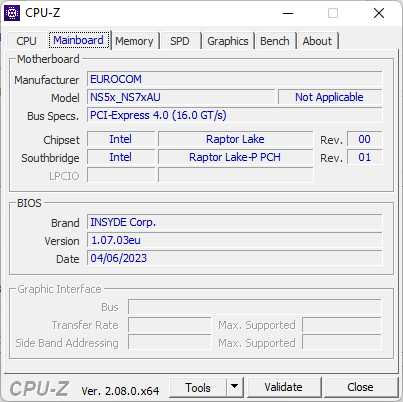
Chassit är identiskt med förra årets Schenker Work 15 eftersom båda är baserade på samma X170KM-chassi. Notera att endast en av de två USB-C-portarna har stöd för Thunderbolt, USB-C-laddning och DisplayPort-out.
SD-kortläsare
| SD Card Reader | |
| average JPG Copy Test (av. of 3 runs) | |
| SCHENKER Work 15 Tiger Lake-H (Angelbird AV Pro V60) | |
| Eurocom C315 Blitz (Angelbird AV Pro V60) | |
| Lenovo ThinkPad L15 Gen 4 21H70021GE | |
| Samsung Galaxy Book2 15 (Angelbird AV Pro V60) | |
| maximum AS SSD Seq Read Test (1GB) | |
| Lenovo ThinkPad L15 Gen 4 21H70021GE | |
| Eurocom C315 Blitz (Angelbird AV Pro V60) | |
| SCHENKER Work 15 Tiger Lake-H (Angelbird AV Pro V60) | |
| Samsung Galaxy Book2 15 (Angelbird AV Pro V60) | |
Kommunikation
| Networking | |
| iperf3 transmit AX12 | |
| SCHENKER Work 15 Tiger Lake-H | |
| iperf3 receive AX12 | |
| SCHENKER Work 15 Tiger Lake-H | |
| iperf3 transmit AXE11000 | |
| Samsung Galaxy Book2 15 | |
| Lenovo ThinkPad L15 Gen 4 21H70021GE | |
| Eurocom C315 Blitz | |
| Acer Aspire 5 A515-58GM-76S8 | |
| Asus VivoBook S15 M3502RA-L1029W | |
| iperf3 receive AXE11000 | |
| Lenovo ThinkPad L15 Gen 4 21H70021GE | |
| Samsung Galaxy Book2 15 | |
| Eurocom C315 Blitz | |
| Acer Aspire 5 A515-58GM-76S8 | |
| Asus VivoBook S15 M3502RA-L1029W | |
| iperf3 transmit AXE11000 6GHz | |
| Acer Aspire 5 A515-58GM-76S8 | |
| Lenovo ThinkPad L15 Gen 4 21H70021GE | |
| Eurocom C315 Blitz | |
| iperf3 receive AXE11000 6GHz | |
| Lenovo ThinkPad L15 Gen 4 21H70021GE | |
| Acer Aspire 5 A515-58GM-76S8 | |
| Eurocom C315 Blitz | |
Webbkamera
Eurocom marknadsför en 2 MP webbkamera, men Windows kameraapp låter dig bara välja upp till 1 MP eller 720p30 inspelning som max.


Underhåll

Garanti
Den begränsade standardgarantin på ett år gäller vid köp i USA. Eurocom erbjuder valfria förlängningsplaner på upp till tre år.
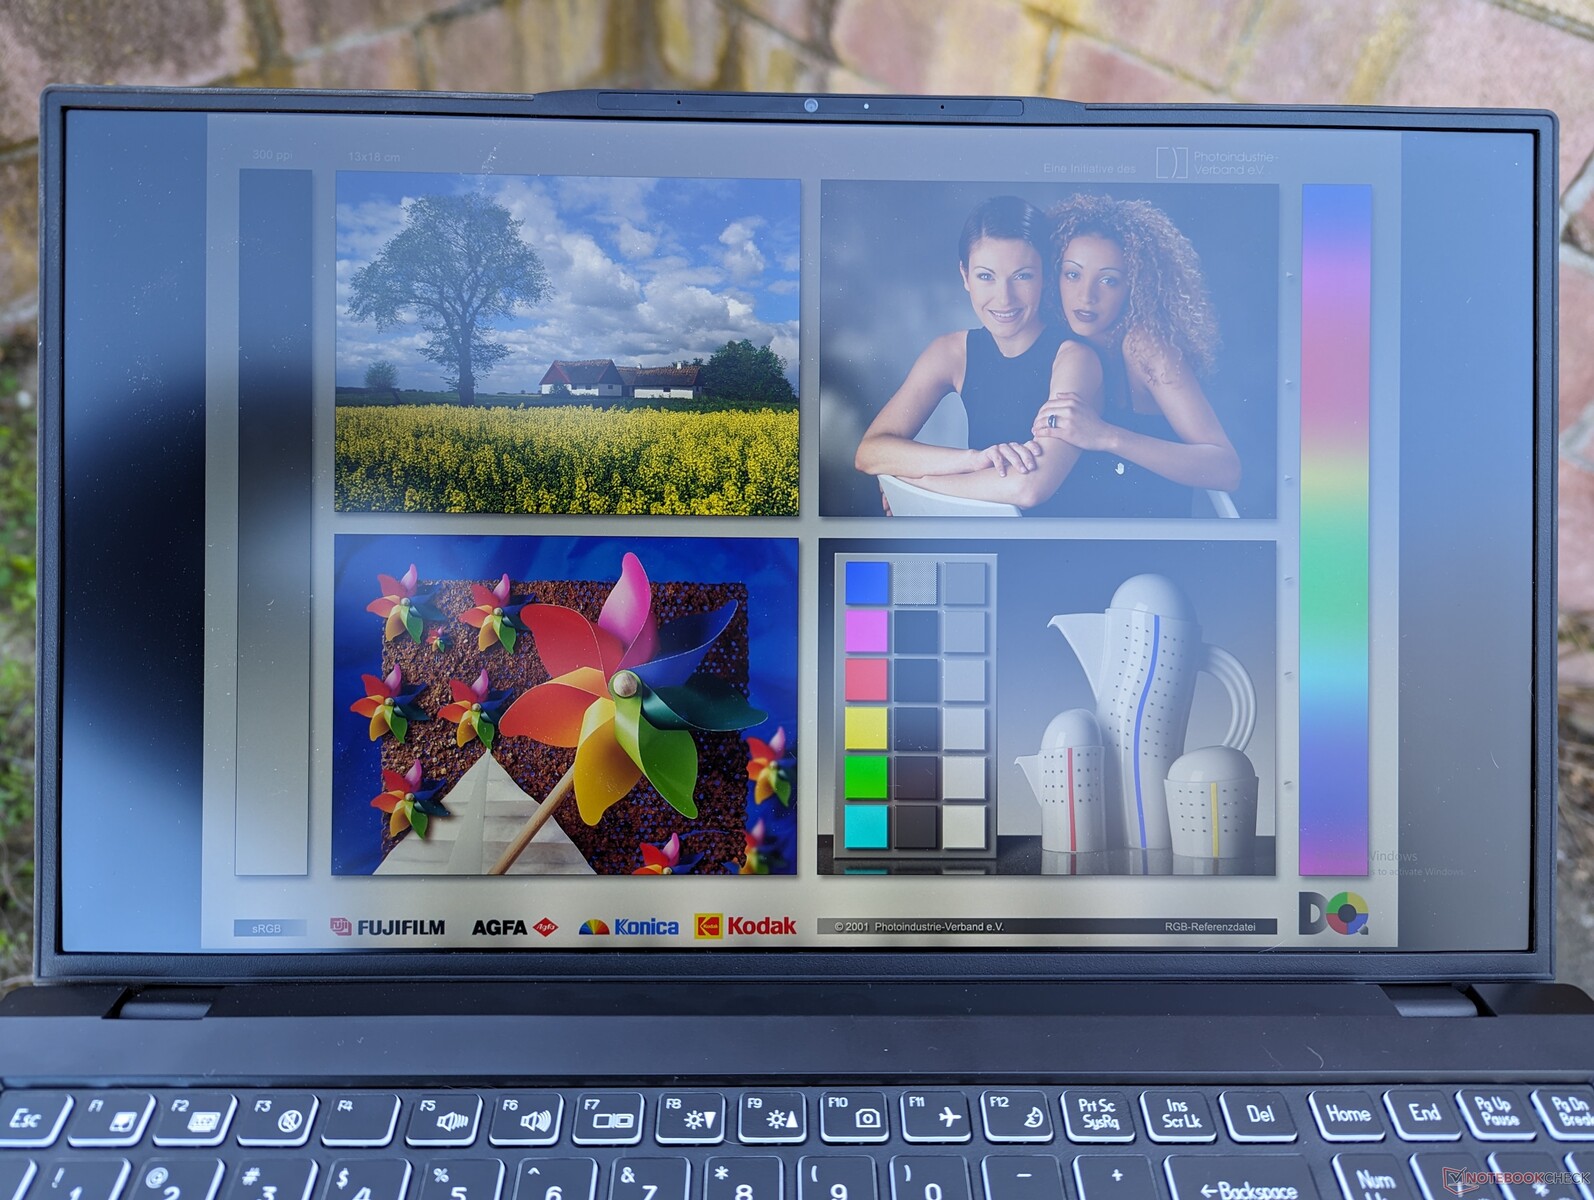
Display
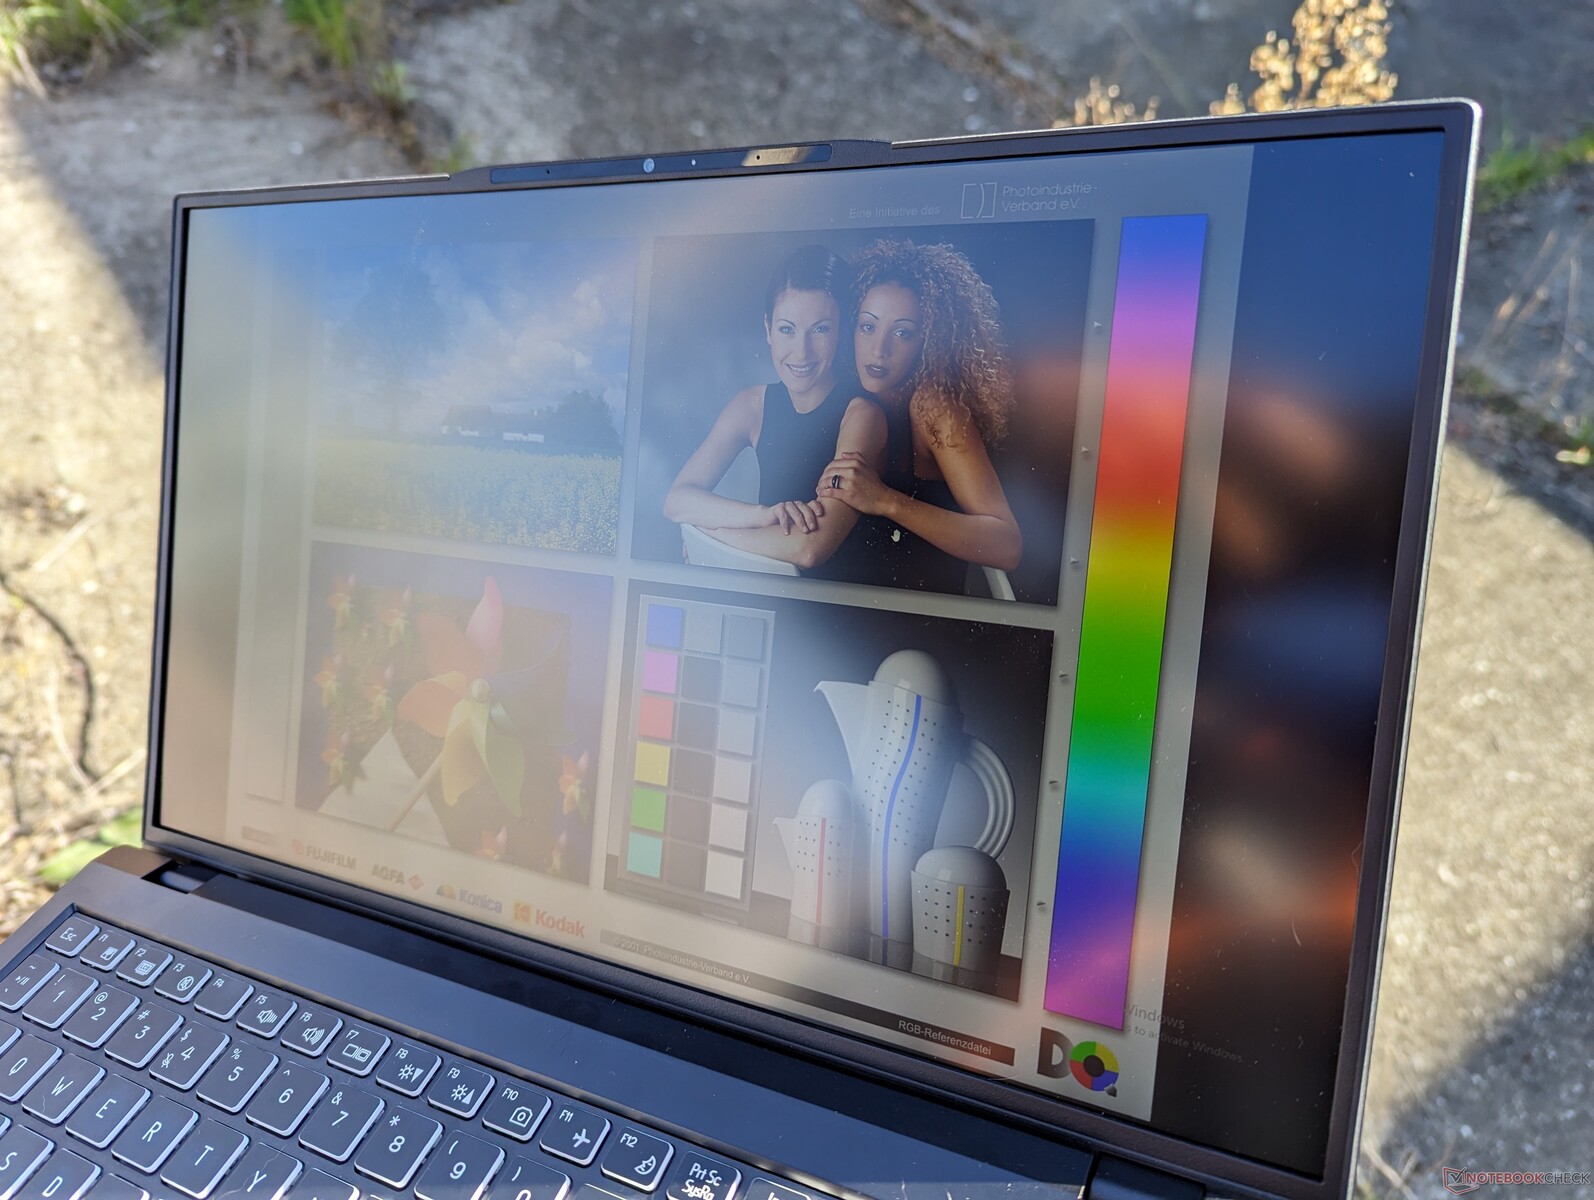
Vår Eurocom-konfiguration har en 4K-panel med högre upplösning än 1080p-panelen på vår Schenker. Svarstiderna för svartvitt har dock inte förbättrats och därför är spökbilder fortfarande märkbara. Tyvärr erbjuder C315 Blitz inga alternativ med HDR, fullständig DCI-P3, AdobeRGB-täckning eller paneler med högre uppdateringsfrekvens.
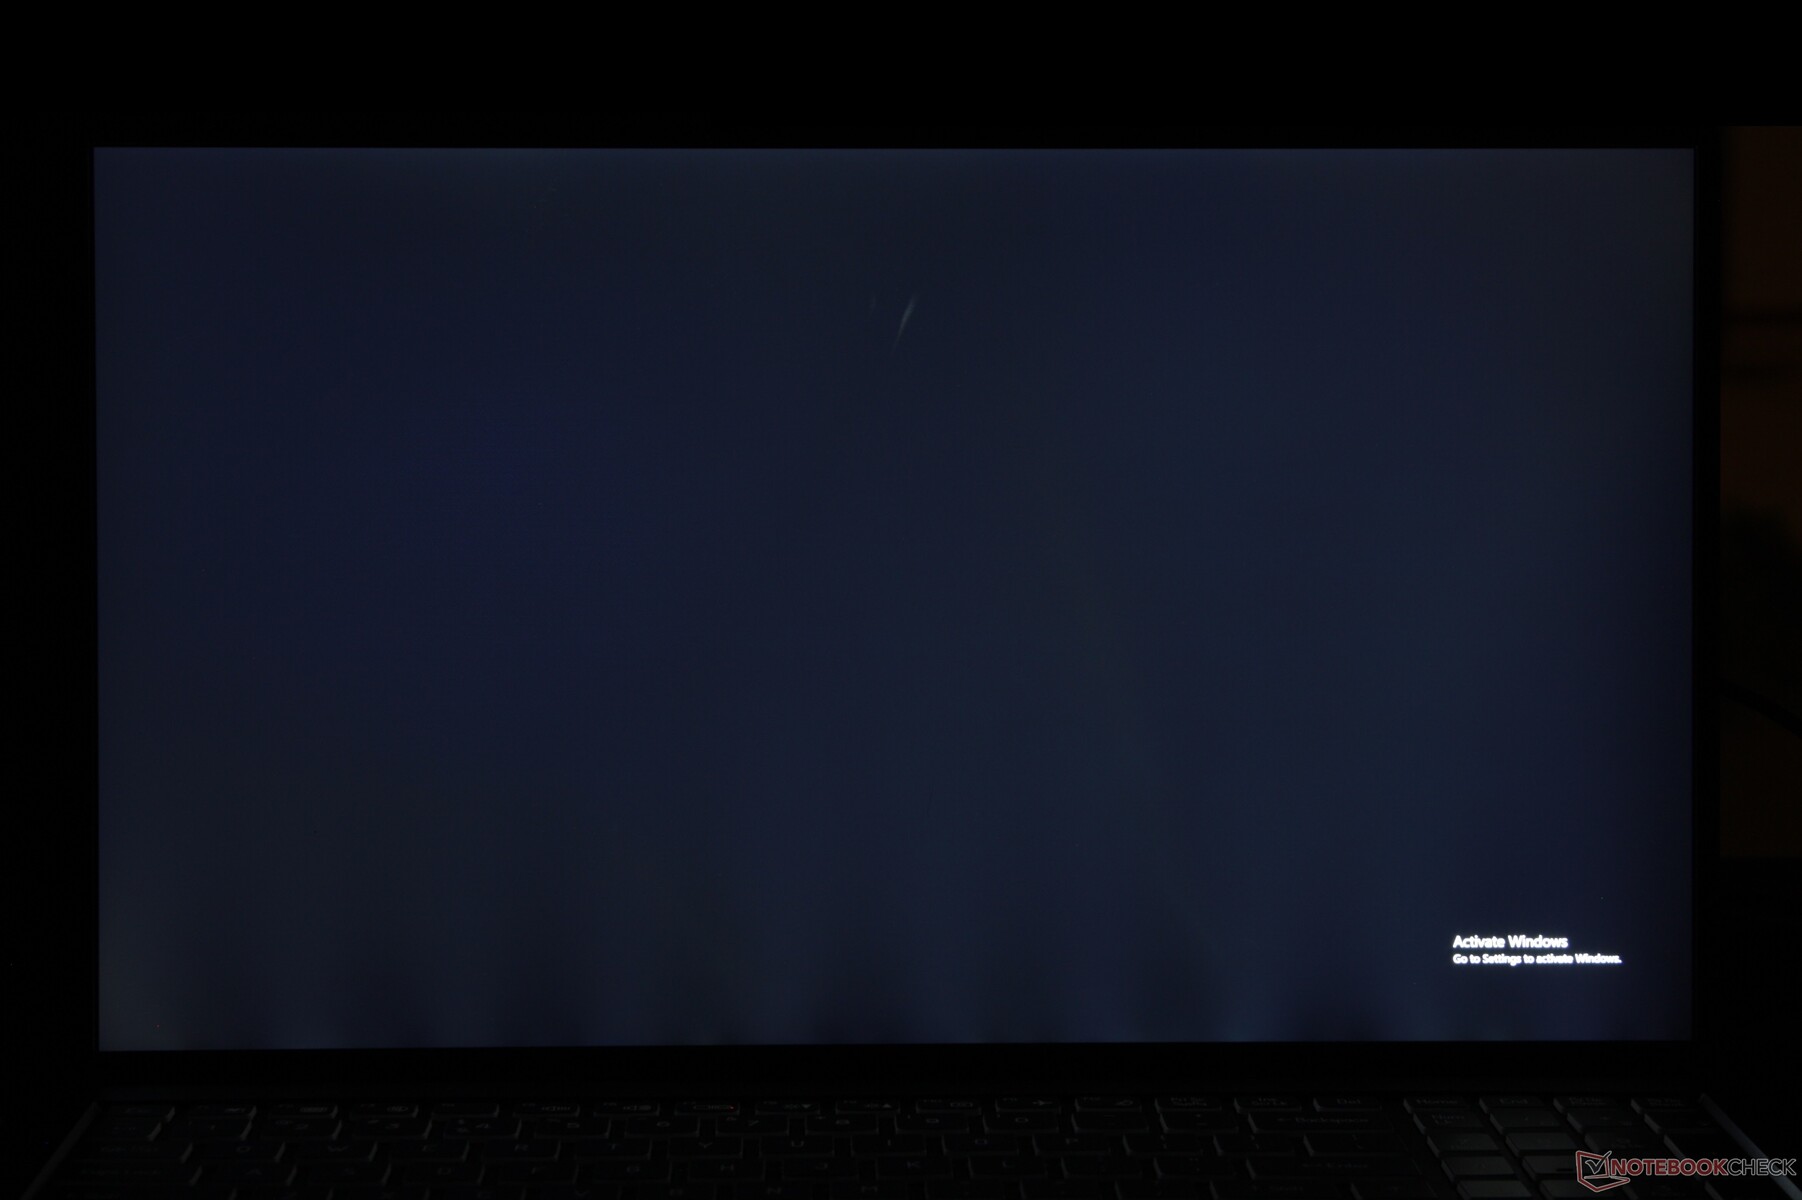
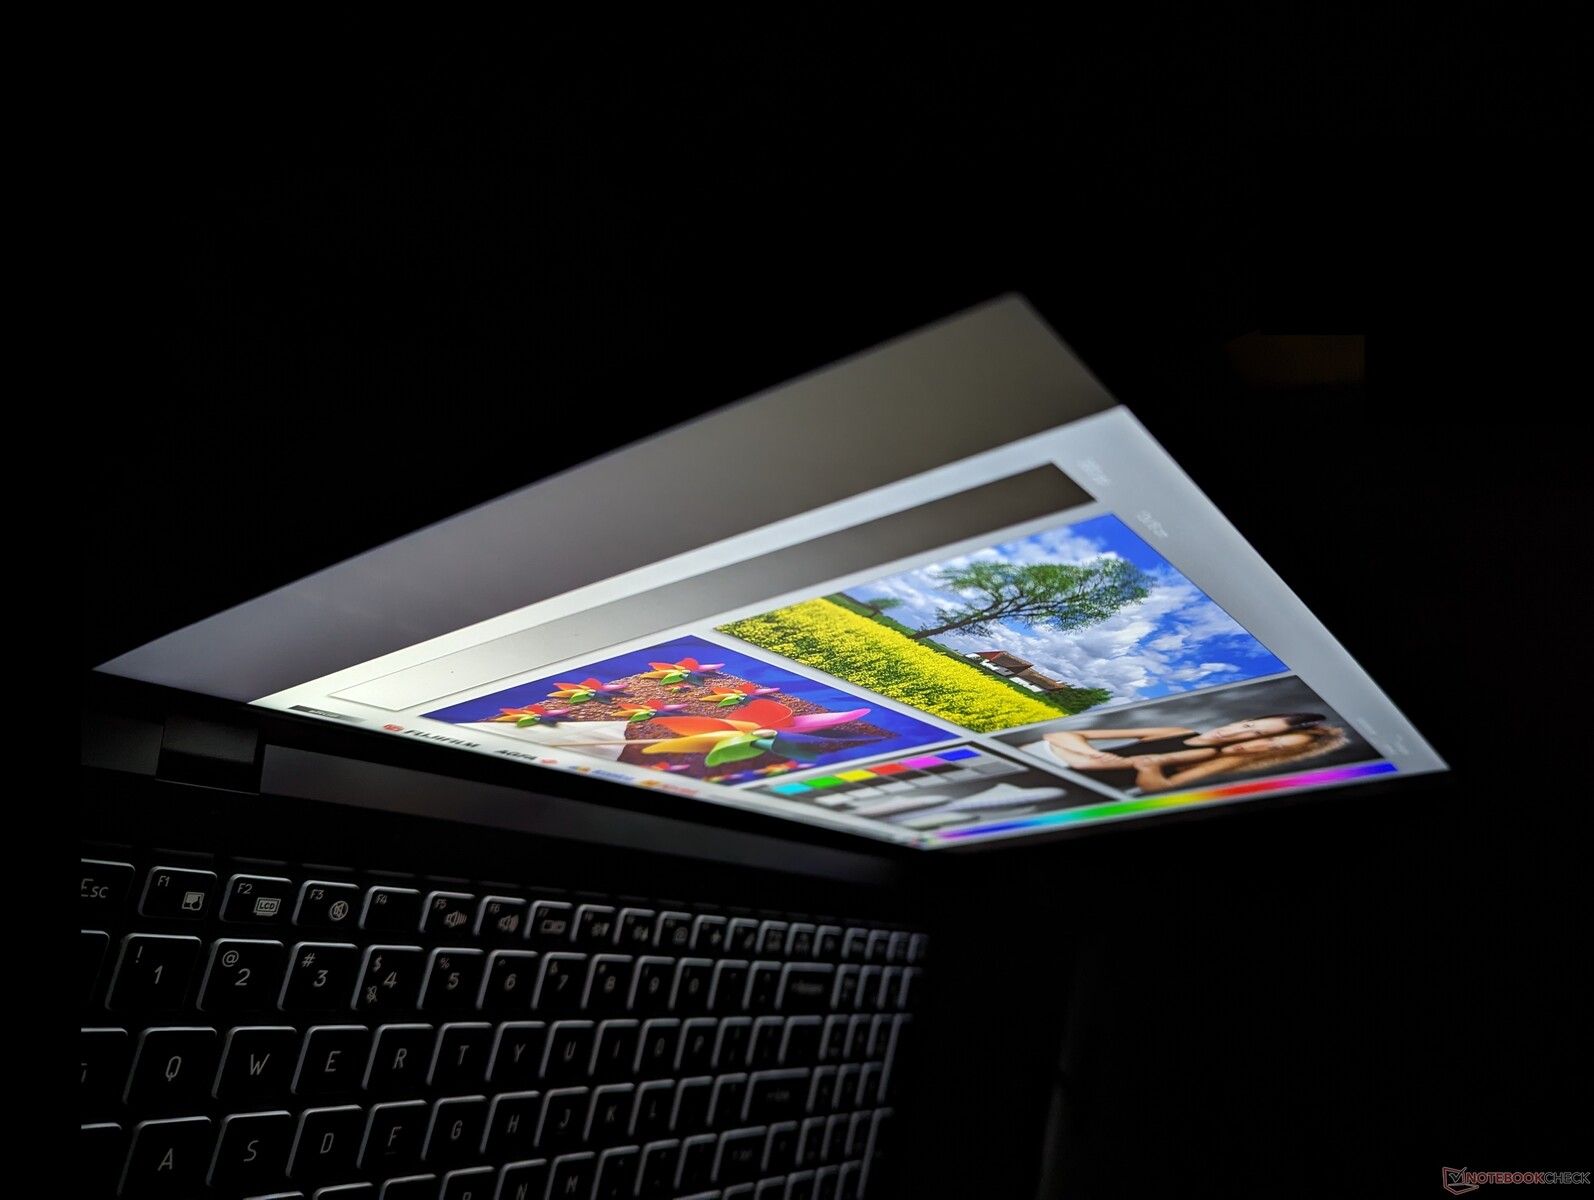
Skärmen på vår specifika granskningsenhet lider av extrem blödning i bakgrundsbelysningen längs den nedre kanten, vilket framgår av bilderna nedan. Vi rekommenderar att du dubbelkollar dina inköp för att se till att det inte finns några problem med skärmen.
| |||||||||||||||||||||||||
Distribution av ljusstyrkan: 85 %
Mitt på batteriet: 262.5 cd/m²
Kontrast: 1050:1 (Svärta: 0.25 cd/m²)
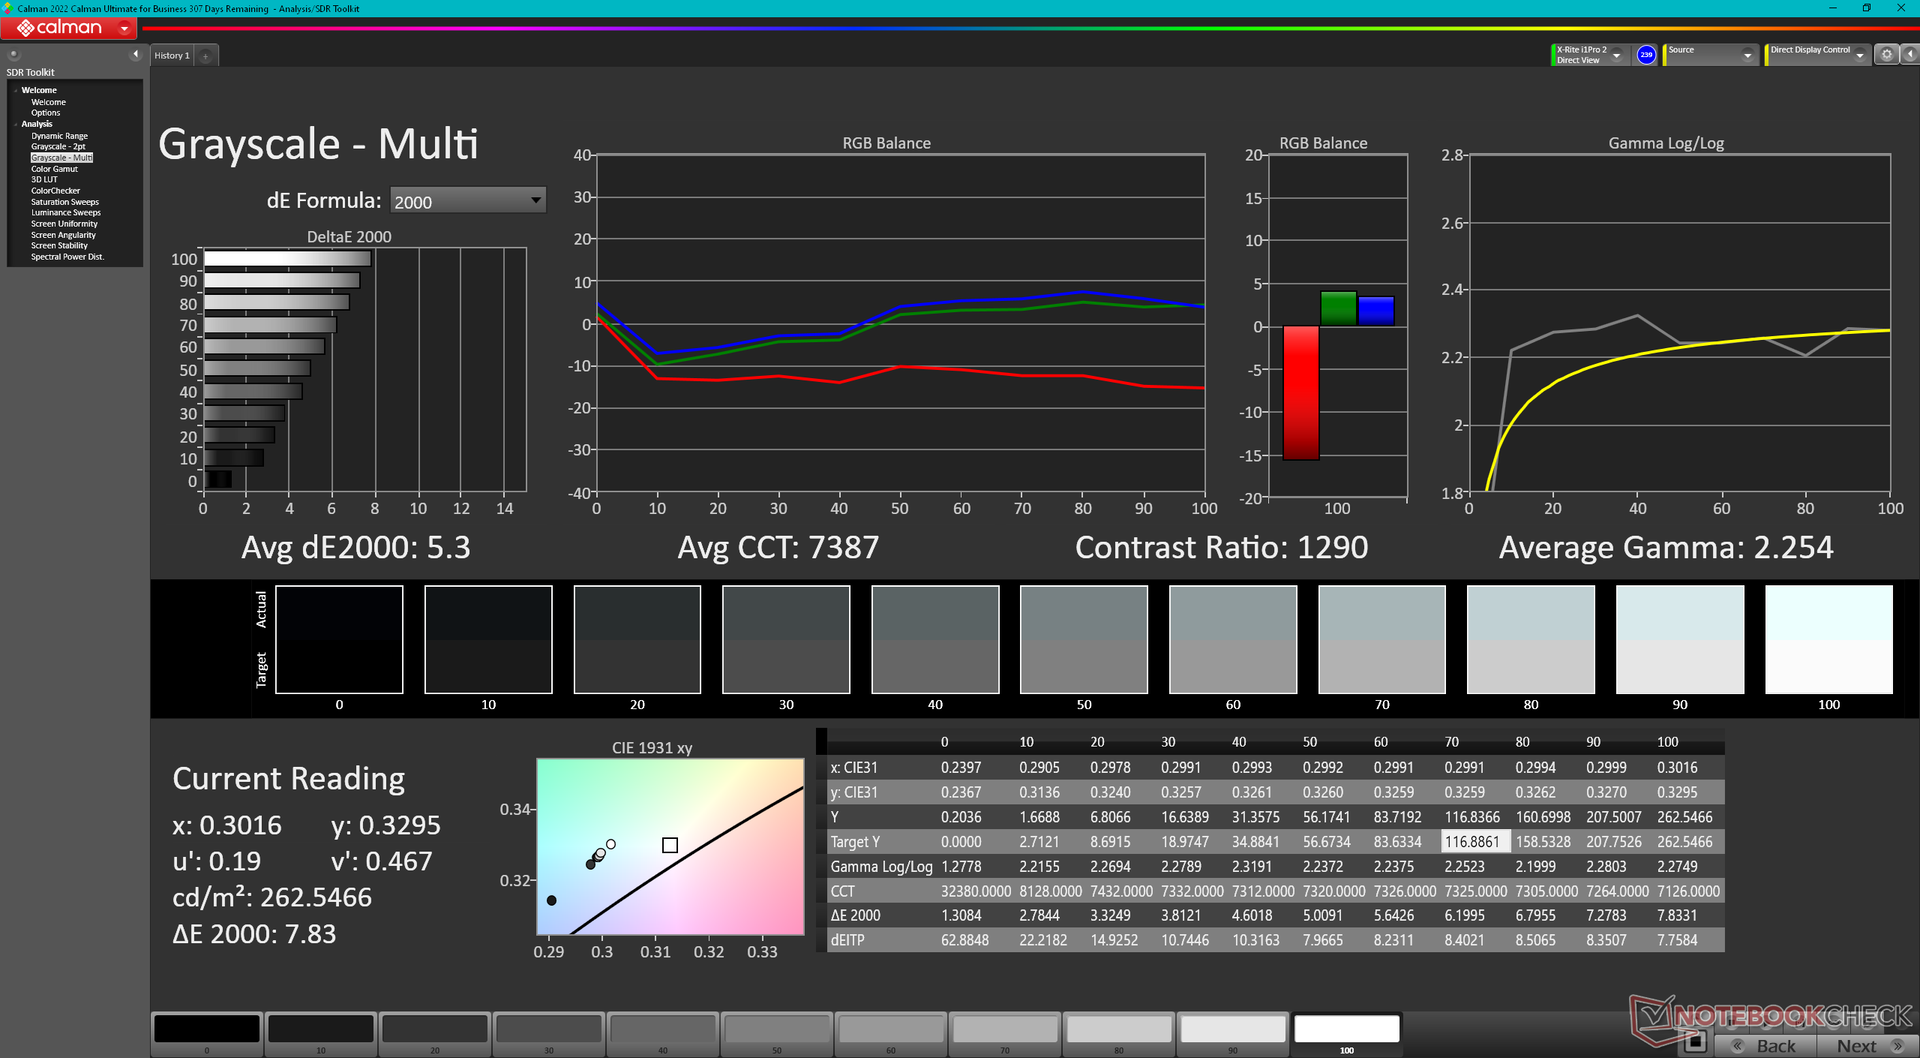
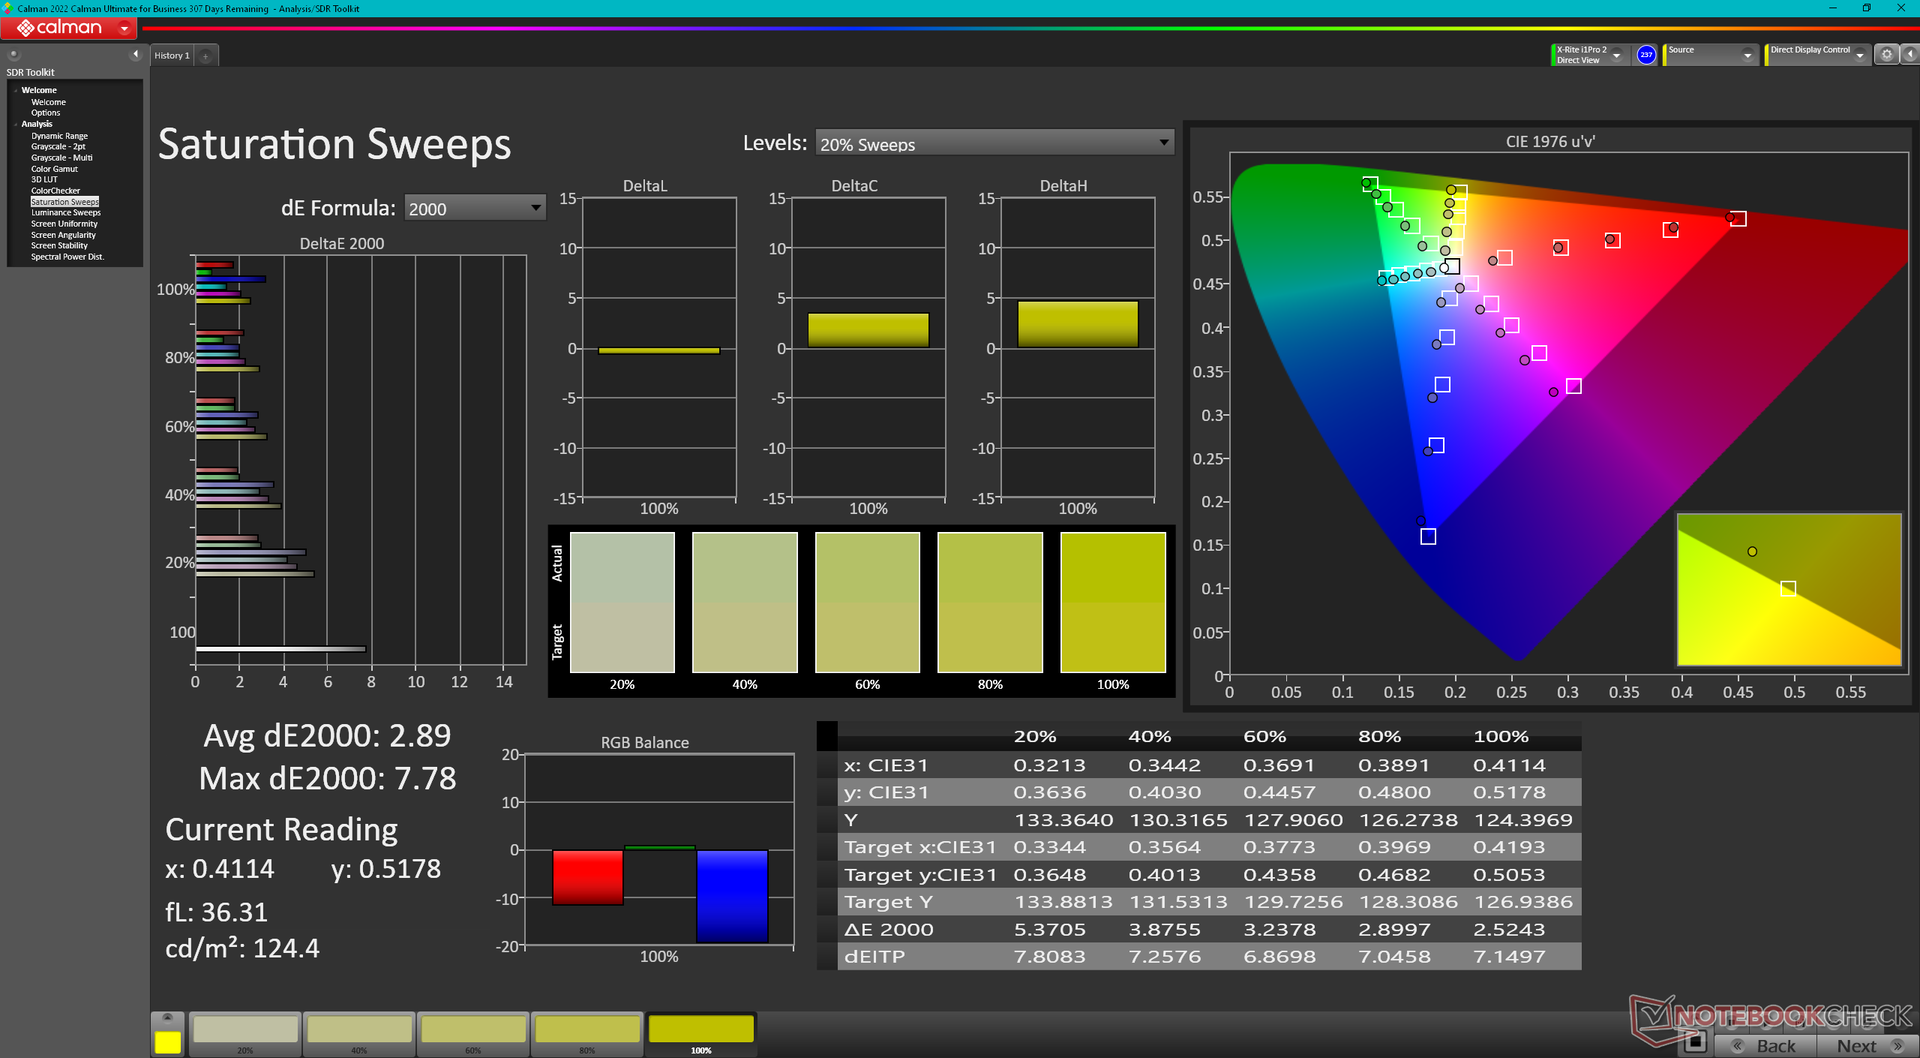
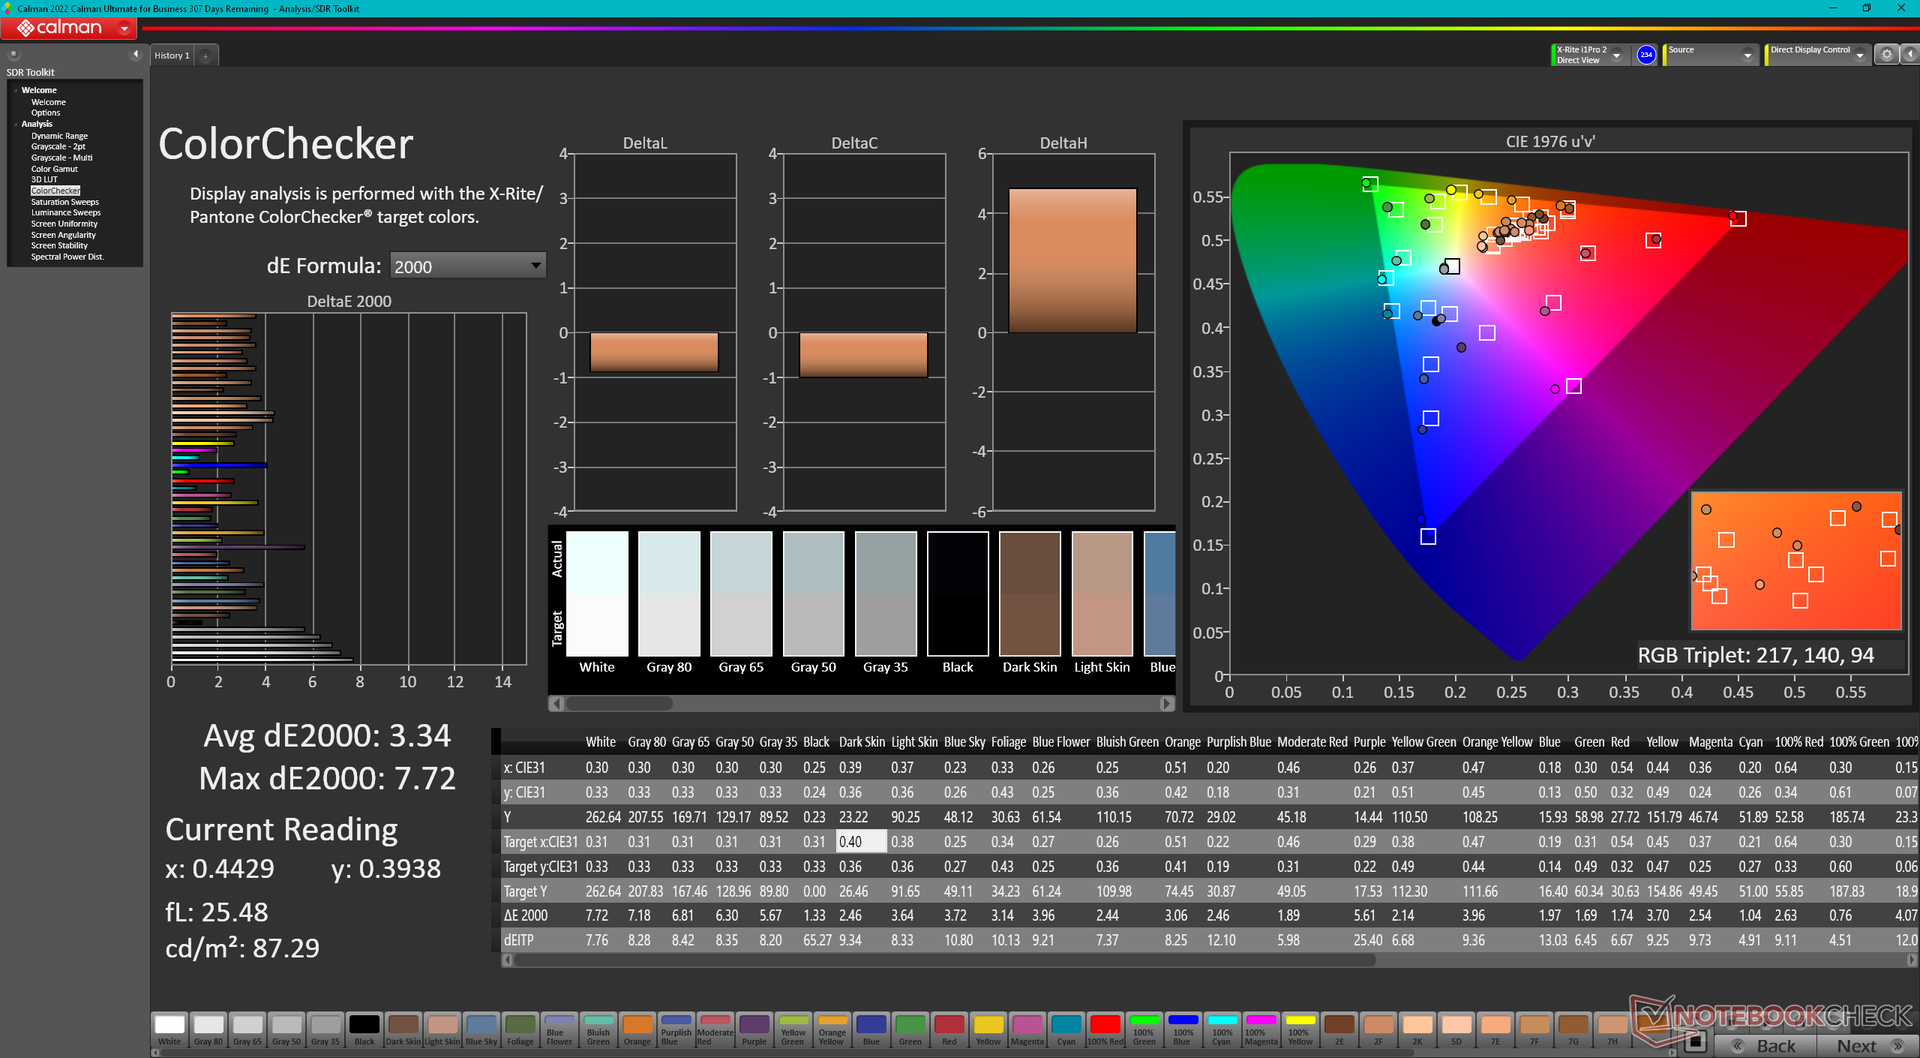
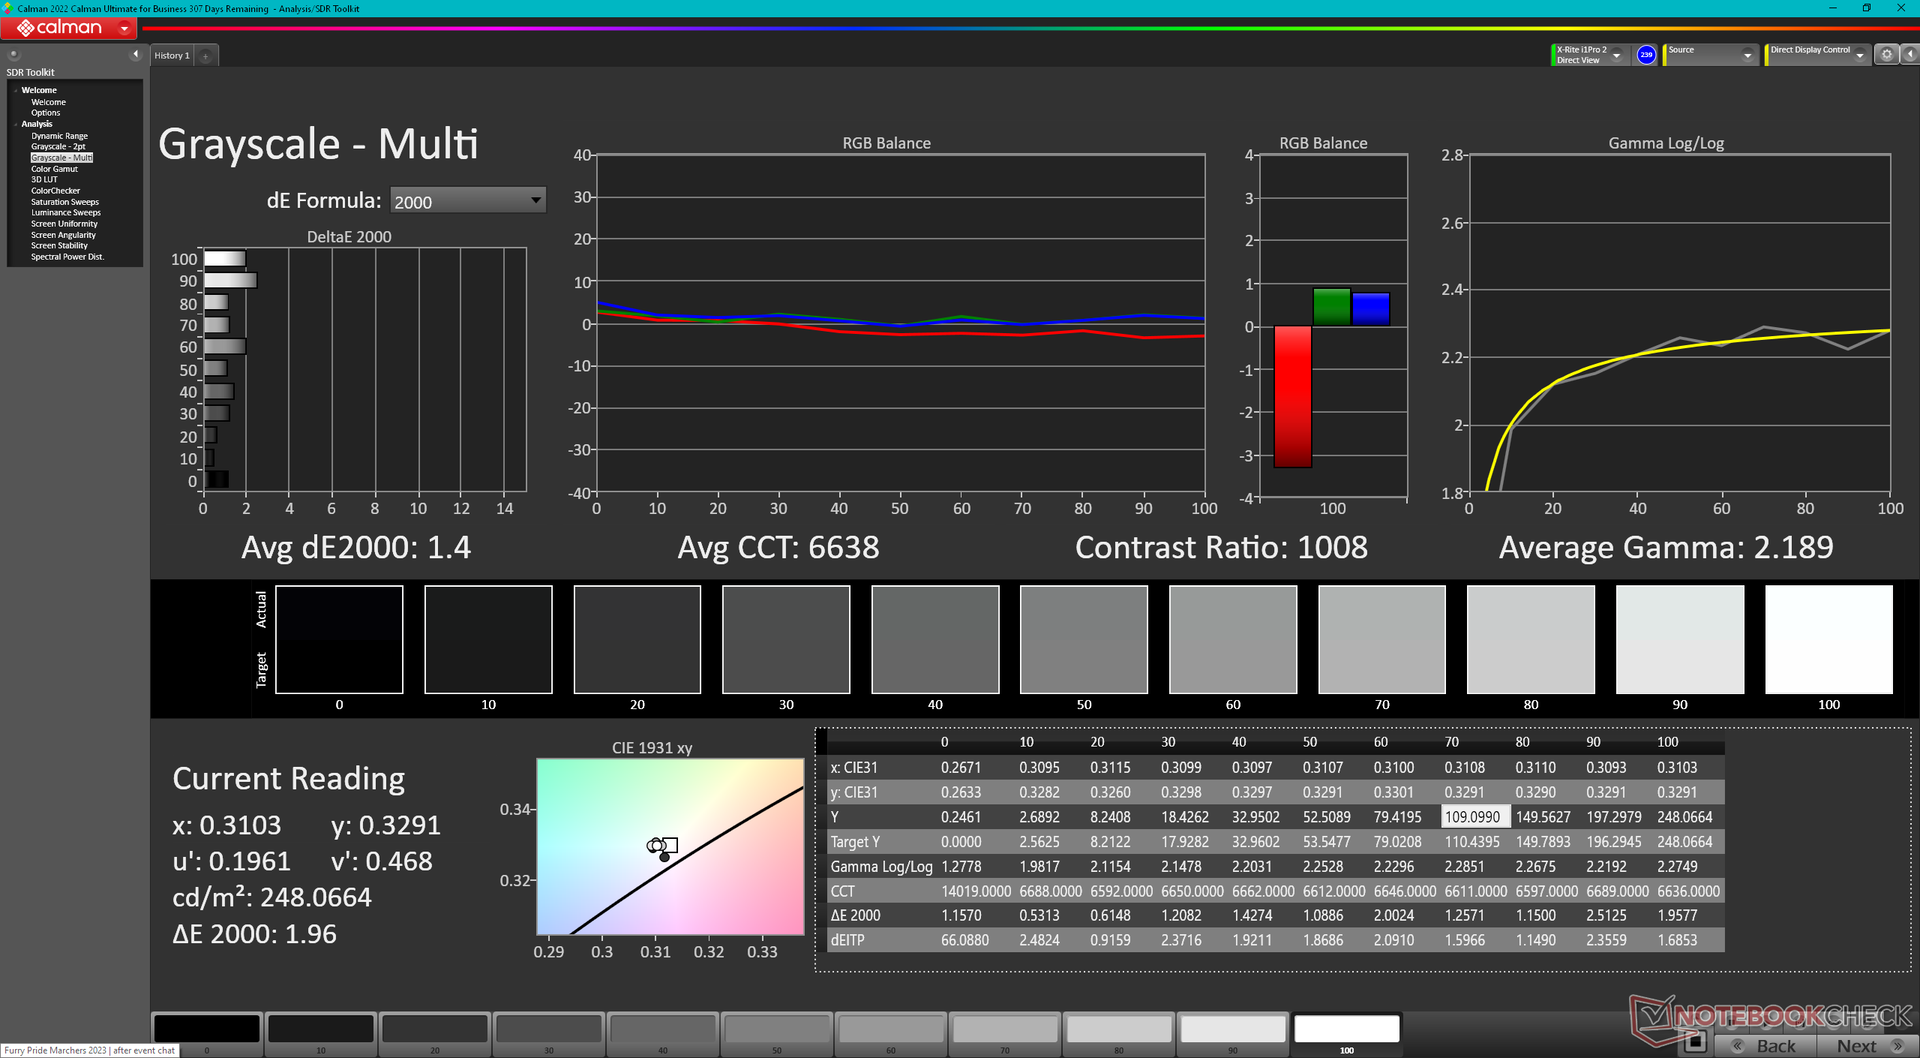
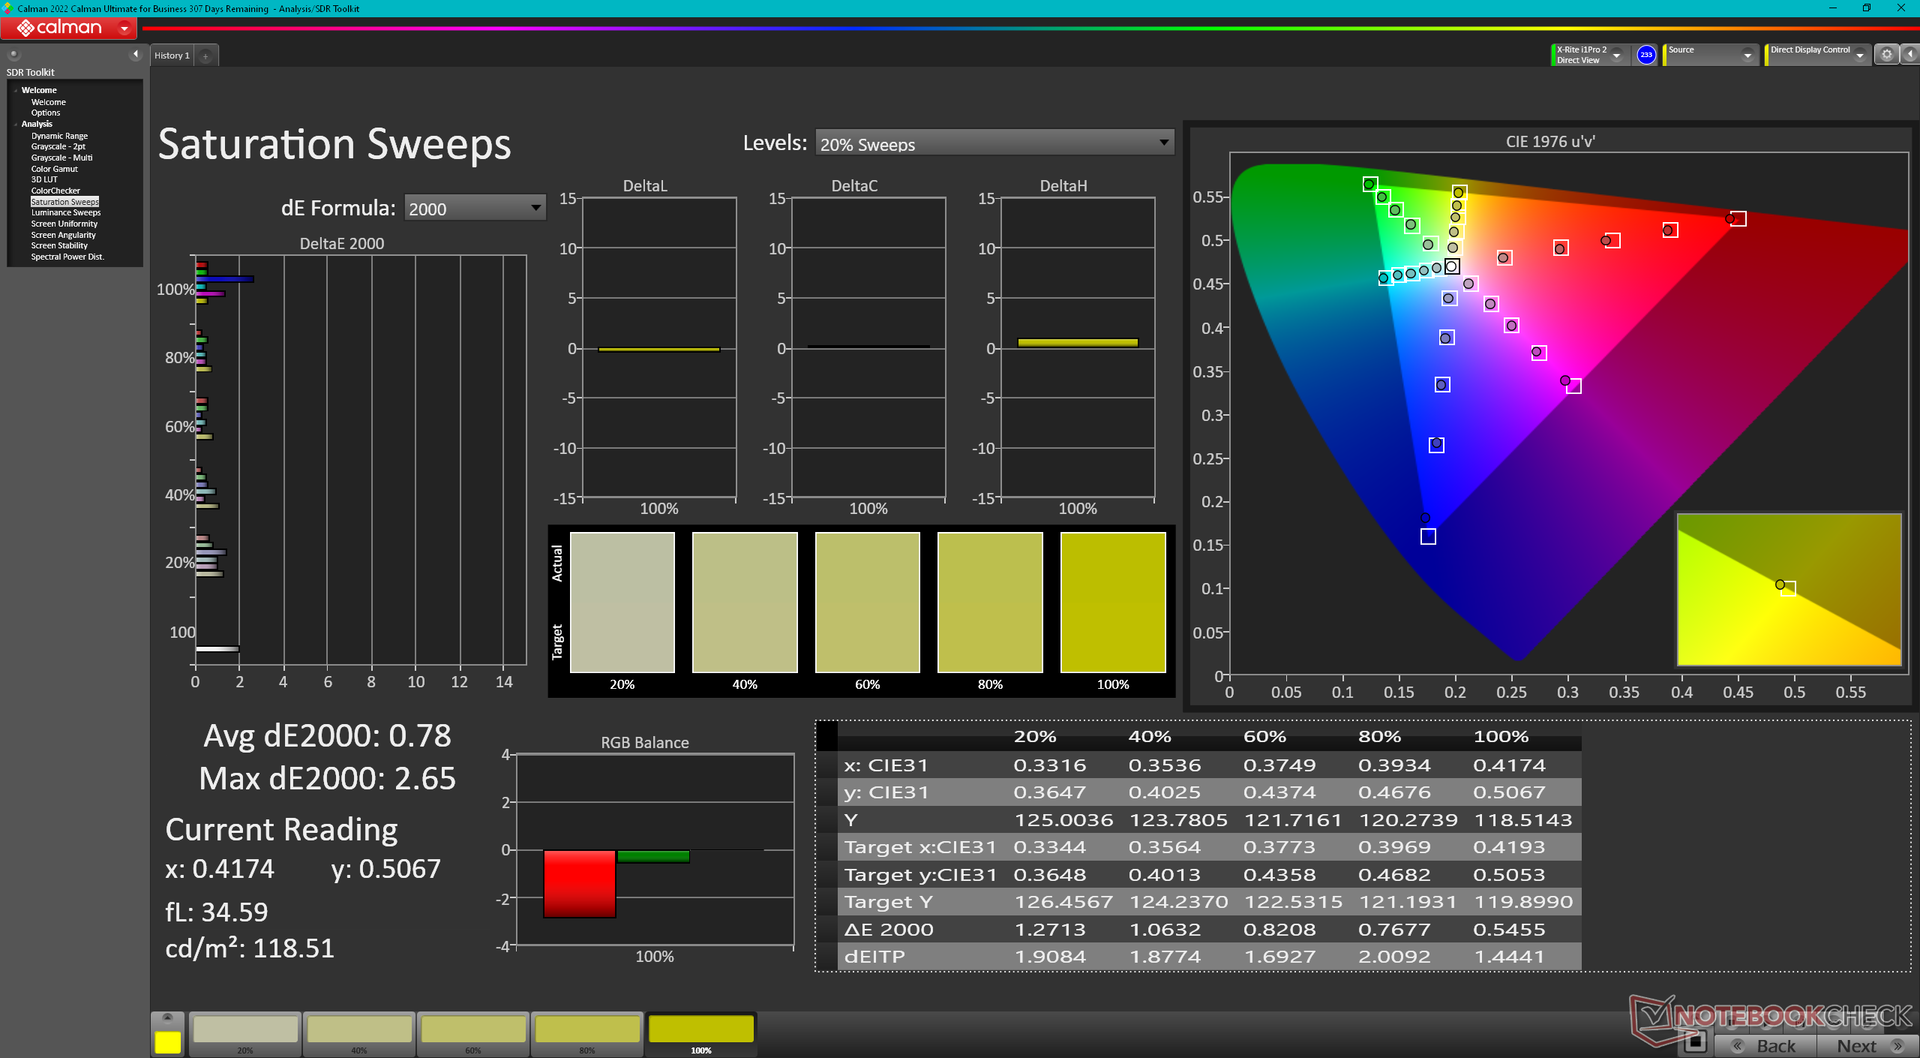
ΔE Color 3.34 | 0.5-29.43 Ø4.87, calibrated: 0.91
ΔE Greyscale 5.3 | 0.5-98 Ø5.1
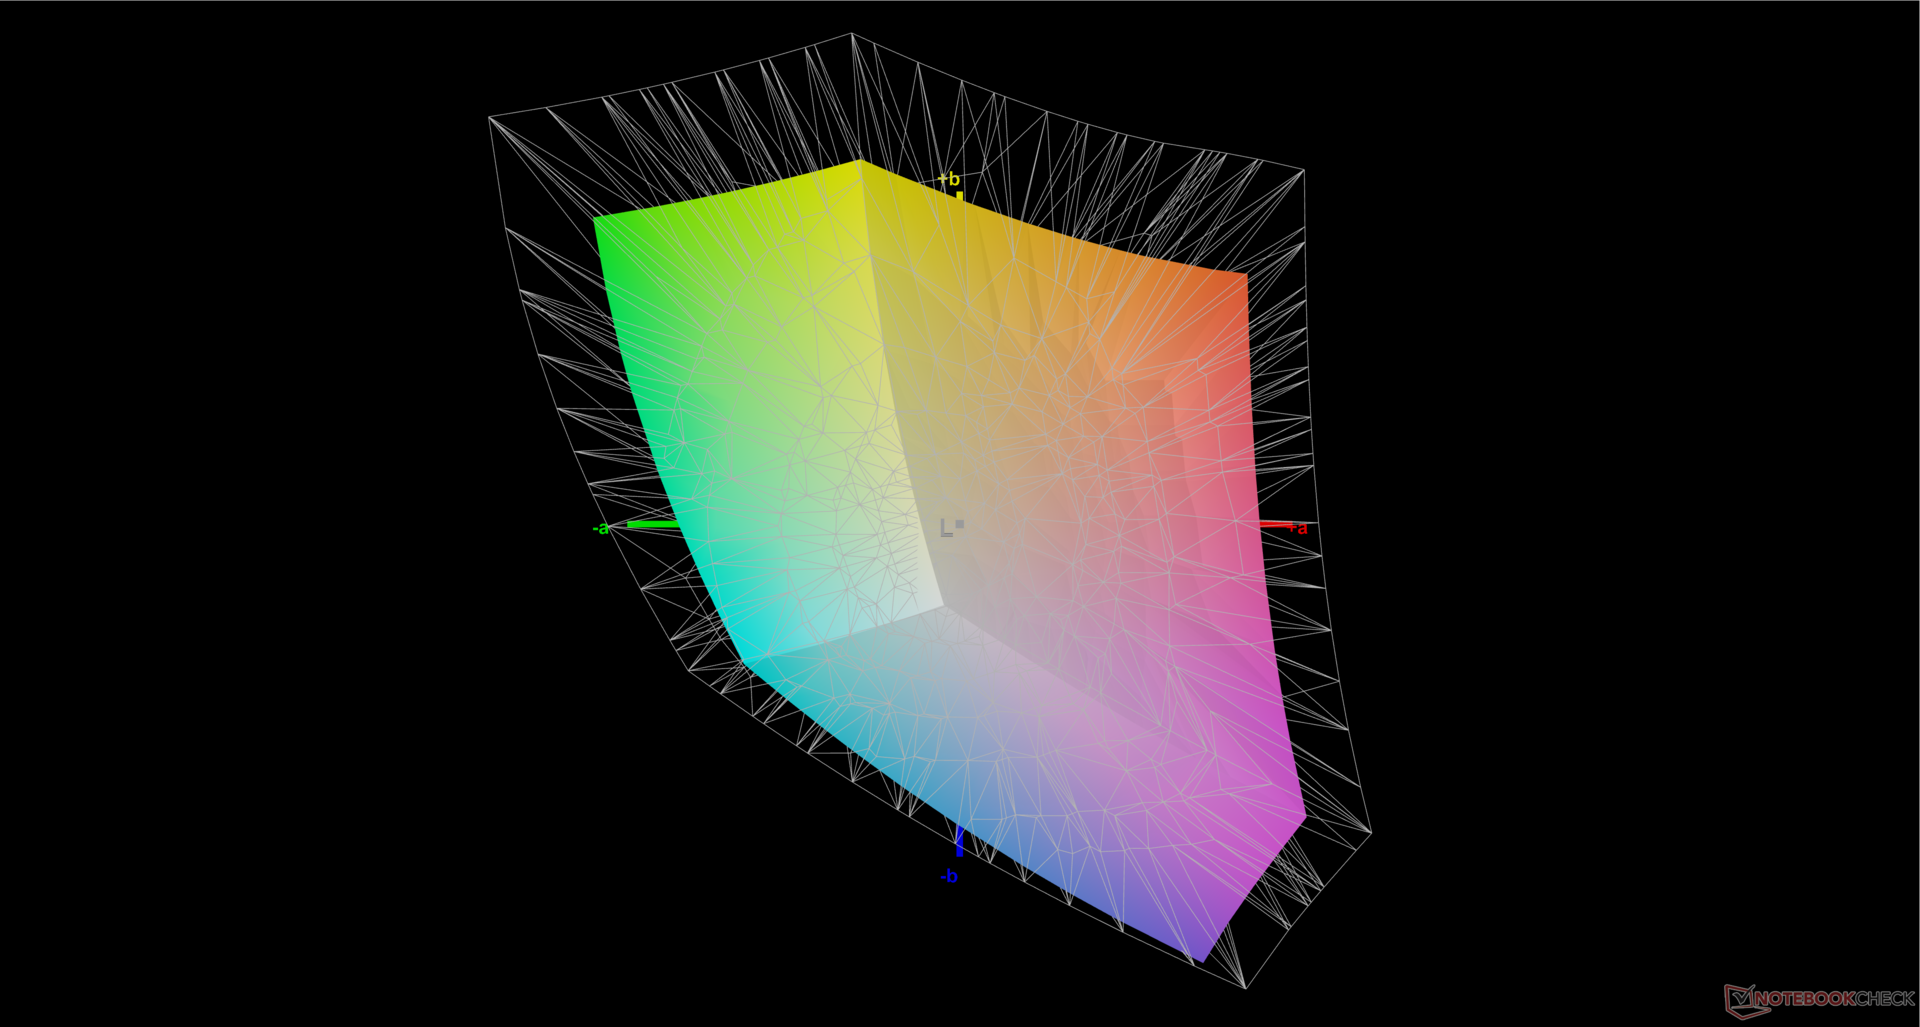
69.8% AdobeRGB 1998 (Argyll 2.2.0 3D)
96.5% sRGB (Argyll 2.2.0 3D)
67.7% Display P3 (Argyll 2.2.0 3D)
Gamma: 2.25
| Eurocom C315 Blitz BOE HF NE156QUM-N64, IPS, 3840x2160, 15.6" | SCHENKER Work 15 Tiger Lake-H BOE07D8, IPS, 1920x1080, 15.6" | Lenovo ThinkPad L15 Gen 4 21H70021GE N156HCA-E5B, IPS, 1920x1080, 15.6" | Acer Aspire 5 A515-58GM-76S8 LP156WFH-SPD5, IPS, 1920x1080, 15.6" | Asus VivoBook S15 M3502RA-L1029W Samsung SDC4161, OLED, 1920x1080, 15.6" | Samsung Galaxy Book2 15 NE156FHM-NS0, IPS, 1920x1080, 15.6" | |
|---|---|---|---|---|---|---|
| Display | -9% | -37% | -43% | 31% | -25% | |
| Display P3 Coverage | 67.7 | 64.5 -5% | 41.8 -38% | 38.11 -44% | 99.9 48% | 49.6 -27% |
| sRGB Coverage | 96.5 | 86.2 -11% | 62.5 -35% | 57.7 -40% | 100 4% | 74.8 -22% |
| AdobeRGB 1998 Coverage | 69.8 | 62.9 -10% | 43.2 -38% | 39.41 -44% | 98.6 41% | 51.3 -27% |
| Response Times | -4% | 49% | 34% | 97% | 35% | |
| Response Time Grey 50% / Grey 80% * | 54.4 ? | 58.4 ? -7% | 24.4 ? 55% | 33.6 ? 38% | 0.74 99% | 32.3 ? 41% |
| Response Time Black / White * | 34.8 ? | 35.2 ? -1% | 19.7 ? 43% | 24.8 ? 29% | 2 ? 94% | 25 ? 28% |
| PWM Frequency | 59 ? | |||||
| Screen | -25% | -53% | -77% | 8% | -42% | |
| Brightness middle | 262.5 | 329 25% | 275 5% | 257.4 -2% | 378 44% | 337 28% |
| Brightness | 260 | 316 22% | 252 -3% | 248 -5% | 378 45% | 325 25% |
| Brightness Distribution | 85 | 92 8% | 84 -1% | 88 4% | 98 15% | 89 5% |
| Black Level * | 0.25 | 0.3 -20% | 0.16 36% | 0.3209 -28% | 0.4 -60% | |
| Contrast | 1050 | 1097 4% | 1719 64% | 802 -24% | 843 -20% | |
| Colorchecker dE 2000 * | 3.34 | 5.4 -62% | 6.2 -86% | 6.26 -87% | 2.2 34% | 4.7 -41% |
| Colorchecker dE 2000 max. * | 7.72 | 10.1 -31% | 19.2 -149% | 18.28 -137% | 4.87 37% | 15.7 -103% |
| Colorchecker dE 2000 calibrated * | 0.91 | 2.5 -175% | 4.2 -362% | 4.99 -448% | 2.68 -195% | 2.8 -208% |
| Greyscale dE 2000 * | 5.3 | 5.1 4% | 4.1 23% | 3.7 30% | 1.43 73% | 5.4 -2% |
| Gamma | 2.25 98% | 2.1 105% | 1.91 115% | 2.186 101% | 2.47 89% | 2.07 106% |
| CCT | 7387 88% | 7609 85% | 6352 102% | 6606 98% | 6464 101% | 7727 84% |
| Totalt genomsnitt (program/inställningar) | -13% /
-19% | -14% /
-35% | -29% /
-54% | 45% /
28% | -11% /
-27% |
* ... mindre är bättre

Skärmen levereras inte förkalibrerad. Eurocom erbjuder dock kalibreringstjänster som tillval för användare som inte har tillgång till färgmätare. Vi kan få genomsnittliga deltaE-värden ner till <2 med vår egen X-Rite-kolorimeter.

Visa svarstider
| ↔ Svarstid svart till vitt | ||
|---|---|---|
| 34.8 ms ... stiga ↗ och falla ↘ kombinerat | ↗ 16.8 ms stiga | 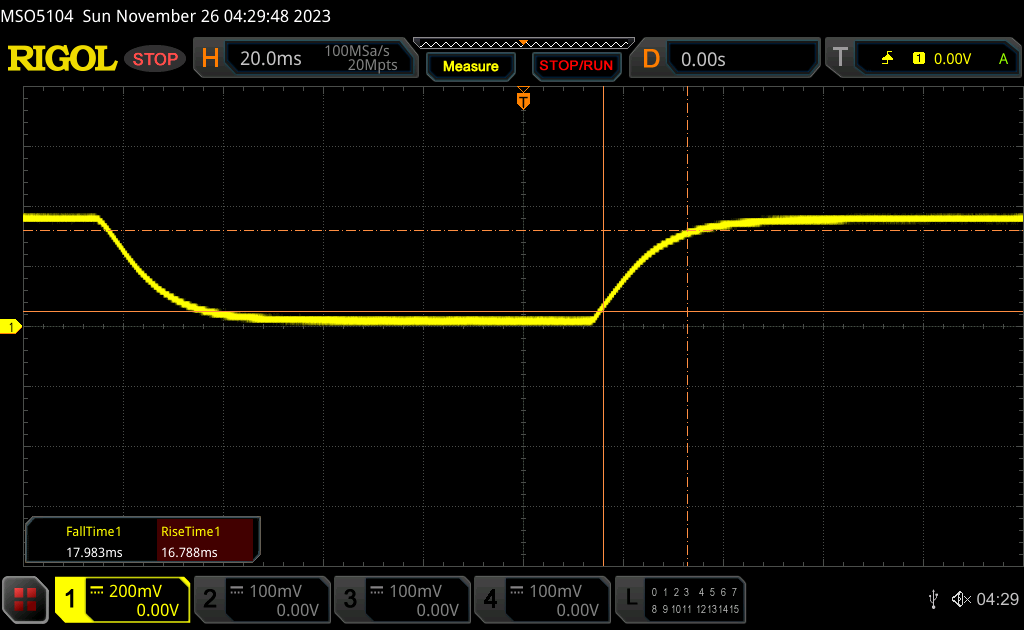 |
| ↘ 18 ms hösten | ||
| Skärmen visar långsamma svarsfrekvenser i våra tester och kommer att vara otillfredsställande för spelare. I jämförelse sträcker sig alla testade enheter från 0.1 (minst) till 240 (maximalt) ms. » 92 % av alla enheter är bättre. Detta innebär att den uppmätta svarstiden är sämre än genomsnittet av alla testade enheter (20.8 ms). | ||
| ↔ Svarstid 50 % grått till 80 % grått | ||
| 54.4 ms ... stiga ↗ och falla ↘ kombinerat | ↗ 25.3 ms stiga | 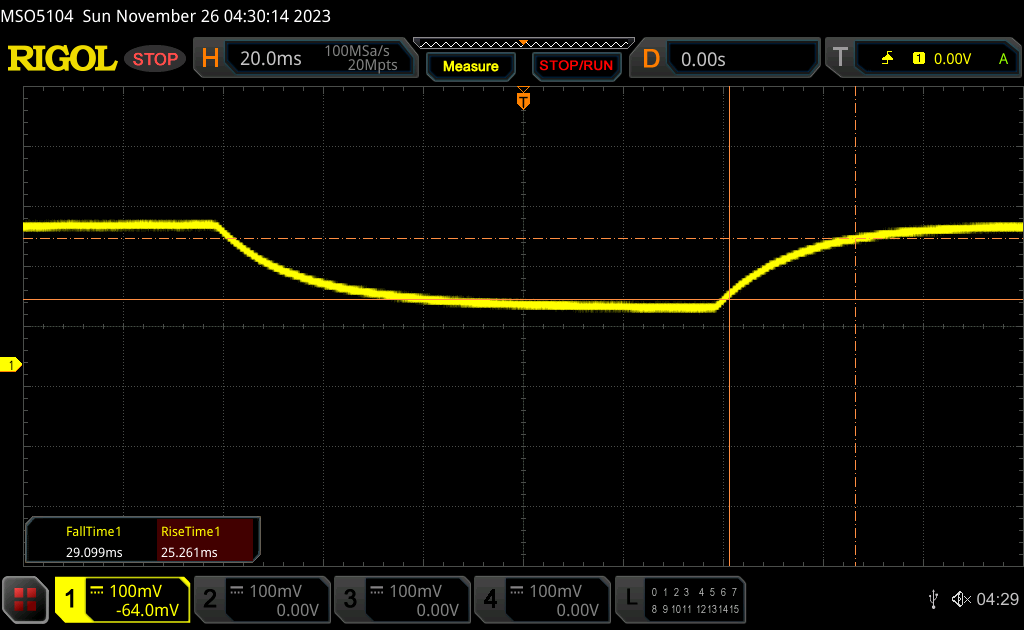 |
| ↘ 29.1 ms hösten | ||
| Skärmen visar långsamma svarsfrekvenser i våra tester och kommer att vara otillfredsställande för spelare. I jämförelse sträcker sig alla testade enheter från 0.165 (minst) till 636 (maximalt) ms. » 90 % av alla enheter är bättre. Detta innebär att den uppmätta svarstiden är sämre än genomsnittet av alla testade enheter (32.5 ms). | ||
Skärmflimmer / PWM (Puls-Width Modulation)
| Skärmflimmer / PWM upptäcktes inte | 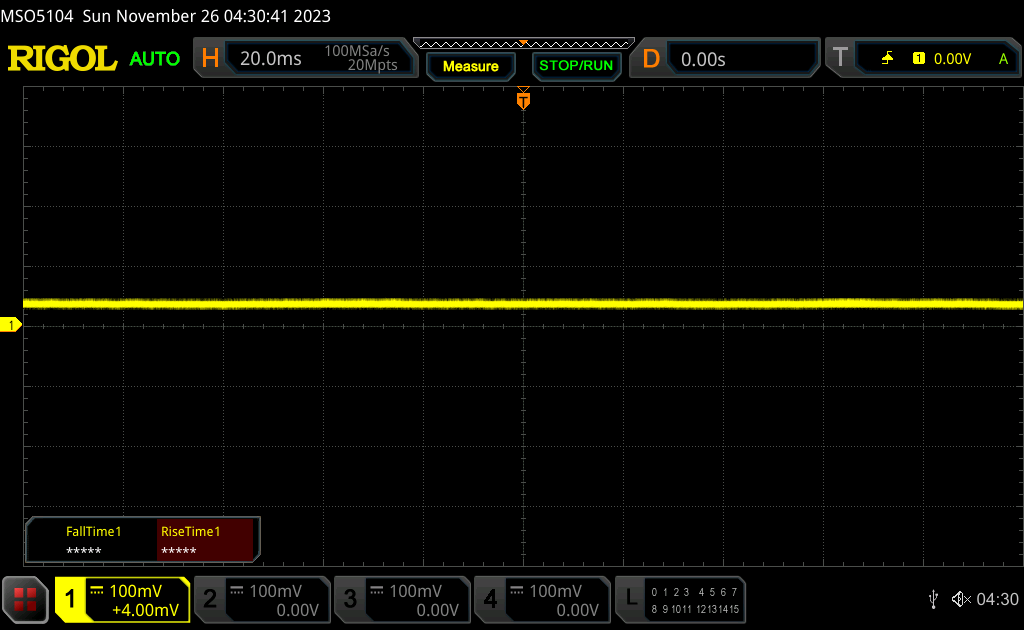 | ||
Som jämförelse: 53 % av alla testade enheter använder inte PWM för att dämpa skärmen. Om PWM upptäcktes mättes ett medelvärde av 8516 (minst: 5 - maximum: 343500) Hz. | |||


Prestanda
Villkor för testning
Vi ställde in Windows på prestandaläge innan vi körde riktmärkena nedan. Systemet innehåller ingen specialiserad "kontrollcenter"-programvara för justering av extrafunktioner eller ytterligare energiprofiler.
Processor
Core i7-1360P Core i7-1360P är lite av en blandad kompott. Å ena sidan erbjuder den liknande prestanda som den äldre och mer krävandeCore i7-11370H i Schenker Work 15. Men å andra sidan kommer den till korta mot alternativ somCore i7-1355U ellerRyzen 7 5700U. Den lider också av strypning eftersom vår ursprungliga CineBench R15 xT-poäng på 1079 poäng skulle sjunka med cirka 21 procent när vi körde benchmarken i en loop.
Core i7-processorn underpresterar definitivt på vår Eurocom. DenCore i5-1340P iSamsung Galaxy Book3 Pro 360 16skulle till exempel gå 50 till 70 procent snabbare enligt flera multi-thread benchmarks.
Cinebench R15 Multi Loop
Cinebench R23: Multi Core | Single Core
Cinebench R20: CPU (Multi Core) | CPU (Single Core)
Cinebench R15: CPU Multi 64Bit | CPU Single 64Bit
Blender: v2.79 BMW27 CPU
7-Zip 18.03: 7z b 4 | 7z b 4 -mmt1
Geekbench 5.5: Multi-Core | Single-Core
HWBOT x265 Benchmark v2.2: 4k Preset
LibreOffice : 20 Documents To PDF
R Benchmark 2.5: Overall mean
* ... mindre är bättre
AIDA64: FP32 Ray-Trace | FPU Julia | CPU SHA3 | CPU Queen | FPU SinJulia | FPU Mandel | CPU AES | CPU ZLib | FP64 Ray-Trace | CPU PhotoWorxx
| Performance Rating | |
| Asus VivoBook S15 M3502RA-L1029W | |
| Lenovo ThinkPad L15 Gen 4 21H70021GE | |
| Genomsnitt Intel Core i7-1360P | |
| Acer Aspire 5 A515-58GM-76S8 | |
| SCHENKER Work 15 Tiger Lake-H | |
| Samsung Galaxy Book2 15 | |
| Eurocom C315 Blitz | |
| AIDA64 / FP32 Ray-Trace | |
| Asus VivoBook S15 M3502RA-L1029W | |
| Lenovo ThinkPad L15 Gen 4 21H70021GE | |
| Genomsnitt Intel Core i7-1360P (5610 - 11188, n=17) | |
| Acer Aspire 5 A515-58GM-76S8 | |
| SCHENKER Work 15 Tiger Lake-H | |
| Samsung Galaxy Book2 15 | |
| Eurocom C315 Blitz | |
| AIDA64 / FPU Julia | |
| Asus VivoBook S15 M3502RA-L1029W | |
| Lenovo ThinkPad L15 Gen 4 21H70021GE | |
| Genomsnitt Intel Core i7-1360P (29251 - 56942, n=16) | |
| Acer Aspire 5 A515-58GM-76S8 | |
| SCHENKER Work 15 Tiger Lake-H | |
| Eurocom C315 Blitz | |
| Samsung Galaxy Book2 15 | |
| AIDA64 / CPU SHA3 | |
| Asus VivoBook S15 M3502RA-L1029W | |
| Lenovo ThinkPad L15 Gen 4 21H70021GE | |
| Genomsnitt Intel Core i7-1360P (1444 - 2728, n=16) | |
| Acer Aspire 5 A515-58GM-76S8 | |
| SCHENKER Work 15 Tiger Lake-H | |
| Eurocom C315 Blitz | |
| Samsung Galaxy Book2 15 | |
| AIDA64 / CPU Queen | |
| Asus VivoBook S15 M3502RA-L1029W | |
| Lenovo ThinkPad L15 Gen 4 21H70021GE | |
| Genomsnitt Intel Core i7-1360P (65324 - 89266, n=16) | |
| Eurocom C315 Blitz | |
| Samsung Galaxy Book2 15 | |
| Acer Aspire 5 A515-58GM-76S8 | |
| SCHENKER Work 15 Tiger Lake-H | |
| AIDA64 / FPU SinJulia | |
| Asus VivoBook S15 M3502RA-L1029W | |
| Lenovo ThinkPad L15 Gen 4 21H70021GE | |
| Samsung Galaxy Book2 15 | |
| Genomsnitt Intel Core i7-1360P (4370 - 7269, n=16) | |
| Acer Aspire 5 A515-58GM-76S8 | |
| SCHENKER Work 15 Tiger Lake-H | |
| Eurocom C315 Blitz | |
| AIDA64 / FPU Mandel | |
| Asus VivoBook S15 M3502RA-L1029W | |
| Lenovo ThinkPad L15 Gen 4 21H70021GE | |
| Genomsnitt Intel Core i7-1360P (14104 - 28019, n=16) | |
| Acer Aspire 5 A515-58GM-76S8 | |
| SCHENKER Work 15 Tiger Lake-H | |
| Eurocom C315 Blitz | |
| Samsung Galaxy Book2 15 | |
| AIDA64 / CPU AES | |
| Asus VivoBook S15 M3502RA-L1029W | |
| Acer Aspire 5 A515-58GM-76S8 | |
| SCHENKER Work 15 Tiger Lake-H | |
| Genomsnitt Intel Core i7-1360P (30391 - 99244, n=16) | |
| Lenovo ThinkPad L15 Gen 4 21H70021GE | |
| Samsung Galaxy Book2 15 | |
| Eurocom C315 Blitz | |
| AIDA64 / CPU ZLib | |
| Asus VivoBook S15 M3502RA-L1029W | |
| Lenovo ThinkPad L15 Gen 4 21H70021GE | |
| Samsung Galaxy Book2 15 | |
| Genomsnitt Intel Core i7-1360P (420 - 807, n=16) | |
| Acer Aspire 5 A515-58GM-76S8 | |
| Eurocom C315 Blitz | |
| SCHENKER Work 15 Tiger Lake-H | |
| AIDA64 / FP64 Ray-Trace | |
| Asus VivoBook S15 M3502RA-L1029W | |
| Lenovo ThinkPad L15 Gen 4 21H70021GE | |
| Genomsnitt Intel Core i7-1360P (2906 - 5957, n=16) | |
| Acer Aspire 5 A515-58GM-76S8 | |
| SCHENKER Work 15 Tiger Lake-H | |
| Samsung Galaxy Book2 15 | |
| Eurocom C315 Blitz | |
| AIDA64 / CPU PhotoWorxx | |
| Genomsnitt Intel Core i7-1360P (29108 - 49328, n=16) | |
| Samsung Galaxy Book2 15 | |
| Eurocom C315 Blitz | |
| SCHENKER Work 15 Tiger Lake-H | |
| Asus VivoBook S15 M3502RA-L1029W | |
| Acer Aspire 5 A515-58GM-76S8 | |
| Lenovo ThinkPad L15 Gen 4 21H70021GE | |
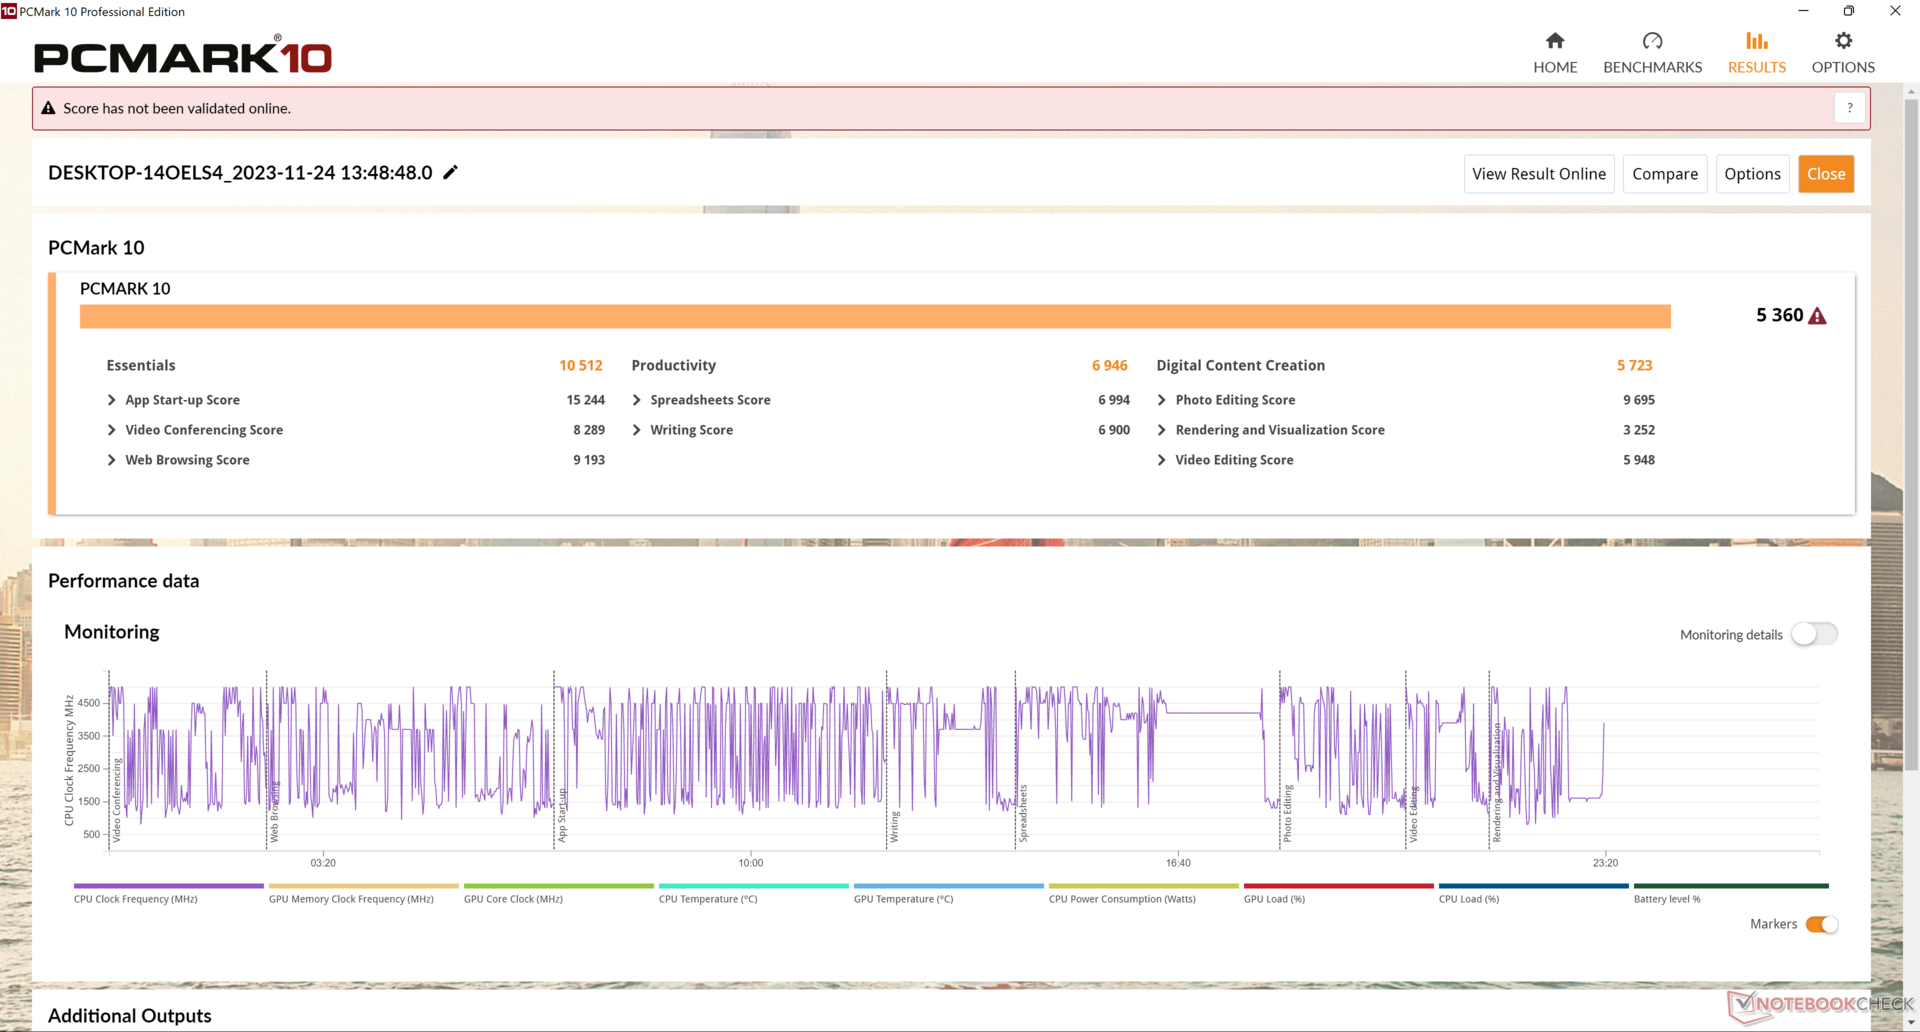
Systemets prestanda
PCMark-resultaten är i princip identiska med Schenker Work 15 som körs på den äldre och mer strömkrävande Core i7-11370H.
CrossMark: Overall | Productivity | Creativity | Responsiveness
| PCMark 10 / Score | |
| Asus VivoBook S15 M3502RA-L1029W | |
| Acer Aspire 5 A515-58GM-76S8 | |
| Genomsnitt Intel Core i7-1360P, Intel Iris Xe Graphics G7 96EUs (5360 - 6281, n=14) | |
| Samsung Galaxy Book2 15 | |
| SCHENKER Work 15 Tiger Lake-H | |
| Lenovo ThinkPad L15 Gen 4 21H70021GE | |
| Eurocom C315 Blitz | |
| PCMark 10 / Essentials | |
| Acer Aspire 5 A515-58GM-76S8 | |
| Genomsnitt Intel Core i7-1360P, Intel Iris Xe Graphics G7 96EUs (9883 - 12059, n=14) | |
| SCHENKER Work 15 Tiger Lake-H | |
| Eurocom C315 Blitz | |
| Asus VivoBook S15 M3502RA-L1029W | |
| Lenovo ThinkPad L15 Gen 4 21H70021GE | |
| Samsung Galaxy Book2 15 | |
| PCMark 10 / Productivity | |
| Asus VivoBook S15 M3502RA-L1029W | |
| Lenovo ThinkPad L15 Gen 4 21H70021GE | |
| Acer Aspire 5 A515-58GM-76S8 | |
| Genomsnitt Intel Core i7-1360P, Intel Iris Xe Graphics G7 96EUs (6572 - 8161, n=14) | |
| SCHENKER Work 15 Tiger Lake-H | |
| Eurocom C315 Blitz | |
| Samsung Galaxy Book2 15 | |
| PCMark 10 / Digital Content Creation | |
| Asus VivoBook S15 M3502RA-L1029W | |
| Acer Aspire 5 A515-58GM-76S8 | |
| Genomsnitt Intel Core i7-1360P, Intel Iris Xe Graphics G7 96EUs (5723 - 7612, n=14) | |
| Samsung Galaxy Book2 15 | |
| SCHENKER Work 15 Tiger Lake-H | |
| Eurocom C315 Blitz | |
| Lenovo ThinkPad L15 Gen 4 21H70021GE | |
| CrossMark / Overall | |
| Eurocom C315 Blitz | |
| Acer Aspire 5 A515-58GM-76S8 | |
| Genomsnitt Intel Core i7-1360P, Intel Iris Xe Graphics G7 96EUs (1527 - 1891, n=15) | |
| Asus VivoBook S15 M3502RA-L1029W | |
| Lenovo ThinkPad L15 Gen 4 21H70021GE | |
| CrossMark / Productivity | |
| Acer Aspire 5 A515-58GM-76S8 | |
| Eurocom C315 Blitz | |
| Genomsnitt Intel Core i7-1360P, Intel Iris Xe Graphics G7 96EUs (1503 - 1842, n=15) | |
| Asus VivoBook S15 M3502RA-L1029W | |
| Lenovo ThinkPad L15 Gen 4 21H70021GE | |
| CrossMark / Creativity | |
| Eurocom C315 Blitz | |
| Genomsnitt Intel Core i7-1360P, Intel Iris Xe Graphics G7 96EUs (1558 - 2003, n=15) | |
| Asus VivoBook S15 M3502RA-L1029W | |
| Acer Aspire 5 A515-58GM-76S8 | |
| Lenovo ThinkPad L15 Gen 4 21H70021GE | |
| CrossMark / Responsiveness | |
| Acer Aspire 5 A515-58GM-76S8 | |
| Eurocom C315 Blitz | |
| Genomsnitt Intel Core i7-1360P, Intel Iris Xe Graphics G7 96EUs (1311 - 1899, n=15) | |
| Asus VivoBook S15 M3502RA-L1029W | |
| Lenovo ThinkPad L15 Gen 4 21H70021GE | |
| PCMark 10 Score | 5360 poäng | |
Hjälp | ||
| AIDA64 / Memory Copy | |
| Eurocom C315 Blitz | |
| Samsung Galaxy Book2 15 | |
| Genomsnitt Intel Core i7-1360P (44299 - 72748, n=16) | |
| Asus VivoBook S15 M3502RA-L1029W | |
| SCHENKER Work 15 Tiger Lake-H | |
| Acer Aspire 5 A515-58GM-76S8 | |
| Lenovo ThinkPad L15 Gen 4 21H70021GE | |
| AIDA64 / Memory Read | |
| Eurocom C315 Blitz | |
| Samsung Galaxy Book2 15 | |
| Genomsnitt Intel Core i7-1360P (44751 - 68945, n=16) | |
| Asus VivoBook S15 M3502RA-L1029W | |
| SCHENKER Work 15 Tiger Lake-H | |
| Acer Aspire 5 A515-58GM-76S8 | |
| Lenovo ThinkPad L15 Gen 4 21H70021GE | |
| AIDA64 / Memory Write | |
| Eurocom C315 Blitz | |
| Genomsnitt Intel Core i7-1360P (45887 - 93331, n=16) | |
| Samsung Galaxy Book2 15 | |
| Asus VivoBook S15 M3502RA-L1029W | |
| SCHENKER Work 15 Tiger Lake-H | |
| Acer Aspire 5 A515-58GM-76S8 | |
| Lenovo ThinkPad L15 Gen 4 21H70021GE | |
| AIDA64 / Memory Latency | |
| Lenovo ThinkPad L15 Gen 4 21H70021GE | |
| Genomsnitt Intel Core i7-1360P (85 - 110.5, n=16) | |
| Asus VivoBook S15 M3502RA-L1029W | |
| Eurocom C315 Blitz | |
| SCHENKER Work 15 Tiger Lake-H | |
| Acer Aspire 5 A515-58GM-76S8 | |
| Samsung Galaxy Book2 15 | |
* ... mindre är bättre
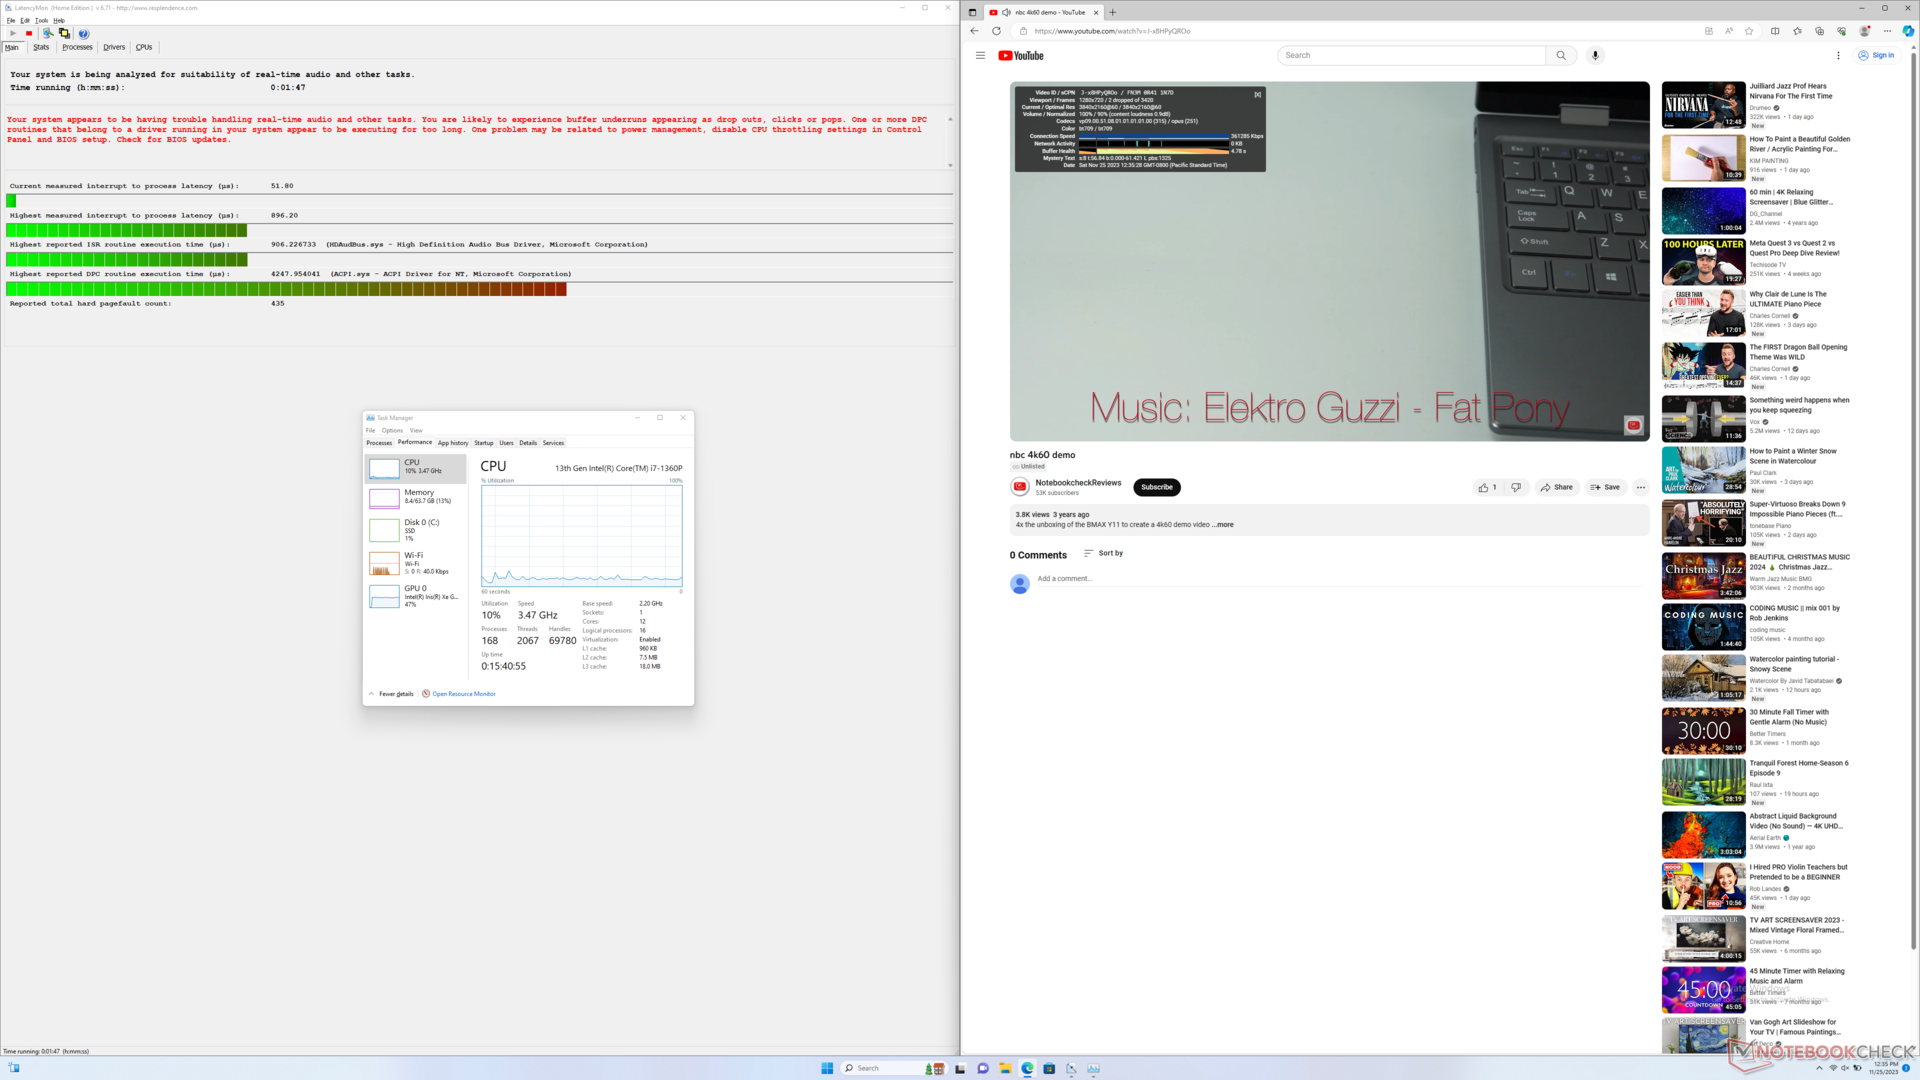
DPC-fördröjning
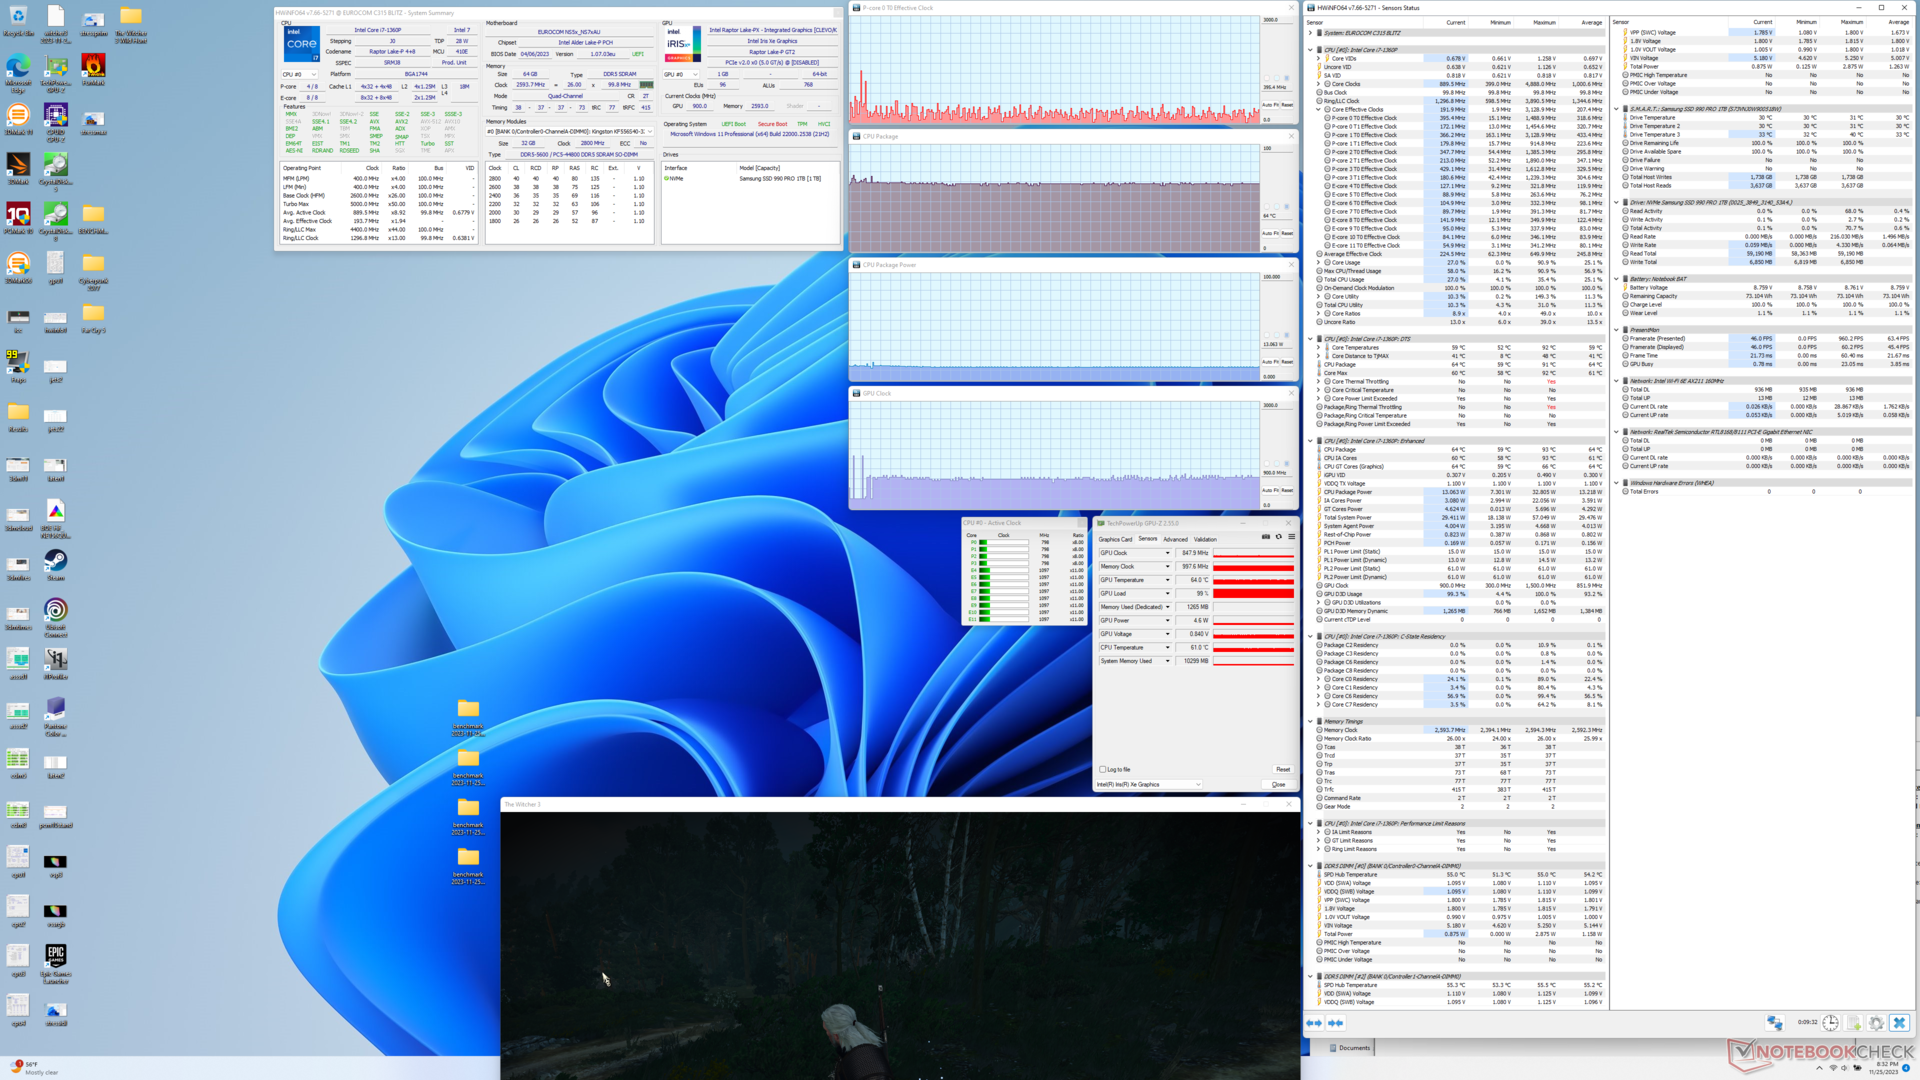
LatencyMon avslöjar DPC-problem när flera webbläsarflikar öppnas på vår hemsida. uppspelning av 4K-video vid 60 FPS är utmärkt med bara två tappade bildrutor under ett tidsintervall på en minut.

| DPC Latencies / LatencyMon - interrupt to process latency (max), Web, Youtube, Prime95 | |
| Lenovo ThinkPad L15 Gen 4 21H70021GE | |
| SCHENKER Work 15 Tiger Lake-H | |
| Acer Aspire 5 A515-58GM-76S8 | |
| Eurocom C315 Blitz | |
| Samsung Galaxy Book2 15 | |
| Asus VivoBook S15 M3502RA-L1029W | |
* ... mindre är bättre
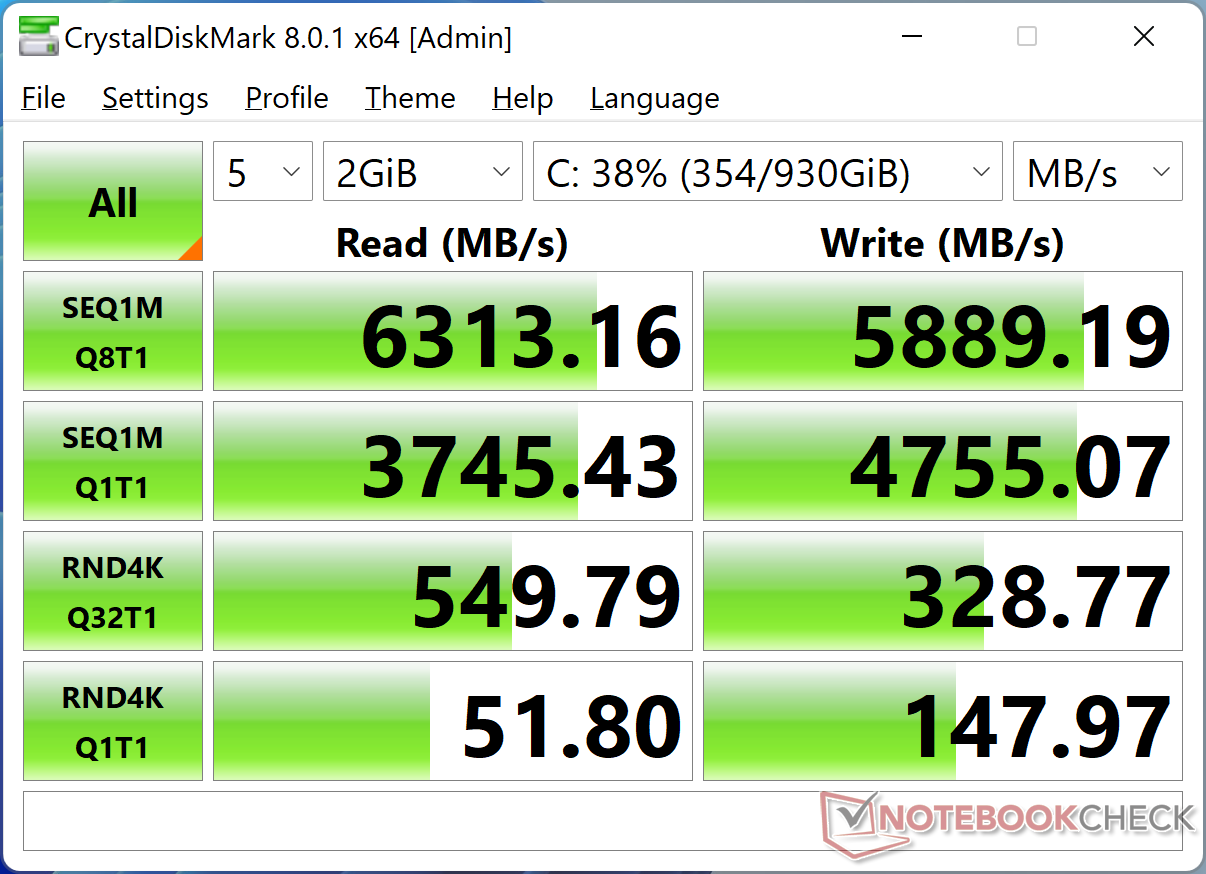
Lagringsenheter
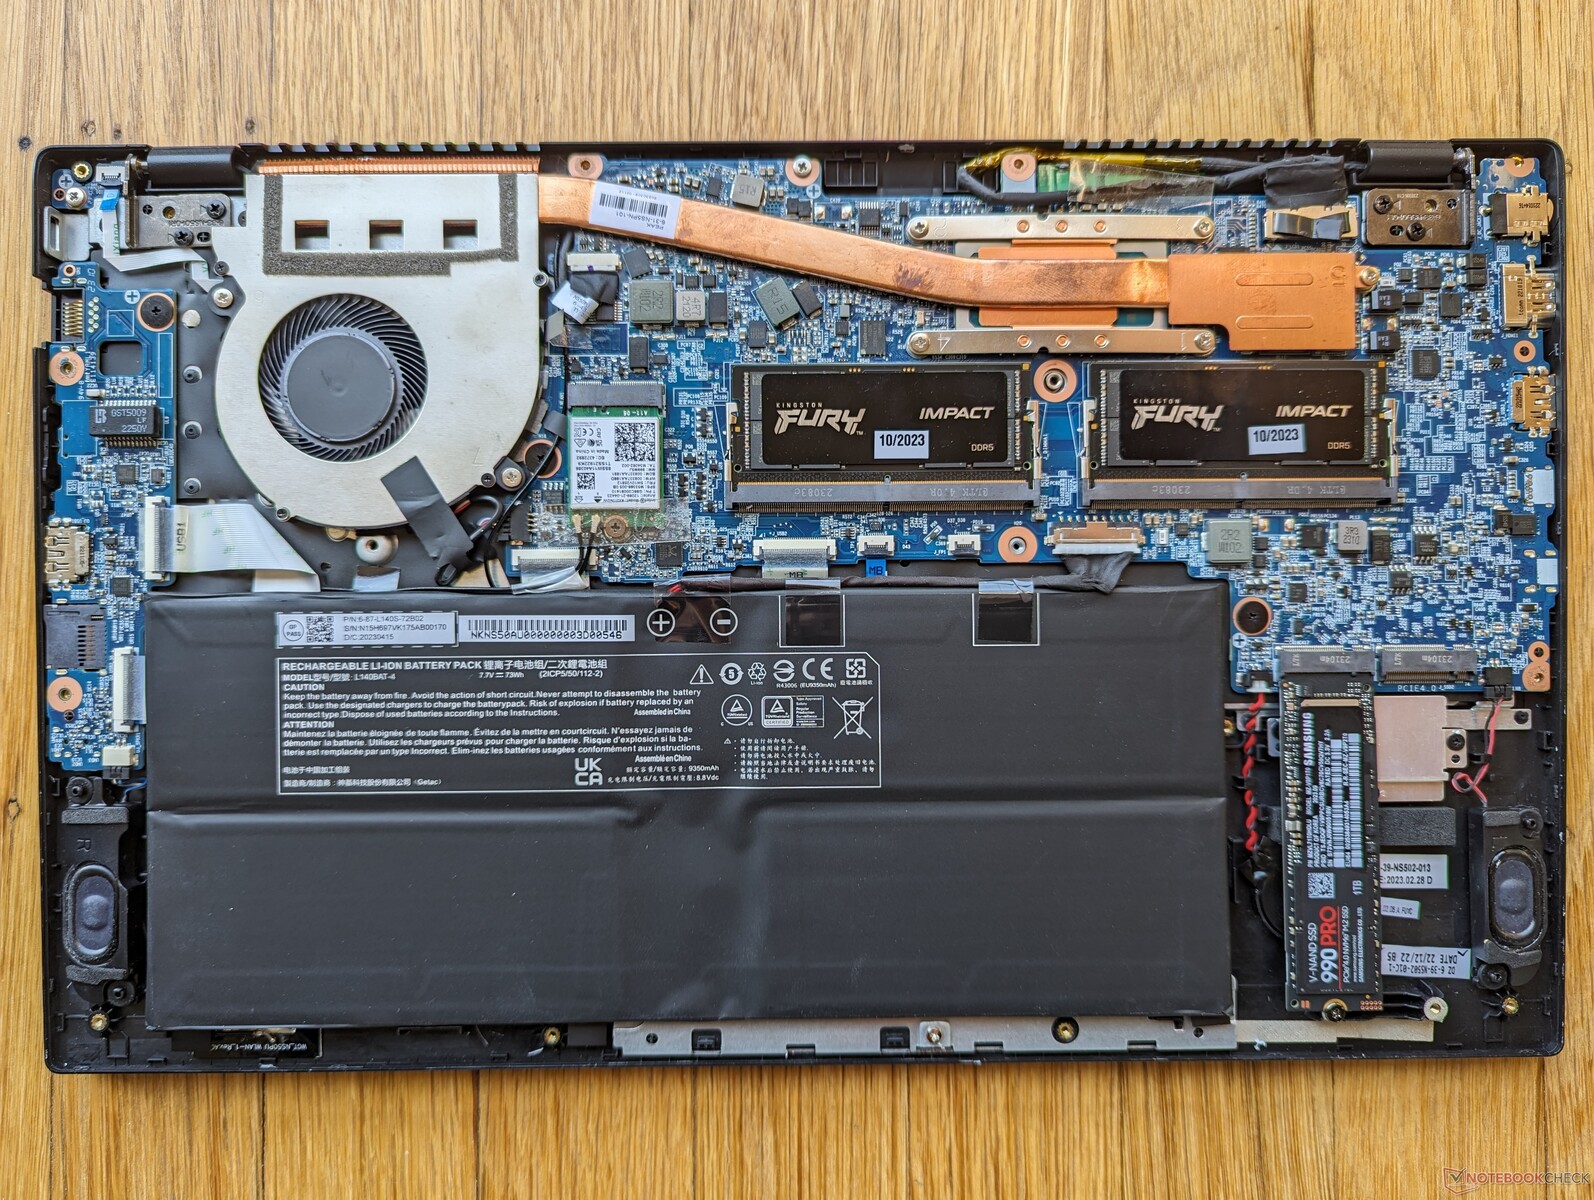
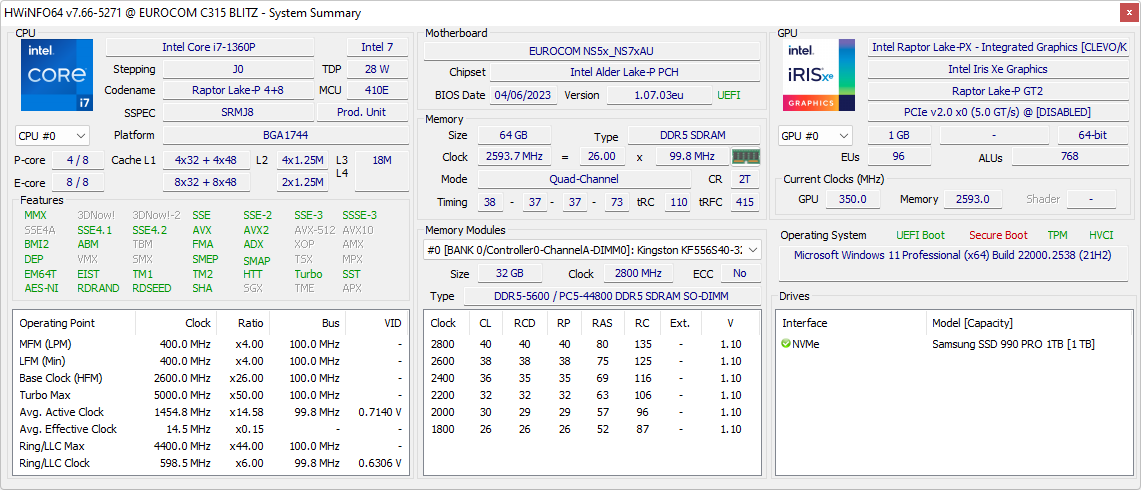
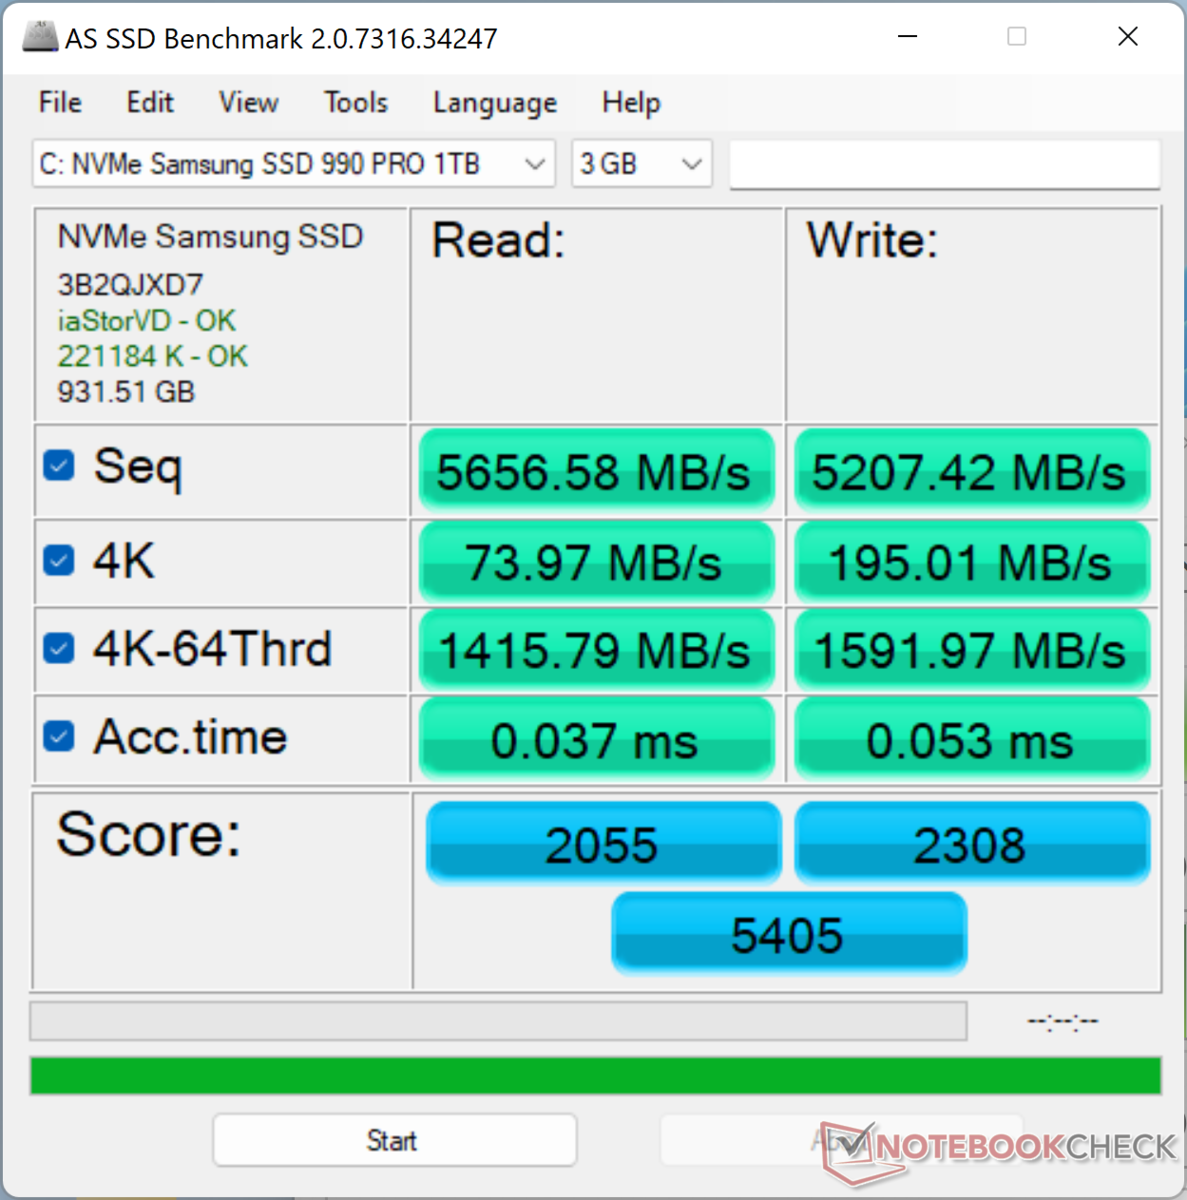
Vår enhet levereras med en avancerad Samsung 990 Pro som utlovar sekventiella läs- och skrivhastigheter på upp till 7450 MB/s respektive 6900 MB/s. Enheten i vår enhet klarar maximalt 7100 MB/s utan problem med strypning. Den medföljande värmeplattan på SSD-enheten gör att värmen kan ledas bort till bottenplattan av metall.

* ... mindre är bättre
Disk Throttling: DiskSpd Read Loop, Queue Depth 8
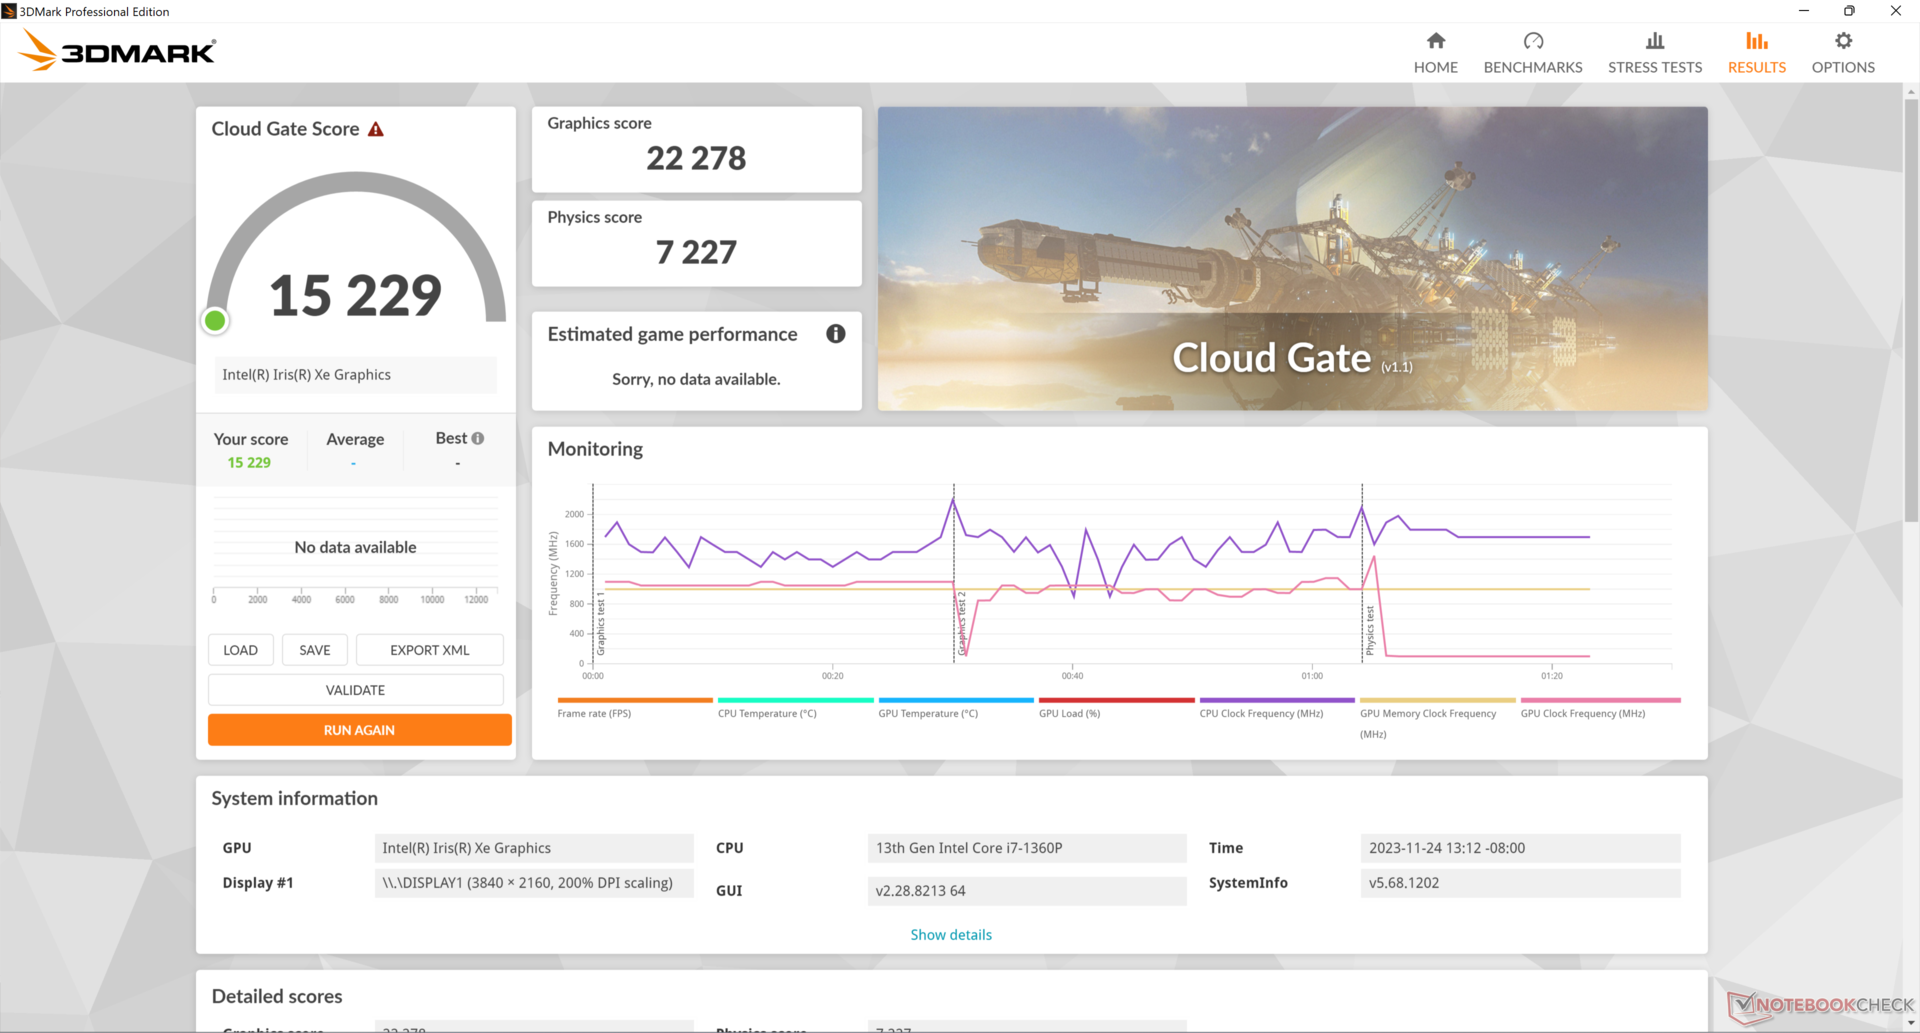
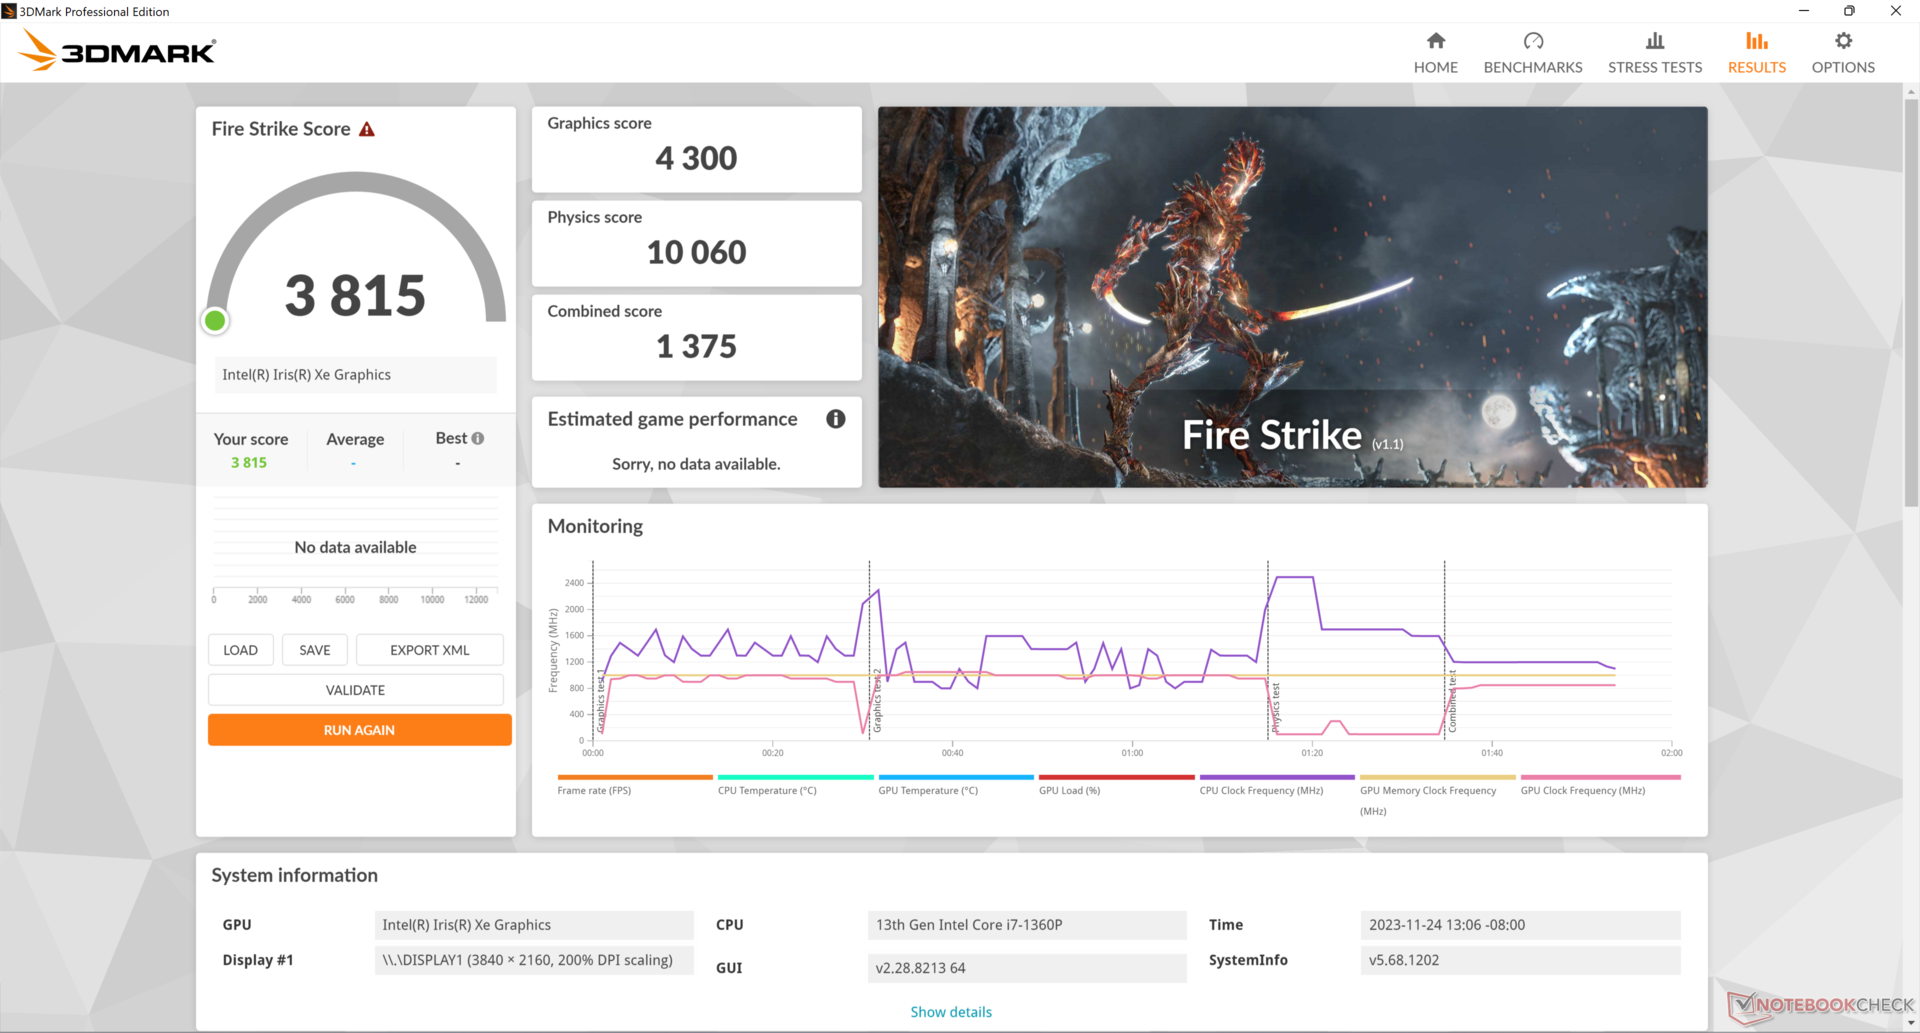
GPU-prestanda
Den integrerade Iris Xe 96 EUs presterar något under genomsnittet jämfört med andra bärbara datorer med samma GPU. Faktum är att vår Schenker Work 15 med den äldre Core i7-11370H skulle returnera högre 3DMark-poäng än vår Eurocom trots deras liknande GPU.
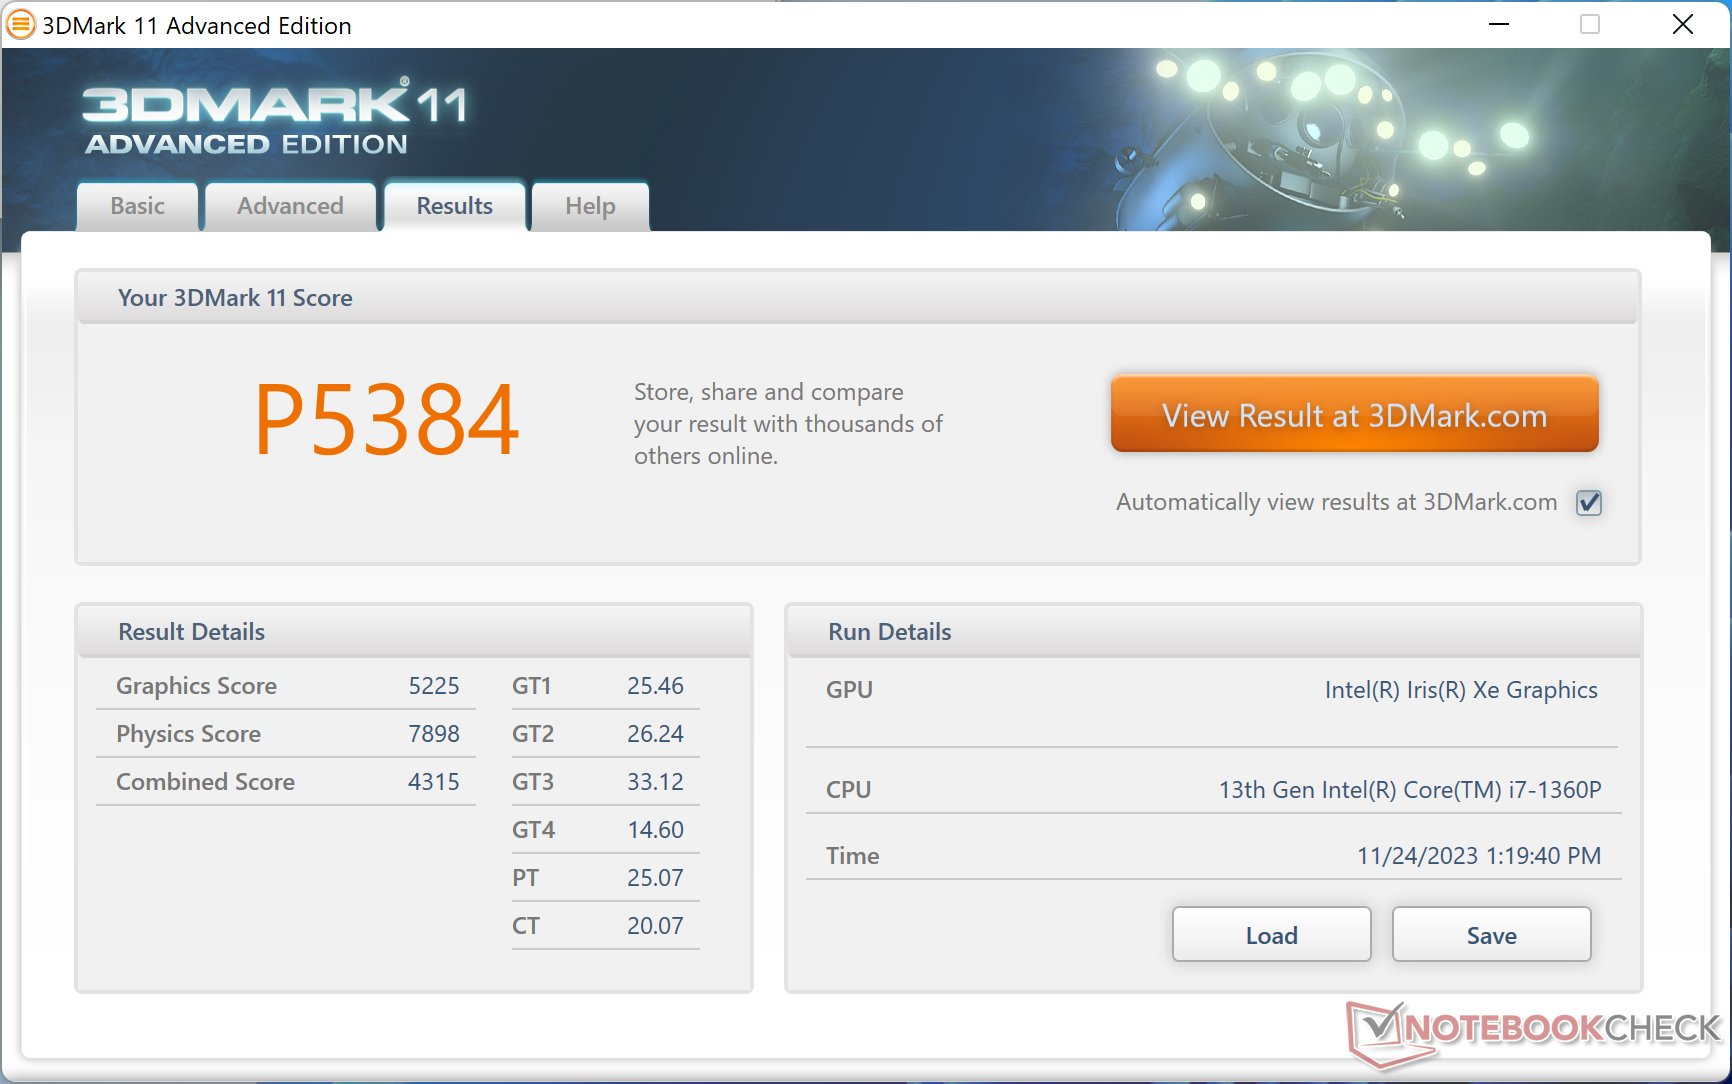
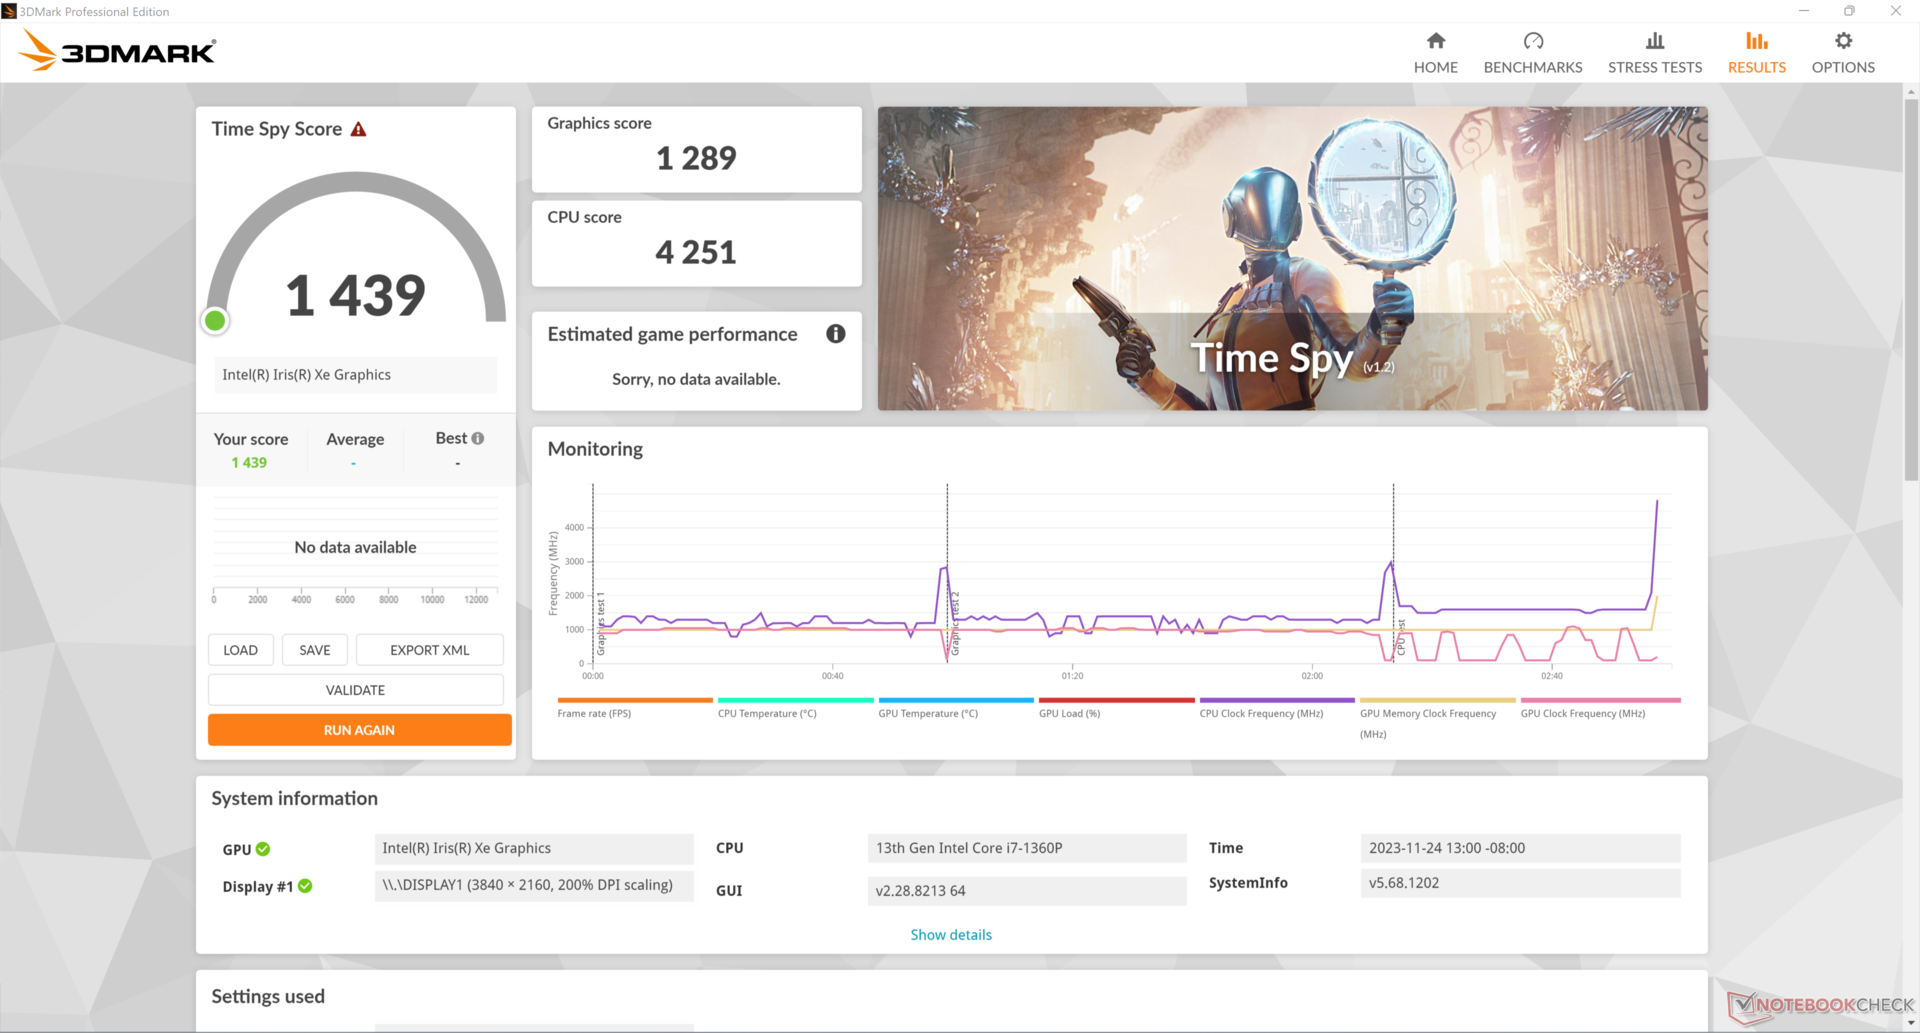
| 3DMark 11 Performance | 5384 poäng | |
| 3DMark Cloud Gate Standard Score | 15229 poäng | |
| 3DMark Fire Strike Score | 3815 poäng | |
| 3DMark Time Spy Score | 1439 poäng | |
Hjälp | ||
* ... mindre är bättre
| Tiny Tina's Wonderlands - 1280x720 Lowest Preset (DX12) | |
| Genomsnitt Intel Iris Xe Graphics G7 96EUs (25.9 - 67.3, n=32) | |
| Eurocom C315 Blitz | |
Witcher 3 FPS Chart
| låg | med. | hög | ultra | |
|---|---|---|---|---|
| GTA V (2015) | 84.7 | 72.7 | 22.5 | 9.68 |
| The Witcher 3 (2015) | 66.7 | 46.9 | 26.3 | 13 |
| Dota 2 Reborn (2015) | 96.8 | 66.3 | 48.6 | 40.9 |
| Final Fantasy XV Benchmark (2018) | 33.4 | 18.8 | 14 | |
| X-Plane 11.11 (2018) | 43.4 | 32.2 | 29.3 | |
| Far Cry 5 (2018) | 36 | 23 | 21 | 20 |
| Strange Brigade (2018) | 76.8 | 34.7 | 28.2 | 23.3 |
| Cyberpunk 2077 1.6 (2022) | 14.1 | |||
| Tiny Tina's Wonderlands (2022) | ||||
| F1 22 (2022) | 38.5 | 34.5 | 25.3 | 19.2 |
Utsläpp
Buller från systemet
Fläktens ljudnivå behöver förbättras ytterligare. När fläkten var ansluten till elnätet pulserade den ibland mellan tyst och 35 dB(A), även när den gick på tomgång i energisparläge. Endast vid batteridrift är fläkten tyst utan onödiga pulseringar. I övrigt är fläktljudet vid krävande belastningar som spel nästan identiskt med vad vi observerade på Schenker Work 15 med den äldre Core H-seriens CPU.
Ljudnivå
| Låg belastning |
| 25.1 / 25.1 / 34.9 dB(A) |
| Hög belastning |
| 42.1 / 44.2 dB(A) |
 | ||
30 dB tyst 40 dB(A) hörbar 50 dB(A) högt ljud |
||
min: | ||
| Eurocom C315 Blitz Iris Xe G7 96EUs, i7-1360P, Samsung 990 Pro 1 TB | SCHENKER Work 15 Tiger Lake-H Iris Xe G7 96EUs, i7-11370H, Samsung SSD 980 Pro 1TB MZ-V8P1T0BW | Lenovo ThinkPad L15 Gen 4 21H70021GE Vega 8, R7 PRO 7730U, SK hynix HFS512GEJ4X113N | Acer Aspire 5 A515-58GM-76S8 GeForce RTX 2050 Mobile, i7-1355U, Micron 2450 1TB MTFDKBA1T0TFK | Asus VivoBook S15 M3502RA-L1029W Radeon 680M, R7 6800H, WD PC SN735 SDBPNHH-512G | Samsung Galaxy Book2 15 A350M, i7-1260P, Samsung PM991 MZVLQ512HBLU | |
|---|---|---|---|---|---|---|
| Noise | 3% | 18% | 2% | -14% | -2% | |
| av / miljö * | 22.5 | 24.4 -8% | 23.5 -4% | 25.04 -11% | 26 -16% | 24.3 -8% |
| Idle Minimum * | 25.1 | 24.4 3% | 23.5 6% | 26.3 -5% | 26 -4% | 24.3 3% |
| Idle Average * | 25.1 | 24.4 3% | 23.5 6% | 26.3 -5% | 26 -4% | 24.3 3% |
| Idle Maximum * | 34.9 | 26.7 23% | 23.5 33% | 26.3 25% | 28.1 19% | 29.8 15% |
| Load Average * | 42.1 | 43.8 -4% | 27.5 35% | 32.5 23% | 56.9 -35% | 47.5 -13% |
| Witcher 3 ultra * | 44.5 | 43.8 2% | 32.7 27% | 46.7 -5% | 47.5 -7% | |
| Load Maximum * | 44.2 | 44.8 -1% | 32.7 26% | 49 -11% | 62.6 -42% | 47.5 -7% |
* ... mindre är bättre
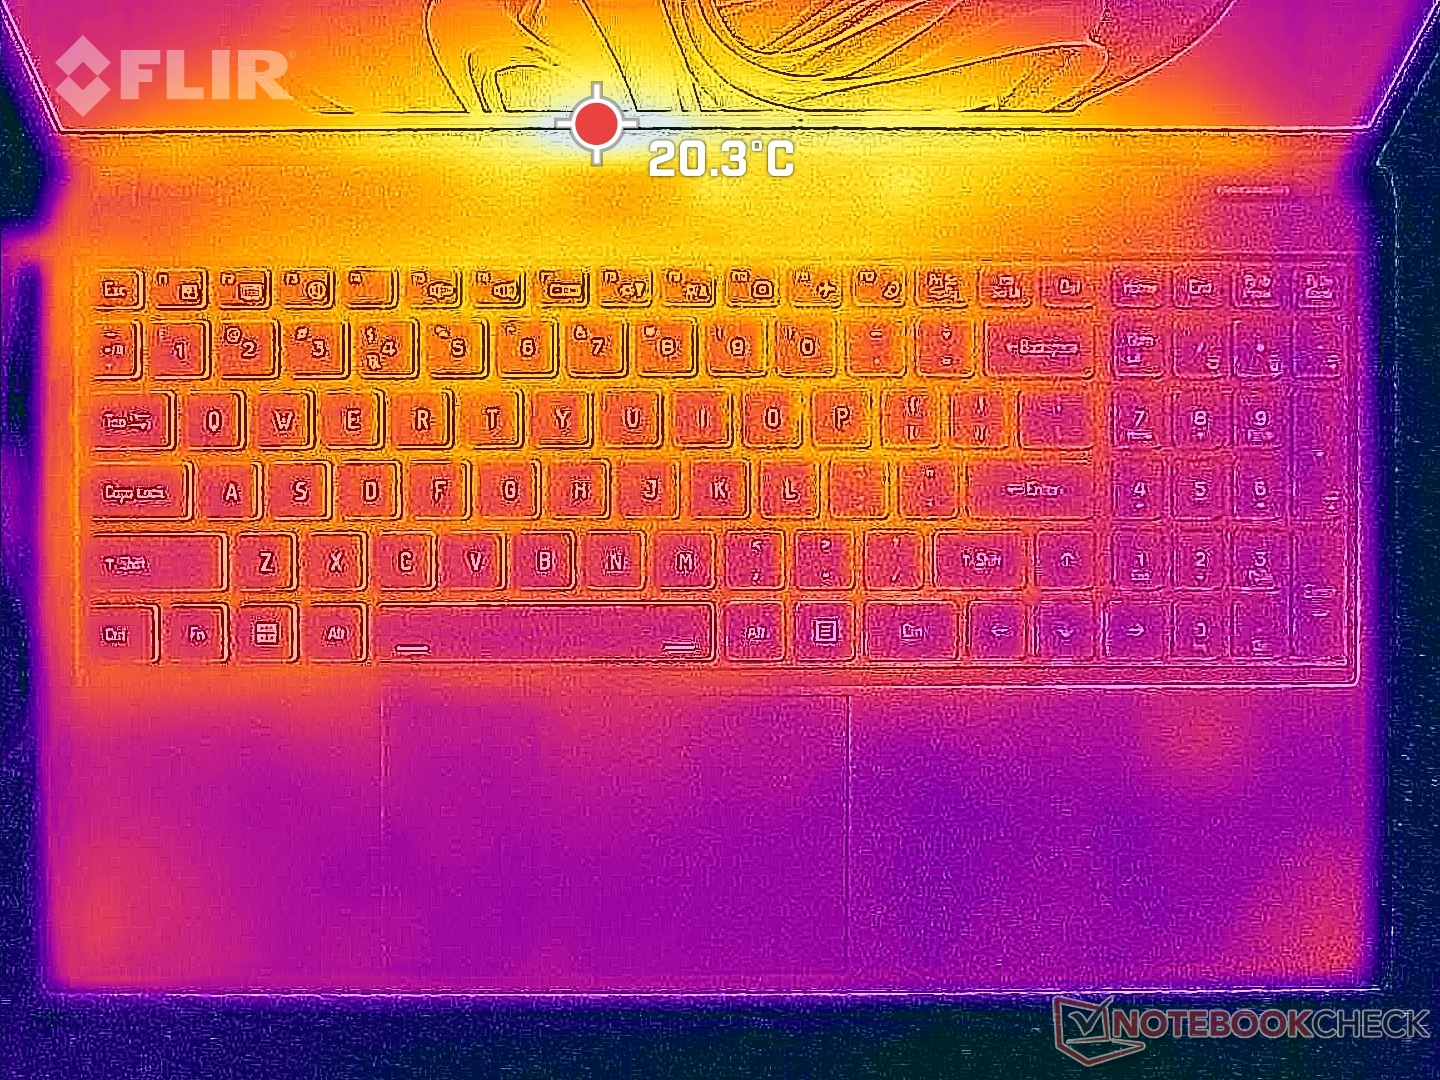
Temperatur
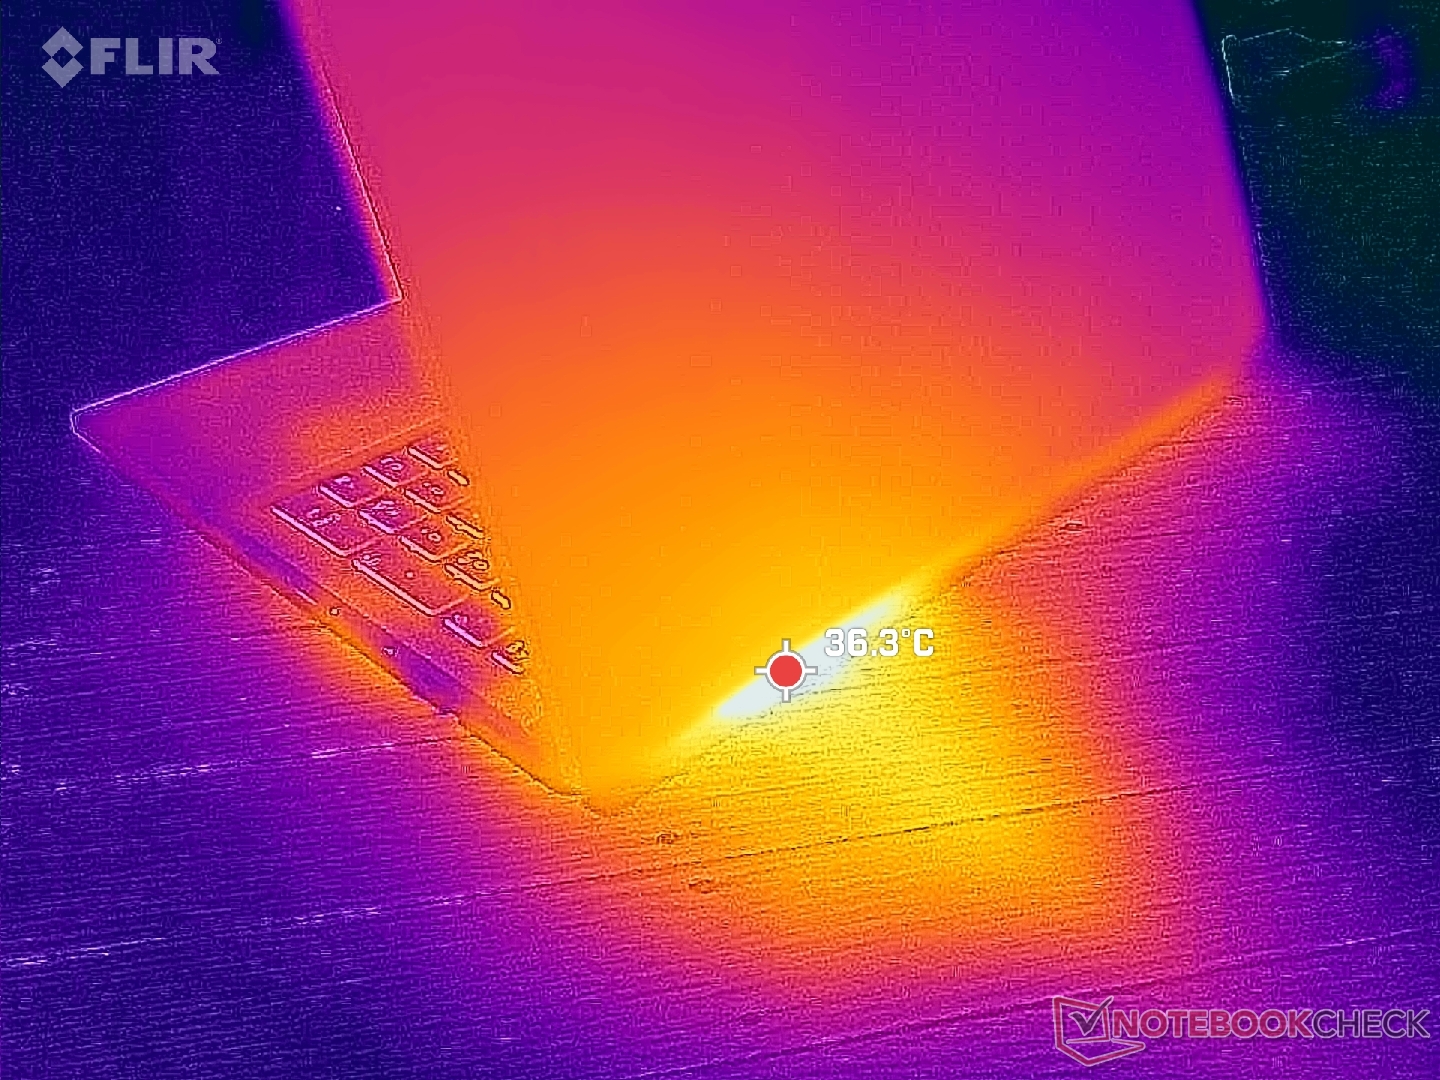
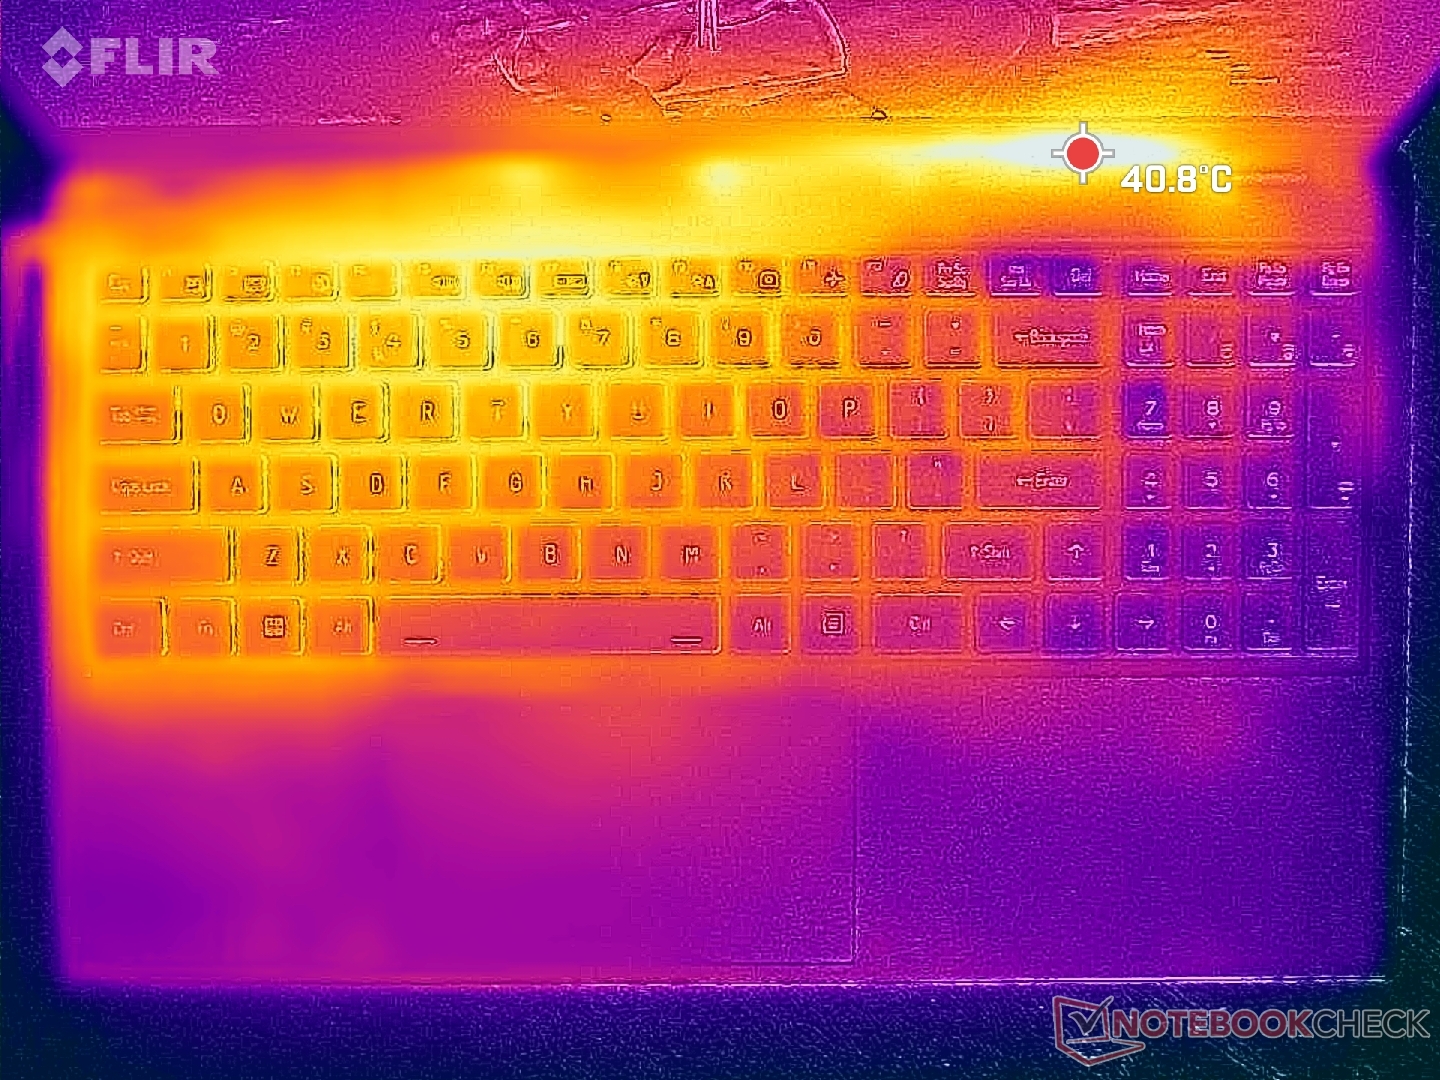
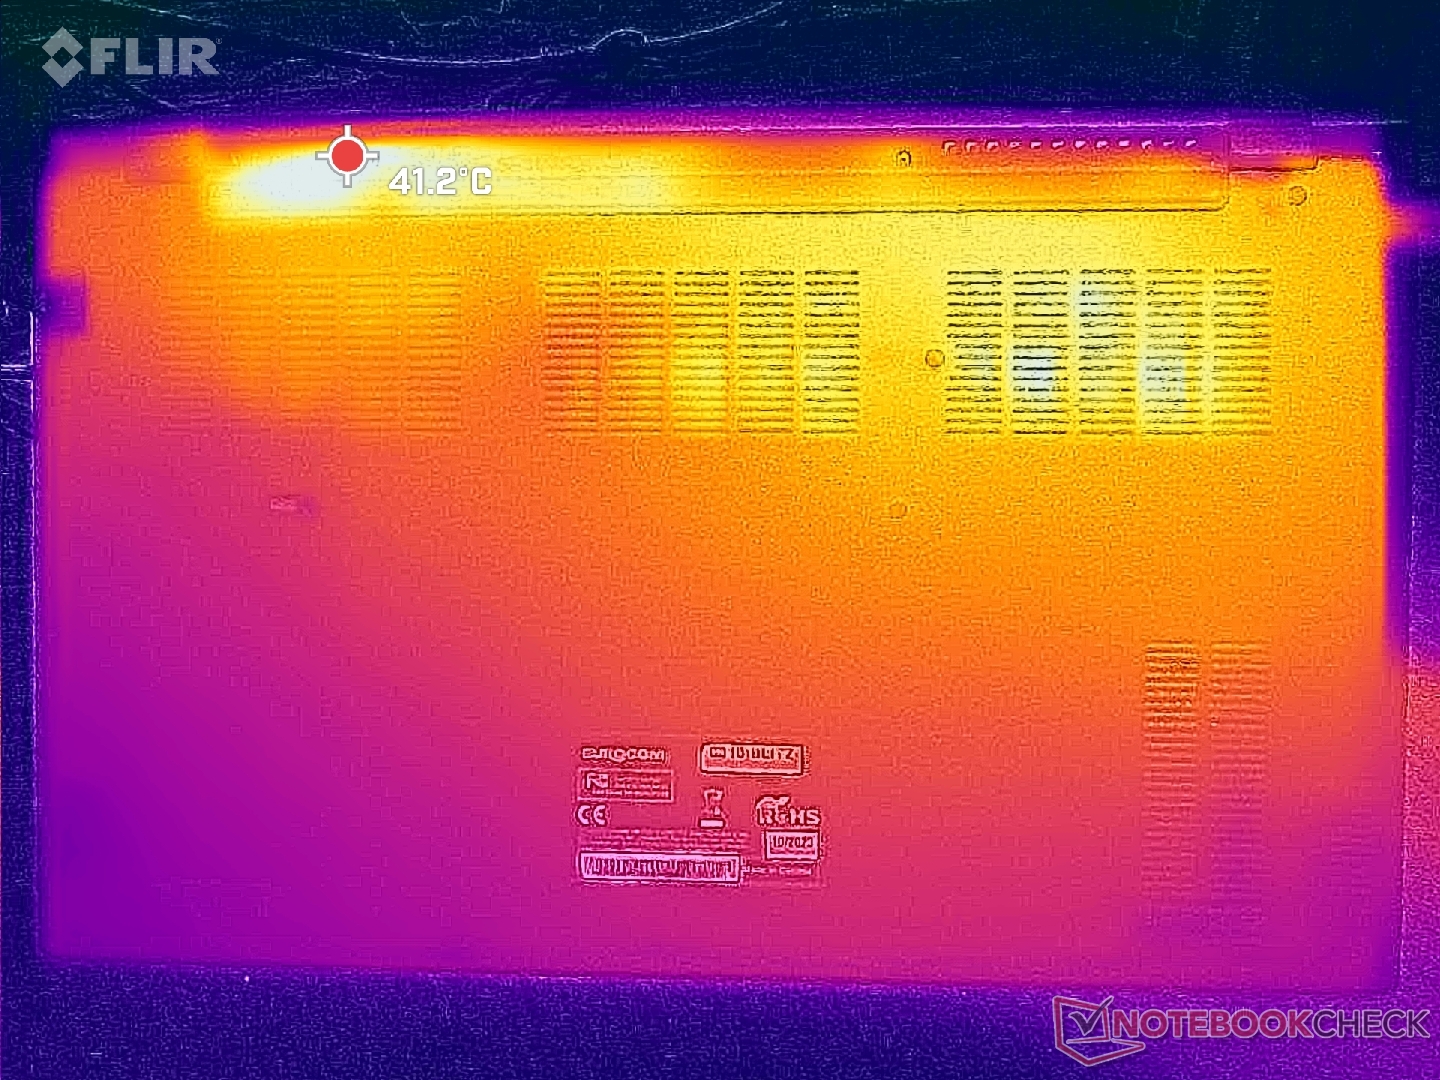
Yttemperaturerna är i genomsnitt lite svalare än vad vi observerade på Schenker Work 15. Vid krävande belastning, till exempel, skulle heta punkter nära baksidan av chassit bara nå 35 C till 38 C jämfört med 43 C på Schenker.
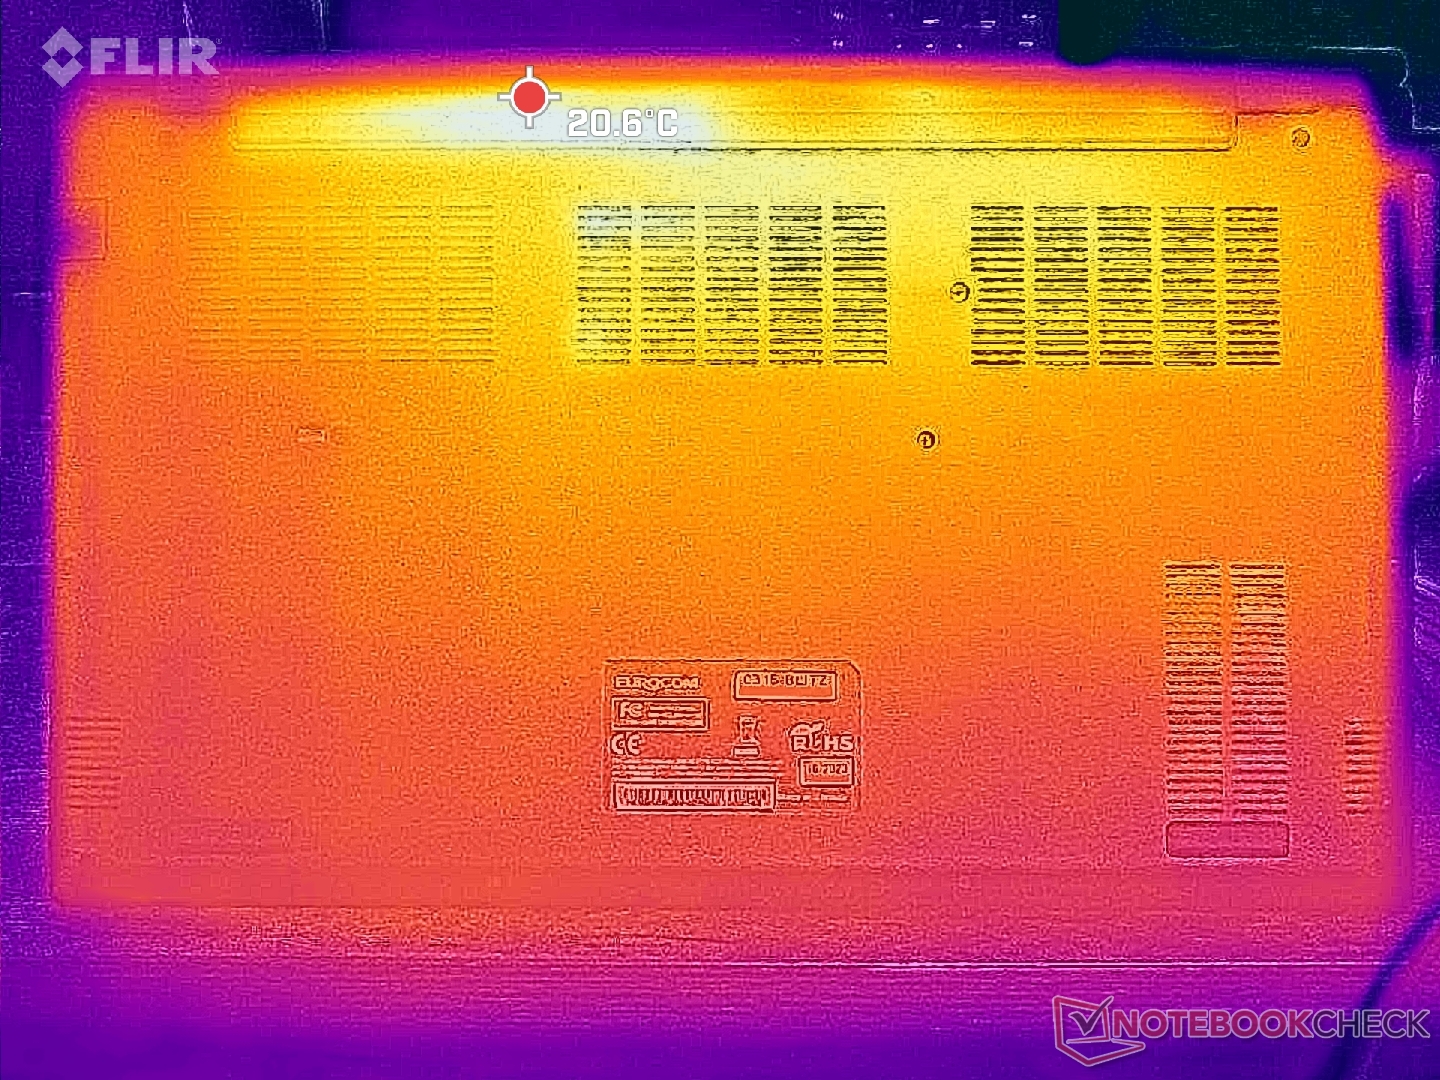
(+) Den maximala temperaturen på ovansidan är 35.6 °C / 96 F, jämfört med genomsnittet av 34.3 °C / 94 F , allt från 21.2 till 62.5 °C för klassen Office.
(+) Botten värms upp till maximalt 37.8 °C / 100 F, jämfört med genomsnittet av 36.8 °C / 98 F
(+) Vid tomgångsbruk är medeltemperaturen för ovansidan 22.8 °C / 73 F, jämfört med enhetsgenomsnittet på 29.5 °C / ### class_avg_f### F.
(+) Handledsstöden och pekplattan är kallare än hudtemperaturen med maximalt 26.6 °C / 79.9 F och är därför svala att ta på.
(±) Medeltemperaturen för handledsstödsområdet på liknande enheter var 27.6 °C / 81.7 F (+1 °C / 1.8 F).
| Eurocom C315 Blitz Intel Core i7-1360P, Intel Iris Xe Graphics G7 96EUs | SCHENKER Work 15 Tiger Lake-H Intel Core i7-11370H, Intel Iris Xe Graphics G7 96EUs | Lenovo ThinkPad L15 Gen 4 21H70021GE AMD Ryzen 7 PRO 7730U, AMD Radeon RX Vega 8 (Ryzen 4000/5000) | Acer Aspire 5 A515-58GM-76S8 Intel Core i7-1355U, NVIDIA GeForce RTX 2050 Mobile | Asus VivoBook S15 M3502RA-L1029W AMD Ryzen 7 6800H, AMD Radeon 680M | Samsung Galaxy Book2 15 Intel Core i7-1260P, Intel Arc A350M | |
|---|---|---|---|---|---|---|
| Heat | -6% | 0% | -5% | -35% | -15% | |
| Maximum Upper Side * | 35.6 | 39.1 -10% | 39.1 -10% | 35.7 -0% | 50.2 -41% | 44.6 -25% |
| Maximum Bottom * | 37.8 | 43.4 -15% | 36.1 4% | 36.8 3% | 50.2 -33% | 47.5 -26% |
| Idle Upper Side * | 24.2 | 24.3 -0% | 23.1 5% | 27.9 -15% | 32.1 -33% | 25.8 -7% |
| Idle Bottom * | 26 | 25.1 3% | 25.7 1% | 27.9 -7% | 34.6 -33% | 26.1 -0% |
* ... mindre är bättre
Stresstest
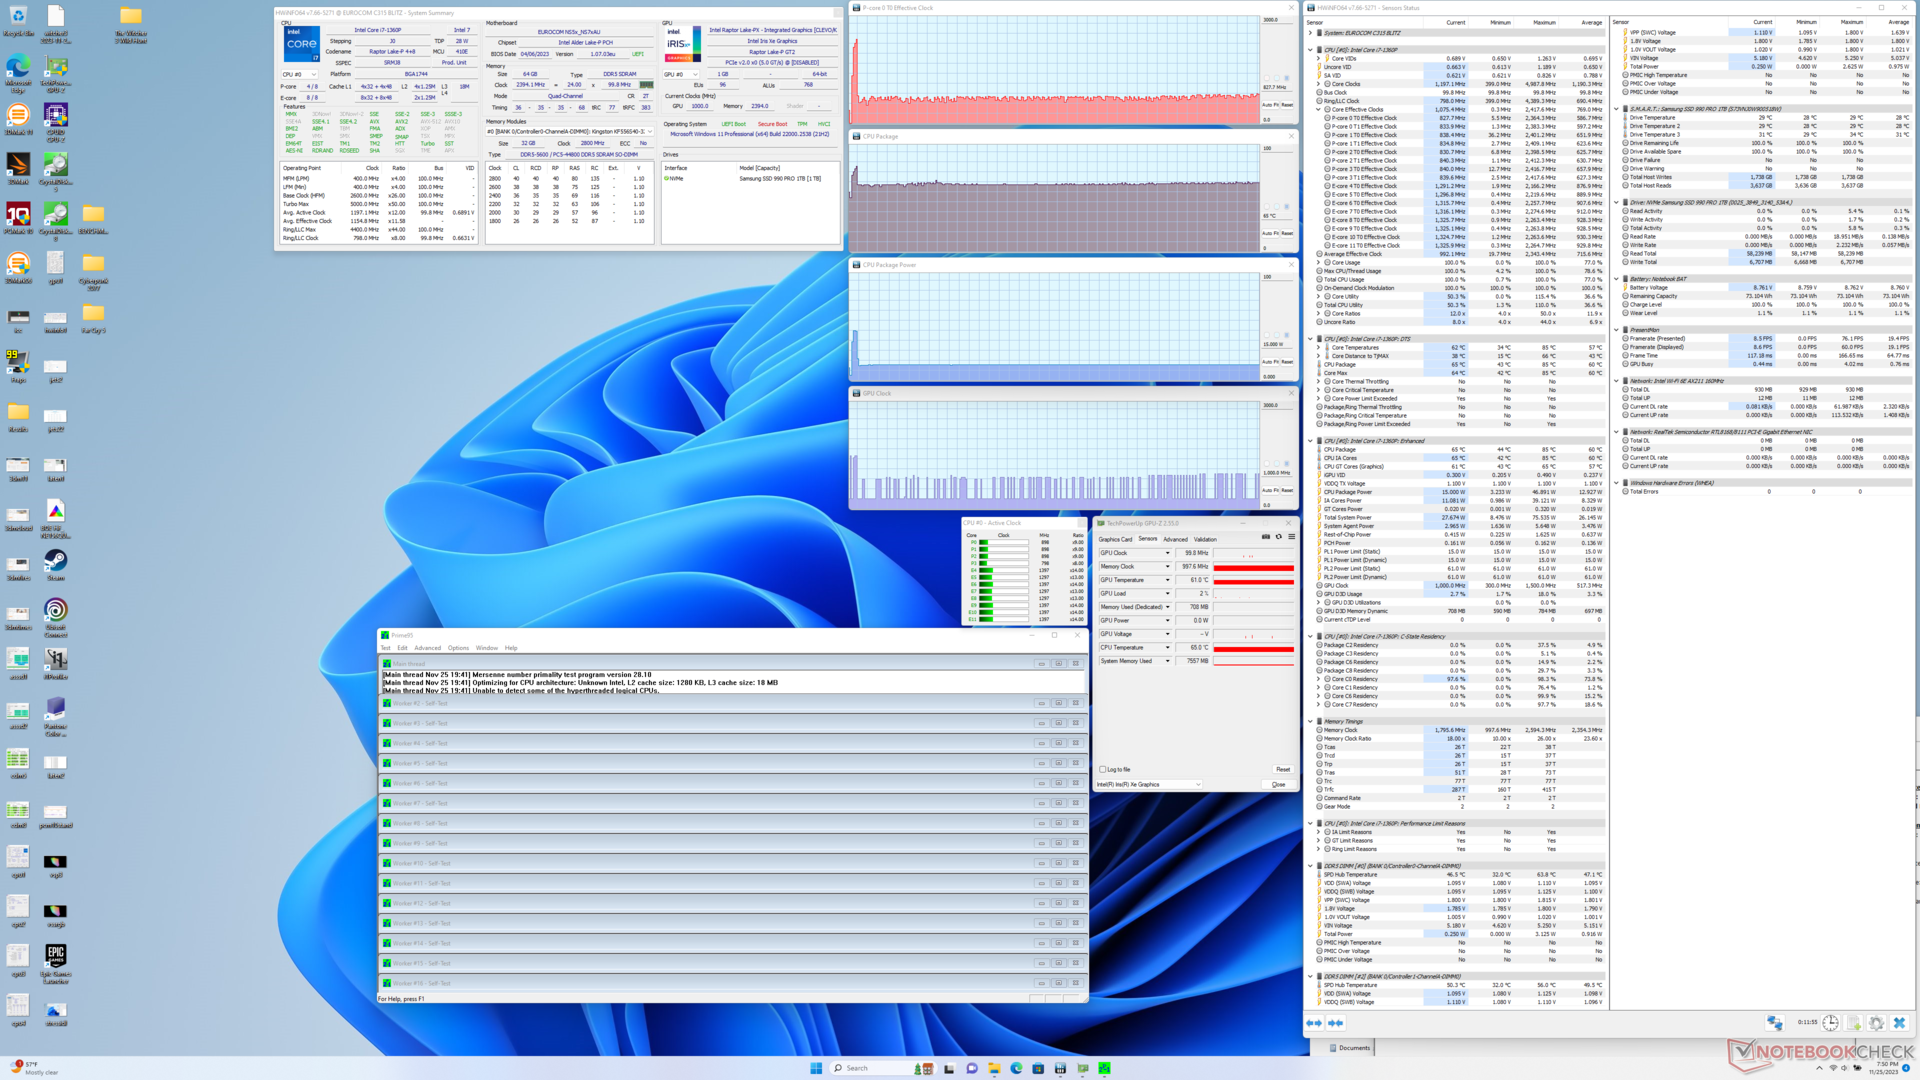
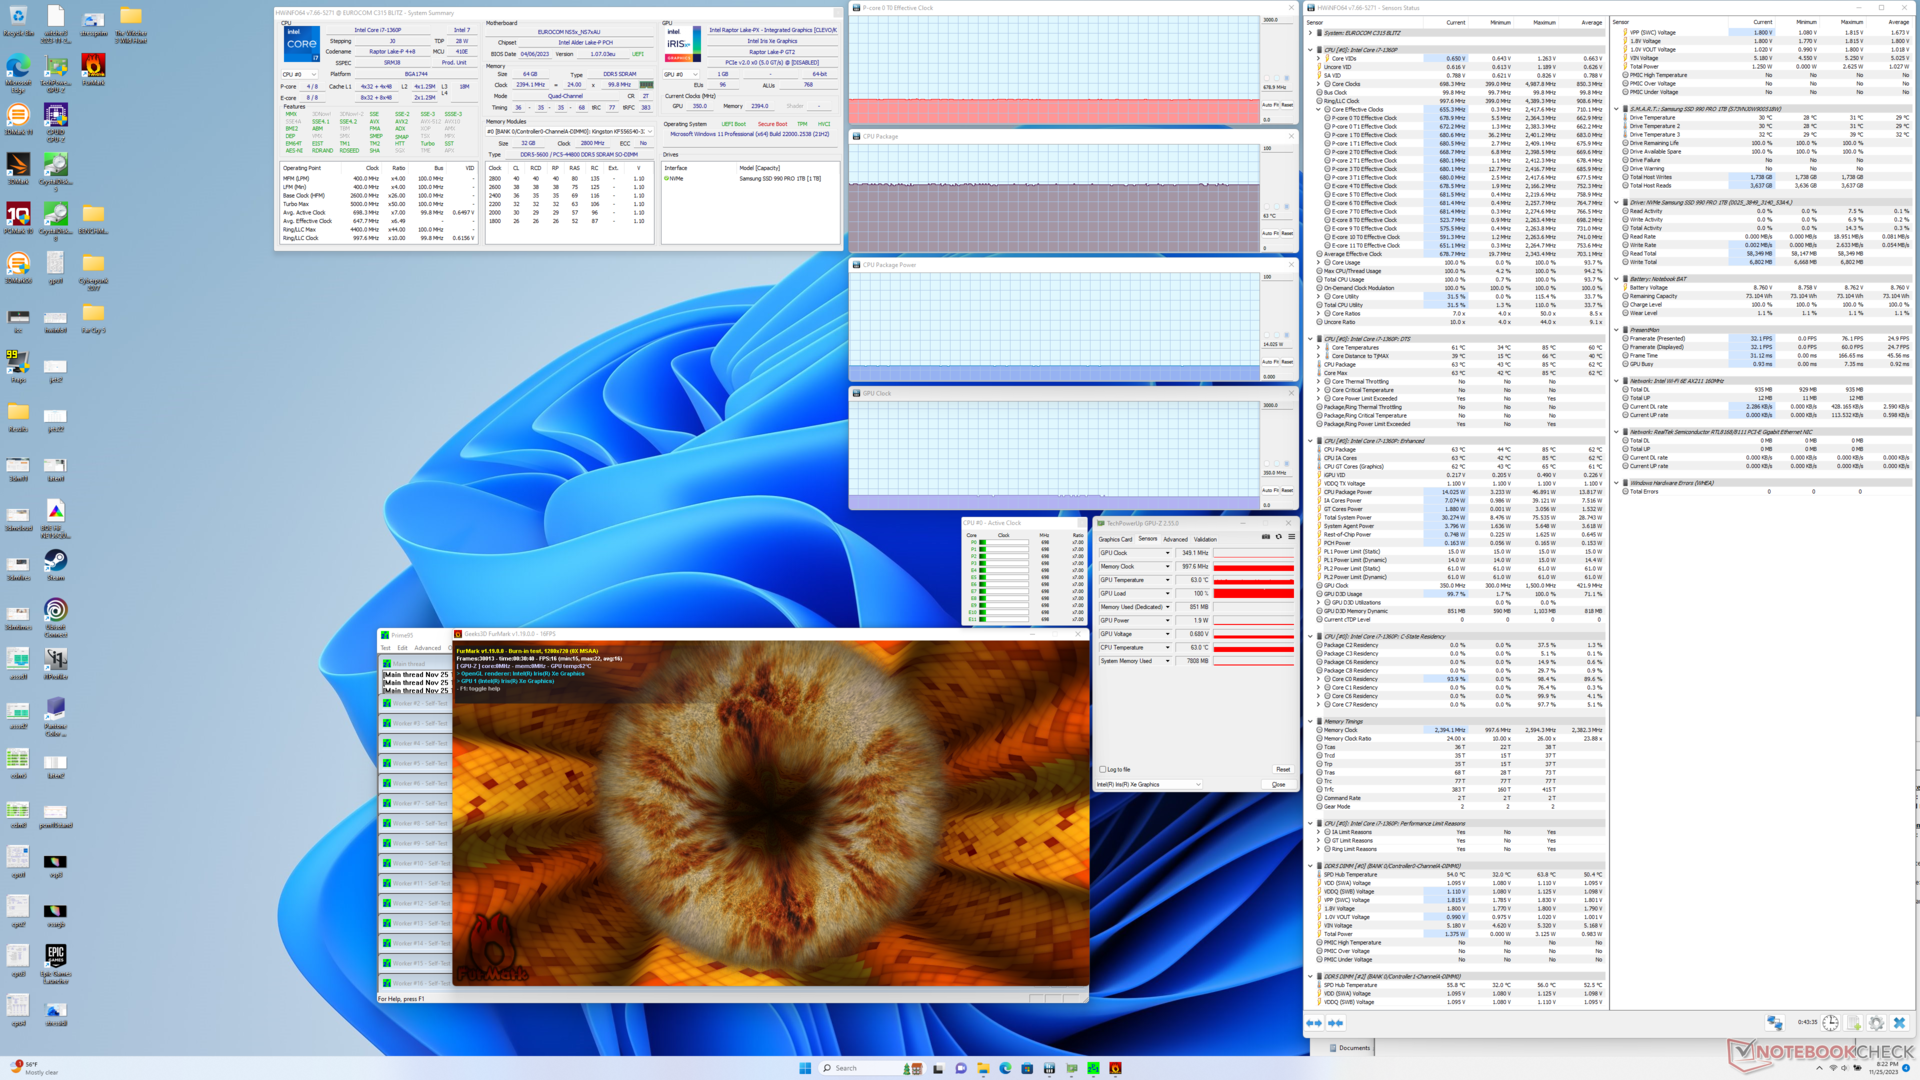
När Prime95-stressen initierades ökade processorn till 2,4 GHz, 47 W och 85 W under bara några sekunder innan den sjönk och stabiliserades vid 800 MHz - 1,3 GHz, 15 W och 65 W. Den kraftiga prestandaförsämringen stämmer överens med våra CineBench R15 xT-loopresultat ovan. Vi förväntade oss bättre prestanda eftersom Core P-serien är tänkt att vara ett steg mellan den långsammare U-serien och den kraftfullare H-serien, men dess beteende i vår Eurocom är istället typiskt för de flesta processorer i U-serien.
Kärntemperaturen stabiliserades på cirka 65 C vid krävande belastningar jämfört med 78 C på Schenker Work 15 med den äldre Core i7-11730H.
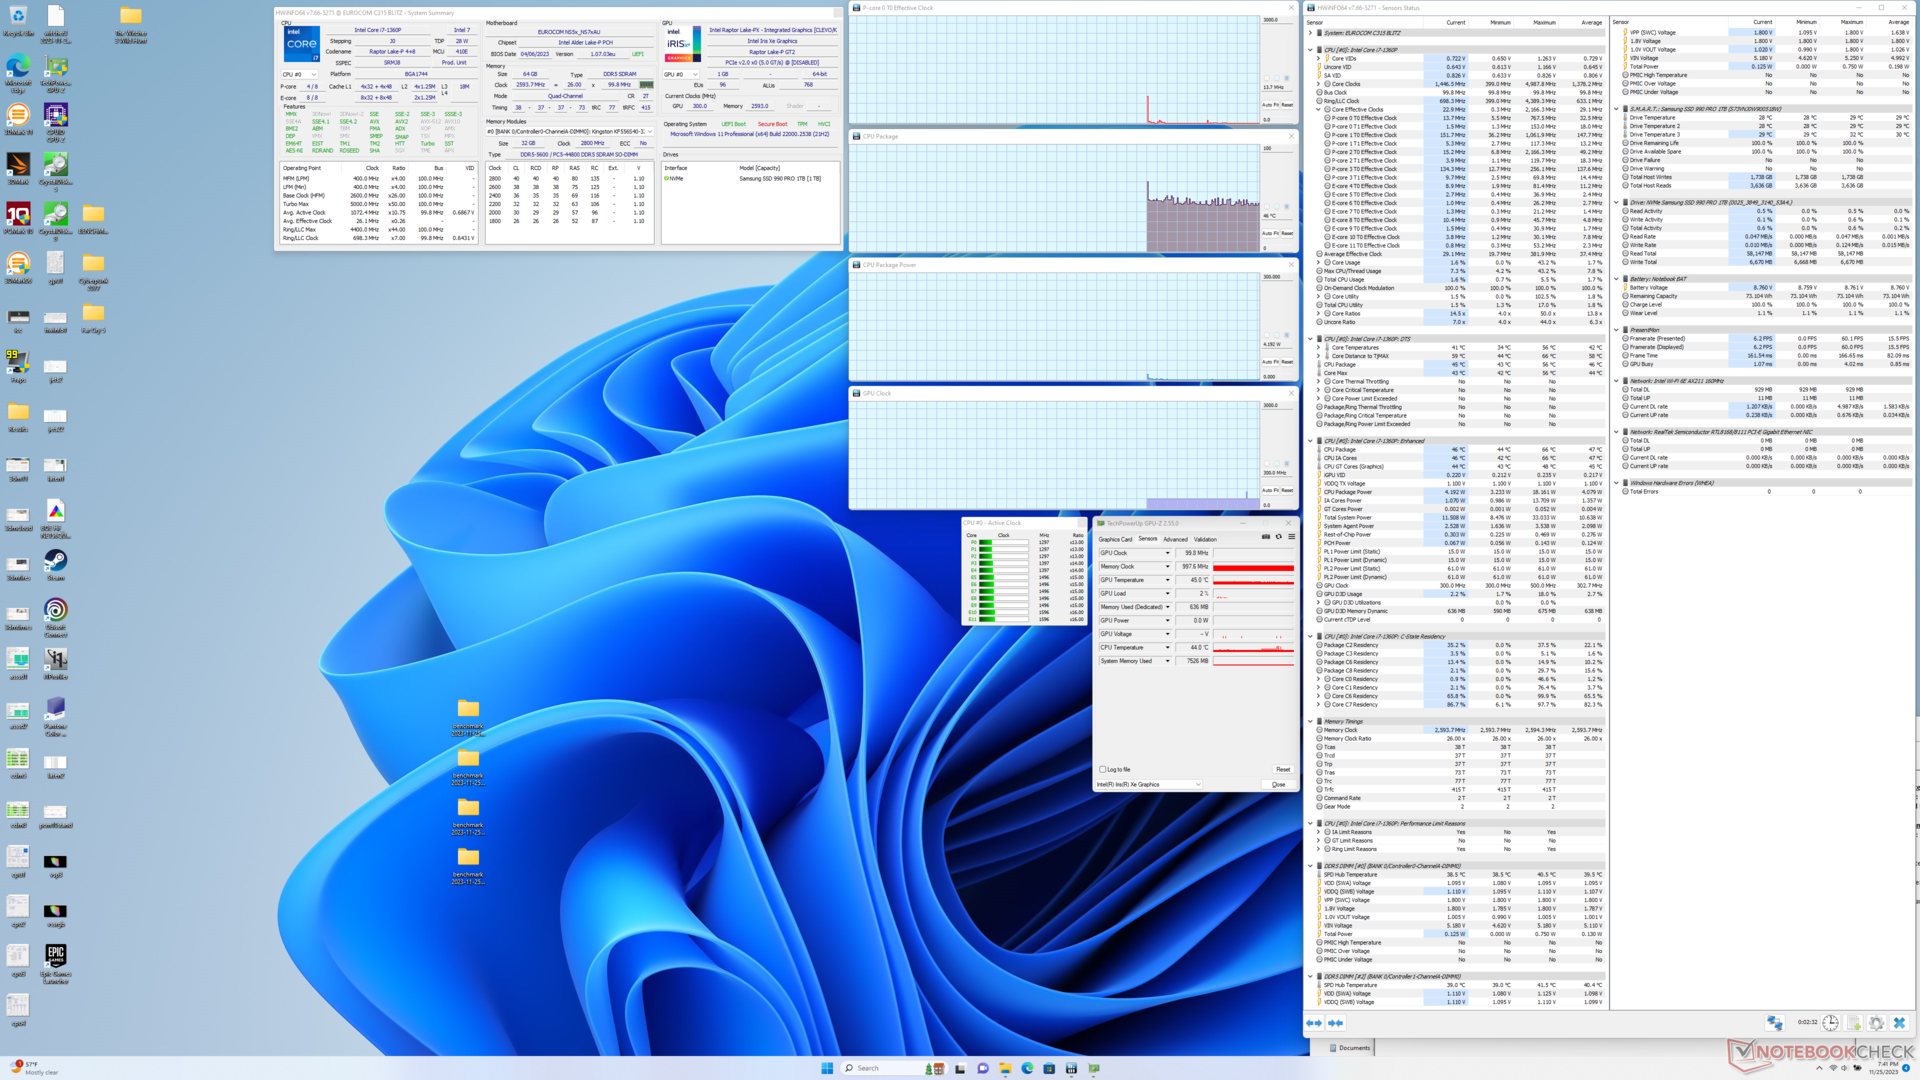
| CPU-klocka (GHz) | GPU-klocka (MHz) | Genomsnittlig CPU-temperatur (°C) | |
| System i viloläge | -- | -- | 46 |
| Prime95 Stress | 0,7 - 0,8 | -- | 65 |
| Prime95 + FurMark Stress | 0,7 | 350 | 63 |
| Witcher 3 Stress | ~0,4 | 900 | 64 |
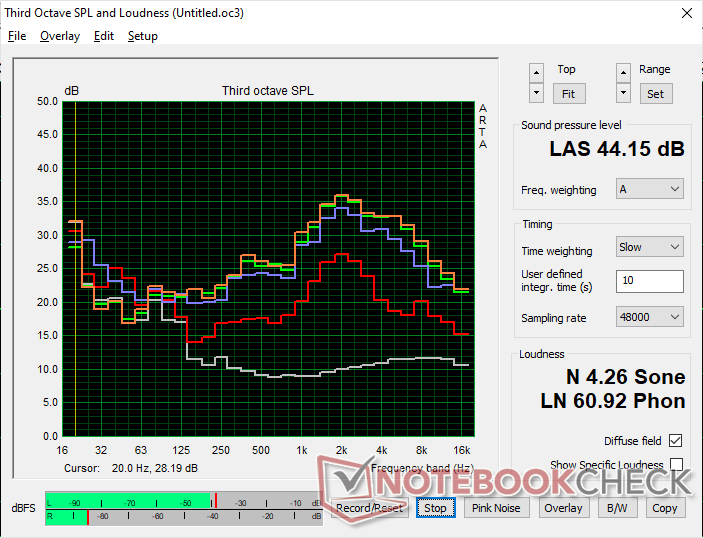
Högtalare
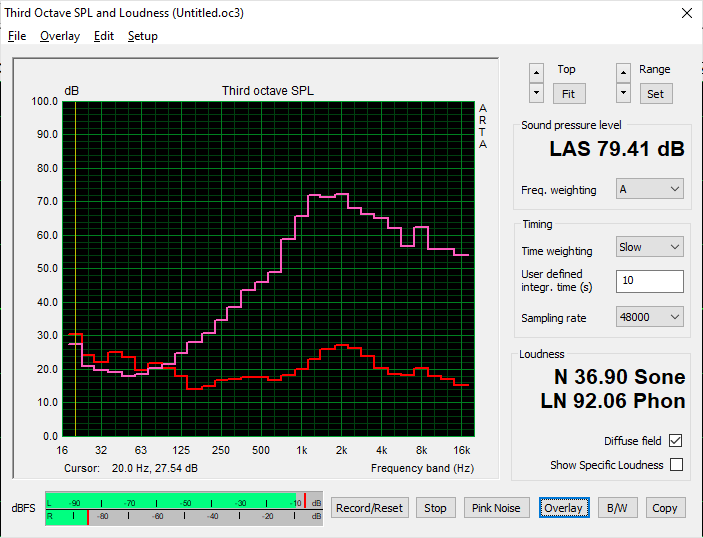
Eurocom C315 Blitz ljudanalys
(±) | högtalarljudstyrkan är genomsnittlig men bra (79.4 dB)
Bas 100 - 315 Hz
(-) | nästan ingen bas - i genomsnitt 26.1% lägre än medianen
(±) | linjäriteten för basen är genomsnittlig (8% delta till föregående frekvens)
Mellan 400 - 2000 Hz
(±) | högre mellan - i genomsnitt 11.2% högre än median
(±) | linjäriteten för mids är genomsnittlig (11.5% delta till föregående frekvens)
Högsta 2 - 16 kHz
(±) | högre toppar - i genomsnitt 6.6% högre än medianen
(±) | linjäriteten för toppar är genomsnittlig (10.4% delta till föregående frekvens)
Totalt 100 - 16 000 Hz
(-) | det totala ljudet är inte linjärt (35.6% skillnad mot median)
Jämfört med samma klass
» 97% av alla testade enheter i den här klassen var bättre, 1% liknande, 2% sämre
» Den bästa hade ett delta på 7%, genomsnittet var 21%, sämst var 53%
Jämfört med alla testade enheter
» 93% av alla testade enheter var bättre, 1% liknande, 6% sämre
» Den bästa hade ett delta på 4%, genomsnittet var 24%, sämst var 134%
Apple MacBook Pro 16 2021 M1 Pro ljudanalys
(+) | högtalare kan spela relativt högt (84.7 dB)
Bas 100 - 315 Hz
(+) | bra bas - bara 3.8% från medianen
(+) | basen är linjär (5.2% delta till föregående frekvens)
Mellan 400 - 2000 Hz
(+) | balanserad mellan - endast 1.3% från medianen
(+) | mids är linjära (2.1% delta till föregående frekvens)
Högsta 2 - 16 kHz
(+) | balanserade toppar - endast 1.9% från medianen
(+) | toppar är linjära (2.7% delta till föregående frekvens)
Totalt 100 - 16 000 Hz
(+) | det totala ljudet är linjärt (4.6% skillnad mot median)
Jämfört med samma klass
» 0% av alla testade enheter i den här klassen var bättre, 0% liknande, 100% sämre
» Den bästa hade ett delta på 5%, genomsnittet var 18%, sämst var 45%
Jämfört med alla testade enheter
» 0% av alla testade enheter var bättre, 0% liknande, 100% sämre
» Den bästa hade ett delta på 4%, genomsnittet var 24%, sämst var 134%
Energiförvaltning
Strömförbrukning
Tomgångskörning på skrivbordet drar några watt mer än Schenker Work 15, vilket sannolikt beror på vår 4K-skärm med högre upplösning. Förbrukningen skulle dock vara ungefär densamma i genomsnitt vid högre belastning trots eventuella prestanda- eller temperaturskillnader mellan Core i7-1360P och Core i7-11370H.
Vi kan registrera en maximal förbrukning på 87 W från den lilla (~12,5 x 4,8 x 3 cm) 90 W AC-adaptern när processorn utnyttjas till 100 procent. Detta behov är endast tillfälligt innan strypningen sätter in, vilket framgår av våra strömförbrukningsdiagram nedan.
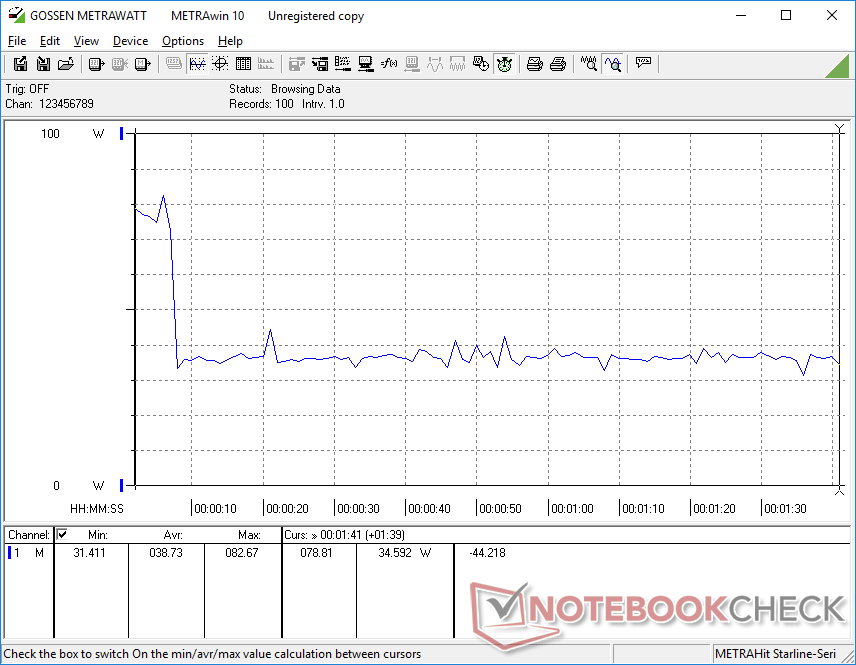
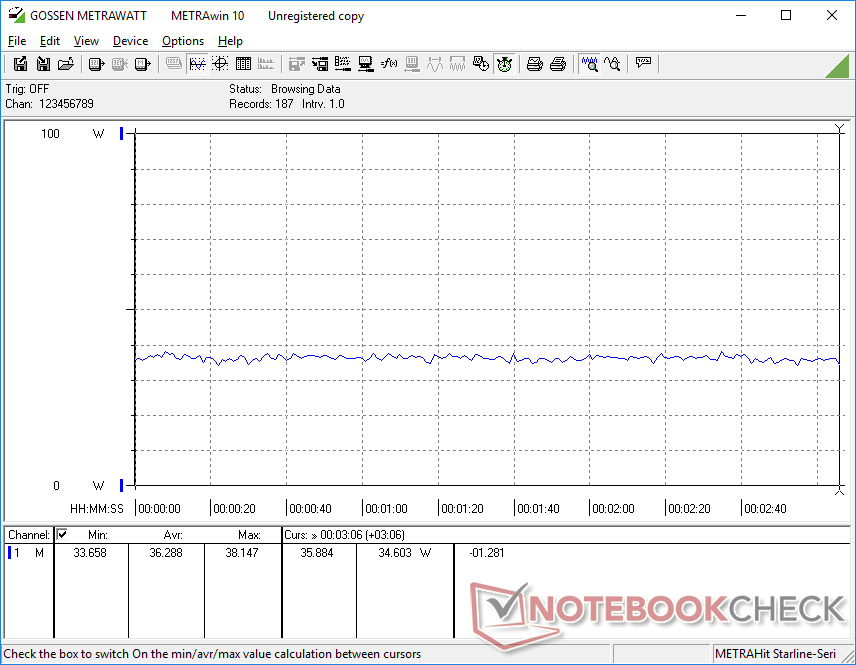
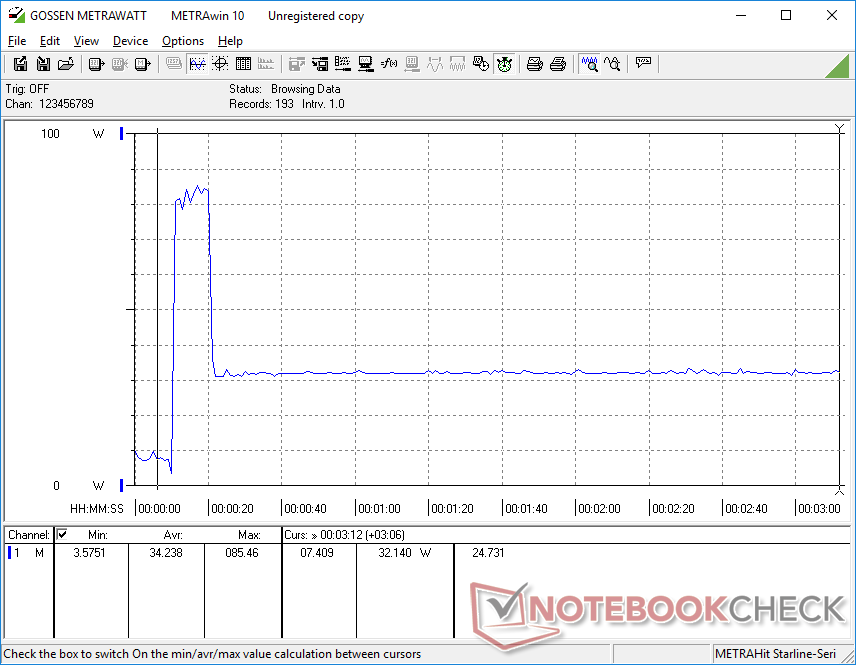
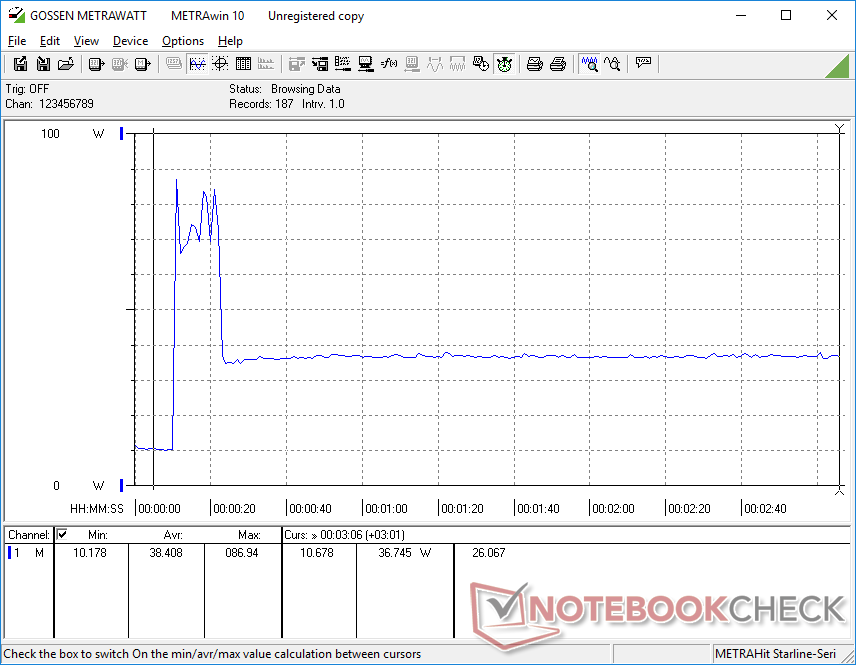
| Av/Standby | |
| Låg belastning | |
| Hög belastning |
|
Förklaring:
min: | |
| Eurocom C315 Blitz i7-1360P, Iris Xe G7 96EUs, Samsung 990 Pro 1 TB, IPS, 3840x2160, 15.6" | SCHENKER Work 15 Tiger Lake-H i7-11370H, Iris Xe G7 96EUs, Samsung SSD 980 Pro 1TB MZ-V8P1T0BW, IPS, 1920x1080, 15.6" | Lenovo ThinkPad L15 Gen 4 21H70021GE R7 PRO 7730U, Vega 8, SK hynix HFS512GEJ4X113N, IPS, 1920x1080, 15.6" | Acer Aspire 5 A515-58GM-76S8 i7-1355U, GeForce RTX 2050 Mobile, Micron 2450 1TB MTFDKBA1T0TFK, IPS, 1920x1080, 15.6" | Asus VivoBook S15 M3502RA-L1029W R7 6800H, Radeon 680M, WD PC SN735 SDBPNHH-512G, OLED, 1920x1080, 15.6" | Samsung Galaxy Book2 15 i7-1260P, A350M, Samsung PM991 MZVLQ512HBLU, IPS, 1920x1080, 15.6" | |
|---|---|---|---|---|---|---|
| Power Consumption | 18% | 22% | -6% | -5% | 6% | |
| Idle Minimum * | 9.4 | 4.5 52% | 4.5 52% | 4.31 54% | 4.4 53% | 4 57% |
| Idle Average * | 11.5 | 8.5 26% | 8.5 26% | 6.52 43% | 5.1 56% | 7.8 32% |
| Idle Maximum * | 12.1 | 9.1 25% | 10.5 13% | 8.037 34% | 9.3 23% | 8.5 30% |
| Load Average * | 38.7 | 43.5 -12% | 35.6 8% | 75.2 -94% | 67 -73% | 59.1 -53% |
| Witcher 3 ultra * | 36.3 | 37.5 -3% | 37.4 -3% | 60.8 -67% | 66.4 -83% | 56.7 -56% |
| Load Maximum * | 87 | 69.4 20% | 57.9 33% | 89.5 -3% | 93.5 -7% | 62.4 28% |
* ... mindre är bättre
Power Consumption Witcher 3 / Stresstest
Power Consumption external Monitor
Batteritid
WLAN-körtiden är märkbart kortare än på den äldre Schenker Work 15 med över 2 timmar. Skillnaden kan tillskrivas vår 4K-skärm med högre upplösning. Vår Core-P CPU skulle också öka till högre klockfrekvenser och förbrukningsnivåer än den äldre 11:e generationens Core i7 för att påverka batteritiden ännu mer.
Laddning från tom till full kapacitet tar drygt 90 minuter.
| Eurocom C315 Blitz i7-1360P, Iris Xe G7 96EUs, 73 Wh | SCHENKER Work 15 Tiger Lake-H i7-11370H, Iris Xe G7 96EUs, 73 Wh | Lenovo ThinkPad L15 Gen 4 21H70021GE R7 PRO 7730U, Vega 8, 57 Wh | Acer Aspire 5 A515-58GM-76S8 i7-1355U, GeForce RTX 2050 Mobile, 48 Wh | Asus VivoBook S15 M3502RA-L1029W R7 6800H, Radeon 680M, 70 Wh | Samsung Galaxy Book2 15 i7-1260P, A350M, 54 Wh | |
|---|---|---|---|---|---|---|
| Batteridrifttid | 29% | 50% | 9% | 45% | 4% | |
| WiFi v1.3 | 477 | 614 29% | 716 50% | 522 9% | 692 45% | 494 4% |
| Reader / Idle | 1472 | 1504 | ||||
| H.264 | 576 | 569 | 397 | 766 | 635 | |
| Load | 132.7 | 133 | 118 | 59 | 90 |
För
Emot
Slutsats - CPU-prestandan kan behöva förbättras något

Core i7-1360P hjälper till att särskilja Eurocom C315 Blitz från de flesta andra bärbara datorer eftersom detta CPU-alternativ är något ovanligt. Tyvärr stryps processorn alltför kraftigt på Eurocom till den punkt där den totala prestandan kan vara identisk med Core i7-11370H eller till och med långsammare än den billigare Core i5-1340P. DenLG Gram 2-i-1 16som levereras med samma Core i7-1360P-alternativ, kan köra processorn upp till 80 procent snabbare än vår Eurocom.
Eurocom C315 Blitz dras ned av den strypkänsliga Core i7-1360P-processorn och bristen på skärmalternativ.
Andra viktiga aspekter av modellen är bristfälliga när det gäller funktioner. 4K-panelen erbjuder till exempel inga DCI-P3-färger, höga uppdateringsfrekvenser eller HDR-stöd, vilket vissa yrkesverksamma eller multimediaanvändare kan värdesätta. Batteritiden och webbkamerakvaliteten är också bara genomsnittliga eller underväldigande.
Clevo X170KM-basen skulle verkligen behöva en ansiktslyftning med ytterligare prestandajustering, fläktljudjustering och skärmfunktioner, särskilt när man tänker på startpriset på 1300 USD. Prisintervallet 1000 till 1500 USD är redan extremt konkurrenskraftigt i detta utrymme med professionella alternativ som Lenovo ThinkPad L15, HP ProBook eller Dell Latitude -serien.
Pris och tillgänglighet
Eurocom levererar nu c315 Blitz från $1300 USD för baskonfigurationen till över $2500 om den konfigureras med 64 GB RAM och en 1 TB SSD som vår.
Eurocom C315 Blitz
- 11/29/2023 v7 (old)
Allen Ngo
Genomskinlighet
Valet av enheter som ska granskas görs av vår redaktion. Testprovet gavs till författaren som ett lån av tillverkaren eller återförsäljaren för denna recension. Långivaren hade inget inflytande på denna recension och inte heller fick tillverkaren en kopia av denna recension innan publiceringen. Det fanns ingen skyldighet att publicera denna recension. Vi accepterar aldrig ersättning eller betalning i utbyte mot våra recensioner. Som ett oberoende medieföretag är Notebookcheck inte föremål för auktoritet från tillverkare, återförsäljare eller förlag.
This is how Notebookcheck is testingEvery year, Notebookcheck independently reviews hundreds of laptops and smartphones using standardized procedures to ensure that all results are comparable. We have continuously developed our test methods for around 20 years and set industry standards in the process. In our test labs, high-quality measuring equipment is utilized by experienced technicians and editors. These tests involve a multi-stage validation process. Our complex rating system is based on hundreds of well-founded measurements and benchmarks, which maintains objectivity.
Price comparison

