Granskning av Dell Precision 5490 arbetsstation: Nu med Intel Meteor Lake-H vPro
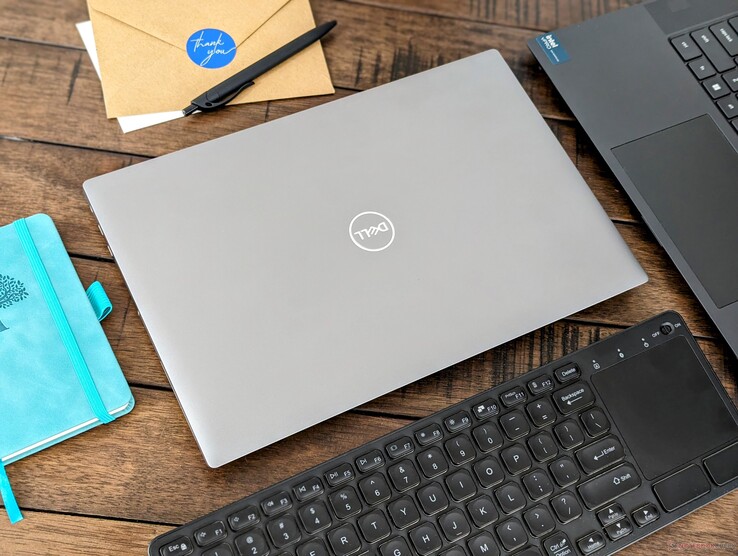
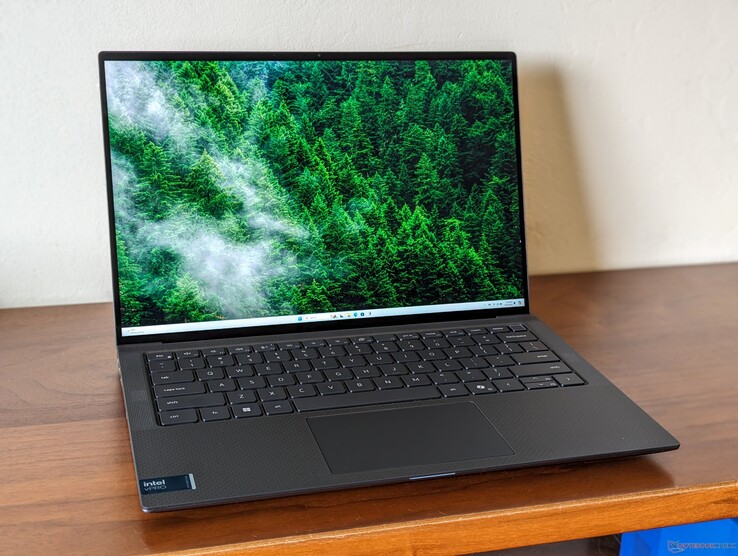
2024 Precision 5490 är en uppdatering av förra årets Precision 5480. Den senaste modellen använder samma chassidesign som både Precision 5480 och 5470 vilket innebär att alla våra befintliga kommentarer om de fysiska egenskaperna hos Precision 5470 fortfarande gäller här för 5490.
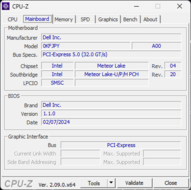
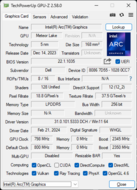
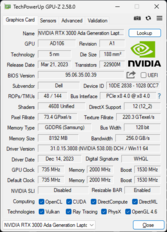
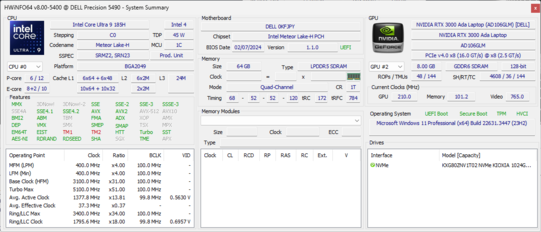
Vår testenhet är toppkonfigurationen med Meteor Lake-H Core Ultra 9 185H CPU för att ersätta förra årets Raptor Lake-H-alternativ. Annars förblir allt annat detsamma, inklusive QHD+ 2560 x 1600 IPS-pekskärm och 50 W Nvidia RTX 3000 Ada GPU. Mindre SKU:er kan levereras med Core Ultra 5 135H, FHD + 1920 x 1200-skärm och endast integrerad Arc-grafik istället.
Direkta konkurrenter till Precision 5490 inkluderar andra ultraportabla 14-tums arbetsstationer som Lenovo ThinkPad P14s eller HP ZBook Firefly 14 G10.
Fler recensioner av Dell:
Potentiella konkurrenter i jämförelse
Gradering | Datum | Modell | Vikt | Höjd | Storlek | Upplösning | Pris |
|---|---|---|---|---|---|---|---|
| 89.3 % v7 (old) | 04/2024 | Dell Precision 5000 5490 Ultra 9 185H, NVIDIA RTX 3000 Ada Generation Laptop GPU | 1.6 kg | 18.95 mm | 14.00" | 2560x1600 | |
| 81 % | 07/2024 | Lenovo ThinkPad P14s G4 21HF0017GE i7-1370P, RTX A500 Laptop GPU | 1.5 kg | 22.7 mm | 14.00" | 2880x1800 | |
| 87.4 % v7 (old) | 10/2023 | HP ZBook Firefly 14 G10 A R5 PRO 7640HS, Radeon 760M | 1.5 kg | 20 mm | 14.00" | 1920x1200 | |
| 87.4 % v7 (old) | 01/2023 | HP ZBook Firefly 14 G9-6B8A2EA i7-1265U, T550 Laptop GPU | 1.5 kg | 19.9 mm | 14.00" | 1920x1200 | |
| 89.6 % v7 (old) | 09/2023 | Dell Precision 5480 i9-13900H, NVIDIA RTX 3000 Ada Generation Laptop GPU | 1.6 kg | 18.95 mm | 14.00" | 2560x1600 | |
| 87.6 % v7 (old) | 09/2022 | Dell Precision 5000 5470 i9-12900H, RTX A1000 Laptop GPU | 1.6 kg | 18.95 mm | 14.00" | 2560x1600 |
Topp 10...
» Topp 10: Bästa bärbara allround/multimediadatorerna
» Topp 10: Bästa bärbara speldatorerna
» Topp 10: Bärbara budget/kontorsdatorer
» Topp 10: Bästa bärbara kontors/premiumdatorerna
» Topp 10: Bärbara arbetsstationer
» Topp 10: De bästa små/kompakta bärbara datorerna
» Topp 10: Bästa ultrabooks
» Topp 10: Bästa hybriddatorerna
» Topp 10: Bästa surfplattorna
» Topp 10: Marknadens bästa smartphones
Fodral - Inspirerad av XPS
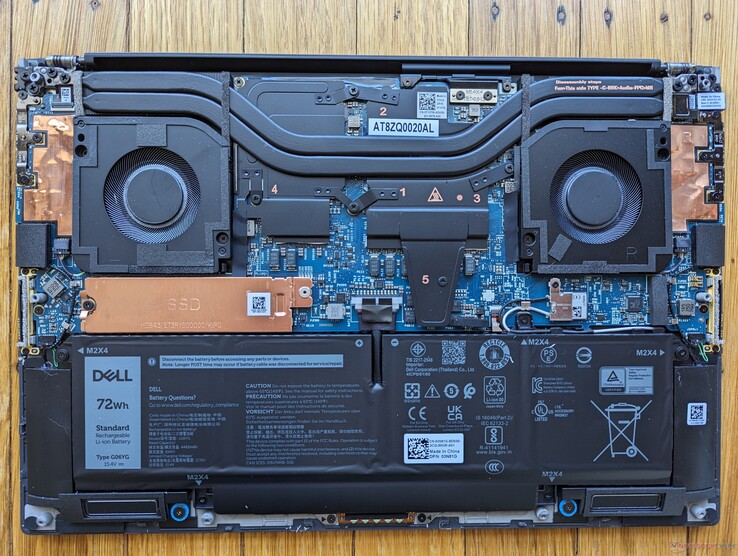
Det enklaste sättet att visuellt skilja Precision 5490 från Precision 5480 eller 5470 är att leta efter den nya Co-Pilot-tangenten på tangentbordet. Microsoft kräver denna dedikerade tangent från alla större tillverkare framöver för att bättre kunna stödja kommande Windows AI-funktioner. I övrigt finns det inga andra förändringar i chassit. Vi rekommenderar att du kollar in vår recension på Precision 5470 för mer information.
Observera att MicroSD-kortläsaren förblir valfri.
Anslutningsmöjligheter
Kommunikation
Årets modell innehåller Intel BE200 för att vara Wi-Fi 7-kompatibel.
| Networking | |
| iperf3 transmit AXE11000 | |
| Dell Precision 5480 | |
| Dell Precision 5000 5490 | |
| HP ZBook Firefly 14 G10 A | |
| Lenovo ThinkPad P14s G4 21HF0017GE | |
| iperf3 receive AXE11000 | |
| HP ZBook Firefly 14 G10 A | |
| Lenovo ThinkPad P14s G4 21HF0017GE | |
| Dell Precision 5480 | |
| Dell Precision 5000 5490 | |
| iperf3 transmit AXE11000 6GHz | |
| Dell Precision 5000 5490 | |
| Dell Precision 5480 | |
| Dell Precision 5000 5470 | |
| Lenovo ThinkPad P14s G4 21HF0017GE | |
| iperf3 receive AXE11000 6GHz | |
| Lenovo ThinkPad P14s G4 21HF0017GE | |
| Dell Precision 5000 5490 | |
| Dell Precision 5480 | |
| Dell Precision 5000 5470 | |
Webbkamera
Skärm - gammal hederlig IPS
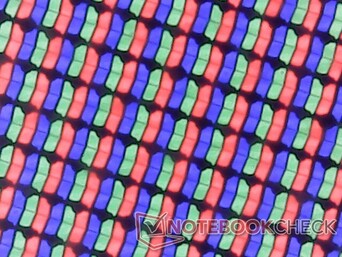
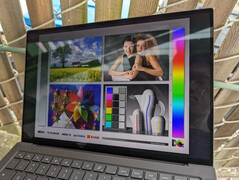
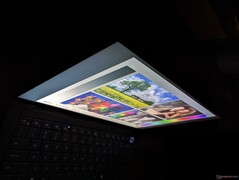
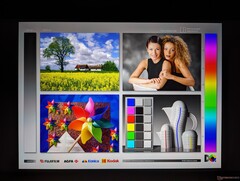
AU Optronics är återigen leverantör av QHD+-panelen för tredje året i rad. Panelen var enastående när den först lanserades för Precision 5470, men den börjar nu visa sin ålder i och med nyare OLED-alternativ och alternativ med högre uppdateringsfrekvens. Lenovo ThinkPad Lenovo ThinkPad P14s G4levereras till exempel med ett 1800p OLED-alternativ som inte är tillgängligt på Precision 5490.
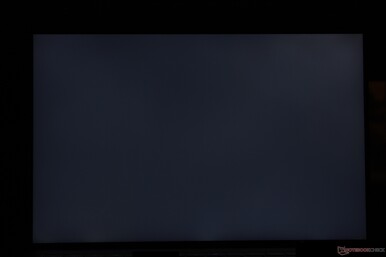
| |||||||||||||||||||||||||
Distribution av ljusstyrkan: 90 %
Mitt på batteriet: 485.1 cd/m²
Kontrast: 1277:1 (Svärta: 0.38 cd/m²)
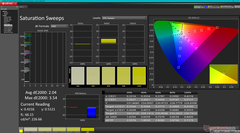
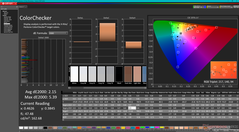
ΔE Color 2.15 | 0.5-29.43 Ø4.87, calibrated: 0.67
ΔE Greyscale 2 | 0.5-98 Ø5.1
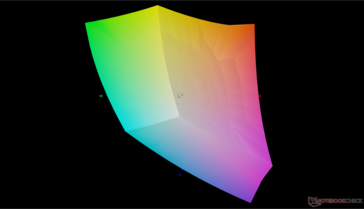
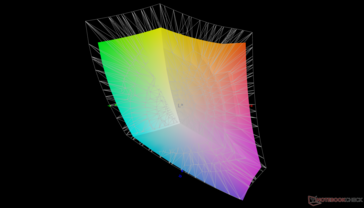
79.5% AdobeRGB 1998 (Argyll 2.2.0 3D)
100% sRGB (Argyll 2.2.0 3D)
79.7% Display P3 (Argyll 2.2.0 3D)
Gamma: 2.3
| Dell Precision 5000 5490 AU Optronics B140QAN, IPS, 2560x1600, 14" | Lenovo ThinkPad P14s G4 21HF0017GE ATNA40YK15-0, OLED, 2880x1800, 14" | HP ZBook Firefly 14 G10 A CMN1435, IPS, 1920x1200, 14" | HP ZBook Firefly 14 G9-6B8A2EA CMN1435, IPS, 1920x1200, 14" | Dell Precision 5480 AU Optronics B140QAN, IPS, 2560x1600, 14" | Dell Precision 5000 5470 AU Optronics B140QAN, IPS, 2560x1600, 14" | |
|---|---|---|---|---|---|---|
| Display | 16% | -9% | -8% | -2% | -1% | |
| Display P3 Coverage | 79.7 | 99.9 25% | 68.7 -14% | 69.6 -13% | 77.6 -3% | 79.3 -1% |
| sRGB Coverage | 100 | 100 0% | 98.2 -2% | 99.9 0% | 99.8 0% | 100 0% |
| AdobeRGB 1998 Coverage | 79.5 | 97 22% | 70.8 -11% | 71.1 -11% | 78 -2% | 78.7 -1% |
| Response Times | 94% | 9% | 7% | 20% | 2% | |
| Response Time Grey 50% / Grey 80% * | 52.3 ? | 3 ? 94% | 56.2 ? -7% | 56.3 ? -8% | 43.9 ? 16% | 52.4 ? -0% |
| Response Time Black / White * | 33.3 ? | 2.2 ? 93% | 25.2 ? 24% | 26.2 ? 21% | 25.3 ? 24% | 32.4 ? 3% |
| PWM Frequency | 360 ? | |||||
| Screen | -121% | -8% | -19% | 4% | -3% | |
| Brightness middle | 485.1 | 432 -11% | 397 -18% | 432 -11% | 472.8 -3% | 537 11% |
| Brightness | 471 | 432 -8% | 367 -22% | 407 -14% | 469 0% | 518 10% |
| Brightness Distribution | 90 | 98 9% | 86 -4% | 91 1% | 87 -3% | 94 4% |
| Black Level * | 0.38 | 0.25 34% | 0.28 26% | 0.35 8% | 0.33 13% | |
| Contrast | 1277 | 1588 24% | 1543 21% | 1351 6% | 1627 27% | |
| Colorchecker dE 2000 * | 2.15 | 4.8 -123% | 2.35 -9% | 3.1 -44% | 2.1 2% | 2.97 -38% |
| Colorchecker dE 2000 max. * | 5.39 | 9.2 -71% | 4.68 13% | 5.6 -4% | 5.54 -3% | 5.33 1% |
| Colorchecker dE 2000 calibrated * | 0.67 | 4.9 -631% | 1.15 -72% | 0.8 -19% | 0.59 12% | 0.88 -31% |
| Greyscale dE 2000 * | 2 | 2.3 -15% | 2.4 -20% | 4.5 -125% | 1.7 15% | 2.4 -20% |
| Gamma | 2.3 96% | 2.23 99% | 2.067 106% | 2 110% | 2.26 97% | 2.06 107% |
| CCT | 6826 95% | 6391 102% | 6409 101% | 6528 100% | 6493 100% | 6668 97% |
| Totalt genomsnitt (program/inställningar) | -4% /
-51% | -3% /
-6% | -7% /
-13% | 7% /
5% | -1% /
-2% |
* ... mindre är bättre
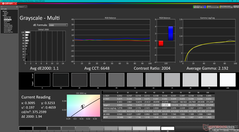
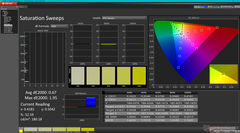
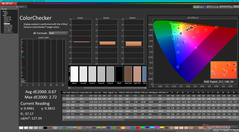
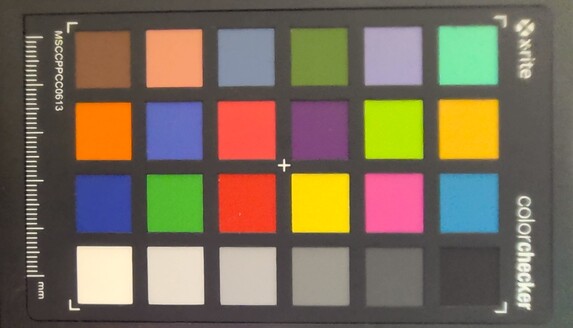
Skärmen är välkalibrerad direkt från förpackningen med genomsnittliga deltaE-värden för gråskala och färg på bara 2 respektive 2,15. Endast sRGB stöds fullt ut i alla konfigurationer.
Visa svarstider
| ↔ Svarstid svart till vitt | ||
|---|---|---|
| 33.3 ms ... stiga ↗ och falla ↘ kombinerat | ↗ 16.2 ms stiga | |
| ↘ 17.1 ms hösten | ||
| Skärmen visar långsamma svarsfrekvenser i våra tester och kommer att vara otillfredsställande för spelare. I jämförelse sträcker sig alla testade enheter från 0.1 (minst) till 240 (maximalt) ms. » 89 % av alla enheter är bättre. Detta innebär att den uppmätta svarstiden är sämre än genomsnittet av alla testade enheter (20.8 ms). | ||
| ↔ Svarstid 50 % grått till 80 % grått | ||
| 52.3 ms ... stiga ↗ och falla ↘ kombinerat | ↗ 23.6 ms stiga | |
| ↘ 28.7 ms hösten | ||
| Skärmen visar långsamma svarsfrekvenser i våra tester och kommer att vara otillfredsställande för spelare. I jämförelse sträcker sig alla testade enheter från 0.165 (minst) till 636 (maximalt) ms. » 88 % av alla enheter är bättre. Detta innebär att den uppmätta svarstiden är sämre än genomsnittet av alla testade enheter (32.5 ms). | ||
Skärmflimmer / PWM (Puls-Width Modulation)
| Skärmflimmer / PWM upptäcktes inte | |||
Som jämförelse: 53 % av alla testade enheter använder inte PWM för att dämpa skärmen. Om PWM upptäcktes mättes ett medelvärde av 8516 (minst: 5 - maximum: 343500) Hz. | |||
Prestanda - Allt om AI
Testförhållanden
Processor
Rå CPU-prestanda är oförändrad jämfört med Core i9-13900H i förra årets Precision 5480. Eventuella fördelar är i bästa fall marginella, upp till 5 procent, men även detta lilla delta kan krympa när Turbo Boost-begränsningar beaktas, vilket visas av våra CineBench R15 xT-loopresultat nedan.
Om integrerade AI-funktioner är oviktiga, då är den billigare Ryzen 7 Pro 7840HS på konkurrerande modeller som HP Firefly 14-serien ge i stort sett samma prestanda som den nyare Core Ultra 9 185H.
Nedgradering till Core Ultra 5 135H förväntas påverka processorns prestanda med 15 till 20 procent baserat på vår erfarenhet med Core i5-13500H bärbara datorer.
Cinebench R15 Multi Loop
Cinebench R23: Multi Core | Single Core
Cinebench R20: CPU (Multi Core) | CPU (Single Core)
Cinebench R15: CPU Multi 64Bit | CPU Single 64Bit
Blender: v2.79 BMW27 CPU
7-Zip 18.03: 7z b 4 | 7z b 4 -mmt1
Geekbench 6.4: Multi-Core | Single-Core
Geekbench 5.5: Multi-Core | Single-Core
HWBOT x265 Benchmark v2.2: 4k Preset
LibreOffice : 20 Documents To PDF
R Benchmark 2.5: Overall mean
| CPU Performance Rating | |
| Dell Precision 5480 | |
| Genomsnitt Intel Core Ultra 9 185H | |
| HP ZBook Power 15 G10 | |
| Dell Precision 5000 5490 | |
| Lenovo ThinkPad P14s G4 21HF0017GE | |
| Lenovo ThinkPad P14s G4 21K5000LGE | |
| HP ZBook Power 15 G9 6B8C4EA -2! | |
| Dell Precision 5000 5470 -2! | |
| Asus VivoBook 14X K3405 -2! | |
| HP ZBook Firefly 14 G10 A | |
| Lenovo ThinkPad P14s G3 AMD 21J6S05000 -2! | |
| HP ZBook Firefly 14 G9-6B8A2EA -2! | |
| Lenovo ThinkPad P15v G3 21EM001AGE -2! | |
| Dell Precision 5000 5560 -4! | |
| Lenovo ThinkPad P15v G2 21A9000XGE -3! | |
| Lenovo ThinkPad P14s Gen1-20Y10002GE -2! | |
| Cinebench R23 / Single Core | |
| Dell Precision 5480 | |
| Lenovo ThinkPad P14s G4 21HF0017GE | |
| Genomsnitt Intel Core Ultra 9 185H (1166 - 1912, n=19) | |
| Dell Precision 5000 5470 | |
| HP ZBook Power 15 G10 | |
| Dell Precision 5000 5490 | |
| HP ZBook Power 15 G9 6B8C4EA | |
| HP ZBook Firefly 14 G9-6B8A2EA | |
| Lenovo ThinkPad P14s G4 21K5000LGE | |
| Asus VivoBook 14X K3405 | |
| HP ZBook Firefly 14 G10 A | |
| Lenovo ThinkPad P14s G3 AMD 21J6S05000 | |
| Dell Precision 5000 5560 | |
| Lenovo ThinkPad P15v G3 21EM001AGE | |
| Lenovo ThinkPad P14s Gen1-20Y10002GE | |
| Cinebench R15 / CPU Multi 64Bit | |
| Dell Precision 5000 5490 | |
| Genomsnitt Intel Core Ultra 9 185H (1582 - 3165, n=21) | |
| HP ZBook Power 15 G10 | |
| Dell Precision 5480 | |
| Lenovo ThinkPad P14s G4 21HF0017GE | |
| Dell Precision 5000 5470 | |
| Lenovo ThinkPad P14s G4 21K5000LGE | |
| Asus VivoBook 14X K3405 | |
| Lenovo ThinkPad P15v G3 21EM001AGE | |
| HP ZBook Power 15 G9 6B8C4EA | |
| Lenovo ThinkPad P14s G3 AMD 21J6S05000 | |
| HP ZBook Firefly 14 G10 A | |
| Lenovo ThinkPad P15v G2 21A9000XGE | |
| Dell Precision 5000 5560 | |
| HP ZBook Firefly 14 G9-6B8A2EA | |
| Lenovo ThinkPad P14s Gen1-20Y10002GE | |
| Cinebench R15 / CPU Single 64Bit | |
| Dell Precision 5480 | |
| HP ZBook Power 15 G10 | |
| Lenovo ThinkPad P14s G4 21K5000LGE | |
| Lenovo ThinkPad P14s G4 21HF0017GE | |
| Genomsnitt Intel Core Ultra 9 185H (191.9 - 281, n=19) | |
| Dell Precision 5000 5490 | |
| HP ZBook Power 15 G9 6B8C4EA | |
| HP ZBook Firefly 14 G9-6B8A2EA | |
| Asus VivoBook 14X K3405 | |
| HP ZBook Firefly 14 G10 A | |
| Dell Precision 5000 5470 | |
| Lenovo ThinkPad P14s G3 AMD 21J6S05000 | |
| Dell Precision 5000 5560 | |
| Lenovo ThinkPad P15v G2 21A9000XGE | |
| Lenovo ThinkPad P14s Gen1-20Y10002GE | |
| Lenovo ThinkPad P15v G3 21EM001AGE | |
| Geekbench 6.4 / Multi-Core | |
| Dell Precision 5480 | |
| Dell Precision 5000 5490 | |
| Genomsnitt Intel Core Ultra 9 185H (9140 - 14540, n=19) | |
| HP ZBook Power 15 G10 | |
| Lenovo ThinkPad P14s G4 21HF0017GE | |
| Lenovo ThinkPad P14s G4 21K5000LGE | |
| HP ZBook Firefly 14 G10 A | |
| Geekbench 6.4 / Single-Core | |
| Dell Precision 5480 | |
| Lenovo ThinkPad P14s G4 21HF0017GE | |
| HP ZBook Power 15 G10 | |
| Lenovo ThinkPad P14s G4 21K5000LGE | |
| Genomsnitt Intel Core Ultra 9 185H (1490 - 2573, n=19) | |
| Dell Precision 5000 5490 | |
| HP ZBook Firefly 14 G10 A | |
| Geekbench 5.5 / Multi-Core | |
| Dell Precision 5480 | |
| Genomsnitt Intel Core Ultra 9 185H (9330 - 14230, n=19) | |
| Dell Precision 5000 5490 | |
| Dell Precision 5000 5470 | |
| HP ZBook Power 15 G10 | |
| Lenovo ThinkPad P14s G4 21HF0017GE | |
| HP ZBook Power 15 G9 6B8C4EA | |
| Lenovo ThinkPad P14s G4 21K5000LGE | |
| Asus VivoBook 14X K3405 | |
| HP ZBook Firefly 14 G10 A | |
| HP ZBook Firefly 14 G9-6B8A2EA | |
| Lenovo ThinkPad P15v G3 21EM001AGE | |
| Lenovo ThinkPad P14s G3 AMD 21J6S05000 | |
| Lenovo ThinkPad P15v G2 21A9000XGE | |
| Lenovo ThinkPad P14s Gen1-20Y10002GE | |
| Geekbench 5.5 / Single-Core | |
| HP ZBook Power 15 G10 | |
| Dell Precision 5480 | |
| Lenovo ThinkPad P14s G4 21HF0017GE | |
| Dell Precision 5000 5470 | |
| Genomsnitt Intel Core Ultra 9 185H (986 - 1902, n=19) | |
| Dell Precision 5000 5490 | |
| HP ZBook Firefly 14 G10 A | |
| Lenovo ThinkPad P14s G4 21K5000LGE | |
| HP ZBook Power 15 G9 6B8C4EA | |
| HP ZBook Firefly 14 G9-6B8A2EA | |
| Asus VivoBook 14X K3405 | |
| Lenovo ThinkPad P14s G3 AMD 21J6S05000 | |
| Lenovo ThinkPad P15v G2 21A9000XGE | |
| Lenovo ThinkPad P15v G3 21EM001AGE | |
| Lenovo ThinkPad P14s Gen1-20Y10002GE | |
| HWBOT x265 Benchmark v2.2 / 4k Preset | |
| HP ZBook Power 15 G10 | |
| Genomsnitt Intel Core Ultra 9 185H (14.1 - 22.7, n=19) | |
| Dell Precision 5480 | |
| Dell Precision 5000 5490 | |
| Lenovo ThinkPad P14s G4 21K5000LGE | |
| HP ZBook Power 15 G9 6B8C4EA | |
| Asus VivoBook 14X K3405 | |
| Lenovo ThinkPad P14s G4 21HF0017GE | |
| HP ZBook Firefly 14 G10 A | |
| Dell Precision 5000 5470 | |
| Lenovo ThinkPad P14s G3 AMD 21J6S05000 | |
| Lenovo ThinkPad P15v G3 21EM001AGE | |
| Dell Precision 5000 5560 | |
| Lenovo ThinkPad P15v G2 21A9000XGE | |
| HP ZBook Firefly 14 G9-6B8A2EA | |
| Lenovo ThinkPad P14s Gen1-20Y10002GE | |
| LibreOffice / 20 Documents To PDF | |
| Lenovo ThinkPad P15v G3 21EM001AGE | |
| Lenovo ThinkPad P14s Gen1-20Y10002GE | |
| Lenovo ThinkPad P14s G3 AMD 21J6S05000 | |
| HP ZBook Firefly 14 G10 A | |
| HP ZBook Power 15 G10 | |
| Lenovo ThinkPad P15v G2 21A9000XGE | |
| Lenovo ThinkPad P14s G4 21K5000LGE | |
| Asus VivoBook 14X K3405 | |
| Dell Precision 5000 5560 | |
| Genomsnitt Intel Core Ultra 9 185H (34.5 - 73.5, n=19) | |
| Dell Precision 5000 5470 | |
| Dell Precision 5480 | |
| HP ZBook Firefly 14 G9-6B8A2EA | |
| HP ZBook Power 15 G9 6B8C4EA | |
| Lenovo ThinkPad P14s G4 21HF0017GE | |
| Dell Precision 5000 5490 | |
| R Benchmark 2.5 / Overall mean | |
| Lenovo ThinkPad P14s Gen1-20Y10002GE | |
| Lenovo ThinkPad P15v G2 21A9000XGE | |
| Dell Precision 5000 5560 | |
| Lenovo ThinkPad P14s G3 AMD 21J6S05000 | |
| Lenovo ThinkPad P15v G3 21EM001AGE | |
| Asus VivoBook 14X K3405 | |
| HP ZBook Firefly 14 G10 A | |
| Lenovo ThinkPad P14s G4 21K5000LGE | |
| HP ZBook Firefly 14 G9-6B8A2EA | |
| Dell Precision 5000 5470 | |
| Dell Precision 5000 5490 | |
| HP ZBook Power 15 G9 6B8C4EA | |
| Genomsnitt Intel Core Ultra 9 185H (0.4313 - 0.759, n=20) | |
| Dell Precision 5480 | |
| HP ZBook Power 15 G10 | |
| Lenovo ThinkPad P14s G4 21HF0017GE | |
Cinebench R23: Multi Core | Single Core
Cinebench R20: CPU (Multi Core) | CPU (Single Core)
Cinebench R15: CPU Multi 64Bit | CPU Single 64Bit
Blender: v2.79 BMW27 CPU
7-Zip 18.03: 7z b 4 | 7z b 4 -mmt1
Geekbench 6.4: Multi-Core | Single-Core
Geekbench 5.5: Multi-Core | Single-Core
HWBOT x265 Benchmark v2.2: 4k Preset
LibreOffice : 20 Documents To PDF
R Benchmark 2.5: Overall mean
* ... mindre är bättre
AIDA64: FP32 Ray-Trace | FPU Julia | CPU SHA3 | CPU Queen | FPU SinJulia | FPU Mandel | CPU AES | CPU ZLib | FP64 Ray-Trace | CPU PhotoWorxx
| Performance Rating | |
| Genomsnitt Intel Core Ultra 9 185H | |
| Dell Precision 5480 | |
| Dell Precision 5000 5490 | |
| HP ZBook Firefly 14 G10 A | |
| Dell Precision 5000 5470 | |
| Lenovo ThinkPad P14s G4 21HF0017GE | |
| HP ZBook Firefly 14 G9-6B8A2EA | |
| AIDA64 / FP32 Ray-Trace | |
| HP ZBook Firefly 14 G10 A | |
| Genomsnitt Intel Core Ultra 9 185H (9220 - 18676, n=19) | |
| Dell Precision 5480 | |
| Dell Precision 5000 5490 | |
| Dell Precision 5000 5470 | |
| Lenovo ThinkPad P14s G4 21HF0017GE | |
| HP ZBook Firefly 14 G9-6B8A2EA | |
| AIDA64 / FPU Julia | |
| Genomsnitt Intel Core Ultra 9 185H (48865 - 96463, n=19) | |
| HP ZBook Firefly 14 G10 A | |
| Dell Precision 5000 5490 | |
| Dell Precision 5480 | |
| Dell Precision 5000 5470 | |
| Lenovo ThinkPad P14s G4 21HF0017GE | |
| HP ZBook Firefly 14 G9-6B8A2EA | |
| AIDA64 / CPU SHA3 | |
| Genomsnitt Intel Core Ultra 9 185H (2394 - 4534, n=19) | |
| Dell Precision 5000 5490 | |
| Dell Precision 5480 | |
| HP ZBook Firefly 14 G10 A | |
| Dell Precision 5000 5470 | |
| Lenovo ThinkPad P14s G4 21HF0017GE | |
| HP ZBook Firefly 14 G9-6B8A2EA | |
| AIDA64 / CPU Queen | |
| Dell Precision 5480 | |
| Dell Precision 5000 5470 | |
| Lenovo ThinkPad P14s G4 21HF0017GE | |
| Dell Precision 5000 5490 | |
| Genomsnitt Intel Core Ultra 9 185H (66785 - 95241, n=19) | |
| HP ZBook Firefly 14 G10 A | |
| HP ZBook Firefly 14 G9-6B8A2EA | |
| AIDA64 / FPU SinJulia | |
| HP ZBook Firefly 14 G10 A | |
| Genomsnitt Intel Core Ultra 9 185H (7255 - 11392, n=19) | |
| Dell Precision 5000 5490 | |
| Dell Precision 5480 | |
| Dell Precision 5000 5470 | |
| Lenovo ThinkPad P14s G4 21HF0017GE | |
| HP ZBook Firefly 14 G9-6B8A2EA | |
| AIDA64 / FPU Mandel | |
| HP ZBook Firefly 14 G10 A | |
| Genomsnitt Intel Core Ultra 9 185H (24004 - 48020, n=19) | |
| Dell Precision 5480 | |
| Dell Precision 5000 5490 | |
| Dell Precision 5000 5470 | |
| Lenovo ThinkPad P14s G4 21HF0017GE | |
| HP ZBook Firefly 14 G9-6B8A2EA | |
| AIDA64 / CPU AES | |
| Genomsnitt Intel Core Ultra 9 185H (53116 - 154066, n=19) | |
| Dell Precision 5000 5490 | |
| Dell Precision 5480 | |
| HP ZBook Firefly 14 G10 A | |
| Lenovo ThinkPad P14s G4 21HF0017GE | |
| HP ZBook Firefly 14 G9-6B8A2EA | |
| Dell Precision 5000 5470 | |
| AIDA64 / CPU ZLib | |
| Genomsnitt Intel Core Ultra 9 185H (678 - 1341, n=19) | |
| Dell Precision 5000 5490 | |
| Dell Precision 5480 | |
| Lenovo ThinkPad P14s G4 21HF0017GE | |
| HP ZBook Firefly 14 G10 A | |
| HP ZBook Firefly 14 G9-6B8A2EA | |
| Dell Precision 5000 5470 | |
| AIDA64 / FP64 Ray-Trace | |
| HP ZBook Firefly 14 G10 A | |
| Genomsnitt Intel Core Ultra 9 185H (4428 - 10078, n=19) | |
| Dell Precision 5480 | |
| Dell Precision 5000 5490 | |
| Dell Precision 5000 5470 | |
| Lenovo ThinkPad P14s G4 21HF0017GE | |
| HP ZBook Firefly 14 G9-6B8A2EA | |
| AIDA64 / CPU PhotoWorxx | |
| Dell Precision 5000 5490 | |
| Genomsnitt Intel Core Ultra 9 185H (44547 - 53918, n=19) | |
| Dell Precision 5480 | |
| Dell Precision 5000 5470 | |
| HP ZBook Firefly 14 G9-6B8A2EA | |
| Lenovo ThinkPad P14s G4 21HF0017GE | |
| HP ZBook Firefly 14 G10 A | |
Stresstest
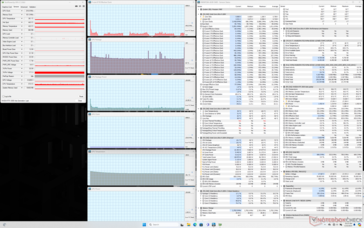
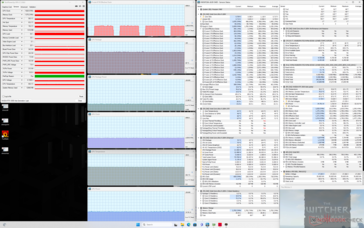
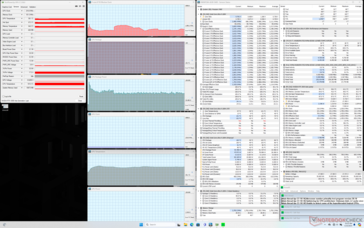
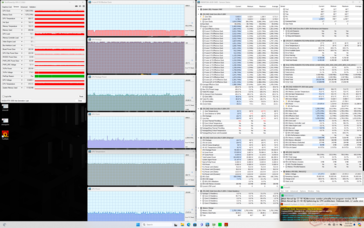
Kärnans klockfrekvens och kortets strömförbrukning ökade till så mycket som 3,3 GHz respektive 92 W när Prime95-stressen inleddes. Detta skulle dock falla mycket snabbt till 2,2 GHz och 55 W i genomsnitt för att upprätthålla en mycket hög kärntemperatur på 101 C. Resultaten liknar vad vi registrerade på förra årets Precision 5480 om inte något varmare.
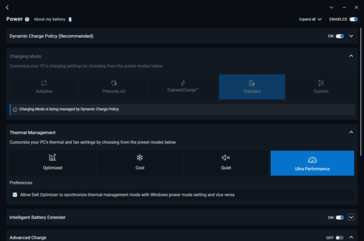
Intressant nog stabiliserades GPU-kortets strömförbrukning vid körning av Witcher 3 på 35 W medan GPU:n i förra årets Precision 5480 stabiliserades på 45 W även när den var inställd på Ultra Performance-läge. Kortets strömförbrukning kan delvis förklara den något långsammare grafikprestandan i vårt avsnitt om GPU-prestanda nedan.
| CPU-klocka (GHz) | GPU-klocka (MHz) | Genomsnittlig CPU-temperatur (°C) | Genomsnittlig GPU-temperatur (°C) | |
| System i viloläge | -- | -- | 45 | 38 |
| Prime95 Stress | 2.2 | -- | 101 | 59 |
| Prime95 + FurMark Stress | 1,6 | ~1350 | 101 | 69 |
| Witcher 3 Stress | 0,4 | 1620 | 68 | 59 |
Systemets prestanda
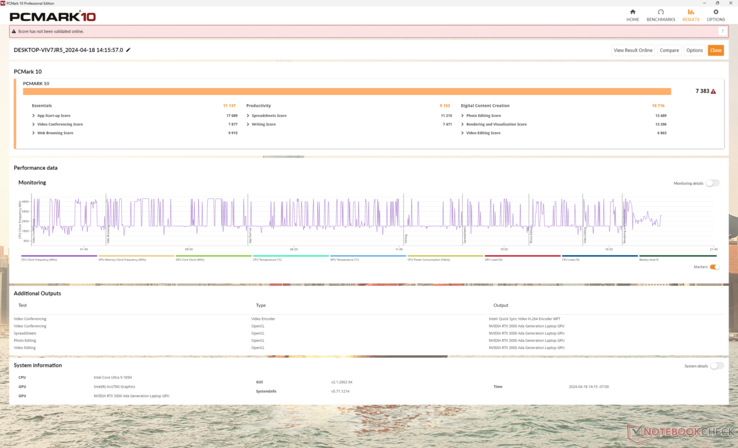
PCMark-resultaten är nästan identiska med vad vi registrerade på förra årets Precision 5480 och tyder inte på några större prestandafördelar när det gäller allmän multitasking eller videoredigeringsuppgifter. PCMark AI-benchmarks, som vi ännu inte har kört, kan bättre skilja bärbara datorer med integrerade NPU:er som vår Precision 5490 från äldre modeller.
CrossMark: Overall | Productivity | Creativity | Responsiveness
WebXPRT 3: Overall
WebXPRT 4: Overall
Mozilla Kraken 1.1: Total
| PCMark 10 / Score | |
| Dell Precision 5480 | |
| Genomsnitt Intel Core Ultra 9 185H, NVIDIA RTX 3000 Ada Generation Laptop GPU (7383 - 7537, n=2) | |
| Dell Precision 5000 5490 | |
| Lenovo ThinkPad P14s G4 21HF0017GE | |
| Dell Precision 5000 5470 | |
| HP ZBook Firefly 14 G10 A | |
| HP ZBook Firefly 14 G9-6B8A2EA | |
| PCMark 10 / Essentials | |
| Dell Precision 5480 | |
| Dell Precision 5000 5490 | |
| Dell Precision 5000 5470 | |
| Genomsnitt Intel Core Ultra 9 185H, NVIDIA RTX 3000 Ada Generation Laptop GPU (10514 - 11137, n=2) | |
| Lenovo ThinkPad P14s G4 21HF0017GE | |
| HP ZBook Firefly 14 G9-6B8A2EA | |
| HP ZBook Firefly 14 G10 A | |
| PCMark 10 / Productivity | |
| Lenovo ThinkPad P14s G4 21HF0017GE | |
| HP ZBook Firefly 14 G9-6B8A2EA | |
| Dell Precision 5480 | |
| Genomsnitt Intel Core Ultra 9 185H, NVIDIA RTX 3000 Ada Generation Laptop GPU (9153 - 9356, n=2) | |
| HP ZBook Firefly 14 G10 A | |
| Dell Precision 5000 5490 | |
| Dell Precision 5000 5470 | |
| PCMark 10 / Digital Content Creation | |
| Dell Precision 5480 | |
| Genomsnitt Intel Core Ultra 9 185H, NVIDIA RTX 3000 Ada Generation Laptop GPU (10716 - 11811, n=2) | |
| Dell Precision 5000 5490 | |
| Dell Precision 5000 5470 | |
| Lenovo ThinkPad P14s G4 21HF0017GE | |
| HP ZBook Firefly 14 G10 A | |
| HP ZBook Firefly 14 G9-6B8A2EA | |
| CrossMark / Overall | |
| Dell Precision 5480 | |
| Lenovo ThinkPad P14s G4 21HF0017GE | |
| Dell Precision 5000 5470 | |
| Genomsnitt Intel Core Ultra 9 185H, NVIDIA RTX 3000 Ada Generation Laptop GPU (1754 - 1770, n=2) | |
| Dell Precision 5000 5490 | |
| HP ZBook Firefly 14 G9-6B8A2EA | |
| CrossMark / Productivity | |
| Dell Precision 5480 | |
| Lenovo ThinkPad P14s G4 21HF0017GE | |
| Dell Precision 5000 5470 | |
| Genomsnitt Intel Core Ultra 9 185H, NVIDIA RTX 3000 Ada Generation Laptop GPU (1643 - 1686, n=2) | |
| Dell Precision 5000 5490 | |
| HP ZBook Firefly 14 G9-6B8A2EA | |
| CrossMark / Creativity | |
| Dell Precision 5480 | |
| Dell Precision 5000 5470 | |
| Lenovo ThinkPad P14s G4 21HF0017GE | |
| Dell Precision 5000 5490 | |
| Genomsnitt Intel Core Ultra 9 185H, NVIDIA RTX 3000 Ada Generation Laptop GPU (1981 - 2001, n=2) | |
| HP ZBook Firefly 14 G9-6B8A2EA | |
| CrossMark / Responsiveness | |
| Dell Precision 5480 | |
| Lenovo ThinkPad P14s G4 21HF0017GE | |
| Dell Precision 5000 5470 | |
| Genomsnitt Intel Core Ultra 9 185H, NVIDIA RTX 3000 Ada Generation Laptop GPU (1438 - 1458, n=2) | |
| Dell Precision 5000 5490 | |
| HP ZBook Firefly 14 G9-6B8A2EA | |
| WebXPRT 3 / Overall | |
| Dell Precision 5480 | |
| Dell Precision 5000 5470 | |
| Lenovo ThinkPad P14s G4 21HF0017GE | |
| Genomsnitt Intel Core Ultra 9 185H, NVIDIA RTX 3000 Ada Generation Laptop GPU (286 - 295, n=2) | |
| Dell Precision 5000 5490 | |
| HP ZBook Firefly 14 G9-6B8A2EA | |
| HP ZBook Firefly 14 G10 A | |
| HP ZBook Firefly 14 G10 A | |
| WebXPRT 4 / Overall | |
| Dell Precision 5480 | |
| Lenovo ThinkPad P14s G4 21HF0017GE | |
| Lenovo ThinkPad P14s G4 21HF0017GE | |
| Dell Precision 5000 5470 | |
| Dell Precision 5000 5490 | |
| Genomsnitt Intel Core Ultra 9 185H, NVIDIA RTX 3000 Ada Generation Laptop GPU (261 - 268, n=2) | |
| HP ZBook Firefly 14 G9-6B8A2EA | |
| Mozilla Kraken 1.1 / Total | |
| HP ZBook Firefly 14 G10 A | |
| HP ZBook Firefly 14 G10 A | |
| HP ZBook Firefly 14 G9-6B8A2EA | |
| Dell Precision 5000 5470 | |
| Dell Precision 5000 5490 | |
| Genomsnitt Intel Core Ultra 9 185H, NVIDIA RTX 3000 Ada Generation Laptop GPU (515 - 522, n=2) | |
| Dell Precision 5480 | |
| Lenovo ThinkPad P14s G4 21HF0017GE | |
* ... mindre är bättre
| PCMark 10 Score | 7383 poäng | |
Hjälp | ||
| AIDA64 / Memory Copy | |
| Dell Precision 5000 5490 | |
| Genomsnitt Intel Core Ultra 9 185H (69929 - 95718, n=19) | |
| Dell Precision 5480 | |
| Dell Precision 5000 5470 | |
| HP ZBook Firefly 14 G10 A | |
| Lenovo ThinkPad P14s G4 21HF0017GE | |
| HP ZBook Firefly 14 G9-6B8A2EA | |
| AIDA64 / Memory Read | |
| Dell Precision 5000 5490 | |
| Genomsnitt Intel Core Ultra 9 185H (64619 - 87768, n=19) | |
| Dell Precision 5000 5470 | |
| Dell Precision 5480 | |
| HP ZBook Firefly 14 G9-6B8A2EA | |
| HP ZBook Firefly 14 G10 A | |
| Lenovo ThinkPad P14s G4 21HF0017GE | |
| AIDA64 / Memory Write | |
| Dell Precision 5000 5490 | |
| Dell Precision 5480 | |
| HP ZBook Firefly 14 G10 A | |
| Genomsnitt Intel Core Ultra 9 185H (51114 - 93871, n=19) | |
| Lenovo ThinkPad P14s G4 21HF0017GE | |
| HP ZBook Firefly 14 G9-6B8A2EA | |
| Dell Precision 5000 5470 | |
| AIDA64 / Memory Latency | |
| Genomsnitt Intel Core Ultra 9 185H (121.4 - 259, n=19) | |
| Dell Precision 5000 5490 | |
| Dell Precision 5000 5470 | |
| HP ZBook Firefly 14 G10 A | |
| Lenovo ThinkPad P14s G4 21HF0017GE | |
| Dell Precision 5480 | |
| HP ZBook Firefly 14 G9-6B8A2EA | |
* ... mindre är bättre
DPC-fördröjning
| DPC Latencies / LatencyMon - interrupt to process latency (max), Web, Youtube, Prime95 | |
| Dell Precision 5000 5490 | |
| Lenovo ThinkPad P14s G4 21HF0017GE | |
| Dell Precision 5480 | |
| HP ZBook Firefly 14 G10 A | |
| Dell Precision 5000 5470 | |
* ... mindre är bättre
Lagringsenheter
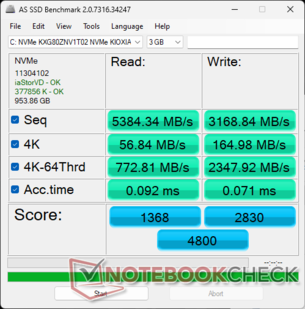
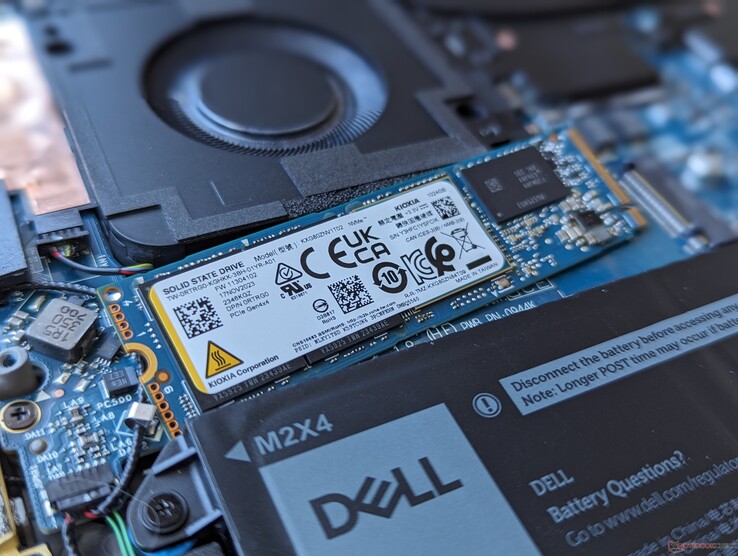
Vår enhet levereras med Kioxia KXG80ZNV1T02 istället för Samsung PM9A1 på förra årets modell. Den övergripande prestandan är ungefär densamma, om än med något långsammare läshastigheter för mindre 4K-block.
| Drive Performance Rating - Percent | |
| Lenovo ThinkPad P14s G4 21HF0017GE | |
| Dell Precision 5480 | |
| Dell Precision 5000 5470 | |
| HP ZBook Firefly 14 G9-6B8A2EA | |
| Dell Precision 5000 5490 | |
| HP ZBook Firefly 14 G10 A | |
* ... mindre är bättre
Disk Throttling: DiskSpd Read Loop, Queue Depth 8
GPU-prestanda - RTX 3000 Ada
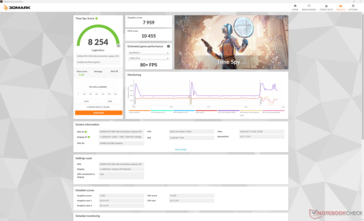
RTX 3000 Ada har återvänt utan några förändringar och utan några prestandafördelar jämfört med Precision 5480. I själva verket kan den genomsnittliga prestandan vara något långsammare i många fall, inklusive vissa spel och 3DMark-benchmarks. Trots detta är Precision 5490 fortfarande en av de snabbaste 14-tums arbetsstationerna.
| Effektprofil | Grafikpoäng | Fysikpoäng | Kombinerad poäng |
| Prestanda-läge | 20233 | 26583 | 8524 |
| Balanserat läge | 19308 (-5%) | 25981 (-2%) | 7568 (-11%) |
| Batteridrift | 19040 (-6%) | 20532 (-23%) | 7331 (-14%) |
Att köra i balanserat läge istället för prestandaläge påverkar prestandan endast marginellt, vilket framgår av våra Fire Strike -resultat ovan. Batteriförbrukningen minskar processorprestandan mer än grafikprestandan.
| 3DMark Performance Rating - Percent | |
| Genomsnitt NVIDIA RTX 3000 Ada Generation Laptop GPU -1! | |
| Dell Precision 5000 5490 -3! | |
| Dell Precision 5480 -5! | |
| HP ZBook Power 15 G10 -11! | |
| HP ZBook Power 15 G9 6B8C4EA -18! | |
| Dell Precision 5000 5560 -4! | |
| Dell Precision 5000 5470 -11! | |
| Lenovo ThinkPad P15v G3 21EM001AGE -12! | |
| Lenovo ThinkPad P15v G2 21A9000XGE -19! | |
| Lenovo ThinkPad P14s G4 21HF0017GE -19! | |
| Lenovo ThinkPad P14s G4 21K5000LGE -21! | |
| Lenovo ThinkPad P14s G3 AMD 21J6S05000 -19! | |
| HP ZBook Firefly 14 G9-6B8A2EA -19! | |
| HP ZBook Firefly 14 G10 A -35! | |
| Lenovo ThinkPad P14s Gen1-20Y10002GE -19! | |
| 3DMark 11 Performance | 25317 poäng | |
| 3DMark Cloud Gate Standard Score | 45774 poäng | |
| 3DMark Fire Strike Score | 18368 poäng | |
| 3DMark Time Spy Score | 8254 poäng | |
Hjälp | ||
* ... mindre är bättre
| Cyberpunk 2077 2.2 Phantom Liberty | |
| 1920x1080 Low Preset (FSR off) | |
| Genomsnitt NVIDIA RTX 3000 Ada Generation Laptop GPU (87.2 - 104.6, n=2) | |
| Dell Precision 5000 5490 | |
| HP ZBook Power 15 G10 | |
| Lenovo ThinkPad P14s G4 21HF0017GE | |
| 1920x1080 Medium Preset (FSR off) | |
| Genomsnitt NVIDIA RTX 3000 Ada Generation Laptop GPU (72.7 - 87.9, n=2) | |
| Dell Precision 5000 5490 | |
| HP ZBook Power 15 G10 | |
| Lenovo ThinkPad P14s G4 21HF0017GE | |
| 1920x1080 High Preset (FSR off) | |
| Genomsnitt NVIDIA RTX 3000 Ada Generation Laptop GPU (60.7 - 74.2, n=2) | |
| Dell Precision 5000 5490 | |
| HP ZBook Power 15 G10 | |
| Lenovo ThinkPad P14s G4 21HF0017GE | |
| 1920x1080 Ultra Preset (FSR off) | |
| Genomsnitt NVIDIA RTX 3000 Ada Generation Laptop GPU (52.1 - 64.3, n=2) | |
| Dell Precision 5000 5490 | |
| HP ZBook Power 15 G10 | |
| Lenovo ThinkPad P14s G4 21HF0017GE | |
| 1920x1080 Ray Tracing Ultra Preset (DLSS off) | |
| Genomsnitt NVIDIA RTX 3000 Ada Generation Laptop GPU (26.2 - 33.2, n=2) | |
| Dell Precision 5000 5490 | |
| HP ZBook Power 15 G10 | |
| Lenovo ThinkPad P14s G4 21HF0017GE | |
| Tiny Tina's Wonderlands | |
| 1920x1080 Low Preset (DX12) | |
| Genomsnitt NVIDIA RTX 3000 Ada Generation Laptop GPU (153.9 - 194, n=3) | |
| Dell Precision 5480 | |
| Dell Precision 5000 5490 | |
| HP ZBook Power 15 G10 | |
| 1920x1080 Medium Preset (DX12) | |
| Genomsnitt NVIDIA RTX 3000 Ada Generation Laptop GPU (125.4 - 157.7, n=3) | |
| Dell Precision 5480 | |
| Dell Precision 5000 5490 | |
| HP ZBook Power 15 G10 | |
| 1920x1080 High Preset (DX12) | |
| Genomsnitt NVIDIA RTX 3000 Ada Generation Laptop GPU (88 - 110, n=3) | |
| Dell Precision 5000 5490 | |
| Dell Precision 5480 | |
| HP ZBook Power 15 G10 | |
| 1920x1080 Badass Preset (DX12) | |
| Genomsnitt NVIDIA RTX 3000 Ada Generation Laptop GPU (69 - 87.9, n=3) | |
| Dell Precision 5000 5490 | |
| Dell Precision 5480 | |
| HP ZBook Power 15 G10 | |
Witcher 3 FPS Chart
| låg | med. | hög | ultra | |
|---|---|---|---|---|
| The Witcher 3 (2015) | 344 | 249.5 | 145.8 | 79.5 |
| Dota 2 Reborn (2015) | 168 | 151.3 | 136 | 123.3 |
| Final Fantasy XV Benchmark (2018) | 128.8 | 91.9 | 72.9 | |
| X-Plane 11.11 (2018) | 109.9 | 102.1 | 76.7 | |
| Far Cry 5 (2018) | 115 | 105 | 104 | 96 |
| Strange Brigade (2018) | 282 | 182.4 | 151.4 | 132.5 |
| Tiny Tina's Wonderlands (2022) | 153.9 | 125.4 | 88.5 | 70.2 |
| F1 22 (2022) | 183.6 | 168 | 127.5 | 50.4 |
| Baldur's Gate 3 (2023) | 92 | 78.8 | 70.1 | 68.8 |
| Cyberpunk 2077 2.2 Phantom Liberty (2023) | 87.2 | 72.7 | 60.7 | 52.1 |
Utsläpp
Systembuller
Fläktljudet är i stort sett identiskt med det vi registrerade på Precision 5480. I synnerhet taket fortsätter att vara högre eller högre än andra 14-tums arbetsstationer, främst på grund av den snabbare GPU:n i Dell-systemet. För det här året kan Precision 5490 åtminstone köras tystare under längre perioder innan fläktarna börjar öka.
Ljudnivå
| Låg belastning |
| 23.8 / 23.8 / 24.7 dB(A) |
| Hög belastning |
| 38.9 / 51.4 dB(A) |
 | ||
30 dB tyst 40 dB(A) hörbar 50 dB(A) högt ljud |
||
min: | ||
| Dell Precision 5000 5490 NVIDIA RTX 3000 Ada Generation Laptop GPU, Ultra 9 185H, Kioxia XG8 KXG80ZNV1T02 | Lenovo ThinkPad P14s G4 21HF0017GE RTX A500 Laptop GPU, i7-1370P, SK Hynix HFS002TEJ9X162N | HP ZBook Firefly 14 G10 A Radeon 760M, R5 PRO 7640HS, Samsung PM9B1 512GB MZVL4512HBLU | HP ZBook Firefly 14 G9-6B8A2EA T550 Laptop GPU, i7-1265U, Micron 3400 1TB MTFDKBA1T0TFH | Dell Precision 5480 NVIDIA RTX 3000 Ada Generation Laptop GPU, i9-13900H, Samsung PM9A1 MZVL21T0HCLR | Dell Precision 5000 5470 RTX A1000 Laptop GPU, i9-12900H, Samsung PM9A1 MZVL21T0HCLR | |
|---|---|---|---|---|---|---|
| Noise | -1% | -4% | 4% | 0% | -2% | |
| av / miljö * | 22.8 | 24.6 -8% | 25 -10% | 23.6 -4% | 23.5 -3% | 23 -1% |
| Idle Minimum * | 23.8 | 24.6 -3% | 25 -5% | 23.6 1% | 23.5 1% | 23.3 2% |
| Idle Average * | 23.8 | 24.6 -3% | 26 -9% | 23.6 1% | 23.5 1% | 23.3 2% |
| Idle Maximum * | 24.7 | 25.9 -5% | 27 -9% | 23.6 4% | 23.5 5% | 23.3 6% |
| Load Average * | 38.9 | 41.3 -6% | 45 -16% | 42.5 -9% | 39.9 -3% | 48.5 -25% |
| Witcher 3 ultra * | 49.9 | 46 8% | 45 10% | 42.5 15% | 50.1 -0% | 48.6 3% |
| Load Maximum * | 51.4 | 46.2 10% | 46 11% | 42.5 17% | 51 1% | 50.4 2% |
| Cyberpunk 2077 ultra * | 44.2 |
* ... mindre är bättre
Temperatur
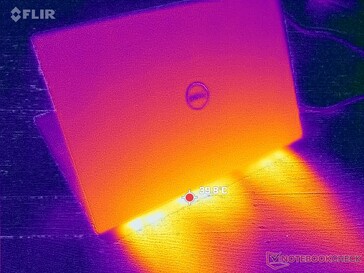
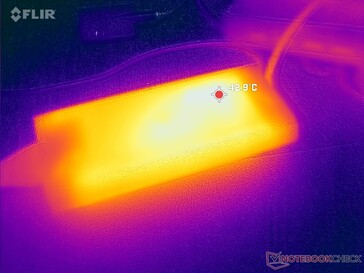
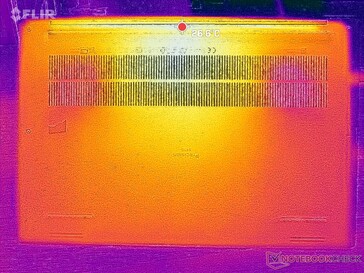
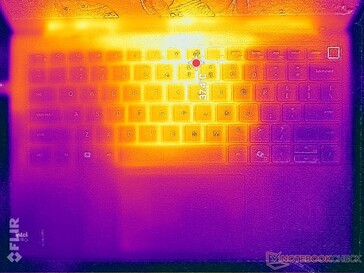
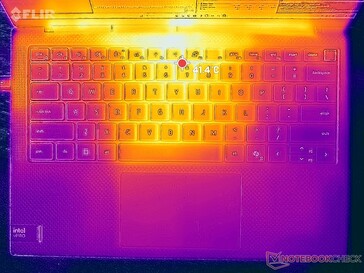
Temperaturutvecklingen är symmetrisk, vilket innebär att de hetaste punkterna ligger närmast tangentbordets mitt medan sidorna och handledsstöden är mycket svalare. Hot spots är ändå märkbart svalare än på HP ZBook Firefly 14 G10 med flera grader C.
(±) Den maximala temperaturen på ovansidan är 43.2 °C / 110 F, jämfört med genomsnittet av 38.2 °C / 101 F , allt från 22.2 till 69.8 °C för klassen Workstation.
(+) Botten värms upp till maximalt 38.4 °C / 101 F, jämfört med genomsnittet av 41.2 °C / 106 F
(+) Vid tomgångsbruk är medeltemperaturen för ovansidan 29 °C / 84 F, jämfört med enhetsgenomsnittet på 32 °C / ### class_avg_f### F.
(+) När du spelar The Witcher 3 är medeltemperaturen för ovansidan 31.7 °C / 89 F, jämfört med enhetsgenomsnittet på 32 °C / ## #class_avg_f### F.
(+) Handledsstöden och pekplattan är kallare än hudtemperaturen med maximalt 27.6 °C / 81.7 F och är därför svala att ta på.
(±) Medeltemperaturen för handledsstödsområdet på liknande enheter var 27.8 °C / 82 F (+0.2 °C / 0.3 F).
| Dell Precision 5000 5490 Intel Core Ultra 9 185H, NVIDIA RTX 3000 Ada Generation Laptop GPU | Lenovo ThinkPad P14s G4 21HF0017GE Intel Core i7-1370P, NVIDIA RTX A500 Laptop GPU | HP ZBook Firefly 14 G10 A AMD Ryzen 5 PRO 7640HS, AMD Radeon 760M | HP ZBook Firefly 14 G9-6B8A2EA Intel Core i7-1265U, NVIDIA T550 Laptop GPU | Dell Precision 5480 Intel Core i9-13900H, NVIDIA RTX 3000 Ada Generation Laptop GPU | Dell Precision 5000 5470 Intel Core i9-12900H, NVIDIA RTX A1000 Laptop GPU | |
|---|---|---|---|---|---|---|
| Heat | -13% | -4% | 2% | -13% | -3% | |
| Maximum Upper Side * | 43.2 | 55.3 -28% | 50 -16% | 41.2 5% | 44 -2% | 41.8 3% |
| Maximum Bottom * | 38.4 | 48.7 -27% | 51 -33% | 47.9 -25% | 38.2 1% | 36 6% |
| Idle Upper Side * | 31.6 | 31 2% | 25 21% | 26.5 16% | 38.8 -23% | 34.6 -9% |
| Idle Bottom * | 30.6 | 29.9 2% | 27 12% | 27 12% | 38.6 -26% | 33.6 -10% |
* ... mindre är bättre
Dell Precision 5000 5490 ljudanalys
(+) | högtalare kan spela relativt högt (87.8 dB)
Bas 100 - 315 Hz
(±) | reducerad bas - i genomsnitt 10.9% lägre än medianen
(±) | linjäriteten för basen är genomsnittlig (7.2% delta till föregående frekvens)
Mellan 400 - 2000 Hz
(+) | balanserad mellan - endast 1.7% från medianen
(+) | mids är linjära (3.5% delta till föregående frekvens)
Högsta 2 - 16 kHz
(+) | balanserade toppar - endast 4.4% från medianen
(+) | toppar är linjära (3.4% delta till föregående frekvens)
Totalt 100 - 16 000 Hz
(+) | det totala ljudet är linjärt (9.2% skillnad mot median)
Jämfört med samma klass
» 3% av alla testade enheter i den här klassen var bättre, 2% liknande, 94% sämre
» Den bästa hade ett delta på 7%, genomsnittet var 18%, sämst var 35%
Jämfört med alla testade enheter
» 3% av alla testade enheter var bättre, 1% liknande, 97% sämre
» Den bästa hade ett delta på 4%, genomsnittet var 24%, sämst var 134%
Apple MacBook Pro 16 2021 M1 Pro ljudanalys
(+) | högtalare kan spela relativt högt (84.7 dB)
Bas 100 - 315 Hz
(+) | bra bas - bara 3.8% från medianen
(+) | basen är linjär (5.2% delta till föregående frekvens)
Mellan 400 - 2000 Hz
(+) | balanserad mellan - endast 1.3% från medianen
(+) | mids är linjära (2.1% delta till föregående frekvens)
Högsta 2 - 16 kHz
(+) | balanserade toppar - endast 1.9% från medianen
(+) | toppar är linjära (2.7% delta till föregående frekvens)
Totalt 100 - 16 000 Hz
(+) | det totala ljudet är linjärt (4.6% skillnad mot median)
Jämfört med samma klass
» 0% av alla testade enheter i den här klassen var bättre, 0% liknande, 100% sämre
» Den bästa hade ett delta på 5%, genomsnittet var 18%, sämst var 45%
Jämfört med alla testade enheter
» 0% av alla testade enheter var bättre, 0% liknande, 100% sämre
» Den bästa hade ett delta på 4%, genomsnittet var 24%, sämst var 134%
Energiförvaltning
Strömförbrukning
Körning Witcher 3 kräver i genomsnitt 88 W för att ligga nära vad vi registrerade på Precision 5480 trots deras CPU-skillnader. Jämfört med andra 14-tums arbetsstationer är Precision 5490 en av de mest krävande, vilket stämmer överens med dess relativt snabba prestanda.
En mindre 100 W USB-C-adapter levereras med konfigurationer som inte använder någon diskret grafik. Annars ingår en 130 W USB-C-adapter som standard.
(Redaktörens anmärkning: Detta avsnitt kommer att uppdateras när reparationerna av vår Metrahit Energy-multimeter är slutförda senare denna månad. Vi ber om ursäkt för besväret)
| Av/Standby | |
| Låg belastning | |
| Hög belastning |
|
Förklaring:
min: | |
| Dell Precision 5000 5490 Ultra 9 185H, NVIDIA RTX 3000 Ada Generation Laptop GPU, Kioxia XG8 KXG80ZNV1T02, IPS, 2560x1600, 14" | Lenovo ThinkPad P14s G4 21HF0017GE i7-1370P, RTX A500 Laptop GPU, SK Hynix HFS002TEJ9X162N, OLED, 2880x1800, 14" | HP ZBook Firefly 14 G10 A R5 PRO 7640HS, Radeon 760M, Samsung PM9B1 512GB MZVL4512HBLU, IPS, 1920x1200, 14" | HP ZBook Firefly 14 G9-6B8A2EA i7-1265U, T550 Laptop GPU, Micron 3400 1TB MTFDKBA1T0TFH, IPS, 1920x1200, 14" | Dell Precision 5480 i9-13900H, NVIDIA RTX 3000 Ada Generation Laptop GPU, Samsung PM9A1 MZVL21T0HCLR, IPS, 2560x1600, 14" | Dell Precision 5000 5470 i9-12900H, RTX A1000 Laptop GPU, Samsung PM9A1 MZVL21T0HCLR, IPS, 2560x1600, 14" | |
|---|---|---|---|---|---|---|
| Power Consumption | 32% | 51% | 52% | -24% | 11% | |
| Idle Minimum * | 11.1 | 6.3 43% | 3 73% | 4.2 62% | 14.9 -34% | 4.3 61% |
| Idle Average * | 14.8 | 7 53% | 4 73% | 6.5 56% | 19.5 -32% | 8.9 40% |
| Idle Maximum * | 16.5 | 8.1 51% | 8 52% | 7.2 56% | 27.2 -65% | 18.9 -15% |
| Load Average * | 70.1 | 84.6 -21% | 56 20% | 47.7 32% | 81.6 -16% | 94 -34% |
| Witcher 3 ultra * | 93.1 | 56.5 39% | 58.2 37% | 42.9 54% | 90.4 3% | 83.2 11% |
| Load Maximum * | 137.5 | 98.3 29% | 66 52% | 68.2 50% | 137.8 -0% | 137.5 -0% |
* ... mindre är bättre
Power Consumption Witcher 3 / Stresstest
Power Consumption external Monitor
Batteritid
Batteritiden är nästan identisk med den som vi registrerade på Precision 5480 eftersom de två modellerna har liknande komponenter och prestandanivåer.
| Dell Precision 5000 5490 Ultra 9 185H, NVIDIA RTX 3000 Ada Generation Laptop GPU, 72 Wh | Lenovo ThinkPad P14s G4 21HF0017GE i7-1370P, RTX A500 Laptop GPU, 52.5 Wh | HP ZBook Firefly 14 G10 A R5 PRO 7640HS, Radeon 760M, 51 Wh | HP ZBook Firefly 14 G9-6B8A2EA i7-1265U, T550 Laptop GPU, 51 Wh | Dell Precision 5480 i9-13900H, NVIDIA RTX 3000 Ada Generation Laptop GPU, 72 Wh | Dell Precision 5000 5470 i9-12900H, RTX A1000 Laptop GPU, 72 Wh | |
|---|---|---|---|---|---|---|
| Batteridrifttid | -44% | 19% | -19% | 0% | -13% | |
| WiFi v1.3 | 658 | 367 -44% | 782 19% | 530 -19% | 655 0% | 573 -13% |
| Load | 59 | 55 | 63 | |||
| Reader / Idle | 883 |
För
Emot
Bedömning - Nästan omöjlig att skilja från Precision 5480
De Precision 5480 gav en betydande GPU-ökning jämfört med Precision 5470 på grund av hoppet i GPU-generation trots att deras chassin var identiska. För Precision 5490 introducerar modellen dock inga nya GPU-alternativ och därför förblir RTX 3000 Ada toppkonfigurationen. Om GPU-prestanda är prioriterat kommer Precision 5490 att köras identiskt med Precision 5480.
CPU-prestanda och grafikprestanda förblir oförändrade mellan Precision 5490 och Precision 5480. Istället fokuserar den senaste modellen på AI-acceleration som fortfarande är i sin linda vid publiceringstillfället.
Utanför GPU:n ger CPU-hoppet från Raptor Lake-H till Meteor Lake-H inga större råa prestandafördelar. Dess integrerade NPU, som är det främsta försäljningsargumentet för Precision 5490, har få applikationer i skrivande stund. Att köpa Precision 5490 idag innebär därför att man investerar i lokal AI-acceleration och framtida Windows AI-funktioner.
För framtida modeller skulle vi vilja se ytterligare skärmalternativ, särskilt för applikationer som kräver P3-färger och snabbare svartvita svarstider. Alternativ som ThinkPad P14s erbjuder OLED medan vår Precision är fast med endast IPS.
Pris och tillgänglighet
Dell levererar nu Precision 5490 från 2250 USD för baskonfigurationen med Core Ultra 5, RTX 1000 Ada och 1200p upp till över 3900 USD för den avancerade konfigurationen med Core Ultra 9, RTX 3000 Ada och 1600p.
Dell Precision 5000 5490
- 04/25/2024 v7 (old)
Allen Ngo
Genomskinlighet
Valet av enheter som ska granskas görs av vår redaktion. Testprovet gavs till författaren som ett lån av tillverkaren eller återförsäljaren för denna recension. Långivaren hade inget inflytande på denna recension och inte heller fick tillverkaren en kopia av denna recension innan publiceringen. Det fanns ingen skyldighet att publicera denna recension. Vi accepterar aldrig ersättning eller betalning i utbyte mot våra recensioner. Som ett oberoende medieföretag är Notebookcheck inte föremål för auktoritet från tillverkare, återförsäljare eller förlag.
This is how Notebookcheck is testingEvery year, Notebookcheck independently reviews hundreds of laptops and smartphones using standardized procedures to ensure that all results are comparable. We have continuously developed our test methods for around 20 years and set industry standards in the process. In our test labs, high-quality measuring equipment is utilized by experienced technicians and editors. These tests involve a multi-stage validation process. Our complex rating system is based on hundreds of well-founded measurements and benchmarks, which maintains objectivity.


