Notebookcheck Logo

XMG Neo 16 (Early 24) recension: Full RTX 4090-kraft i en kompakt bärbar speldator
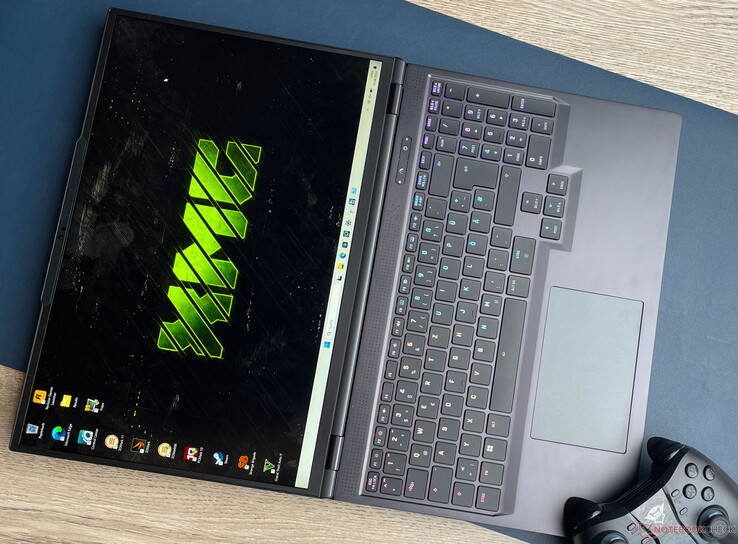
Ta fram vattnet.

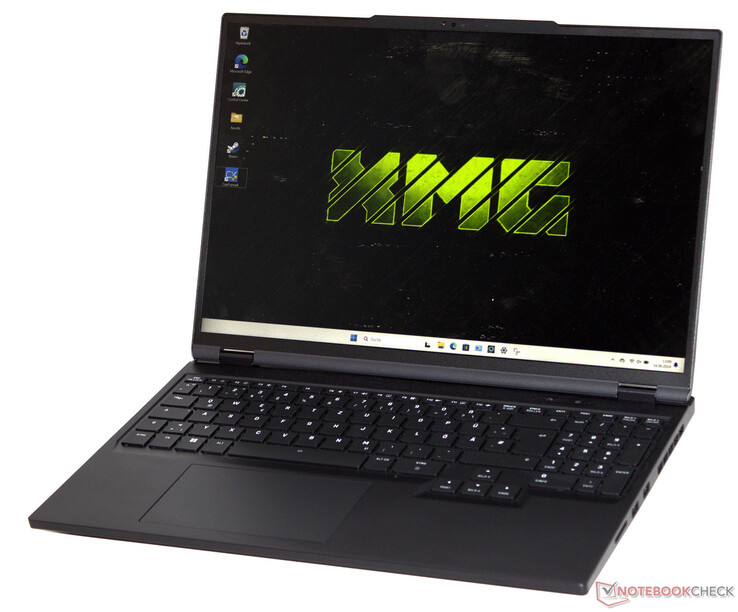
Neo 16 är för närvarande en av de mest kraftfulla bärbara datorerna: Core i9 14900HX och GeForce RTX 4090 förbereder datorn för spel, streaming och rendering. Ett externt vattenkylningssystem (tillval) pressar ut varenda droppe ur hårdvaran.

Med Neo 16 vänder sig Schenker till high-end-segmentet, och följaktligen finns det inga halvmesyrer: Med Core i9, GeForce RTX 4090 och 32 GB RAM är den bärbara datorn utrustad för krävande applikationsscenarier (streaming, rendering, gaming). Men detta kommer till en kostnad: Du får punga ut med cirka 4 000 dollar (aktuell växelkurs dollar/euro) för testmodellen, även om billigare varianter också finns från 2 000 dollar. Basen utgörs av Tongfang barebone (GM6IX9B). Konkurrenter kommer i form av till exempel Razer Blade 16, den Medion Erazer Beast X40 och Asus ROG Strix Scar 17.

Enheten liknar 2023-modellen men har några nya funktioner: En ljusstarkare skärm, ett omarbetat kylsystem och en större öppningsvinkel. Det mekaniska tangentbordet (tillval) som finns i föregångaren är inte en del av 2024-modellens erbjudanden.

SCHENKER XMG Neo 16 (Early 24) (XMG Neo 16 Serie)
Processor
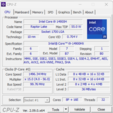
Intel Core i9-14900HX 24 x 1.6 - 5.8 GHz, 205 W PL2 / Short Burst, 205 W PL1 / Sustained, Raptor Lake-HX Refresh
Grafikkort
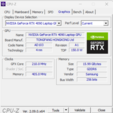
NVIDIA GeForce RTX 4090 Laptop GPU - 16 GB VRAM, Kärna: 2040 MHz, Minne: 2250 MHz, 175 W TDP ( including 25 W Dynamic Boost), GDDR6, 32.0.15.5599, Advanced Optimus, MUX-Switch
Minne
32 GB 
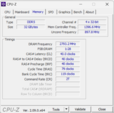
, DDR5-5600, Dual-Channel-Mode, two memory slots (both in use)
Skärm
16.00 tum 16:10, 2560 x 1600 pixlar 189 PPI, BOE NE160QDM-NZA, IPS, G-Sync, glansig: nej, 240 Hz, Adaptive Sync
Moderkort
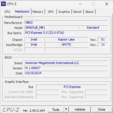
Intel HM770 (Raptor Lake-S PCH)
Hårddisk
Samsung 990 Pro 1 TB, 1024 GB 
, PCIe 4, M.2 2280, 865 GB ledigt
Anslutningar
4 USB 3.0, 1 USB 4.0 40 Gbps, 1 Thunderbolt, USB-C Power Delivery (PD), 1 HDMI, 1 DisplayPort, 1 Kensingtonlås, Ljudanslutningar: Headset combined port, Kortläsare: SD, SDHC, SDXC, , TPM 2.0
Nätverk
Realtek RTL8125 2.5GBe Family Ethernet Controller (10/100/1000/2500MBit/s), Intel Wi-Fi 6E AX211 (a/b/g/h/n = Wi-Fi 4/ac = Wi-Fi 5/ax = Wi-Fi 6/ Wi-Fi 6E 6 GHz), Bluetooth 5.3
Storlek
höjd x bredd x djup (i mm) 26.6 x 356.7 x 253
Batteri
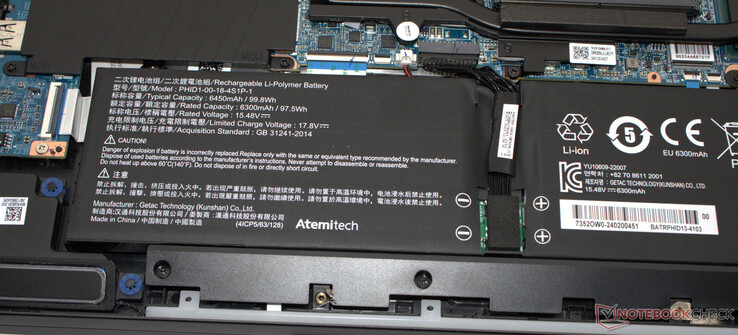
99.8 Wh, 6450 mAh Litiumpolymer
Operativsystem
Microsoft Windows 11 Pro
Camera
Webbkamera: FHD
Primary Camera: 2.1 MPix
Övrigt
Högtalare: Stereo, Tangentbord: Chiclet, Tangentbordsbelysning: ja, USB Thumbdrive (Drivers, Manuals), Stickers, Mousepad, 24 Månader Garanti
Vikt
2.52 kg, Strömförsörjning: 970 g
Pris
3800 Euro
Note: The manufacturer may use components from different suppliers including display panels, drives or memory sticks with similar specifications.


Potentiella konkurrenter i jämförelse

Rating
Version
Date
Model
Weight
Height
Size
Resolution
Price
85.5 %v8
06/2024
SCHENKER XMG Neo 16 (Early 24)
i9-14900HX, NVIDIA GeForce RTX 4090 Laptop GPU
2.5 kg26.6 mm16.00"2560x1600
91.1 %
v7 (old)
v7 (old)
02/2024
Razer Blade 16 2024, RTX 4090
i9-14900HX, NVIDIA GeForce RTX 4090 Laptop GPU
2.5 kg22 mm16.00"2560x1600
89.2 %
v7 (old)
v7 (old)
02/2024
Medion Erazer Beast X40 2024
i9-14900HX, NVIDIA GeForce RTX 4090 Laptop GPU
2.9 kg36 mm17.00"2560x1600
87.2 %
v7 (old)
v7 (old)
08/2023
Asus ROG Strix Scar 17 G733PYV-LL053X
R9 7945HX3D, NVIDIA GeForce RTX 4090 Laptop GPU
2.9 kg28.3 mm17.30"2560x1440

Fodral - Den bärbara datorn XMG har ett aluminiumchassi

2023-modellens chassi används inte i den nuvarande Neo-modellen. Det nya höljet har mer gemensamt med det hölje som finns i de senaste bärbara XMG-datorerna - ett steg i rätt riktning: Istället för en blandning av plast och metall har tillverkaren valt ett hölje helt i metall (undantag: Displayramarna är gjorda av plast). Chassit är så stabilt som man kan förvänta sig. Basenheten och locket kan endast vridas något. Locket möjliggör en öppningsvinkel på upp till 180 grader (2023-modellen: 135 grader). Detta gör det lättare att se innehåll när flera personer är närvarande. De täta gångjärnen håller locket säkert på plats och i nästan alla vinklar. Det är möjligt att öppna enheten med en hand.

Iögonfallande designelement syns inte till, vilket innebär att den mattsvarta datorn gör en ganska seriös figur. Färgstarka ljusinsläpp ges - förutom av de bakgrundsbelysta tangenterna (RGB) - av en användardefinierad, individuellt anpassningsbar LED-remsa.

XMG Neo 16 (tidig 24)

Den senaste Neo 16 ser något mer kompakt ut än föregångaren, men när det gäller vikten går det inte att skilja de bärbara datorerna åt. Endast Blade 16 erbjuder mer kompakthet - och det till en nästan identisk vikt.

Storleksjämförelse

395 mm 282.1 mm 28.3 mm 2.9 kg383 mm 272 mm 36 mm 2.9 kg357 mm 268 mm 29.9 mm 2.5 kg356.7 mm 253 mm 26.6 mm 2.5 kg355 mm 244 mm 22 mm 2.5 kg297 mm 210 mm 1 mm 5.7 g

Funktioner - USB 4 är ombord

Fyra av Neo 16:s fem USB-portar (3x USB-A, 2x USB-C) fungerar enligt USB 3.2 Gen 1-standarden. Endast USB-C-porten på baksidan ger Thunderbolt 4 (USB 4) till bordet - inklusive stöd för Power Delivery och Display Alt-läge. Totalt finns två videoutgångar tillgängliga (1x HDMI, 1x DP). Ett ljuduttag och en Gigabit Ethernet-port (2,5 GBit/s) kompletterar utbudet.

Avståndet mellan USB-portarna (höger sida: 12 mm, vänster sida: 8 mm) verkar vara lagom stort: Två USB-minnen (kontakter) av normal storlek kan anslutas samtidigt (se bilderna i galleriet). Videoutgångar och strömanslutningar finns på enhetens baksida. De tillhörande kablarna skulle löpa till baksidan och därför inte komma i vägen.

Vänster sida: Plats för kabellås, USB 3.2 Gen 1 (USB-A), USB 3.2 Gen 1 (USB-C), ljudkombination
Höger sida: Minneskortsläsare (SD), 2x USB 3.2 Gen 1 (USB-A)
Baksida: 2x kontakter för vattenkylning, Thunderbolt 4/USB 4 (USB-C; Power Delivery, Displayport, G-Sync), HDMI, Gigabit Ethernet (2,5 GBit/s), strömkontakt

SD-kortläsare

SD-kortläsaren (referens: AV PRO microSD 128 GB V60) är en av de medelsnabba modellerna: Överföringshastigheter på 76 MB/s (överföring av 250 jpg-bilder, 5 MB per fil) och 87 MB/s (kopiering av stora datablock) kan beskrivas som acceptabla. För Razer Blade 16 visar att betydligt högre siffror är möjliga.

SD Card Reader
average JPG Copy Test (av. of 3 runs)
Razer Blade 16 2024, RTX 4090
Intel Core i9-14900HX
171 (169.48min - 194.55max) MB/s +125%
Average of class Gaming
  (19 - 202, n=89, last 2 years)
95.5 MB/s +26%
Medion Erazer Beast X40 2024
Intel Core i9-14900HX (AV PRO microSD 128 GB V60)
77 MB/s +1%
SCHENKER XMG Neo 16 (Early 24)
Intel Core i9-14900HX (AV PRO microSD 128 GB V60)
76 MB/s
SCHENKER XMG Neo 16 E23
Intel Core i9-13900HX (AV PRO microSD 128 GB V60)
71 MB/s -7%
maximum AS SSD Seq Read Test (1GB)
Razer Blade 16 2024, RTX 4090
Intel Core i9-14900HX
181.81 MB/s +109%
Average of class Gaming
  (25.8 - 269, n=90, last 2 years)
119.3 MB/s +37%
Medion Erazer Beast X40 2024
Intel Core i9-14900HX (AV PRO microSD 128 GB V60)
90 MB/s +3%
SCHENKER XMG Neo 16 (Early 24)
Intel Core i9-14900HX (AV PRO microSD 128 GB V60)
87 MB/s
SCHENKER XMG Neo 16 E23
Intel Core i9-13900HX (AV PRO microSD 128 GB V60)
83 MB/s -5%

Kommunikation

Under optimala förhållanden (inga Wi-Fi-enheter i närheten, kort avstånd mellan den bärbara datorn och serverdatorn) kan bra till mycket bra datahastigheter uppnås - ett WiFi 6E-chip (Intel AX211) gör detta möjligt. För trådbundna anslutningar används en Realtek Gigabit Ethernet-styrenhet (RTL8125, 2,5 GBit/s).

Networking
iperf3 transmit AXE11000
SCHENKER XMG Neo 16 E23
Intel Wi-Fi 6E AX211
1585 (642min - 1670max) MBit/s +56%
Razer Blade 16 2024, RTX 4090
Intel Killer Wi-Fi 7 BE1750W 320 MHz (BE200NGW)
1577 (796min - 1617max) MBit/s +55%
Average of class Gaming
  (469 - 1843, n=151, last 2 years)
1235 MBit/s +21%
Average Intel Wi-Fi 6E AX211
  (464 - 1921, n=238)
1233 MBit/s +21%
SCHENKER XMG Neo 16 (Early 24)
Intel Wi-Fi 6E AX211
1018 (656min - 1248max) MBit/s
Medion Erazer Beast X40 2024
Intel Wi-Fi 6E AX211
636 (501min - 571max) MBit/s -38%
iperf3 receive AXE11000
SCHENKER XMG Neo 16 (Early 24)
Intel Wi-Fi 6E AX211
1689 (843min - 1714max) MBit/s
SCHENKER XMG Neo 16 E23
Intel Wi-Fi 6E AX211
1665 (839min - 1716max) MBit/s -1%
Medion Erazer Beast X40 2024
Intel Wi-Fi 6E AX211
1650 (1031min - 1711max) MBit/s -2%
Razer Blade 16 2024, RTX 4090
Intel Killer Wi-Fi 7 BE1750W 320 MHz (BE200NGW)
1604 (1554min - 1623max) MBit/s -5%
Average of class Gaming
  (680 - 1890, n=151, last 2 years)
1383 MBit/s -18%
Average Intel Wi-Fi 6E AX211
  (582 - 1890, n=238)
1379 MBit/s -18%
050100150200250300350400450500550600650700750800850900950100010501100115012001250130013501400145015001550160016501700Tooltip
SCHENKER XMG Neo 16 (Early 24) Intel Wi-Fi 6E AX211; iperf3 transmit AXE11000; iperf 3.1.3: Ø1018 (656-1248)
Razer Blade 16 2024, RTX 4090 Intel Killer Wi-Fi 7 BE1750W 320 MHz (BE200NGW); iperf3 transmit AXE11000; iperf 3.1.3: Ø1550 (796-1617)
Medion Erazer Beast X40 2024 Intel Wi-Fi 6E AX211; iperf3 transmit AXE11000; iperf 3.1.3: Ø636 (601-671)
SCHENKER XMG Neo 16 E23 Intel Wi-Fi 6E AX211; iperf3 transmit AXE11000; iperf 3.1.3: Ø1564 (642-1670)
SCHENKER XMG Neo 16 (Early 24) Intel Wi-Fi 6E AX211; iperf3 receive AXE11000; iperf 3.1.3: Ø1661 (843-1714)
Razer Blade 16 2024, RTX 4090 Intel Killer Wi-Fi 7 BE1750W 320 MHz (BE200NGW); iperf3 receive AXE11000; iperf 3.1.3: Ø1604 (1554-1623)
Medion Erazer Beast X40 2024 Intel Wi-Fi 6E AX211; iperf3 receive AXE11000; iperf 3.1.3: Ø1671 (1585-1711)
SCHENKER XMG Neo 16 E23 Intel Wi-Fi 6E AX211; iperf3 receive AXE11000; iperf 3.1.3: Ø1637 (839-1716)

Webbkamera

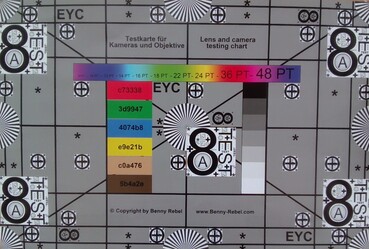
Webbkameran (2,1 MP) levererar genomsnittlig kvalitet och stöd för Windows Hello tillhandahålls. Dessutom finns det en mekanisk slutare.
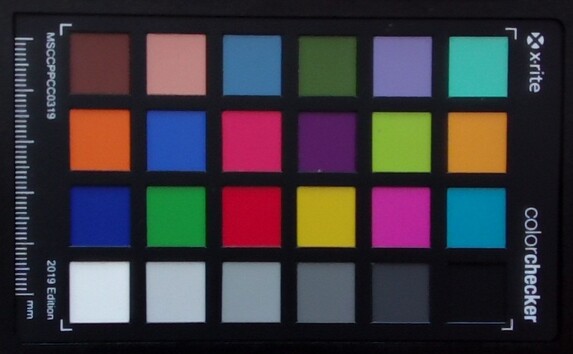
ColorChecker
11.8 ∆E
10.2 ∆E
7.3 ∆E
7.9 ∆E
6.3 ∆E
5.8 ∆E
13.2 ∆E
6.1 ∆E
11.7 ∆E
8.2 ∆E
5.3 ∆E
9.7 ∆E
6.9 ∆E
4.9 ∆E
4.7 ∆E
11.6 ∆E
9.2 ∆E
3.5 ∆E
8.6 ∆E
9.1 ∆E
9.6 ∆E
12.6 ∆E
12.7 ∆E
12 ∆E
ColorChecker SCHENKER XMG Neo 16 (Early 24): 8.7 ∆E min: 3.45 - max: 13.19 ∆E

Tillbehör

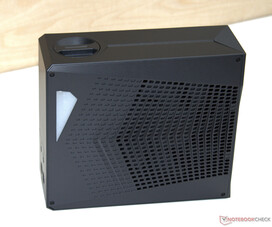
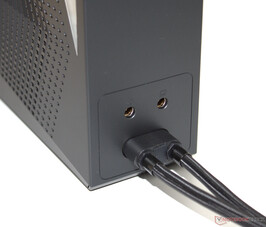
Den bärbara datorn levereras med ett USB-minne (drivrutiner, instruktioner), klistermärken och en musmatta. Ett valfritt tillbehör kommer i form av extern vattenkylning ($230).

Extern vattenkylning (Oasis Mk2)
Vattenröret är magnetiskt fixerat

Underhåll

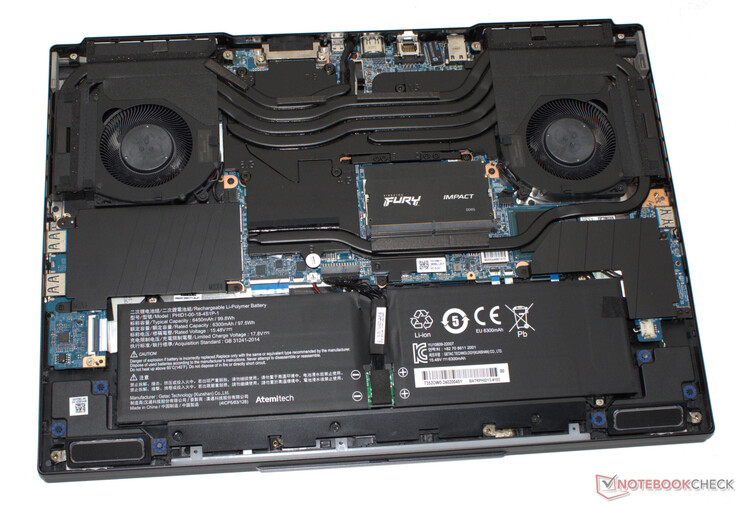
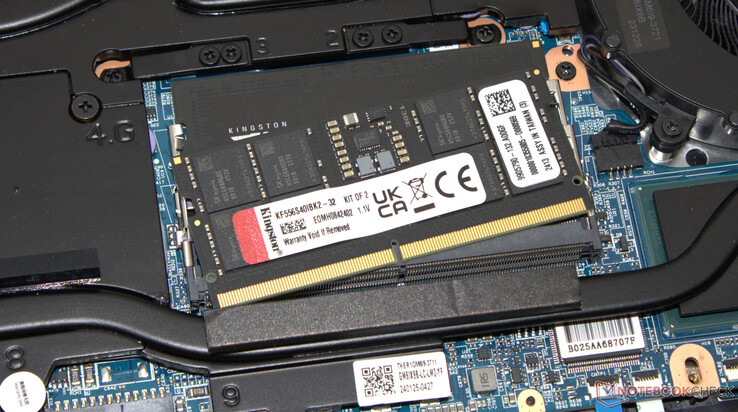
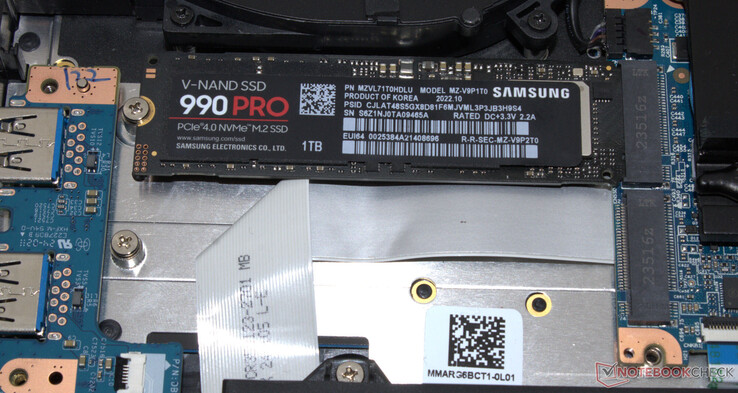
Efter att ha lossat alla skruvar på enhetens bas kan baslocket separeras antingen med hjälp av ett plektrum eller en platt spatel. Detta ger dig tillgång till RAM-bankerna (båda är upptagna), fläktarna och batteriet. SSD och SSD-platserna (PCIe 4, M.2 2280) och Wi-Fi-modulen täcks av ytterligare, skruvade plattor.

XMG Neo 16 (E24)-maskinvara

Garanti

Inom EU erbjuder Schenker en tvåårig grundgaranti inklusive upphämtningsservice och en 6-månaders snabb reparationsservice (reparationer inom 48 timmar). En 36-månadersgaranti kostar mellan 100 och 160 dollar - beroende på vilken snabb reparationsperiod som valts.

Inmatningsenheter - Ett tangentbord med individuell tangentbelysning

Tangentbord

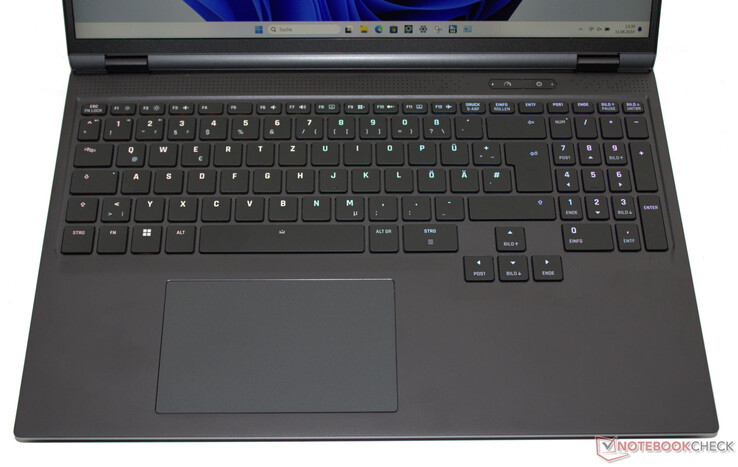
Du kunde tidigare beställa förra årets Neo 16 med ett mekaniskt tangentbord som tillval, men den nuvarande modellen har bara ett chiclet-tangentbord. Tangentbordet täcker hela den bärbara datorns bredd och det finns även ett numeriskt block och individuell tangentbelysning (RGB). De konkava, böjda tangenterna har medelstor rörelse, en väldefinierad tryckpunkt och ett mycket behagligt motstånd. Tangentbordet böjer sig inte när du skriver. Det som märks är hur bekväma de excentriska piltangenterna i full storlek är att använda - en förbättring jämfört med förra årets modell.

Pekplatta

Ett musalternativ är en multitouch-kompatibel clickpad (ca 12,3 x 7,7 cm), vars släta ytor gör det lätt som en plätt att utföra svepande gester. Den har kort rörelseväg och en tydlig tryckpunkt.

XMG Neo 16 (E24) tangentbord

Display - Schenker har valt en ljusstark IPS-panel

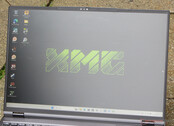
Den installerade 16-tumsskärmen (2.560 x 1.600 pixlar) saknar inget i fråga om ljusstyrka (~ 500 cd/m²) men kontrasten (1.000:1) kunde vara högre. När det gäller detta område är Blade 16:s OLED-panelen i Blade 16 ett bättre helhetspaket - på grund av sin design levererar den underbara svartvärden och kontrast. Generellt sett är de siffror som Neo 16 uppnår mer än tillräckligt för att kunna använda enheten inomhus. Utomhus är displayen läsbar, så länge solen inte är för stark. Några positiva aspekter är att den mycket responsiva, betraktningsvinkelstabila 16:10, 240 Hz-panelen (IPS, G-Sync) inte visar några tecken på PWM-flimmer oavsett ljusstyrka. Alternativa visningsalternativ är inte tillgängliga.

Subpixlar
Subpixlar
Ljusblödning
Ljusblödning
Friluftsliv
Friluftsliv
Betraktningsvinkel
Betraktningsvinkel
517
cd/m²
510
cd/m²
507
cd/m²
514
cd/m²
530
cd/m²
500
cd/m²
453
cd/m²
483
cd/m²
462
cd/m²
Distribution av ljusstyrkan
BOE NE160QDM-NZA tested with X-Rite i1Pro 2
Max: 530 cd/m² (Nits) Medel: 497.3 cd/m² Minimum: 26 cd/m²
Distribution av ljusstyrkan: 85 %
Mitt på batteriet: 530 cd/m²
Kontrast: 1000:1 (Svärta: 0.53 cd/m²)
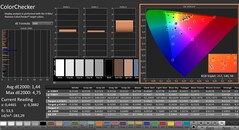
ΔE Color 3.21 | 0.5-29.43 Ø4.92, calibrated: 1.44
ΔE Greyscale 4.2 | 0.5-98 Ø5.2
70.6% AdobeRGB 1998 (Argyll 2.2.0 3D)
98% sRGB (Argyll 2.2.0 3D)
70.2% Display P3 (Argyll 2.2.0 3D)
Gamma: 2.226
SCHENKER XMG Neo 16 (Early 24)
BOE NE160QDM-NZA, IPS, 2560x1600, 16"
Razer Blade 16 2024, RTX 4090
Samsung SDC41AB (ATNA60DL03-0), OLED, 2560x1600, 16"
Medion Erazer Beast X40 2024
BOE NE170QDM-NZ1, IPS, 2560x1600, 17"
SCHENKER XMG Neo 16 E23
BOE0AF0 NE160QDM-NZ1, IPS, 2560x1600, 16"
Display
26%
-1%
-2%
Display P3 Coverage
70.2
99.1
41%
68.1
-3%
67.3
-4%
sRGB Coverage
98
99.9
2%
99.5
2%
96.7
-1%
AdobeRGB 1998 Coverage
70.6
95.6
35%
69
-2%
68.9
-2%
Response Times
95%
-20%
-49%
Response Time Grey 50% / Grey 80% *
11.2 ?(5.2, 6)
0.24 ?(0.15, 0.09)
98%
11.7 ?(5.7, 6)
-4%
14.5 ?(7.1, 7.4)
-29%
Response Time Black / White *
5.1 ?(1.6, 3.5)
0.4 ?(0.2, 0.2)
92%
6.9 ?(2.8, 4.1)
-35%
8.6 ?(3.9, 4.7)
-69%
PWM Frequency
960
Screen
251%
25%
15%
Brightness middle
530
418
-21%
422
-20%
372
-30%
Brightness
497
420
-15%
388
-22%
349
-30%
Brightness Distribution
85
98
15%
87
2%
88
4%
Black Level *
0.53
0.02
96%
0.42
21%
0.32
40%
Contrast
1000
20900
1990%
1005
1%
1163
16%
Colorchecker dE 2000 *
3.21
1.07
67%
1.42
56%
2.06
36%
Colorchecker dE 2000 max. *
5.8
4.04
30%
1.97
66%
3
48%
Colorchecker dE 2000 calibrated *
1.44
1.07
26%
0.7
51%
1.5
-4%
Greyscale dE 2000 *
4.2
1.12
73%
1.2
71%
1.9
55%
Gamma
2.226 99%
2.29 96%
2.078 106%
2.312 95%
CCT
6448 101%
6417 101%
6581 99%
6747 96%
Total Average (Program / Settings)
124% / 181%
1% / 13%
-12% / 2%

* ... smaller is better

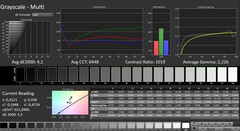
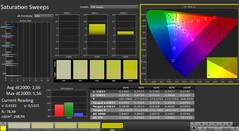
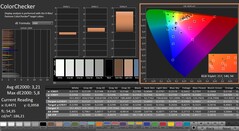
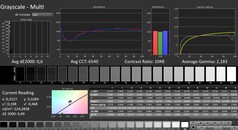
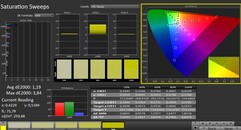
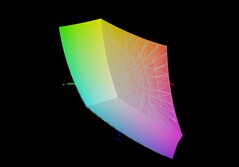
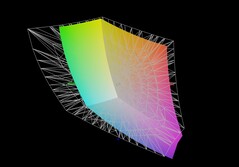
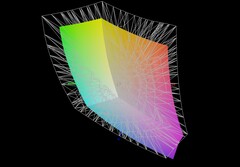
Direkt från start levererar skärmen en hyfsad färgåtergivning: Med en DeltaE på 3,2 missar avvikelsen precis målvärdet (DeltaE < 3). En kalibrering reducerar detta till 1,44 - en bra siffra. Av alla standardfärgrymder (AdobeRGB, sRGB, DCI P3) är panelen - precis som Erazer Beast X40:s display - bara visa sRGB-rymden nästan helt och hållet. Att visa alla tre färgrymderna är reserverat för OLED-panelen som finns i Blade 16.

Den färgprofil som vi har skapat kan laddas ner och användas kostnadsfritt. En länk finns i displayens informationsruta.

CalMAN: Gråskalor
CalMAN: Gråskalor
CalMAN: Färgmättnad
CalMAN: Färgmättnad
CalMAN: Färgkontroll
CalMAN: Gråskalor (kalibrerade)
CalMAN: Färgmättnad (kalibrerad)
CalMAN: ColorChecker (kalibrerad)
XMG Neo 16 E24 jämfört med sRGB
XMG Neo 16 E24 jämfört med AdobeRGB
XMG Neo 16 E24 mot DCI P3

Display Response Times

Display response times show how fast the screen is able to change from one color to the next. Slow response times can lead to afterimages and can cause moving objects to appear blurry (ghosting). Gamers of fast-paced 3D titles should pay special attention to fast response times.
       Response Time Black to White
5.1 ms ... rise ↗ and fall ↘ combined↗ 1.6 ms rise
↘ 3.5 ms fall
The screen shows very fast response rates in our tests and should be very well suited for fast-paced gaming.
In comparison, all tested devices range from 0.1 (minimum) to 240 (maximum) ms. » 14 % of all devices are better.
This means that the measured response time is better than the average of all tested devices (21 ms).
       Response Time 50% Grey to 80% Grey
11.2 ms ... rise ↗ and fall ↘ combined↗ 5.2 ms rise
↘ 6 ms fall
The screen shows good response rates in our tests, but may be too slow for competitive gamers.
In comparison, all tested devices range from 0.165 (minimum) to 636 (maximum) ms. » 21 % of all devices are better.
This means that the measured response time is better than the average of all tested devices (32.9 ms).

Screen Flickering / PWM (Pulse-Width Modulation)

To dim the screen, some notebooks will simply cycle the backlight on and off in rapid succession - a method called Pulse Width Modulation (PWM) . This cycling frequency should ideally be undetectable to the human eye. If said frequency is too low, users with sensitive eyes may experience strain or headaches or even notice the flickering altogether.
Screen flickering / PWM not detected

In comparison: 53 % of all tested devices do not use PWM to dim the display. If PWM was detected, an average of 8746 (minimum: 5 - maximum: 343500) Hz was measured.

100 % ljusstyrka
100 % ljusstyrka
75 % ljusstyrka
75 % ljusstyrka
50 % ljusstyrka
50 % ljusstyrka
25 % ljusstyrka
25 % ljusstyrka
0 % ljusstyrka
0 % ljusstyrka

Prestanda - Raptor Lake och Ada Lovelace garanterar massor av kraft

Neo 16 (Early 24) riktar sig till spelare, kreatörer och i allmänhet alla användargrupper som kräver mycket kraft. Varje specifikationsvariant är utrustad med en Core i9 14900HX och GPU-paletten sträcker sig från RTX 4060 till RTX 4090 - vår modell är en RTX 4090. Individuella konfigurationer och köp av den bärbara datorn är möjliga via Bestware.com (tyska). Granskningsenheten vi har här kan fås för cirka 4 000 $ med instegsmodellen (RTX 4060) som kostar cirka 2 000 $. Den valfria vattenkylningen ( Oasis MK2) ingår i modellerna RTX 4080 eller RTX 4090 Neo 16.

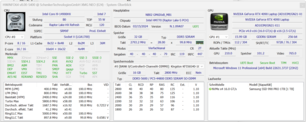
CPU-Z
CPU-Z
CPU-Z
CPU-Z
CPU-Z
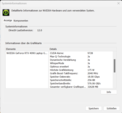
Nvidia systeminformation
GPU-Z
GPU-Z
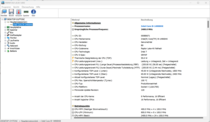
HWInfo
HWInfo


Testförhållanden

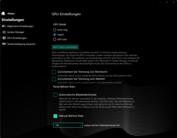
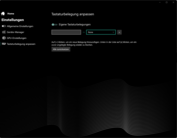
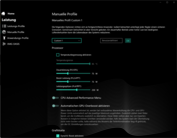
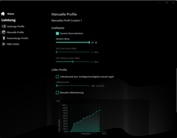
Du kan välja mellan tre tillverkarspecifika prestandalägen (se tabell). Under testet använde vi lägena "Overboost" (benchmarks) och "Balanced" (batteritest). GPU-läget var inställt på "Hybrid" (= Optimus). Du kan hantera enskilda profiler via kontrollcentret. Det innebär att du kan justera CPU Power Limit, GPU:ns TGP och/eller den övre temperaturgränsen. En separat knapp (bredvid strömbrytaren) gör det möjligt att snabbt växla mellan lägena.

Vi hade tillgång till den externa vattenkylningen (Oasis Mk2) som finns som tillval, men använde den inte under testningen. Trots detta gjorde vi några mätningar oberoende av de officiella testerna (se jämförelsetabellen).

Overboost Entusiast Balanserad
Effektbegränsning 1 (HWInfo) 205 watt 205 watt 205 watt
Effektgräns 2 (HWInfo) 205 Watt 205 Watt 205 Watt
Buller (Witcher 3) 54 dB(A) 51 dB(A) 32 dB(A)
Prestanda (Witcher 3) 214fps 198fps 30fps (lock)
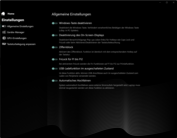
Kontrollcenter
Kontrollcenter
Kontrollcenter
Kontrollcenter
Kontrollcenter
Kontrollcenter
Kontrollcenter
Kontrollcenter
Kontrollcenter
Kontrollcenter
Kontrollcenter
Kontrollcenter
Kontrollcenter
Kontrollcenter
Kontrollcenter
Kontrollcenter

Processor

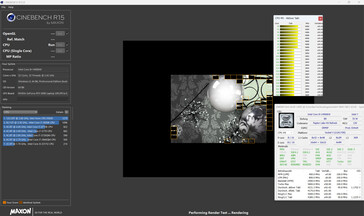
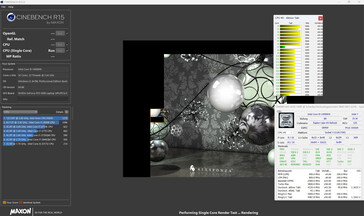
Den bärbara datorn drivs av en Core i9 14900HX (Raptor Lake) - andra processorer är inte tillgängliga. Core i9 erbjuder hela 24 kärnor (8P + 16E = 32 trådar) med en maxhastighet på 5,8 GHz (P) och 4,1 GHz (E). Kontinuerlig belastning med flera trådar (CB15-loop) resulterar i kontinuerligt men något minskande prestanda (Overboost) - användning av Oasis-vattenkylningen motverkar denna effekt. De andra två strömlägena säkerställer konsekvent prestanda även utan vattenkylning - naturligtvis på en låg nivå.

"Overboost" levererar CPU-siffror över genomsnittet och "Enthusiast" ligger något under genomsnittet - detta gäller främst multi-thread-prestandan. I var och en av de tre profilerna är single-thread-prestandan på en lika hög nivå. Vattenkylningen (Oasis), som finns som tillval, ger en liten prestandaförbättring.

Multi-thread (PSU)
Multi-thread (PSU)
Enkel tråd (batteri)

Cinebench R15 Multi Continuous Test

02805608401120140016801960224025202800308033603640392042004480476050405320Tooltip
SCHENKER XMG Neo 16 (Early 24) Intel Core i9-14900HX: Ø5001 (4861.45-5267.14)
Razer Blade 16 2024, RTX 4090 Intel Core i9-14900HX: Ø4396 (4349.72-4455.83)
Medion Erazer Beast X40 2024 Intel Core i9-14900HX: Ø3224 (3189.54-3263.11)
Asus ROG Strix Scar 17 G733PYV-LL053X AMD Ryzen 9 7945HX3D: Ø5282 (5177.32-5599.89)
SCHENKER XMG Neo 16 E23 Intel Core i9-13900HX: Ø4121 (3925.8-4598.23)
SCHENKER XMG Neo 16 (Early 24) Intel Core i9-14900HX; Overboost, Oasis: Ø5559 (5506.61-5589.71)
Lenovo Legion Pro 7 RTX4090 Intel Core i9-13900HX: Ø4469 (4358.72-4684.94)
Alienware x16 R2 P120F Intel Core Ultra 9 185H: Ø2753 (2708.56-2857.35)
Asus ROG Strix Scar 16 G634JZR Intel Core i9-14900HX: Ø4439 (4357.3-4809.43)
Lenovo Legion 9 16IRX9, RTX 4090 Intel Core i9-14900HX: Ø4648 (4505.52-4878.64)
CB15-slinga (överstyrning)
CB15-loop (Entusiast)
CB15-slinga (balanserad)
CB15-slinga (Overboost, Oasis)
CPU Performance Rating - Percent
SCHENKER XMG Neo 16 (Early 24)
Intel Core i9-14900HX
88.1 pt
SCHENKER XMG Neo 16 (Early 24)
Intel Core i9-14900HX
86.7 pt
Asus ROG Strix Scar 17 G733PYV-LL053X
AMD Ryzen 9 7945HX3D
81.5 pt
Asus ROG Strix Scar 16 G634JZR
Intel Core i9-14900HX
79.8 pt
Average Intel Core i9-14900HX
 
76.2 pt
Razer Blade 16 2024, RTX 4090
Intel Core i9-14900HX
76.1 pt
Lenovo Legion Pro 7 RTX4090 -2!
Intel Core i9-13900HX
75.4 pt
SCHENKER XMG Neo 16 E23 -2!
Intel Core i9-13900HX
75.3 pt
Medion Erazer Beast X40 2024
Intel Core i9-14900HX
70.1 pt
Lenovo Legion 9 16IRX9, RTX 4090
Intel Core i9-14900HX
69.9 pt
Average of class Gaming
 
60.8 pt
Alienware x16 R2 P120F
Intel Core Ultra 9 185H
51 pt
Cinebench R23
Multi Core
SCHENKER XMG Neo 16 (Early 24)
Intel Core i9-14900HX
36249 Points
SCHENKER XMG Neo 16 (Early 24)
Intel Core i9-14900HX (Overboost, Oasis)
36200 Points 0%
Asus ROG Strix Scar 17 G733PYV-LL053X
AMD Ryzen 9 7945HX3D
32782 Points -10%
Lenovo Legion 9 16IRX9, RTX 4090
Intel Core i9-14900HX
31889 Points -12%
Lenovo Legion Pro 7 RTX4090
Intel Core i9-13900HX
31109 Points -14%
Asus ROG Strix Scar 16 G634JZR
Intel Core i9-14900HX
30411 Points -16%
Average Intel Core i9-14900HX
  (17078 - 36249, n=34)
29130 Points -20%
SCHENKER XMG Neo 16 E23
Intel Core i9-13900HX
29082 Points -20%
Razer Blade 16 2024, RTX 4090
Intel Core i9-14900HX
28867 Points -20%
Medion Erazer Beast X40 2024
Intel Core i9-14900HX
22238 Points -39%
Average of class Gaming
  (5668 - 36249, n=193, last 2 years)
21651 Points -40%
Alienware x16 R2 P120F
Intel Core Ultra 9 185H
18338 (17139.2min - 18337.8max) Points -49%
Single Core
Medion Erazer Beast X40 2024
Intel Core i9-14900HX
2227 Points +1%
SCHENKER XMG Neo 16 (Early 24)
Intel Core i9-14900HX
2209 Points
SCHENKER XMG Neo 16 (Early 24)
Intel Core i9-14900HX (Overboost, Oasis)
2205 Points 0%
Asus ROG Strix Scar 16 G634JZR
Intel Core i9-14900HX
2193 Points -1%
Average Intel Core i9-14900HX
  (1720 - 2245, n=34)
2157 Points -2%
Razer Blade 16 2024, RTX 4090
Intel Core i9-14900HX
2117 Points -4%
SCHENKER XMG Neo 16 E23
Intel Core i9-13900HX
2076 Points -6%
Lenovo Legion Pro 7 RTX4090
Intel Core i9-13900HX
2039 Points -8%
Asus ROG Strix Scar 17 G733PYV-LL053X
AMD Ryzen 9 7945HX3D
1935 Points -12%
Average of class Gaming
  (1088 - 2235, n=191, last 2 years)
1877 Points -15%
Lenovo Legion 9 16IRX9, RTX 4090
Intel Core i9-14900HX
1720 Points -22%
Alienware x16 R2 P120F
Intel Core Ultra 9 185H
1620 Points -27%
Cinebench R20
CPU (Multi Core)
SCHENKER XMG Neo 16 (Early 24)
Intel Core i9-14900HX (Overboost, Oasis, Overboost, Oasis)
13832 Points 0%
SCHENKER XMG Neo 16 (Early 24)
Intel Core i9-14900HX
13824 Points
Asus ROG Strix Scar 17 G733PYV-LL053X
AMD Ryzen 9 7945HX3D
13033 Points -6%
Lenovo Legion 9 16IRX9, RTX 4090
Intel Core i9-14900HX
11960 Points -13%
Lenovo Legion Pro 7 RTX4090
Intel Core i9-13900HX
11637 Points -16%
Asus ROG Strix Scar 16 G634JZR
Intel Core i9-14900HX
11604 Points -16%
Average Intel Core i9-14900HX
  (6579 - 13832, n=34)
11084 Points -20%
SCHENKER XMG Neo 16 E23
Intel Core i9-13900HX
11010 Points -20%
Razer Blade 16 2024, RTX 4090
Intel Core i9-14900HX
10968 Points -21%
Medion Erazer Beast X40 2024
Intel Core i9-14900HX
8495 Points -39%
Average of class Gaming
  (2179 - 13832, n=191, last 2 years)
8240 Points -40%
Alienware x16 R2 P120F
Intel Core Ultra 9 185H
7081 Points -49%
CPU (Single Core)
Medion Erazer Beast X40 2024
Intel Core i9-14900HX
855 Points +1%
SCHENKER XMG Neo 16 (Early 24)
Intel Core i9-14900HX (Overboost, Oasis, Overboost, Oasis)
847 Points 0%
SCHENKER XMG Neo 16 (Early 24)
Intel Core i9-14900HX
844 Points
Asus ROG Strix Scar 16 G634JZR
Intel Core i9-14900HX
839 Points -1%
Average Intel Core i9-14900HX
  (657 - 859, n=34)
826 Points -2%
Razer Blade 16 2024, RTX 4090
Intel Core i9-14900HX
810 Points -4%
SCHENKER XMG Neo 16 E23
Intel Core i9-13900HX
797 Points -6%
Lenovo Legion Pro 7 RTX4090
Intel Core i9-13900HX
780 Points -8%
Asus ROG Strix Scar 17 G733PYV-LL053X
AMD Ryzen 9 7945HX3D
755 Points -11%
Average of class Gaming
  (427 - 856, n=191, last 2 years)
722 Points -14%
Lenovo Legion 9 16IRX9, RTX 4090
Intel Core i9-14900HX
657 Points -22%
Alienware x16 R2 P120F
Intel Core Ultra 9 185H
622 Points -26%
Cinebench R15
CPU Multi 64Bit
Asus ROG Strix Scar 17 G733PYV-LL053X
AMD Ryzen 9 7945HX3D
5600 (5177.32min - 5599.89max) Points +6%
SCHENKER XMG Neo 16 (Early 24)
Intel Core i9-14900HX (Overboost, Oasis)
5589 Points +6%
SCHENKER XMG Neo 16 (Early 24)
Intel Core i9-14900HX
5267 Points
Lenovo Legion 9 16IRX9, RTX 4090
Intel Core i9-14900HX
4879 (4505.52min - 4878.64max) Points -7%
Asus ROG Strix Scar 16 G634JZR
Intel Core i9-14900HX
4809 (4357.3min - 4809.43max) Points -9%
Lenovo Legion Pro 7 RTX4090
Intel Core i9-13900HX
4685 (4358.72min - 4684.94max) Points -11%
SCHENKER XMG Neo 16 E23
Intel Core i9-13900HX
4598 (3925.8min - 4598.23max) Points -13%
Average Intel Core i9-14900HX
  (3263 - 5589, n=35)
4462 Points -15%
Razer Blade 16 2024, RTX 4090
Intel Core i9-14900HX
4456 (4349.72min - 4455.83max) Points -15%
Average of class Gaming
  (905 - 5663, n=198, last 2 years)
3394 Points -36%
Medion Erazer Beast X40 2024
Intel Core i9-14900HX
3263 Points -38%
Alienware x16 R2 P120F
Intel Core Ultra 9 185H
2857 (2708.56min - 2857.35max) Points -46%
CPU Single 64Bit
SCHENKER XMG Neo 16 (Early 24)
Intel Core i9-14900HX (Overboost, Oasis)
318 Points +3%
Asus ROG Strix Scar 16 G634JZR
Intel Core i9-14900HX
316 Points +2%
Medion Erazer Beast X40 2024
Intel Core i9-14900HX
314 Points +1%
Asus ROG Strix Scar 17 G733PYV-LL053X
AMD Ryzen 9 7945HX3D
311 Points 0%
Razer Blade 16 2024, RTX 4090
Intel Core i9-14900HX
311 Points 0%
SCHENKER XMG Neo 16 (Early 24)
Intel Core i9-14900HX
310 Points
Average Intel Core i9-14900HX
  (247 - 323, n=34)
306 Points -1%
SCHENKER XMG Neo 16 E23
Intel Core i9-13900HX
301 Points -3%
Lenovo Legion Pro 7 RTX4090
Intel Core i9-13900HX
289 Points -7%
Average of class Gaming
  (176.6 - 318, n=195, last 2 years)
276 Points -11%
Lenovo Legion 9 16IRX9, RTX 4090
Intel Core i9-14900HX
247 Points -20%
Alienware x16 R2 P120F
Intel Core Ultra 9 185H
238 Points -23%
Blender - v2.79 BMW27 CPU
Alienware x16 R2 P120F
Intel Core Ultra 9 185H
178 Seconds * -87%
Average of class Gaming
  (87 - 555, n=186, last 2 years)
172.1 Seconds * -81%
Medion Erazer Beast X40 2024
Intel Core i9-14900HX
143 Seconds * -51%
Average Intel Core i9-14900HX
  (91 - 206, n=34)
119.5 Seconds * -26%
SCHENKER XMG Neo 16 E23
Intel Core i9-13900HX
117 Seconds * -23%
Razer Blade 16 2024, RTX 4090
Intel Core i9-14900HX
113 Seconds * -19%
Asus ROG Strix Scar 16 G634JZR
Intel Core i9-14900HX
110 Seconds * -16%
Lenovo Legion 9 16IRX9, RTX 4090
Intel Core i9-14900HX
106 Seconds * -12%
Lenovo Legion Pro 7 RTX4090
Intel Core i9-13900HX
105 Seconds * -11%
Asus ROG Strix Scar 17 G733PYV-LL053X
AMD Ryzen 9 7945HX3D
95 Seconds * -0%
SCHENKER XMG Neo 16 (Early 24)
Intel Core i9-14900HX
95 Seconds *
SCHENKER XMG Neo 16 (Early 24)
Intel Core i9-14900HX (Overboost, Oasis)
91 Seconds * +4%
7-Zip 18.03
7z b 4
SCHENKER XMG Neo 16 (Early 24)
Intel Core i9-14900HX (Overboost, Oasis)
136645 MIPS +1%
Asus ROG Strix Scar 17 G733PYV-LL053X
AMD Ryzen 9 7945HX3D
136201 MIPS +1%
SCHENKER XMG Neo 16 (Early 24)
Intel Core i9-14900HX
135229 MIPS
Lenovo Legion 9 16IRX9, RTX 4090
Intel Core i9-14900HX
125676 MIPS -7%
Lenovo Legion Pro 7 RTX4090
Intel Core i9-13900HX
122148 MIPS -10%
Asus ROG Strix Scar 16 G634JZR
Intel Core i9-14900HX
121465 MIPS -10%
Razer Blade 16 2024, RTX 4090
Intel Core i9-14900HX
115695 MIPS -14%
SCHENKER XMG Neo 16 E23
Intel Core i9-13900HX
115262 MIPS -15%
Average Intel Core i9-14900HX
  (66769 - 136645, n=34)
112494 MIPS -17%
Medion Erazer Beast X40 2024
Intel Core i9-14900HX
92386 MIPS -32%
Average of class Gaming
  (23795 - 140932, n=190, last 2 years)
84653 MIPS -37%
Alienware x16 R2 P120F
Intel Core Ultra 9 185H
67227 MIPS -50%
7z b 4 -mmt1
Asus ROG Strix Scar 17 G733PYV-LL053X
AMD Ryzen 9 7945HX3D
7573 MIPS +2%
Asus ROG Strix Scar 16 G634JZR
Intel Core i9-14900HX
7442 MIPS 0%
SCHENKER XMG Neo 16 (Early 24)
Intel Core i9-14900HX (Overboost, Oasis)
7441 MIPS 0%
SCHENKER XMG Neo 16 (Early 24)
Intel Core i9-14900HX
7406 MIPS
Medion Erazer Beast X40 2024
Intel Core i9-14900HX
7340 MIPS -1%
SCHENKER XMG Neo 16 E23
Intel Core i9-13900HX
7070 MIPS -5%
Razer Blade 16 2024, RTX 4090
Intel Core i9-14900HX
7018 MIPS -5%
Average Intel Core i9-14900HX
  (5452 - 7545, n=34)
7017 MIPS -5%
Lenovo Legion Pro 7 RTX4090
Intel Core i9-13900HX
6931 MIPS -6%
Average of class Gaming
  (4168 - 7581, n=190, last 2 years)
6281 MIPS -15%
Lenovo Legion 9 16IRX9, RTX 4090
Intel Core i9-14900HX
5452 MIPS -26%
Alienware x16 R2 P120F
Intel Core Ultra 9 185H
4502 MIPS -39%
Geekbench 6.3
Multi-Core
SCHENKER XMG Neo 16 (Early 24)
Intel Core i9-14900HX (6.2.1, Overboost, Oasis)
19665 Points +1%
SCHENKER XMG Neo 16 (Early 24)
Intel Core i9-14900HX (6.2.1)
19451 Points
Asus ROG Strix Scar 16 G634JZR
Intel Core i9-14900HX (6.2.1)
18590 Points -4%
Razer Blade 16 2024, RTX 4090
Intel Core i9-14900HX (6.2.1)
17559 Points -10%
Lenovo Legion 9 16IRX9, RTX 4090
Intel Core i9-14900HX (6.2.1)
17499 Points -10%
Average Intel Core i9-14900HX
  (13158 - 19665, n=34)
17369 Points -11%
Asus ROG Strix Scar 17 G733PYV-LL053X
AMD Ryzen 9 7945HX3D
16957 Points -13%
Medion Erazer Beast X40 2024
Intel Core i9-14900HX (6.2.1)
15849 Points -19%
Average of class Gaming
  (5340 - 19665, n=110, last 2 years)
14171 Points -27%
Alienware x16 R2 P120F
Intel Core Ultra 9 185H (6.2.1)
12825 Points -34%
Single-Core
SCHENKER XMG Neo 16 (Early 24)
Intel Core i9-14900HX (6.2.1)
3129 Points
SCHENKER XMG Neo 16 (Early 24)
Intel Core i9-14900HX (6.2.1, Overboost, Oasis)
3109 Points -1%
Medion Erazer Beast X40 2024
Intel Core i9-14900HX (6.2.1)
3077 Points -2%
Asus ROG Strix Scar 16 G634JZR
Intel Core i9-14900HX (6.2.1)
3025 Points -3%
Average Intel Core i9-14900HX
  (2419 - 3129, n=34)
2973 Points -5%
Razer Blade 16 2024, RTX 4090
Intel Core i9-14900HX (6.2.1)
2964 Points -5%
Asus ROG Strix Scar 17 G733PYV-LL053X
AMD Ryzen 9 7945HX3D
2916 Points -7%
Average of class Gaming
  (1490 - 3129, n=110, last 2 years)
2641 Points -16%
Lenovo Legion 9 16IRX9, RTX 4090
Intel Core i9-14900HX (6.2.1)
2419 Points -23%
Alienware x16 R2 P120F
Intel Core Ultra 9 185H (6.2.1)
2199 Points -30%
Geekbench 5.5
Multi-Core
SCHENKER XMG Neo 16 (Early 24)
Intel Core i9-14900HX (Overboost, Oasis)
23194 Points 0%
SCHENKER XMG Neo 16 (Early 24)
Intel Core i9-14900HX
23086 Points
Lenovo Legion 9 16IRX9, RTX 4090
Intel Core i9-14900HX
21642 Points -6%
Asus ROG Strix Scar 16 G634JZR
Intel Core i9-14900HX
21335 Points -8%
SCHENKER XMG Neo 16 E23
Intel Core i9-13900HX
21075 Points -9%
Lenovo Legion Pro 7 RTX4090
Intel Core i9-13900HX
20510 Points -11%
Asus ROG Strix Scar 17 G733PYV-LL053X
AMD Ryzen 9 7945HX3D
19875 Points -14%
Average Intel Core i9-14900HX
  (8618 - 23194, n=34)
19540 Points -15%
Razer Blade 16 2024, RTX 4090
Intel Core i9-14900HX
19372 Points -16%
Medion Erazer Beast X40 2024
Intel Core i9-14900HX
17082 Points -26%
Average of class Gaming
  (4557 - 23194, n=191, last 2 years)
14891 Points -35%
Alienware x16 R2 P120F
Intel Core Ultra 9 185H
12759 Points -45%
Single-Core
Asus ROG Strix Scar 16 G634JZR
Intel Core i9-14900HX
2210 Points +1%
SCHENKER XMG Neo 16 (Early 24)
Intel Core i9-14900HX (Overboost, Oasis)
2210 Points +1%
SCHENKER XMG Neo 16 (Early 24)
Intel Core i9-14900HX
2195 Points
Medion Erazer Beast X40 2024
Intel Core i9-14900HX
2168 Points -1%
Asus ROG Strix Scar 17 G733PYV-LL053X
AMD Ryzen 9 7945HX3D
2133 Points -3%
Razer Blade 16 2024, RTX 4090
Intel Core i9-14900HX
2131 Points -3%
Average Intel Core i9-14900HX
  (1669 - 2210, n=34)
2092 Points -5%
SCHENKER XMG Neo 16 E23
Intel Core i9-13900HX
2049 Points -7%
Lenovo Legion Pro 7 RTX4090
Intel Core i9-13900HX
2012 Points -8%
Average of class Gaming
  (986 - 2210, n=191, last 2 years)
1882 Points -14%
Lenovo Legion 9 16IRX9, RTX 4090
Intel Core i9-14900HX
1729 Points -21%
Alienware x16 R2 P120F
Intel Core Ultra 9 185H
1700 Points -23%
HWBOT x265 Benchmark v2.2 - 4k Preset
SCHENKER XMG Neo 16 (Early 24)
Intel Core i9-14900HX (Overboost, Oasis)
38.9 fps +10%
Asus ROG Strix Scar 17 G733PYV-LL053X
AMD Ryzen 9 7945HX3D
36.4 fps +3%
SCHENKER XMG Neo 16 (Early 24)
Intel Core i9-14900HX
35.3 fps
Lenovo Legion Pro 7 RTX4090
Intel Core i9-13900HX
32.2 fps -9%
Asus ROG Strix Scar 16 G634JZR
Intel Core i9-14900HX
32 fps -9%
SCHENKER XMG Neo 16 E23
Intel Core i9-13900HX
31 fps -12%
Lenovo Legion 9 16IRX9, RTX 4090
Intel Core i9-14900HX
30.7 fps -13%
Razer Blade 16 2024, RTX 4090
Intel Core i9-14900HX
30.1 fps -15%
Average Intel Core i9-14900HX
  (16.8 - 38.9, n=34)
29.7 fps -16%
Medion Erazer Beast X40 2024
Intel Core i9-14900HX
23.7 fps -33%
Average of class Gaming
  (6.72 - 38.9, n=190, last 2 years)
23.3 fps -34%
Alienware x16 R2 P120F
Intel Core Ultra 9 185H
20.7 fps -41%
LibreOffice - 20 Documents To PDF
Lenovo Legion 9 16IRX9, RTX 4090
Intel Core i9-14900HX (6.3.4.2)
53.6 s * -63%
Asus ROG Strix Scar 16 G634JZR
Intel Core i9-14900HX (6.3.4.2)
47.9 s * -46%
Average of class Gaming
  (31.4 - 96.6, n=187, last 2 years)
47.6 s * -45%
Razer Blade 16 2024, RTX 4090
Intel Core i9-14900HX (6.3.4.2)
47.5 s * -44%
Alienware x16 R2 P120F
Intel Core Ultra 9 185H (6.3.4.2)
45.9 s * -40%
Average Intel Core i9-14900HX
  (31.4 - 85.1, n=34)
43.4 s * -32%
Medion Erazer Beast X40 2024
Intel Core i9-14900HX (6.3.4.2)
42.8 s * -30%
Lenovo Legion Pro 7 RTX4090
Intel Core i9-13900HX
40.6 s * -23%
Asus ROG Strix Scar 17 G733PYV-LL053X
AMD Ryzen 9 7945HX3D
39 s * -19%
SCHENKER XMG Neo 16 E23
Intel Core i9-13900HX
37.3 s * -13%
SCHENKER XMG Neo 16 (Early 24)
Intel Core i9-14900HX (6.3.4.2)
32.9 s *
SCHENKER XMG Neo 16 (Early 24)
Intel Core i9-14900HX (6.3.4.2, Overboost, Oasis)
31.4 s * +5%
R Benchmark 2.5 - Overall mean
Alienware x16 R2 P120F
Intel Core Ultra 9 185H
0.503 sec * -38%
Lenovo Legion 9 16IRX9, RTX 4090
Intel Core i9-14900HX
0.4859 sec * -33%
Average of class Gaming
  (0.3609 - 0.759, n=191, last 2 years)
0.4402 sec * -20%
Asus ROG Strix Scar 17 G733PYV-LL053X
AMD Ryzen 9 7945HX3D
0.4127 sec * -13%
Lenovo Legion Pro 7 RTX4090
Intel Core i9-13900HX
0.401 sec * -10%
Average Intel Core i9-14900HX
  (0.3604 - 0.4859, n=34)
0.3845 sec * -5%
SCHENKER XMG Neo 16 (Early 24)
Intel Core i9-14900HX (Overboost, Oasis, Overboost, Oasis)
0.3826 sec * -5%
Razer Blade 16 2024, RTX 4090
Intel Core i9-14900HX
0.3789 sec * -4%
SCHENKER XMG Neo 16 E23
Intel Core i9-13900HX
0.375 sec * -3%
Medion Erazer Beast X40 2024
Intel Core i9-14900HX
0.3717 sec * -2%
Asus ROG Strix Scar 16 G634JZR
Intel Core i9-14900HX
0.3699 sec * -1%
SCHENKER XMG Neo 16 (Early 24)
Intel Core i9-14900HX
0.3658 sec *

* ... smaller is better

Cinebench R15 CPU Multi 64Bit
5267 Points
Cinebench R15 OpenGL 64Bit
281 fps
Cinebench R15 Ref. Match 64Bit
99.6 %
Cinebench R15 CPU Single 64Bit
310 Points
Cinebench R20 CPU (Single Core)
844 Points
Cinebench R20 CPU (Multi Core)
13824 Points
Cinebench R23 Multi Core
36249 Points
Cinebench R23 Single Core
2209 Points
Cinebench 2024 CPU Multi Core
1940 Points
Cinebench 2024 CPU Single Core
131.7 Points
Hjälp
Performance Rating
Asus ROG Strix Scar 17 G733PYV-LL053X
AMD Ryzen 9 7945HX3D, NVIDIA GeForce RTX 4090 Laptop GPU
95.6 pt
SCHENKER XMG Neo 16 (Early 24)
Intel Core i9-14900HX, NVIDIA GeForce RTX 4090 Laptop GPU
73.5 pt
SCHENKER XMG Neo 16 (Early 24)
Intel Core i9-14900HX, NVIDIA GeForce RTX 4090 Laptop GPU
70.2 pt
Asus ROG Strix Scar 16 G634JZR
Intel Core i9-14900HX, NVIDIA GeForce RTX 4080 Laptop GPU
65.2 pt
Lenovo Legion 9 16IRX9, RTX 4090
Intel Core i9-14900HX, NVIDIA GeForce RTX 4090 Laptop GPU
65.1 pt
Lenovo Legion Pro 7 RTX4090
Intel Core i9-13900HX, NVIDIA GeForce RTX 4090 Laptop GPU
63.1 pt
Razer Blade 16 2024, RTX 4090
Intel Core i9-14900HX, NVIDIA GeForce RTX 4090 Laptop GPU
61.1 pt
SCHENKER XMG Neo 16 E23
Intel Core i9-13900HX, NVIDIA GeForce RTX 4090 Laptop GPU
60.1 pt
Average Intel Core i9-14900HX
 
60.1 pt
Medion Erazer Beast X40 2024
Intel Core i9-14900HX, NVIDIA GeForce RTX 4090 Laptop GPU
51.7 pt
Average of class Gaming
 
49.7 pt
Alienware x16 R2 P120F
Intel Core Ultra 9 185H, NVIDIA GeForce RTX 4080 Laptop GPU
47.1 pt
AIDA64 / FP32 Ray-Trace
Asus ROG Strix Scar 17 G733PYV-LL053X
AMD Ryzen 9 7945HX3D, NVIDIA GeForce RTX 4090 Laptop GPU (v6.88.6413 Beta)
53908 KRay/s +75%
SCHENKER XMG Neo 16 (Early 24)
Intel Core i9-14900HX, NVIDIA GeForce RTX 4090 Laptop GPU (v6.92.6600, Overboost, Oasis)
33474 KRay/s +9%
SCHENKER XMG Neo 16 (Early 24)
Intel Core i9-14900HX, NVIDIA GeForce RTX 4090 Laptop GPU (v6.92.6600)
30829 KRay/s
Lenovo Legion 9 16IRX9, RTX 4090
Intel Core i9-14900HX, NVIDIA GeForce RTX 4090 Laptop GPU (v6.92.6600)
27535 KRay/s -11%
Lenovo Legion Pro 7 RTX4090
Intel Core i9-13900HX, NVIDIA GeForce RTX 4090 Laptop GPU (v6.85.6300)
27200 KRay/s -12%
Asus ROG Strix Scar 16 G634JZR
Intel Core i9-14900HX, NVIDIA GeForce RTX 4080 Laptop GPU (v6.92.6600)
26280 KRay/s -15%
Razer Blade 16 2024, RTX 4090
Intel Core i9-14900HX, NVIDIA GeForce RTX 4090 Laptop GPU (v6.92.6600)
25682 KRay/s -17%
Average Intel Core i9-14900HX
  (13098 - 33474, n=33)
25096 KRay/s -19%
SCHENKER XMG Neo 16 E23
Intel Core i9-13900HX, NVIDIA GeForce RTX 4090 Laptop GPU (v6.75.6100)
22497 KRay/s -27%
Average of class Gaming
  (4986 - 60169, n=187, last 2 years)
21640 KRay/s -30%
Medion Erazer Beast X40 2024
Intel Core i9-14900HX, NVIDIA GeForce RTX 4090 Laptop GPU (v6.92.6600)
20114 KRay/s -35%
Alienware x16 R2 P120F
Intel Core Ultra 9 185H, NVIDIA GeForce RTX 4080 Laptop GPU (v6.92.6600)
18676 KRay/s -39%
AIDA64 / FPU Julia
Asus ROG Strix Scar 17 G733PYV-LL053X
AMD Ryzen 9 7945HX3D, NVIDIA GeForce RTX 4090 Laptop GPU (v6.88.6413 Beta)
222115 Points +47%
SCHENKER XMG Neo 16 (Early 24)
Intel Core i9-14900HX, NVIDIA GeForce RTX 4090 Laptop GPU (v6.92.6600, Overboost, Oasis)
166040 Points +10%
SCHENKER XMG Neo 16 (Early 24)
Intel Core i9-14900HX, NVIDIA GeForce RTX 4090 Laptop GPU (v6.92.6600)
150728 Points
Lenovo Legion 9 16IRX9, RTX 4090
Intel Core i9-14900HX, NVIDIA GeForce RTX 4090 Laptop GPU (v6.92.6600)
136486 Points -9%
Lenovo Legion Pro 7 RTX4090
Intel Core i9-13900HX, NVIDIA GeForce RTX 4090 Laptop GPU (v6.85.6300)
135707 Points -10%
Razer Blade 16 2024, RTX 4090
Intel Core i9-14900HX, NVIDIA GeForce RTX 4090 Laptop GPU (v6.92.6600)
127908 Points -15%
Average Intel Core i9-14900HX
  (67573 - 166040, n=33)
125765 Points -17%
Asus ROG Strix Scar 16 G634JZR
Intel Core i9-14900HX, NVIDIA GeForce RTX 4080 Laptop GPU (v6.92.6600)
125593 Points -17%
SCHENKER XMG Neo 16 E23
Intel Core i9-13900HX, NVIDIA GeForce RTX 4090 Laptop GPU (v6.75.6100)
115346 Points -23%
Average of class Gaming
  (25360 - 252486, n=187, last 2 years)
106090 Points -30%
Medion Erazer Beast X40 2024
Intel Core i9-14900HX, NVIDIA GeForce RTX 4090 Laptop GPU (v6.92.6600)
103901 Points -31%
Alienware x16 R2 P120F
Intel Core Ultra 9 185H, NVIDIA GeForce RTX 4080 Laptop GPU (v6.92.6600)
96463 Points -36%
AIDA64 / CPU SHA3
Asus ROG Strix Scar 17 G733PYV-LL053X
AMD Ryzen 9 7945HX3D, NVIDIA GeForce RTX 4090 Laptop GPU (v6.88.6413 Beta)
9582 MB/s +26%
SCHENKER XMG Neo 16 (Early 24)
Intel Core i9-14900HX, NVIDIA GeForce RTX 4090 Laptop GPU (v6.92.6600, Overboost, Oasis)
7979 MB/s +5%
SCHENKER XMG Neo 16 (Early 24)
Intel Core i9-14900HX, NVIDIA GeForce RTX 4090 Laptop GPU (v6.92.6600)
7588 MB/s
Lenovo Legion 9 16IRX9, RTX 4090
Intel Core i9-14900HX, NVIDIA GeForce RTX 4090 Laptop GPU (v6.92.6600)
7000 MB/s -8%
Lenovo Legion Pro 7 RTX4090
Intel Core i9-13900HX, NVIDIA GeForce RTX 4090 Laptop GPU (v6.85.6300)
6705 MB/s -12%
Asus ROG Strix Scar 16 G634JZR
Intel Core i9-14900HX, NVIDIA GeForce RTX 4080 Laptop GPU (v6.92.6600)
6666 MB/s -12%
Average Intel Core i9-14900HX
  (3589 - 7979, n=33)
6212 MB/s -18%
Razer Blade 16 2024, RTX 4090
Intel Core i9-14900HX, NVIDIA GeForce RTX 4090 Laptop GPU (v6.92.6600)
6188 MB/s -18%
SCHENKER XMG Neo 16 E23
Intel Core i9-13900HX, NVIDIA GeForce RTX 4090 Laptop GPU (v6.75.6100)
6112 MB/s -19%
Medion Erazer Beast X40 2024
Intel Core i9-14900HX, NVIDIA GeForce RTX 4090 Laptop GPU (v6.92.6600)
4905 MB/s -35%
Average of class Gaming
  (1339 - 10389, n=187, last 2 years)
4852 MB/s -36%
Alienware x16 R2 P120F
Intel Core Ultra 9 185H, NVIDIA GeForce RTX 4080 Laptop GPU (v6.92.6600)
4534 MB/s -40%
AIDA64 / CPU Queen
Asus ROG Strix Scar 17 G733PYV-LL053X
AMD Ryzen 9 7945HX3D, NVIDIA GeForce RTX 4090 Laptop GPU (v6.88.6413 Beta)
181270 Points +22%
SCHENKER XMG Neo 16 (Early 24)
Intel Core i9-14900HX, NVIDIA GeForce RTX 4090 Laptop GPU (v6.92.6600)
148966 Points
SCHENKER XMG Neo 16 (Early 24)
Intel Core i9-14900HX, NVIDIA GeForce RTX 4090 Laptop GPU (v6.92.6600, Overboost, Oasis)
148609 Points 0%
Asus ROG Strix Scar 16 G634JZR
Intel Core i9-14900HX, NVIDIA GeForce RTX 4080 Laptop GPU (v6.92.6600)
144073 Points -3%
Average Intel Core i9-14900HX
  (118405 - 148966, n=33)
138709 Points -7%
Razer Blade 16 2024, RTX 4090
Intel Core i9-14900HX, NVIDIA GeForce RTX 4090 Laptop GPU (v6.92.6600)
138473 Points -7%
SCHENKER XMG Neo 16 E23
Intel Core i9-13900HX, NVIDIA GeForce RTX 4090 Laptop GPU (v6.75.6100)
135672 Points -9%
Lenovo Legion Pro 7 RTX4090
Intel Core i9-13900HX, NVIDIA GeForce RTX 4090 Laptop GPU (v6.85.6300)
134965 Points -9%
Medion Erazer Beast X40 2024
Intel Core i9-14900HX, NVIDIA GeForce RTX 4090 Laptop GPU (v6.92.6600)
132613 Points -11%
Lenovo Legion 9 16IRX9, RTX 4090
Intel Core i9-14900HX, NVIDIA GeForce RTX 4090 Laptop GPU (v6.92.6600)
130803 Points -12%
Average of class Gaming
  (50699 - 200651, n=187, last 2 years)
116237 Points -22%
Alienware x16 R2 P120F
Intel Core Ultra 9 185H, NVIDIA GeForce RTX 4080 Laptop GPU (v6.92.6600)
94794 Points -36%
AIDA64 / FPU SinJulia
Asus ROG Strix Scar 17 G733PYV-LL053X
AMD Ryzen 9 7945HX3D, NVIDIA GeForce RTX 4090 Laptop GPU (v6.88.6413 Beta)
29487 Points +63%
SCHENKER XMG Neo 16 (Early 24)
Intel Core i9-14900HX, NVIDIA GeForce RTX 4090 Laptop GPU (v6.92.6600, Overboost, Oasis)
18517 Points +2%
SCHENKER XMG Neo 16 (Early 24)
Intel Core i9-14900HX, NVIDIA GeForce RTX 4090 Laptop GPU (v6.92.6600)
18114 Points
Lenovo Legion 9 16IRX9, RTX 4090
Intel Core i9-14900HX, NVIDIA GeForce RTX 4090 Laptop GPU (v6.92.6600)
16268 Points -10%
Asus ROG Strix Scar 16 G634JZR
Intel Core i9-14900HX, NVIDIA GeForce RTX 4080 Laptop GPU (v6.92.6600)
16108 Points -11%
Razer Blade 16 2024, RTX 4090
Intel Core i9-14900HX, NVIDIA GeForce RTX 4090 Laptop GPU (v6.92.6600)
15857 Points -12%
Lenovo Legion Pro 7 RTX4090
Intel Core i9-13900HX, NVIDIA GeForce RTX 4090 Laptop GPU (v6.85.6300)
15447 Points -15%
Average Intel Core i9-14900HX
  (10475 - 18517, n=33)
15369 Points -15%
SCHENKER XMG Neo 16 E23
Intel Core i9-13900HX, NVIDIA GeForce RTX 4090 Laptop GPU (v6.75.6100)
14811 Points -18%
Medion Erazer Beast X40 2024
Intel Core i9-14900HX, NVIDIA GeForce RTX 4090 Laptop GPU (v6.92.6600)
13541 Points -25%
Average of class Gaming
  (4800 - 32988, n=187, last 2 years)
13175 Points -27%
Alienware x16 R2 P120F
Intel Core Ultra 9 185H, NVIDIA GeForce RTX 4080 Laptop GPU (v6.92.6600)
11095 Points -39%
AIDA64 / FPU Mandel
Asus ROG Strix Scar 17 G733PYV-LL053X
AMD Ryzen 9 7945HX3D, NVIDIA GeForce RTX 4090 Laptop GPU (v6.88.6413 Beta)
118813 Points +55%
SCHENKER XMG Neo 16 (Early 24)
Intel Core i9-14900HX, NVIDIA GeForce RTX 4090 Laptop GPU (v6.92.6600, Overboost, Oasis)
83662 Points +9%
SCHENKER XMG Neo 16 (Early 24)
Intel Core i9-14900HX, NVIDIA GeForce RTX 4090 Laptop GPU (v6.92.6600)
76668 Points
Lenovo Legion 9 16IRX9, RTX 4090
Intel Core i9-14900HX, NVIDIA GeForce RTX 4090 Laptop GPU (v6.92.6600)
68467 Points -11%
Lenovo Legion Pro 7 RTX4090
Intel Core i9-13900HX, NVIDIA GeForce RTX 4090 Laptop GPU (v6.85.6300)
67013 Points -13%
Asus ROG Strix Scar 16 G634JZR
Intel Core i9-14900HX, NVIDIA GeForce RTX 4080 Laptop GPU (v6.92.6600)
64437 Points -16%
Razer Blade 16 2024, RTX 4090
Intel Core i9-14900HX, NVIDIA GeForce RTX 4090 Laptop GPU (v6.92.6600)
64134 Points -16%
Average Intel Core i9-14900HX
  (32543 - 83662, n=33)
61872 Points -19%
SCHENKER XMG Neo 16 E23
Intel Core i9-13900HX, NVIDIA GeForce RTX 4090 Laptop GPU (v6.75.6100)
55564 Points -28%
Average of class Gaming
  (12321 - 134044, n=187, last 2 years)
53471 Points -30%
Medion Erazer Beast X40 2024
Intel Core i9-14900HX, NVIDIA GeForce RTX 4090 Laptop GPU
50393 Points -34%
Alienware x16 R2 P120F
Intel Core Ultra 9 185H, NVIDIA GeForce RTX 4080 Laptop GPU (v6.92.6600)
48020 Points -37%
AIDA64 / CPU AES
Asus ROG Strix Scar 17 G733PYV-LL053X
AMD Ryzen 9 7945HX3D, NVIDIA GeForce RTX 4090 Laptop GPU (v6.88.6413 Beta)
328679 MB/s +126%
Asus ROG Strix Scar 16 G634JZR
Intel Core i9-14900HX, NVIDIA GeForce RTX 4080 Laptop GPU (v6.92.6600)
226181 MB/s +56%
SCHENKER XMG Neo 16 E23
Intel Core i9-13900HX, NVIDIA GeForce RTX 4090 Laptop GPU (v6.75.6100)
210913 MB/s +45%
SCHENKER XMG Neo 16 (Early 24)
Intel Core i9-14900HX, NVIDIA GeForce RTX 4090 Laptop GPU (v6.92.6600, Overboost, Oasis)
152317 MB/s +5%
SCHENKER XMG Neo 16 (Early 24)
Intel Core i9-14900HX, NVIDIA GeForce RTX 4090 Laptop GPU (v6.92.6600)
145389 MB/s
Average Intel Core i9-14900HX
  (86964 - 241777, n=33)
137399 MB/s -5%
Lenovo Legion 9 16IRX9, RTX 4090
Intel Core i9-14900HX, NVIDIA GeForce RTX 4090 Laptop GPU (v6.92.6600)
133395 MB/s -8%
Lenovo Legion Pro 7 RTX4090
Intel Core i9-13900HX, NVIDIA GeForce RTX 4090 Laptop GPU (v6.85.6300)
128778 MB/s -11%
Razer Blade 16 2024, RTX 4090
Intel Core i9-14900HX, NVIDIA GeForce RTX 4090 Laptop GPU (v6.92.6600)
122937 MB/s -15%
Average of class Gaming
  (19065 - 328679, n=187, last 2 years)
109176 MB/s -25%
Medion Erazer Beast X40 2024
Intel Core i9-14900HX, NVIDIA GeForce RTX 4090 Laptop GPU (v6.92.6600)
99333 MB/s -32%
Alienware x16 R2 P120F
Intel Core Ultra 9 185H, NVIDIA GeForce RTX 4080 Laptop GPU (v6.92.6600)
88763 MB/s -39%
AIDA64 / CPU ZLib
SCHENKER XMG Neo 16 (Early 24)
Intel Core i9-14900HX, NVIDIA GeForce RTX 4090 Laptop GPU (v6.92.6600, Overboost, Oasis)
2292 MB/s +2%
SCHENKER XMG Neo 16 (Early 24)
Intel Core i9-14900HX, NVIDIA GeForce RTX 4090 Laptop GPU (v6.92.6600)
2239 MB/s
Asus ROG Strix Scar 17 G733PYV-LL053X
AMD Ryzen 9 7945HX3D, NVIDIA GeForce RTX 4090 Laptop GPU (v6.88.6413 Beta)
2043 MB/s -9%
Lenovo Legion 9 16IRX9, RTX 4090
Intel Core i9-14900HX, NVIDIA GeForce RTX 4090 Laptop GPU (v6.92.6600)
2043 MB/s -9%
Lenovo Legion Pro 7 RTX4090
Intel Core i9-13900HX, NVIDIA GeForce RTX 4090 Laptop GPU (v6.85.6300)
1936 MB/s -14%
Razer Blade 16 2024, RTX 4090
Intel Core i9-14900HX, NVIDIA GeForce RTX 4090 Laptop GPU (v6.92.6600)
1863 MB/s -17%
Asus ROG Strix Scar 16 G634JZR
Intel Core i9-14900HX, NVIDIA GeForce RTX 4080 Laptop GPU (v6.92.6600)
1861 MB/s -17%
Average Intel Core i9-14900HX
  (1054 - 2292, n=33)
1815 MB/s -19%
SCHENKER XMG Neo 16 E23
Intel Core i9-13900HX, NVIDIA GeForce RTX 4090 Laptop GPU (v6.75.6100)
1772 MB/s -21%
Medion Erazer Beast X40 2024
Intel Core i9-14900HX, NVIDIA GeForce RTX 4090 Laptop GPU (v6.92.6600)
1443 MB/s -36%
Average of class Gaming
  (373 - 2409, n=187, last 2 years)
1349 MB/s -40%
Alienware x16 R2 P120F
Intel Core Ultra 9 185H, NVIDIA GeForce RTX 4080 Laptop GPU (v6.92.6600)
1298 MB/s -42%
AIDA64 / FP64 Ray-Trace
Asus ROG Strix Scar 17 G733PYV-LL053X
AMD Ryzen 9 7945HX3D, NVIDIA GeForce RTX 4090 Laptop GPU (v6.88.6413 Beta)
29140 KRay/s +75%
SCHENKER XMG Neo 16 (Early 24)
Intel Core i9-14900HX, NVIDIA GeForce RTX 4090 Laptop GPU (v6.92.6600, Overboost, Oasis)
18349 KRay/s +10%
SCHENKER XMG Neo 16 (Early 24)
Intel Core i9-14900HX, NVIDIA GeForce RTX 4090 Laptop GPU (v6.92.6600)
16655 KRay/s
Lenovo Legion 9 16IRX9, RTX 4090
Intel Core i9-14900HX, NVIDIA GeForce RTX 4090 Laptop GPU (v6.92.6600)
14791 KRay/s -11%
Lenovo Legion Pro 7 RTX4090
Intel Core i9-13900HX, NVIDIA GeForce RTX 4090 Laptop GPU (v6.85.6300)
14508 KRay/s -13%
Asus ROG Strix Scar 16 G634JZR
Intel Core i9-14900HX, NVIDIA GeForce RTX 4080 Laptop GPU (v6.92.6600)
14033 KRay/s -16%
Razer Blade 16 2024, RTX 4090
Intel Core i9-14900HX, NVIDIA GeForce RTX 4090 Laptop GPU (v6.92.6600)
13993 KRay/s -16%
Average Intel Core i9-14900HX
  (6809 - 18349, n=33)
13525 KRay/s -19%
SCHENKER XMG Neo 16 E23
Intel Core i9-13900HX, NVIDIA GeForce RTX 4090 Laptop GPU (v6.75.6100)
12069 KRay/s -28%
Average of class Gaming
  (2540 - 31796, n=187, last 2 years)
11654 KRay/s -30%
Medion Erazer Beast X40 2024
Intel Core i9-14900HX, NVIDIA GeForce RTX 4090 Laptop GPU (v6.92.6600)
10990 KRay/s -34%
Alienware x16 R2 P120F
Intel Core Ultra 9 185H, NVIDIA GeForce RTX 4080 Laptop GPU (v6.92.6600)
10078 KRay/s -39%
AIDA64 / CPU PhotoWorxx
Lenovo Legion 9 16IRX9, RTX 4090
Intel Core i9-14900HX, NVIDIA GeForce RTX 4090 Laptop GPU (v6.92.6600)
54702 MPixel/s +11%
Alienware x16 R2 P120F
Intel Core Ultra 9 185H, NVIDIA GeForce RTX 4080 Laptop GPU (v6.92.6600)
53242 MPixel/s +8%
Lenovo Legion Pro 7 RTX4090
Intel Core i9-13900HX, NVIDIA GeForce RTX 4090 Laptop GPU (v6.85.6300)
50637 MPixel/s +3%
Asus ROG Strix Scar 16 G634JZR
Intel Core i9-14900HX, NVIDIA GeForce RTX 4080 Laptop GPU (v6.92.6600)
49769 MPixel/s +1%
Razer Blade 16 2024, RTX 4090
Intel Core i9-14900HX, NVIDIA GeForce RTX 4090 Laptop GPU (v6.92.6600)
49616 MPixel/s +1%
SCHENKER XMG Neo 16 (Early 24)
Intel Core i9-14900HX, NVIDIA GeForce RTX 4090 Laptop GPU (v6.92.6600, Overboost, Oasis)
49399 MPixel/s 0%
SCHENKER XMG Neo 16 (Early 24)
Intel Core i9-14900HX, NVIDIA GeForce RTX 4090 Laptop GPU (v6.92.6600)
49305 MPixel/s
Medion Erazer Beast X40 2024
Intel Core i9-14900HX, NVIDIA GeForce RTX 4090 Laptop GPU (v6.92.6600)
49089 MPixel/s 0%
SCHENKER XMG Neo 16 E23
Intel Core i9-13900HX, NVIDIA GeForce RTX 4090 Laptop GPU (v6.75.6100)
48753 MPixel/s -1%
Average Intel Core i9-14900HX
  (23903 - 54702, n=33)
46637 MPixel/s -5%
Average of class Gaming
  (10805 - 60161, n=188, last 2 years)
39919 MPixel/s -19%
Asus ROG Strix Scar 17 G733PYV-LL053X
AMD Ryzen 9 7945HX3D, NVIDIA GeForce RTX 4090 Laptop GPU (v6.88.6413 Beta)
36406 MPixel/s -26%

Systemets prestanda

Listan över specifikationer ger redan bort det: Det råder ingen brist på datorkraft - inte minst bekräftas detta av de mycket goda PCMark-poängen. Gaming, streaming och rendering borde vara den snabba datorns huvudsakliga användningsområden. RAM-minnets överföringshastigheter ligger på en normal nivå för DDR5 5600 RAM.

RAM-minnet körs i dual-channel-läge.
PCMark 10 / Score
Asus ROG Strix Scar 17 G733PYV-LL053X
NVIDIA GeForce RTX 4090 Laptop GPU, R9 7945HX3D, SK hynix PC801 HFS001TEJ9X101N
9117 Points +1%
SCHENKER XMG Neo 16 (Early 24)
NVIDIA GeForce RTX 4090 Laptop GPU, i9-14900HX, Samsung 990 Pro 1 TB
9017 Points
Medion Erazer Beast X40 2024
NVIDIA GeForce RTX 4090 Laptop GPU, i9-14900HX, Phison E18-1TB-PHISON-SSD-BICS5
8963 Points -1%
Average Intel Core i9-14900HX, NVIDIA GeForce RTX 4090 Laptop GPU
  (8230 - 9234, n=13)
8674 Points -4%
Razer Blade 16 2024, RTX 4090
NVIDIA GeForce RTX 4090 Laptop GPU, i9-14900HX, Samsung PM9A1 MZVL22T0HBLB
8401 Points -7%
SCHENKER XMG Neo 16 E23
NVIDIA GeForce RTX 4090 Laptop GPU, i9-13900HX, Crucial P5 Plus 1TB CT1000P5PSSD8
8374 Points -7%
Lenovo Legion 9 16IRX9, RTX 4090
NVIDIA GeForce RTX 4090 Laptop GPU, i9-14900HX, Micron 3400 2TB MTFDKBA2T0TFH
8239 Points -9%
Lenovo Legion Pro 7 RTX4090
NVIDIA GeForce RTX 4090 Laptop GPU, i9-13900HX, Samsung PM9A1 MZVL21T0HCLR
8158 Points -10%
Average of class Gaming
  (5776 - 9852, n=168, last 2 years)
7774 Points -14%
Asus ROG Strix Scar 16 G634JZR
NVIDIA GeForce RTX 4080 Laptop GPU, i9-14900HX, SK hynix PC801 HFS002TEJ9X101N
7703 Points -15%
Alienware x16 R2 P120F
NVIDIA GeForce RTX 4080 Laptop GPU, Ultra 9 185H, WDC PC SN810 1TB
7251 Points -20%
PCMark 10 / Essentials
Asus ROG Strix Scar 16 G634JZR
NVIDIA GeForce RTX 4080 Laptop GPU, i9-14900HX, SK hynix PC801 HFS002TEJ9X101N
11617 Points +5%
Asus ROG Strix Scar 17 G733PYV-LL053X
NVIDIA GeForce RTX 4090 Laptop GPU, R9 7945HX3D, SK hynix PC801 HFS001TEJ9X101N
11561 Points +4%
Average Intel Core i9-14900HX, NVIDIA GeForce RTX 4090 Laptop GPU
  (10778 - 11628, n=13)
11125 Points +1%
Lenovo Legion Pro 7 RTX4090
NVIDIA GeForce RTX 4090 Laptop GPU, i9-13900HX, Samsung PM9A1 MZVL21T0HCLR
11091 Points 0%
SCHENKER XMG Neo 16 (Early 24)
NVIDIA GeForce RTX 4090 Laptop GPU, i9-14900HX, Samsung 990 Pro 1 TB
11065 Points
Lenovo Legion 9 16IRX9, RTX 4090
NVIDIA GeForce RTX 4090 Laptop GPU, i9-14900HX, Micron 3400 2TB MTFDKBA2T0TFH
11007 Points -1%
SCHENKER XMG Neo 16 E23
NVIDIA GeForce RTX 4090 Laptop GPU, i9-13900HX, Crucial P5 Plus 1TB CT1000P5PSSD8
10972 Points -1%
Razer Blade 16 2024, RTX 4090
NVIDIA GeForce RTX 4090 Laptop GPU, i9-14900HX, Samsung PM9A1 MZVL22T0HBLB
10915 Points -1%
Medion Erazer Beast X40 2024
NVIDIA GeForce RTX 4090 Laptop GPU, i9-14900HX, Phison E18-1TB-PHISON-SSD-BICS5
10871 Points -2%
Average of class Gaming
  (9057 - 12334, n=167, last 2 years)
10836 Points -2%
Alienware x16 R2 P120F
NVIDIA GeForce RTX 4080 Laptop GPU, Ultra 9 185H, WDC PC SN810 1TB
10036 Points -9%
PCMark 10 / Productivity
Medion Erazer Beast X40 2024
NVIDIA GeForce RTX 4090 Laptop GPU, i9-14900HX, Phison E18-1TB-PHISON-SSD-BICS5
11759 Points +1%
SCHENKER XMG Neo 16 (Early 24)
NVIDIA GeForce RTX 4090 Laptop GPU, i9-14900HX, Samsung 990 Pro 1 TB
11681 Points
Razer Blade 16 2024, RTX 4090
NVIDIA GeForce RTX 4090 Laptop GPU, i9-14900HX, Samsung PM9A1 MZVL22T0HBLB
11150 Points -5%
Asus ROG Strix Scar 17 G733PYV-LL053X
NVIDIA GeForce RTX 4090 Laptop GPU, R9 7945HX3D, SK hynix PC801 HFS001TEJ9X101N
10881 Points -7%
Average Intel Core i9-14900HX, NVIDIA GeForce RTX 4090 Laptop GPU
  (9458 - 11759, n=13)
10610 Points -9%
Lenovo Legion 9 16IRX9, RTX 4090
NVIDIA GeForce RTX 4090 Laptop GPU, i9-14900HX, Micron 3400 2TB MTFDKBA2T0TFH
10202 Points -13%
Average of class Gaming
  (6662 - 14612, n=167, last 2 years)
9878 Points -15%
SCHENKER XMG Neo 16 E23
NVIDIA GeForce RTX 4090 Laptop GPU, i9-13900HX, Crucial P5 Plus 1TB CT1000P5PSSD8
9837 Points -16%
Lenovo Legion Pro 7 RTX4090
NVIDIA GeForce RTX 4090 Laptop GPU, i9-13900HX, Samsung PM9A1 MZVL21T0HCLR
9089 Points -22%
Alienware x16 R2 P120F
NVIDIA GeForce RTX 4080 Laptop GPU, Ultra 9 185H, WDC PC SN810 1TB
7934 Points -32%
Asus ROG Strix Scar 16 G634JZR
NVIDIA GeForce RTX 4080 Laptop GPU, i9-14900HX, SK hynix PC801 HFS002TEJ9X101N
6662 Points -43%
PCMark 10 / Digital Content Creation
Asus ROG Strix Scar 17 G733PYV-LL053X
NVIDIA GeForce RTX 4090 Laptop GPU, R9 7945HX3D, SK hynix PC801 HFS001TEJ9X101N
16348 Points +6%
Asus ROG Strix Scar 16 G634JZR
NVIDIA GeForce RTX 4080 Laptop GPU, i9-14900HX, SK hynix PC801 HFS002TEJ9X101N
16027 Points +4%
SCHENKER XMG Neo 16 (Early 24)
NVIDIA GeForce RTX 4090 Laptop GPU, i9-14900HX, Samsung 990 Pro 1 TB
15394 Points
Medion Erazer Beast X40 2024
NVIDIA GeForce RTX 4090 Laptop GPU, i9-14900HX, Phison E18-1TB-PHISON-SSD-BICS5
15287 Points -1%
Average Intel Core i9-14900HX, NVIDIA GeForce RTX 4090 Laptop GPU
  (13219 - 16462, n=13)
15042 Points -2%
SCHENKER XMG Neo 16 E23
NVIDIA GeForce RTX 4090 Laptop GPU, i9-13900HX, Crucial P5 Plus 1TB CT1000P5PSSD8
14764 Points -4%
Lenovo Legion Pro 7 RTX4090
NVIDIA GeForce RTX 4090 Laptop GPU, i9-13900HX, Samsung PM9A1 MZVL21T0HCLR
14614 Points -5%
Lenovo Legion 9 16IRX9, RTX 4090
NVIDIA GeForce RTX 4090 Laptop GPU, i9-14900HX, Micron 3400 2TB MTFDKBA2T0TFH
13516 Points -12%
Razer Blade 16 2024, RTX 4090
NVIDIA GeForce RTX 4090 Laptop GPU, i9-14900HX, Samsung PM9A1 MZVL22T0HBLB
13219 Points -14%
Alienware x16 R2 P120F
NVIDIA GeForce RTX 4080 Laptop GPU, Ultra 9 185H, WDC PC SN810 1TB
12994 Points -16%
Average of class Gaming
  (6703 - 18475, n=167, last 2 years)
12030 Points -22%
CrossMark / Overall
SCHENKER XMG Neo 16 (Early 24)
NVIDIA GeForce RTX 4090 Laptop GPU, i9-14900HX, Samsung 990 Pro 1 TB
2344 Points
Razer Blade 16 2024, RTX 4090
NVIDIA GeForce RTX 4090 Laptop GPU, i9-14900HX, Samsung PM9A1 MZVL22T0HBLB
2149 Points -8%
Medion Erazer Beast X40 2024
NVIDIA GeForce RTX 4090 Laptop GPU, i9-14900HX, Phison E18-1TB-PHISON-SSD-BICS5
2144 Points -9%
Average Intel Core i9-14900HX, NVIDIA GeForce RTX 4090 Laptop GPU
  (1877 - 2344, n=10)
2119 Points -10%
SCHENKER XMG Neo 16 E23
NVIDIA GeForce RTX 4090 Laptop GPU, i9-13900HX, Crucial P5 Plus 1TB CT1000P5PSSD8
2113 Points -10%
Asus ROG Strix Scar 17 G733PYV-LL053X
NVIDIA GeForce RTX 4090 Laptop GPU, R9 7945HX3D, SK hynix PC801 HFS001TEJ9X101N
2086 Points -11%
Asus ROG Strix Scar 16 G634JZR
NVIDIA GeForce RTX 4080 Laptop GPU, i9-14900HX, SK hynix PC801 HFS002TEJ9X101N
2037 Points -13%
Lenovo Legion 9 16IRX9, RTX 4090
NVIDIA GeForce RTX 4090 Laptop GPU, i9-14900HX, Micron 3400 2TB MTFDKBA2T0TFH
1939 Points -17%
Average of class Gaming
  (1247 - 2344, n=151, last 2 years)
1899 Points -19%
Alienware x16 R2 P120F
NVIDIA GeForce RTX 4080 Laptop GPU, Ultra 9 185H, WDC PC SN810 1TB
1589 Points -32%
CrossMark / Productivity
SCHENKER XMG Neo 16 (Early 24)
NVIDIA GeForce RTX 4090 Laptop GPU, i9-14900HX, Samsung 990 Pro 1 TB
2162 Points
Medion Erazer Beast X40 2024
NVIDIA GeForce RTX 4090 Laptop GPU, i9-14900HX, Phison E18-1TB-PHISON-SSD-BICS5
2070 Points -4%
Razer Blade 16 2024, RTX 4090
NVIDIA GeForce RTX 4090 Laptop GPU, i9-14900HX, Samsung PM9A1 MZVL22T0HBLB
2007 Points -7%
Average Intel Core i9-14900HX, NVIDIA GeForce RTX 4090 Laptop GPU
  (1738 - 2162, n=10)
1968 Points -9%
SCHENKER XMG Neo 16 E23
NVIDIA GeForce RTX 4090 Laptop GPU, i9-13900HX, Crucial P5 Plus 1TB CT1000P5PSSD8
1957 Points -9%
Asus ROG Strix Scar 17 G733PYV-LL053X
NVIDIA GeForce RTX 4090 Laptop GPU, R9 7945HX3D, SK hynix PC801 HFS001TEJ9X101N
1948 Points -10%
Asus ROG Strix Scar 16 G634JZR
NVIDIA GeForce RTX 4080 Laptop GPU, i9-14900HX, SK hynix PC801 HFS002TEJ9X101N
1874 Points -13%
Average of class Gaming
  (1299 - 2204, n=151, last 2 years)
1801 Points -17%
Lenovo Legion 9 16IRX9, RTX 4090
NVIDIA GeForce RTX 4090 Laptop GPU, i9-14900HX, Micron 3400 2TB MTFDKBA2T0TFH
1755 Points -19%
Alienware x16 R2 P120F
NVIDIA GeForce RTX 4080 Laptop GPU, Ultra 9 185H, WDC PC SN810 1TB
1584 Points -27%
CrossMark / Creativity
SCHENKER XMG Neo 16 (Early 24)
NVIDIA GeForce RTX 4090 Laptop GPU, i9-14900HX, Samsung 990 Pro 1 TB
2660 Points
SCHENKER XMG Neo 16 E23
NVIDIA GeForce RTX 4090 Laptop GPU, i9-13900HX, Crucial P5 Plus 1TB CT1000P5PSSD8
2430 Points -9%
Razer Blade 16 2024, RTX 4090
NVIDIA GeForce RTX 4090 Laptop GPU, i9-14900HX, Samsung PM9A1 MZVL22T0HBLB
2418 Points -9%
Asus ROG Strix Scar 17 G733PYV-LL053X
NVIDIA GeForce RTX 4090 Laptop GPU, R9 7945HX3D, SK hynix PC801 HFS001TEJ9X101N
2415 Points -9%
Average Intel Core i9-14900HX, NVIDIA GeForce RTX 4090 Laptop GPU
  (2195 - 2660, n=10)
2387 Points -10%
Asus ROG Strix Scar 16 G634JZR
NVIDIA GeForce RTX 4080 Laptop GPU, i9-14900HX, SK hynix PC801 HFS002TEJ9X101N
2327 Points -13%
Medion Erazer Beast X40 2024
NVIDIA GeForce RTX 4090 Laptop GPU, i9-14900HX, Phison E18-1TB-PHISON-SSD-BICS5
2323 Points -13%
Lenovo Legion 9 16IRX9, RTX 4090
NVIDIA GeForce RTX 4090 Laptop GPU, i9-14900HX, Micron 3400 2TB MTFDKBA2T0TFH
2207 Points -17%
Average of class Gaming
  (1275 - 2660, n=151, last 2 years)
2083 Points -22%
Alienware x16 R2 P120F
NVIDIA GeForce RTX 4080 Laptop GPU, Ultra 9 185H, WDC PC SN810 1TB
1583 Points -40%
CrossMark / Responsiveness
SCHENKER XMG Neo 16 (Early 24)
NVIDIA GeForce RTX 4090 Laptop GPU, i9-14900HX, Samsung 990 Pro 1 TB
2045 Points
Medion Erazer Beast X40 2024
NVIDIA GeForce RTX 4090 Laptop GPU, i9-14900HX, Phison E18-1TB-PHISON-SSD-BICS5
1874 Points -8%
Average Intel Core i9-14900HX, NVIDIA GeForce RTX 4090 Laptop GPU
  (1478 - 2327, n=10)
1862 Points -9%
Razer Blade 16 2024, RTX 4090
NVIDIA GeForce RTX 4090 Laptop GPU, i9-14900HX, Samsung PM9A1 MZVL22T0HBLB
1851 Points -9%
Lenovo Legion 9 16IRX9, RTX 4090
NVIDIA GeForce RTX 4090 Laptop GPU, i9-14900HX, Micron 3400 2TB MTFDKBA2T0TFH
1769 Points -13%
Asus ROG Strix Scar 16 G634JZR
NVIDIA GeForce RTX 4080 Laptop GPU, i9-14900HX, SK hynix PC801 HFS002TEJ9X101N
1756 Points -14%
SCHENKER XMG Neo 16 E23
NVIDIA GeForce RTX 4090 Laptop GPU, i9-13900HX, Crucial P5 Plus 1TB CT1000P5PSSD8
1750 Points -14%
Average of class Gaming
  (1030 - 2330, n=151, last 2 years)
1699 Points -17%
Asus ROG Strix Scar 17 G733PYV-LL053X
NVIDIA GeForce RTX 4090 Laptop GPU, R9 7945HX3D, SK hynix PC801 HFS001TEJ9X101N
1649 Points -19%
Alienware x16 R2 P120F
NVIDIA GeForce RTX 4080 Laptop GPU, Ultra 9 185H, WDC PC SN810 1TB
1621 Points -21%
WebXPRT 3 / Overall
Asus ROG Strix Scar 17 G733PYV-LL053X
NVIDIA GeForce RTX 4090 Laptop GPU, R9 7945HX3D, SK hynix PC801 HFS001TEJ9X101N
480 Points +43%
SCHENKER XMG Neo 16 (Early 24)
NVIDIA GeForce RTX 4090 Laptop GPU, i9-14900HX, Samsung 990 Pro 1 TB
336 Points
SCHENKER XMG Neo 16 E23
NVIDIA GeForce RTX 4090 Laptop GPU, i9-13900HX, Crucial P5 Plus 1TB CT1000P5PSSD8
331 Points -1%
Razer Blade 16 2024, RTX 4090
NVIDIA GeForce RTX 4090 Laptop GPU, i9-14900HX, Samsung PM9A1 MZVL22T0HBLB
330 Points -2%
Medion Erazer Beast X40 2024
NVIDIA GeForce RTX 4090 Laptop GPU, i9-14900HX, Phison E18-1TB-PHISON-SSD-BICS5
326 Points -3%
Average Intel Core i9-14900HX, NVIDIA GeForce RTX 4090 Laptop GPU
  (279 - 339, n=10)
323 Points -4%
Asus ROG Strix Scar 16 G634JZR
NVIDIA GeForce RTX 4080 Laptop GPU, i9-14900HX, SK hynix PC801 HFS002TEJ9X101N
310 Points -8%
Average of class Gaming
  (215 - 480, n=165, last 2 years)
303 Points -10%
Lenovo Legion 9 16IRX9, RTX 4090
NVIDIA GeForce RTX 4090 Laptop GPU, i9-14900HX, Micron 3400 2TB MTFDKBA2T0TFH
279 Points -17%
Lenovo Legion Pro 7 RTX4090
NVIDIA GeForce RTX 4090 Laptop GPU, i9-13900HX, Samsung PM9A1 MZVL21T0HCLR
266 Points -21%
Alienware x16 R2 P120F
NVIDIA GeForce RTX 4080 Laptop GPU, Ultra 9 185H, WDC PC SN810 1TB
237 Points -29%
WebXPRT 4 / Overall
Asus ROG Strix Scar 17 G733PYV-LL053X
NVIDIA GeForce RTX 4090 Laptop GPU, R9 7945HX3D, SK hynix PC801 HFS001TEJ9X101N
328 Points +7%
Asus ROG Strix Scar 16 G634JZR
NVIDIA GeForce RTX 4080 Laptop GPU, i9-14900HX, SK hynix PC801 HFS002TEJ9X101N
308 Points +1%
SCHENKER XMG Neo 16 (Early 24)
NVIDIA GeForce RTX 4090 Laptop GPU, i9-14900HX, Samsung 990 Pro 1 TB
306 Points
SCHENKER XMG Neo 16 E23
NVIDIA GeForce RTX 4090 Laptop GPU, i9-13900HX, Crucial P5 Plus 1TB CT1000P5PSSD8
304 Points -1%
Medion Erazer Beast X40 2024
NVIDIA GeForce RTX 4090 Laptop GPU, i9-14900HX, Phison E18-1TB-PHISON-SSD-BICS5
295 Points -4%
Average Intel Core i9-14900HX, NVIDIA GeForce RTX 4090 Laptop GPU
  (246 - 309, n=8)
291 Points -5%
Lenovo Legion Pro 7 RTX4090
NVIDIA GeForce RTX 4090 Laptop GPU, i9-13900HX, Samsung PM9A1 MZVL21T0HCLR
269 Points -12%
Average of class Gaming
  (157.9 - 328, n=153, last 2 years)
266 Points -13%
Lenovo Legion 9 16IRX9, RTX 4090
NVIDIA GeForce RTX 4090 Laptop GPU, i9-14900HX, Micron 3400 2TB MTFDKBA2T0TFH
246 Points -20%
Alienware x16 R2 P120F
NVIDIA GeForce RTX 4080 Laptop GPU, Ultra 9 185H, WDC PC SN810 1TB
237 Points -23%
Mozilla Kraken 1.1 / Total
Alienware x16 R2 P120F
NVIDIA GeForce RTX 4080 Laptop GPU, Ultra 9 185H, WDC PC SN810 1TB
594 ms * -39%
Lenovo Legion 9 16IRX9, RTX 4090
NVIDIA GeForce RTX 4090 Laptop GPU, i9-14900HX, Micron 3400 2TB MTFDKBA2T0TFH
535 ms * -25%
Average of class Gaming
  (421 - 779, n=179, last 2 years)
506 ms * -18%
Lenovo Legion Pro 7 RTX4090
NVIDIA GeForce RTX 4090 Laptop GPU, i9-13900HX, Samsung PM9A1 MZVL21T0HCLR
500 ms * -17%
Average Intel Core i9-14900HX, NVIDIA GeForce RTX 4090 Laptop GPU
  (428 - 535, n=11)
456 ms * -7%
SCHENKER XMG Neo 16 E23
NVIDIA GeForce RTX 4090 Laptop GPU, i9-13900HX, Crucial P5 Plus 1TB CT1000P5PSSD8
453 ms * -6%
Razer Blade 16 2024, RTX 4090
NVIDIA GeForce RTX 4090 Laptop GPU, i9-14900HX, Samsung PM9A1 MZVL22T0HBLB
450 ms * -5%
Asus ROG Strix Scar 16 G634JZR
NVIDIA GeForce RTX 4080 Laptop GPU, i9-14900HX, SK hynix PC801 HFS002TEJ9X101N
443 ms * -4%
Medion Erazer Beast X40 2024
NVIDIA GeForce RTX 4090 Laptop GPU, i9-14900HX, Phison E18-1TB-PHISON-SSD-BICS5
437 ms * -2%
SCHENKER XMG Neo 16 (Early 24)
NVIDIA GeForce RTX 4090 Laptop GPU, i9-14900HX, Samsung 990 Pro 1 TB
428 ms *
Asus ROG Strix Scar 17 G733PYV-LL053X
NVIDIA GeForce RTX 4090 Laptop GPU, R9 7945HX3D, SK hynix PC801 HFS001TEJ9X101N
421.3 ms * +2%

* ... smaller is better

PCMark 10 Score
9017 poäng
Hjälp
AIDA64 / Memory Copy
Alienware x16 R2 P120F
Intel Core Ultra 9 185H, NVIDIA GeForce RTX 4080 Laptop GPU
89701 MB/s +14%
Lenovo Legion 9 16IRX9, RTX 4090
Intel Core i9-14900HX, NVIDIA GeForce RTX 4090 Laptop GPU
81940 MB/s +4%
SCHENKER XMG Neo 16 (Early 24)
Intel Core i9-14900HX, NVIDIA GeForce RTX 4090 Laptop GPU
78897 MB/s
Asus ROG Strix Scar 16 G634JZR
Intel Core i9-14900HX, NVIDIA GeForce RTX 4080 Laptop GPU
78885 MB/s 0%
Razer Blade 16 2024, RTX 4090
Intel Core i9-14900HX, NVIDIA GeForce RTX 4090 Laptop GPU
78799 MB/s 0%
SCHENKER XMG Neo 16 (Early 24)
Intel Core i9-14900HX, NVIDIA GeForce RTX 4090 Laptop GPU
78589 MB/s 0%
Lenovo Legion Pro 7 RTX4090
Intel Core i9-13900HX, NVIDIA GeForce RTX 4090 Laptop GPU
78367 MB/s -1%
Medion Erazer Beast X40 2024
Intel Core i9-14900HX, NVIDIA GeForce RTX 4090 Laptop GPU
77961 MB/s -1%
SCHENKER XMG Neo 16 E23
Intel Core i9-13900HX, NVIDIA GeForce RTX 4090 Laptop GPU
77217 MB/s -2%
Average Intel Core i9-14900HX
  (38028 - 83392, n=33)
74739 MB/s -5%
Average of class Gaming
  (21842 - 94222, n=187, last 2 years)
64907 MB/s -18%
Asus ROG Strix Scar 17 G733PYV-LL053X
AMD Ryzen 9 7945HX3D, NVIDIA GeForce RTX 4090 Laptop GPU
50335 MB/s -36%
AIDA64 / Memory Read
Asus ROG Strix Scar 16 G634JZR
Intel Core i9-14900HX, NVIDIA GeForce RTX 4080 Laptop GPU
87507 MB/s +1%
SCHENKER XMG Neo 16 (Early 24)
Intel Core i9-14900HX, NVIDIA GeForce RTX 4090 Laptop GPU
86939 MB/s
Lenovo Legion Pro 7 RTX4090
Intel Core i9-13900HX, NVIDIA GeForce RTX 4090 Laptop GPU
86932 MB/s 0%
SCHENKER XMG Neo 16 (Early 24)
Intel Core i9-14900HX, NVIDIA GeForce RTX 4090 Laptop GPU
86790 MB/s 0%
Razer Blade 16 2024, RTX 4090
Intel Core i9-14900HX, NVIDIA GeForce RTX 4090 Laptop GPU
86387 MB/s -1%
Medion Erazer Beast X40 2024
Intel Core i9-14900HX, NVIDIA GeForce RTX 4090 Laptop GPU
85340 MB/s -2%
Alienware x16 R2 P120F
Intel Core Ultra 9 185H, NVIDIA GeForce RTX 4080 Laptop GPU
85092 MB/s -2%
SCHENKER XMG Neo 16 E23
Intel Core i9-13900HX, NVIDIA GeForce RTX 4090 Laptop GPU
84390 MB/s -3%
Lenovo Legion 9 16IRX9, RTX 4090
Intel Core i9-14900HX, NVIDIA GeForce RTX 4090 Laptop GPU
84192 MB/s -3%
Average Intel Core i9-14900HX
  (43306 - 87568, n=33)
80919 MB/s -7%
Average of class Gaming
  (23681 - 99713, n=187, last 2 years)
68658 MB/s -21%
Asus ROG Strix Scar 17 G733PYV-LL053X
AMD Ryzen 9 7945HX3D, NVIDIA GeForce RTX 4090 Laptop GPU
59921 MB/s -31%
AIDA64 / Memory Write
Lenovo Legion 9 16IRX9, RTX 4090
Intel Core i9-14900HX, NVIDIA GeForce RTX 4090 Laptop GPU
80589 MB/s +4%
SCHENKER XMG Neo 16 (Early 24)
Intel Core i9-14900HX, NVIDIA GeForce RTX 4090 Laptop GPU
77688 MB/s 0%
SCHENKER XMG Neo 16 (Early 24)
Intel Core i9-14900HX, NVIDIA GeForce RTX 4090 Laptop GPU
77562 MB/s
Asus ROG Strix Scar 16 G634JZR
Intel Core i9-14900HX, NVIDIA GeForce RTX 4080 Laptop GPU
77444 MB/s 0%
Medion Erazer Beast X40 2024
Intel Core i9-14900HX, NVIDIA GeForce RTX 4090 Laptop GPU
77302 MB/s 0%
Lenovo Legion Pro 7 RTX4090
Intel Core i9-13900HX, NVIDIA GeForce RTX 4090 Laptop GPU
76779 MB/s -1%
Razer Blade 16 2024, RTX 4090
Intel Core i9-14900HX, NVIDIA GeForce RTX 4090 Laptop GPU
75421 MB/s -3%
Alienware x16 R2 P120F
Intel Core Ultra 9 185H, NVIDIA GeForce RTX 4080 Laptop GPU
73199 MB/s -6%
Average Intel Core i9-14900HX
  (37146 - 80589, n=33)
71949 MB/s -7%
SCHENKER XMG Neo 16 E23
Intel Core i9-13900HX, NVIDIA GeForce RTX 4090 Laptop GPU
71877 MB/s -7%
Average of class Gaming
  (22986 - 108954, n=187, last 2 years)
66727 MB/s -14%
Asus ROG Strix Scar 17 G733PYV-LL053X
AMD Ryzen 9 7945HX3D, NVIDIA GeForce RTX 4090 Laptop GPU
58774 MB/s -24%
AIDA64 / Memory Latency
Alienware x16 R2 P120F
Intel Core Ultra 9 185H, NVIDIA GeForce RTX 4080 Laptop GPU
142.3 ns * -87%
Lenovo Legion 9 16IRX9, RTX 4090
Intel Core i9-14900HX, NVIDIA GeForce RTX 4090 Laptop GPU
96.2 ns * -26%
Average of class Gaming
  (59.5 - 259, n=187, last 2 years)
94.1 ns * -24%
Asus ROG Strix Scar 17 G733PYV-LL053X
AMD Ryzen 9 7945HX3D, NVIDIA GeForce RTX 4090 Laptop GPU
88.6 ns * -16%
SCHENKER XMG Neo 16 E23
Intel Core i9-13900HX, NVIDIA GeForce RTX 4090 Laptop GPU
86 ns * -13%
Lenovo Legion Pro 7 RTX4090
Intel Core i9-13900HX, NVIDIA GeForce RTX 4090 Laptop GPU
85.4 ns * -12%
Average Intel Core i9-14900HX
  (76.1 - 105, n=33)
84.8 ns * -11%
Razer Blade 16 2024, RTX 4090
Intel Core i9-14900HX, NVIDIA GeForce RTX 4090 Laptop GPU
83.4 ns * -10%
Medion Erazer Beast X40 2024
Intel Core i9-14900HX, NVIDIA GeForce RTX 4090 Laptop GPU
80.9 ns * -6%
Asus ROG Strix Scar 16 G634JZR
Intel Core i9-14900HX, NVIDIA GeForce RTX 4080 Laptop GPU
79.9 ns * -5%
SCHENKER XMG Neo 16 (Early 24)
Intel Core i9-14900HX, NVIDIA GeForce RTX 4090 Laptop GPU
78 ns * -2%
SCHENKER XMG Neo 16 (Early 24)
Intel Core i9-14900HX, NVIDIA GeForce RTX 4090 Laptop GPU
76.1 ns *

* ... smaller is better

DPC-latenstider

Det standardiserade Latency Monitor-testet (surfing på internet, 4k-videouppspelning, Prime95 hög belastning) avslöjade vissa avvikelser. Systemet verkar inte vara lämpligt för video- och ljudredigering i realtid. Framtida programuppdateringar kan påverka detta.

Latency Monitor
Latency Monitor
Latency Monitor
Latency Monitor
DPC Latencies / LatencyMon - interrupt to process latency (max), Web, Youtube, Prime95
SCHENKER XMG Neo 16 E23
NVIDIA GeForce RTX 4090 Laptop GPU, i9-13900HX, Crucial P5 Plus 1TB CT1000P5PSSD8
5340 μs * -115%
SCHENKER XMG Neo 16 (Early 24)
NVIDIA GeForce RTX 4090 Laptop GPU, i9-14900HX, Samsung 990 Pro 1 TB
2478.6 μs *
Razer Blade 16 2024, RTX 4090
NVIDIA GeForce RTX 4090 Laptop GPU, i9-14900HX, Samsung PM9A1 MZVL22T0HBLB
1389.7 μs * +44%
Medion Erazer Beast X40 2024
NVIDIA GeForce RTX 4090 Laptop GPU, i9-14900HX, Phison E18-1TB-PHISON-SSD-BICS5
1305.5 μs * +47%
Asus ROG Strix Scar 17 G733PYV-LL053X
NVIDIA GeForce RTX 4090 Laptop GPU, R9 7945HX3D, SK hynix PC801 HFS001TEJ9X101N
1100.8 μs * +56%

* ... smaller is better

Masslagring

Som vanligt erbjuder Schenker kunderna ett brett urval av SSD-enheter i sin onlinebutik - det finns plats för två i Neo. RAID 0/1-stöd erbjuds. Samsung SSD-enheten (1 TB, PCIe 4, M.2 2280) i testpanelen levererar bra överföringshastigheter. En positiv egenskap är avsaknaden av termisk strypning.

Det finns plats för två PCIe 4 SSD-enheter.
Samsung 990 Pro 1 TB
CDM 5/6 Read Seq Q32T1: 7108 MB/s
CDM 5/6 Write Seq Q32T1: 6863 MB/s
CDM 5/6 Read 4K Q32T1: 805.4 MB/s
CDM 5/6 Write 4K Q32T1: 570.8 MB/s
CDM 5 Read Seq: 3277 MB/s
CDM 5 Write Seq: 4984 MB/s
CDM 5/6 Read 4K: 75.33 MB/s
CDM 5/6 Write 4K: 284.7 MB/s
Drive Performance Rating - Percent
SCHENKER XMG Neo 16 (Early 24)
Samsung 990 Pro 1 TB
90.3 pt
Average Samsung 990 Pro 1 TB
 
83.9 pt
Medion Erazer Beast X40 2024
Phison E18-1TB-PHISON-SSD-BICS5
83.2 pt
Razer Blade 16 2024, RTX 4090
Samsung PM9A1 MZVL22T0HBLB
74.5 pt
Average of class Gaming
 
67.8 pt
Asus ROG Strix Scar 17 G733PYV-LL053X
SK hynix PC801 HFS001TEJ9X101N
61.3 pt
SCHENKER XMG Neo 16 E23
Crucial P5 Plus 1TB CT1000P5PSSD8
55.2 pt
DiskSpd
seq read
Razer Blade 16 2024, RTX 4090
Samsung PM9A1 MZVL22T0HBLB
3795 (3693.04min - 3794.8max) MB/s +26%
Average of class Gaming
  (1319 - 7045, n=168, last 2 years)
3487 MB/s +16%
Average Samsung 990 Pro 1 TB
  (2556 - 4234, n=18)
3249 MB/s +8%
Medion Erazer Beast X40 2024
Phison E18-1TB-PHISON-SSD-BICS5
3238 (3056.39min - 3237.58max) MB/s +7%
SCHENKER XMG Neo 16 (Early 24)
Samsung 990 Pro 1 TB
3015 (2943.98min - 3014.55max) MB/s
SCHENKER XMG Neo 16 E23
Crucial P5 Plus 1TB CT1000P5PSSD8
2945 (2911.9min - 2945.45max) MB/s -2%
Asus ROG Strix Scar 17 G733PYV-LL053X
SK hynix PC801 HFS001TEJ9X101N
2570 (2552.37min - 2570.06max) MB/s -15%
seq write
SCHENKER XMG Neo 16 (Early 24)
Samsung 990 Pro 1 TB
4826 (4760.33min - 4825.54max) MB/s
Average Samsung 990 Pro 1 TB
  (3598 - 5842, n=18)
4777 MB/s -1%
Medion Erazer Beast X40 2024
Phison E18-1TB-PHISON-SSD-BICS5
3940 (3577.56min - 3940.13max) MB/s -18%
Average of class Gaming
  (535 - 9307, n=168, last 2 years)
3797 MB/s -21%
Razer Blade 16 2024, RTX 4090
Samsung PM9A1 MZVL22T0HBLB
3794 (3745.51min - 3793.5max) MB/s -21%
SCHENKER XMG Neo 16 E23
Crucial P5 Plus 1TB CT1000P5PSSD8
2991 (2423.86min - 2991.17max) MB/s -38%
Asus ROG Strix Scar 17 G733PYV-LL053X
SK hynix PC801 HFS001TEJ9X101N
1690 (1454.82min - 1690.3max) MB/s -65%
seq q8 t1 read
SCHENKER XMG Neo 16 (Early 24)
Samsung 990 Pro 1 TB
7140 (5903.9min - 7139.54max) MB/s
Average Samsung 990 Pro 1 TB
  (7011 - 7148, n=18)
7091 MB/s -1%
Asus ROG Strix Scar 17 G733PYV-LL053X
SK hynix PC801 HFS001TEJ9X101N
6971 (6127.67min - 6971.35max) MB/s -2%
Medion Erazer Beast X40 2024
Phison E18-1TB-PHISON-SSD-BICS5
6929 (6183.66min - 6928.97max) MB/s -3%
Razer Blade 16 2024, RTX 4090
Samsung PM9A1 MZVL22T0HBLB
6673 (5801.28min - 6672.72max) MB/s -7%
SCHENKER XMG Neo 16 E23
Crucial P5 Plus 1TB CT1000P5PSSD8
6551 (5445.88min - 6551.19max) MB/s -8%
Average of class Gaming
  (2594 - 16089, n=168, last 2 years)
6328 MB/s -11%
seq q8 t1 write
SCHENKER XMG Neo 16 (Early 24)
Samsung 990 Pro 1 TB
6860 (6824.33min - 6859.91max) MB/s
Average Samsung 990 Pro 1 TB
  (6531 - 6898, n=18)
6802 MB/s -1%
Medion Erazer Beast X40 2024
Phison E18-1TB-PHISON-SSD-BICS5
5740 (5704.67min - 5740.32max) MB/s -16%
Razer Blade 16 2024, RTX 4090
Samsung PM9A1 MZVL22T0HBLB
4936 (4909.47min - 4936.28max) MB/s -28%
Average of class Gaming
  (539 - 14571, n=168, last 2 years)
4823 MB/s -30%
SCHENKER XMG Neo 16 E23
Crucial P5 Plus 1TB CT1000P5PSSD8
4562 (4255.12min - 4561.93max) MB/s -33%
Asus ROG Strix Scar 17 G733PYV-LL053X
SK hynix PC801 HFS001TEJ9X101N
2382 (920.86min - 2382.42max) MB/s -65%
4k q1 t1 read
Average Samsung 990 Pro 1 TB
  (55.3 - 99, n=18)
76.4 MB/s +26%
Razer Blade 16 2024, RTX 4090
Samsung PM9A1 MZVL22T0HBLB
71.4 (66.19min - 71.35max) MB/s +18%
Average of class Gaming
  (30.6 - 95.9, n=168, last 2 years)
65.8 MB/s +9%
SCHENKER XMG Neo 16 (Early 24)
Samsung 990 Pro 1 TB
60.5 (49.54min - 60.46max) MB/s
Medion Erazer Beast X40 2024
Phison E18-1TB-PHISON-SSD-BICS5
54.5 (53.38min - 54.47max) MB/s -10%
Asus ROG Strix Scar 17 G733PYV-LL053X
SK hynix PC801 HFS001TEJ9X101N
54.3 (54.23min - 54.34max) MB/s -10%
SCHENKER XMG Neo 16 E23
Crucial P5 Plus 1TB CT1000P5PSSD8
49.8 (49.12min - 49.75max) MB/s -18%
4k q1 t1 write
Medion Erazer Beast X40 2024
Phison E18-1TB-PHISON-SSD-BICS5
324 (322.91min - 324.37max) MB/s +86%
Average Samsung 990 Pro 1 TB
  (133.9 - 343, n=18)
235 MB/s +35%
Average of class Gaming
  (66.6 - 397, n=168, last 2 years)
222 MB/s +27%
Razer Blade 16 2024, RTX 4090
Samsung PM9A1 MZVL22T0HBLB
205 (202.97min - 204.75max) MB/s +18%
Asus ROG Strix Scar 17 G733PYV-LL053X
SK hynix PC801 HFS001TEJ9X101N
183.8 (182.06min - 183.78max) MB/s +5%
SCHENKER XMG Neo 16 (Early 24)
Samsung 990 Pro 1 TB
174.4 (160.08min - 174.38max) MB/s
SCHENKER XMG Neo 16 E23
Crucial P5 Plus 1TB CT1000P5PSSD8
119.3 (117.59min - 119.29max) MB/s -32%
4k q32 t16 read
SCHENKER XMG Neo 16 (Early 24)
Samsung 990 Pro 1 TB
4920 (4883.21min - 4920.02max) MB/s
Razer Blade 16 2024, RTX 4090
Samsung PM9A1 MZVL22T0HBLB
3726 (3704.12min - 3725.6max) MB/s -24%
Medion Erazer Beast X40 2024
Phison E18-1TB-PHISON-SSD-BICS5
3653 (3636.8min - 3652.63max) MB/s -26%
Average Samsung 990 Pro 1 TB
  (818 - 4926, n=18)
3327 MB/s -32%
Average of class Gaming
  (417 - 6172, n=168, last 2 years)
2555 MB/s -48%
SCHENKER XMG Neo 16 E23
Crucial P5 Plus 1TB CT1000P5PSSD8
1350 (1194.53min - 1349.82max) MB/s -73%
Asus ROG Strix Scar 17 G733PYV-LL053X
SK hynix PC801 HFS001TEJ9X101N
1331 (1250.04min - 1330.81max) MB/s -73%
4k q32 t16 write
SCHENKER XMG Neo 16 (Early 24)
Samsung 990 Pro 1 TB
4522 (4451.05min - 4521.93max) MB/s
Razer Blade 16 2024, RTX 4090
Samsung PM9A1 MZVL22T0HBLB
3548 (3533.85min - 3548.33max) MB/s -22%
Medion Erazer Beast X40 2024
Phison E18-1TB-PHISON-SSD-BICS5
3447 (3336.65min - 3446.75max) MB/s -24%
Average Samsung 990 Pro 1 TB
  (413 - 4683, n=18)
2563 MB/s -43%
Average of class Gaming
  (162.3 - 4869, n=168, last 2 years)
2101 MB/s -54%
Asus ROG Strix Scar 17 G733PYV-LL053X
SK hynix PC801 HFS001TEJ9X101N
730 (694.74min - 729.67max) MB/s -84%
SCHENKER XMG Neo 16 E23
Crucial P5 Plus 1TB CT1000P5PSSD8
601 (540.73min - 601.05max) MB/s -87%
AS SSD
Score Total
SCHENKER XMG Neo 16 (Early 24)
Samsung 990 Pro 1 TB
9365 Points
Medion Erazer Beast X40 2024
Phison E18-1TB-PHISON-SSD-BICS5
8462 Points -10%
Average Samsung 990 Pro 1 TB
  (5405 - 10591, n=18)
8308 Points -11%
Razer Blade 16 2024, RTX 4090
Samsung PM9A1 MZVL22T0HBLB
7040 Points -25%
Average of class Gaming
  (2271 - 13854, n=159, last 2 years)
6737 Points -28%
Asus ROG Strix Scar 17 G733PYV-LL053X
SK hynix PC801 HFS001TEJ9X101N
6546 Points -30%
SCHENKER XMG Neo 16 E23
Crucial P5 Plus 1TB CT1000P5PSSD8
5751 Points -39%
Score Read
SCHENKER XMG Neo 16 (Early 24)
Samsung 990 Pro 1 TB
3496 Points
Medion Erazer Beast X40 2024
Phison E18-1TB-PHISON-SSD-BICS5
3033 Points -13%
Average Samsung 990 Pro 1 TB
  (1349 - 4721, n=18)
2891 Points -17%
Razer Blade 16 2024, RTX 4090
Samsung PM9A1 MZVL22T0HBLB
2848 Points -19%
Average of class Gaming
  (776 - 4721, n=159, last 2 years)
2441 Points -30%
SCHENKER XMG Neo 16 E23
Crucial P5 Plus 1TB CT1000P5PSSD8
1890 Points -46%
Asus ROG Strix Scar 17 G733PYV-LL053X
SK hynix PC801 HFS001TEJ9X101N
1689 Points -52%
Score Write
Asus ROG Strix Scar 17 G733PYV-LL053X
SK hynix PC801 HFS001TEJ9X101N
4073 Points 0%
SCHENKER XMG Neo 16 (Early 24)
Samsung 990 Pro 1 TB
4062 Points
Average Samsung 990 Pro 1 TB
  (2308 - 4852, n=18)
4043 Points 0%
Medion Erazer Beast X40 2024
Phison E18-1TB-PHISON-SSD-BICS5
3948 Points -3%
Average of class Gaming
  (515 - 7208, n=159, last 2 years)
3113 Points -23%
SCHENKER XMG Neo 16 E23
Crucial P5 Plus 1TB CT1000P5PSSD8
3007 Points -26%
Razer Blade 16 2024, RTX 4090
Samsung PM9A1 MZVL22T0HBLB
2766 Points -32%
Seq Read
Asus ROG Strix Scar 17 G733PYV-LL053X
SK hynix PC801 HFS001TEJ9X101N
5739 MB/s +1%
SCHENKER XMG Neo 16 (Early 24)
Samsung 990 Pro 1 TB
5684.15 MB/s
Medion Erazer Beast X40 2024
Phison E18-1TB-PHISON-SSD-BICS5
5459.84 MB/s -4%
Average Samsung 990 Pro 1 TB
  (4362 - 5760, n=18)
5211 MB/s -8%
Average of class Gaming
  (2260 - 12763, n=159, last 2 years)
4944 MB/s -13%
SCHENKER XMG Neo 16 E23
Crucial P5 Plus 1TB CT1000P5PSSD8
4823 MB/s -15%
Razer Blade 16 2024, RTX 4090
Samsung PM9A1 MZVL22T0HBLB
4371 MB/s -23%
Seq Write
SCHENKER XMG Neo 16 (Early 24)
Samsung 990 Pro 1 TB
5612.29 MB/s
Average Samsung 990 Pro 1 TB
  (3376 - 5651, n=18)
4712 MB/s -16%
Asus ROG Strix Scar 17 G733PYV-LL053X
SK hynix PC801 HFS001TEJ9X101N
3972 MB/s -29%
Medion Erazer Beast X40 2024
Phison E18-1TB-PHISON-SSD-BICS5
3914.76 MB/s -30%
Razer Blade 16 2024, RTX 4090
Samsung PM9A1 MZVL22T0HBLB
3791 MB/s -32%
Average of class Gaming
  (495 - 11316, n=159, last 2 years)
3720 MB/s -34%
SCHENKER XMG Neo 16 E23
Crucial P5 Plus 1TB CT1000P5PSSD8
2496 MB/s -56%
4K Read
Medion Erazer Beast X40 2024
Phison E18-1TB-PHISON-SSD-BICS5
82.84 MB/s +40%
Average Samsung 990 Pro 1 TB
  (52.7 - 90.9, n=18)
71.6 MB/s +21%
Average of class Gaming
  (27.8 - 112.1, n=159, last 2 years)
65.1 MB/s +10%
Razer Blade 16 2024, RTX 4090
Samsung PM9A1 MZVL22T0HBLB
61.1 MB/s +3%
SCHENKER XMG Neo 16 (Early 24)
Samsung 990 Pro 1 TB
59.28 MB/s
Asus ROG Strix Scar 17 G733PYV-LL053X
SK hynix PC801 HFS001TEJ9X101N
56 MB/s -6%
SCHENKER XMG Neo 16 E23
Crucial P5 Plus 1TB CT1000P5PSSD8
49.34 MB/s -17%
4K Write
SCHENKER XMG Neo 16 (Early 24)
Samsung 990 Pro 1 TB
248.48 MB/s
Medion Erazer Beast X40 2024
Phison E18-1TB-PHISON-SSD-BICS5
237.11 MB/s -5%
Average Samsung 990 Pro 1 TB
  (172.3 - 306, n=18)
223 MB/s -10%
Average of class Gaming
  (108.8 - 512, n=159, last 2 years)
211 MB/s -15%
Asus ROG Strix Scar 17 G733PYV-LL053X
SK hynix PC801 HFS001TEJ9X101N
192.1 MB/s -23%
Razer Blade 16 2024, RTX 4090
Samsung PM9A1 MZVL22T0HBLB
160.6 MB/s -35%
SCHENKER XMG Neo 16 E23
Crucial P5 Plus 1TB CT1000P5PSSD8
149.1 MB/s -40%
4K-64 Read
SCHENKER XMG Neo 16 (Early 24)
Samsung 990 Pro 1 TB
2933.61 MB/s
Medion Erazer Beast X40 2024
Phison E18-1TB-PHISON-SSD-BICS5
2404.46 MB/s -18%
Razer Blade 16 2024, RTX 4090
Samsung PM9A1 MZVL22T0HBLB
2350 MB/s -20%
Average Samsung 990 Pro 1 TB
  (787 - 3182, n=18)
2252 MB/s -23%
Average of class Gaming
  (451 - 3475, n=159, last 2 years)
1876 MB/s -36%
SCHENKER XMG Neo 16 E23
Crucial P5 Plus 1TB CT1000P5PSSD8
1358 MB/s -54%
Asus ROG Strix Scar 17 G733PYV-LL053X
SK hynix PC801 HFS001TEJ9X101N
1059 MB/s -64%
4K-64 Write
Asus ROG Strix Scar 17 G733PYV-LL053X
SK hynix PC801 HFS001TEJ9X101N
3484 MB/s +7%
Average Samsung 990 Pro 1 TB
  (1592 - 4090, n=18)
3356 MB/s +3%
Medion Erazer Beast X40 2024
Phison E18-1TB-PHISON-SSD-BICS5
3319.37 MB/s +2%
SCHENKER XMG Neo 16 (Early 24)
Samsung 990 Pro 1 TB
3252.43 MB/s
SCHENKER XMG Neo 16 E23
Crucial P5 Plus 1TB CT1000P5PSSD8
2608 MB/s -20%
Average of class Gaming
  (277 - 5909, n=159, last 2 years)
2533 MB/s -22%
Razer Blade 16 2024, RTX 4090
Samsung PM9A1 MZVL22T0HBLB
2226 MB/s -32%
Access Time Read
SCHENKER XMG Neo 16 E23
Crucial P5 Plus 1TB CT1000P5PSSD8
0.085 ms * -254%
Asus ROG Strix Scar 17 G733PYV-LL053X
SK hynix PC801 HFS001TEJ9X101N
0.062 ms * -158%
Medion Erazer Beast X40 2024
Phison E18-1TB-PHISON-SSD-BICS5
0.057 ms * -138%
Average of class Gaming
  (0.016 - 0.379, n=158, last 2 years)
0.05509 ms * -130%
Average Samsung 990 Pro 1 TB
  (0.018 - 0.074, n=18)
0.0345 ms * -44%
Razer Blade 16 2024, RTX 4090
Samsung PM9A1 MZVL22T0HBLB
0.033 ms * -38%
SCHENKER XMG Neo 16 (Early 24)
Samsung 990 Pro 1 TB
0.024 ms *
Access Time Write
Average of class Gaming
  (0.011 - 1.028, n=159, last 2 years)
0.04843 ms * -203%
Razer Blade 16 2024, RTX 4090
Samsung PM9A1 MZVL22T0HBLB
0.025 ms * -56%
SCHENKER XMG Neo 16 E23
Crucial P5 Plus 1TB CT1000P5PSSD8
0.024 ms * -50%
Average Samsung 990 Pro 1 TB
  (0.012 - 0.053, n=18)
0.01978 ms * -24%
Asus ROG Strix Scar 17 G733PYV-LL053X
SK hynix PC801 HFS001TEJ9X101N
0.019 ms * -19%
Medion Erazer Beast X40 2024
Phison E18-1TB-PHISON-SSD-BICS5
0.016 ms * -0%
SCHENKER XMG Neo 16 (Early 24)
Samsung 990 Pro 1 TB
0.016 ms *

* ... smaller is better

Continuous Performance: DiskSpd Read Loop, Queue Depth 8

036072010801440180021602520288032403600396043204680504054005760612064806840Tooltip
SCHENKER XMG Neo 16 (Early 24) Samsung 990 Pro 1 TB; diskspd 2.0.17 f: Ø7118 (6337.06-7142.46)
Razer Blade 16 2024, RTX 4090 Samsung PM9A1 MZVL22T0HBLB; diskspd 2.0.17 f: Ø5414 (3853.78-6701.45)
Medion Erazer Beast X40 2024 Phison E18-1TB-PHISON-SSD-BICS5; diskspd 2.0.17 f: Ø6943 (5621.29-6984.69)
Asus ROG Strix Scar 17 G733PYV-LL053X SK hynix PC801 HFS001TEJ9X101N: Ø6593 (4837.89-6648.18)
SCHENKER XMG Neo 16 E23 Crucial P5 Plus 1TB CT1000P5PSSD8: Ø6442 (5614.61-6552.24)

Grafikkort

För närvarande är GeForce RTX 4090 den högsta prestandan bland Nvidias mobila GPU:er. 9.728 shaders, en 256-bitars buss samt snabbt GDDR6 RAM (16.384 MB) kännetecknar pixelacceleratorn. Maximal TGP ligger på 175 watt (150 watt + 25 watt Dynamic Boost) - mer är inte möjligt.

Benchmarkresultaten ligger över (Overboost) och under (Enthusiast, Balanced) genomsnittet för RTX 4090 hittills. Oasis vattenkylning hjälper till att uppnå en liten ökning av prestanda. I vilket fall som helst är huvudkonkurrenten, den Blade 16, hålls på armlängds avstånd. Att växla mellan dGPU och Optimus kräver inte en omstart: Avancerad Optimus stöds.

Time Spy (PSU, Overboost)
Time Spy (Batteri, överladdning)
Time Spy (PSU, Overboost, Oasis)
Time Spy (PSU, entusiast)
Time Spy (PSU, balanserad)
3DMark Performance Rating - Percent
SCHENKER XMG Neo 16 (Early 24)
NVIDIA GeForce RTX 4090 Laptop GPU, Intel Core i9-14900HX
99.2 pt
SCHENKER XMG Neo 16 (Early 24)
NVIDIA GeForce RTX 4090 Laptop GPU, Intel Core i9-14900HX
98 pt
SCHENKER XMG Neo 16 E23
NVIDIA GeForce RTX 4090 Laptop GPU, Intel Core i9-13900HX
97.5 pt
Asus ROG Strix Scar 17 G733PYV-LL053X
NVIDIA GeForce RTX 4090 Laptop GPU, AMD Ryzen 9 7945HX3D
92.7 pt
Average NVIDIA GeForce RTX 4090 Laptop GPU
 
90.5 pt
Lenovo Legion Pro 7 RTX4090
NVIDIA GeForce RTX 4090 Laptop GPU, Intel Core i9-13900HX
89.6 pt
Razer Blade 16 2024, RTX 4090
NVIDIA GeForce RTX 4090 Laptop GPU, Intel Core i9-14900HX
89.5 pt
Medion Erazer Beast X40 2024
NVIDIA GeForce RTX 4090 Laptop GPU, Intel Core i9-14900HX
88.8 pt
Lenovo Legion 9 16IRX9, RTX 4090
NVIDIA GeForce RTX 4090 Laptop GPU, Intel Core i9-14900HX
87.6 pt
Asus ROG Strix Scar 16 G634JZR
NVIDIA GeForce RTX 4080 Laptop GPU, Intel Core i9-14900HX
81.5 pt
Alienware x16 R2 P120F
NVIDIA GeForce RTX 4080 Laptop GPU, Intel Core Ultra 9 185H
80.9 pt
Average of class Gaming
 
59.3 pt
3DMark 11 - 1280x720 Performance GPU
SCHENKER XMG Neo 16 (Early 24)
NVIDIA GeForce RTX 4090 Laptop GPU, Intel Core i9-14900HX (Overboost, Oasis)
72178 Points +4%
SCHENKER XMG Neo 16 E23
NVIDIA GeForce RTX 4090 Laptop GPU, Intel Core i9-13900HX
72070 Points +4%
SCHENKER XMG Neo 16 (Early 24)
NVIDIA GeForce RTX 4090 Laptop GPU, Intel Core i9-14900HX
69606 Points
Razer Blade 16 2024, RTX 4090
NVIDIA GeForce RTX 4090 Laptop GPU, Intel Core i9-14900HX
65956 Points -5%
Average NVIDIA GeForce RTX 4090 Laptop GPU
  (54073 - 73027, n=42)
65041 Points -7%
Medion Erazer Beast X40 2024
NVIDIA GeForce RTX 4090 Laptop GPU, Intel Core i9-14900HX
64540 Points -7%
Lenovo Legion 9 16IRX9, RTX 4090
NVIDIA GeForce RTX 4090 Laptop GPU, Intel Core i9-14900HX
64341 Points -8%
Asus ROG Strix Scar 17 G733PYV-LL053X
NVIDIA GeForce RTX 4090 Laptop GPU, AMD Ryzen 9 7945HX3D
64166 Points -8%
Lenovo Legion Pro 7 RTX4090
NVIDIA GeForce RTX 4090 Laptop GPU, Intel Core i9-13900HX
62862 Points -10%
Asus ROG Strix Scar 16 G634JZR
NVIDIA GeForce RTX 4080 Laptop GPU, Intel Core i9-14900HX
58713 Points -16%
Alienware x16 R2 P120F
NVIDIA GeForce RTX 4080 Laptop GPU, Intel Core Ultra 9 185H
56772 Points -18%
Average of class Gaming
  (1029 - 72178, n=186, last 2 years)
43521 Points -37%
3DMark
1920x1080 Fire Strike Graphics
SCHENKER XMG Neo 16 (Early 24)
NVIDIA GeForce RTX 4090 Laptop GPU, Intel Core i9-14900HX
51946 Points
SCHENKER XMG Neo 16 (Early 24)
NVIDIA GeForce RTX 4090 Laptop GPU, Intel Core i9-14900HX (Overboost, Oasis)
50743 Points -2%
Asus ROG Strix Scar 17 G733PYV-LL053X
NVIDIA GeForce RTX 4090 Laptop GPU, AMD Ryzen 9 7945HX3D
49422 Points -5%
SCHENKER XMG Neo 16 E23
NVIDIA GeForce RTX 4090 Laptop GPU, Intel Core i9-13900HX
48556 Points -7%
Razer Blade 16 2024, RTX 4090
NVIDIA GeForce RTX 4090 Laptop GPU, Intel Core i9-14900HX
46527 Points -10%
Average NVIDIA GeForce RTX 4090 Laptop GPU
  (40259 - 53059, n=41)
46365 Points -11%
Lenovo Legion Pro 7 RTX4090
NVIDIA GeForce RTX 4090 Laptop GPU, Intel Core i9-13900HX
45696 Points -12%
Medion Erazer Beast X40 2024
NVIDIA GeForce RTX 4090 Laptop GPU, Intel Core i9-14900HX
44366 Points -15%
Lenovo Legion 9 16IRX9, RTX 4090
NVIDIA GeForce RTX 4090 Laptop GPU, Intel Core i9-14900HX
43518 Points -16%
Alienware x16 R2 P120F
NVIDIA GeForce RTX 4080 Laptop GPU, Intel Core Ultra 9 185H
42558 Points -18%
Asus ROG Strix Scar 16 G634JZR
NVIDIA GeForce RTX 4080 Laptop GPU, Intel Core i9-14900HX
41431 Points -20%
Average of class Gaming
  (781 - 53059, n=196, last 2 years)
31245 Points -40%
2560x1440 Time Spy Graphics
SCHENKER XMG Neo 16 (Early 24)
NVIDIA GeForce RTX 4090 Laptop GPU, Intel Core i9-14900HX (Overboost, Oasis)
22717 Points +3%
SCHENKER XMG Neo 16 E23
NVIDIA GeForce RTX 4090 Laptop GPU, Intel Core i9-13900HX
22529 Points +2%
SCHENKER XMG Neo 16 (Early 24)
NVIDIA GeForce RTX 4090 Laptop GPU, Intel Core i9-14900HX
22134 Points
Asus ROG Strix Scar 17 G733PYV-LL053X
NVIDIA GeForce RTX 4090 Laptop GPU, AMD Ryzen 9 7945HX3D
21353 Points -4%
Lenovo Legion Pro 7 RTX4090
NVIDIA GeForce RTX 4090 Laptop GPU, Intel Core i9-13900HX
21279 Points -4%
Average NVIDIA GeForce RTX 4090 Laptop GPU
  (16950 - 23292, n=43)
20950 Points -5%
Medion Erazer Beast X40 2024
NVIDIA GeForce RTX 4090 Laptop GPU, Intel Core i9-14900HX
20806 Points -6%
Lenovo Legion 9 16IRX9, RTX 4090
NVIDIA GeForce RTX 4090 Laptop GPU, Intel Core i9-14900HX
20416 Points -8%
Razer Blade 16 2024, RTX 4090
NVIDIA GeForce RTX 4090 Laptop GPU, Intel Core i9-14900HX
19878 Points -10%
Asus ROG Strix Scar 16 G634JZR
NVIDIA GeForce RTX 4080 Laptop GPU, Intel Core i9-14900HX
18954 Points -14%
Alienware x16 R2 P120F
NVIDIA GeForce RTX 4080 Laptop GPU, Intel Core Ultra 9 185H
18627 Points -16%
Average of class Gaming
  (224 - 22717, n=191, last 2 years)
13034 Points -41%
3DMark 06 Standard Score
62889 poäng
3DMark 11 Performance
43829 poäng
3DMark Fire Strike Score
38597 poäng
3DMark Time Spy Score
20588 poäng
3DMark Steel Nomad Score
5102 poäng
Hjälp
Blender
v3.3 Classroom OPTIX/RTX
Average of class Gaming
  (9 - 95, n=177, last 2 years)
21 Seconds * -62%
Alienware x16 R2 P120F
NVIDIA GeForce RTX 4080 Laptop GPU, Intel Core Ultra 9 185H (3.3.3)
15 Seconds * -15%
SCHENKER XMG Neo 16 E23
NVIDIA GeForce RTX 4090 Laptop GPU, Intel Core i9-13900HX (3.3.0)
13 Seconds * -0%
Asus ROG Strix Scar 16 G634JZR
NVIDIA GeForce RTX 4080 Laptop GPU, Intel Core i9-14900HX (3.3.3)
13 Seconds * -0%
Lenovo Legion 9 16IRX9, RTX 4090
NVIDIA GeForce RTX 4090 Laptop GPU, Intel Core i9-14900HX (3.3.3)
13 Seconds * -0%
SCHENKER XMG Neo 16 (Early 24)
NVIDIA GeForce RTX 4090 Laptop GPU, Intel Core i9-14900HX (3.3.3)
13 Seconds *
Average NVIDIA GeForce RTX 4090 Laptop GPU
  (9 - 19, n=39)
12.1 Seconds * +7%
Lenovo Legion Pro 7 RTX4090
NVIDIA GeForce RTX 4090 Laptop GPU, Intel Core i9-13900HX (3.3.3)
12 Seconds * +8%
Razer Blade 16 2024, RTX 4090
NVIDIA GeForce RTX 4090 Laptop GPU, Intel Core i9-14900HX (3.3.3)
12 Seconds * +8%
SCHENKER XMG Neo 16 (Early 24)
NVIDIA GeForce RTX 4090 Laptop GPU, Intel Core i9-14900HX (3.3.3, Overboost, Oasis)
12 Seconds * +8%
Asus ROG Strix Scar 17 G733PYV-LL053X
NVIDIA GeForce RTX 4090 Laptop GPU, AMD Ryzen 9 7945HX3D (3.3.3)
11 Seconds * +15%
Medion Erazer Beast X40 2024
NVIDIA GeForce RTX 4090 Laptop GPU, Intel Core i9-14900HX (3.3.3)
11 Seconds * +15%
v3.3 Classroom CUDA
Average of class Gaming
  (16 - 175, n=183, last 2 years)
36.7 Seconds * -116%
Asus ROG Strix Scar 16 G634JZR
NVIDIA GeForce RTX 4080 Laptop GPU, Intel Core i9-14900HX (3.3.3)
22 Seconds * -29%
Alienware x16 R2 P120F
NVIDIA GeForce RTX 4080 Laptop GPU, Intel Core Ultra 9 185H (3.3.3)
22 Seconds * -29%
Average NVIDIA GeForce RTX 4090 Laptop GPU
  (16 - 24, n=39)
18.3 Seconds * -8%
SCHENKER XMG Neo 16 E23
NVIDIA GeForce RTX 4090 Laptop GPU, Intel Core i9-13900HX (3.3.0)
18 Seconds * -6%
Lenovo Legion Pro 7 RTX4090
NVIDIA GeForce RTX 4090 Laptop GPU, Intel Core i9-13900HX
18 Seconds * -6%
Asus ROG Strix Scar 17 G733PYV-LL053X
NVIDIA GeForce RTX 4090 Laptop GPU, AMD Ryzen 9 7945HX3D (3.3.3)
18 Seconds * -6%
Razer Blade 16 2024, RTX 4090
NVIDIA GeForce RTX 4090 Laptop GPU, Intel Core i9-14900HX (3.3.3)
18 Seconds * -6%
Lenovo Legion 9 16IRX9, RTX 4090
NVIDIA GeForce RTX 4090 Laptop GPU, Intel Core i9-14900HX (3.3.3)
18 Seconds * -6%
Medion Erazer Beast X40 2024
NVIDIA GeForce RTX 4090 Laptop GPU, Intel Core i9-14900HX (3.3.3)
17 Seconds * -0%
SCHENKER XMG Neo 16 (Early 24)
NVIDIA GeForce RTX 4090 Laptop GPU, Intel Core i9-14900HX (3.3.3)
17 Seconds *
SCHENKER XMG Neo 16 (Early 24)
NVIDIA GeForce RTX 4090 Laptop GPU, Intel Core i9-14900HX (3.3.3, Overboost, Oasis)
16 Seconds * +6%
v3.3 Classroom CPU
Alienware x16 R2 P120F
NVIDIA GeForce RTX 4080 Laptop GPU, Intel Core Ultra 9 185H (3.3.3)
305 Seconds * -83%
Average of class Gaming
  (138 - 962, n=191, last 2 years)
297 Seconds * -78%
Medion Erazer Beast X40 2024
NVIDIA GeForce RTX 4090 Laptop GPU, Intel Core i9-14900HX (3.3.3)
253 Seconds * -51%
SCHENKER XMG Neo 16 E23
NVIDIA GeForce RTX 4090 Laptop GPU, Intel Core i9-13900HX (3.3.0)
205 Seconds * -23%
Razer Blade 16 2024, RTX 4090
NVIDIA GeForce RTX 4090 Laptop GPU, Intel Core i9-14900HX (3.3.3)
202 Seconds * -21%
Average NVIDIA GeForce RTX 4090 Laptop GPU
  (144 - 305, n=39)
199.1 Seconds * -19%
Lenovo Legion Pro 7 RTX4090
NVIDIA GeForce RTX 4090 Laptop GPU, Intel Core i9-13900HX (3.3.3)
198 Seconds * -19%
Lenovo Legion 9 16IRX9, RTX 4090
NVIDIA GeForce RTX 4090 Laptop GPU, Intel Core i9-14900HX (3.3.3)
193 Seconds * -16%
Asus ROG Strix Scar 16 G634JZR
NVIDIA GeForce RTX 4080 Laptop GPU, Intel Core i9-14900HX (3.3.3)
187 Seconds * -12%
SCHENKER XMG Neo 16 (Early 24)
NVIDIA GeForce RTX 4090 Laptop GPU, Intel Core i9-14900HX (3.3.3)
167 Seconds *
SCHENKER XMG Neo 16 (Early 24)
NVIDIA GeForce RTX 4090 Laptop GPU, Intel Core i9-14900HX (3.3.3, Overboost, Oasis)
155 Seconds * +7%
Asus ROG Strix Scar 17 G733PYV-LL053X
NVIDIA GeForce RTX 4090 Laptop GPU, AMD Ryzen 9 7945HX3D (3.3.3)
150 Seconds * +10%
Geekbench 5.5
OpenCL Score
SCHENKER XMG Neo 16 (Early 24)
NVIDIA GeForce RTX 4090 Laptop GPU, Intel Core i9-14900HX (Overboost, Oasis)
237138 Points +4%
SCHENKER XMG Neo 16 (Early 24)
NVIDIA GeForce RTX 4090 Laptop GPU, Intel Core i9-14900HX
228074 Points
SCHENKER XMG Neo 16 E23
NVIDIA GeForce RTX 4090 Laptop GPU, Intel Core i9-13900HX
221004 Points -3%
Asus ROG Strix Scar 17 G733PYV-LL053X
NVIDIA GeForce RTX 4090 Laptop GPU, AMD Ryzen 9 7945HX3D
204326 Points -10%
Medion Erazer Beast X40 2024
NVIDIA GeForce RTX 4090 Laptop GPU, Intel Core i9-14900HX
201625 Points -12%
Average NVIDIA GeForce RTX 4090 Laptop GPU
  (6841 - 237138, n=39)
201434 Points -12%
Razer Blade 16 2024, RTX 4090
NVIDIA GeForce RTX 4090 Laptop GPU, Intel Core i9-14900HX
196962 Points -14%
Lenovo Legion 9 16IRX9, RTX 4090
NVIDIA GeForce RTX 4090 Laptop GPU, Intel Core i9-14900HX
190565 Points -16%
Lenovo Legion Pro 7 RTX4090
NVIDIA GeForce RTX 4090 Laptop GPU, Intel Core i9-13900HX
170505 Points -25%
Asus ROG Strix Scar 16 G634JZR
NVIDIA GeForce RTX 4080 Laptop GPU, Intel Core i9-14900HX
170225 Points -25%
Alienware x16 R2 P120F
NVIDIA GeForce RTX 4080 Laptop GPU, Intel Core Ultra 9 185H
163242 Points -28%
Average of class Gaming
  (5039 - 237138, n=193, last 2 years)
125975 Points -45%
Vulkan Score 5.5
SCHENKER XMG Neo 16 (Early 24)
NVIDIA GeForce RTX 4090 Laptop GPU, Intel Core i9-14900HX
163089 Points
Medion Erazer Beast X40 2024
NVIDIA GeForce RTX 4090 Laptop GPU, Intel Core i9-14900HX
154063 Points -6%
Razer Blade 16 2024, RTX 4090
NVIDIA GeForce RTX 4090 Laptop GPU, Intel Core i9-14900HX
148841 Points -9%
Lenovo Legion 9 16IRX9, RTX 4090
NVIDIA GeForce RTX 4090 Laptop GPU, Intel Core i9-14900HX
133971 Points -18%
Asus ROG Strix Scar 17 G733PYV-LL053X
NVIDIA GeForce RTX 4090 Laptop GPU, AMD Ryzen 9 7945HX3D
119323 Points -27%
SCHENKER XMG Neo 16 (Early 24)
NVIDIA GeForce RTX 4090 Laptop GPU, Intel Core i9-14900HX (Overboost, Oasis)
117457 Points -28%
Average NVIDIA GeForce RTX 4090 Laptop GPU
  (49663 - 163089, n=28)
102459 Points -37%
Alienware x16 R2 P120F
NVIDIA GeForce RTX 4080 Laptop GPU, Intel Core Ultra 9 185H
82123 Points -50%
Average of class Gaming
  (7995 - 163089, n=123, last 2 years)
71890 Points -56%
Lenovo Legion Pro 7 RTX4090
NVIDIA GeForce RTX 4090 Laptop GPU, Intel Core i9-13900HX
63400 Points -61%
Asus ROG Strix Scar 16 G634JZR
NVIDIA GeForce RTX 4080 Laptop GPU, Intel Core i9-14900HX
52951 Points -68%
Geekbench 6.3
GPU Vulkan
Razer Blade 16 2024, RTX 4090
NVIDIA GeForce RTX 4090 Laptop GPU, Intel Core i9-14900HX (6.2.1)
178909 Points +9%
Medion Erazer Beast X40 2024
NVIDIA GeForce RTX 4090 Laptop GPU, Intel Core i9-14900HX (6.2.1)
178630 Points +9%
SCHENKER XMG Neo 16 (Early 24)
NVIDIA GeForce RTX 4090 Laptop GPU, Intel Core i9-14900HX (6.2.1)
164105 Points
Asus ROG Strix Scar 17 G733PYV-LL053X
NVIDIA GeForce RTX 4090 Laptop GPU, AMD Ryzen 9 7945HX3D
157614 Points -4%
SCHENKER XMG Neo 16 (Early 24)
NVIDIA GeForce RTX 4090 Laptop GPU, Intel Core i9-14900HX (6.2.1, Overboost, Oasis)
149336 Points -9%
Lenovo Legion 9 16IRX9, RTX 4090
NVIDIA GeForce RTX 4090 Laptop GPU, Intel Core i9-14900HX (6.2.1)
148584 Points -9%
Average NVIDIA GeForce RTX 4090 Laptop GPU
  (9584 - 196201, n=18)
139199 Points -15%
Alienware x16 R2 P120F
NVIDIA GeForce RTX 4080 Laptop GPU, Intel Core Ultra 9 185H (6.2.1)
115199 Points -30%
Asus ROG Strix Scar 16 G634JZR
NVIDIA GeForce RTX 4080 Laptop GPU, Intel Core i9-14900HX (6.2.1)
110302 Points -33%
Average of class Gaming
  (4286 - 196201, n=106, last 2 years)
82317 Points -50%
GPU OpenCL
Medion Erazer Beast X40 2024
NVIDIA GeForce RTX 4090 Laptop GPU, Intel Core i9-14900HX (6.2.1)
207373 Points +9%
SCHENKER XMG Neo 16 (Early 24)
NVIDIA GeForce RTX 4090 Laptop GPU, Intel Core i9-14900HX (6.2.1, Overboost, Oasis)
199154 Points +4%
Asus ROG Strix Scar 17 G733PYV-LL053X
NVIDIA GeForce RTX 4090 Laptop GPU, AMD Ryzen 9 7945HX3D
192262 Points +1%
SCHENKER XMG Neo 16 (Early 24)
NVIDIA GeForce RTX 4090 Laptop GPU, Intel Core i9-14900HX (6.2.1)
190820 Points
Lenovo Legion 9 16IRX9, RTX 4090
NVIDIA GeForce RTX 4090 Laptop GPU, Intel Core i9-14900HX (6.2.1)
190540 Points 0%
Average NVIDIA GeForce RTX 4090 Laptop GPU
  (159127 - 209521, n=20)
187721 Points -2%
Razer Blade 16 2024, RTX 4090
NVIDIA GeForce RTX 4090 Laptop GPU, Intel Core i9-14900HX (6.2.1)
167047 Points -12%
Asus ROG Strix Scar 16 G634JZR
NVIDIA GeForce RTX 4080 Laptop GPU, Intel Core i9-14900HX (6.2.1)
157282 Points -18%
Alienware x16 R2 P120F
NVIDIA GeForce RTX 4080 Laptop GPU, Intel Core Ultra 9 185H (6.2.1)
153327 Points -20%
Average of class Gaming
  (4321 - 207373, n=109, last 2 years)
115663 Points -39%
V-Ray 5 Benchmark
GPU RTX
SCHENKER XMG Neo 16 (Early 24)
NVIDIA GeForce RTX 4090 Laptop GPU, Intel Core i9-14900HX (5.0.1, v6.92.6600, Overboost, Oasis)
3744 mpaths +4%
Asus ROG Strix Scar 17 G733PYV-LL053X
NVIDIA GeForce RTX 4090 Laptop GPU, AMD Ryzen 9 7945HX3D (5.0.1)
3715 mpaths +4%
SCHENKER XMG Neo 16 (Early 24)
NVIDIA GeForce RTX 4090 Laptop GPU, Intel Core i9-14900HX (5.0.1)
3588 mpaths
Average NVIDIA GeForce RTX 4090 Laptop GPU
  (1982 - 3824, n=29)
3476 mpaths -3%
Medion Erazer Beast X40 2024
NVIDIA GeForce RTX 4090 Laptop GPU, Intel Core i9-14900HX (5.0.1)
3424 mpaths -5%
Alienware x16 R2 P120F
NVIDIA GeForce RTX 4080 Laptop GPU, Intel Core Ultra 9 185H (5.0.1)
2653 mpaths -26%
Average of class Gaming
  (171 - 3824, n=114, last 2 years)
2181 mpaths -39%
GPU CUDA
SCHENKER XMG Neo 16 (Early 24)
NVIDIA GeForce RTX 4090 Laptop GPU, Intel Core i9-14900HX (5.0.1, v6.92.6600, Overboost, Oasis)
2710 mpaths +4%
Asus ROG Strix Scar 17 G733PYV-LL053X
NVIDIA GeForce RTX 4090 Laptop GPU, AMD Ryzen 9 7945HX3D (5.0.1)
2708 mpaths +4%
SCHENKER XMG Neo 16 (Early 24)
NVIDIA GeForce RTX 4090 Laptop GPU, Intel Core i9-14900HX (5.0.1)
2603 mpaths
Average NVIDIA GeForce RTX 4090 Laptop GPU
  (1454 - 2797, n=29)
2537 mpaths -3%
Medion Erazer Beast X40 2024
NVIDIA GeForce RTX 4090 Laptop GPU, Intel Core i9-14900HX (5.0.1)
2489 mpaths -4%
Alienware x16 R2 P120F
NVIDIA GeForce RTX 4080 Laptop GPU, Intel Core Ultra 9 185H (5.0.1)
1967 mpaths -24%
Average of class Gaming
  (120 - 2797, n=116, last 2 years)
1568 mpaths -40%
CPU
Asus ROG Strix Scar 17 G733PYV-LL053X
NVIDIA GeForce RTX 4090 Laptop GPU, AMD Ryzen 9 7945HX3D (5.0.1)
25424 mpaths +9%
SCHENKER XMG Neo 16 (Early 24)
NVIDIA GeForce RTX 4090 Laptop GPU, Intel Core i9-14900HX (5.0.1, v6.92.6600, Overboost, Oasis)
24595 mpaths +5%
SCHENKER XMG Neo 16 (Early 24)
NVIDIA GeForce RTX 4090 Laptop GPU, Intel Core i9-14900HX (5.0.1)
23364 mpaths
Average NVIDIA GeForce RTX 4090 Laptop GPU
  (12404 - 25897, n=27)
20296 mpaths -13%
Medion Erazer Beast X40 2024
NVIDIA GeForce RTX 4090 Laptop GPU, Intel Core i9-14900HX (5.0.1)
15489 mpaths -34%
Average of class Gaming
  (3562 - 26944, n=119, last 2 years)
15070 mpaths -35%
Alienware x16 R2 P120F
NVIDIA GeForce RTX 4080 Laptop GPU, Intel Core Ultra 9 185H (5.0.1)
12388 mpaths -47%
V-Ray Benchmark Next 4.10
GPU
SCHENKER XMG Neo 16 E23
NVIDIA GeForce RTX 4090 Laptop GPU, Intel Core i9-13900HX (v4.10.07 )
1334 mpaths +3%
SCHENKER XMG Neo 16 (Early 24)
NVIDIA GeForce RTX 4090 Laptop GPU, Intel Core i9-14900HX (v4.10.07, v6.92.6600, Overboost, Oasis)
1317 mpaths +2%
SCHENKER XMG Neo 16 (Early 24)
NVIDIA GeForce RTX 4090 Laptop GPU, Intel Core i9-14900HX (v4.10.07 )
1296 mpaths
Asus ROG Strix Scar 17 G733PYV-LL053X
NVIDIA GeForce RTX 4090 Laptop GPU, AMD Ryzen 9 7945HX3D (v4.10.07 )
1276 mpaths -2%
Razer Blade 16 2024, RTX 4090
NVIDIA GeForce RTX 4090 Laptop GPU, Intel Core i9-14900HX (v4.10.07 )
1258 mpaths -3%
Average NVIDIA GeForce RTX 4090 Laptop GPU
  (873 - 1334, n=30)
1213 mpaths -6%
Lenovo Legion 9 16IRX9, RTX 4090
NVIDIA GeForce RTX 4090 Laptop GPU, Intel Core i9-14900HX (v4.10.07 )
1191 mpaths -8%
Medion Erazer Beast X40 2024
NVIDIA GeForce RTX 4090 Laptop GPU, Intel Core i9-14900HX (v4.10.07 )
1170 mpaths -10%
Asus ROG Strix Scar 16 G634JZR
NVIDIA GeForce RTX 4080 Laptop GPU, Intel Core i9-14900HX (v4.10.07 )
1036 mpaths -20%
Lenovo Legion Pro 7 RTX4090
NVIDIA GeForce RTX 4090 Laptop GPU, Intel Core i9-13900HX (v4.10.07 )
873 mpaths -33%
Average of class Gaming
  (54 - 1334, n=152, last 2 years)
701 mpaths -46%
CPU
Asus ROG Strix Scar 17 G733PYV-LL053X
NVIDIA GeForce RTX 4090 Laptop GPU, AMD Ryzen 9 7945HX3D (v4.10.07 )
37621 ksamples +3%
SCHENKER XMG Neo 16 (Early 24)
NVIDIA GeForce RTX 4090 Laptop GPU, Intel Core i9-14900HX (v4.10.07, v6.92.6600, Overboost, Oasis)
37055 ksamples +2%
SCHENKER XMG Neo 16 (Early 24)
NVIDIA GeForce RTX 4090 Laptop GPU, Intel Core i9-14900HX (v4.10.07 )
36438 ksamples
Lenovo Legion 9 16IRX9, RTX 4090
NVIDIA GeForce RTX 4090 Laptop GPU, Intel Core i9-14900HX (v4.10.07 )
31870 ksamples -13%
Lenovo Legion Pro 7 RTX4090
NVIDIA GeForce RTX 4090 Laptop GPU, Intel Core i9-13900HX (v4.10.07 )
30971 ksamples -15%
Asus ROG Strix Scar 16 G634JZR
NVIDIA GeForce RTX 4080 Laptop GPU, Intel Core i9-14900HX (v4.10.07 )
30073 ksamples -17%
Average NVIDIA GeForce RTX 4090 Laptop GPU
  (18206 - 37629, n=30)
29643 ksamples -19%
Razer Blade 16 2024, RTX 4090
NVIDIA GeForce RTX 4090 Laptop GPU, Intel Core i9-14900HX (v4.10.07 )
29082 ksamples -20%
SCHENKER XMG Neo 16 E23
NVIDIA GeForce RTX 4090 Laptop GPU, Intel Core i9-13900HX (v4.10.07 )
29032 ksamples -20%
Medion Erazer Beast X40 2024
NVIDIA GeForce RTX 4090 Laptop GPU, Intel Core i9-14900HX (v4.10.07 )
23314 ksamples -36%
Average of class Gaming
  (5413 - 37629, n=152, last 2 years)
21367 ksamples -41%

* ... smaller is better

Prestanda för spel

XMG-datorn är utformad för att hantera QHD-spel med maximala inställningar. Bildfrekvenserna ligger över genomsnittet för RTX 4090 (Overboost) och vattenkylningen ökar prestandan något. GPU-funktionerna Frame Generation och DLSS 3 skulle möjliggöra högre upplösningar vid maximala inställningar och med raytracing - dock endast med spel som erbjuder dessa funktioner.

Performance Rating - Percent
Asus ROG Strix Scar 17 G733PYV-LL053X
AMD Ryzen 9 7945HX3D, NVIDIA GeForce RTX 4090 Laptop GPU
97.7 pt
SCHENKER XMG Neo 16 (Early 24)
Intel Core i9-14900HX, NVIDIA GeForce RTX 4090 Laptop GPU
94.6 pt
SCHENKER XMG Neo 16 (Early 24)
Intel Core i9-14900HX, NVIDIA GeForce RTX 4090 Laptop GPU
94.1 pt
SCHENKER XMG Neo 16 E23
Intel Core i9-13900HX, NVIDIA GeForce RTX 4090 Laptop GPU
88.8 pt
Medion Erazer Beast X40 2024
Intel Core i9-14900HX, NVIDIA GeForce RTX 4090 Laptop GPU
88.5 pt
Lenovo Legion Pro 7 RTX4090
Intel Core i9-13900HX, NVIDIA GeForce RTX 4090 Laptop GPU
86.1 pt
Average NVIDIA GeForce RTX 4090 Laptop GPU
 
84.2 pt
Asus ROG Strix Scar 16 G634JZR
Intel Core i9-14900HX, NVIDIA GeForce RTX 4080 Laptop GPU
84 pt
Razer Blade 16 2024, RTX 4090
Intel Core i9-14900HX, NVIDIA GeForce RTX 4090 Laptop GPU
83.9 pt
Lenovo Legion 9 16IRX9, RTX 4090
Intel Core i9-14900HX, NVIDIA GeForce RTX 4090 Laptop GPU
82.8 pt
Alienware x16 R2 P120F -1!
Intel Core Ultra 9 185H, NVIDIA GeForce RTX 4080 Laptop GPU
66.2 pt
Average of class Gaming
 
62 pt
The Witcher 3 - 1920x1080 Ultra Graphics & Postprocessing (HBAO+)
SCHENKER XMG Neo 16 (Early 24)
Intel Core i9-14900HX, NVIDIA GeForce RTX 4090 Laptop GPU
214 (181min) fps
SCHENKER XMG Neo 16 (Early 24)
Intel Core i9-14900HX, NVIDIA GeForce RTX 4090 Laptop GPU (Overboost, Oasis)
214 fps 0%
SCHENKER XMG Neo 16 E23
Intel Core i9-13900HX, NVIDIA GeForce RTX 4090 Laptop GPU
210 (170min) fps -2%
Asus ROG Strix Scar 17 G733PYV-LL053X
AMD Ryzen 9 7945HX3D, NVIDIA GeForce RTX 4090 Laptop GPU
207 fps -3%
Medion Erazer Beast X40 2024
Intel Core i9-14900HX, NVIDIA GeForce RTX 4090 Laptop GPU
204 fps -5%
Lenovo Legion 9 16IRX9, RTX 4090
Intel Core i9-14900HX, NVIDIA GeForce RTX 4090 Laptop GPU
203.4 fps -5%
Lenovo Legion Pro 7 RTX4090
Intel Core i9-13900HX, NVIDIA GeForce RTX 4090 Laptop GPU
200 (174min) fps -7%
Razer Blade 16 2024, RTX 4090
Intel Core i9-14900HX, NVIDIA GeForce RTX 4090 Laptop GPU
200 fps -7%
Average NVIDIA GeForce RTX 4090 Laptop GPU
  (139.2 - 216, n=35)
198.5 fps -7%
Asus ROG Strix Scar 16 G634JZR
Intel Core i9-14900HX, NVIDIA GeForce RTX 4080 Laptop GPU
185.6 (170min, 170.31P1) fps -13%
Alienware x16 R2 P120F
Intel Core Ultra 9 185H, NVIDIA GeForce RTX 4080 Laptop GPU
166.3 (154min) fps -22%
Average of class Gaming
  (18.4 - 216, n=168, last 2 years)
126.9 fps -41%
GTA V - 1920x1080 Highest Settings possible AA:4xMSAA + FX AF:16x
Asus ROG Strix Scar 17 G733PYV-LL053X
AMD Ryzen 9 7945HX3D, NVIDIA GeForce RTX 4090 Laptop GPU
167.7 (1.87min, 111.1P1) fps +5%
SCHENKER XMG Neo 16 (Early 24)
Intel Core i9-14900HX, NVIDIA GeForce RTX 4090 Laptop GPU (Overboost, Oasis)
163 (4.23min, 125P1) fps +2%
SCHENKER XMG Neo 16 (Early 24)
Intel Core i9-14900HX, NVIDIA GeForce RTX 4090 Laptop GPU
159.3 (3.25min, 125P1) fps
SCHENKER XMG Neo 16 E23
Intel Core i9-13900HX, NVIDIA GeForce RTX 4090 Laptop GPU
148.2 (7.32min, 100P1) fps -7%
Lenovo Legion Pro 7 RTX4090
Intel Core i9-13900HX, NVIDIA GeForce RTX 4090 Laptop GPU
143.6 (4.39min, 100P1) fps -10%
Medion Erazer Beast X40 2024
Intel Core i9-14900HX, NVIDIA GeForce RTX 4090 Laptop GPU
141.5 (3.53min, 100P1) fps -11%
Asus ROG Strix Scar 16 G634JZR
Intel Core i9-14900HX, NVIDIA GeForce RTX 4080 Laptop GPU
139 (6.45min, 100P1) fps -13%
Average NVIDIA GeForce RTX 4090 Laptop GPU
  (91.1 - 167.7, n=40)
138.6 fps -13%
Razer Blade 16 2024, RTX 4090
Intel Core i9-14900HX, NVIDIA GeForce RTX 4090 Laptop GPU
138.1 (4.19min, 83.3P1) fps -13%
Lenovo Legion 9 16IRX9, RTX 4090
Intel Core i9-14900HX, NVIDIA GeForce RTX 4090 Laptop GPU
136.2 (0.938min, 111.1P1) fps -15%
Average of class Gaming
  (12.1 - 167.7, n=171, last 2 years)
113 fps -29%
Final Fantasy XV Benchmark - 1920x1080 High Quality
SCHENKER XMG Neo 16 (Early 24)
Intel Core i9-14900HX, NVIDIA GeForce RTX 4090 Laptop GPU (1.3, Overboost, Oasis)
201 fps +2%
SCHENKER XMG Neo 16 (Early 24)
Intel Core i9-14900HX, NVIDIA GeForce RTX 4090 Laptop GPU (1.3)
196.9 fps
SCHENKER XMG Neo 16 E23
Intel Core i9-13900HX, NVIDIA GeForce RTX 4090 Laptop GPU (1.3)
184.9 fps -6%
Lenovo Legion Pro 7 RTX4090
Intel Core i9-13900HX, NVIDIA GeForce RTX 4090 Laptop GPU (1.3)
181.2 fps -8%
Medion Erazer Beast X40 2024
Intel Core i9-14900HX, NVIDIA GeForce RTX 4090 Laptop GPU (1.3)
181.1 fps -8%
Asus ROG Strix Scar 17 G733PYV-LL053X
AMD Ryzen 9 7945HX3D, NVIDIA GeForce RTX 4090 Laptop GPU (1.3)
180 fps -9%
Asus ROG Strix Scar 16 G634JZR
Intel Core i9-14900HX, NVIDIA GeForce RTX 4080 Laptop GPU (1.3)
178 fps -10%
Average NVIDIA GeForce RTX 4090 Laptop GPU
  (122.2 - 201, n=40)
173.4 fps -12%
Lenovo Legion 9 16IRX9, RTX 4090
Intel Core i9-14900HX, NVIDIA GeForce RTX 4090 Laptop GPU (1.3)
165.1 fps -16%
Alienware x16 R2 P120F
Intel Core Ultra 9 185H, NVIDIA GeForce RTX 4080 Laptop GPU (1.3)
139.8 fps -29%
Razer Blade 16 2024, RTX 4090
Intel Core i9-14900HX, NVIDIA GeForce RTX 4090 Laptop GPU (1.3)
137.5 fps -30%
Average of class Gaming
  (19.2 - 201, n=184, last 2 years)
119 fps -40%
Strange Brigade - 1920x1080 ultra AA:ultra AF:16
Asus ROG Strix Scar 17 G733PYV-LL053X
AMD Ryzen 9 7945HX3D, NVIDIA GeForce RTX 4090 Laptop GPU (1.47.22.14 D3D12)
420 (64.7min, 302P1) fps +4%
SCHENKER XMG Neo 16 (Early 24)
Intel Core i9-14900HX, NVIDIA GeForce RTX 4090 Laptop GPU (1.47.22.14 D3D12, Overboost, Oasis)
415 (139.4min, 305P1) fps +3%
SCHENKER XMG Neo 16 (Early 24)
Intel Core i9-14900HX, NVIDIA GeForce RTX 4090 Laptop GPU (1.47.22.14 D3D12)
403 (101.2min, 295P1) fps
SCHENKER XMG Neo 16 E23
Intel Core i9-13900HX, NVIDIA GeForce RTX 4090 Laptop GPU (1.47.22.14 D3D12)
384 (116.1min, 281P1) fps -5%
Medion Erazer Beast X40 2024
Intel Core i9-14900HX, NVIDIA GeForce RTX 4090 Laptop GPU (1.47.22.14 D3D12)
371 (5min, 273P1) fps -8%
Lenovo Legion 9 16IRX9, RTX 4090
Intel Core i9-14900HX, NVIDIA GeForce RTX 4090 Laptop GPU (1.47.22.14 D3D12)
369 (5min, 269P1) fps -8%
Razer Blade 16 2024, RTX 4090
Intel Core i9-14900HX, NVIDIA GeForce RTX 4090 Laptop GPU (1.47.22.14 D3D12)
359.8 (30.2min, 253P1) fps -11%
Average NVIDIA GeForce RTX 4090 Laptop GPU
  (233 - 421, n=39)
357 fps -11%
Lenovo Legion Pro 7 RTX4090
Intel Core i9-13900HX, NVIDIA GeForce RTX 4090 Laptop GPU (1.47.22.14 D3D12)
347 (87.7min, 252P1) fps -14%
Asus ROG Strix Scar 16 G634JZR
Intel Core i9-14900HX, NVIDIA GeForce RTX 4080 Laptop GPU (1.47.22.14 D3D12)
337 (16.7min, 246P1) fps -16%
Alienware x16 R2 P120F
Intel Core Ultra 9 185H, NVIDIA GeForce RTX 4080 Laptop GPU (1.47.22.14 D3D12)
293 (38.3min, 184.1P1) fps -27%
Average of class Gaming
  (38.9 - 421, n=182, last 2 years)
227 fps -44%
Dota 2 Reborn - 1920x1080 ultra (3/3) best looking
Asus ROG Strix Scar 17 G733PYV-LL053X
AMD Ryzen 9 7945HX3D, NVIDIA GeForce RTX 4090 Laptop GPU
220 (175min) fps +13%
SCHENKER XMG Neo 16 (Early 24)
Intel Core i9-14900HX, NVIDIA GeForce RTX 4090 Laptop GPU
194.6 (165.7min) fps
SCHENKER XMG Neo 16 (Early 24)
Intel Core i9-14900HX, NVIDIA GeForce RTX 4090 Laptop GPU (Overboost, Oasis)
193.3 (166.3min) fps -1%
Medion Erazer Beast X40 2024
Intel Core i9-14900HX, NVIDIA GeForce RTX 4090 Laptop GPU
189.9 (162.8min) fps -2%
Razer Blade 16 2024, RTX 4090
Intel Core i9-14900HX, NVIDIA GeForce RTX 4090 Laptop GPU
188.1 (155.2min) fps -3%
SCHENKER XMG Neo 16 E23
Intel Core i9-13900HX, NVIDIA GeForce RTX 4090 Laptop GPU
182.6 (154.9min) fps -6%
Lenovo Legion Pro 7 RTX4090
Intel Core i9-13900HX, NVIDIA GeForce RTX 4090 Laptop GPU
182.1 (154.2min) fps -6%
Asus ROG Strix Scar 16 G634JZR
Intel Core i9-14900HX, NVIDIA GeForce RTX 4080 Laptop GPU
177.4 (149.3min) fps -9%
Average NVIDIA GeForce RTX 4090 Laptop GPU
  (115.7 - 220, n=42)
176.3 fps -9%
Lenovo Legion 9 16IRX9, RTX 4090
Intel Core i9-14900HX, NVIDIA GeForce RTX 4090 Laptop GPU
164.5 (136min) fps -15%
Average of class Gaming
  (30.8 - 220, n=190, last 2 years)
149.3 fps -23%
Alienware x16 R2 P120F
Intel Core Ultra 9 185H, NVIDIA GeForce RTX 4080 Laptop GPU
133 (114.6min) fps -32%
X-Plane 11.11 - 1920x1080 high (fps_test=3)
Asus ROG Strix Scar 17 G733PYV-LL053X
AMD Ryzen 9 7945HX3D, NVIDIA GeForce RTX 4090 Laptop GPU
166.2 fps +15%
Razer Blade 16 2024, RTX 4090
Intel Core i9-14900HX, NVIDIA GeForce RTX 4090 Laptop GPU
146.2 fps +1%
SCHENKER XMG Neo 16 (Early 24)
Intel Core i9-14900HX, NVIDIA GeForce RTX 4090 Laptop GPU
144.5 fps
Medion Erazer Beast X40 2024
Intel Core i9-14900HX, NVIDIA GeForce RTX 4090 Laptop GPU
143.9 fps 0%
Asus ROG Strix Scar 16 G634JZR
Intel Core i9-14900HX, NVIDIA GeForce RTX 4080 Laptop GPU
141.3 fps -2%
SCHENKER XMG Neo 16 (Early 24)
Intel Core i9-14900HX, NVIDIA GeForce RTX 4090 Laptop GPU (v6.92.6600, Overboost, Oasis)
139.6 fps -3%
Lenovo Legion Pro 7 RTX4090
Intel Core i9-13900HX, NVIDIA GeForce RTX 4090 Laptop GPU
136.4 fps -6%
SCHENKER XMG Neo 16 E23
Intel Core i9-13900HX, NVIDIA GeForce RTX 4090 Laptop GPU
133 fps -8%
Average NVIDIA GeForce RTX 4090 Laptop GPU
  (77.8 - 166.2, n=46)
130.7 fps -10%
Lenovo Legion 9 16IRX9, RTX 4090
Intel Core i9-14900HX, NVIDIA GeForce RTX 4090 Laptop GPU
125.6 fps -13%
Average of class Gaming
  (31.5 - 166.2, n=196, last 2 years)
107.2 fps -26%
Alienware x16 R2 P120F
Intel Core Ultra 9 185H, NVIDIA GeForce RTX 4080 Laptop GPU
89.3 fps -38%
Cyberpunk 2077 2.1 Phantom Liberty
2560x1440 Ultra Preset (FSR off)
SCHENKER XMG Neo 16 (Early 24)
Intel Core i9-14900HX, NVIDIA GeForce RTX 4090 Laptop GPU (2.02, Overboost, Oasis)
96.8 (61.1min) fps +3%
SCHENKER XMG Neo 16 (Early 24)
Intel Core i9-14900HX, NVIDIA GeForce RTX 4090 Laptop GPU (2.02)
93.8 (53.7min) fps
Average NVIDIA GeForce RTX 4090 Laptop GPU
  (68.1 - 103.9, n=19)
89.9 fps -4%
Medion Erazer Beast X40 2024
Intel Core i9-14900HX, NVIDIA GeForce RTX 4090 Laptop GPU (2.02)
87.5 (56.4min) fps -7%
Lenovo Legion 9 16IRX9, RTX 4090
Intel Core i9-14900HX, NVIDIA GeForce RTX 4090 Laptop GPU (2.12)
86 (70.4min) fps -8%
Razer Blade 16 2024, RTX 4090
Intel Core i9-14900HX, NVIDIA GeForce RTX 4090 Laptop GPU
83.39 (67.14min) fps -11%
Asus ROG Strix Scar 16 G634JZR
Intel Core i9-14900HX, NVIDIA GeForce RTX 4080 Laptop GPU (2.12)
77.6 (64min) fps -17%
Alienware x16 R2 P120F
Intel Core Ultra 9 185H, NVIDIA GeForce RTX 4080 Laptop GPU (2.02)
75.4 (25.4min) fps -20%
Average of class Gaming
  (24.8 - 110, n=69, last 2 years)
64.9 fps -31%
1920x1080 Ultra Preset (FSR off)
SCHENKER XMG Neo 16 (Early 24)
Intel Core i9-14900HX, NVIDIA GeForce RTX 4090 Laptop GPU (2.02, Overboost, Oasis)
133.1 (56.2min) fps +1%
SCHENKER XMG Neo 16 (Early 24)
Intel Core i9-14900HX, NVIDIA GeForce RTX 4090 Laptop GPU (2.02)
131.5 (62.2min) fps
Lenovo Legion 9 16IRX9, RTX 4090
Intel Core i9-14900HX, NVIDIA GeForce RTX 4090 Laptop GPU (2.12)
127 (70.6min) fps -3%
Asus ROG Strix Scar 16 G634JZR
Intel Core i9-14900HX, NVIDIA GeForce RTX 4080 Laptop GPU (2.12)
123.1 (100.1min) fps -6%
Average NVIDIA GeForce RTX 4090 Laptop GPU
  (93.1 - 144.7, n=19)
120.8 fps -8%
Medion Erazer Beast X40 2024
Intel Core i9-14900HX, NVIDIA GeForce RTX 4090 Laptop GPU (2.02)
118.9 (49.7min) fps -10%
Alienware x16 R2 P120F
Intel Core Ultra 9 185H, NVIDIA GeForce RTX 4080 Laptop GPU (2.02)
99.7 (13.5min) fps -24%
Razer Blade 16 2024, RTX 4090
Intel Core i9-14900HX, NVIDIA GeForce RTX 4090 Laptop GPU
95.35 (70.51min) fps -27%
Average of class Gaming
  (6.76 - 144.7, n=79, last 2 years)
85.9 fps -35%
1920x1080 Ray Tracing Ultra Preset (DLSS off)
SCHENKER XMG Neo 16 (Early 24)
Intel Core i9-14900HX, NVIDIA GeForce RTX 4090 Laptop GPU (2.02, Overboost, Oasis)
77.7 (39.8min) fps +3%
SCHENKER XMG Neo 16 (Early 24)
Intel Core i9-14900HX, NVIDIA GeForce RTX 4090 Laptop GPU (2.02)
75.5 (49.8min) fps
Average NVIDIA GeForce RTX 4090 Laptop GPU
  (65.5 - 77.7, n=11)
72.2 fps -4%
Medion Erazer Beast X40 2024
Intel Core i9-14900HX, NVIDIA GeForce RTX 4090 Laptop GPU (2.02)
68.3 (47.6min) fps -10%
Asus ROG Strix Scar 16 G634JZR
Intel Core i9-14900HX, NVIDIA GeForce RTX 4080 Laptop GPU (2.12)
62.4 (54.1min) fps -17%
Alienware x16 R2 P120F
Intel Core Ultra 9 185H, NVIDIA GeForce RTX 4080 Laptop GPU (2.02)
58.4 (15.2min) fps -23%
Average of class Gaming
  (11.9 - 77.7, n=54, last 2 years)
45.3 fps -40%
F1 24
1920x1080 Ultra High Preset AA:T AF:16x
SCHENKER XMG Neo 16 (Early 24)
Intel Core i9-14900HX, NVIDIA GeForce RTX 4090 Laptop GPU (1119215)
127 (78min, 90P1) fps
XMG Neo 16 E23
Intel Core i9-13900HX, NVIDIA GeForce RTX 4090 Laptop GPU
120 (77min) fps -6%
Lenovo Legion 9 16IRX9, RTX 4090
Intel Core i9-14900HX, NVIDIA GeForce RTX 4090 Laptop GPU (1118244)
113.6 (14min, 69P1) fps -11%
Average NVIDIA GeForce RTX 4090 Laptop GPU
  (88 - 127, n=4)
112.2 fps -12%
Average of class Gaming
  (54.1 - 127, n=14, last 2 years)
78.2 fps -38%
2560x1440 Ultra High Preset AA:T AF:16x
SCHENKER XMG Neo 16 (Early 24)
Intel Core i9-14900HX, NVIDIA GeForce RTX 4090 Laptop GPU (1119215)
84.7 (69min, 68P1) fps
XMG Neo 16 E23
Intel Core i9-13900HX, NVIDIA GeForce RTX 4090 Laptop GPU
79 (63min) fps -7%
Average NVIDIA GeForce RTX 4090 Laptop GPU
  (58.5 - 84.7, n=4)
73.6 fps -13%
Lenovo Legion 9 16IRX9, RTX 4090
Intel Core i9-14900HX, NVIDIA GeForce RTX 4090 Laptop GPU (1118244)
72.1 (2min, 56P1) fps -15%
Average of class Gaming
  (36.7 - 84.7, n=11, last 2 years)
54.6 fps -36%
2560x1440 Ultra High Preset + Quality DLSS AF:16x
SCHENKER XMG Neo 16 (Early 24)
Intel Core i9-14900HX, NVIDIA GeForce RTX 4090 Laptop GPU (1119215)
129.5 (76min, 87P1) fps
Average NVIDIA GeForce RTX 4090 Laptop GPU
  (88.3 - 129.5, n=2)
108.9 fps -16%
Average of class Gaming
  (59.2 - 129.5, n=9, last 2 years)
78.4 fps -39%
Senua's Saga Hellblade 2
1920x1080 High Preset
SCHENKER XMG Neo 16 (Early 24)
Intel Core i9-14900HX, NVIDIA GeForce RTX 4090 Laptop GPU
78.8 (51min, 56.6P0.1, 64.4P1) fps
Average NVIDIA GeForce RTX 4090 Laptop GPU
  (74 - 78.8, n=2)
76.4 fps -3%
XMG Neo 16 E23
Intel Core i9-13900HX, NVIDIA GeForce RTX 4090 Laptop GPU
74 (31.1min, 50.5P0.1, 62.7P1) fps -6%
Average of class Gaming
  (38.4 - 78.8, n=4, last 2 years)
52 fps -34%
2560x1440 High Preset
SCHENKER XMG Neo 16 (Early 24)
Intel Core i9-14900HX, NVIDIA GeForce RTX 4090 Laptop GPU
57.3 (43min, 46.4P0.1, 50.4P1) fps
Average NVIDIA GeForce RTX 4090 Laptop GPU
  (51.8 - 57.3, n=2)
54.6 fps -5%
XMG Neo 16 E23
Intel Core i9-13900HX, NVIDIA GeForce RTX 4090 Laptop GPU
51.8 (36.2min, 41.4P0.1, 46.1P1) fps -10%
Average of class Gaming
  (33.3 - 57.3, n=2, last 2 years)
45.3 fps -21%
2560x1440 High Preset + Quality DLSS
SCHENKER XMG Neo 16 (Early 24)
Intel Core i9-14900HX, NVIDIA GeForce RTX 4090 Laptop GPU
83.1 (40.3min, 63.5P0.1, 72.6P1) fps
Average NVIDIA GeForce RTX 4090 Laptop GPU
  ()
83.1 fps 0%
Average of class Gaming
  (47.8 - 83.1, n=2, last 2 years)
65.5 fps -21%
Horizon Forbidden West
1920x1080 Very High Preset AA:T
SCHENKER XMG Neo 16 (Early 24)
Intel Core i9-14900HX, NVIDIA GeForce RTX 4090 Laptop GPU
125.2 (73.2min, 82.8P0.1, 91.6P1) fps
Average NVIDIA GeForce RTX 4090 Laptop GPU
  (81 - 125.2, n=3)
100 fps -20%
Average of class Gaming
  (14.7 - 125.2, n=10, last 2 years)
66.7 fps -47%
2560x1440 Very High Preset AA:T
SCHENKER XMG Neo 16 (Early 24)
Intel Core i9-14900HX, NVIDIA GeForce RTX 4090 Laptop GPU
98 (65.7min, 67.6P0.1, 76.8P1) fps
Average NVIDIA GeForce RTX 4090 Laptop GPU
  (66 - 98, n=3)
79.7 fps -19%
Average of class Gaming
  (24.1 - 98, n=9, last 2 years)
57.1 fps -42%
Alone in the Dark
1920x1080 Cinematic Preset
SCHENKER XMG Neo 16 (Early 24)
Intel Core i9-14900HX, NVIDIA GeForce RTX 4090 Laptop GPU
189.9 (28.2min, 84.5P0.1, 113.6P1) fps
Average NVIDIA GeForce RTX 4090 Laptop GPU
  (141 - 189.9, n=2)
165.5 fps -13%
Average of class Gaming
  (13.6 - 189.9, n=6, last 2 years)
126.3 fps -33%
2560x1440 Cinematic Preset
SCHENKER XMG Neo 16 (Early 24)
Intel Core i9-14900HX, NVIDIA GeForce RTX 4090 Laptop GPU
133.6 (25.7min, 66.5P0.1, 87.2P1) fps
Average NVIDIA GeForce RTX 4090 Laptop GPU
  (99 - 133.6, n=2)
116.3 fps -13%
Average of class Gaming
  (64.7 - 133.6, n=4, last 2 years)
91.6 fps -31%
Alan Wake 2
1920x1080 High Preset
SCHENKER XMG Neo 16 (Early 24)
Intel Core i9-14900HX, NVIDIA GeForce RTX 4090 Laptop GPU
123.3 (50.5min, 68.4P0.1, 84.1P1) fps
Average NVIDIA GeForce RTX 4090 Laptop GPU
  (108.6 - 124.7, n=6)
118.1 fps -4%
Razer Blade 16 2024, RTX 4090
Intel Core i9-14900HX, NVIDIA GeForce RTX 4090 Laptop GPU
108.6 (26.3P0.1, 67P1) fps -12%
Average of class Gaming
  (17.1 - 123.3, n=18, last 2 years)
70.8 fps -43%
2560x1440 High Preset
SCHENKER XMG Neo 16 (Early 24)
Intel Core i9-14900HX, NVIDIA GeForce RTX 4090 Laptop GPU
87.1 (51.7min, 55.3P0.1, 66.2P1) fps
Average NVIDIA GeForce RTX 4090 Laptop GPU
  (78.4 - 87.1, n=6)
82.9 fps -5%
Razer Blade 16 2024, RTX 4090
Intel Core i9-14900HX, NVIDIA GeForce RTX 4090 Laptop GPU
78.4 (17P0.1, 52.8P1) fps -10%
Average of class Gaming
  (22.5 - 87.1, n=13, last 2 years)
62 fps -29%
1920x1080 High Preset + High Ray Tracing
Average NVIDIA GeForce RTX 4090 Laptop GPU
  (60.3 - 70.3, n=2)
65.3 fps +8%
SCHENKER XMG Neo 16 (Early 24)
Intel Core i9-14900HX, NVIDIA GeForce RTX 4090 Laptop GPU
60.3 (38.8min, 40.2P0.1, 46.9P1) fps
Average of class Gaming
  (42.9 - 60.3, n=2, last 2 years)
51.6 fps -14%

Vi använde Witcher 3 för att kontrollera stabiliteten i bildfrekvensen: Spelet (maximala inställningar, FHD) kördes i cirka 1 timme, spelkaraktären flyttades inte och vi observerade inga dippar i bildfrekvensen.

Witcher 3 FPS diagram

0153045607590105120135150165180195210Tooltip
SCHENKER XMG Neo 16 (Early 24) i9-14900HX, NVIDIA GeForce RTX 4090 Laptop GPU: Ø204 (195-211)
Razer Blade 16 2024, RTX 4090 i9-14900HX, NVIDIA GeForce RTX 4090 Laptop GPU: Ø192.6 (177-211)
Medion Erazer Beast X40 2024 i9-14900HX, NVIDIA GeForce RTX 4090 Laptop GPU: Ø190.8 (167-207)
SCHENKER XMG Neo 16 E23 i9-13900HX, NVIDIA GeForce RTX 4090 Laptop GPU: Ø205 (192-219)
SCHENKER XMG Neo 16 (Early 24) i9-14900HX, NVIDIA GeForce RTX 4090 Laptop GPU; Overboost, Oasis: Ø206 (193-218)
Lenovo Legion Pro 7 RTX4090 i9-13900HX, NVIDIA GeForce RTX 4090 Laptop GPU: Ø196 (185-206)
Alienware x16 R2 P120F Ultra 9 185H, NVIDIA GeForce RTX 4080 Laptop GPU: Ø154.7 (132-167)
Asus ROG Strix Scar 16 G634JZR i9-14900HX, NVIDIA GeForce RTX 4080 Laptop GPU: Ø178.8 (173-185)
Lenovo Legion 9 16IRX9, RTX 4090 i9-14900HX, NVIDIA GeForce RTX 4090 Laptop GPU: Ø195.6 (67-209)
Witcher 3 (Överdriven)
Witcher 3 (Overboost, Oasis)
lågmed.högultraQHD
GTA V (2015) 187.6 187.4 185.7 159.3 156
The Witcher 3 (2015) 643 562.3 412.7 214 169.4
Dota 2 Reborn (2015) 248 221 210 194.6
Final Fantasy XV Benchmark (2018) 233 225 196.9 162.5
X-Plane 11.11 (2018) 208 184.2 144.5
Far Cry 5 (2018) 194 184 172 156
Strange Brigade (2018) 579 444 397 403 305
Cyberpunk 2077 2.1 Phantom Liberty (2023) 168.5 157.8 138 131.5 93.8
Alan Wake 2 (2023) 128.5 128 123.3 87.1
Alone in the Dark (2024) 219 217 216 189.9 133.6
Horizon Forbidden West (2024) 165.4 160.5 126.2 125.2 98
Senua's Saga Hellblade 2 (2024) 122.3 103.3 78.8 57.3
F1 24 (2024) 346 369 302 127 84.7

Utsläpp - Den bärbara datorn XMG har klassspecifika utsläpp

Bullerutsläpp

Ljudnivåer på upp till 56 dB(A) är möjliga, men vid spel är denna siffra något lägre (Overboost). En betydligt lägre ljudnivå kan uppnås med "Balanced" - på bekostnad av prestandan. Gaming skulle vara möjligt. Vid daglig användning (kontor, internet) och tomgångskörning arbetar datorn i allmänhet tyst - oavsett vilket aktivt prestandaläge som används.

Användningen av den externa vattenkylningen orsakar en del buller: Pumpen arbetar mycket tyst och fläktarna är mycket mer märkbara. Subjektivt sett tycker vi att ljudnivån med den externa vattenkylningen är behagligare, men inte nödvändigtvis tystare.

Då och då hörs ett elektroniskt knastrande från den bärbara datorns insida, till exempel under Diskspd-testet. Förmodligen beror detta på SSD-enheten.

Ljudnivå

Låg belastning
28 / 29 / 31 dB(A)
Hög belastning
51 / 56 dB(A)
  red to green bar
 
 
30 dB
tyst
40 dB(A)
hörbar
50 dB(A)
högt ljud
 
min: dark, med: mid, max: light   Earthworks M23R, Arta (15 cm avstånd)   environment noise: 26 dB(A)
dB(A) 0102030405060708090Deep BassMiddle BassHigh BassLower RangeMidsHigher MidsLower HighsMid HighsUpper HighsSuper Highs2035.535.635.738.135.52532.333.531.232.833.93144.344.642.844.1424029.928.126.127.831.95039.222.923.320.533.26336.22827.226.435.78033.320.419.817.435.31004627.323.721.531.412530.921.120.218.429.216029.620.121.219.230.620030.623.722.722.232.725031.621.922.419.133.531531.119.21917.534.540033.519.417.91637.350035.819.218.315.538.363036.919.716.913.439.980037.917.816.11242.1100038.818.715.713.242.4125041.519.716.312.845.3160041.719.315.91445.8200041.518.617.513.345.9250041.517.515.312.845.5315041.316.515.513.146.1400039.217.616.813.243.8500037.415.214.61341.4630036.814.116.713.543.2800032.114.615.813.938.51000029.814.915.914.436.61250027.515.916.11334.61600022.31515.112.529.1SPL51.43028.625.955.7N7.81.31.10.810.3median 36.8median 18.7median 16.7median 13.5median 38.5Delta4.52.11.325.3hearing rangehide median Fan NoiseSCHENKER XMG Neo 16 (Early 24)
SCHENKER XMG Neo 16 (Early 24)
NVIDIA GeForce RTX 4090 Laptop GPU, i9-14900HX, Samsung 990 Pro 1 TB
Razer Blade 16 2024, RTX 4090
NVIDIA GeForce RTX 4090 Laptop GPU, i9-14900HX, Samsung PM9A1 MZVL22T0HBLB
Medion Erazer Beast X40 2024
NVIDIA GeForce RTX 4090 Laptop GPU, i9-14900HX, Phison E18-1TB-PHISON-SSD-BICS5
Asus ROG Strix Scar 17 G733PYV-LL053X
NVIDIA GeForce RTX 4090 Laptop GPU, R9 7945HX3D, SK hynix PC801 HFS001TEJ9X101N
SCHENKER XMG Neo 16 E23
NVIDIA GeForce RTX 4090 Laptop GPU, i9-13900HX, Crucial P5 Plus 1TB CT1000P5PSSD8
Noise
14%
3%
3%
-12%
off / environment *
26
23
12%
25
4%
23
12%
25
4%
Idle Minimum *
28
23
18%
28
-0%
23
18%
31
-11%
Idle Average *
29
23
21%
29
-0%
27.7
4%
33
-14%
Idle Maximum *
31
27.66
11%
32
-3%
34.7
-12%
42
-35%
Load Average *
51
43.76
14%
48
6%
53.4
-5%
58
-14%
Witcher 3 ultra *
54
46.81
13%
50
7%
53.4
1%
57
-6%
Load Maximum *
56
50.37
10%
52
7%
53.4
5%
59
-5%

* ... smaller is better

Temperatur

Den bärbara datorn värms upp märkbart under belastning (stresstest och Witcher 3 test): På vissa ställen når temperaturen ibland över 50 °C. På handlovsstödet ligger temperaturerna dock kvar på en måttlig nivå. Vid vardaglig användning (kontor, internet) ligger siffrorna i den gröna zonen.

Testet på Witcher 3 belyser effekten av vattenkylningen som finns som tillval: GPU-temperaturen skiljer sig med cirka 17 °C (80,7 °C jämfört med 63,4 °C).

 45 °C47 °C46 °C 
 44 °C45 °C44 °C 
 29 °C31 °C30 °C 
Max: 47 °C
Medel: 40.1 °C
54 °C55 °C56 °C
50 °C50 °C44 °C
29 °C31 °C34 °C
Max: 56 °C
Medel: 44.8 °C
Strömförsörjning (max.)  57 °C | Rumstemperatur 21 °C | Fluke t3000FC (calibrated), Voltcraft IR-900
(-) The average temperature for the upper side under maximal load is 40.1 °C / 104 F, compared to the average of 33.9 °C / 93 F for the devices in the class Gaming.
(-) The maximum temperature on the upper side is 47 °C / 117 F, compared to the average of 40.5 °C / 105 F, ranging from 21.2 to 68.8 °C for the class Gaming.
(-) The bottom heats up to a maximum of 56 °C / 133 F, compared to the average of 43.2 °C / 110 F
(+) In idle usage, the average temperature for the upper side is 26 °C / 79 F, compared to the device average of 33.9 °C / 93 F.
(-) Playing The Witcher 3, the average temperature for the upper side is 42.4 °C / 108 F, compared to the device average of 33.9 °C / 93 F.
(+) The palmrests and touchpad are reaching skin temperature as a maximum (35 °C / 95 F) and are therefore not hot.
(-) The average temperature of the palmrest area of similar devices was 28.9 °C / 84 F (-6.1 °C / -11 F).
SCHENKER XMG Neo 16 (Early 24)
Intel Core i9-14900HX, NVIDIA GeForce RTX 4090 Laptop GPU
Razer Blade 16 2024, RTX 4090
Intel Core i9-14900HX, NVIDIA GeForce RTX 4090 Laptop GPU
Medion Erazer Beast X40 2024
Intel Core i9-14900HX, NVIDIA GeForce RTX 4090 Laptop GPU
Asus ROG Strix Scar 17 G733PYV-LL053X
AMD Ryzen 9 7945HX3D, NVIDIA GeForce RTX 4090 Laptop GPU
SCHENKER XMG Neo 16 E23
Intel Core i9-13900HX, NVIDIA GeForce RTX 4090 Laptop GPU
Heat
2%
-7%
8%
1%
Maximum Upper Side *
47
45
4%
47
-0%
40.1
15%
50
-6%
Maximum Bottom *
56
45
20%
54
4%
46.7
17%
51
9%
Idle Upper Side *
27
29
-7%
30
-11%
26.5
2%
28
-4%
Idle Bottom *
27
30
-11%
32
-19%
27.7
-3%
26
4%

* ... smaller is better

Stresstest

Det extrema scenariot i stresstestet (Prime95 och Furmark i kontinuerlig drift) kontrollerar systemets stabilitet under full belastning. Processorhastigheten sjunker inom den första minuten av testet från ca 4,3 till 4,5 GHz (P) och 3,5 till 3,6 GHz (E) till 2,5 GHz (P) och 2,3 GHz (E). Samtidigt ökar GPU-hastigheten från en startpunkt på 1.600 MHz till mer än 2.000 MHz.

Furmark &amp; Prime95
Witcher 3
Witcher 3
Witcher 3
Witcher 3
Witcher 3
Witcher 3

Högtalare

Stereohögtalarna saknar bas. Bortsett från det ger de oftast ett hyfsat ljud. Bättre kvalitet kan uppnås genom att använda antingen hörlurar eller externa högtalare.

dB(A) 0102030405060708090Deep BassMiddle BassHigh BassLower RangeMidsHigher MidsLower HighsMid HighsUpper HighsSuper Highs2038.136.52532.836.83144.146.54027.830.55020.533.66326.4328017.438.710021.549.812518.447.616019.255.420022.260.825019.163.231517.561.74001664.550015.570.963013.475.28001275.1100013.275.6125012.875.916001475.6200013.373.2250012.873.1315013.174.7400013.273.250001377.8630013.574.9800013.972.71000014.465.3125001360.61600012.555.5SPL25.986.4N0.871.1median 13.5median 72.7Delta27.13032.83030.931.430.935.742.935.723.728.123.726.219.726.231.216.431.245.113.845.145.919.845.951.414.551.45913.95964.117.864.168.614.368.667.19.667.167.68.567.672.97.572.977.47.477.4717.77164.88.164.865.88.265.867.58.867.568.89.868.868.710.568.77010.67066.410.966.467.311.267.36411.56464.711.664.767126763.211.863.25510.75581.222.581.254.70.454.7median 67median 10.7median 673.62.53.6hearing rangehide median Pink NoiseSCHENKER XMG Neo 16 (Early 24)Razer Blade 16 2024, RTX 4090
Frequency diagram (checkboxes can be checked and unchecked to compare devices)
SCHENKER XMG Neo 16 (Early 24) audio analysis

(+) | speakers can play relatively loud (86 dB)
Bass 100 - 315 Hz
(-) | nearly no bass - on average 16.3% lower than median
(±) | linearity of bass is average (8.6% delta to prev. frequency)
Mids 400 - 2000 Hz
(+) | balanced mids - only 3% away from median
(+) | mids are linear (3.6% delta to prev. frequency)
Highs 2 - 16 kHz
(+) | balanced highs - only 2.5% away from median
(+) | highs are linear (4.9% delta to prev. frequency)
Overall 100 - 16.000 Hz
(+) | overall sound is linear (12.4% difference to median)
Compared to same class
» 14% of all tested devices in this class were better, 3% similar, 83% worse
» The best had a delta of 6%, average was 18%, worst was 132%
Compared to all devices tested
» 9% of all tested devices were better, 2% similar, 89% worse
» The best had a delta of 4%, average was 25%, worst was 134%

Razer Blade 16 2024, RTX 4090 audio analysis

(±) | speaker loudness is average but good (81.16 dB)
Bass 100 - 315 Hz
(±) | reduced bass - on average 8.2% lower than median
(±) | linearity of bass is average (7.4% delta to prev. frequency)
Mids 400 - 2000 Hz
(+) | balanced mids - only 3.3% away from median
(+) | mids are linear (5.9% delta to prev. frequency)
Highs 2 - 16 kHz
(+) | balanced highs - only 1.6% away from median
(+) | highs are linear (3.1% delta to prev. frequency)
Overall 100 - 16.000 Hz
(+) | overall sound is linear (9.2% difference to median)
Compared to same class
» 3% of all tested devices in this class were better, 1% similar, 96% worse
» The best had a delta of 6%, average was 18%, worst was 132%
Compared to all devices tested
» 3% of all tested devices were better, 1% similar, 97% worse
» The best had a delta of 4%, average was 25%, worst was 134%

Energihantering - Schenker Neo har en hyfsad batteritid

Strömförbrukning

Strömförbrukningen ligger på en normal nivå för den installerade hårdvara vi har här. Witcher 3 -testet och stresstestet kördes med något minskande strömförbrukning. Nätaggregatet (330 watt) är av lämplig storlek.

Strömförbrukning
Av/Standbydarklight 0.1 /  Watt
Låg belastningdarkmidlight 6 / 16 / 28 Watt
Hög belastning midlight 130 / 361 Watt
 color bar
Förklaring: min: dark, med: mid, max: light        Metrahit Energy
SCHENKER XMG Neo 16 (Early 24)
i9-14900HX, NVIDIA GeForce RTX 4090 Laptop GPU, Samsung 990 Pro 1 TB, IPS, 2560x1600, 16"
Razer Blade 16 2024, RTX 4090
i9-14900HX, NVIDIA GeForce RTX 4090 Laptop GPU, Samsung PM9A1 MZVL22T0HBLB, OLED, 2560x1600, 16"
Medion Erazer Beast X40 2024
i9-14900HX, NVIDIA GeForce RTX 4090 Laptop GPU, Phison E18-1TB-PHISON-SSD-BICS5, IPS, 2560x1600, 17"
Asus ROG Strix Scar 17 G733PYV-LL053X
R9 7945HX3D, NVIDIA GeForce RTX 4090 Laptop GPU, SK hynix PC801 HFS001TEJ9X101N, IPS, 2560x1440, 17.3"
SCHENKER XMG Neo 16 E23
i9-13900HX, NVIDIA GeForce RTX 4090 Laptop GPU, Crucial P5 Plus 1TB CT1000P5PSSD8, IPS, 2560x1600, 16"
Average of class Gaming
 
Power Consumption
-22%
-1%
-23%
-9%
-18%
Idle Minimum *
6
16.9
-182%
7
-17%
15.4
-157%
8
-33%
Idle Average *
16
17.8
-11%
15
6%
21.6
-35%
18
-13%
Idle Maximum *
28
19.6
30%
33
-18%
22.2
21%
28
-0%
Load Average *
130
128
2%
134
-3%
116.7
10%
133
-2%
Witcher 3 ultra *
302
243
20%
280
7%
262
13%
294
3%
Load Maximum *
361
328
9%
294
19%
327.1
9%
399
-11%

* ... smaller is better

Power consumption Witcher 3 / stress test

020406080100120140160180200220240260280300320340Tooltip
SCHENKER XMG Neo 16 (Early 24); Witcher 3 ultra: Ø302 (250-321)
SCHENKER XMG Neo 16 (Early 24); 1280x720 Prime95 28.10 and Furmark 1.25: Ø298 (280-349)
SCHENKER XMG Neo 16 (Early 24); Idle 150cd/m2: Ø16.5 (6.12-27.9)

Power consumption with an external monitor

020406080100120140160180200220240260280300Tooltip
SCHENKER XMG Neo 16 (Early 24); Prime95 V2810 Stress (external Monitor): Ø194.9 (175.3-205)
SCHENKER XMG Neo 16 (Early 24); Cinebench R23 Multi (external Monitor): Ø288 (258-296)
SCHENKER XMG Neo 16 (Early 24); 1280x720 FurMark 1.19 GPU Stress Test (external Monitor): Ø232 (216-240)
SCHENKER XMG Neo 16 (Early 24); 1920x1080 The Witcher 3 ultra (external Monitor): Ø297 (280-309)
SCHENKER XMG Neo 16 (Early 24); Idle 1min (external Monitor): Ø23.4 (21.8-29.1)

Batteriets livslängd

I Wi-Fi- och videotesterna (laddning av webbplatser med hjälp av ett skript samt den korta videon Big Buck Bunny (H.264-kodning, FHD) i en loop) uppnådde 16-tumsmaskinen körtider på 5 timmar och 50 minuter och 6 timmar och 58 minuter. Allt som allt är detta anständiga siffror.

Batteriet har en kapacitet på 99,8 Wh.
Batteritid
Låg belastning (utan WLAN, min. ljusstyrka)
10tim 00min
WiFi Websurfing (Edge 125)
5tim 50min
Big Buck Bunny H.264 1080p
6tim 58min
Hög belastning (maximal ljusstyrka)
2tim 02min
SCHENKER XMG Neo 16 (Early 24)
i9-14900HX, NVIDIA GeForce RTX 4090 Laptop GPU, 99.8 Wh
Razer Blade 16 2024, RTX 4090
i9-14900HX, NVIDIA GeForce RTX 4090 Laptop GPU, 95.2 Wh
Medion Erazer Beast X40 2024
i9-14900HX, NVIDIA GeForce RTX 4090 Laptop GPU, 99.8 Wh
Asus ROG Strix Scar 17 G733PYV-LL053X
R9 7945HX3D, NVIDIA GeForce RTX 4090 Laptop GPU, 90 Wh
SCHENKER XMG Neo 16 E23
i9-13900HX, NVIDIA GeForce RTX 4090 Laptop GPU, 99 Wh
Average of class Gaming
 
Battery Runtime
-11%
7%
-34%
-2%
-8%
Reader / Idle
600
H.264
418
456
9%
302
-28%
349
-17%
WiFi v1.3
350
329
-6%
374
7%
287
-18%
399
14%
Load
122
79
-35%
55
-55%
Witcher 3 ultra
84

För

+ ljusstark, 16:10, QHD+-skärm (240 Hz, G-Sync)
+ hög systemprestanda
+ två SSD-platser (PCIe 4, M.2 2280)
+ RAM-minne utbytbart/utökningsbart
+ RGB-belysning för individuella tangenter
+ Thunderbolt 4
+ Power Delivery
+ stabilt metallhölje
+ Avancerad Optimus
+ termisk pasta för flytande metall
+ vattenkylning som tillval

Emot

- färgrymdstäckningen kunde vara större
- höga utsläpp under full belastning
- enstaka elektroniska sprakningar i interiören

Bedömning - En avancerad eldboll

XMG Neo 16 (Early 24) levererades av Schenker.

Neo 16 håller vad den lovar: Hårdvara (Core i9, RTX 4090) från den övre delen av prestandaskalan möjliggör videoredigering, rendering, streaming och, naturligtvis, QHD-spel. De förväntade höga utsläppen kan reduceras till en mer måttlig nivå genom att välja lämpligt prestandaläge.

Med XMG Neo 16 (Early 24) levererar Schenker massor av kraft i en kompakt formfaktor.

Den som söker en kompromisslös lösning måste välja den externa vattenkylning som finns som tillval (230 USD): Detta bidrar till en liten prestandaökning och lägre utsläpp. Med detta sagt är den bärbara datorn sedan bunden till en stationär plats.

Den matta 16-tums 16:10-skärmen (2 560 x 1 600 pixlar, sRGB, IPS, 240 Hz) gjorde i stort sett ett gott intryck med sin höga ljusstyrka som en särskilt tilltalande punkt. Det finns utrymme för förbättringar när det gäller kontrasten och färgrymdens täckning. Två SSD-kortplatser (PCIe 4) inklusive RAID 0/1-stöd ger massor av lagringsutrymme och korta laddningstider.

En enda batteriladdning (99,8 Wh) räcker för körtider i verkliga livet på cirka 6 till 7 timmar - anständiga siffror. Positivt: Batteriet kan laddas via en USB-C-laddare (100 watt, 20 V, 5 A) - TB4-porten stöder Power Delivery, vilket innebär att nätaggregatet (330 watt) teoretiskt sett kan stanna hemma.

Ett alternativ skulle kunna vara Razer Blade 16 (2024). Denna dator erbjuder något mindre datorkraft, men till skillnad från Neo erbjuder den högre kontrast och en mer levande OLED-skärm är ombord.

Pris och tillgänglighet

XMG Neo 16 (Early 24) kan konfigureras individuellt och köpas i Schenkers onlinebutik (tyska) och priserna motsvarar växelkursen mellan dollar och euro vid testtillfället. Vår testmodell kostar cirka 4 000 dollar. Instegsmodellerna (med RTX 4060) börjar på cirka 2 000 USD. Schenker har angett att de kommer att vara tillgängliga i slutet av juni (RTX 4090) och i mitten av juli (RTX 4060/70/80). Den valfria vattenkylningen kommer att få dig att betala cirka $ 230.

SCHENKER XMG Neo 16 (Early 24) - 06/19/2024 v8
Sascha Mölck

Design
85 / 98 → 87%
Tangentbord
85%
Mus
86%
Anslutningar
70 / 80 → 87%
Vikt
60 / 10-68 → 86%
Batteri
68 / 95 → 71%
Skärm
84%
Spelprestanda
92%
Programprestanda
93%
AI Performance
100%
Temperatur
81 / 95 → 86%
Ljudnivå
62 / 90 → 69%
Audio
84%
Camera
41 / 75 → 55%
Medel
63%
86%
Gaming - Vägt medel
CO2 Emissions
No Data
Materials
0%
Packaging
25%
Power Use
80.6%
Repairability
65%
Software Updates
22.3%
Recycle Logo Total Sustainability Score: 32.2%

Transparency

The selection of devices to be reviewed is made by our editorial team. The test sample was provided to the author as a loan by the manufacturer or retailer for the purpose of this review. The lender had no influence on this review, nor did the manufacturer receive a copy of this review before publication. There was no obligation to publish this review. We never accept compensation or payment in return for our reviews. As an independent media company, Notebookcheck is not subjected to the authority of manufacturers, retailers or publishers.

This is how Notebookcheck is testing

Every year, Notebookcheck independently reviews hundreds of laptops and smartphones using standardized procedures to ensure that all results are comparable. We have continuously developed our test methods for around 20 years and set industry standards in the process. In our test labs, high-quality measuring equipment is utilized by experienced technicians and editors. These tests involve a multi-stage validation process. Our complex rating system is based on hundreds of well-founded measurements and benchmarks, which maintains objectivity. Further information on our test methods can be found here.

Price comparison

Please share our article, every link counts!
Mail Logo
> Bärbara datorer, laptops - tester och nyheter > Tester > XMG Neo 16 (Early 24) recension: Full RTX 4090-kraft i en kompakt bärbar speldator
Sascha Mölck, 2024-06-25 (Update: 2024-06-25)