Notebookcheck Logo
Geekom GT1 Mega in review

Geekom GT1 Mega recension: Geekom's första AI-minidator övertygar inte i alla aspekter

Vad är egentligen Mega i Geekom GT1 Mega?

Geekom GT1 Mega utlovar kraftfull prestanda i en mini-PC-formfaktor och riktar sig till användare som behöver mycket prestanda i de minsta utrymmena. Utrustad med Intel Core Ultra 9 185H har Geekom för första gången installerat en Meteor Lake-processor med en dedikerad NPU. I det här testet tar vi reda på om Geekom GT1 Mega är övertygande i flera aspekter, allt från funktioner till prestanda och kylning.
Sebastian Bade, 👁 Sebastian Bade (översatt av DeepL / Ninh Duy) Published 🇺🇸 🇩🇪 ...
Mini PC Desktop Intel Meteor Lake Business

Omdöme: Inte tillräckligt med premium för priset

Geekom GT1 Mega presenterar sig som en kraftfull mini-dator som imponerar på många områden. Med kraftfull hårdvara, bestående av Intel Core Ultra 9 185H, som också har en mycket kraftfull iGPU, är minidatorn perfekt lämpad för kontorsapplikationer samt multimedia och lätta kreativa uppgifter.

En särskilt positiv egenskap är de många olika anslutningarna, vilket är ovanligt för en kompakt enhet av denna storlek. De två USB4-gränssnitten är bland de mest användbara portarna när det gäller framtidssäkring. Det utbyggbara minnet och det felfria utförandet gör också GT1 Mega till en attraktiv lösning för arbetsstationer som kräver lite utrymme.

Vi måste dock kritisera ljudnivån under genomsnittlig och hög belastning. En mini-PC, som oundvikligen placeras på skrivbordet i omedelbar närhet, borde helt enkelt inte nå 50 dB(A).

Varför Geekom inte lade mer energi på detta för att bättre ställa in produkten när det gäller fläktkurvor är ett mysterium för oss. BIOS-alternativen är också mycket rudimentära. Lyckligtvis kan ett tyst läge aktiveras, men det är mer en lösning än en riktig lösning med förlust av prestanda. Detta kan inte vara en idealisk lösning, eftersom Geekom begär långt över 1 000 euro för GT1 Mega enligt RRP.

Bortsett från höga ljudnivåer är Geekom GT1 Mega en kraftfull, flexibel och kompakt lösning som är idealisk för kontor och hemmakontor, för alla som vill ha en pålitlig allrounddator i ett litet utrymme, och även som en kapabel multimedialösning.

För

+ fantastisk design
+ perfekt utförande
+ mycket stabil konstruktion
+ 2x USB4
+ Dubbelt 2,5G LAN
+ snabb SD-kortläsare
+ Wi-Fi 7
+ bra vardagsprestanda hos Intel Core Ultra 9 185H
+ kraftfull iGPU
+ generös 2 TB SSD
+ 32 GB RAM-MINNE
+ låg energiförbrukning
+ stabil SSD-prestanda
+ 36 månaders garanti

Emot

- tydligt hörbar vid partiell och full belastning
- begränsade BIOS-alternativ
- ingen manuellt anpassningsbar fläktkontroll
- inget OCuLink-gränssnitt
- mycket dyrt

Pris och tillgänglighet

Geekom GT1 Mega i vår recensionskonfiguration kostar 1 149 € hos Geekom DE och kan för närvarande köpas för 989 $ hos Geekom US. För bara 899 €, eller 849 $, är GT1 Mega med Intel Core Ultra 7 155H ett mer kostnadseffektivt alternativ.

I USA kan köpare också beställa Geekom GT1 Mega via Amazon.

Amazon Logo
$989.00
GEEKOM GT1 Mega AI Mini PC,14th Gen Intel Core Ultra U9-185H Processor (16C/22T,up to 5.1 GHz),32GB DDR5 2TB PCIe Gen4 SSD,Mini Desktop Computers Windows 11 Pro,WiFi 7/BT 5.4/Dual 2.5G LAN/USB4.0/8K
  • $799.00
    GEEKOM GT1 Mega AI Mini PC,14th Gen Intel Core Ultra U7-155H (16C/22T,up to 4.8 GHz),32GB DDR5 1TB PCIe Gen4 SSD,NUC14 Pro Mini Desktop Computers Windows 11 Pro,WiFi 7/BT 5.4/Dual 2.5G LAN/USB4.0/8K
  • $979.00
    GEEKOM IT1 Mega AI Mini PC,14th Gen Intel Core Ultra U9-185H (Up to 5.1Ghz) Mini Computers 32GB DDR5 RAM 2TB PCle 4.0 SSD Mini Desktop Intel ARC Gpu/Intel AI Boost/Dual NIC LAN/WiFi 7/BT5.4/8K/USB4

Price comparison

Jämförelse av möjliga alternativ

Image
Model / Review
Geizhals
Weight
Height
Display
1.
78.8%
Geekom GT1 Mega
Geekom GT1 Mega
Intel Core Ultra 9 185H ⎘
Intel Arc 8-Core iGPU ⎘
32 GB Minne, 2048 GB SSD
Listenpreis 1149 EUR
Geizhals Suche
693 g46.9 mmx
2.
78.4%
Geekom AX8 Pro
Geekom AX8 Pro
AMD Ryzen 9 8945H ⎘
AMD Radeon 780M ⎘
32 GB Minne, 2048 GB SSD
Listenpreis 999 EUR548 g37 mmx
3.
74.7%
Asus NUC 14 Pro
Asus NUC 14 Pro
Intel Core Ultra 5 125H ⎘
Intel Arc 7-Core iGPU ⎘
, 2048 GB SSD
Bestpreis 516.78€ playox.de
2. 516.8€ office-partner.de
3. 521.12€ playox (AT)
525 g37 mmx
4.
74.5%
Minisforum UH125 Pro
Intel Core Ultra 5 125H ⎘
Intel Arc 7-Core iGPU ⎘
32 GB Minne, 1024 GB SSD
Listenpreis 879 EUR
Geizhals Suche
797 g49 mmx
5.
72.1%
Geekom GT13 Pro
Geekom GT13 Pro
Intel Core i9-13900H ⎘
Intel Iris Xe Graphics G7 96EUs ⎘
32 GB Minne, 2048 GB SSD
Listenpreis 930 EUR440 g37 mmx
6.
83.4% v7 (old)
Acemagic F2A
Acemagic F2A
Intel Core Ultra 7 155H ⎘
Intel Arc 8-Core iGPU ⎘
32 GB Minne, 1024 GB SSD
Listenpreis 1199 EUR768 g57 mmx

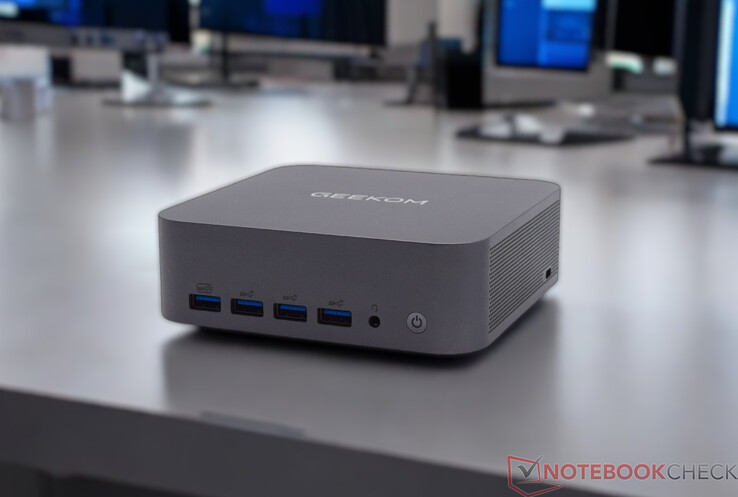
Geekom GT1 Mega är den senaste minidatorn från Geekom, som för första gången är utrustad med en Intel Meteor Lake-processor. Visuellt påminner Geekom GT1 Mega om en Geekom GT13 Pro.

Ändå har Geekom införlivat några stora designförändringar. Vid första anblicken fångar den betydligt större designen ögat. Vi ska strax undersöka om detta ger några inneboende fördelar.

I det här testet fokuserar vi på Geekom GT1 Mega i toppkonfigurationen. Den levereras med en Intel Core Ultra 9 185H med 32 GB RAM och en 2 TB SSD. När det gäller priset måste du dock gräva djupt i fickorna, för med 1 149 € eller 989 $ är mini-datorn inte precis ett fynd. Med det sagt är Geekom känt för en och annan rabattkampanj, som du kan spekulera i om du planerar att köpa den här enheten.

Om din budget ligger runt 899 euro kan du också utrusta Geekom GT1 Mega med en Intel Core Ultra 7 155H med 32 GB RAM och en 1 TB SSD. I början ser detta ut att vara en mer förnuftig konfiguration eftersom det bara finns minimala tekniska skillnader mellan de två processorerna.

Geekom GT1 Mega konkurrerar också med etablerade minidatorer från andra tillverkare som Asus, Minisforum och Acemagic. GT1 Mega möter dock även konkurrens från de egna leden eftersom Geekom själva har flera andra högpresterande minidatorer i sin nuvarande portfölj.

Specifikationer

Geekom GT1 Mega
Processor
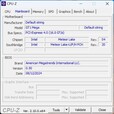
Intel Core Ultra 9 185H 16 x 3.8 - 5.1 GHz, 70 W PL2 / Short Burst, 45 W PL1 / Sustained, Meteor Lake-H
Grafikkort
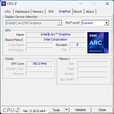
Intel Arc 8-Core iGPU, Kärna: 2350 MHz, 32.0.101.6079
Minne
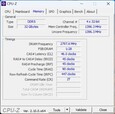
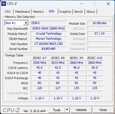
32 GB 
, DDR5-5600, max 64 GB
Moderkort
Intel Meteor Lake-U/P/H PCH
Hårddisk
Crucial P3 Plus CT2000P3PSSD8 , 2048 GB 
, 1760 GB ledigt
Ljudkort
Intel Meteor Lake-U/P/H PCH - cAVS (Audio, Voice, Speech)
Anslutningar
1 USB 2.0, 5 USB 3.1 Gen2, 2 USB 4.0 40 Gbps, USB-C Power Delivery (PD), 2 HDMI, 2 DisplayPort, 1 Kensingtonlås, 1 Dockningsstation, Ljudanslutningar: 3.5mm combo, Kortläsare: Full-Size-SD-Card (UHS II), Intel Ethernet Controller I226-V (10/2500MBit/s)
Nätverk
Intel Ethernet Controller I226-V (10/2500MBit/s), Intel Wi-Fi 7 BE200 320MHz (a/b/g/n = Wi-Fi 4/ac = Wi-Fi 5/ax = Wi-Fi 6/ Wi-Fi 6E 6 GHz be = Wi-Fi 7), Bluetooth 5.4
Storlek
höjd x bredd x djup (i mm) 46.9 x 135 x 132
Operativsystem
Microsoft Windows 11 Pro
Övrigt
120-Watt-Power-Adapter, 36 Månader Garanti
Vikt
693 g, Strömförsörjning: 256 g
Pris
1149 EUR
Note: The manufacturer may use components from different suppliers including display panels, drives or memory sticks with similar specifications.


Chassi: Perfekt bearbetat aluminiumhölje

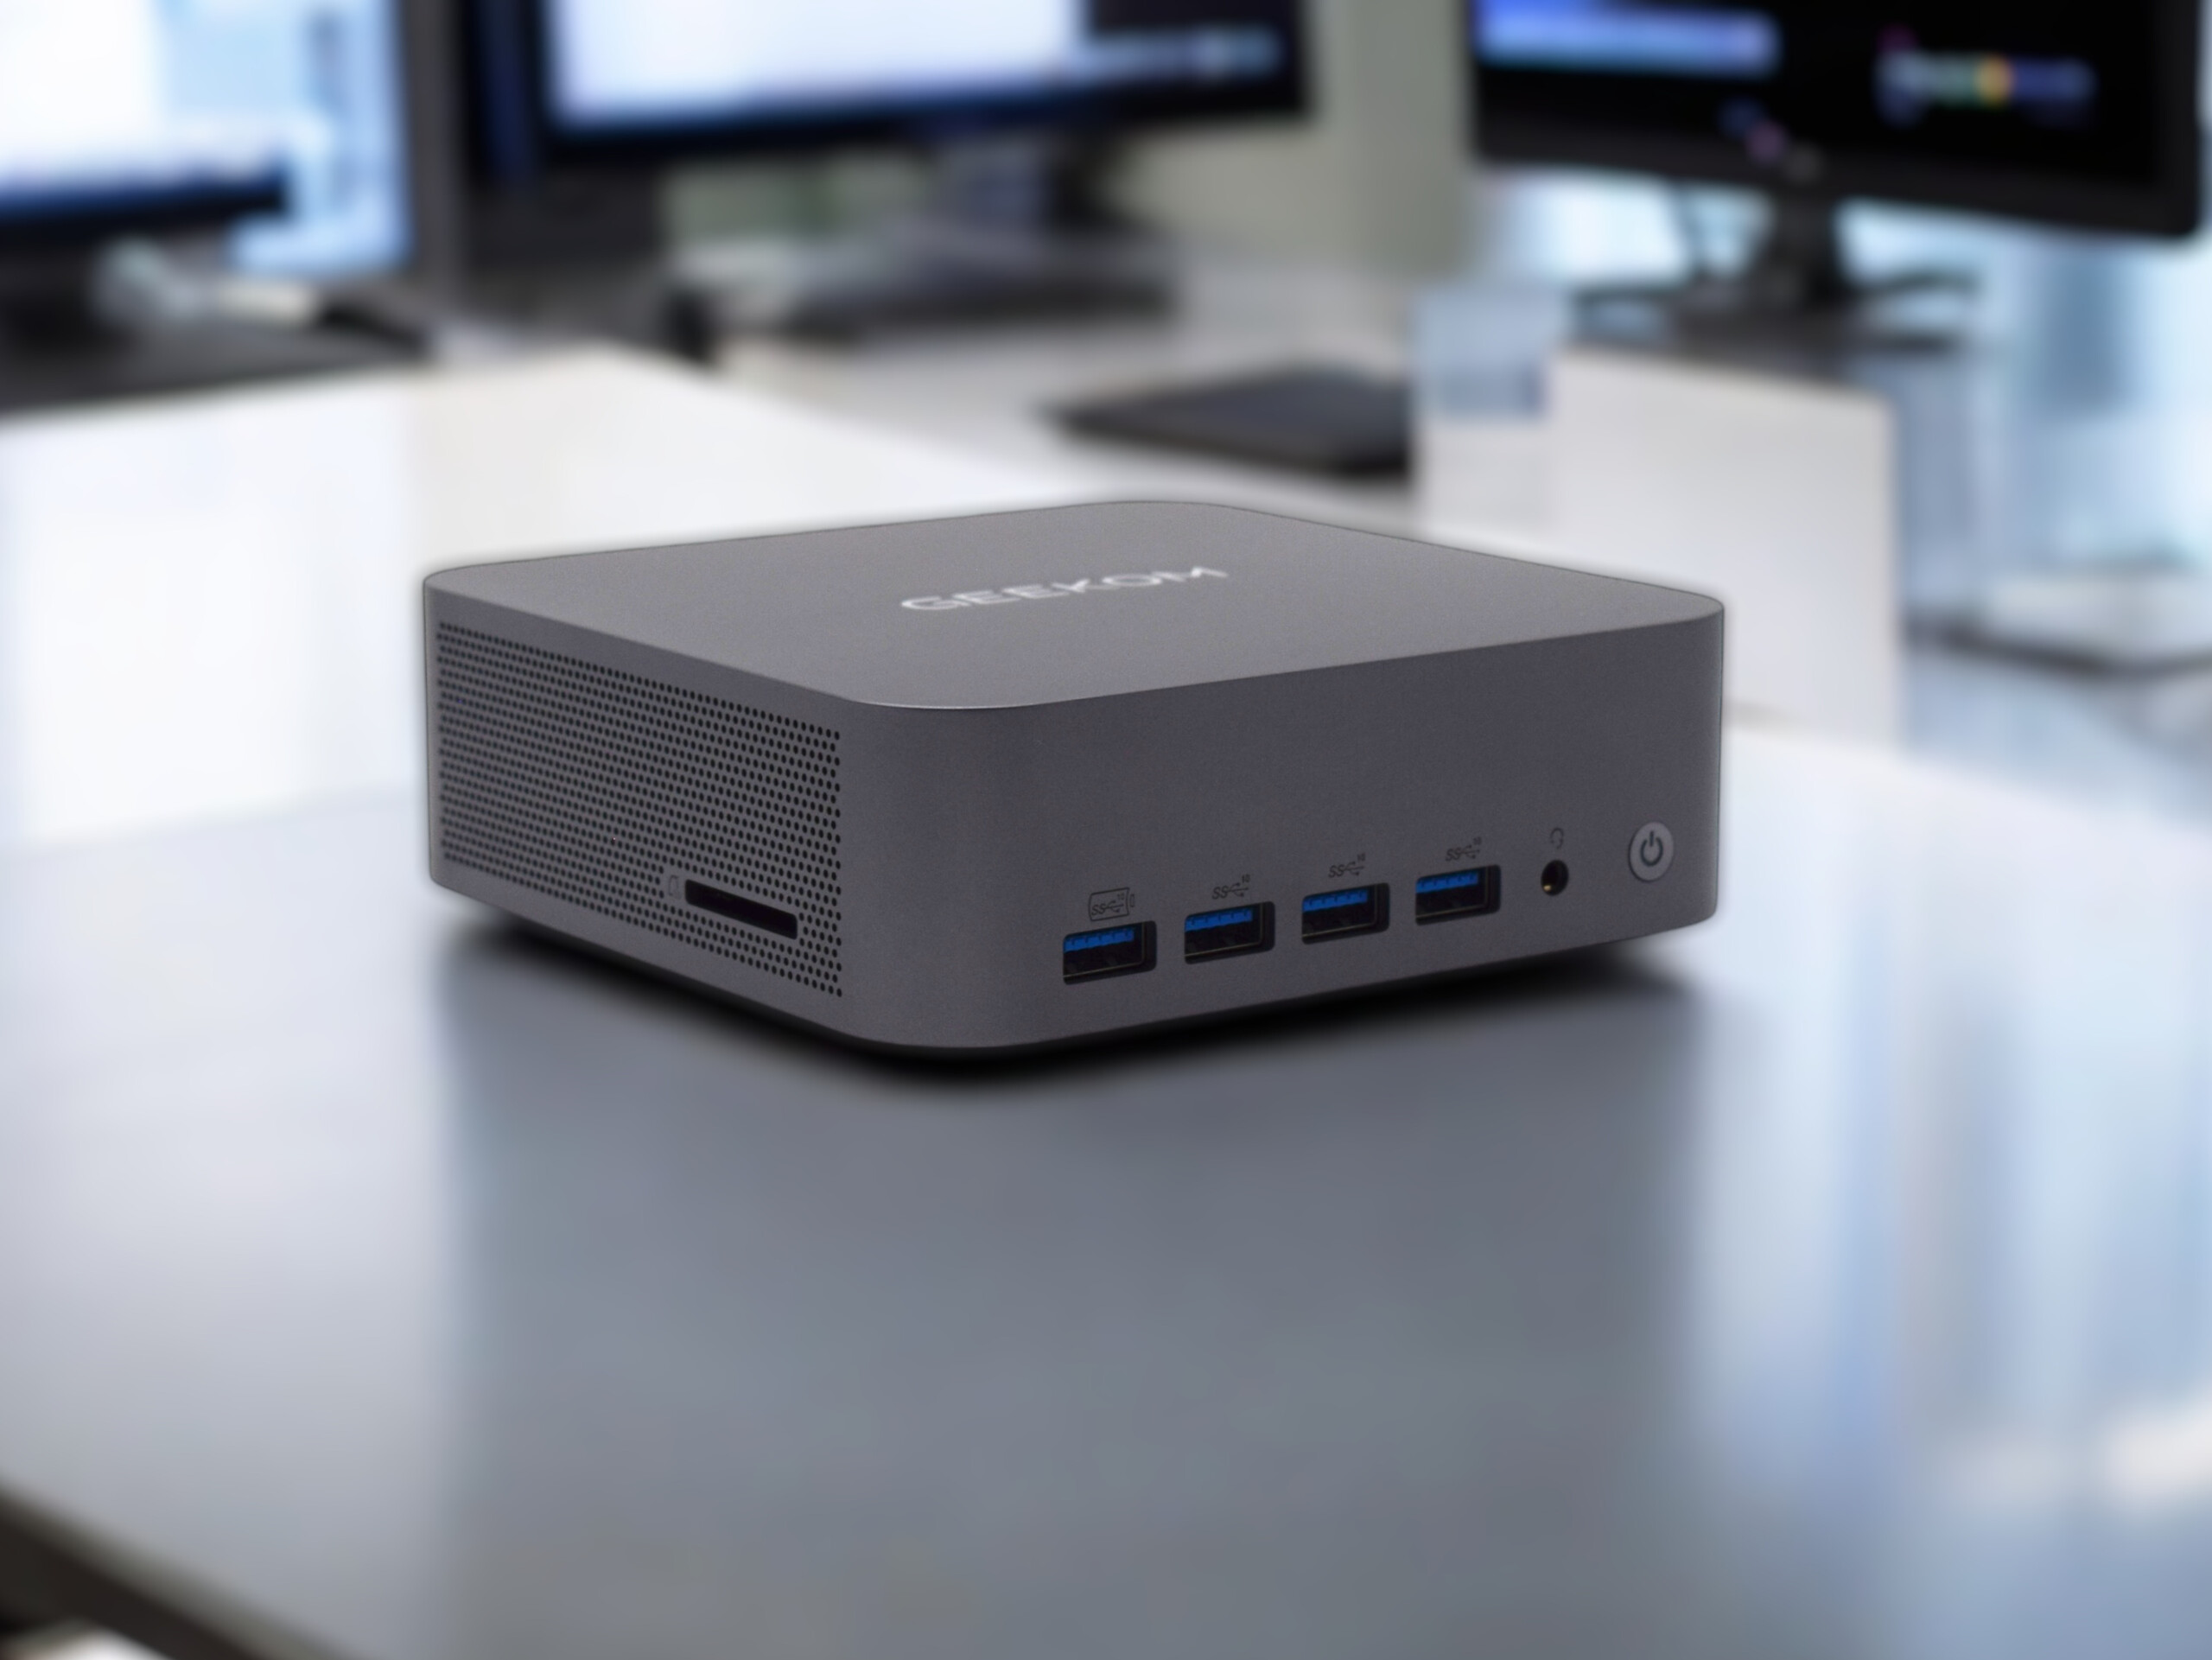
Geekom GT1 Mega är betydligt större än tidigare Geekom mini-datorer. Detta är inte ett stort problem eftersom det möjliggör användning av en kraftfullare kylenhet.

När det gäller materialval förlitar sig Geekom främst på aluminium, som ser mycket högkvalitativt ut i den diskreta mörkgrå finishen. Det finns inget att kritisera när det gäller byggkvaliteten eftersom enheten ser ut att vara perfekt färdigställd överallt. Detta är vad man kan förvänta sig med tanke på priset.

Undersidan är tillverkad av plast, liknande det vi såg hos Geekom GT13 Pro. Den större designen har också en inverkan på vikten. Med en vikt på strax under 700 g är vårt testexemplar fortfarande lite lättare än Acemagic F2A eller Minisforum UH125 Pro.

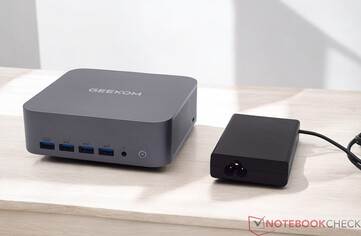
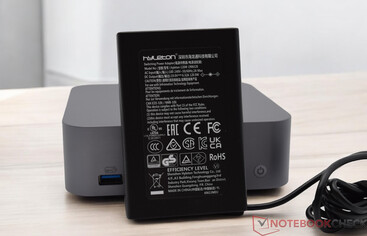
Strömförsörjningen väger in på 256 g, vilket är ungefär samma vikt som Geekom AX8 Pro eller Geekom GT13 Pro. Alla enheter från Geekom som vi har jämfört här levereras med samma strömförsörjningsenhet.

Det är också möjligt att fästa Geekom GT1 Mega direkt på en bildskärm med hjälp av det medföljande VESA-fästet.

Storleksjämförelse

146 mm 146 mm 57 mm 768 g145 mm 145 mm 49 mm 797 g135 mm 132 mm 46.9 mm 693 g117 mm 112 mm 37 mm 548 g117 mm 112 mm 37 mm 525 g112.4 mm 112.4 mm 37 mm 440 g210 mm 148 mm 1 mm 2.9 g

Funktioner: Massor av portar inklusive 2x USB4

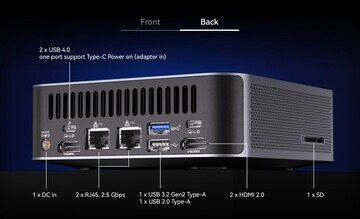
Geekom drar nytta av den större designen och utrustar GT1 Mega med ett bra urval av portar. Det bör inte råda någon brist på USB-portar av typ A, eftersom det finns sex stycken totalt.

Frågan om de fyra portarna på framsidan är användbara får var och en svara på själv. Geekom har även installerat ytterligare två USB4-portar på baksidan, vilket innebär att minidatorn även kan fungera med exempelvis ett externt grafikkort.

De två HDMI-utgångarna på baksidan kan användas för videoutgång. Det är möjligt att använda upp till fyra skärmar samtidigt i kombination med de två USB4-portarna. Den snabba SD-kortläsaren på vänster sida får inte glömmas bort och bör framhållas i positiva ordalag.

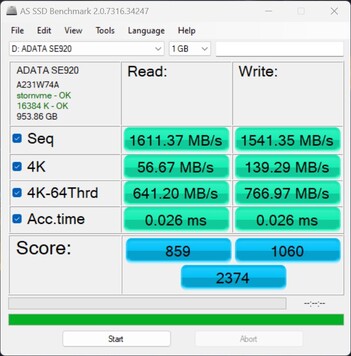
Prestandan som vi bestämmer via USB4-gränssnittet är något nykterande. Den sekventiella läshastigheten för vår test-SSD (ADATA SE920) bleknar i jämförelse med Minisforum MS-A1 eller en Khadas Mind 2.

Framsida: Externa anslutningar på Geekom GT1 Mega (Bildkälla: Geekom)
Bakre delen: Externa anslutningar på Geekom GT1 Mega (Bildkälla: Geekom)
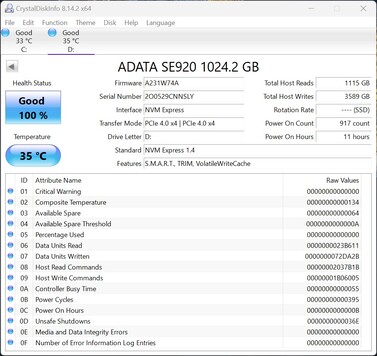
Prestandakontroll med ADATA SE920 via USB4
ADATA SE920 fungerar med PCIe 4.0 x4

SD-kortläsare

SD Card Reader
average JPG Copy Test (av. of 3 runs)
Geekom GT1 Mega
Intel Core Ultra 9 185H
214.4 MB/s
Khadas Mind
Intel Core i7-1360P (AV Pro SD microSD 128 GB V60)
181.79 MB/s -15%
Geekom A5
AMD Ryzen 7 5800H (AV Pro SD microSD 128 GB V60)
176.8 MB/s -18%
Geekom Mini IT13
Intel Core i9-13900H
154.449 MB/s -28%
Geekom Mini IT12
Intel Core i7-1260P (AV Pro SD microSD 128 GB V60)
129.2 MB/s -40%
Average of class Mini PC
  (15.1 - 214, n=26, last 2 years)
97.7 MB/s -54%
Zotac ZBOX Magnus EN173070C
Intel Core i7-11800H (AV Pro SD microSD 128 GB V60)
65 MB/s -70%
maximum AS SSD Seq Read Test (1GB)
Geekom GT1 Mega
Intel Core Ultra 9 185H
220.9 MB/s
Khadas Mind
Intel Core i7-1360P (AV Pro SD microSD 128 GB V60)
200.48 MB/s -9%
Geekom A5
AMD Ryzen 7 5800H (AV Pro SD microSD 128 GB V60)
182.5 MB/s -17%
Geekom Mini IT13
Intel Core i9-13900H
180.4 MB/s -18%
Geekom Mini IT12
Intel Core i7-1260P (AV Pro SD microSD 128 GB V60)
176.8 MB/s -20%
Average of class Mini PC
  (18.2 - 221, n=26, last 2 years)
112.4 MB/s -49%
Zotac ZBOX Magnus EN173070C
Intel Core i7-11800H (AV Pro SD microSD 128 GB V60)
69.9 MB/s -68%
Connectivity - USB 3.x / USB4 / TB - AS SSD Seq Read Test (1GB)
Minisforum MS-A1
Radeon 780M, Ryzen 7 8700G, Kingston OM8PGP41024Q-A0
3245.45 MB/s
Khadas Mind 2
Arc 8-Core, Ultra 7 155H, WD PC SN740 SDDPTQD-1T00
3165.4 MB/s
Average of class Mini PC
  (1611 - 3245, n=6, last 2 years)
2831 MB/s
Geekom GT1 Mega
Arc 8-Core, Ultra 9 185H, Crucial P3 Plus CT2000P3PSSD8
1611.37 MB/s

Kommunikation

Intel Wi-Fi 7 BE200 WLAN-modul

Geekom har installerat en Intel Wi-Fi 7 BE200 i GT1 Mega. Wi-Fi-modulen möjliggör drift i frekvensområdena 2,4 GHz, 5 GHz och 6 GHz.

Våra mätningar i detta test är begränsade till frekvensbanden 5 GHz och 6 GHz. Resultaten är nedslående i jämförelse med konkurrenterna. Som framgår av resultaten bör frekvensbandet 6 GHz användas när det är möjligt för att uppnå bästa möjliga prestanda.

Testerna utfördes i kombination med vår referens Asus ROG Rapture GT-AXE11000 testrouter. Högre dataöverföringar är möjliga via RJ-45 Ethernet. Geekom har installerat två LAN-uttag, vilket möjliggör dataöverföringshastigheter på upp till 2,5 GBit/s.

Networking
iperf3 receive AXE11000 6GHz
Acemagic F2A
Intel Wi-Fi 7 BE200 320MHz
1770 (1584min - 1790max) MBit/s +54%
Minisforum UH125 Pro
Intel Wi-Fi 6E AX210
1755 (1737min - 1766max) MBit/s +53%
Asus NUC 14 Pro
Intel Wi-Fi 6E AX211
1729 (1594min - 1755max) MBit/s +50%
Geekom AX8 Pro
MediaTek Wi-Fi 6E MT7922 160MHz Wireless LAN Card
1657 (1619min - 1670max) MBit/s +44%
Geekom GT13 Pro
MediaTek Wi-Fi 6E MT7922 160MHz Wireless LAN Card
1583 (1557min - 1611max) MBit/s +38%
Average Intel Wi-Fi 7 BE200 320MHz
  (1149 - 1770, n=15)
1537 MBit/s +34%
Average of class Mini PC
  (684 - 1771, n=55, last 2 years)
1380 MBit/s +20%
Geekom GT1 Mega
Intel Wi-Fi 7 BE200 320MHz
1149 (666min - 1346max) MBit/s
iperf3 transmit AXE11000 6GHz
Geekom AX8 Pro
MediaTek Wi-Fi 6E MT7922 160MHz Wireless LAN Card
1800 (1737min - 1904max) MBit/s +45%
Acemagic F2A
Intel Wi-Fi 7 BE200 320MHz
1615 (767min - 1670max) MBit/s +30%
Minisforum UH125 Pro
Intel Wi-Fi 6E AX210
1605 (1238min - 1652max) MBit/s +29%
Geekom GT13 Pro
MediaTek Wi-Fi 6E MT7922 160MHz Wireless LAN Card
1429 (1392min - 1511max) MBit/s +15%
Average Intel Wi-Fi 7 BE200 320MHz
  (943 - 1653, n=15)
1390 MBit/s +12%
Asus NUC 14 Pro
Intel Wi-Fi 6E AX211
1379 (1299min - 1425max) MBit/s +11%
Average of class Mini PC
  (394 - 1800, n=55, last 2 years)
1330 MBit/s +7%
Geekom GT1 Mega
Intel Wi-Fi 7 BE200 320MHz
1242 (1110min - 1348max) MBit/s
iperf3 receive AXE11000
Geekom GT13 Pro
MediaTek Wi-Fi 6E MT7922 160MHz Wireless LAN Card
1398 (1261min - 1453max) MBit/s +57%
Asus NUC 14 Pro
Intel Wi-Fi 6E AX211
1379 (1016min - 1613max) MBit/s +55%
Average Intel Wi-Fi 7 BE200 320MHz
  (838 - 1701, n=20)
1358 MBit/s +53%
Geekom AX8 Pro
MediaTek Wi-Fi 6E MT7922 160MHz Wireless LAN Card
979 (962min - 989max) MBit/s +10%
Average of class Mini PC
  (320 - 1796, n=113, last 2 years)
945 MBit/s +6%
Minisforum UH125 Pro
Intel Wi-Fi 6E AX210
936 (907min - 946max) MBit/s +5%
Geekom GT1 Mega
Intel Wi-Fi 7 BE200 320MHz
888 (825min - 926max) MBit/s
Acemagic F2A
Intel Wi-Fi 7 BE200 320MHz
838 (728min - 926max) MBit/s -6%
iperf3 transmit AXE11000
Asus NUC 14 Pro
Intel Wi-Fi 6E AX211
1331 (1187min - 1442max) MBit/s +80%
Average Intel Wi-Fi 7 BE200 320MHz
  (469 - 1642, n=20)
1192 MBit/s +61%
Geekom GT13 Pro
MediaTek Wi-Fi 6E MT7922 160MHz Wireless LAN Card
1146 (846min - 1308max) MBit/s +55%
Geekom AX8 Pro
MediaTek Wi-Fi 6E MT7922 160MHz Wireless LAN Card
966 (921min - 1008max) MBit/s +30%
Average of class Mini PC
  (184.1 - 1776, n=113, last 2 years)
874 MBit/s +18%
Minisforum UH125 Pro
Intel Wi-Fi 6E AX210
758 (727min - 793max) MBit/s +2%
Geekom GT1 Mega
Intel Wi-Fi 7 BE200 320MHz
741 (690min - 797max) MBit/s
Acemagic F2A
Intel Wi-Fi 7 BE200 320MHz
709 (369min - 977max) MBit/s -4%
0501001502002503003504004505005506006507007508008509009501000105011001150120012501300135014001450150015501600165017001750180018501900Tooltip
Geekom GT1 Mega Intel Wi-Fi 7 BE200 320MHz; iperf3 transmit AXE11000 6GHz; iperf 3.1.3: Ø1242 (1110-1348)
Geekom AX8 Pro MediaTek Wi-Fi 6E MT7922 160MHz Wireless LAN Card; iperf3 transmit AXE11000 6GHz; iperf 3.1.3: Ø1800 (1737-1904)
Geekom GT1 Mega Intel Wi-Fi 7 BE200 320MHz; iperf3 receive AXE11000 6GHz; iperf 3.1.3: Ø1126 (666-1346)
Geekom AX8 Pro MediaTek Wi-Fi 6E MT7922 160MHz Wireless LAN Card; iperf3 receive AXE11000 6GHz; iperf 3.1.3: Ø1656 (1619-1670)
Geekom GT1 Mega Intel Wi-Fi 7 BE200 320MHz; iperf3 receive AXE11000; iperf 3.1.3: Ø887 (825-926)
Geekom AX8 Pro MediaTek Wi-Fi 6E MT7922 160MHz Wireless LAN Card; iperf3 receive AXE11000; iperf 3.1.3: Ø978 (962-989)
Geekom GT1 Mega Intel Wi-Fi 7 BE200 320MHz; iperf3 transmit AXE11000; iperf 3.1.3: Ø741 (690-797)
Geekom AX8 Pro MediaTek Wi-Fi 6E MT7922 160MHz Wireless LAN Card; iperf3 transmit AXE11000; iperf 3.1.3: Ø966 (921-1008)

Tillbehör

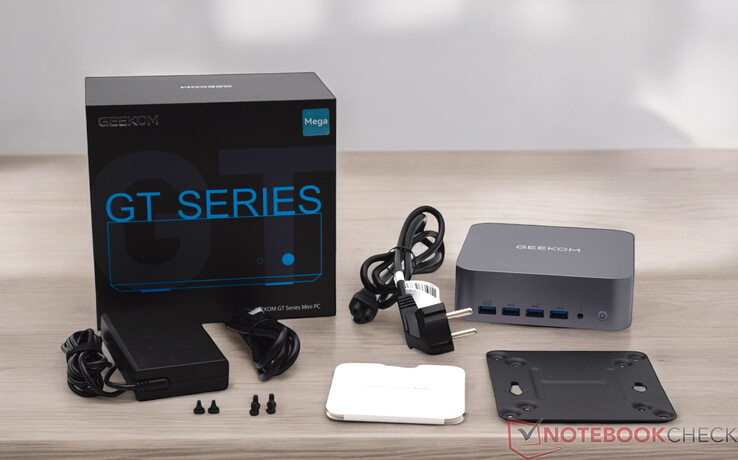
Geekom GT1 Mega levereras med ett 120 W nätaggregat. Det finns också en HDMI-kabel och en VESA-monteringsplatta, vilket är standardleveransen.

Tillverkaren inkluderar också en användarmanual, som bland annat beskriver anslutningsalternativen och installationen av RAM och SSD.

Omfattning av leveransen av Geekom GT1 Mega

Underhåll

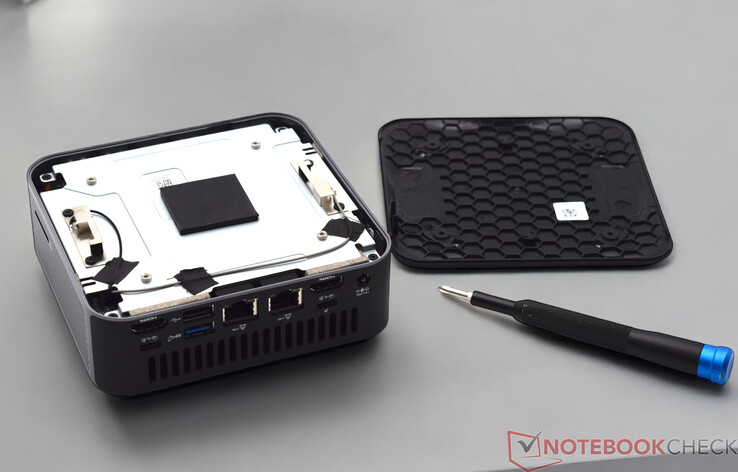
Geekom GT1 Mega säljs alltid i kombination med förinstallerat RAM-minne och en SSD-enhet. Omvänt betyder detta att GT1 Mega är omedelbart redo att användas. Enheten kan dock fortfarande öppnas med lite skicklighet.

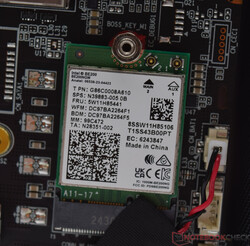
Förfarandet här liknar Geekom GT13 Pro, även om G1 Mega bara är något större. Fyra små skruvar är dolda under de fastlimmade gummifötterna, som först måste skruvas loss för att ta bort undersidan. En annan metallplatta blockerar vägen till de installerade komponenterna, som först måste tas bort om du vill komma åt RAM-minnet, SSD eller WLAN-modulen.

En ledig M.2-plats är fortfarande tillgänglig, vilket innebär att Geekom GT1 Mega kan utrustas med två SSD-enheter. Den andra M.2-platsen kan tekniskt sett rymma både NVMe- och SATA-SSD-enheter. SSD-längden är dock begränsad till 42 mm.

Geekom GT1 Mega med öppen undersida
Skruvarna är placerade under gummifötterna
Kretskort med kylaggregat
Kretskort
Geekom GT1 Mega demonterad

Hållbarhet

Geekom GT1 Mega är en kompakt minidator, vilket innebär att det knappast är möjligt att reparera den om den skulle gå sönder. Geekom erbjuder dock 36 månaders garanti, vilket skiljer dem från de flesta andra tillverkare inom detta område.

Geekom kan berömmas för sin kompakta förpackning, som verkligen gör transporten enklare. När det gäller hållbarhet annonserar Geekom lägre strömförbrukning jämfört med en konventionell stationär PC. Det finns dock ingen detaljerad information om användningen av återvunnet material i produktionen.

Prestanda: Geekom installerar en AI-processor för första gången

För första gången har Geekom installerat en Intel Core Ultra 9 185Hsom på grund av sin design också kan utföra speciella AI-beräkningar särskilt effektivt. Tillsammans med 32 GB DDR5 RAM är du utrustad för nästan alla uppgifter. Den alternativa utrustningsvarianten, baserad på Intel Core Ultra 7 155Hlevererar liknande prestanda och kommer med samma innovationer.

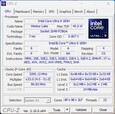
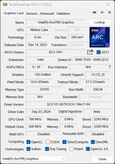
CPU-Z
CPU-Z
CPU-Z
CPU-Z
CPU-Z
CPU-Z
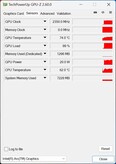
GPU-Z
GPU-Z
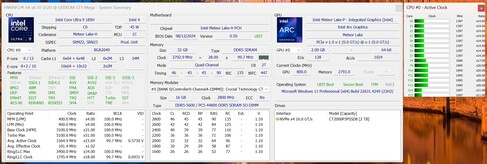
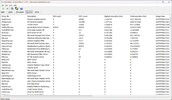
HWiNFO

Testförhållanden

Vi utförde alla prestandatester med energiprofilen "Hög prestanda". Vi ändrade inte prestandan hos Intel Core Ultra 9 185H och lämnade den i normalt läge enligt BIOS-inställningarna.

Avvikande energisparplaner användes endast för mätningarna av energiförbrukningen enligt våra Testkriterier.

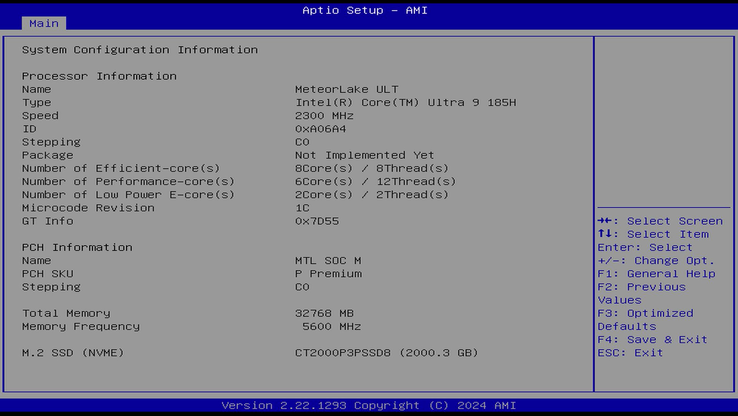
Geekom GT1 Mega - BIOS-alternativ

Processor

Toppmodellen Geekom GT1 Mega drivs av en Intel Core Ultra 9 185H. 16 kärnor med totalt 22 trådar säkerställer en hög arbetshastighet, vilket främst lönar sig i flertrådade uppgifter.

Vårt testprov är dock inte ett slöseri när det gäller prestanda med en enda kärna. GT1 Mega leder ofta benchmarkresultaten. Sammantaget säkrar vårt testexemplar andraplatsen i jämförelsen. Den tuffaste konkurrenten här är Geekom AX8 Pro som vi hade testat med AMD Ryzen 9 8945HS.

När det gäller strömförbrukningen bör det nämnas att Geekom använder Intel Core Ultra 9 185H enligt tillverkarens specifikationer. Som levererat är den normala lägesprofilen aktiv i BIOS. Detta innebär att SoC-enheten arbetar med 45 W under kontinuerlig belastning, även om upp till 70 W är möjligt i Turbo-läge.

Förutom i normalläge kan Geekom GT1 Mega också köras i tyst läge eller prestandaläge. Detta har liten effekt på processorns effektgränser, vilket också förändrar prestandan något. Vi har utfört några tester med de olika lägena och sammanfattat dem i tabellen.

Resultaten visar att det inte finns någon betydande prestandafördel i prestandaläget. För att minska den akustiska belastningen skulle vi rekommendera tyst läge. Den därmed sammanhängande prestandaförlusten kan säkert tolereras.

För ytterligare jämförelser och benchmarks hänvisar vi till vår CPU-jämförelsetabell.

Power Mode PL1/PL2 i W Cinebench R15 1T Cinebench R15 nT Cinebench R20 1T Cinebench R20 nT Cinebench R23 1T Cinebench R23 nT
tyst läge 45/50 260 2.430 696 6.403 1.820 16.536
normalläge 45/70 262 2.794 696 7.192 1.774 18.608
performance mode 65/70 264 2.800 704 7.213 1.826 18.739

Resultat från Cinebench: Normalt läge - PL2 70 W; PL1 45 W

Cinebench R15
Cinebench R15
Cinebench R20
Cinebench R20
Cinebench R23
Cinebench R23
Cinebench 2024
Cinebench 2024
Performance Rating - Percent
Geekom AX8 Pro
AMD Ryzen 9 8945H
56.6 pt
Geekom GT1 Mega
Intel Core Ultra 9 185H
56.1 pt
Acemagic F2A
Intel Core Ultra 7 155H
55.3 pt
Geekom GT13 Pro
Intel Core i9-13900H
53.5 pt
Asus NUC 14 Pro
Intel Core Ultra 5 125H
50.9 pt
Minisforum UH125 Pro
Intel Core Ultra 5 125H
50.1 pt
Cinebench 2024
CPU Multi Core
Acemagic F2A
Intel Core Ultra 7 155H
1022 Points +11%
Geekom GT1 Mega
Intel Core Ultra 9 185H
924 Points
Geekom AX8 Pro
AMD Ryzen 9 8945H
852 Points -8%
Asus NUC 14 Pro
Intel Core Ultra 5 125H
815 Points -12%
Minisforum UH125 Pro
Intel Core Ultra 5 125H
814 Points -12%
Geekom GT13 Pro
Intel Core i9-13900H
703 Points -24%
CPU Single Core
Geekom AX8 Pro
AMD Ryzen 9 8945H
107 Points 0%
Geekom GT1 Mega
Intel Core Ultra 9 185H
107 Points
Acemagic F2A
Intel Core Ultra 7 155H
106 Points -1%
Geekom GT13 Pro
Intel Core i9-13900H
104 Points -3%
Asus NUC 14 Pro
Intel Core Ultra 5 125H
102 Points -5%
Minisforum UH125 Pro
Intel Core Ultra 5 125H
97 Points -9%
Cinebench R23
Multi Core
Geekom GT1 Mega
Intel Core Ultra 9 185H
18608 Points
Acemagic F2A
Intel Core Ultra 7 155H
18497 Points -1%
Geekom AX8 Pro
AMD Ryzen 9 8945H
15516 Points -17%
Minisforum UH125 Pro
Intel Core Ultra 5 125H
14564 Points -22%
Asus NUC 14 Pro
Intel Core Ultra 5 125H
14516 Points -22%
Geekom GT13 Pro
Intel Core i9-13900H
13015 Points -30%
Single Core
Geekom AX8 Pro
AMD Ryzen 9 8945H
1808 Points +2%
Geekom GT1 Mega
Intel Core Ultra 9 185H
1774 Points
Acemagic F2A
Intel Core Ultra 7 155H
1771 Points 0%
Asus NUC 14 Pro
Intel Core Ultra 5 125H
1721 Points -3%
Geekom GT13 Pro
Intel Core i9-13900H
1715 Points -3%
Minisforum UH125 Pro
Intel Core Ultra 5 125H
1640 Points -8%
Cinebench R20
CPU (Single Core)
Geekom AX8 Pro
AMD Ryzen 9 8945H
703 Points +1%
Geekom GT1 Mega
Intel Core Ultra 9 185H
696 Points
Acemagic F2A
Intel Core Ultra 7 155H
679 Points -2%
Geekom GT13 Pro
Intel Core i9-13900H
659 Points -5%
Minisforum UH125 Pro
Intel Core Ultra 5 125H
629 Points -10%
Asus NUC 14 Pro
Intel Core Ultra 5 125H
622 Points -11%
CPU (Multi Core)
Geekom GT1 Mega
Intel Core Ultra 9 185H
7192 Points
Acemagic F2A
Intel Core Ultra 7 155H
7188 Points 0%
Geekom AX8 Pro
AMD Ryzen 9 8945H
6153 Points -14%
Minisforum UH125 Pro
Intel Core Ultra 5 125H
5618 Points -22%
Asus NUC 14 Pro
Intel Core Ultra 5 125H
5617 Points -22%
Geekom GT13 Pro
Intel Core i9-13900H
5013 Points -30%
Cinebench R15
CPU Single 64Bit
Geekom AX8 Pro
AMD Ryzen 9 8945H
284 Points +8%
Geekom GT1 Mega
Intel Core Ultra 9 185H
262 Points
Acemagic F2A
Intel Core Ultra 7 155H
258 Points -2%
Asus NUC 14 Pro
Intel Core Ultra 5 125H
248 Points -5%
Geekom GT13 Pro
Intel Core i9-13900H
245 Points -6%
Minisforum UH125 Pro
Intel Core Ultra 5 125H
235 Points -10%
CPU Multi 64Bit
Geekom GT1 Mega
Intel Core Ultra 9 185H
2794 Points
Acemagic F2A
Intel Core Ultra 7 155H
2738 Points -2%
Geekom AX8 Pro
AMD Ryzen 9 8945H
2521 Points -10%
Geekom GT13 Pro
Intel Core i9-13900H
2260 Points -19%
Minisforum UH125 Pro
Intel Core Ultra 5 125H
2245 Points -20%
Asus NUC 14 Pro
Intel Core Ultra 5 125H
2141 Points -23%
Cinebench R11.5
CPU Single 64Bit
Geekom AX8 Pro
AMD Ryzen 9 8945H
3.28 Points +5%
Acemagic F2A
Intel Core Ultra 7 155H
3.13 Points 0%
Geekom GT1 Mega
Intel Core Ultra 9 185H
3.13 Points
Asus NUC 14 Pro
Intel Core Ultra 5 125H
3.03 Points -3%
Geekom GT13 Pro
Intel Core i9-13900H
2.98 Points -5%
Minisforum UH125 Pro
Intel Core Ultra 5 125H
2.86 Points -9%
CPU Multi 64Bit
Geekom GT1 Mega
Intel Core Ultra 9 185H
34.34 Points
Acemagic F2A
Intel Core Ultra 7 155H
33.49 Points -2%
Geekom AX8 Pro
AMD Ryzen 9 8945H
29.14 Points -15%
Geekom GT13 Pro
Intel Core i9-13900H
27.48 Points -20%
Minisforum UH125 Pro
Intel Core Ultra 5 125H
27.02 Points -21%
Asus NUC 14 Pro
Intel Core Ultra 5 125H
26.92 Points -22%
Cinebench R10
Rendering Single CPUs 64Bit
Geekom AX8 Pro
AMD Ryzen 9 8945H
14451 Points +3%
Geekom GT1 Mega
Intel Core Ultra 9 185H
13997 Points
Acemagic F2A
Intel Core Ultra 7 155H
13938 Points 0%
Geekom GT13 Pro
Intel Core i9-13900H
13820 Points -1%
Asus NUC 14 Pro
Intel Core Ultra 5 125H
13281 Points -5%
Minisforum UH125 Pro
Intel Core Ultra 5 125H
12858 Points -8%
Rendering Multiple CPUs 64Bit
Acemagic F2A
Intel Core Ultra 7 155H
95005 Points +4%
Geekom GT1 Mega
Intel Core Ultra 9 185H
91553 Points
Geekom AX8 Pro
AMD Ryzen 9 8945H
84253 Points -8%
Geekom GT13 Pro
Intel Core i9-13900H
79014 Points -14%
Minisforum UH125 Pro
Intel Core Ultra 5 125H
78817 Points -14%
Asus NUC 14 Pro
Intel Core Ultra 5 125H
78788 Points -14%
Blender - v2.79 BMW27 CPU
Geekom GT13 Pro
Intel Core i9-13900H
262 Seconds * -37%
Minisforum UH125 Pro
Intel Core Ultra 5 125H
230 Seconds * -20%
Asus NUC 14 Pro
Intel Core Ultra 5 125H
228 Seconds * -19%
Geekom AX8 Pro
AMD Ryzen 9 8945H
206 Seconds * -8%
Geekom GT1 Mega
Intel Core Ultra 9 185H
191 Seconds *
Acemagic F2A
Intel Core Ultra 7 155H
178 Seconds * +7%
wPrime 2.10
32m
Minisforum UH125 Pro
Intel Core Ultra 5 125H
4.48 s * -37%
Asus NUC 14 Pro
Intel Core Ultra 5 125H
4.107 s * -26%
Acemagic F2A
Intel Core Ultra 7 155H
3.523 s * -8%
Geekom GT13 Pro
Intel Core i9-13900H
3.518 s * -8%
Geekom GT1 Mega
Intel Core Ultra 9 185H
3.271 s *
Geekom AX8 Pro
AMD Ryzen 9 8945H
2.688 s * +18%
1024m
Geekom GT13 Pro
Intel Core i9-13900H
412.775 s * -150%
Minisforum UH125 Pro
Intel Core Ultra 5 125H
246.982 s * -50%
Geekom GT1 Mega
Intel Core Ultra 9 185H
165.075 s *
Asus NUC 14 Pro
Intel Core Ultra 5 125H
148.994 s * +10%
Acemagic F2A
Intel Core Ultra 7 155H
139.617 s * +15%
Geekom AX8 Pro
AMD Ryzen 9 8945H
74.917 s * +55%
X264 HD Benchmark 4.0
Pass 1
Geekom GT1 Mega
Intel Core Ultra 9 185H
336.5 (329min - 346max) fps
Acemagic F2A
Intel Core Ultra 7 155H
325 (323min - 328max) fps -3%
Asus NUC 14 Pro
Intel Core Ultra 5 125H
308.5 (306min - 311max) fps -8%
Minisforum UH125 Pro
Intel Core Ultra 5 125H
304.5 (304min - 306max) fps -10%
Geekom GT13 Pro
Intel Core i9-13900H
300.5 (288min - 319max) fps -11%
Geekom AX8 Pro
AMD Ryzen 9 8945H
300 (299min - 301max) fps -11%
Pass 2
Geekom GT1 Mega
Intel Core Ultra 9 185H
161.5 (159.8min - 163.8max) fps
Acemagic F2A
Intel Core Ultra 7 155H
154.15 (153.8min - 154.3max) fps -5%
Geekom AX8 Pro
AMD Ryzen 9 8945H
141.2 (141min - 143.9max) fps -13%
Minisforum UH125 Pro
Intel Core Ultra 5 125H
134 (133.7min - 134.5max) fps -17%
Asus NUC 14 Pro
Intel Core Ultra 5 125H
132.3 (129.2min - 135max) fps -18%
Geekom GT13 Pro
Intel Core i9-13900H
113.95 (106.5min - 136.6max) fps -29%
WinRAR - Result
Geekom GT1 Mega
Intel Core Ultra 9 185H
8563 KB/s
Geekom AX8 Pro
AMD Ryzen 9 8945H
7744 KB/s -10%
Acemagic F2A
Intel Core Ultra 7 155H
7723 KB/s -10%
Geekom GT13 Pro
Intel Core i9-13900H
6800 KB/s -21%
Asus NUC 14 Pro
Intel Core Ultra 5 125H
6315 KB/s -26%
Minisforum UH125 Pro
Intel Core Ultra 5 125H
5594 KB/s -35%
TrueCrypt
AES Mean 100MB
Geekom AX8 Pro
AMD Ryzen 9 8945H
14.5 GB/s +32%
Geekom GT13 Pro
Intel Core i9-13900H
13.2 GB/s +20%
Geekom GT1 Mega
Intel Core Ultra 9 185H
11 GB/s
Acemagic F2A
Intel Core Ultra 7 155H
10.6 GB/s -4%
Minisforum UH125 Pro
Intel Core Ultra 5 125H
9 GB/s -18%
Asus NUC 14 Pro
Intel Core Ultra 5 125H
8.8 GB/s -20%
Twofish Mean 100MB
Geekom GT13 Pro
Intel Core i9-13900H
2.4 GB/s +26%
Geekom AX8 Pro
AMD Ryzen 9 8945H
2.1 GB/s +11%
Geekom GT1 Mega
Intel Core Ultra 9 185H
1.9 GB/s
Acemagic F2A
Intel Core Ultra 7 155H
1.7 GB/s -11%
Minisforum UH125 Pro
Intel Core Ultra 5 125H
1.4 GB/s -26%
Asus NUC 14 Pro
Intel Core Ultra 5 125H
1.4 GB/s -26%
Serpent Mean 100MB
Geekom AX8 Pro
AMD Ryzen 9 8945H
1.3 GB/s +18%
Geekom GT13 Pro
Intel Core i9-13900H
1.2 GB/s +9%
Geekom GT1 Mega
Intel Core Ultra 9 185H
1.1 GB/s
Acemagic F2A
Intel Core Ultra 7 155H
1 GB/s -9%
Asus NUC 14 Pro
Intel Core Ultra 5 125H
0.869 GB/s -21%
Minisforum UH125 Pro
Intel Core Ultra 5 125H
0.854 GB/s -22%
Geekbench 5.5
Multi-Core
Geekom GT1 Mega
Intel Core Ultra 9 185H
13763 Points
Acemagic F2A
Intel Core Ultra 7 155H
12662 Points -8%
Geekom AX8 Pro
AMD Ryzen 9 8945H
11980 Points -13%
Geekom GT13 Pro
Intel Core i9-13900H
11283 Points -18%
Asus NUC 14 Pro
Intel Core Ultra 5 125H
10856 Points -21%
Minisforum UH125 Pro
Intel Core Ultra 5 125H
10788 Points -22%
Single-Core
Geekom AX8 Pro
AMD Ryzen 9 8945H
1994 Points +8%
Geekom GT1 Mega
Intel Core Ultra 9 185H
1852 Points
Geekom GT13 Pro
Intel Core i9-13900H
1841 Points -1%
Acemagic F2A
Intel Core Ultra 7 155H
1746 Points -6%
Asus NUC 14 Pro
Intel Core Ultra 5 125H
1685 Points -9%
Minisforum UH125 Pro
Intel Core Ultra 5 125H
1593 Points -14%
Geekbench 5.0
5.0 Multi-Core
Geekom GT1 Mega
Intel Core Ultra 9 185H
13822 Points
Acemagic F2A
Intel Core Ultra 7 155H
12438 Points -10%
Geekom AX8 Pro
AMD Ryzen 9 8945H
11804 Points -15%
Geekom GT13 Pro
Intel Core i9-13900H
11168 Points -19%
Asus NUC 14 Pro
Intel Core Ultra 5 125H
10747 Points -22%
Minisforum UH125 Pro
Intel Core Ultra 5 125H
10676 Points -23%
5.0 Single-Core
Geekom AX8 Pro
AMD Ryzen 9 8945H
1907 Points +6%
Geekom GT13 Pro
Intel Core i9-13900H
1810 Points +1%
Geekom GT1 Mega
Intel Core Ultra 9 185H
1797 Points
Acemagic F2A
Intel Core Ultra 7 155H
1708 Points -5%
Asus NUC 14 Pro
Intel Core Ultra 5 125H
1659 Points -8%
Minisforum UH125 Pro
Intel Core Ultra 5 125H
1596 Points -11%
Geekbench 4.4
64 Bit Single-Core Score
Geekom AX8 Pro
AMD Ryzen 9 8945H
8140 Points +8%
Geekom GT13 Pro
Intel Core i9-13900H
7787 Points +4%
Geekom GT1 Mega
Intel Core Ultra 9 185H
7516 Points
Asus NUC 14 Pro
Intel Core Ultra 5 125H
6964 Points -7%
Acemagic F2A
Intel Core Ultra 7 155H
6927 Points -8%
Minisforum UH125 Pro
Intel Core Ultra 5 125H
6734 Points -10%
64 Bit Multi-Core Score
Geekom GT1 Mega
Intel Core Ultra 9 185H
49924 Points
Geekom AX8 Pro
AMD Ryzen 9 8945H
47917 Points -4%
Acemagic F2A
Intel Core Ultra 7 155H
45250 Points -9%
Geekom GT13 Pro
Intel Core i9-13900H
41851 Points -16%
Asus NUC 14 Pro
Intel Core Ultra 5 125H
38793 Points -22%
Minisforum UH125 Pro
Intel Core Ultra 5 125H
38648 Points -23%
3DMark 11 - 1280x720 Performance Physics
Geekom AX8 Pro
AMD Ryzen 9 8945H
22340 Points +23%
Acemagic F2A
Intel Core Ultra 7 155H
20846 Points +15%
Geekom GT13 Pro
Intel Core i9-13900H
18383 Points +1%
Geekom GT1 Mega
Intel Core Ultra 9 185H
18130 Points
Asus NUC 14 Pro
Intel Core Ultra 5 125H
17624 Points -3%
Minisforum UH125 Pro
Intel Core Ultra 5 125H
17138 Points -5%
7-Zip 18.03
7z b 4
Geekom GT1 Mega
Intel Core Ultra 9 185H
71050 MIPS
Geekom AX8 Pro
AMD Ryzen 9 8945H
66557 MIPS -6%
Acemagic F2A
Intel Core Ultra 7 155H
66438 MIPS -6%
Geekom GT13 Pro
Intel Core i9-13900H
52479 MIPS -26%
Minisforum UH125 Pro
Intel Core Ultra 5 125H
0 MIPS -100%
Asus NUC 14 Pro
Intel Core Ultra 5 125H
0 MIPS -100%
7z b 4 -mmt1
Geekom AX8 Pro
AMD Ryzen 9 8945H
6691 MIPS +18%
Geekom GT13 Pro
Intel Core i9-13900H
6321 MIPS +12%
Geekom GT1 Mega
Intel Core Ultra 9 185H
5657 MIPS
Acemagic F2A
Intel Core Ultra 7 155H
5485 MIPS -3%
Asus NUC 14 Pro
Intel Core Ultra 5 125H
5136 MIPS -9%
Minisforum UH125 Pro
Intel Core Ultra 5 125H
4699 MIPS -17%
HWBOT x265 Benchmark v2.2 - 4k Preset
Geekom AX8 Pro
AMD Ryzen 9 8945H
20.6 fps +2%
Geekom GT1 Mega
Intel Core Ultra 9 185H
20.2 fps
Acemagic F2A
Intel Core Ultra 7 155H
19.6 fps -3%
Minisforum UH125 Pro
Intel Core Ultra 5 125H
16.7 fps -17%
Asus NUC 14 Pro
Intel Core Ultra 5 125H
15.7 fps -22%
Geekom GT13 Pro
Intel Core i9-13900H
14.1 fps -30%
R Benchmark 2.5 - Overall mean
Minisforum UH125 Pro
Intel Core Ultra 5 125H
0.513 sec * -12%
Asus NUC 14 Pro
Intel Core Ultra 5 125H
0.4982 sec * -9%
Acemagic F2A
Intel Core Ultra 7 155H
0.4652 sec * -2%
Geekom AX8 Pro
AMD Ryzen 9 8945H
0.4576 sec * -0%
Geekom GT1 Mega
Intel Core Ultra 9 185H
0.4571 sec *
Geekom GT13 Pro
Intel Core i9-13900H
0.4395 sec * +4%
LibreOffice - 20 Documents To PDF
Minisforum UH125 Pro
Intel Core Ultra 5 125H
70.9 s * -36%
Asus NUC 14 Pro
Intel Core Ultra 5 125H
55.7 s * -7%
Geekom GT1 Mega
Intel Core Ultra 9 185H
52.1 s *
Geekom AX8 Pro
AMD Ryzen 9 8945H
49.8 s * +4%
Acemagic F2A
Intel Core Ultra 7 155H
44.5 s * +15%
Geekom GT13 Pro
Intel Core i9-13900H
39.4 s * +24%
WebXPRT 3 - Overall
Geekom AX8 Pro
AMD Ryzen 9 8945H
309 Points +8%
Geekom GT13 Pro
Intel Core i9-13900H
304 Points +6%
Geekom GT1 Mega
Intel Core Ultra 9 185H
286 Points
Acemagic F2A
Intel Core Ultra 7 155H
276 Points -3%
Minisforum UH125 Pro
Intel Core Ultra 5 125H
254 Points -11%
Asus NUC 14 Pro
Intel Core Ultra 5 125H
254 Points -11%
Mozilla Kraken 1.1 - Total
Minisforum UH125 Pro
Intel Core Ultra 5 125H
595 ms * -15%
Asus NUC 14 Pro
Intel Core Ultra 5 125H
567 ms * -9%
Acemagic F2A
Intel Core Ultra 7 155H
535 ms * -3%
Geekom GT1 Mega
Intel Core Ultra 9 185H
518 ms *
Geekom GT13 Pro
Intel Core i9-13900H
517 ms * -0%
Geekom AX8 Pro
AMD Ryzen 9 8945H
506 ms * +2%
3DMark
1920x1080 Fire Strike Physics
Geekom AX8 Pro
AMD Ryzen 9 8945H
27363 Points +12%
Acemagic F2A
Intel Core Ultra 7 155H
25043 Points +3%
Geekom GT1 Mega
Intel Core Ultra 9 185H
24366 Points
Geekom GT13 Pro
Intel Core i9-13900H
23626 Points -3%
Asus NUC 14 Pro
Intel Core Ultra 5 125H
22863 Points -6%
Minisforum UH125 Pro
Intel Core Ultra 5 125H
21391 Points -12%
2560x1440 Time Spy CPU
Geekom AX8 Pro
AMD Ryzen 9 8945H
10844 Points +12%
Acemagic F2A
Intel Core Ultra 7 155H
10014 Points +3%
Geekom GT1 Mega
Intel Core Ultra 9 185H
9687 Points
Geekom GT13 Pro
Intel Core i9-13900H
9347 Points -4%
Minisforum UH125 Pro
Intel Core Ultra 5 125H
9182 Points -5%
Asus NUC 14 Pro
Intel Core Ultra 5 125H
8719 Points -10%
Super Pi mod 1.5 XS 1M - 1M
Minisforum UH125 Pro
Intel Core Ultra 5 125H
7.744 s * -15%
Geekom GT13 Pro
Intel Core i9-13900H
7.445 s * -10%
Asus NUC 14 Pro
Intel Core Ultra 5 125H
7.444 s * -10%
Acemagic F2A
Intel Core Ultra 7 155H
7.168 s * -6%
Geekom AX8 Pro
AMD Ryzen 9 8945H
6.962 s * -3%
Geekom GT1 Mega
Intel Core Ultra 9 185H
6.762 s *
Super Pi mod 1.5 XS 2M - 2M
Geekom AX8 Pro
AMD Ryzen 9 8945H
17.404 s * -17%
Minisforum UH125 Pro
Intel Core Ultra 5 125H
16.967 s * -14%
Asus NUC 14 Pro
Intel Core Ultra 5 125H
16.446 s * -10%
Geekom GT13 Pro
Intel Core i9-13900H
16.234 s * -9%
Acemagic F2A
Intel Core Ultra 7 155H
16.125 s * -8%
Geekom GT1 Mega
Intel Core Ultra 9 185H
14.928 s *
Super Pi Mod 1.5 XS 32M - 32M
Geekom AX8 Pro
AMD Ryzen 9 8945H
644.49 s * -76%
Minisforum UH125 Pro
Intel Core Ultra 5 125H
423.565 s * -15%
Geekom GT13 Pro
Intel Core i9-13900H
417.103 s * -14%
Acemagic F2A
Intel Core Ultra 7 155H
394.754 s * -8%
Asus NUC 14 Pro
Intel Core Ultra 5 125H
394.697 s * -8%
Geekom GT1 Mega
Intel Core Ultra 9 185H
366.851 s *
Affinity Photo 2 - Combined (Multi CPU)
Geekom GT1 Mega
Intel Core Ultra 9 185H
792 Points
Acemagic F2A
Intel Core Ultra 7 155H
770 Points -3%
Minisforum UH125 Pro
Intel Core Ultra 5 125H
615 Points -22%
Geekom AX8 Pro
AMD Ryzen 9 8945H
603 Points -24%
Asus NUC 14 Pro
Intel Core Ultra 5 125H
594 Points -25%
Geekom GT13 Pro
Intel Core i9-13900H
547 Points -31%

* ... smaller is better

Cinebench R10 Rendering Single 32Bit
9719
Cinebench R10 Shading 64Bit
21485 Points
Cinebench R10 Rendering Multiple CPUs 64Bit
91553 Points
Cinebench R10 Rendering Single CPUs 64Bit
13997 Points
Cinebench R10 Shading 32Bit
19892
Cinebench R10 Rendering Multiple CPUs 32Bit
61959
Cinebench R11.5 CPU Single 32Bit
2.74 Points
Cinebench R11.5 CPU Multi 32Bit
30.5 Points
Cinebench R11.5 OpenGL 32Bit
111.51 fps
Cinebench R11.5 CPU Single 64Bit
3.13 Points
Cinebench R11.5 CPU Multi 64Bit
34.34 Points
Cinebench R11.5 OpenGL 64Bit
111.5 fps
Cinebench R15 CPU Single 64Bit
262 Points
Cinebench R15 CPU Multi 64Bit
2794 Points
Cinebench R15 Ref. Match 64Bit
97.8 %
Cinebench R15 OpenGL 64Bit
163.41 fps
Cinebench R20 CPU (Single Core)
696 Points
Cinebench R20 CPU (Multi Core)
7192 Points
Cinebench R23 Multi Core
18608 Points
Cinebench R23 Single Core
1774 Points
Cinebench 2024 CPU Single Core
107 Points
Cinebench 2024 CPU Multi Core
924 Points
Hjälp
Performance Rating
Geekom AX8 Pro
AMD Ryzen 9 8945H, Radeon 780M
96.7 pt
Acemagic F2A
Intel Core Ultra 7 155H, Arc 8-Core
80.2 pt
Geekom GT1 Mega
Intel Core Ultra 9 185H, Arc 8-Core
77.3 pt
Minisforum UH125 Pro
Intel Core Ultra 5 125H, Arc 7-Core
65.3 pt
Asus NUC 14 Pro
Intel Core Ultra 5 125H, Arc 7-Core
64.5 pt
Average of class Mini PC
 
59.2 pt
Geekom GT13 Pro
Intel Core i9-13900H, Iris Xe G7 96EUs
58.5 pt
AIDA64 / FP32 Ray-Trace
Geekom AX8 Pro
AMD Ryzen 9 8945H, Radeon 780M
24531 KRay/s +62%
Acemagic F2A
Intel Core Ultra 7 155H, Arc 8-Core
17544 KRay/s +16%
Geekom GT1 Mega
Intel Core Ultra 9 185H, Arc 8-Core
15184 KRay/s
Minisforum UH125 Pro
Intel Core Ultra 5 125H, Arc 7-Core
13639 KRay/s -10%
Asus NUC 14 Pro
Intel Core Ultra 5 125H, Arc 7-Core
13347 KRay/s -12%
Average of class Mini PC
  (646 - 51004, n=119, last 2 years)
12878 KRay/s -15%
Geekom GT13 Pro
Intel Core i9-13900H, Iris Xe G7 96EUs
11735 KRay/s -23%
AIDA64 / FPU Julia
Geekom AX8 Pro
AMD Ryzen 9 8945H, Radeon 780M
106518 Points +36%
Acemagic F2A
Intel Core Ultra 7 155H, Arc 8-Core
88829 Points +13%
Geekom GT1 Mega
Intel Core Ultra 9 185H, Arc 8-Core
78346 Points
Minisforum UH125 Pro
Intel Core Ultra 5 125H, Arc 7-Core
70880 Points -10%
Asus NUC 14 Pro
Intel Core Ultra 5 125H, Arc 7-Core
68551 Points -13%
Average of class Mini PC
  (3857 - 214250, n=119, last 2 years)
64921 Points -17%
Geekom GT13 Pro
Intel Core i9-13900H, Iris Xe G7 96EUs
59094 Points -25%
AIDA64 / CPU SHA3
Geekom AX8 Pro
AMD Ryzen 9 8945H, Radeon 780M
4684 MB/s +25%
Acemagic F2A
Intel Core Ultra 7 155H, Arc 8-Core
4246 MB/s +13%
Geekom GT1 Mega
Intel Core Ultra 9 185H, Arc 8-Core
3753 MB/s
Minisforum UH125 Pro
Intel Core Ultra 5 125H, Arc 7-Core
3404 MB/s -9%
Asus NUC 14 Pro
Intel Core Ultra 5 125H, Arc 7-Core
3323 MB/s -11%
Average of class Mini PC
  (260 - 9399, n=119, last 2 years)
2856 MB/s -24%
Geekom GT13 Pro
Intel Core i9-13900H, Iris Xe G7 96EUs
2718 MB/s -28%
AIDA64 / CPU Queen
Geekom AX8 Pro
AMD Ryzen 9 8945H, Radeon 780M
114586 Points +32%
Geekom GT13 Pro
Intel Core i9-13900H, Iris Xe G7 96EUs
93952 Points +8%
Acemagic F2A
Intel Core Ultra 7 155H, Arc 8-Core
89748 Points +3%
Geekom GT1 Mega
Intel Core Ultra 9 185H, Arc 8-Core
86969 Points
Average of class Mini PC
  (8172 - 184747, n=119, last 2 years)
80187 Points -8%
Asus NUC 14 Pro
Intel Core Ultra 5 125H, Arc 7-Core
79866 Points -8%
Minisforum UH125 Pro
Intel Core Ultra 5 125H, Arc 7-Core
78098 Points -10%
AIDA64 / FPU SinJulia
Geekom AX8 Pro
AMD Ryzen 9 8945H, Radeon 780M
14631 Points +42%
Geekom GT1 Mega
Intel Core Ultra 9 185H, Arc 8-Core
10289 Points
Acemagic F2A
Intel Core Ultra 7 155H, Arc 8-Core
10247 Points 0%
Average of class Mini PC
  (408 - 29064, n=119, last 2 years)
8812 Points -14%
Geekom GT13 Pro
Intel Core i9-13900H, Iris Xe G7 96EUs
8026 Points -22%
Asus NUC 14 Pro
Intel Core Ultra 5 125H, Arc 7-Core
7851 Points -24%
Minisforum UH125 Pro
Intel Core Ultra 5 125H, Arc 7-Core
7842 Points -24%
AIDA64 / FPU Mandel
Geekom AX8 Pro
AMD Ryzen 9 8945H, Radeon 780M
56505 Points +45%
Acemagic F2A
Intel Core Ultra 7 155H, Arc 8-Core
45718 Points +17%
Geekom GT1 Mega
Intel Core Ultra 9 185H, Arc 8-Core
38945 Points
Minisforum UH125 Pro
Intel Core Ultra 5 125H, Arc 7-Core
35321 Points -9%
Asus NUC 14 Pro
Intel Core Ultra 5 125H, Arc 7-Core
34225 Points -12%
Average of class Mini PC
  (1987 - 113499, n=119, last 2 years)
33863 Points -13%
Geekom GT13 Pro
Intel Core i9-13900H, Iris Xe G7 96EUs
29138 Points -25%
AIDA64 / CPU AES
Geekom AX8 Pro
AMD Ryzen 9 8945H, Radeon 780M
163032 MB/s +18%
Acemagic F2A
Intel Core Ultra 7 155H, Arc 8-Core
144741 MB/s +5%
Geekom GT1 Mega
Intel Core Ultra 9 185H, Arc 8-Core
138481 MB/s
Geekom GT13 Pro
Intel Core i9-13900H, Iris Xe G7 96EUs
102677 MB/s -26%
Average of class Mini PC
  (3691 - 325960, n=119, last 2 years)
88382 MB/s -36%
Minisforum UH125 Pro
Intel Core Ultra 5 125H, Arc 7-Core
65304 MB/s -53%
Asus NUC 14 Pro
Intel Core Ultra 5 125H, Arc 7-Core
64107 MB/s -54%
AIDA64 / CPU ZLib
Acemagic F2A
Intel Core Ultra 7 155H, Arc 8-Core
1183 MB/s 0%
Geekom GT1 Mega
Intel Core Ultra 9 185H, Arc 8-Core
1181 MB/s
Minisforum UH125 Pro
Intel Core Ultra 5 125H, Arc 7-Core
994 MB/s -16%
Geekom AX8 Pro
AMD Ryzen 9 8945H, Radeon 780M
976 MB/s -17%
Asus NUC 14 Pro
Intel Core Ultra 5 125H, Arc 7-Core
969 MB/s -18%
Geekom GT13 Pro
Intel Core i9-13900H, Iris Xe G7 96EUs
789 MB/s -33%
Average of class Mini PC
  (74.9 - 2039, n=119, last 2 years)
740 MB/s -37%
AIDA64 / FP64 Ray-Trace
Geekom AX8 Pro
AMD Ryzen 9 8945H, Radeon 780M
13609 KRay/s +72%
Acemagic F2A
Intel Core Ultra 7 155H, Arc 8-Core
9284 KRay/s +17%
Geekom GT1 Mega
Intel Core Ultra 9 185H, Arc 8-Core
7925 KRay/s
Minisforum UH125 Pro
Intel Core Ultra 5 125H, Arc 7-Core
7221 KRay/s -9%
Average of class Mini PC
  (350 - 26952, n=119, last 2 years)
6881 KRay/s -13%
Asus NUC 14 Pro
Intel Core Ultra 5 125H, Arc 7-Core
6786 KRay/s -14%
Geekom GT13 Pro
Intel Core i9-13900H, Iris Xe G7 96EUs
6205 KRay/s -22%
AIDA64 / CPU PhotoWorxx
Asus NUC 14 Pro
Intel Core Ultra 5 125H, Arc 7-Core
47377 MPixel/s +1%
Geekom GT1 Mega
Intel Core Ultra 9 185H, Arc 8-Core
47032 MPixel/s
Minisforum UH125 Pro
Intel Core Ultra 5 125H, Arc 7-Core
45789 MPixel/s -3%
Geekom AX8 Pro
AMD Ryzen 9 8945H, Radeon 780M
40114 MPixel/s -15%
Acemagic F2A
Intel Core Ultra 7 155H, Arc 8-Core
33092 MPixel/s -30%
Average of class Mini PC
  (4408 - 50500, n=119, last 2 years)
28301 MPixel/s -40%
Geekom GT13 Pro
Intel Core i9-13900H, Iris Xe G7 96EUs
28269 MPixel/s -40%

Cinebench R15 flerkärnig loop

En titt på Cinebench R15 multi-core continuous loop visar att de individuella resultaten är något sämre strax efter starten. I prestandajämförelsen räcker det fortfarande till en stabil andraplats.

Endast Acemagic F2A uppnår en genomgående högre prestanda. Geekom Geekom AX8 Pro kan inte upprätthålla den höga CPU-prestandan, vilket är anledningen till att den förlorar märkbart mer prestanda under ihållande belastning och halkar ner i mittfältet.

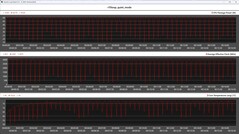
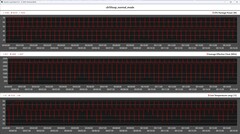
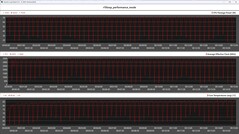
Av telemetridata från den kontinuerliga slingan Cinebench R15, som vi körde en gång med alla prestandalägen, framgår det att processorn når de inställda prestandagränserna.

CPU-mätvärden under Cinebench R15-loopen (tyst läge)
CPU-mätvärden under Cinebench R15-loopen (normalt läge)
CPU-mätvärden under Cinebench R15-loopen (prestandaläge)
01452904355807258701015116013051450159517401885203021752320246526102755Tooltip
Geekom GT1 Mega Intel Core Ultra 9 185H, Intel Core Ultra 9 185H: Ø2442 (2286.63-2795.05)
Geekom AX8 Pro AMD Ryzen 9 8945H, AMD Ryzen 9 8945H: Ø2223 (2100.4-2438.43)
Asus NUC 14 Pro Intel Core Ultra 5 125H, Intel Core Ultra 5 125H: Ø2021 (1900.15-2203.13)
Minisforum UH125 Pro Intel Core Ultra 5 125H, Intel Core Ultra 5 125H: Ø2186 (2040.4-2248.33)
Geekom GT13 Pro Intel Core i9-13900H, Intel Core i9-13900H: Ø1776 (1688.48-2326.12)
Acemagic F2A Intel Core Ultra 7 155H, Intel Core Ultra 7 155H: Ø2759 (2690.7-2800.92)

Systemets prestanda

Geekom GT1 Mega presterar utmärkt i systemtesterna. Med ett undantag kunde vårt testexemplar alltid säkra förstaplatsen. Detta återspeglar också vår subjektiva uppfattning av prestandan under testperioden.

Det fanns inga problem när det gäller prestanda, och inte ens installation av flera appar samtidigt ställde mini-datorn inför en omöjlig uppgift. Tack vare den generösa mängden RAM-minne kan många webbläsarflikar hanteras samtidigt.

PCMark 10 / Score
Geekom AX8 Pro, AMD Ryzen 9 8945H
AMD Radeon 780M, Acer N7000
7553 Points +4%
Geekom GT1 Mega, Intel Core Ultra 9 185H
Intel Arc 8-Core iGPU, Crucial P3 Plus CT2000P3PSSD8
7232 Points
Acemagic F2A, Intel Core Ultra 7 155H
Intel Arc 8-Core iGPU, Kingston OM8SEP1024Q-A0
7120 Points -2%
Asus NUC 14 Pro, Intel Core Ultra 5 125H
Intel Arc 7-Core iGPU, Kingston KC3000 2048G SKC3000D2048G
6282 Points -13%
Minisforum UH125 Pro, Intel Core Ultra 5 125H
Intel Arc 7-Core iGPU, Kingston OM8PGP41024Q-A0
6194 Points -14%
Geekom GT13 Pro, Intel Core i9-13900H
Intel Iris Xe Graphics G7 96EUs, Acer N7000
5944 Points -18%
PCMark 10 / Essentials
Geekom AX8 Pro, AMD Ryzen 9 8945H
AMD Radeon 780M, Acer N7000
11227 Points +4%
Acemagic F2A, Intel Core Ultra 7 155H
Intel Arc 8-Core iGPU, Kingston OM8SEP1024Q-A0
11125 Points +3%
Geekom GT1 Mega, Intel Core Ultra 9 185H
Intel Arc 8-Core iGPU, Crucial P3 Plus CT2000P3PSSD8
10824 Points
Geekom GT13 Pro, Intel Core i9-13900H
Intel Iris Xe Graphics G7 96EUs, Acer N7000
10347 Points -4%
Asus NUC 14 Pro, Intel Core Ultra 5 125H
Intel Arc 7-Core iGPU, Kingston KC3000 2048G SKC3000D2048G
10050 Points -7%
Minisforum UH125 Pro, Intel Core Ultra 5 125H
Intel Arc 7-Core iGPU, Kingston OM8PGP41024Q-A0
9427 Points -13%
PCMark 10 / Productivity
Geekom AX8 Pro, AMD Ryzen 9 8945H
AMD Radeon 780M, Acer N7000
10774 Points +22%
Acemagic F2A, Intel Core Ultra 7 155H
Intel Arc 8-Core iGPU, Kingston OM8SEP1024Q-A0
8901 Points +1%
Geekom GT1 Mega, Intel Core Ultra 9 185H
Intel Arc 8-Core iGPU, Crucial P3 Plus CT2000P3PSSD8
8797 Points
Minisforum UH125 Pro, Intel Core Ultra 5 125H
Intel Arc 7-Core iGPU, Kingston OM8PGP41024Q-A0
7715 Points -12%
Geekom GT13 Pro, Intel Core i9-13900H
Intel Iris Xe Graphics G7 96EUs, Acer N7000
7319 Points -17%
Asus NUC 14 Pro, Intel Core Ultra 5 125H
Intel Arc 7-Core iGPU, Kingston KC3000 2048G SKC3000D2048G
7042 Points -20%
CrossMark / Overall
Geekom GT1 Mega, Intel Core Ultra 9 185H
Intel Arc 8-Core iGPU, Crucial P3 Plus CT2000P3PSSD8
1888 Points
Geekom AX8 Pro, AMD Ryzen 9 8945H
AMD Radeon 780M, Acer N7000
1865 Points -1%
Acemagic F2A, Intel Core Ultra 7 155H
Intel Arc 8-Core iGPU, Kingston OM8SEP1024Q-A0
1802 Points -5%
Geekom GT13 Pro, Intel Core i9-13900H
Intel Iris Xe Graphics G7 96EUs, Acer N7000
1766 Points -6%
Minisforum UH125 Pro, Intel Core Ultra 5 125H
Intel Arc 7-Core iGPU, Kingston OM8PGP41024Q-A0
1533 Points -19%
Asus NUC 14 Pro, Intel Core Ultra 5 125H
Intel Arc 7-Core iGPU, Kingston KC3000 2048G SKC3000D2048G
1522 Points -19%
CrossMark / Responsiveness
Geekom GT1 Mega, Intel Core Ultra 9 185H
Intel Arc 8-Core iGPU, Crucial P3 Plus CT2000P3PSSD8
1864 Points
Geekom GT13 Pro, Intel Core i9-13900H
Intel Iris Xe Graphics G7 96EUs, Acer N7000
1790 Points -4%
Acemagic F2A, Intel Core Ultra 7 155H
Intel Arc 8-Core iGPU, Kingston OM8SEP1024Q-A0
1700 Points -9%
Geekom AX8 Pro, AMD Ryzen 9 8945H
AMD Radeon 780M, Acer N7000
1583 Points -15%
Minisforum UH125 Pro, Intel Core Ultra 5 125H
Intel Arc 7-Core iGPU, Kingston OM8PGP41024Q-A0
1332 Points -29%
Asus NUC 14 Pro, Intel Core Ultra 5 125H
Intel Arc 7-Core iGPU, Kingston KC3000 2048G SKC3000D2048G
1171 Points -37%
CrossMark / Creativity
Geekom AX8 Pro, AMD Ryzen 9 8945H
AMD Radeon 780M, Acer N7000
2057 Points +5%
Geekom GT1 Mega, Intel Core Ultra 9 185H
Intel Arc 8-Core iGPU, Crucial P3 Plus CT2000P3PSSD8
1959 Points
Acemagic F2A, Intel Core Ultra 7 155H
Intel Arc 8-Core iGPU, Kingston OM8SEP1024Q-A0
1929 Points -2%
Geekom GT13 Pro, Intel Core i9-13900H
Intel Iris Xe Graphics G7 96EUs, Acer N7000
1789 Points -9%
Asus NUC 14 Pro, Intel Core Ultra 5 125H
Intel Arc 7-Core iGPU, Kingston KC3000 2048G SKC3000D2048G
1765 Points -10%
Minisforum UH125 Pro, Intel Core Ultra 5 125H
Intel Arc 7-Core iGPU, Kingston OM8PGP41024Q-A0
1683 Points -14%
CrossMark / Productivity
Geekom GT1 Mega, Intel Core Ultra 9 185H
Intel Arc 8-Core iGPU, Crucial P3 Plus CT2000P3PSSD8
1827 Points
Geekom AX8 Pro, AMD Ryzen 9 8945H
AMD Radeon 780M, Acer N7000
1786 Points -2%
Geekom GT13 Pro, Intel Core i9-13900H
Intel Iris Xe Graphics G7 96EUs, Acer N7000
1736 Points -5%
Acemagic F2A, Intel Core Ultra 7 155H
Intel Arc 8-Core iGPU, Kingston OM8SEP1024Q-A0
1717 Points -6%
Minisforum UH125 Pro, Intel Core Ultra 5 125H
Intel Arc 7-Core iGPU, Kingston OM8PGP41024Q-A0
1463 Points -20%
Asus NUC 14 Pro, Intel Core Ultra 5 125H
Intel Arc 7-Core iGPU, Kingston KC3000 2048G SKC3000D2048G
1432 Points -22%
AIDA64 / Memory Copy
Geekom GT1 Mega
Intel Core Ultra 9 185H, Arc 8-Core
73624 MB/s
Minisforum UH125 Pro
Intel Core Ultra 5 125H, Arc 7-Core
69592 MB/s -5%
Asus NUC 14 Pro
Intel Core Ultra 5 125H, Arc 7-Core
69264 MB/s -6%
Geekom AX8 Pro
AMD Ryzen 9 8945H, Radeon 780M
68924 MB/s -6%
Acemagic F2A
Intel Core Ultra 7 155H, Arc 8-Core
62397 MB/s -15%
Average of class Mini PC
  (6481 - 89287, n=119, last 2 years)
48357 MB/s -34%
Geekom GT13 Pro
Intel Core i9-13900H, Iris Xe G7 96EUs
45721 MB/s -38%
AIDA64 / Memory Read
Geekom GT1 Mega
Intel Core Ultra 9 185H, Arc 8-Core
79371 MB/s
Asus NUC 14 Pro
Intel Core Ultra 5 125H, Arc 7-Core
74415 MB/s -6%
Minisforum UH125 Pro
Intel Core Ultra 5 125H, Arc 7-Core
72711 MB/s -8%
Acemagic F2A
Intel Core Ultra 7 155H, Arc 8-Core
64323 MB/s -19%
Geekom AX8 Pro
AMD Ryzen 9 8945H, Radeon 780M
61624 MB/s -22%
Average of class Mini PC
  (6914 - 99171, n=119, last 2 years)
49177 MB/s -38%
Geekom GT13 Pro
Intel Core i9-13900H, Iris Xe G7 96EUs
45995 MB/s -42%
AIDA64 / Memory Write
Geekom AX8 Pro
AMD Ryzen 9 8945H, Radeon 780M
87138 MB/s +21%
Asus NUC 14 Pro
Intel Core Ultra 5 125H, Arc 7-Core
72443 MB/s 0%
Geekom GT1 Mega
Intel Core Ultra 9 185H, Arc 8-Core
72187 MB/s
Minisforum UH125 Pro
Intel Core Ultra 5 125H, Arc 7-Core
71514 MB/s -1%
Acemagic F2A
Intel Core Ultra 7 155H, Arc 8-Core
65057 MB/s -10%
Average of class Mini PC
  (6862 - 98583, n=119, last 2 years)
52856 MB/s -27%
Geekom GT13 Pro
Intel Core i9-13900H, Iris Xe G7 96EUs
45733 MB/s -37%
AIDA64 / Memory Latency
Minisforum UH125 Pro
Intel Core Ultra 5 125H, Arc 7-Core
184.8 ns * -35%
Acemagic F2A
Intel Core Ultra 7 155H, Arc 8-Core
149 ns * -9%
Geekom GT1 Mega
Intel Core Ultra 9 185H, Arc 8-Core
136.7 ns *
Asus NUC 14 Pro
Intel Core Ultra 5 125H, Arc 7-Core
127.3 ns * +7%
Average of class Mini PC
  (44.9 - 184.8, n=119, last 2 years)
92.1 ns * +33%
Geekom AX8 Pro
AMD Ryzen 9 8945H, Radeon 780M
91.4 ns * +33%
Geekom GT13 Pro
Intel Core i9-13900H, Iris Xe G7 96EUs
75.8 ns * +45%

* ... smaller is better

NPU-prestanda

Intel Core Intel Core Ultra 9 185H är utrustad med en NPU (Neural Processing Unit), vilket gör att SoC:n kan beräkna AI-applikationer särskilt effektivt. För att illustrera prestandajämförelsen använder vi UL Procyon AI Interface Benchmark.

Alla jämförelseenheter är baserade på Intel Meteor Lake-processorer, vilket innebär att de alla använder samma NPU. Skillnaden mellan de enskilda konkurrenterna är mycket liten. Geekom GT1 Mega kommer ut på toppen med en liten marginal.

UL Procyon for Windows / Overall Score Integer NPU
Geekom GT1 Mega
Intel Core Ultra 9 185H, Arc 8-Core
529 Points
Asus NUC 14 Pro
Intel Core Ultra 5 125H, Arc 7-Core
508 Points -4%
Khadas Mind 2
Intel Core Ultra 7 155H, Arc 8-Core
504 Points -5%
Minisforum UH125 Pro
Intel Core Ultra 5 125H, Arc 7-Core
501 Points -5%
Acemagic F2A
Intel Core Ultra 7 155H, Arc 8-Core
499 Points -6%
UL Procyon for Windows / Overall Score Integer GPU
Acer Predator BiFrost Arc A770 OC, 16GB GDDR6
AMD Ryzen 9 7950X, Arc A770
1500 Points +87%
Acer Predator BiFrost Arc A750 OC
AMD Ryzen 9 7950X, Arc A750
1433 Points +79%
Geekom GT1 Mega
Intel Core Ultra 9 185H, Arc 8-Core
801 Points
Asus NUC 14 Pro
Intel Core Ultra 5 125H, Arc 7-Core
741 Points -7%
Khadas Mind 2
Intel Core Ultra 7 155H, Arc 8-Core
687 Points -14%
Acemagic F2A
Intel Core Ultra 7 155H, Arc 8-Core
684 Points -15%
Minisforum UH125 Pro
Intel Core Ultra 5 125H, Arc 7-Core
547 Points -32%

DPC-latenstider

Om man tittar på resultaten presterar Geekom GT1 Mega bättre än jämförelseenheterna. När vi surfar på Internet med Edge-webbläsaren dokumenterade vi inte någon ökad DPC-latens, vilket förändrades när vi spelade upp 4K-testvideon.

Dessa värden är dock inte extremt höga, vilket innebär att vår testenhet fortfarande levererar de bästa resultaten i jämförelsen.

Maximal fördröjning när flera webbläsarflikar öppnas
Maximal latenstid vid uppspelning av 4K-video
Maximal fördröjning efter tio sekunder med Prime95
Förare rangordnade efter längsta genomförandetid
DPC Latencies / LatencyMon - interrupt to process latency (max), Web, Youtube, Prime95
Asus NUC 14 Pro
Arc 7-Core, Ultra 5 125H, Kingston KC3000 2048G SKC3000D2048G
2776 μs * -142%
Acemagic F2A
Arc 8-Core, Ultra 7 155H, Kingston OM8SEP1024Q-A0
2724 μs * -138%
Geekom AX8 Pro
Radeon 780M, R9 8945H, Acer N7000
1856 μs * -62%
Geekom GT13 Pro
Iris Xe G7 96EUs, i9-13900H, Acer N7000
1533.4 μs * -34%
Minisforum UH125 Pro
Arc 7-Core, Ultra 5 125H, Kingston OM8PGP41024Q-A0
1438 μs * -26%
Geekom GT1 Mega
Arc 8-Core, Ultra 9 185H, Crucial P3 Plus CT2000P3PSSD8
1145.7 μs *

* ... smaller is better

Lagringsenheter

Crucial P3 Plus 2 TB SSD

Som redan nämnts flera gånger testar vi Geekom GT1 Mega i toppkonfigurationen. Detta innebär att modellen har en 2 TB SSD, som gör det möjligt att lagra mycket data.

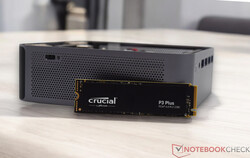
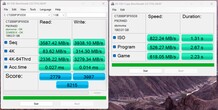
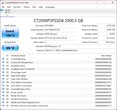
Mer exakt är det Crucial P3 Plus, som arbetar med PCIe 4.0 x4-hastigheter. Masslagringssystemet uppnådde fantastiska resultat i testet, med vår testenhet som förvisade alla sina konkurrenter till baksidan av förpackningen.

Crucial P3 Plus klarade också vårt stresstest med glans, så att inga prestandaförluster kan förväntas. Två SSD-enheter kan rymmas i Geekom GT1 Mega. Förutom den redan installerade SSD-enheten kan ytterligare en M.2 SSD-enhet installeras. Du måste dock vara uppmärksam på den totala längden på 42 mm. NVMe SATA SSD-enheter stöds tekniskt.

För ytterligare jämförelser och benchmarks, vänligen se vår SSD-jämförelsetabell.

AS SSD
AS SSD
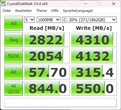
CDM 3
CDM 3
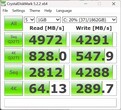
CDM 5
CDM 5
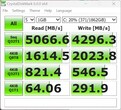
CDM 6
CDM 6
CDI
CDI
Crucial P3 Plus CT2000P3PSSD8
Sequential Read: 2822 MB/s
Sequential Write: 4310 MB/s
512K Read: 2054 MB/s
512K Write: 4132 MB/s
4K Read: 57.7 MB/s
4K Write: 315.4 MB/s
4K QD32 Read: 844 MB/s
4K QD32 Write: 550 MB/s
Drive Performance Rating - Percent
Geekom GT1 Mega
Crucial P3 Plus CT2000P3PSSD8
88.4 pt
Geekom GT13 Pro
Acer N7000
80.8 pt
Geekom AX8 Pro
Acer N7000
67.3 pt
Asus NUC 14 Pro
Kingston KC3000 2048G SKC3000D2048G
61.8 pt
Minisforum UH125 Pro
Kingston OM8PGP41024Q-A0
51.6 pt
Average of class Mini PC
 
50.2 pt
Acemagic F2A
Kingston OM8SEP1024Q-A0
48.4 pt
DiskSpd
seq read
Geekom GT13 Pro
Acer N7000
4357 (4314.26min - 4356.72max) MB/s +59%
Geekom AX8 Pro
Acer N7000
3921 (3897.31min - 3920.75max) MB/s +43%
Asus NUC 14 Pro
Kingston KC3000 2048G SKC3000D2048G
3706 (3594.04min - 3706.37max) MB/s +36%
Geekom GT1 Mega
Crucial P3 Plus CT2000P3PSSD8
2734 (2730.27min - 2734.25max) MB/s
Minisforum UH125 Pro
Kingston OM8PGP41024Q-A0
2351 (2320.68min - 2350.61max) MB/s -14%
Average of class Mini PC
  (277 - 4357, n=119, last 2 years)
2333 MB/s -15%
Acemagic F2A
Kingston OM8SEP1024Q-A0
1674 (1242.56min - 1673.54max) MB/s -39%
seq write
Geekom GT13 Pro
Acer N7000
4544 (4380.79min - 4543.83max) MB/s +14%
Geekom GT1 Mega
Crucial P3 Plus CT2000P3PSSD8
3976 (425.08min - 3975.57max) MB/s
Geekom AX8 Pro
Acer N7000
3791 (3695.18min - 3790.57max) MB/s -5%
Minisforum UH125 Pro
Kingston OM8PGP41024Q-A0
3331 (3244.92min - 3330.75max) MB/s -16%
Asus NUC 14 Pro
Kingston KC3000 2048G SKC3000D2048G
2928 (1958.53min - 2927.62max) MB/s -26%
Average of class Mini PC
  (229 - 5595, n=119, last 2 years)
2509 MB/s -37%
Acemagic F2A
Kingston OM8SEP1024Q-A0
1348 (1117.85min - 1347.87max) MB/s -66%
seq q8 t1 read
Asus NUC 14 Pro
Kingston KC3000 2048G SKC3000D2048G
7110 (6058.21min - 7110.02max) MB/s +41%
Geekom AX8 Pro
Acer N7000
7012 (5624.01min - 7012.25max) MB/s +39%
Geekom GT13 Pro
Acer N7000
7007 (6166.72min - 7006.62max) MB/s +38%
Geekom GT1 Mega
Crucial P3 Plus CT2000P3PSSD8
5060 (4781.3min - 5060.16max) MB/s
Minisforum UH125 Pro
Kingston OM8PGP41024Q-A0
4802 (4169.19min - 4801.68max) MB/s -5%
Average of class Mini PC
  (236 - 8430, n=119, last 2 years)
3790 MB/s -25%
Acemagic F2A
Kingston OM8SEP1024Q-A0
3194 (2810.81min - 3194.17max) MB/s -37%
seq q8 t1 write
Geekom AX8 Pro
Acer N7000
5685 (5389.6min - 5684.54max) MB/s +43%
Geekom GT13 Pro
Acer N7000
5261 (5018.9min - 5261.3max) MB/s +32%
Asus NUC 14 Pro
Kingston KC3000 2048G SKC3000D2048G
4712 (3064.99min - 4711.88max) MB/s +18%
Geekom GT1 Mega
Crucial P3 Plus CT2000P3PSSD8
3985 (52.74min - 3985.01max) MB/s
Minisforum UH125 Pro
Kingston OM8PGP41024Q-A0
3902 (3839.68min - 3901.75max) MB/s -2%
Average of class Mini PC
  (239 - 6669, n=119, last 2 years)
2810 MB/s -29%
Acemagic F2A
Kingston OM8SEP1024Q-A0
2212 (1222.43min - 2212.27max) MB/s -44%
4k q1 t1 read
Geekom GT13 Pro
Acer N7000
85.3 (82.57min - 85.32max) MB/s +36%
Geekom GT1 Mega
Crucial P3 Plus CT2000P3PSSD8
62.5 (62.22min - 62.52max) MB/s
Geekom AX8 Pro
Acer N7000
62.2 (61.55min - 62.23max) MB/s 0%
Minisforum UH125 Pro
Kingston OM8PGP41024Q-A0
60 (58.44min - 60.02max) MB/s -4%
Average of class Mini PC
  (6.85 - 86.6, n=119, last 2 years)
55.3 MB/s -12%
Asus NUC 14 Pro
Kingston KC3000 2048G SKC3000D2048G
53.4 (49.89min - 53.35max) MB/s -15%
Acemagic F2A
Kingston OM8SEP1024Q-A0
47.3 (47.07min - 47.31max) MB/s -24%
4k q1 t1 write
Geekom GT1 Mega
Crucial P3 Plus CT2000P3PSSD8
353 (348.24min - 353.16max) MB/s
Geekom GT13 Pro
Acer N7000
327 (306.06min - 326.78max) MB/s -7%
Average of class Mini PC
  (30.4 - 435, n=119, last 2 years)
196.9 MB/s -44%
Acemagic F2A
Kingston OM8SEP1024Q-A0
187.2 (181.54min - 187.2max) MB/s -47%
Geekom AX8 Pro
Acer N7000
187 (185.73min - 187.04max) MB/s -47%
Minisforum UH125 Pro
Kingston OM8PGP41024Q-A0
136.8 (131.56min - 136.81max) MB/s -61%
Asus NUC 14 Pro
Kingston KC3000 2048G SKC3000D2048G
83.1 (75.3min - 83.11max) MB/s -76%
4k q32 t16 read
Geekom GT13 Pro
Acer N7000
3593 (3380.17min - 3593.41max) MB/s +25%
Geekom GT1 Mega
Crucial P3 Plus CT2000P3PSSD8
2876 (2861.34min - 2875.92max) MB/s
Acemagic F2A
Kingston OM8SEP1024Q-A0
1824 (1239.47min - 1824.09max) MB/s -37%
Geekom AX8 Pro
Acer N7000
1644 (1568.76min - 1643.51max) MB/s -43%
Average of class Mini PC
  (26.1 - 4158, n=119, last 2 years)
1411 MB/s -51%
Asus NUC 14 Pro
Kingston KC3000 2048G SKC3000D2048G
731 (660.89min - 731.29max) MB/s -75%
Minisforum UH125 Pro
Kingston OM8PGP41024Q-A0
698 (691.89min - 697.84max) MB/s -76%
4k q32 t16 write
Geekom GT1 Mega
Crucial P3 Plus CT2000P3PSSD8
2822 (709.76min - 2821.52max) MB/s
Acemagic F2A
Kingston OM8SEP1024Q-A0
1434 (1410.26min - 1433.71max) MB/s -49%
Average of class Mini PC
  (32.6 - 4288, n=119, last 2 years)
1332 MB/s -53%
Geekom GT13 Pro
Acer N7000
762 (700.88min - 761.76max) MB/s -73%
Geekom AX8 Pro
Acer N7000
647 (598.22min - 647.4max) MB/s -77%
Minisforum UH125 Pro
Kingston OM8PGP41024Q-A0
311 (252.72min - 310.91max) MB/s -89%
Asus NUC 14 Pro
Kingston KC3000 2048G SKC3000D2048G
186.7 (155.05min - 186.74max) MB/s -93%
AS SSD
Score Total
Geekom GT1 Mega
Crucial P3 Plus CT2000P3PSSD8
8215 Points
Geekom GT13 Pro
Acer N7000
6798 Points -17%
Geekom AX8 Pro
Acer N7000
5512 Points -33%
Asus NUC 14 Pro
Kingston KC3000 2048G SKC3000D2048G
5131 Points -38%
Acemagic F2A
Kingston OM8SEP1024Q-A0
4412 Points -46%
Average of class Mini PC
  (211 - 10021, n=117, last 2 years)
4244 Points -48%
Minisforum UH125 Pro
Kingston OM8PGP41024Q-A0
3878 Points -53%
Score Read
Geekom GT13 Pro
Acer N7000
2866 Points +3%
Geekom GT1 Mega
Crucial P3 Plus CT2000P3PSSD8
2779 Points
Geekom AX8 Pro
Acer N7000
1793 Points -35%
Average of class Mini PC
  (76 - 3741, n=117, last 2 years)
1578 Points -43%
Acemagic F2A
Kingston OM8SEP1024Q-A0
1561 Points -44%
Asus NUC 14 Pro
Kingston KC3000 2048G SKC3000D2048G
1275 Points -54%
Minisforum UH125 Pro
Kingston OM8PGP41024Q-A0
1096 Points -61%
Score Write
Geekom GT1 Mega
Crucial P3 Plus CT2000P3PSSD8
3987 Points
Asus NUC 14 Pro
Kingston KC3000 2048G SKC3000D2048G
3313 Points -17%
Geekom AX8 Pro
Acer N7000
2896 Points -27%
Geekom GT13 Pro
Acer N7000
2516 Points -37%
Minisforum UH125 Pro
Kingston OM8PGP41024Q-A0
2306 Points -42%
Acemagic F2A
Kingston OM8SEP1024Q-A0
2082 Points -48%
Average of class Mini PC
  (88 - 4371, n=117, last 2 years)
1902 Points -52%
Seq Read
Asus NUC 14 Pro
Kingston KC3000 2048G SKC3000D2048G
5158 MB/s +44%
Geekom AX8 Pro
Acer N7000
4902 MB/s +37%
Geekom GT13 Pro
Acer N7000
4546 MB/s +27%
Minisforum UH125 Pro
Kingston OM8PGP41024Q-A0
3808 MB/s +6%
Geekom GT1 Mega
Crucial P3 Plus CT2000P3PSSD8
3587 MB/s
Average of class Mini PC
  (291 - 6620, n=117, last 2 years)
3231 MB/s -10%
Acemagic F2A
Kingston OM8SEP1024Q-A0
3010 MB/s -16%
Seq Write
Geekom GT1 Mega
Crucial P3 Plus CT2000P3PSSD8
3938 MB/s
Geekom GT13 Pro
Acer N7000
3374 MB/s -14%
Geekom AX8 Pro
Acer N7000
2835 MB/s -28%
Asus NUC 14 Pro
Kingston KC3000 2048G SKC3000D2048G
2646 MB/s -33%
Acemagic F2A
Kingston OM8SEP1024Q-A0
2369 MB/s -40%
Average of class Mini PC
  (242 - 5783, n=117, last 2 years)
2292 MB/s -42%
Minisforum UH125 Pro
Kingston OM8PGP41024Q-A0
1787 MB/s -55%
4K Read
Geekom GT1 Mega
Crucial P3 Plus CT2000P3PSSD8
83.6 MB/s
Geekom GT13 Pro
Acer N7000
83.4 MB/s 0%
Asus NUC 14 Pro
Kingston KC3000 2048G SKC3000D2048G
63.6 MB/s -24%
Average of class Mini PC
  (21.4 - 104.3, n=117, last 2 years)
59.7 MB/s -29%
Geekom AX8 Pro
Acer N7000
59.1 MB/s -29%
Minisforum UH125 Pro
Kingston OM8PGP41024Q-A0
57.3 MB/s -31%
Acemagic F2A
Kingston OM8SEP1024Q-A0
41.8 MB/s -50%
4K Write
Geekom GT1 Mega
Crucial P3 Plus CT2000P3PSSD8
314 MB/s
Geekom GT13 Pro
Acer N7000
296 MB/s -6%
Acemagic F2A
Kingston OM8SEP1024Q-A0
196.9 MB/s -37%
Minisforum UH125 Pro
Kingston OM8PGP41024Q-A0
182.1 MB/s -42%
Geekom AX8 Pro
Acer N7000
181.4 MB/s -42%
Average of class Mini PC
  (30.9 - 366, n=117, last 2 years)
177.5 MB/s -43%
Asus NUC 14 Pro
Kingston KC3000 2048G SKC3000D2048G
169.5 MB/s -46%
4K-64 Read
Geekom GT1 Mega
Crucial P3 Plus CT2000P3PSSD8
2336 MB/s
Geekom GT13 Pro
Acer N7000
2328 MB/s 0%
Geekom AX8 Pro
Acer N7000
1244 MB/s -47%
Acemagic F2A
Kingston OM8SEP1024Q-A0
1218 MB/s -48%
Average of class Mini PC
  (23.4 - 3220, n=117, last 2 years)
1195 MB/s -49%
Asus NUC 14 Pro
Kingston KC3000 2048G SKC3000D2048G
695 MB/s -70%
Minisforum UH125 Pro
Kingston OM8PGP41024Q-A0
658 MB/s -72%
4K-64 Write
Geekom GT1 Mega
Crucial P3 Plus CT2000P3PSSD8
3279 MB/s
Asus NUC 14 Pro
Kingston KC3000 2048G SKC3000D2048G
2878 MB/s -12%
Geekom AX8 Pro
Acer N7000
2431 MB/s -26%
Minisforum UH125 Pro
Kingston OM8PGP41024Q-A0
1945 MB/s -41%
Geekom GT13 Pro
Acer N7000
1883 MB/s -43%
Acemagic F2A
Kingston OM8SEP1024Q-A0
1649 MB/s -50%
Average of class Mini PC
  (32.8 - 3731, n=117, last 2 years)
1495 MB/s -54%
Access Time Read
Geekom GT13 Pro
Acer N7000
0.127 ms * -370%
Minisforum UH125 Pro
Kingston OM8PGP41024Q-A0
0.101 ms * -274%
Average of class Mini PC
  (0.022 - 0.489, n=117, last 2 years)
0.09579 ms * -255%
Geekom AX8 Pro
Acer N7000
0.079 ms * -193%
Asus NUC 14 Pro
Kingston KC3000 2048G SKC3000D2048G
0.053 ms * -96%
Acemagic F2A
Kingston OM8SEP1024Q-A0
0.046 ms * -70%
Geekom GT1 Mega
Crucial P3 Plus CT2000P3PSSD8
0.027 ms *
Access Time Write
Acemagic F2A
Kingston OM8SEP1024Q-A0
0.126 ms * -800%
Average of class Mini PC
  (0.014 - 0.765, n=117, last 2 years)
0.1133 ms * -709%
Geekom AX8 Pro
Acer N7000
0.064 ms * -357%
Geekom GT13 Pro
Acer N7000
0.059 ms * -321%
Asus NUC 14 Pro
Kingston KC3000 2048G SKC3000D2048G
0.043 ms * -207%
Minisforum UH125 Pro
Kingston OM8PGP41024Q-A0
0.024 ms * -71%
Geekom GT1 Mega
Crucial P3 Plus CT2000P3PSSD8
0.014 ms *

* ... smaller is better

Disk throttling: DiskSpd Read Loop, Queue Depth 8

036072010801440180021602520288032403600396043204680504054005760612064806840Tooltip
Geekom GT1 Mega Crucial P3 Plus CT2000P3PSSD8 ; diskspd 2.0.17 f: Ø5055 (4738.1-5067.7)
Geekom AX8 Pro Acer N7000; diskspd 2.0.17 f: Ø6996 (5972.7-7027.76)
Asus NUC 14 Pro Kingston KC3000 2048G SKC3000D2048G; diskspd 2.0.17 f: Ø6306 (1073.74-7111.48)
Minisforum UH125 Pro Kingston OM8PGP41024Q-A0; diskspd 2.0.17 f: Ø4790 (4223.81-4803.95)
Geekom GT13 Pro Acer N7000; diskspd 2.0.17 f: Ø5377 (3710.83-7006.62)
Acemagic F2A Kingston OM8SEP1024Q-A0; diskspd 2.0.17 f: Ø1320 (771.89-3141.95)

GPU-prestanda

3D-prestandan hos Geekom GT1 Mega tillhandahålls av Intel Arc 8-kärnig iGPU av Intel Core Ultra 9 185H. Resultatet är extremt positivt, eftersom GT1 Mega nästan alltid kan ta förstaplatsen även i denna disciplin.

Den annars kraftfulla AMD Radeon 780M kan ibland överträffas tydligt. Det är bara i renderingstesterna (SPECviewperf 2020) som iGPU från Intel inte är konkurrenskraftig och faller långt efter Geekom AX8 Pro i acceptans.

Ytterligare jämförelser och riktmärken finns i vår GPU-jämförelsetabell.

3DMark Performance Rating - Percent
Geekom GT1 Mega
Intel Arc 8-Core iGPU, Intel Core Ultra 9 185H
100 pt
Geekom AX8 Pro
AMD Radeon 780M, AMD Ryzen 9 8945H
90.6 pt
Asus NUC 14 Pro
Intel Arc 7-Core iGPU, Intel Core Ultra 5 125H
89.3 pt
Acemagic F2A
Intel Arc 8-Core iGPU, Intel Core Ultra 7 155H
89.3 pt
Minisforum UH125 Pro
Intel Arc 7-Core iGPU, Intel Core Ultra 5 125H
78.5 pt
Geekom GT13 Pro
Intel Iris Xe Graphics G7 96EUs, Intel Core i9-13900H
56.4 pt
3DMark 11 - 1280x720 Performance GPU
Geekom GT1 Mega
Intel Arc 8-Core iGPU, Intel Core Ultra 9 185H
13309 Points
Geekom AX8 Pro
AMD Radeon 780M, AMD Ryzen 9 8945H
13281 Points 0%
Acemagic F2A
Intel Arc 8-Core iGPU, Intel Core Ultra 7 155H
12085 Points -9%
Asus NUC 14 Pro
Intel Arc 7-Core iGPU, Intel Core Ultra 5 125H
11785 Points -11%
Minisforum UH125 Pro
Intel Arc 7-Core iGPU, Intel Core Ultra 5 125H
10303 Points -23%
Geekom GT13 Pro
Intel Iris Xe Graphics G7 96EUs, Intel Core i9-13900H
7424 Points -44%
3DMark
2560x1440 Time Spy Graphics
Geekom GT1 Mega
Intel Arc 8-Core iGPU, Intel Core Ultra 9 185H
3610 Points
Acemagic F2A
Intel Arc 8-Core iGPU, Intel Core Ultra 7 155H
3205 Points -11%
Asus NUC 14 Pro
Intel Arc 7-Core iGPU, Intel Core Ultra 5 125H
3205 Points -11%
Geekom AX8 Pro
AMD Radeon 780M, AMD Ryzen 9 8945H
2852 Points -21%
Minisforum UH125 Pro
Intel Arc 7-Core iGPU, Intel Core Ultra 5 125H
2796 Points -23%
Geekom GT13 Pro
Intel Iris Xe Graphics G7 96EUs, Intel Core i9-13900H
1690 Points -53%
1920x1080 Fire Strike Graphics
Geekom GT1 Mega
Intel Arc 8-Core iGPU, Intel Core Ultra 9 185H
8726 Points
Geekom AX8 Pro
AMD Radeon 780M, AMD Ryzen 9 8945H
8117 Points -7%
Asus NUC 14 Pro
Intel Arc 7-Core iGPU, Intel Core Ultra 5 125H
7900 Points -9%
Acemagic F2A
Intel Arc 8-Core iGPU, Intel Core Ultra 7 155H
7710 Points -12%
Minisforum UH125 Pro
Intel Arc 7-Core iGPU, Intel Core Ultra 5 125H
7047 Points -19%
Geekom GT13 Pro
Intel Iris Xe Graphics G7 96EUs, Intel Core i9-13900H
5812 Points -33%
Unigine Heaven 4.0
Extreme Preset OpenGL
Geekom GT1 Mega
Intel Arc 8-Core iGPU, Intel Core Ultra 9 185H
36.4 fps
Asus NUC 14 Pro
Intel Arc 7-Core iGPU, Intel Core Ultra 5 125H
33.3 fps -9%
Acemagic F2A
Intel Arc 8-Core iGPU, Intel Core Ultra 7 155H
31.6 fps -13%
Geekom AX8 Pro
AMD Radeon 780M, AMD Ryzen 9 8945H
30 fps -18%
Minisforum UH125 Pro
Intel Arc 7-Core iGPU, Intel Core Ultra 5 125H
29.6 fps -19%
Geekom GT13 Pro
Intel Iris Xe Graphics G7 96EUs, Intel Core i9-13900H
25.1 fps -31%
Extreme Preset DX11
Geekom GT1 Mega
Intel Arc 8-Core iGPU, Intel Core Ultra 9 185H
37.5 fps
Geekom AX8 Pro
AMD Radeon 780M, AMD Ryzen 9 8945H
36.4 fps -3%
Asus NUC 14 Pro
Intel Arc 7-Core iGPU, Intel Core Ultra 5 125H
34.5 fps -8%
Acemagic F2A
Intel Arc 8-Core iGPU, Intel Core Ultra 7 155H
32.7 fps -13%
Minisforum UH125 Pro
Intel Arc 7-Core iGPU, Intel Core Ultra 5 125H
31.5 fps -16%
Geekom GT13 Pro
Intel Iris Xe Graphics G7 96EUs, Intel Core i9-13900H
26 fps -31%
Unigine Valley 1.0
1920x1080 Extreme HD DirectX AA:x8
Geekom AX8 Pro
AMD Radeon 780M, AMD Ryzen 9 8945H
23.1 fps +15%
Geekom GT1 Mega
Intel Arc 8-Core iGPU, Intel Core Ultra 9 185H
20.1 fps
Asus NUC 14 Pro
Intel Arc 7-Core iGPU, Intel Core Ultra 5 125H
18.8 fps -6%
Acemagic F2A
Intel Arc 8-Core iGPU, Intel Core Ultra 7 155H
17.1 fps -15%
Minisforum UH125 Pro
Intel Arc 7-Core iGPU, Intel Core Ultra 5 125H
16.9 fps -16%
Geekom GT13 Pro
Intel Iris Xe Graphics G7 96EUs, Intel Core i9-13900H
15.1 fps -25%
1920x1080 Extreme HD Preset OpenGL AA:x8
Geekom GT1 Mega
Intel Arc 8-Core iGPU, Intel Core Ultra 9 185H
21.9 fps
Geekom AX8 Pro
AMD Radeon 780M, AMD Ryzen 9 8945H
20.6 fps -6%
Asus NUC 14 Pro
Intel Arc 7-Core iGPU, Intel Core Ultra 5 125H
20.2 fps -8%
Acemagic F2A
Intel Arc 8-Core iGPU, Intel Core Ultra 7 155H
18.3 fps -16%
Minisforum UH125 Pro
Intel Arc 7-Core iGPU, Intel Core Ultra 5 125H
18.3 fps -16%
Geekom GT13 Pro
Intel Iris Xe Graphics G7 96EUs, Intel Core i9-13900H
15.7 fps -28%
Unigine Superposition
1280x720 720p Low
Geekom GT1 Mega
Intel Arc 8-Core iGPU, Intel Core Ultra 9 185H
12451 Points
Geekom AX8 Pro
AMD Radeon 780M, AMD Ryzen 9 8945H
12232 Points -2%
Asus NUC 14 Pro
Intel Arc 7-Core iGPU, Intel Core Ultra 5 125H
10872 Points -13%
Acemagic F2A
Intel Arc 8-Core iGPU, Intel Core Ultra 7 155H
10491 Points -16%
Minisforum UH125 Pro
Intel Arc 7-Core iGPU, Intel Core Ultra 5 125H
10026 Points -19%
Geekom GT13 Pro
Intel Iris Xe Graphics G7 96EUs, Intel Core i9-13900H
6619 Points -47%
1920x1080 1080p High
Geekom GT1 Mega
Intel Arc 8-Core iGPU, Intel Core Ultra 9 185H
3948 Points
Asus NUC 14 Pro
Intel Arc 7-Core iGPU, Intel Core Ultra 5 125H
3609 Points -9%
Geekom AX8 Pro
AMD Radeon 780M, AMD Ryzen 9 8945H
3559 Points -10%
Acemagic F2A
Intel Arc 8-Core iGPU, Intel Core Ultra 7 155H
3391 Points -14%
Minisforum UH125 Pro
Intel Arc 7-Core iGPU, Intel Core Ultra 5 125H
3066 Points -22%
Geekom GT13 Pro
Intel Iris Xe Graphics G7 96EUs, Intel Core i9-13900H
2306 Points -42%
1920x1080 1080p Extreme
Geekom GT1 Mega
Intel Arc 8-Core iGPU, Intel Core Ultra 9 185H
2119 Points
Asus NUC 14 Pro
Intel Arc 7-Core iGPU, Intel Core Ultra 5 125H
1981 Points -7%
Acemagic F2A
Intel Arc 8-Core iGPU, Intel Core Ultra 7 155H
1920 Points -9%
Minisforum UH125 Pro
Intel Arc 7-Core iGPU, Intel Core Ultra 5 125H
1686 Points -20%
Geekom AX8 Pro
AMD Radeon 780M, AMD Ryzen 9 8945H
1649 Points -22%
Geekom GT13 Pro
Intel Iris Xe Graphics G7 96EUs, Intel Core i9-13900H
1124 Points -47%
ComputeMark v2.1
1024x600 Normal, Score
Geekom AX8 Pro
AMD Radeon 780M, AMD Ryzen 9 8945H
8595 Points +8%
Geekom GT1 Mega
Intel Arc 8-Core iGPU, Intel Core Ultra 9 185H
7963 Points
Acemagic F2A
Intel Arc 8-Core iGPU, Intel Core Ultra 7 155H
7480 Points -6%
Asus NUC 14 Pro
Intel Arc 7-Core iGPU, Intel Core Ultra 5 125H
6698 Points -16%
Minisforum UH125 Pro
Intel Arc 7-Core iGPU, Intel Core Ultra 5 125H
5613 Points -30%
Geekom GT13 Pro
Intel Iris Xe Graphics G7 96EUs, Intel Core i9-13900H
3650 Points -54%
1024x600 Normal, Fluid 3DTex
Geekom GT1 Mega
Intel Arc 8-Core iGPU, Intel Core Ultra 9 185H
492 Points
Asus NUC 14 Pro
Intel Arc 7-Core iGPU, Intel Core Ultra 5 125H
490 Points 0%
Geekom AX8 Pro
AMD Radeon 780M, AMD Ryzen 9 8945H
488 Points -1%
Minisforum UH125 Pro
Intel Arc 7-Core iGPU, Intel Core Ultra 5 125H
471 Points -4%
Acemagic F2A
Intel Arc 8-Core iGPU, Intel Core Ultra 7 155H
427 Points -13%
Geekom GT13 Pro
Intel Iris Xe Graphics G7 96EUs, Intel Core i9-13900H
286 Points -42%
1024x600 Normal, Fluid 2DTexArr
Geekom GT1 Mega
Intel Arc 8-Core iGPU, Intel Core Ultra 9 185H
487 Points
Asus NUC 14 Pro
Intel Arc 7-Core iGPU, Intel Core Ultra 5 125H
472 Points -3%
Minisforum UH125 Pro
Intel Arc 7-Core iGPU, Intel Core Ultra 5 125H
439 Points -10%
Geekom AX8 Pro
AMD Radeon 780M, AMD Ryzen 9 8945H
427 Points -12%
Acemagic F2A
Intel Arc 8-Core iGPU, Intel Core Ultra 7 155H
422 Points -13%
Geekom GT13 Pro
Intel Iris Xe Graphics G7 96EUs, Intel Core i9-13900H
294 Points -40%
1024x600 Normal, Mandel Vector
Geekom AX8 Pro
AMD Radeon 780M, AMD Ryzen 9 8945H
2362 Points +16%
Geekom GT1 Mega
Intel Arc 8-Core iGPU, Intel Core Ultra 9 185H
2039 Points
Acemagic F2A
Intel Arc 8-Core iGPU, Intel Core Ultra 7 155H
1961 Points -4%
Asus NUC 14 Pro
Intel Arc 7-Core iGPU, Intel Core Ultra 5 125H
1715 Points -16%
Minisforum UH125 Pro
Intel Arc 7-Core iGPU, Intel Core Ultra 5 125H
1447 Points -29%
Geekom GT13 Pro
Intel Iris Xe Graphics G7 96EUs, Intel Core i9-13900H
873 Points -57%
1024x600 Normal, Mandel Scalar
Geekom AX8 Pro
AMD Radeon 780M, AMD Ryzen 9 8945H
2449 Points +44%
Geekom GT1 Mega
Intel Arc 8-Core iGPU, Intel Core Ultra 9 185H
1701 Points
Acemagic F2A
Intel Arc 8-Core iGPU, Intel Core Ultra 7 155H
1594 Points -6%
Asus NUC 14 Pro
Intel Arc 7-Core iGPU, Intel Core Ultra 5 125H
1360 Points -20%
Minisforum UH125 Pro
Intel Arc 7-Core iGPU, Intel Core Ultra 5 125H
1112 Points -35%
Geekom GT13 Pro
Intel Iris Xe Graphics G7 96EUs, Intel Core i9-13900H
888 Points -48%
1024x600 Normal, QJuliaRayTrace
Geekom GT1 Mega
Intel Arc 8-Core iGPU, Intel Core Ultra 9 185H
3244 Points
Acemagic F2A
Intel Arc 8-Core iGPU, Intel Core Ultra 7 155H
3076 Points -5%
Geekom AX8 Pro
AMD Radeon 780M, AMD Ryzen 9 8945H
2868 Points -12%
Asus NUC 14 Pro
Intel Arc 7-Core iGPU, Intel Core Ultra 5 125H
2662 Points -18%
Minisforum UH125 Pro
Intel Arc 7-Core iGPU, Intel Core Ultra 5 125H
2143 Points -34%
Geekom GT13 Pro
Intel Iris Xe Graphics G7 96EUs, Intel Core i9-13900H
1310 Points -60%
LuxMark v2.0 64Bit
Room GPUs-only
Geekom AX8 Pro
AMD Radeon 780M, AMD Ryzen 9 8945H
1068 Samples/s +63%
Asus NUC 14 Pro
Intel Arc 7-Core iGPU, Intel Core Ultra 5 125H
801 Samples/s +22%
Minisforum UH125 Pro
Intel Arc 7-Core iGPU, Intel Core Ultra 5 125H
710 Samples/s +8%
Geekom GT1 Mega
Intel Arc 8-Core iGPU, Intel Core Ultra 9 185H
656 Samples/s
Geekom GT13 Pro
Intel Iris Xe Graphics G7 96EUs, Intel Core i9-13900H
651 Samples/s -1%
Acemagic F2A
Intel Arc 8-Core iGPU, Intel Core Ultra 7 155H
549 Samples/s -16%
Sala GPUs-only
Geekom GT1 Mega
Intel Arc 8-Core iGPU, Intel Core Ultra 9 185H
2888 Samples/s
Asus NUC 14 Pro
Intel Arc 7-Core iGPU, Intel Core Ultra 5 125H
2807 Samples/s -3%
Minisforum UH125 Pro
Intel Arc 7-Core iGPU, Intel Core Ultra 5 125H
2517 Samples/s -13%
Acemagic F2A
Intel Arc 8-Core iGPU, Intel Core Ultra 7 155H
2319 Samples/s -20%
Geekom AX8 Pro
AMD Radeon 780M, AMD Ryzen 9 8945H
2218 Samples/s -23%
Geekom GT13 Pro
Intel Iris Xe Graphics G7 96EUs, Intel Core i9-13900H
2104 Samples/s -27%
Affinity Photo 2 - Combined (Single / Multi GPU)
Geekom GT1 Mega
Intel Arc 8-Core iGPU, Intel Core Ultra 9 185H
6468 Points
Minisforum UH125 Pro
Intel Arc 7-Core iGPU, Intel Core Ultra 5 125H
5244 Points -19%
Asus NUC 14 Pro
Intel Arc 7-Core iGPU, Intel Core Ultra 5 125H
5105 Points -21%
Acemagic F2A
Intel Arc 8-Core iGPU, Intel Core Ultra 7 155H
4928 Points -24%
Geekom GT13 Pro
Intel Iris Xe Graphics G7 96EUs, Intel Core i9-13900H
4460 Points -31%
Geekom AX8 Pro
AMD Radeon 780M, AMD Ryzen 9 8945H
1831 Points -72%
Geekom GT1 Mega, Intel Arc 8-Core iGPU
Ultra 9 185H
Geekom AX8 Pro, AMD Radeon 780M
R9 8945H
Asus NUC 14 Pro, Intel Arc 7-Core iGPU
Ultra 5 125H
Minisforum UH125 Pro, Intel Arc 7-Core iGPU
Ultra 5 125H
Geekom GT13 Pro, Intel Iris Xe Graphics G7 96EUs
i9-13900H
Acemagic F2A, Intel Arc 8-Core iGPU
Ultra 7 155H
Average of class Mini PC
 
SPECviewperf 2020
223%
-13%
-19%
-27%
-13%
129%
3840x2160 Medical (medical-03)
7.07
12.8
81%
5.87
-17%
4.8
-32%
2.69
-62%
5.05
-29%
3840x2160 Energy (energy-03)
5
13.3
166%
3.81
-24%
3.38
-32%
3.17
-37%
4.61
-8%
3840x2160 Creo (creo-03)
19.8
35.3
78%
15.3
-23%
15.4
-22%
16.3
-18%
17.9
-10%
3840x2160 CATIA (catia-06)
11.7
25.1
115%
10.4
-11%
9.7
-17%
8.53
-27%
10
-15%
3840x2160 3ds Max (3dsmax-07)
15.5
21.1
36%
14.5
-6%
13.2
-15%
10.3
-34%
12.9
-17%
3840x2160 Siemens NX (snx-04)
5.68
65.7
1057%
5.82
2%
5.54
-2%
6.62
17%
5.7
0%
3840x2160 Maya (maya-06)
38.8
49.6
28%
34.7
-11%
32.8
-15%
27.3
-30%
35.4
-9%
3DMark 05 Standard
53214 poäng
3DMark 06 Standard Score
38204 poäng
3DMark Vantage P Result
43259 poäng
3DMark 11 Performance
13104 poäng
3DMark Ice Storm Standard Score
145222 poäng
3DMark Cloud Gate Standard Score
35142 poäng
3DMark Fire Strike Score
7968 poäng
3DMark Fire Strike Extreme Score
4087 poäng
3DMark Time Spy Score
3984 poäng
3DMark Steel Nomad Score
781 poäng
3DMark Steel Nomad Light Score
3222 poäng
Hjälp

Prestanda för spel

De utmärkta resultaten av Intel Arc 8-kärnig iGPU i syntetiska benchmarks återspeglas tyvärr inte i speltesterna. Geekom GT1 Mega faller mycket tydligt bakom Geekom AX8 Pro.

För AMD Radeon 780M levererar också bara begränsad spelprestanda, vilket åtföljs av begränsningar i praktiken. I allmänhet levererar dock Intel Arc 8-Core iGPU tillräcklig prestanda när det gäller äldre eller mindre krävande titlar.

För en detaljerad översikt över iGPU:ns prestanda jämfört med andra grafikkort, se vår GPU-spellista.

GTA V
1024x768 Lowest Settings possible
Geekom AX8 Pro
Radeon 780M, R9 8945H, Acer N7000
169.4 (3.69min, 125P1) fps +3%
Geekom GT1 Mega
Arc 8-Core, Ultra 9 185H, Crucial P3 Plus CT2000P3PSSD8
165.2 (3.77min, 100P1) fps
Acemagic F2A
Arc 8-Core, Ultra 7 155H, Kingston OM8SEP1024Q-A0
161 (4.76min, 100P1) fps -3%
Asus NUC 14 Pro
Arc 7-Core, Ultra 5 125H, Kingston KC3000 2048G SKC3000D2048G
156.3 (4.92min, 90.9P1) fps -5%
Minisforum UH125 Pro
Arc 7-Core, Ultra 5 125H, Kingston OM8PGP41024Q-A0
132.4 (4.93min, 90.9P1) fps -20%
Geekom GT13 Pro
Iris Xe G7 96EUs, i9-13900H, Acer N7000
119.7 (7.51min, 66.7P1) fps -28%
1920x1080 High/On (Advanced Graphics Off) AA:2xMSAA + FX AF:8x
Geekom AX8 Pro
Radeon 780M, R9 8945H, Acer N7000
65.9 (2.44min, 41.7P1) fps +51%
Geekom GT1 Mega
Arc 8-Core, Ultra 9 185H, Crucial P3 Plus CT2000P3PSSD8
43.5 (3.49min, 32.3P1) fps
Asus NUC 14 Pro
Arc 7-Core, Ultra 5 125H, Kingston KC3000 2048G SKC3000D2048G
39.9 (3.1min, 29.4P1) fps -8%
Minisforum UH125 Pro
Arc 7-Core, Ultra 5 125H, Kingston OM8PGP41024Q-A0
38.9 (3.15min, 28.6P1) fps -11%
Acemagic F2A
Arc 8-Core, Ultra 7 155H, Kingston OM8SEP1024Q-A0
31.3 (2.94min, 22.7P1) fps -28%
Geekom GT13 Pro
Iris Xe G7 96EUs, i9-13900H, Acer N7000
22 (6.3min, 16.4P1) fps -49%
Dota 2 Reborn
1280x720 min (0/3) fastest
Geekom AX8 Pro
Radeon 780M, R9 8945H, Acer N7000
157.5 (136min) fps +43%
Geekom GT1 Mega
Arc 8-Core, Ultra 9 185H, Crucial P3 Plus CT2000P3PSSD8
110.5 (63min) fps
Geekom GT13 Pro
Iris Xe G7 96EUs, i9-13900H, Acer N7000
109.8 (85min) fps -1%
Acemagic F2A
Arc 8-Core, Ultra 7 155H, Kingston OM8SEP1024Q-A0
103.2 (59.8min) fps -7%
Asus NUC 14 Pro
Arc 7-Core, Ultra 5 125H, Kingston KC3000 2048G SKC3000D2048G
97.1 (61.8min) fps -12%
Minisforum UH125 Pro
Arc 7-Core, Ultra 5 125H, Kingston OM8PGP41024Q-A0
95.5 (63.7min) fps -14%
1920x1080 high (2/3)
Geekom AX8 Pro
Radeon 780M, R9 8945H, Acer N7000
88 (69.2min) fps 0%
Geekom GT1 Mega
Arc 8-Core, Ultra 9 185H, Crucial P3 Plus CT2000P3PSSD8
87.8 (28.3min) fps
Acemagic F2A
Arc 8-Core, Ultra 7 155H, Kingston OM8SEP1024Q-A0
77.3 (52.5min) fps -12%
Asus NUC 14 Pro
Arc 7-Core, Ultra 5 125H, Kingston KC3000 2048G SKC3000D2048G
75.9 (45.7min) fps -14%
Minisforum UH125 Pro
Arc 7-Core, Ultra 5 125H, Kingston OM8PGP41024Q-A0
73.6 (47.5min) fps -16%
Geekom GT13 Pro
Iris Xe G7 96EUs, i9-13900H, Acer N7000
65.5 (56.1min) fps -25%
Cyberpunk 2077 2.1 Phantom Liberty
1920x1080 Low Preset (FSR off)
Geekom AX8 Pro
Radeon 780M, R9 8945H, Acer N7000
41.3 (34.5min) fps +9%
Geekom GT1 Mega
Arc 8-Core, Ultra 9 185H, Crucial P3 Plus CT2000P3PSSD8
38 (33.3min) fps
Asus NUC 14 Pro
Arc 7-Core, Ultra 5 125H, Kingston KC3000 2048G SKC3000D2048G
30.1 (25.8min) fps -21%
Acemagic F2A
Arc 8-Core, Ultra 7 155H, Kingston OM8SEP1024Q-A0
29.5 (24.1min) fps -22%
Minisforum UH125 Pro
Arc 7-Core, Ultra 5 125H, Kingston OM8PGP41024Q-A0
29.5 (25.4min) fps -22%
Geekom GT13 Pro
Iris Xe G7 96EUs, i9-13900H, Acer N7000
18.2 (14.7min) fps -52%
1920x1080 High Preset (FSR off)
Geekom GT1 Mega
Arc 8-Core, Ultra 9 185H, Crucial P3 Plus CT2000P3PSSD8
26 (22.6min) fps
Geekom AX8 Pro
Radeon 780M, R9 8945H, Acer N7000
25.8 (21.7min) fps -1%
Asus NUC 14 Pro
Arc 7-Core, Ultra 5 125H, Kingston KC3000 2048G SKC3000D2048G
21.7 (18.8min) fps -17%
Minisforum UH125 Pro
Arc 7-Core, Ultra 5 125H, Kingston OM8PGP41024Q-A0
20.6 (17.9min) fps -21%
Acemagic F2A
Arc 8-Core, Ultra 7 155H, Kingston OM8SEP1024Q-A0
20.4 (13.8min) fps -22%
Geekom GT13 Pro
Iris Xe G7 96EUs, i9-13900H, Acer N7000
12.8 (10.9min) fps -51%
Baldur's Gate 3
1280x720 Low Preset
Geekom AX8 Pro
Radeon 780M, R9 8945H, Acer N7000
60.8 (21.6min, 28.1P0.1, 35.6P1) fps +6%
Geekom GT1 Mega
Arc 8-Core, Ultra 9 185H, Crucial P3 Plus CT2000P3PSSD8
57.6 (31.7min, 33.6P0.1, 37.9P1) fps
Asus NUC 14 Pro
Arc 7-Core, Ultra 5 125H, Kingston KC3000 2048G SKC3000D2048G
50.2 (27.7min, 29.7P0.1, 32.6P1) fps -13%
Minisforum UH125 Pro
Arc 7-Core, Ultra 5 125H, Kingston OM8PGP41024Q-A0
45 (14.9min, 19.4P0.1, 29P1) fps -22%
Geekom GT13 Pro
Iris Xe G7 96EUs, i9-13900H, Acer N7000
26.2 (4.4min, 7.02P0.1, 18.4P1) fps -55%
1920x1080 High Preset
Geekom GT1 Mega
Arc 8-Core, Ultra 9 185H, Crucial P3 Plus CT2000P3PSSD8
25.4 (13.9min, 14.3P0.1, 16.3P1) fps
Geekom AX8 Pro
Radeon 780M, R9 8945H, Acer N7000
24.5 (17.7min, 17.7P0.1, 19.8P1) fps -4%
Asus NUC 14 Pro
Arc 7-Core, Ultra 5 125H, Kingston KC3000 2048G SKC3000D2048G
22.4 (14min, 14.2P0.1, 15.3P1) fps -12%
Minisforum UH125 Pro
Arc 7-Core, Ultra 5 125H, Kingston OM8PGP41024Q-A0
19.5 (9.2min, 10.4P0.1, 12.7P1) fps -23%
Geekom GT13 Pro
Iris Xe G7 96EUs, i9-13900H, Acer N7000
11.7 (3.43min, 3.51P0.1, 3.99P1) fps -54%
F1 24
1920x1080 Low Preset AA:T AF:16x
Geekom GT1 Mega
Arc 8-Core, Ultra 9 185H, Crucial P3 Plus CT2000P3PSSD8
84.3 (70min, 66P1) fps
Geekom AX8 Pro
Radeon 780M, R9 8945H, Acer N7000
83.4 (28min, 33P1) fps -1%
Asus NUC 14 Pro
Arc 7-Core, Ultra 5 125H, Kingston KC3000 2048G SKC3000D2048G
66.2 (56min, 54P1) fps -21%
Minisforum UH125 Pro
Arc 7-Core, Ultra 5 125H, Kingston OM8PGP41024Q-A0
64.3 (55min, 53P1) fps -24%
Geekom GT13 Pro
Iris Xe G7 96EUs, i9-13900H, Acer N7000
40.4 (34min, 33P1) fps -52%
1920x1080 High Preset AA:T AF:16x
Geekom GT1 Mega
Arc 8-Core, Ultra 9 185H, Crucial P3 Plus CT2000P3PSSD8
54.8 (43min, 45P1) fps
Geekom AX8 Pro
Radeon 780M, R9 8945H, Acer N7000
51.3 (23min, 15P1) fps -6%
Asus NUC 14 Pro
Arc 7-Core, Ultra 5 125H, Kingston KC3000 2048G SKC3000D2048G
43.4 (34min, 35P1) fps -21%
Minisforum UH125 Pro
Arc 7-Core, Ultra 5 125H, Kingston OM8PGP41024Q-A0
41.7 (34min, 34P1) fps -24%
Geekom GT13 Pro
Iris Xe G7 96EUs, i9-13900H, Acer N7000
25.6 (22min, 21P1) fps -53%

FPS-Diagramm - 30 Min. Cyberpunk 2077 1.920 x 1.080 Ultra Preset (FSR off)

05101520Tooltip
Geekom GT1 Mega Ultra 9 185H, Arc 8-Core: Ø22.1 (18.6-24)
Geekom AX8 Pro R9 8945H, Radeon 780M: Ø19.2 (17.9-20.3)
Asus NUC 14 Pro Ultra 5 125H, Arc 7-Core: Ø18.5 (12.6-20.7)
Geekom GT13 Pro i9-13900H, Iris Xe G7 96EUs: Ø11.1 (5.97-12.3)
lågmed.högultra
GTA V (2015) 165.2 151.8 43.5 16.6
Dota 2 Reborn (2015) 110.5 62.8 87.8 45.5
Final Fantasy XV Benchmark (2018) 79.2 41 28.9
X-Plane 11.11 (2018) 66.4 52.1 42.3
Baldur's Gate 3 (2023) 39.3 30.3 25.4 25.2
Cyberpunk 2077 2.1 Phantom Liberty (2023) 38 31.4 26 23.3
F1 24 (2024) 84.3 73.8 54.8

Geekom GT1 Mega prestandakontroll med en Nvidia GeForce RTX 4090

GPU-Z
GPU-Z

Geekom GT1 Mega gör det möjligt att använda externa grafiklösningar via USB4 tack vare dess anslutningsmöjligheter. En viktig punkt är bandbreddsbegränsningen, vilket innebär att ett externt grafikkort endast fungerar med PCIe 3.0 x4-hastighet via en USB4-anslutning.

I kombination med ett Nvidia GeForce RTX 4090 har vi utfört några benchmarks för att visa den prestandaökning som kan förväntas med det snabbaste konsumentgrafikkortet som finns tillgängligt för närvarande.

I princip kan 3D-prestandan ökas märkbart jämfört med iGPU. Jämförelsevis levererar kombinationen med Geekom GT1 Mega något mer prestanda än mini-PC:n från Khadas.

Jämfört med Minisforum MS-A1 måste vårt testprov dock erkänna sig besegrat. Den tekniska nackdelen med USB4-anslutningen jämfört med ett OCuLink-gränssnitt är tydligt synlig här. Ett OCuLink-gränssnitt erbjuder PCIe 4.0 x4-hastighet, vilket motsvarar en fördubbling av bandbredden.

Performance Rating - Percent
AMD Ryzen 5 9600X
AMD Ryzen 5 9600X
98.7 pt
Intel Core i5-14600K
96.9 pt
Minisforum MS-A1 (Nvidia GeForce RTX 4090 @OCuLink)
AMD Ryzen 7 8700G
88.1 pt
Geekom GT1 Mega (Nvidia GeForce RTX 4090 @USB4)
Intel Core Ultra 9 185H
78.6 pt
Khadas Mind 2 (Nvidia GeForce RTX 4090 @USB4)
Intel Core Ultra 7 155H
75 pt
3DMark 11 - 1280x720 Performance GPU
Intel Core i5-14600K
110994 Points +734%
AMD Ryzen 5 9600X
AMD Ryzen 5 9600X
104516 Points +685%
Minisforum MS-A1 (Nvidia GeForce RTX 4090 @OCuLink)
AMD Ryzen 7 8700G
98454 Points +640%
Geekom GT1 Mega (Nvidia GeForce RTX 4090 @USB4)
Intel Core Ultra 9 185H
64648 Points +386%
Khadas Mind 2 (Nvidia GeForce RTX 4090 @USB4)
Intel Core Ultra 7 155H
62498 Points +370%

13309 Points
3DMark
2560x1440 Time Spy Graphics
Intel Core i5-14600K
37769 Points +946%
AMD Ryzen 5 9600X
AMD Ryzen 5 9600X
37161 Points +929%
Minisforum MS-A1 (Nvidia GeForce RTX 4090 @OCuLink)
AMD Ryzen 7 8700G
34984 Points +869%
Geekom GT1 Mega (Nvidia GeForce RTX 4090 @USB4)
Intel Core Ultra 9 185H
28844 Points +699%
Khadas Mind 2 (Nvidia GeForce RTX 4090 @USB4)
Intel Core Ultra 7 155H
23140 Points +541%

3610 Points
1920x1080 Fire Strike Graphics
Intel Core i5-14600K
86031 Points +886%
AMD Ryzen 5 9600X
AMD Ryzen 5 9600X
78579 Points +801%
Minisforum MS-A1 (Nvidia GeForce RTX 4090 @OCuLink)
AMD Ryzen 7 8700G
76191 Points +773%
Geekom GT1 Mega (Nvidia GeForce RTX 4090 @USB4)
Intel Core Ultra 9 185H
53367 Points +512%
Khadas Mind 2 (Nvidia GeForce RTX 4090 @USB4)
Intel Core Ultra 7 155H
40417 Points +363%

8726 Points
3840x2160 Fire Strike Ultra Graphics
Intel Core i5-14600K
25342 Points +1150%
AMD Ryzen 5 9600X
AMD Ryzen 5 9600X
24915 Points +1129%
Minisforum MS-A1 (Nvidia GeForce RTX 4090 @OCuLink)
AMD Ryzen 7 8700G
23565 Points +1062%
Geekom GT1 Mega (Nvidia GeForce RTX 4090 @USB4)
Intel Core Ultra 9 185H
21506 Points +960%
Khadas Mind 2 (Nvidia GeForce RTX 4090 @USB4)
Intel Core Ultra 7 155H
17047 Points +741%

2028 Points
Unigine Superposition
1280x720 720p Low
AMD Ryzen 5 9600X
AMD Ryzen 5 9600X
63603 Points +411%
Intel Core i5-14600K
49203 Points +295%
Minisforum MS-A1 (Nvidia GeForce RTX 4090 @OCuLink)
AMD Ryzen 7 8700G
35453 Points +185%
Geekom GT1 Mega (Nvidia GeForce RTX 4090 @USB4)
Intel Core Ultra 9 185H
33318 Points +168%
Khadas Mind 2 (Nvidia GeForce RTX 4090 @USB4)
Intel Core Ultra 7 155H
28104 Points +126%

12451 Points
1920x1080 1080p High
AMD Ryzen 5 9600X
AMD Ryzen 5 9600X
50230 Points +1172%
Intel Core i5-14600K
45162 Points +1044%
Minisforum MS-A1 (Nvidia GeForce RTX 4090 @OCuLink)
AMD Ryzen 7 8700G
32728 Points +729%
Geekom GT1 Mega (Nvidia GeForce RTX 4090 @USB4)
Intel Core Ultra 9 185H
30115 Points +663%
Khadas Mind 2 (Nvidia GeForce RTX 4090 @USB4)
Intel Core Ultra 7 155H
26890 Points +581%

3948 Points
1920x1080 1080p Extreme
Intel Core i5-14600K
21954 Points +936%
AMD Ryzen 5 9600X
AMD Ryzen 5 9600X
21586 Points +919%
Minisforum MS-A1 (Nvidia GeForce RTX 4090 @OCuLink)
AMD Ryzen 7 8700G
20934 Points +888%
Geekom GT1 Mega (Nvidia GeForce RTX 4090 @USB4)
Intel Core Ultra 9 185H
19915 Points +840%
Khadas Mind 2 (Nvidia GeForce RTX 4090 @USB4)
Intel Core Ultra 7 155H
19877 Points +838%

2119 Points
3840x2160 4k Optimized
Intel Core i5-14600K
33700 Points
AMD Ryzen 5 9600X
AMD Ryzen 5 9600X
33095 Points
Minisforum MS-A1 (Nvidia GeForce RTX 4090 @OCuLink)
AMD Ryzen 7 8700G
30190 Points
Geekom GT1 Mega (Nvidia GeForce RTX 4090 @USB4)
Intel Core Ultra 9 185H
27686 Points
Khadas Mind 2 (Nvidia GeForce RTX 4090 @USB4)
Intel Core Ultra 7 155H
25802 Points
7680x4320 8k Optimized
Intel Core i5-14600K
12791 Points
AMD Ryzen 5 9600X
AMD Ryzen 5 9600X
12498 Points
Minisforum MS-A1 (Nvidia GeForce RTX 4090 @OCuLink)
AMD Ryzen 7 8700G
12251 Points
Geekom GT1 Mega (Nvidia GeForce RTX 4090 @USB4)
Intel Core Ultra 9 185H
12132 Points
Khadas Mind 2 (Nvidia GeForce RTX 4090 @USB4)
Intel Core Ultra 7 155H
12050 Points
Unigine Valley 1.0
1920x1080 Extreme HD DirectX AA:x8
AMD Ryzen 5 9600X
AMD Ryzen 5 9600X
324 fps +1512%
Intel Core i5-14600K
283.4 fps +1310%
Minisforum MS-A1 (Nvidia GeForce RTX 4090 @OCuLink)
AMD Ryzen 7 8700G
216.1 fps +975%
Geekom GT1 Mega (Nvidia GeForce RTX 4090 @USB4)
Intel Core Ultra 9 185H
208.7 fps +938%
Khadas Mind 2 (Nvidia GeForce RTX 4090 @USB4)
Intel Core Ultra 7 155H
187.1 fps +831%

20.1 fps
1920x1080 Extreme HD Preset OpenGL AA:x8
AMD Ryzen 5 9600X
AMD Ryzen 5 9600X
331.8 fps +1415%
Intel Core i5-14600K
303.2 fps +1284%
Minisforum MS-A1 (Nvidia GeForce RTX 4090 @OCuLink)
AMD Ryzen 7 8700G
231.7 fps +958%
Geekom GT1 Mega (Nvidia GeForce RTX 4090 @USB4)
Intel Core Ultra 9 185H
224.4 fps +925%
Khadas Mind 2 (Nvidia GeForce RTX 4090 @USB4)
Intel Core Ultra 7 155H
200.5 fps +816%

21.9 fps
Unigine Heaven 4.0
Extreme Preset OpenGL
AMD Ryzen 5 9600X
AMD Ryzen 5 9600X
472.4 fps +1198%
Intel Core i5-14600K
456.3 fps +1154%
Minisforum MS-A1 (Nvidia GeForce RTX 4090 @OCuLink)
AMD Ryzen 7 8700G
441.5 fps +1113%
Geekom GT1 Mega (Nvidia GeForce RTX 4090 @USB4)
Intel Core Ultra 9 185H
386.5 fps +962%
Khadas Mind 2 (Nvidia GeForce RTX 4090 @USB4)
Intel Core Ultra 7 155H
372.8 fps +924%

36.4 fps
Extreme Preset DX11
AMD Ryzen 5 9600X
AMD Ryzen 5 9600X
473.9 fps +1164%
Intel Core i5-14600K
473 fps +1161%
Minisforum MS-A1 (Nvidia GeForce RTX 4090 @OCuLink)
AMD Ryzen 7 8700G
422.3 fps +1026%
Khadas Mind 2 (Nvidia GeForce RTX 4090 @USB4)
Intel Core Ultra 7 155H
344.6 fps +819%
Geekom GT1 Mega (Nvidia GeForce RTX 4090 @USB4)
Intel Core Ultra 9 185H
343 fps +815%

37.5 fps
ComputeMark v2.1
1024x600 Normal, Score
Intel Core i5-14600K
92397 Points +1060%
AMD Ryzen 5 9600X
AMD Ryzen 5 9600X
92222 Points +1058%
Minisforum MS-A1 (Nvidia GeForce RTX 4090 @OCuLink)
AMD Ryzen 7 8700G
90882 Points +1041%
Khadas Mind 2 (Nvidia GeForce RTX 4090 @USB4)
Intel Core Ultra 7 155H
86314 Points +984%
Geekom GT1 Mega (Nvidia GeForce RTX 4090 @USB4)
Intel Core Ultra 9 185H
83349 Points +947%

7963 Points
1024x600 Normal, Fluid 3DTex
Intel Core i5-14600K
10797 Points +2095%
AMD Ryzen 5 9600X
AMD Ryzen 5 9600X
10756 Points +2086%
Minisforum MS-A1 (Nvidia GeForce RTX 4090 @OCuLink)
AMD Ryzen 7 8700G
10664 Points +2067%
Khadas Mind 2 (Nvidia GeForce RTX 4090 @USB4)
Intel Core Ultra 7 155H
10373 Points +2008%
Geekom GT1 Mega (Nvidia GeForce RTX 4090 @USB4)
Intel Core Ultra 9 185H
9972 Points +1927%

492 Points
1024x600 Normal, Fluid 2DTexArr
AMD Ryzen 5 9600X
AMD Ryzen 5 9600X
6948 Points +1327%
Intel Core i5-14600K
6920 Points +1321%
Minisforum MS-A1 (Nvidia GeForce RTX 4090 @OCuLink)
AMD Ryzen 7 8700G
6907 Points +1318%
Khadas Mind 2 (Nvidia GeForce RTX 4090 @USB4)
Intel Core Ultra 7 155H
6771 Points +1290%
Geekom GT1 Mega (Nvidia GeForce RTX 4090 @USB4)
Intel Core Ultra 9 185H
6566 Points +1248%

487 Points
1024x600 Normal, Mandel Vector
Intel Core i5-14600K
17355 Points +751%
AMD Ryzen 5 9600X
AMD Ryzen 5 9600X
17307 Points +749%
Minisforum MS-A1 (Nvidia GeForce RTX 4090 @OCuLink)
AMD Ryzen 7 8700G
17088 Points +738%
Khadas Mind 2 (Nvidia GeForce RTX 4090 @USB4)
Intel Core Ultra 7 155H
16044 Points +687%
Geekom GT1 Mega (Nvidia GeForce RTX 4090 @USB4)
Intel Core Ultra 9 185H
15583 Points +664%

2039 Points
1024x600 Normal, Mandel Scalar
Intel Core i5-14600K
22992 Points +1252%
AMD Ryzen 5 9600X
AMD Ryzen 5 9600X
22843 Points +1243%
Minisforum MS-A1 (Nvidia GeForce RTX 4090 @OCuLink)
AMD Ryzen 7 8700G
22633 Points +1231%
Khadas Mind 2 (Nvidia GeForce RTX 4090 @USB4)
Intel Core Ultra 7 155H
21302 Points +1152%
Geekom GT1 Mega (Nvidia GeForce RTX 4090 @USB4)
Intel Core Ultra 9 185H
20574 Points +1110%

1701 Points
1024x600 Normal, QJuliaRayTrace
AMD Ryzen 5 9600X
AMD Ryzen 5 9600X
34367 Points +959%
Intel Core i5-14600K
34333 Points +958%
Minisforum MS-A1 (Nvidia GeForce RTX 4090 @OCuLink)
AMD Ryzen 7 8700G
33589 Points +935%
Khadas Mind 2 (Nvidia GeForce RTX 4090 @USB4)
Intel Core Ultra 7 155H
31824 Points +881%
Geekom GT1 Mega (Nvidia GeForce RTX 4090 @USB4)
Intel Core Ultra 9 185H
30654 Points +845%

3244 Points
Performance Rating - Percent
AMD Ryzen 5 9600X
AMD Ryzen 5 9600X
100 pt
Minisforum MS-A1 (Nvidia GeForce RTX 4090 @OCuLink)
AMD Ryzen 7 8700G
75.5 pt
Geekom GT1 Mega (Nvidia GeForce RTX 4090 @USB4)
Intel Core Ultra 9 185H
39.9 pt
Khadas Mind 2 (Nvidia GeForce RTX 4090 @USB4)
Intel Core Ultra 7 155H
32.4 pt
Cyberpunk 2077 2.1 Phantom Liberty
1280x720 Low Preset (FSR off)
AMD Ryzen 5 9600X
AMD Ryzen 5 9600X
256 (183.7min - 319max) fps +341%
Minisforum MS-A1 (Nvidia GeForce RTX 4090 @OCuLink)
AMD Ryzen 7 8700G
187.3 (143.6min - 225max) fps +223%
Geekom GT1 Mega (Nvidia GeForce RTX 4090 @USB4)
Intel Core Ultra 9 185H
88.9 (67.9min - 123.3max) fps +53%
Khadas Mind 2 (Nvidia GeForce RTX 4090 @USB4)
Intel Core Ultra 7 155H
79.7 (62.5min - 101.2max) fps +37%

58 (49.1min - 71.8max) fps
1920x1080 Medium Preset (FSR off)
AMD Ryzen 5 9600X
AMD Ryzen 5 9600X
252 (174.7min - 318max) fps +703%
Minisforum MS-A1 (Nvidia GeForce RTX 4090 @OCuLink)
AMD Ryzen 7 8700G
184.9 (141min - 225max) fps +489%
Geekom GT1 Mega (Nvidia GeForce RTX 4090 @USB4)
Intel Core Ultra 9 185H
87.8 (65.1min - 123max) fps +180%
Khadas Mind 2 (Nvidia GeForce RTX 4090 @USB4)
Intel Core Ultra 7 155H
77.5 (58.3min - 109.1max) fps +147%

31.4 (27.8min - 35.6max) fps
1920x1080 Ultra Preset (FSR off)
AMD Ryzen 5 9600X
AMD Ryzen 5 9600X
204 (126.1min - 264max) fps +776%
Minisforum MS-A1 (Nvidia GeForce RTX 4090 @OCuLink)
AMD Ryzen 7 8700G
161.8 (107min - 205max) fps +594%
Geekom GT1 Mega (Nvidia GeForce RTX 4090 @USB4)
Intel Core Ultra 9 185H
75 (50.3min - 110.2max) fps +222%
Khadas Mind 2 (Nvidia GeForce RTX 4090 @USB4)
Intel Core Ultra 7 155H
68.8 (46.7min - 98.6max) fps +195%

23.3 (20.1min - 28.1max) fps
Baldur's Gate 3
1920x1080 Low Preset
AMD Ryzen 5 9600X
AMD Ryzen 5 9600X
253 (30.2min, 76.7P0.1, 155.7P1 - 431max) fps +544%
Minisforum MS-A1 (Nvidia GeForce RTX 4090 @OCuLink)
AMD Ryzen 7 8700G
200 (109.4min, 129.1P0.1, 154.1P1 - 278max) fps +409%
Geekom GT1 Mega (Nvidia GeForce RTX 4090 @USB4)
Intel Core Ultra 9 185H
189.1 (95.1min, 108.7P0.1, 136.8P1 - 323max) fps +381%
Khadas Mind 2 (Nvidia GeForce RTX 4090 @USB4)
Intel Core Ultra 7 155H
142.8 (70.4min, 75.8P0.1, 97.6P1 - 236max) fps +263%

39.3 (24.3min, 25.4P0.1, 28P1 - 90.7max) fps
1920x1080 Medium Preset
AMD Ryzen 5 9600X
AMD Ryzen 5 9600X
231 (52.4min, 123P0.1, 150.8P1 - 382max) fps +662%
Minisforum MS-A1 (Nvidia GeForce RTX 4090 @OCuLink)
AMD Ryzen 7 8700G
194.4 (102.5min, 120P0.1, 151.2P1 - 274max) fps +542%
Geekom GT1 Mega (Nvidia GeForce RTX 4090 @USB4)
Intel Core Ultra 9 185H
168.3 (71.8min, 94P0.1, 117.8P1 - 266max) fps +455%
Khadas Mind 2 (Nvidia GeForce RTX 4090 @USB4)
Intel Core Ultra 7 155H
114 (35.5min, 44P0.1, 57.3P1 - 219max) fps +276%

30.3 (18.1min, 18.2P0.1, 20.2P1 - 85.2max) fps
1920x1080 Ultra Preset
AMD Ryzen 5 9600X
AMD Ryzen 5 9600X
212 (16.9min, 120.1P0.1, 151.8P1 - 372max) fps +741%
Minisforum MS-A1 (Nvidia GeForce RTX 4090 @OCuLink)
AMD Ryzen 7 8700G
190.9 (107.5min, 129.1P0.1, 148.8P1 - 259max) fps +658%
Geekom GT1 Mega (Nvidia GeForce RTX 4090 @USB4)
Intel Core Ultra 9 185H
151.8 (67.2min, 82P0.1, 101.9P1 - 254max) fps +502%
Khadas Mind 2 (Nvidia GeForce RTX 4090 @USB4)
Intel Core Ultra 7 155H
109.2 (29.8min, 38.6P0.1, 55.9P1 - 199max) fps +333%

25.2 (11.9min, 13P0.1, 16.6P1 - 75.3max) fps
F1 24
1920x1080 Low Preset AA:T AF:16x
AMD Ryzen 5 9600X
AMD Ryzen 5 9600X
405 (297min, 246P1 - 476max) fps +380%
Minisforum MS-A1 (Nvidia GeForce RTX 4090 @OCuLink)
AMD Ryzen 7 8700G
269 (203min, 181P1 - 313max) fps +219%

84.3 (70min, 66P1 - 97max) fps
Geekom GT1 Mega (Nvidia GeForce RTX 4090 @USB4)
Intel Core Ultra 9 185H
78.1 (43min, 45P1 - 98max) fps -7%
Khadas Mind 2 (Nvidia GeForce RTX 4090 @USB4)
Intel Core Ultra 7 155H
74.6 (42min, 44P1 - 94max) fps -12%
1920x1080 Medium Preset AA:T AF:16x
AMD Ryzen 5 9600X
AMD Ryzen 5 9600X
421 (328min, 262P1 - 470max) fps +470%
Minisforum MS-A1 (Nvidia GeForce RTX 4090 @OCuLink)
AMD Ryzen 7 8700G
285 (216min, 190P1 - 313max) fps +286%
Geekom GT1 Mega (Nvidia GeForce RTX 4090 @USB4)
Intel Core Ultra 9 185H
74.4 (42min, 44P1 - 86max) fps +1%

73.8 (61min, 59P1 - 88max) fps
Khadas Mind 2 (Nvidia GeForce RTX 4090 @USB4)
Intel Core Ultra 7 155H
72.1 (41min, 43P1 - 85max) fps -2%
1920x1080 High Preset AA:T AF:16x
AMD Ryzen 5 9600X
AMD Ryzen 5 9600X
401 (305min, 241P1 - 449max) fps +632%
Minisforum MS-A1 (Nvidia GeForce RTX 4090 @OCuLink)
AMD Ryzen 7 8700G
267 (203min, 176P1 - 297max) fps +387%
Geekom GT1 Mega (Nvidia GeForce RTX 4090 @USB4)
Intel Core Ultra 9 185H
61.7 (35min, 37P1 - 75max) fps +13%
Khadas Mind 2 (Nvidia GeForce RTX 4090 @USB4)
Intel Core Ultra 7 155H
60.1 (35min, 36P1 - 74max) fps +10%

54.8 (43min, 45P1 - 64max) fps
1920x1080 Ultra High Preset AA:T AF:16x
AMD Ryzen 5 9600X
AMD Ryzen 5 9600X
205 (90min, 114P1 - 235max) fps
Minisforum MS-A1 (Nvidia GeForce RTX 4090 @OCuLink)
AMD Ryzen 7 8700G
154.4 (74min, 88P1 - 171max) fps
Geekom GT1 Mega (Nvidia GeForce RTX 4090 @USB4)
Intel Core Ultra 9 185H
43.9 (24min, 26P1 - 52max) fps
Khadas Mind 2 (Nvidia GeForce RTX 4090 @USB4)
Intel Core Ultra 7 155H
41.7 (23min, 24P1 - 48max) fps
Geekom GT1 Mega, Intel Arc 8-Core iGPU
Ultra 9 185H
Geekom GT1 Mega (Nvidia GeForce RTX 4090 @USB4) ,
Ultra 9 185H
Khadas Mind 2 (Nvidia GeForce RTX 4090 @USB4) ,
Ultra 7 155H
Minisforum MS-A1 (Nvidia GeForce RTX 4090 @OCuLink) ,
Ryzen 7 8700G
AMD Ryzen 5 9600X, NVIDIA GeForce RTX 4090
Ryzen 5 9600X
Intel Core i5-14600K, NVIDIA GeForce RTX 4090
i5-14600K
Average of class Mini PC
 
SPECviewperf 2020
775%
786%
1064%
1037%
1398%
129%
3840x2160 Medical (medical-03)
7.07
42.1
495%
42.3
498%
43.2
511%
43.5
515%
40.2
469%
3840x2160 Energy (energy-03)
5
92.8
1756%
95.3
1806%
141
2720%
95.6
1812%
229
4480%
3840x2160 Creo (creo-03)
19.8
91.1
360%
83.8
323%
128
546%
143
622%
139
602%
3840x2160 CATIA (catia-06)
11.7
77.3
561%
75.7
547%
85.2
628%
94.2
705%
94.3
706%
3840x2160 3ds Max (3dsmax-07)
15.5
158
919%
160
932%
204
1216%
231
1390%
235
1416%
3840x2160 Siemens NX (snx-04)
5.68
31.9
462%
33
481%
40.3
610%
48.1
747%
46.3
715%
3840x2160 Maya (maya-06)
38.8
378
874%
393
913%
512
1220%
609
1470%
lågmed.högultraQHD4K
Dota 2 Reborn (2015) 182.3 156.9 153.6 143 136
Final Fantasy XV Benchmark (2018) 209 196.8 164.3 156.8 119.2
X-Plane 11.11 (2018) 143.6 134.1 101.8 87.2
Baldur's Gate 3 (2023) 189.1 168.3 152.7 151.8 136.9 96.1
Cyberpunk 2077 2.1 Phantom Liberty (2023) 88.8 87.8 79.3 75 74.3 53.1
F1 24 (2024) 78.1 74.4 61.7 43.9 43.2 42

Utsläpp: För högljudd och inte användarvänlig

Bullerutsläpp

Även om Geekom har utformat GT1 Mega för att vara större och därför har gett den en större kylenhet, fungerar systemet bara tyst i viloläge när det levereras. Om du kräver något av enheten, slår fläkten upp och producerar ett ljud som inte kan ignoreras.

I jämförelse ser vi paralleller till Geekom AX8 Pro, som är betydligt mindre. Med UH125 Pro visar Minisforum hur det kan göras bättre, om vi begränsar oss till ljudtrycksnivån under belastning.

Med tanke på detta är vår rekommendation att aktivera tyst läge i BIOS för att minska volymen under belastning något. Överlag verkar fläktkontrollområdet mycket omoget. Fler alternativ för att justera fläkthastigheterna skulle verkligen vara ett första steg. Det skulle också vara vettigt att utveckla ett litet verktyg för att ändra fläkthastigheten från Windows.

Ljudnivå

Låg belastning
25.4 / 27.2 / 27.5 dB(A)
Hög belastning
50.9 / 50.9 dB(A)
  red to green bar
 
 
30 dB
tyst
40 dB(A)
hörbar
50 dB(A)
högt ljud
 
min: dark, med: mid, max: light   Earthworks M23R (15 cm avstånd)   environment noise: 24.8 dB(A)
dB(A) 0102030405060708090Deep BassMiddle BassHigh BassLower RangeMidsHigher MidsLower HighsMid HighsUpper HighsSuper Highs2034.138.635.837.434.13734.12535.434.332.936.236.331.135.43139.738.139.640.338.64039.74026.629.625.426.423.223.926.650293428.630.426.225.3296327.832.533.93227.923.227.88024.525.922.424.622.722.724.510024.924.921.623.221.92124.912524.723.815.915.914.813.424.716022.72314.114.111.99.322.720025.525.214.715.614.210.525.525027.627.412.812.912.79.627.631526.826.911.11313.39.226.840026.926.91011.511.69.626.950030.430.310.813.412.38.830.463031.230.810.513.412.88.931.280034.734.811.314.514.19.334.7100039.138.512.716.816.69.939.1125040.940.612.917.51710.640.9160040.440.511.916.215.711.240.4200042.642.512.616.115.811.842.6250040.340.513.115.215.112.540.3315037.938.213.415.615.213.437.9400043.143.113.815.414.91443.150003736.914.314.414.214.237630029.429.614.614.814.814.529.4800029.73014.814.914.914.829.71000024.525.514.914.915.114.624.51250017.819.414.714.714.814.417.8160001617.514.314.314.31416SPL50.950.925.427.627.224.850.9N6.76.70.60.90.80.56.7median 29.7median 30median 13.4median 14.9median 14.8median 11.8median 29.7Delta6.57.21.70.90.82.46.5hearing rangehide median Fan NoiseGeekom GT1 Mega
Geekom GT1 Mega
Ultra 9 185H, Arc 8-Core
Geekom AX8 Pro
R9 8945H, Radeon 780M
Asus NUC 14 Pro
Ultra 5 125H, Arc 7-Core
Minisforum UH125 Pro
Ultra 5 125H, Arc 7-Core
Geekom GT13 Pro
i9-13900H, Iris Xe G7 96EUs
Acemagic F2A
Ultra 7 155H, Arc 8-Core
Noise
3%
6%
-6%
2%
4%
off / environment *
24.8
24.9
-0%
24
3%
24.8
-0%
24.3
2%
24.9
-0%
Idle Minimum *
25.4
24.9
2%
26
-2%
35
-38%
27.9
-10%
25.4
-0%
Idle Average *
27.2
24.9
8%
26.2
4%
35
-29%
27.9
-3%
25.7
6%
Idle Maximum *
27.5
24.9
9%
26.2
5%
35
-27%
28
-2%
25.7
7%
Load Average *
50.9
50.1
2%
42.4
17%
42.2
17%
43.8
14%
47.8
6%
Cyberpunk 2077 ultra *
50.8
50
2%
47.7
6%
40.8
20%
45.4
11%
Load Maximum *
50.9
50.2
1%
47.8
6%
43.9
14%
48.5
5%
49
4%
Witcher 3 ultra *
45.23

* ... smaller is better

Temperatur

Höljet på Geekom GT1 Mega värms endast upp något vid tomgångskörning. Tack vare den snabbt roterande fläkten försvinner den värme som genereras omedelbart från höljet, vilket leder till låga yttemperaturer även under belastning.

Den nya Intel Core Ultra 9 185H når inte riktigt 100 °C i stresstestet. I genomsnitt faller temperaturen inom ett icke-kritiskt intervall. Det maximala värdet uppnås endast om SoC:n använder PL2.

Kylsystemet kan avleda de 45 W väl under en längre tidsperiod. På grund av den större designen av GT1 Mega jämfört med tidigare enheter från Geekom finns det tyvärr ingen större fördel.

Stresstest Prime95, solo
FurMark stresstest, solo
Prime95 och FurMark stresstest
Geekom GT1 Mega stresstest (ovansida)
Geekom GT1 Mega stresstest (undersida)
Geekom GT1 Mega stresstest (baksida)
Strömförsörjningsenhet under stresstest
Hög belastning
 31.2 °C32.9 °C32.9 °C 
 28.9 °C30.7 °C30.1 °C 
 29.4 °C29.6 °C29.6 °C 
Max: 32.9 °C
Medel: 30.6 °C
34.3 °C33.6 °C32.2 °C
33 °C36.5 °C30.3 °C
31.6 °C28.8 °C28.8 °C
Max: 36.5 °C
Medel: 32.1 °C
Strömförsörjning (max.)  44.3 °C | Rumstemperatur 21.9 °C | Fluke t3000FC (calibrated)
(+) The average temperature for the upper side under maximal load is 30.6 °C / 87 F, compared to the average of 32.3 °C / 90 F for the devices in the class Mini PC.
(+) The maximum temperature on the upper side is 32.9 °C / 91 F, compared to the average of 35.8 °C / 96 F, ranging from 24 to 69.5 °C for the class Mini PC.
(+) The bottom heats up to a maximum of 36.5 °C / 98 F, compared to the average of 36.1 °C / 97 F
(+) In idle usage, the average temperature for the upper side is 29.7 °C / 85 F, compared to the device average of 32.3 °C / 90 F.

Energihantering: I nivå med Asus NUC 14 Pro

Geekom GT1 Mega är en ekonomisk minidator när det gäller strömförbrukning och detta bevisas i våra mätningar. Även i viloläge är enheten mycket sparsam. Endast Asus NUC 14 Pro kan hålla jämna steg med Geekom GT1 Mega och uppnå lika bra värden.

Under belastning är vårt testprov fortfarande relativt ekonomiskt med ett genomsnitt på 65,8 W, även om toppar på upp till 105 W är möjliga. När det gäller effektivitet är det dock bara tillräckligt bra för andraplatsen. Här är det Geekom AX8 Pro med AMD Ryzen 9 8945HS presterar bättre totalt sett.

Vi har stött på 120 W-strömförsörjningsenheten som levereras med Geekom GT1 Mega i olika minidatorer från Geekom. Den maximala prestandan är tillräcklig och det finns tillräckligt med utrymme för en andra datalagringsenhet som tillval.

Geekom GT1 Mega med strömförsörjningsenhet (19 V; 6,32 A)
Strömförsörjningsenhet (19 V; 6,32 A)
Strömförbrukning
Av/Standbydarklight 1.35 / 5.4 Watt
Låg belastningdarkmidlight 4.1 / 6.6 / 11.3 Watt
Hög belastning midlight 65.8 / 104.8 Watt
 color bar
Förklaring: min: dark, med: mid, max: light        Metrahit Energy
Geekom GT1 Mega
Ultra 9 185H, Arc 8-Core
Geekom AX8 Pro
R9 8945H, Radeon 780M
Asus NUC 14 Pro
Ultra 5 125H, Arc 7-Core
Minisforum UH125 Pro
Ultra 5 125H, Arc 7-Core
Geekom GT13 Pro
i9-13900H, Iris Xe G7 96EUs
Acemagic F2A
Ultra 7 155H, Arc 8-Core
Average Intel Arc 8-Core iGPU
 
Average of class Mini PC
 
Power Consumption
-74%
-3%
-47%
-34%
-39%
-7%
-47%
Idle Minimum *
4.1
14
-241%
5.1
-24%
11.9
-190%
7.9
-93%
9.1
-122%
5.41 ?(1.8 - 10.3, n=37)
-32%
Idle Average *
6.6
15.9
-141%
6.4
3%
14.6
-121%
10.3
-56%
10.3
-56%
8.64 ?(4.2 - 16, n=37)
-31%
Idle Maximum *
11.3
19.5
-73%
14.7
-30%
15.4
-36%
22.3
-97%
14.4
-27%
12.1 ?(4.5 - 49, n=37)
-7%
Load Average *
65.8
76.4
-16%
55.5
16%
48.3
27%
57.44
13%
54.9
17%
Cyberpunk 2077 ultra external monitor *
69.4
54.3
22%
59.1
15%
52.7
24%
55.9
19%
Load Maximum *
104.8
99.1
5%
103.3
1%
89.8
14%
93.4
11%
110.4
-5%

* ... smaller is better

Power efficiency

Performance Rating - Percent
Geekom AX8 Pro
AMD Ryzen 9 8945H, Radeon 780M
94.7 pt
Geekom GT1 Mega
Intel Core Ultra 9 185H, Arc 8-Core
84 pt
Geekom GT13 Pro
Intel Core i9-13900H, Iris Xe G7 96EUs
81.1 pt
Minisforum UH125 Pro
Intel Core Ultra 5 125H, Arc 7-Core
81 pt
Asus NUC 14 Pro
Intel Core Ultra 5 125H, Arc 7-Core
80.5 pt
Acemagic F2A
Intel Core Ultra 7 155H, Arc 8-Core
78.7 pt
Power Consumption
Cinebench R23 Multi Power Efficiency - external Monitor
Geekom AX8 Pro
AMD Ryzen 9 8945H, Radeon 780M
219 Points per Watt +12%
Geekom GT13 Pro
Intel Core i9-13900H, Iris Xe G7 96EUs
210 Points per Watt +8%
Geekom GT1 Mega
Intel Core Ultra 9 185H, Arc 8-Core
194.8 Points per Watt
Acemagic F2A
Intel Core Ultra 7 155H, Arc 8-Core
183.7 Points per Watt -6%
Minisforum UH125 Pro
Intel Core Ultra 5 125H, Arc 7-Core
181.1 Points per Watt -7%
Asus NUC 14 Pro
Intel Core Ultra 5 125H, Arc 7-Core
163.7 Points per Watt -16%
Cinebench R23 Single Power Efficiency - external Monitor
Asus NUC 14 Pro
Intel Core Ultra 5 125H, Arc 7-Core
69.4 Points per Watt +22%
Geekom AX8 Pro
AMD Ryzen 9 8945H, Radeon 780M
58.3 Points per Watt +3%
Minisforum UH125 Pro
Intel Core Ultra 5 125H, Arc 7-Core
57.1 Points per Watt +1%
Geekom GT1 Mega
Intel Core Ultra 9 185H, Arc 8-Core
56.7 Points per Watt
Geekom GT13 Pro
Intel Core i9-13900H, Iris Xe G7 96EUs
54.3 Points per Watt -4%
Acemagic F2A
Intel Core Ultra 7 155H, Arc 8-Core
54.2 Points per Watt -4%
Cinebench R15 Multi Efficiency (external Monitor)
Geekom AX8 Pro
AMD Ryzen 9 8945H, Radeon 780M
35.9 Points per Watt +23%
Geekom GT1 Mega
Intel Core Ultra 9 185H, Arc 8-Core
29.2 Points per Watt
Minisforum UH125 Pro
Intel Core Ultra 5 125H, Arc 7-Core
28 Points per Watt -4%
Acemagic F2A
Intel Core Ultra 7 155H, Arc 8-Core
26.6 Points per Watt -9%
Geekom GT13 Pro
Intel Core i9-13900H, Iris Xe G7 96EUs
24.8 Points per Watt -15%
Asus NUC 14 Pro
Intel Core Ultra 5 125H, Arc 7-Core
24 Points per Watt -18%

Power consumption: External monitor

0102030405060708090100Tooltip
Geekom GT1 Mega Ultra 9 185H, Arc 8-Core; Idle 1min (external Monitor): Ø6.65 (4.54-11.3)
Geekom AX8 Pro R9 8945H, Radeon 780M; Idle 1min (external Monitor): Ø15.9 (14.3-19.4)
Asus NUC 14 Pro Ultra 5 125H, Arc 7-Core; Idle 1min (external Monitor): Ø6.48 (4.52-12)
Geekom GT1 Mega Ultra 9 185H, Arc 8-Core; 1280x720 Prime95 28.10 and Furmark 1.25: Ø75.4 (64.2-104.8)
Geekom AX8 Pro R9 8945H, Radeon 780M; 1280x720 Prime95 28.10 and Furmark 1.25: Ø89.4 (87.8-94.6)
Asus NUC 14 Pro Ultra 5 125H, Arc 7-Core; 1280x720 Prime95 28.10 and Furmark 1.25: Ø90.8 (85.1-98.5)
Geekom GT1 Mega Ultra 9 185H, Arc 8-Core; Cyberpunk 2077 FHD ultra no FSR (external Monitor): Ø69.4 (66.7-76.7)
Geekom AX8 Pro R9 8945H, Radeon 780M; Cyberpunk 2077 FHD ultra no FSR (external Monitor): Ø54.3 (43.7-67.1)
Asus NUC 14 Pro Ultra 5 125H, Arc 7-Core; Cyberpunk 2077 FHD ultra no FSR (external Monitor): Ø59.1 (55.8-67.9)
Geekom GT1 Mega Ultra 9 185H, Arc 8-Core; 3DMark06 Return To Proxycon: Ø65.8 (59-72.8)
Geekom AX8 Pro R9 8945H, Radeon 780M; 3DMark06 Return To Proxycon: Ø76.5 (55.7-96.2)
Asus NUC 14 Pro Ultra 5 125H, Arc 7-Core; 3DMark06 Return To Proxycon: Ø55.5 (51.2-61.4)

Power consumption: External monitor

0102030405060708090100Tooltip
Geekom GT1 Mega Ultra 9 185H, Arc 8-Core; Prime95 V2810 Stress (external Monitor): Ø75.6 (62.9-104.6)
Geekom AX8 Pro R9 8945H, Radeon 780M; Prime95 V2810 Stress (external Monitor): Ø75.9 (72.6-96)
Asus NUC 14 Pro Ultra 5 125H, Arc 7-Core; Prime95 V2810 Stress (external Monitor): Ø90.6 (79.2-103.3)
Geekom GT1 Mega Ultra 9 185H, Arc 8-Core; Cinebench R15 Multi (external Monitor): Ø95.8 (95-96.5)
Geekom AX8 Pro R9 8945H, Radeon 780M; Cinebench R15 Multi (external Monitor): Ø70.3 (63.2-83)
Asus NUC 14 Pro Ultra 5 125H, Arc 7-Core; Cinebench R15 Multi (external Monitor): Ø89.2 (88-90.9)
Geekom GT1 Mega Ultra 9 185H, Arc 8-Core; Cinebench R23 Single (external Monitor): Ø31.3 (15.7-81.3)
Geekom AX8 Pro R9 8945H, Radeon 780M; Cinebench R23 Single (external Monitor): Ø31 (25.6-51.4)
Asus NUC 14 Pro Ultra 5 125H, Arc 7-Core; Cinebench R23 Single (external Monitor): Ø24.8 (20.8-58)
Geekom GT1 Mega Ultra 9 185H, Arc 8-Core; Cinebench R23 Multi (external Monitor): Ø95.5 (94-96.6)
Geekom AX8 Pro R9 8945H, Radeon 780M; Cinebench R23 Multi (external Monitor): Ø70.9 (66.8-89.8)
Asus NUC 14 Pro Ultra 5 125H, Arc 7-Core; Cinebench R23 Multi (external Monitor): Ø88.7 (86.9-91.6)
Geekom GT1 Mega Ultra 9 185H, Arc 8-Core; 1280x720 FurMark 1.19 GPU Stress Test (external Monitor): Ø58.2 (56.2-74.2)
Geekom AX8 Pro R9 8945H, Radeon 780M; 1280x720 FurMark 1.19 GPU Stress Test (external Monitor): Ø85.7 (73.1-99.9)
Asus NUC 14 Pro Ultra 5 125H, Arc 7-Core; 1280x720 FurMark 1.19 GPU Stress Test (external Monitor): Ø56.9 (53.6-63.3)

Notebookcheck övergripande betyg

Geekom GT1 Mega är en kraftfull minidator med ett brett utbud av applikationer. Tack vare toppmodern hårdvara och ett generöst utbud av anslutningar är minidatorn framtidssäkrad.

Baserat på Intel Core Ultra 9 185H och 32 GB RAM levererar GT1 Mega bra prestanda för kontorsapplikationer i testet och klarar även kraftfulla multimediauppgifter. Den enda nackdelen är den stundtals högljudda kylningen, som är tydligt hörbar även under medelbelastning.

Geekom GT1 Mega - 11/06/2024 v8
Sebastian Bade

Design
87 / 98 → 89%
Anslutningar
74 / 81 → 91%
Vikt
80%
Spelprestanda
48 / 80 → 60%
Programprestanda
84 / 92 → 91%
Workstation
34%
AI Performance
84%
Temperatur
93%
Ljudnivå
73%
Medel
54%
79%
Mini PC - Vägt medel
CO2 Emissions
No Data
Materials
25%
Packaging
25%
Power Use
63.4%
Repairability
30%
Software Updates
39%
Recycle Logo Total Sustainability Score: 30.4%

Transparency

The selection of devices to be reviewed is made by our editorial team. The test sample was given to the author by the manufacturer free of charge for the purposes of review. There was no third-party influence on this review, nor did the manufacturer receive a copy of this review before publication. There was no obligation to publish this review. We never accept compensation or payment in return for our reviews. As an independent media company, Notebookcheck is not subjected to the authority of manufacturers, retailers or publishers.

This is how Notebookcheck is testing

Every year, Notebookcheck independently reviews hundreds of laptops and smartphones using standardized procedures to ensure that all results are comparable. We have continuously developed our test methods for around 20 years and set industry standards in the process. In our test labs, high-quality measuring equipment is utilized by experienced technicians and editors. These tests involve a multi-stage validation process. Our complex rating system is based on hundreds of well-founded measurements and benchmarks, which maintains objectivity. Further information on our test methods can be found here.
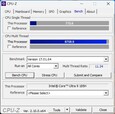
Please share our article, every link counts!
Mail Logo
> Bärbara datorer, laptops - tester och nyheter > Tester > Geekom GT1 Mega recension: Geekom's första AI-minidator övertygar inte i alla aspekter
Sebastian Bade, 2024-11-14 (Update: 2024-11-14)