

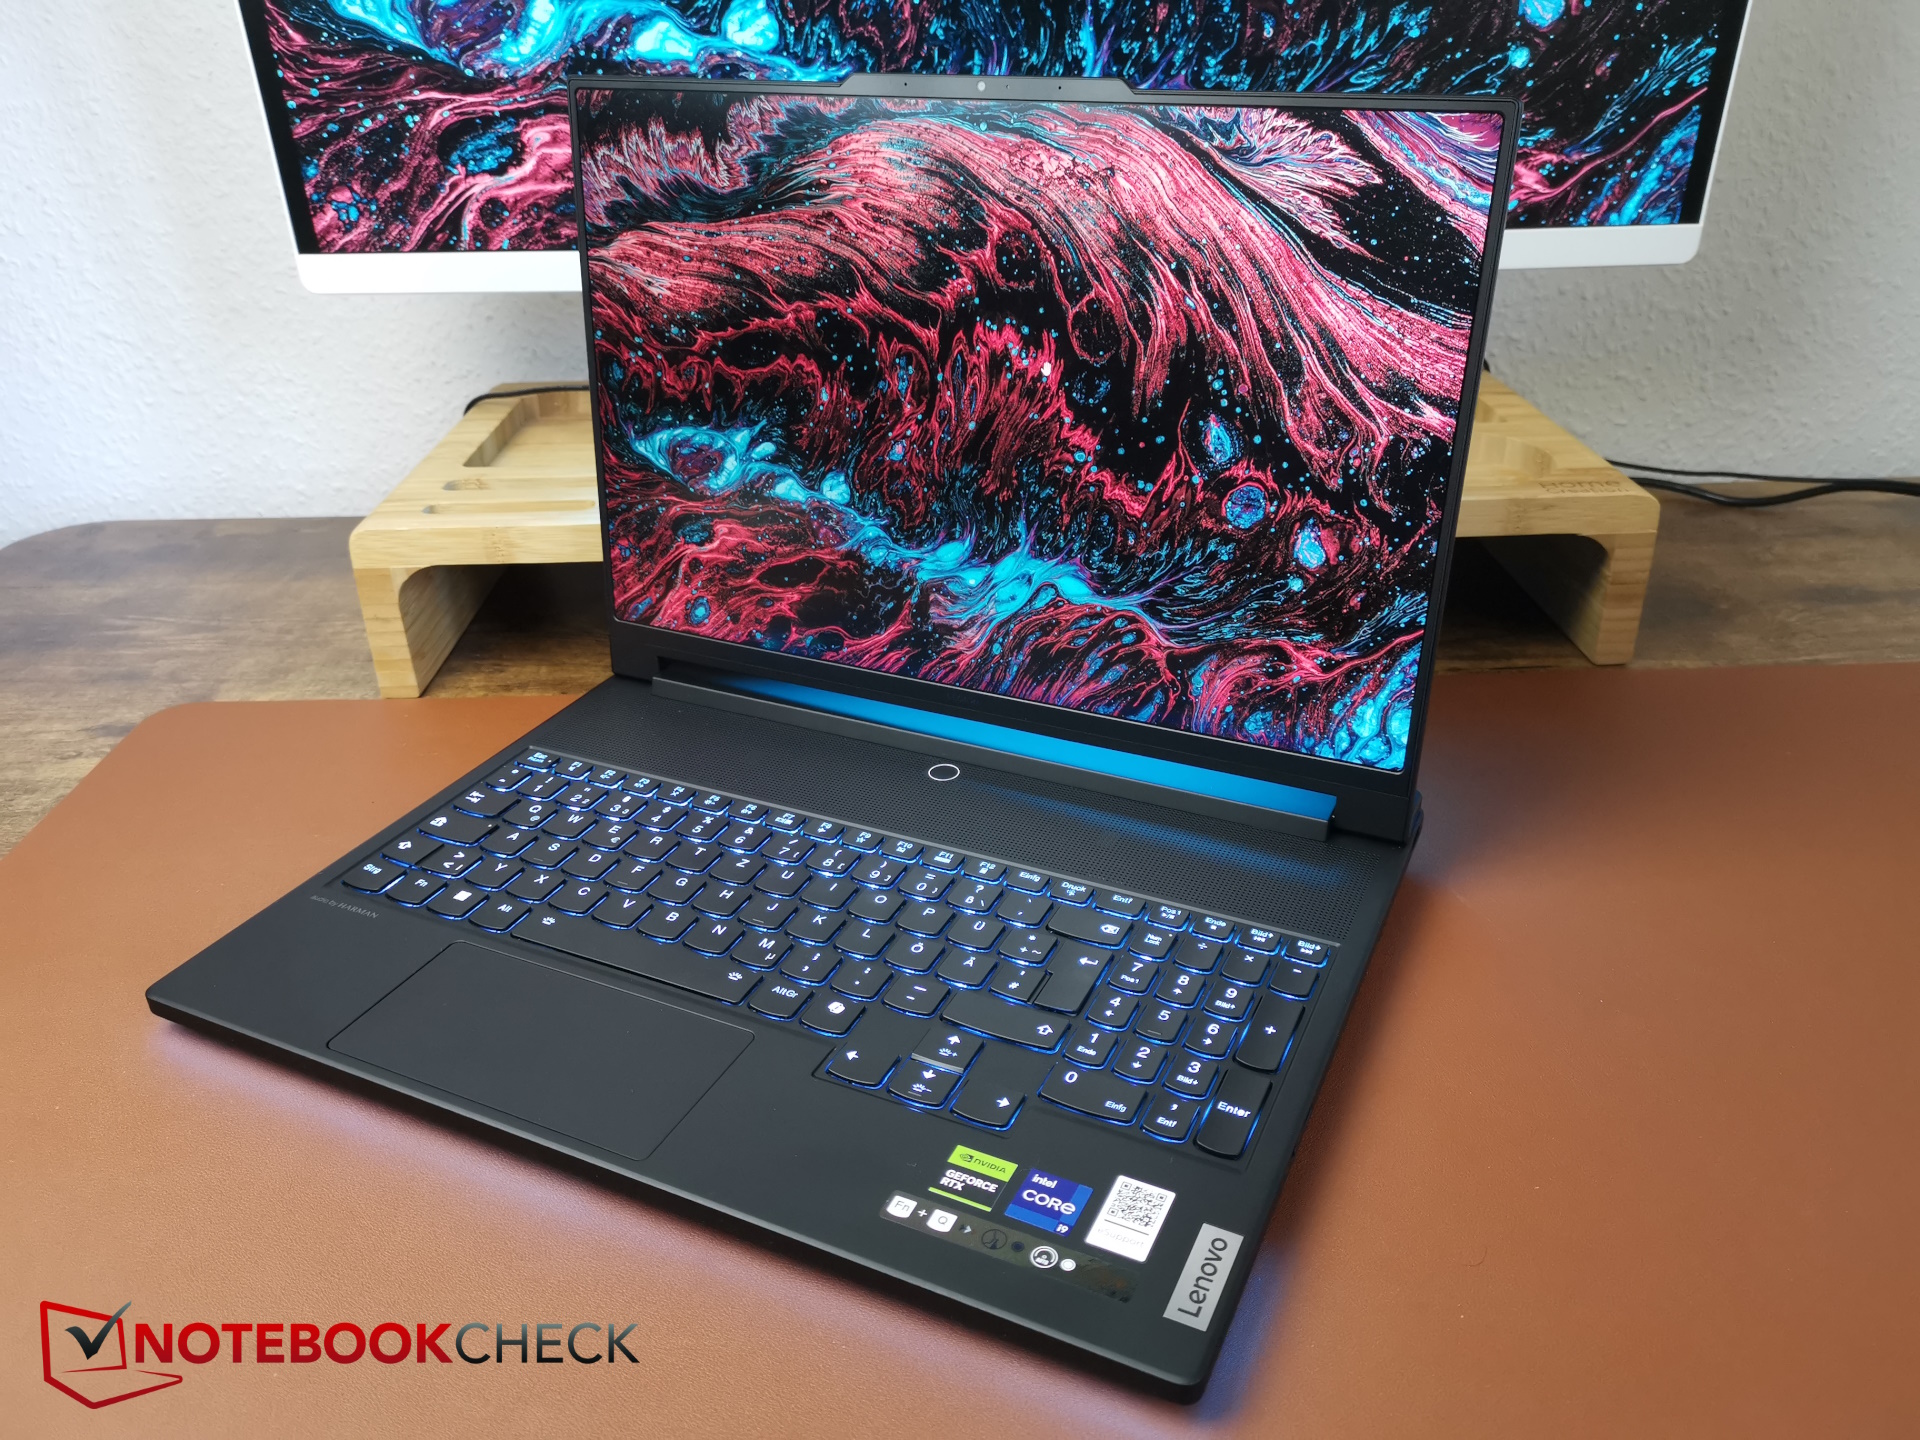
Lenovo Legion 9 16IRX9 (Legion 9i) recension: Hur avancerad är RTX 4090-spelaren?
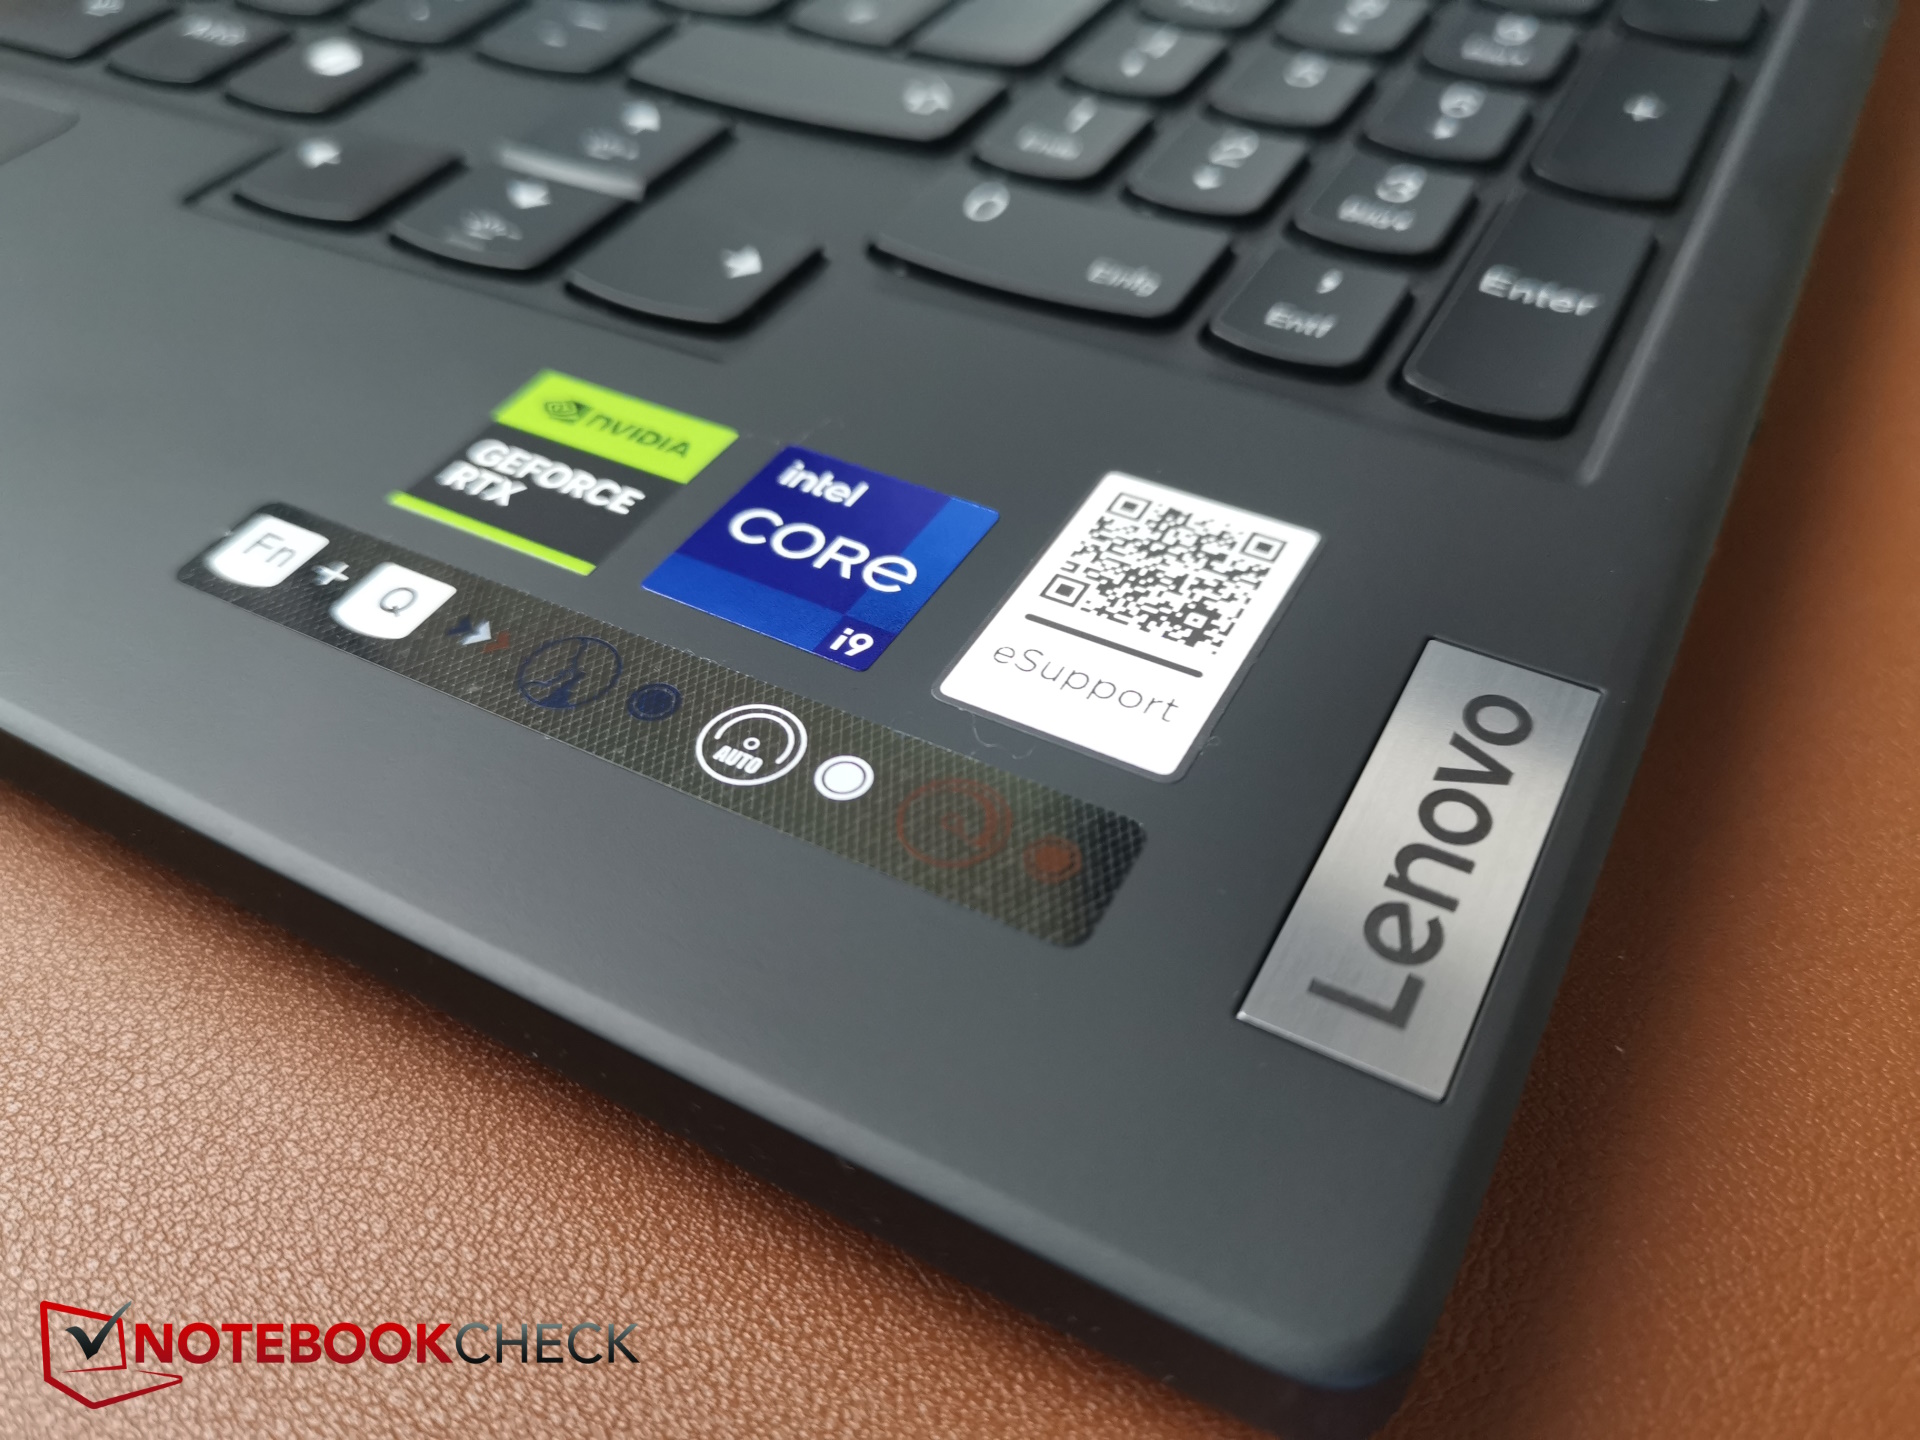
Förra året kallade vi Legion 9i för "Lenovos mest ambitiösa bärbara speldator hittills". Nästa generation är kanske inte mindre ambitiös, men de förändringar som faktiskt gjorts för den avancerade spelaren är mycket begränsade. Endast dess CPU har bytts ut mot den senaste 14:e Intel-generationen, vilket också gör den bärbara datorn mer AI-kompatibel.
Eftersom 16-tums bärbara datorer inte ofta är utrustade med RTX 4090kommer vi att jämföra den med dess föregångare, den Razer Blade 16 (2024) samt 18-tums gamers som t.ex Alienware m18 R2 och Asus ROG Strix Scar 18 (2024), och 17-tums Medion Erazer Beast X40 (2024).
Uppdatering: På grund av de problem som nämns i detta test (bildfrekvensfall, låg single-core-poäng) kom vi i kontakt med tillverkaren (via dess byrå). En potentiell ersättningsenhet visade samma single-core-poäng (uppmätt av byrån), så åtminstone det bekräftades. Vi är fortfarande i kontakt om dess bildfrekvenser och kommer att publicera ett svar så snart som möjligt.
Potentiella konkurrenter i jämförelse
Gradering | Version | Datum | Modell | Vikt | Höjd | Storlek | Upplösning | Pris |
|---|---|---|---|---|---|---|---|---|
| 83.9 % | v8 | 06/2024 | Lenovo Legion 9 16IRX9, RTX 4090 i9-14900HX, NVIDIA GeForce RTX 4090 Laptop GPU | 2.5 kg | 22.7 mm | 16.00" | 3200x2000 | |
| 90.2 % v7 (old) | v7 (old) | 10/2023 | Lenovo Legion 9 16IRX8 i9-13980HX, NVIDIA GeForce RTX 4090 Laptop GPU | 2.6 kg | 22.7 mm | 16.00" | 3200x2000 | |
| 91.1 % v7 (old) | v7 (old) | 02/2024 | Razer Blade 16 2024, RTX 4090 i9-14900HX, NVIDIA GeForce RTX 4090 Laptop GPU | 2.5 kg | 22 mm | 16.00" | 2560x1600 | |
| 89.5 % v7 (old) | v7 (old) | 03/2024 | Alienware m18 R2 i9-14900HX, NVIDIA GeForce RTX 4090 Laptop GPU | 4 kg | 26.7 mm | 18.00" | 2560x1600 | |
| 88.3 % v7 (old) | v7 (old) | 02/2024 | Asus ROG Strix Scar 18 G834JYR (2024) i9-14900HX, NVIDIA GeForce RTX 4090 Laptop GPU | 3.1 kg | 30.8 mm | 18.00" | 2560x1600 | |
| 89.2 % v7 (old) | v7 (old) | 02/2024 | Medion Erazer Beast X40 2024 i9-14900HX, NVIDIA GeForce RTX 4090 Laptop GPU | 2.9 kg | 36 mm | 17.00" | 2560x1600 |
Obs: Vi har nyligen uppdaterat vårt betygssystem och resultaten från version 8 är inte jämförbara med resultaten från version 7. Mer information finns tillgänglig här .
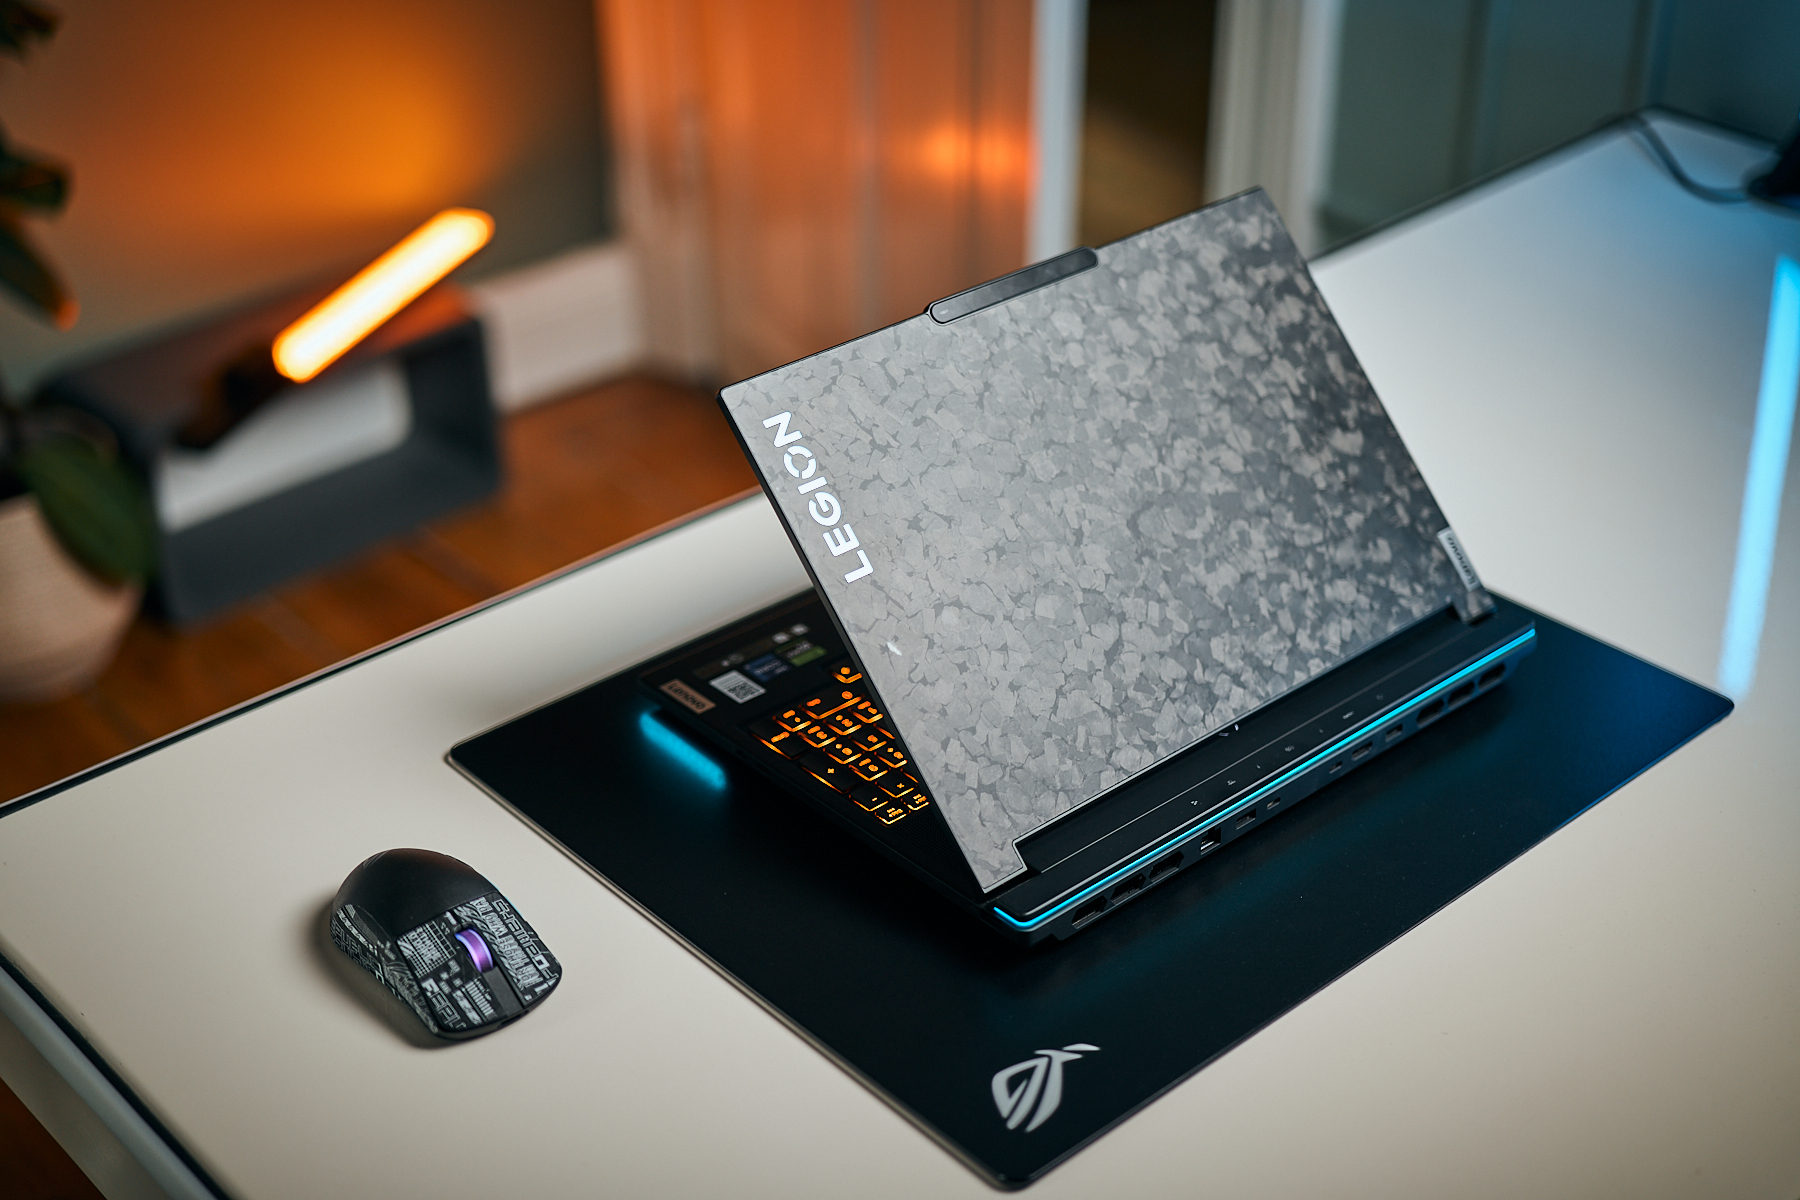
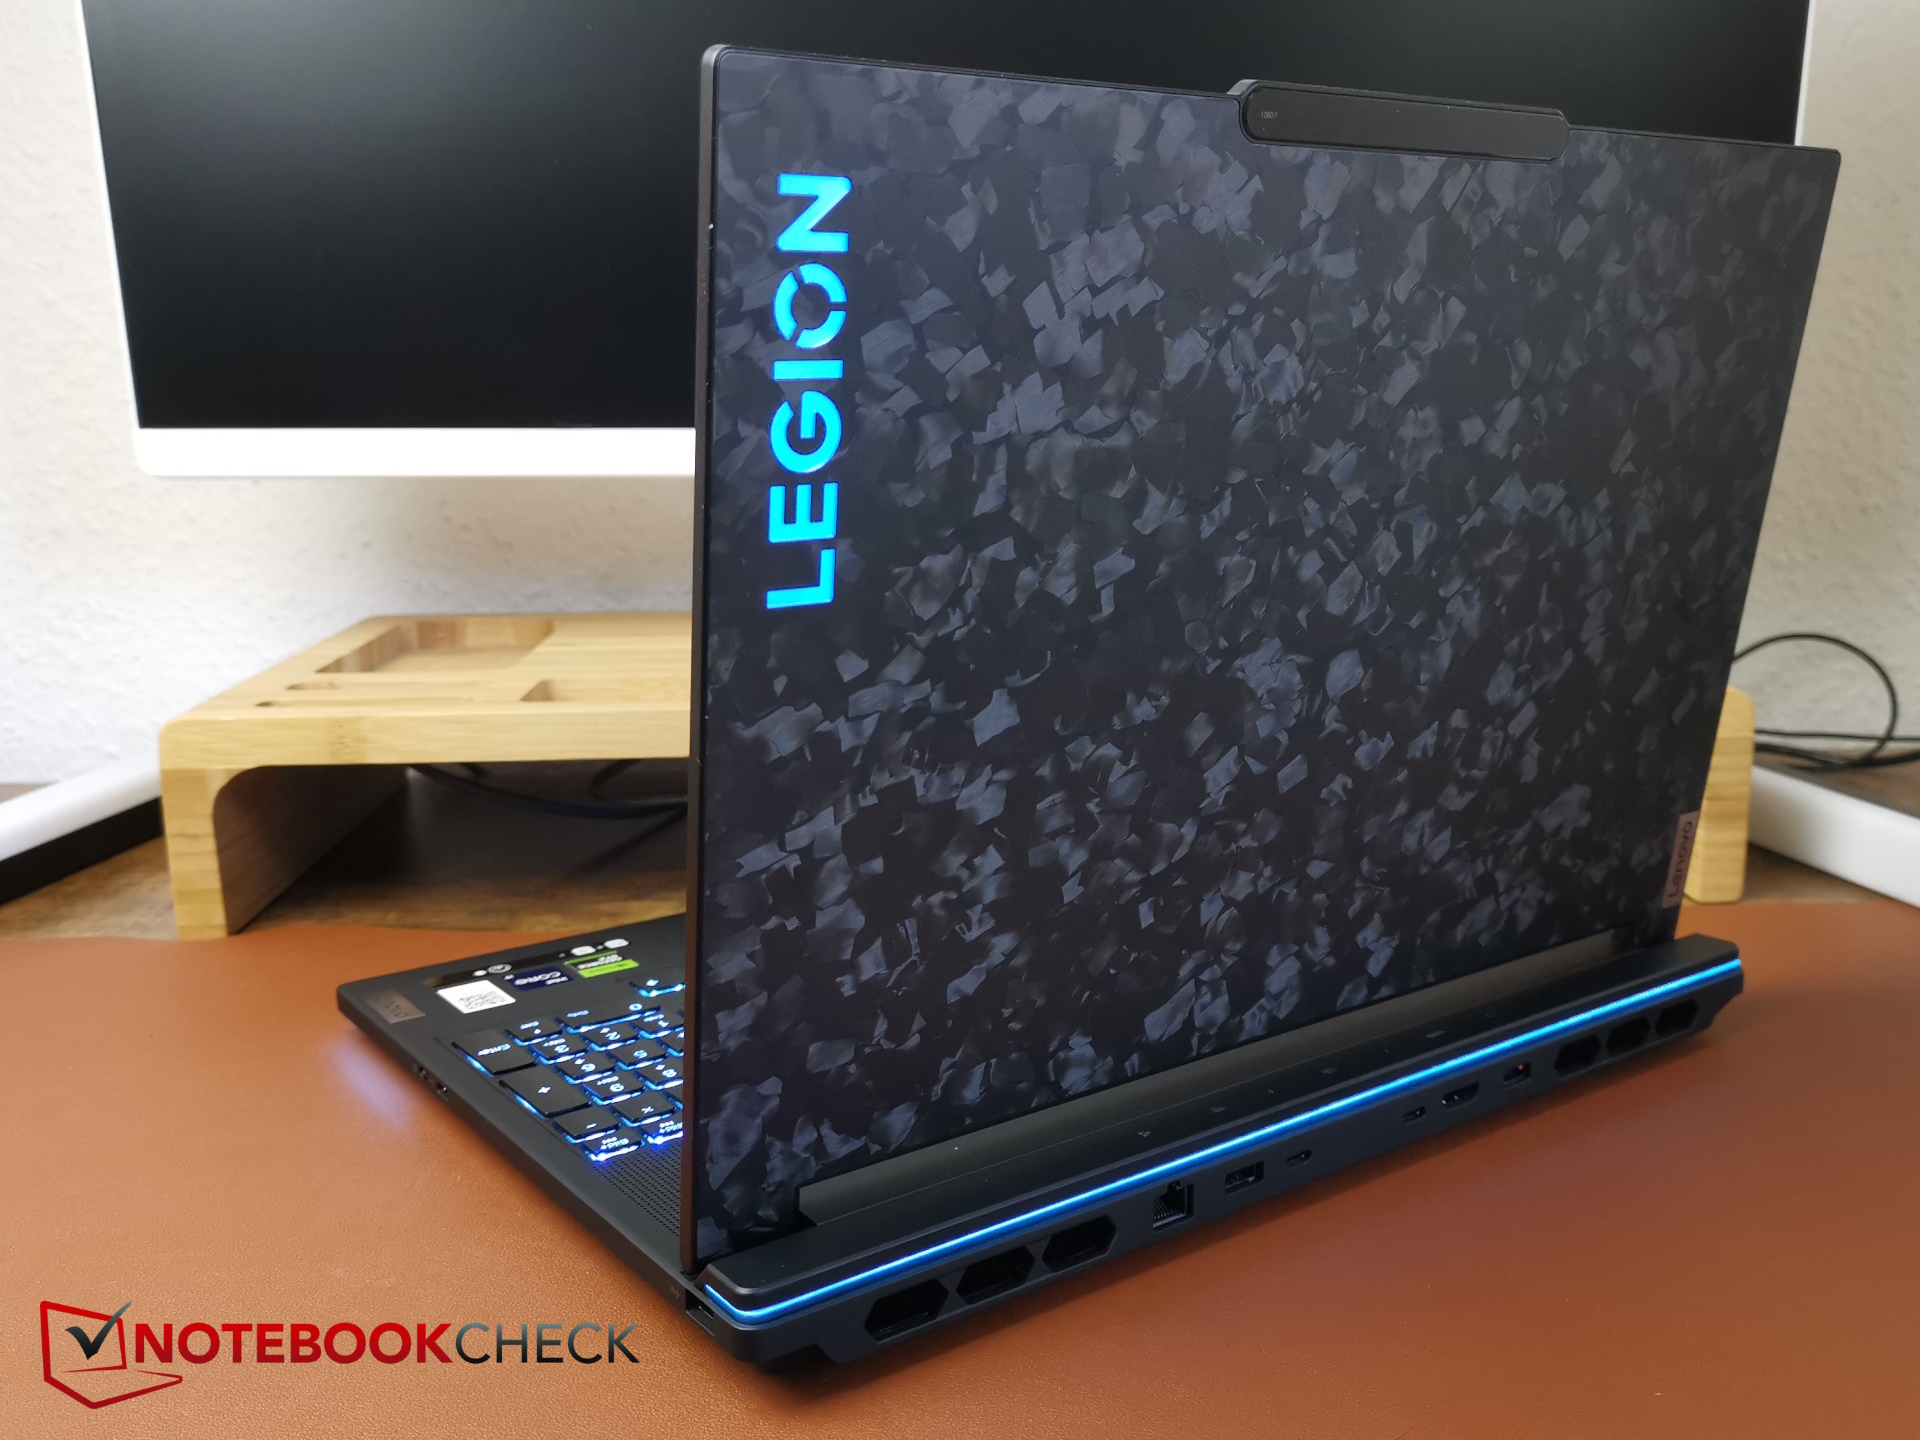
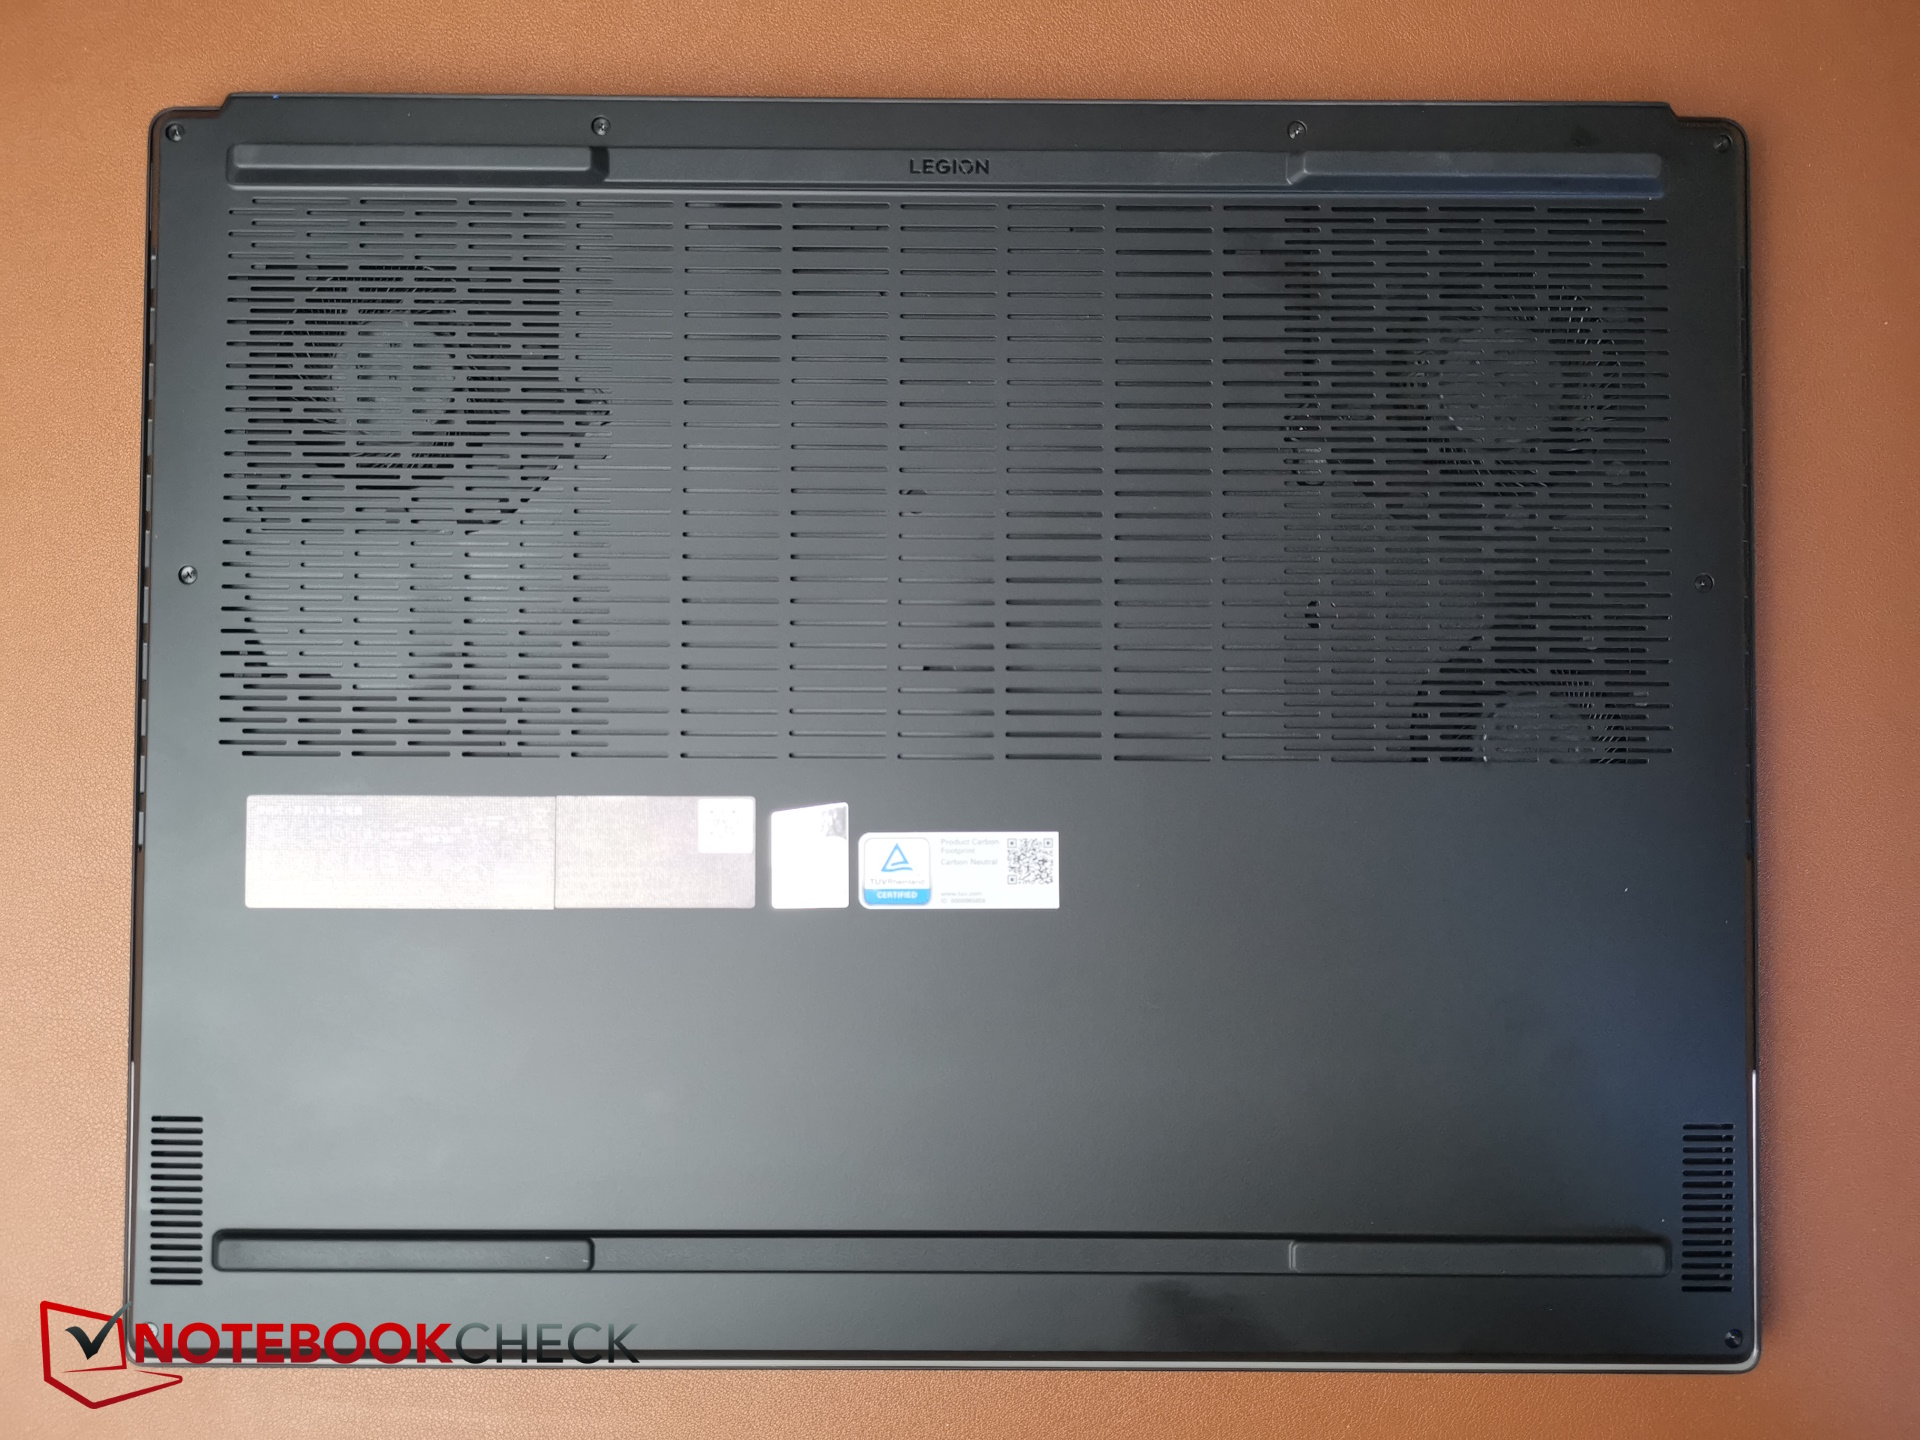
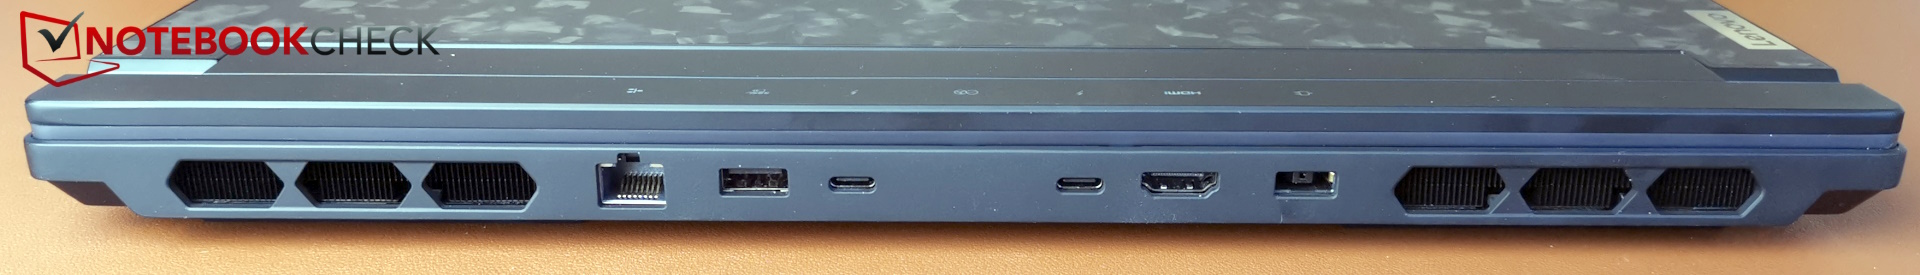
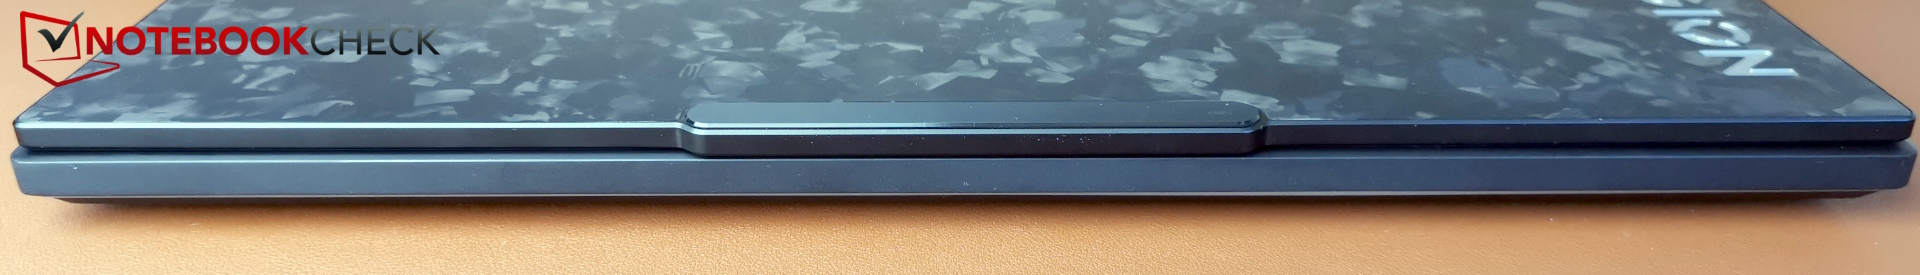
Hölje och anslutningar - Smidd kol
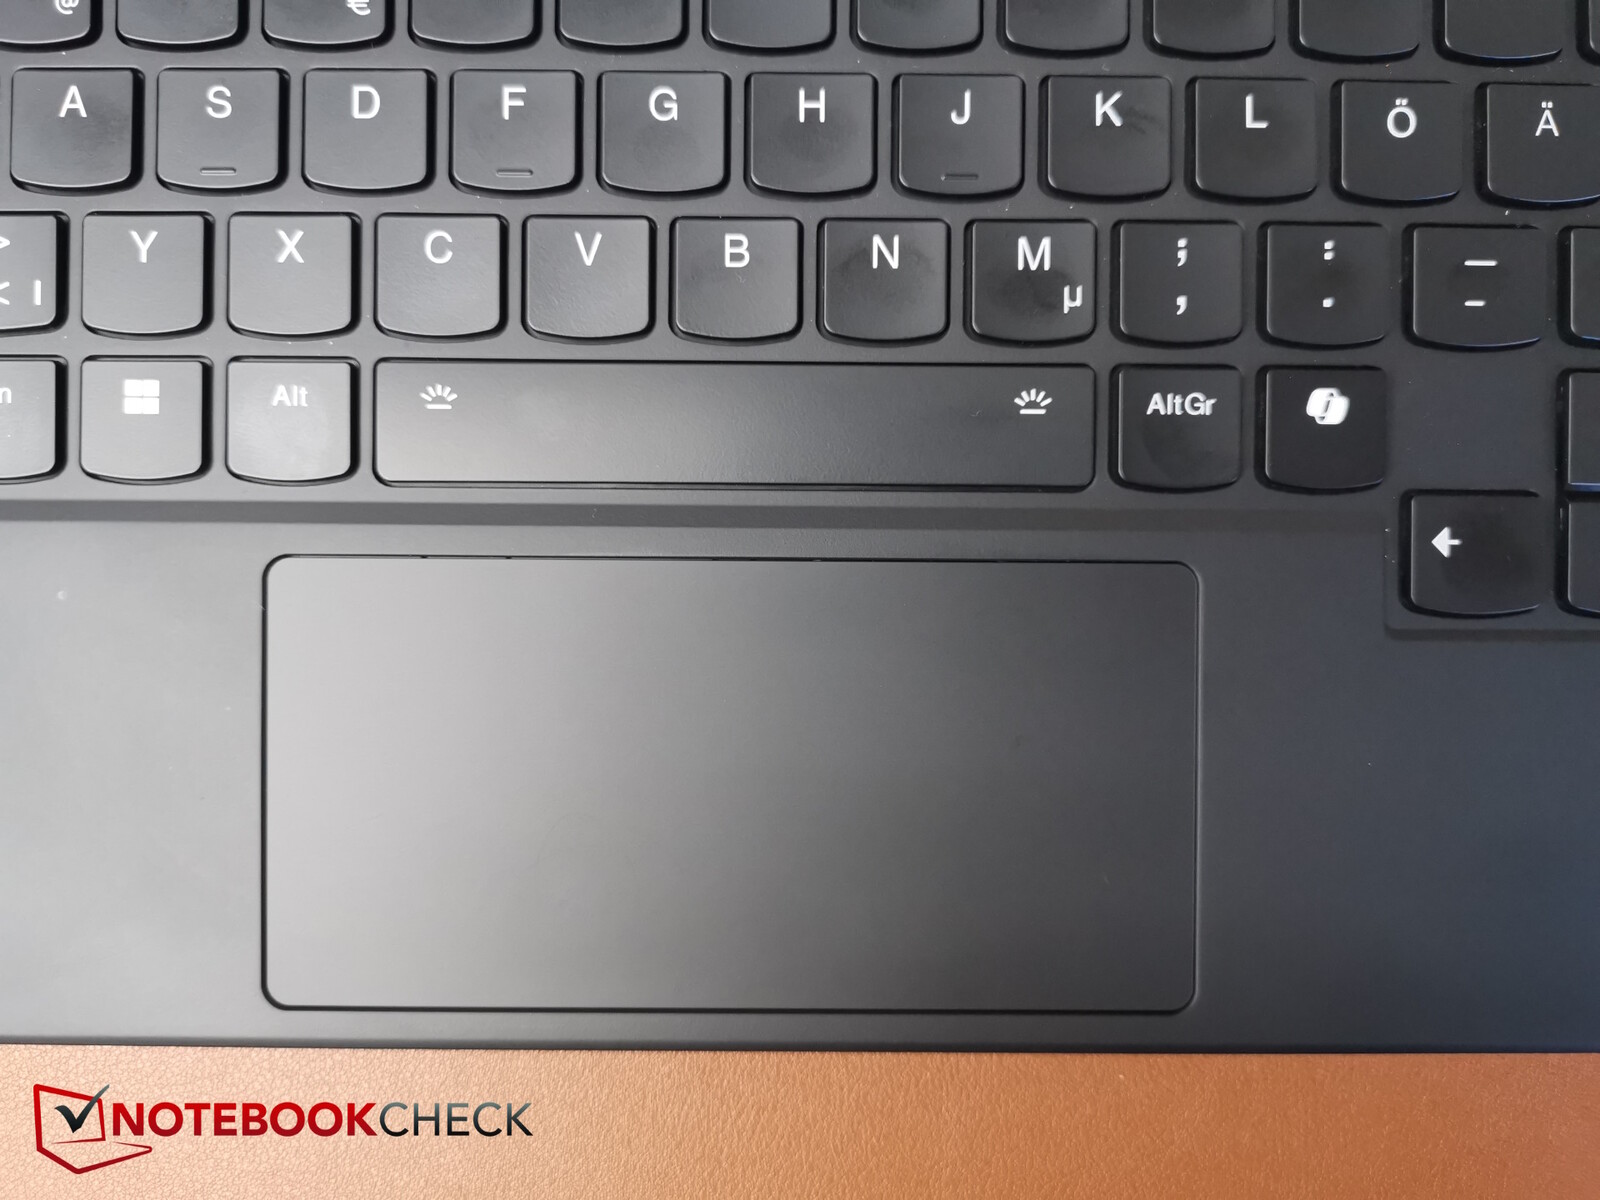
Eftersom åtminstone visuellt allt har förblivit detsamma om den nya modellen, rekommenderar vi att du tar en titt på vår recension av Lenovo Legion 9i Gen8 för information om dess kolsmidda hölje, underhållsalternativ och inmatningsenheter.

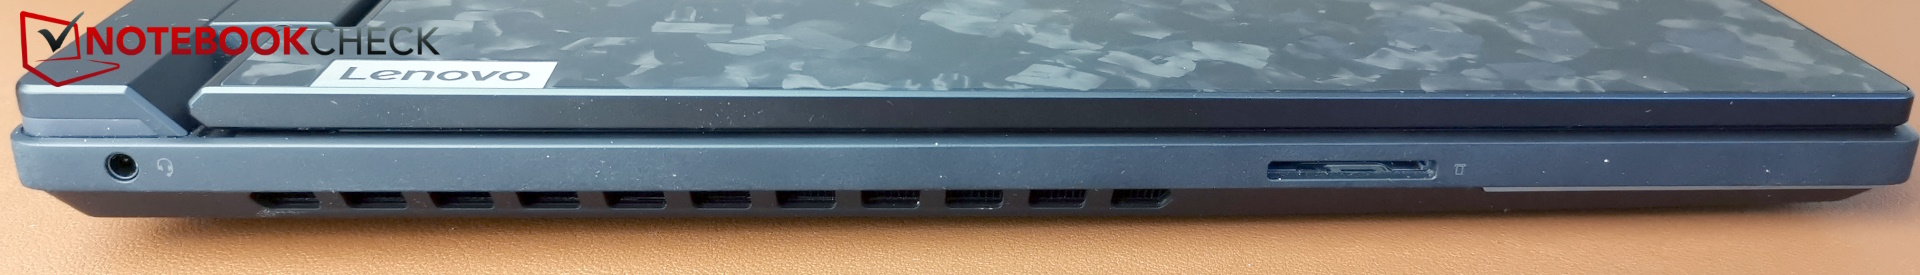
SD-kortläsare
För att vara en avancerad bärbar dator är SD-kortläsarens överföringshastigheter en besvikelse. De är något sämre än förra året och är långt ifrån överföringshastigheterna hos en Razer Blade 16 eller Alienware m18 R2.
| SD Card Reader | |
| average JPG Copy Test (av. of 3 runs) | |
| Alienware m18 R2 (Toshiba Exceria Pro SDXC 64 GB UHS-II) | |
| Razer Blade 16 2024, RTX 4090 | |
| Genomsnitt av klass Gaming (19 - 197.3, n=68, senaste 2 åren) | |
| Lenovo Legion 9 16IRX8 (Toshiba Exceria Pro SDXC 64 GB UHS-II) | |
| Medion Erazer Beast X40 2024 (AV PRO microSD 128 GB V60) | |
| Lenovo Legion 9 16IRX9, RTX 4090 | |
| maximum AS SSD Seq Read Test (1GB) | |
| Alienware m18 R2 (Toshiba Exceria Pro SDXC 64 GB UHS-II) | |
| Razer Blade 16 2024, RTX 4090 | |
| Genomsnitt av klass Gaming (25.8 - 263, n=67, senaste 2 åren) | |
| Medion Erazer Beast X40 2024 (AV PRO microSD 128 GB V60) | |
| Lenovo Legion 9 16IRX9, RTX 4090 | |
| Lenovo Legion 9 16IRX8 (Toshiba Exceria Pro SDXC 64 GB UHS-II) | |
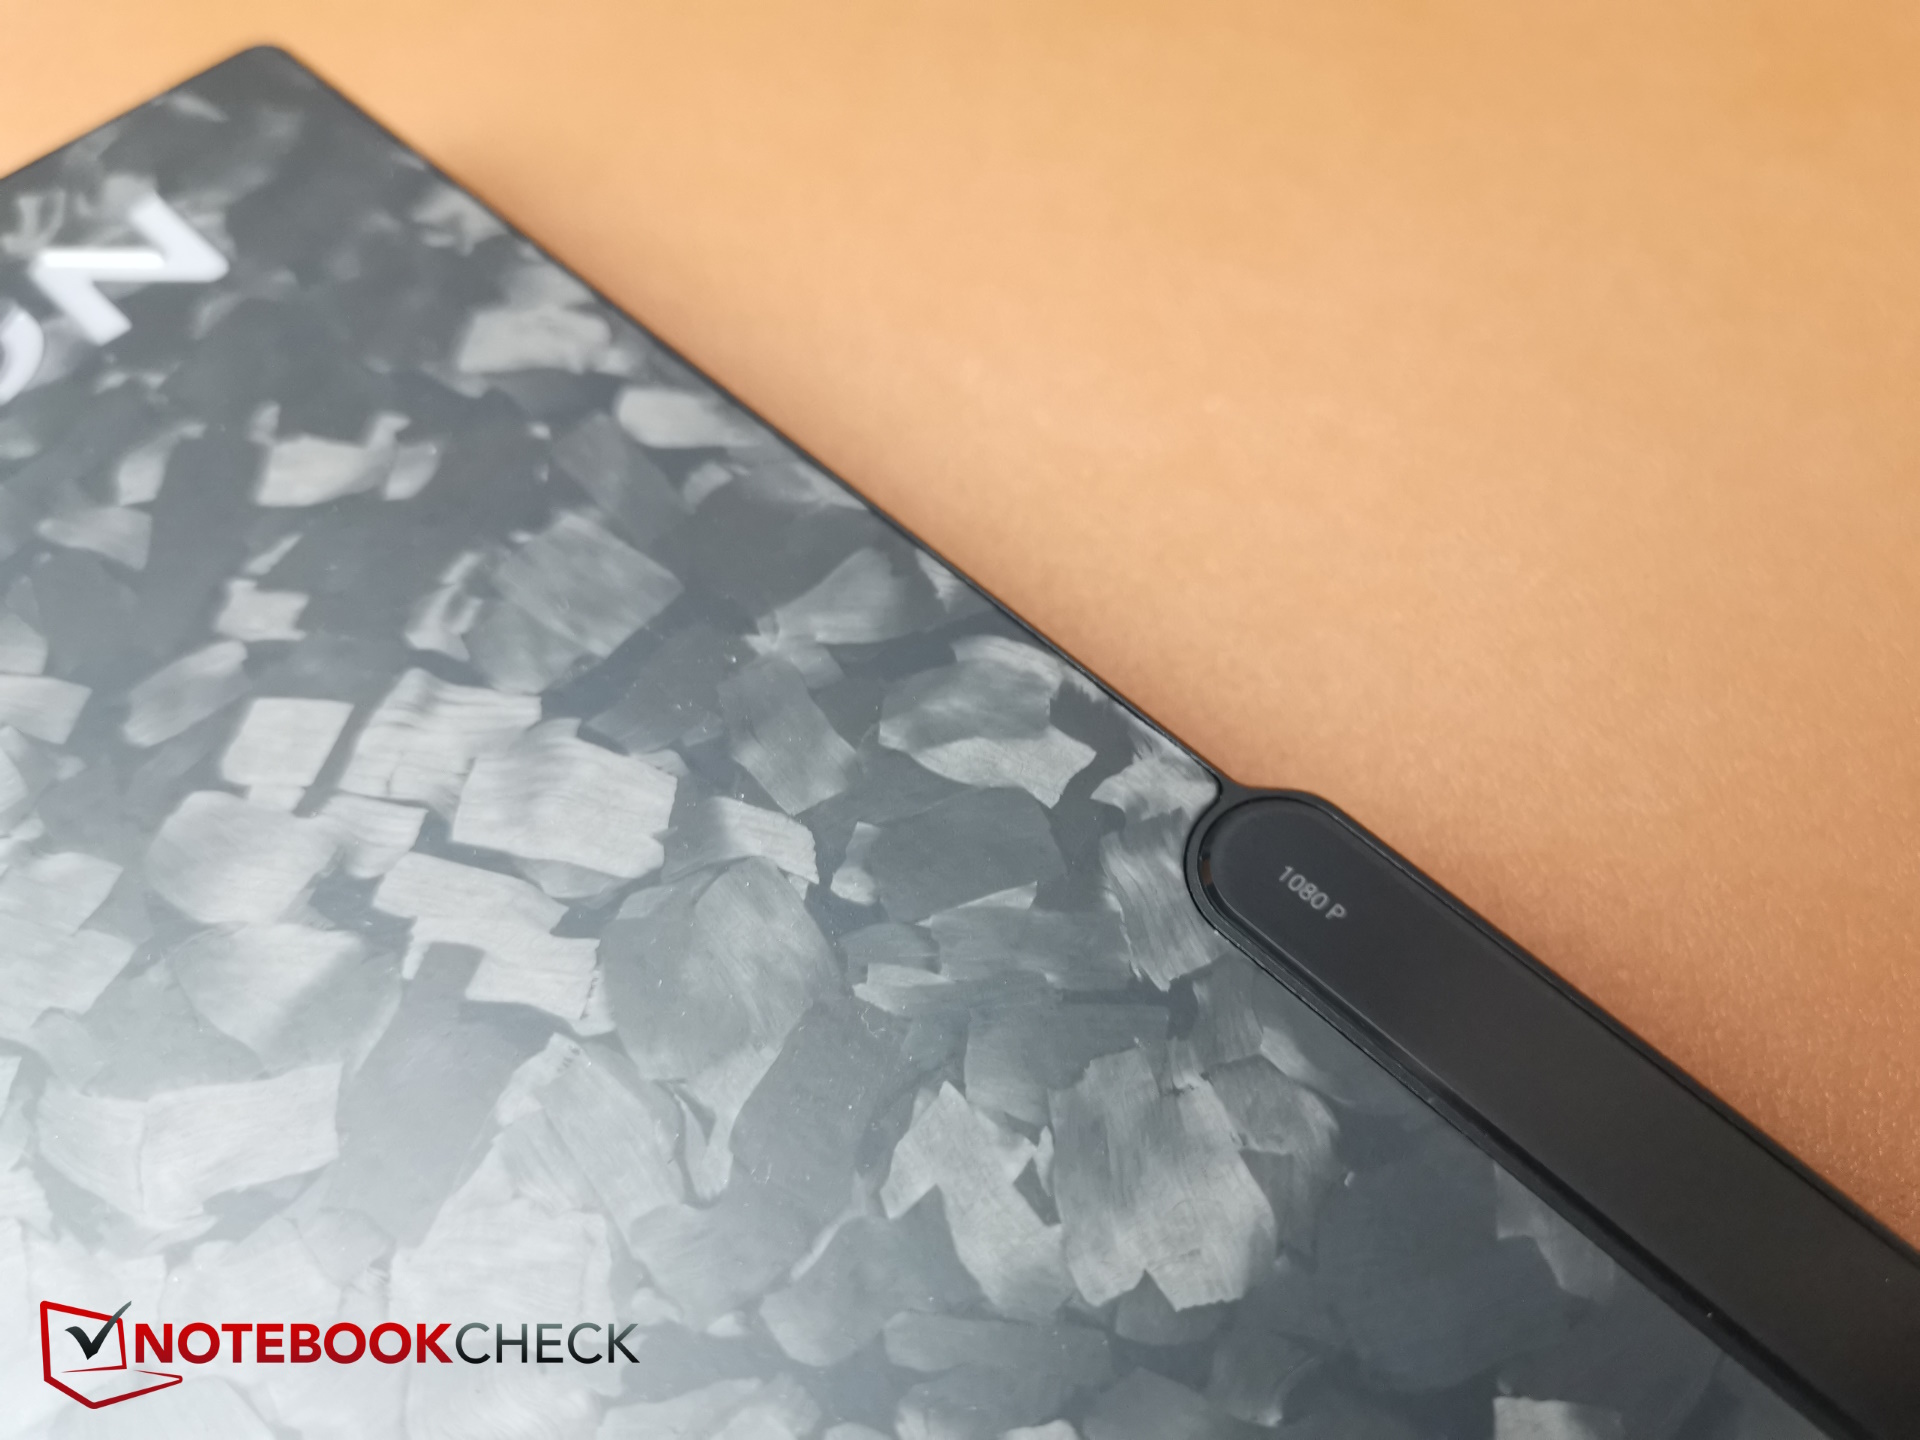
Webbkamera
Webbkameran på 1 080p Full HD har medelhöga till höga färgavvikelser och bildskärpan är okej.


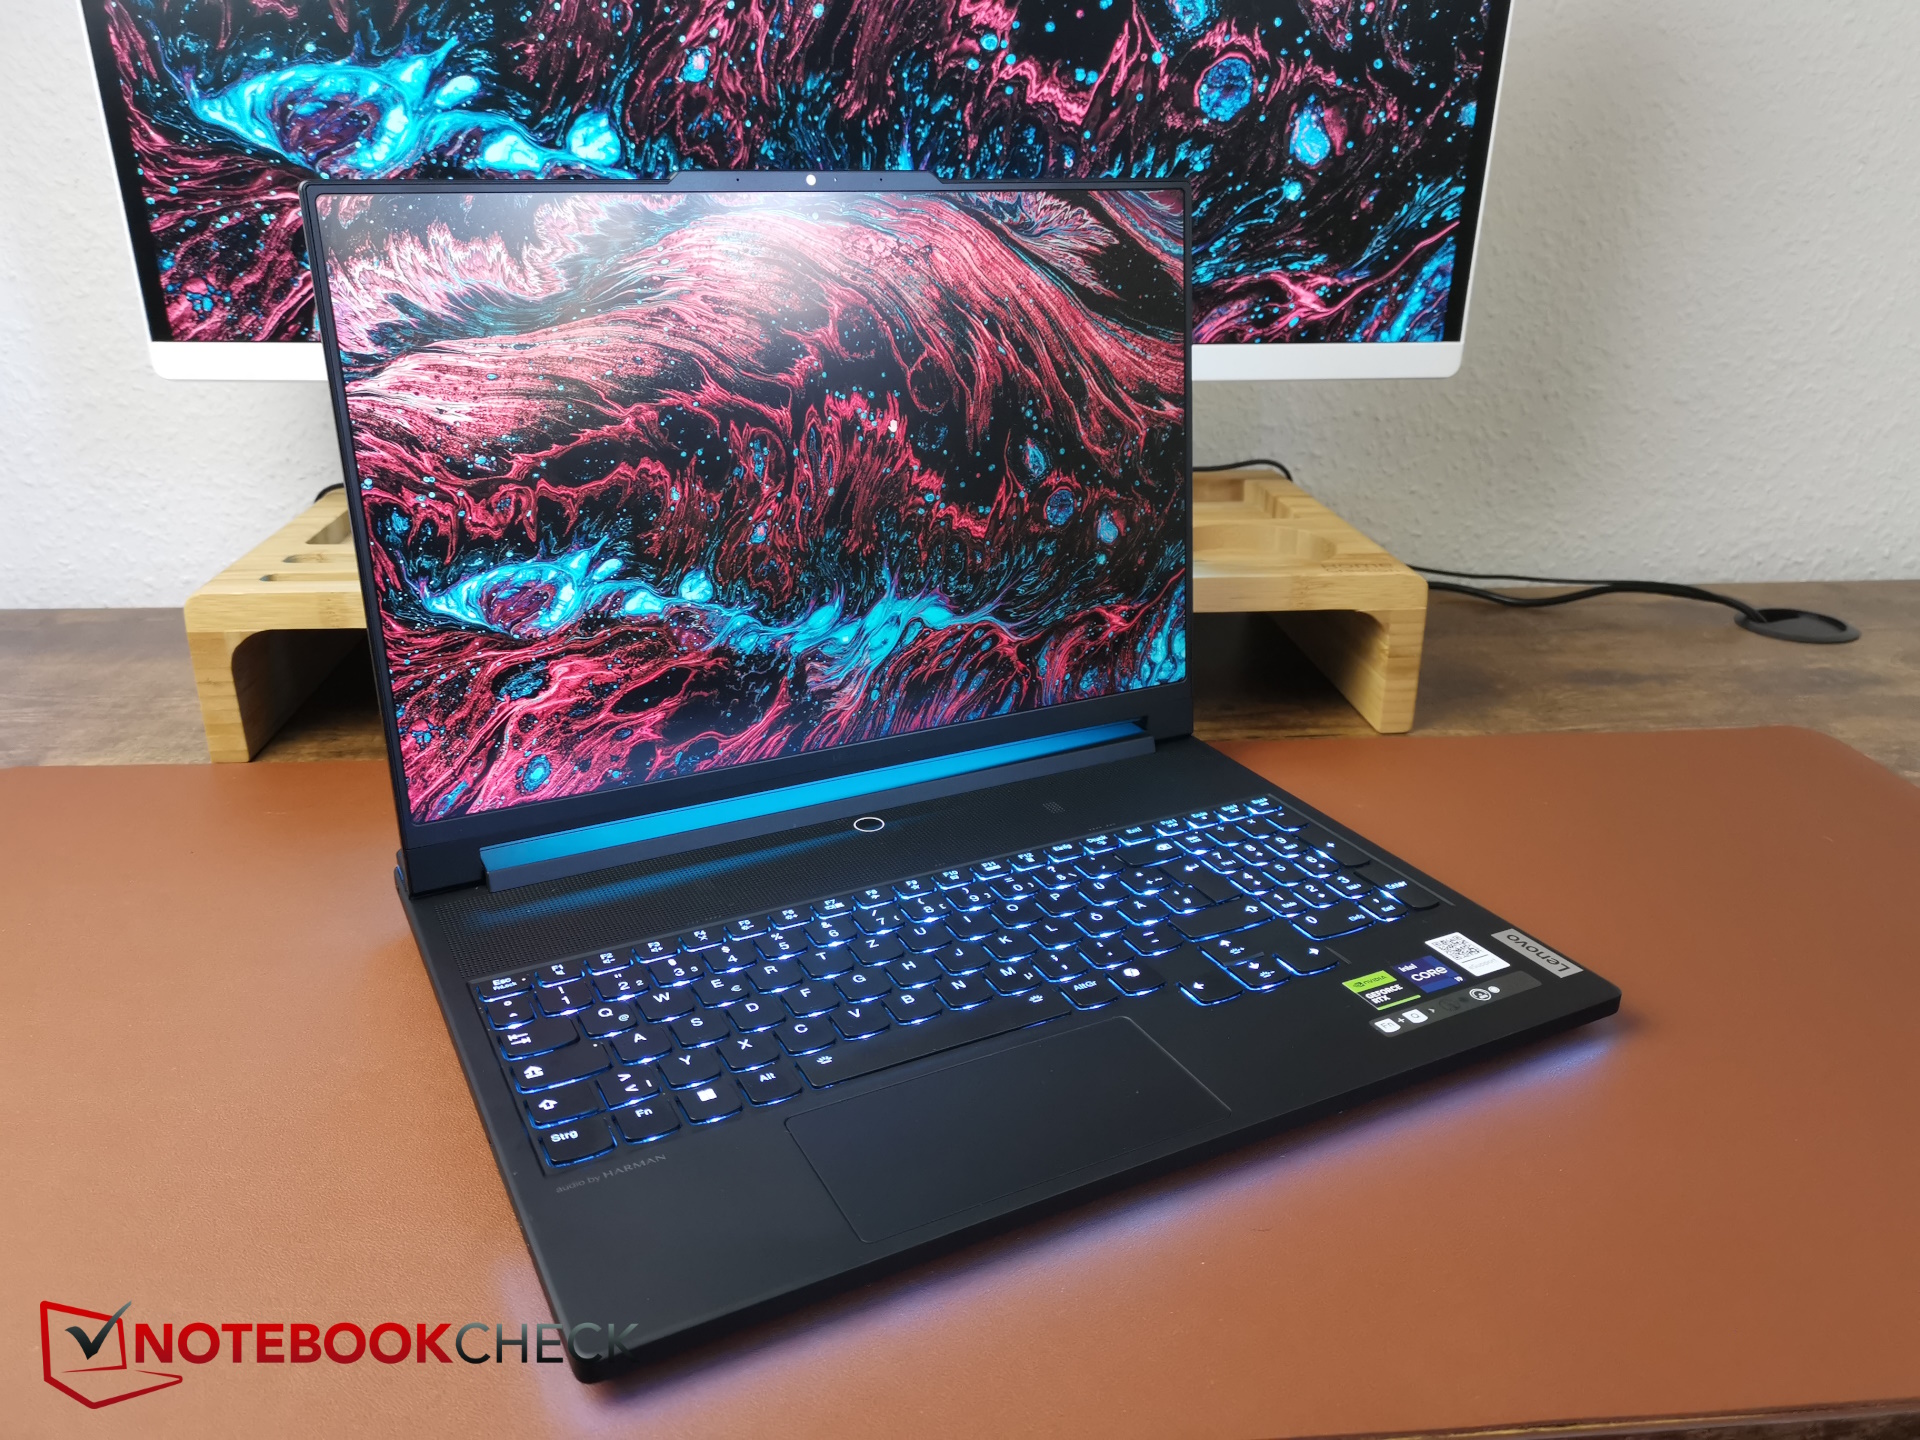
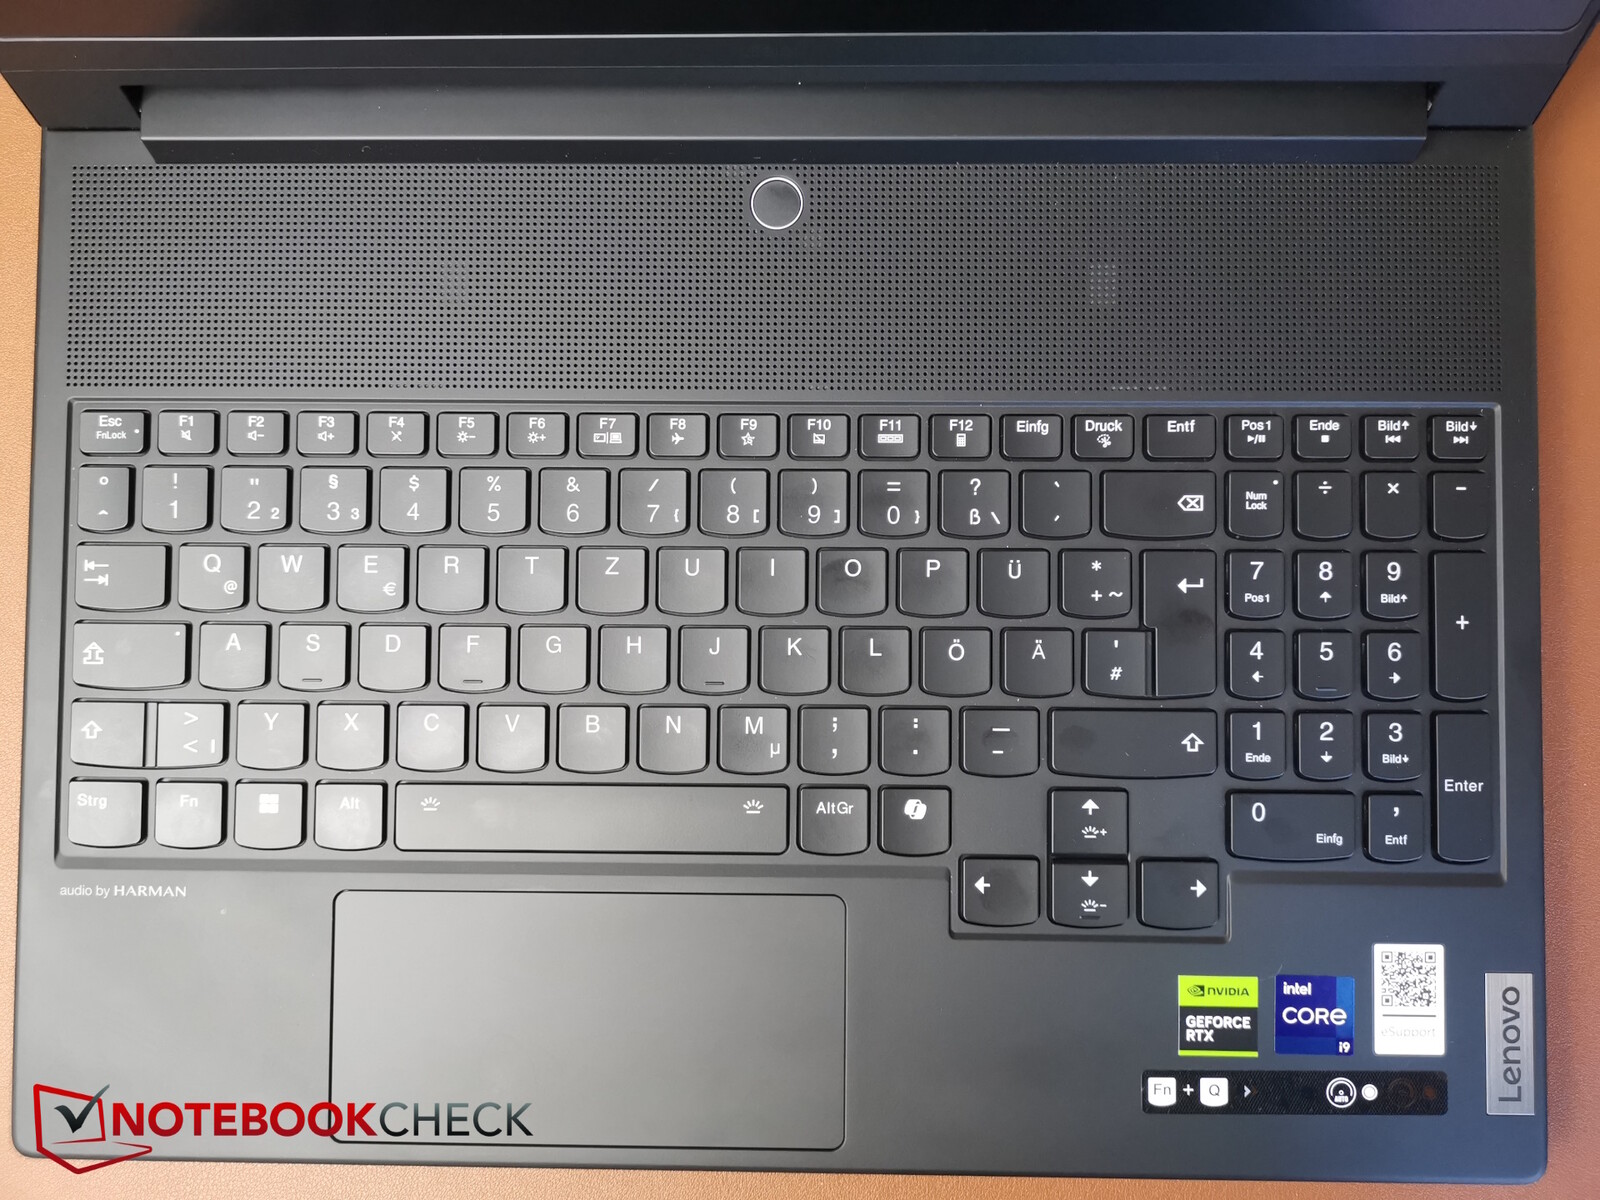
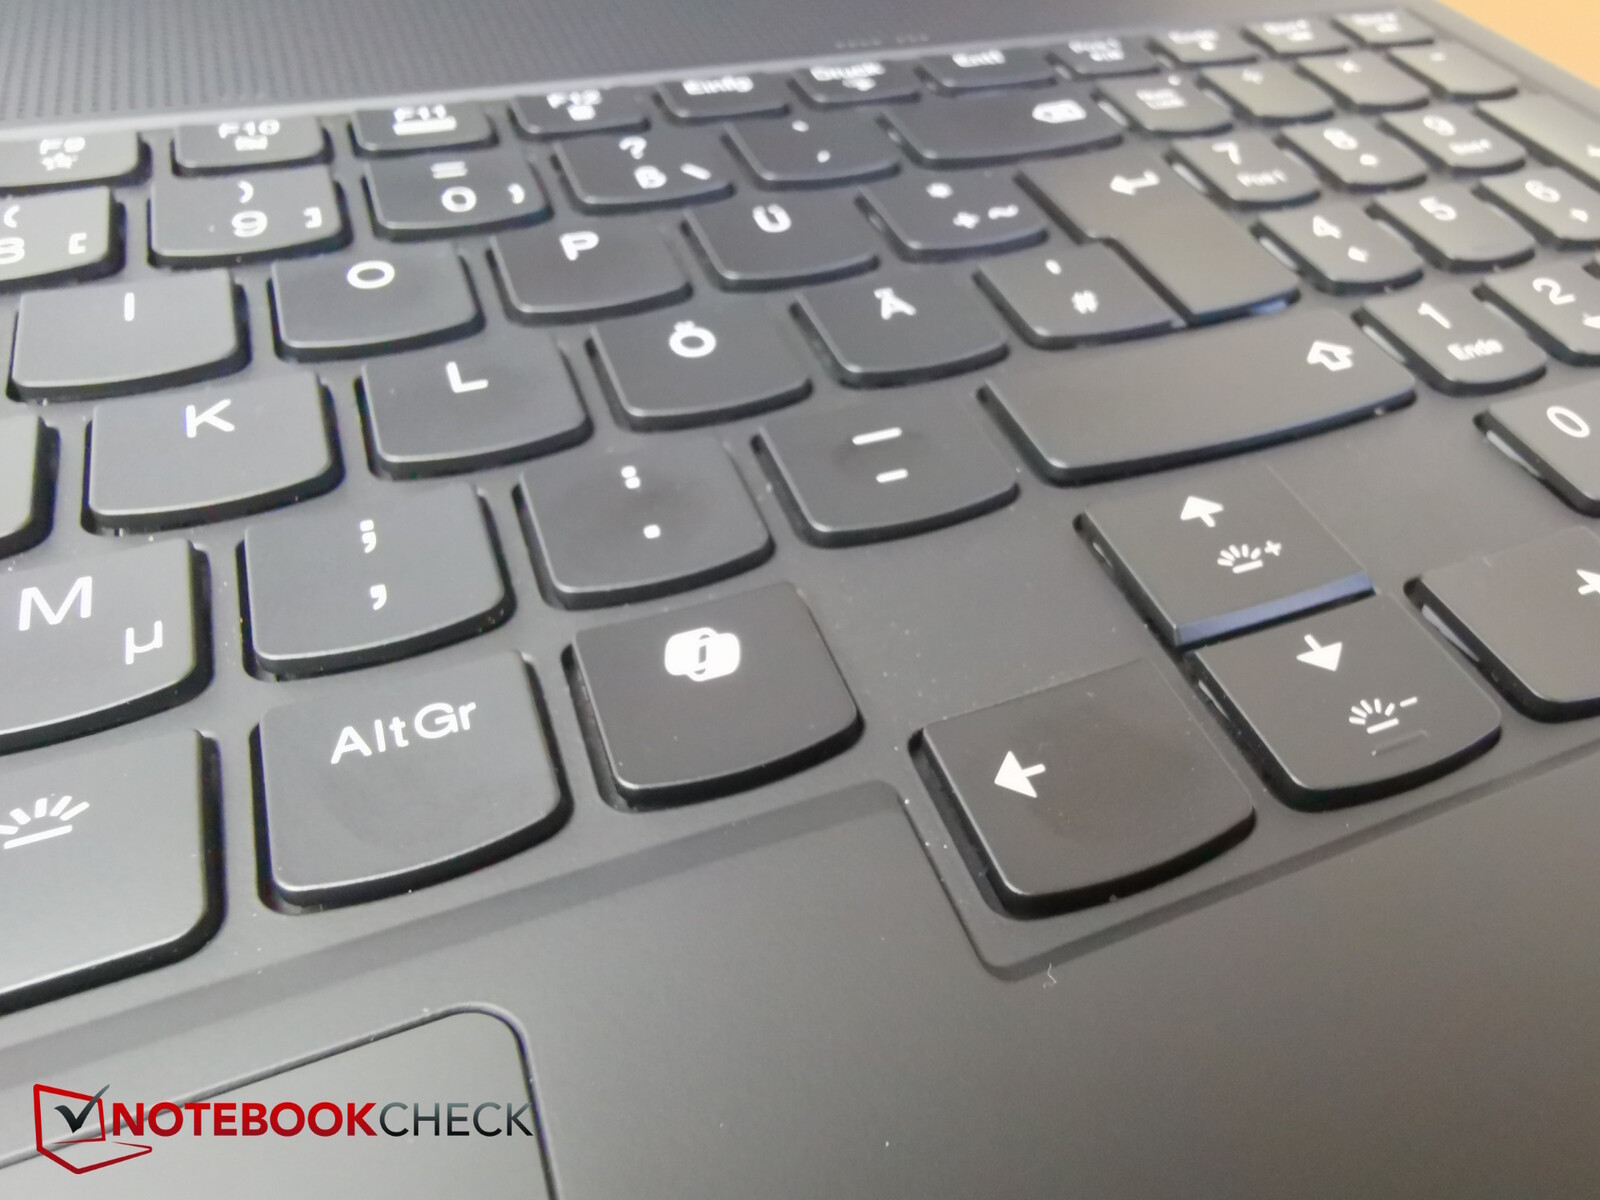
Inmatningsenheter - nu med Co-Pilot
Dess bekväma membrantangentbord och pekplatta förblir i stort sett oförändrade. Den sistnämnda är fortfarande mycket smal, bara 5,9 cm. En Co-Pilot-tangent har nu lagts till på tangentbordet. Den högra Ctrl-tangenten har fått ge vika för denna.

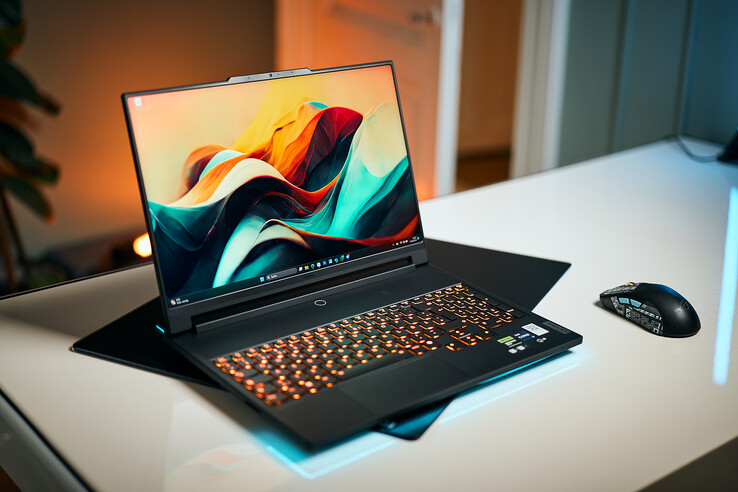
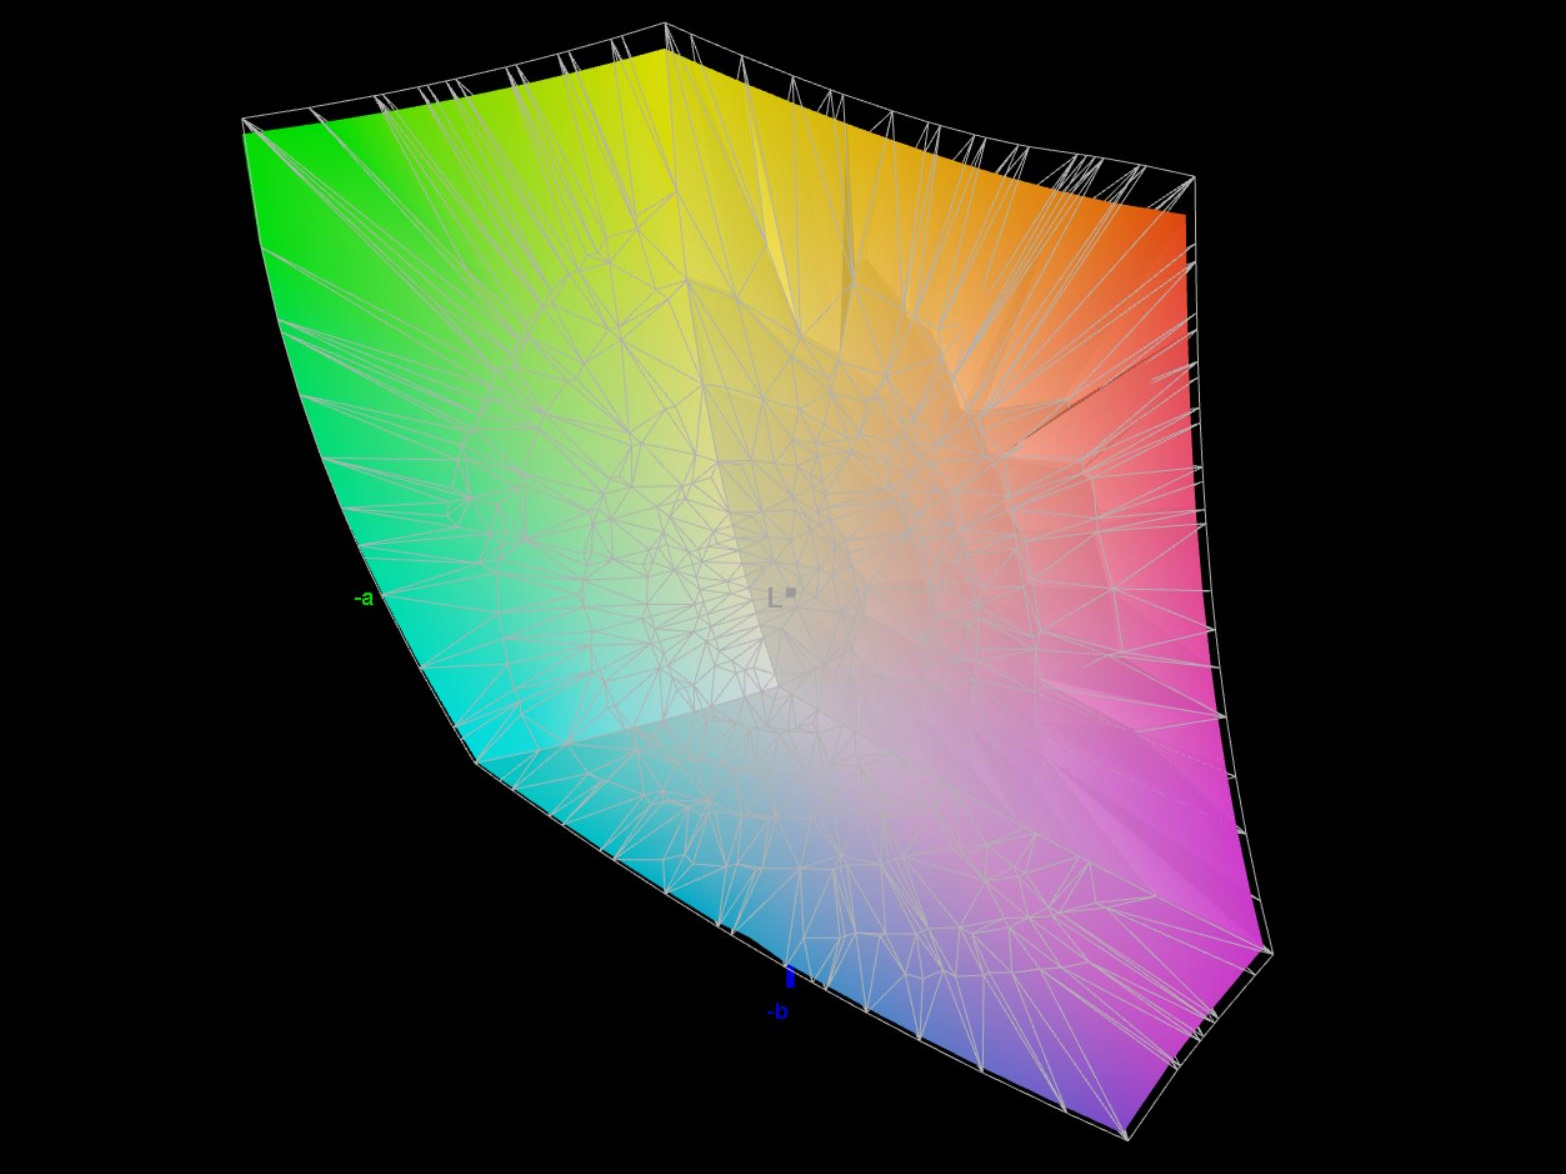
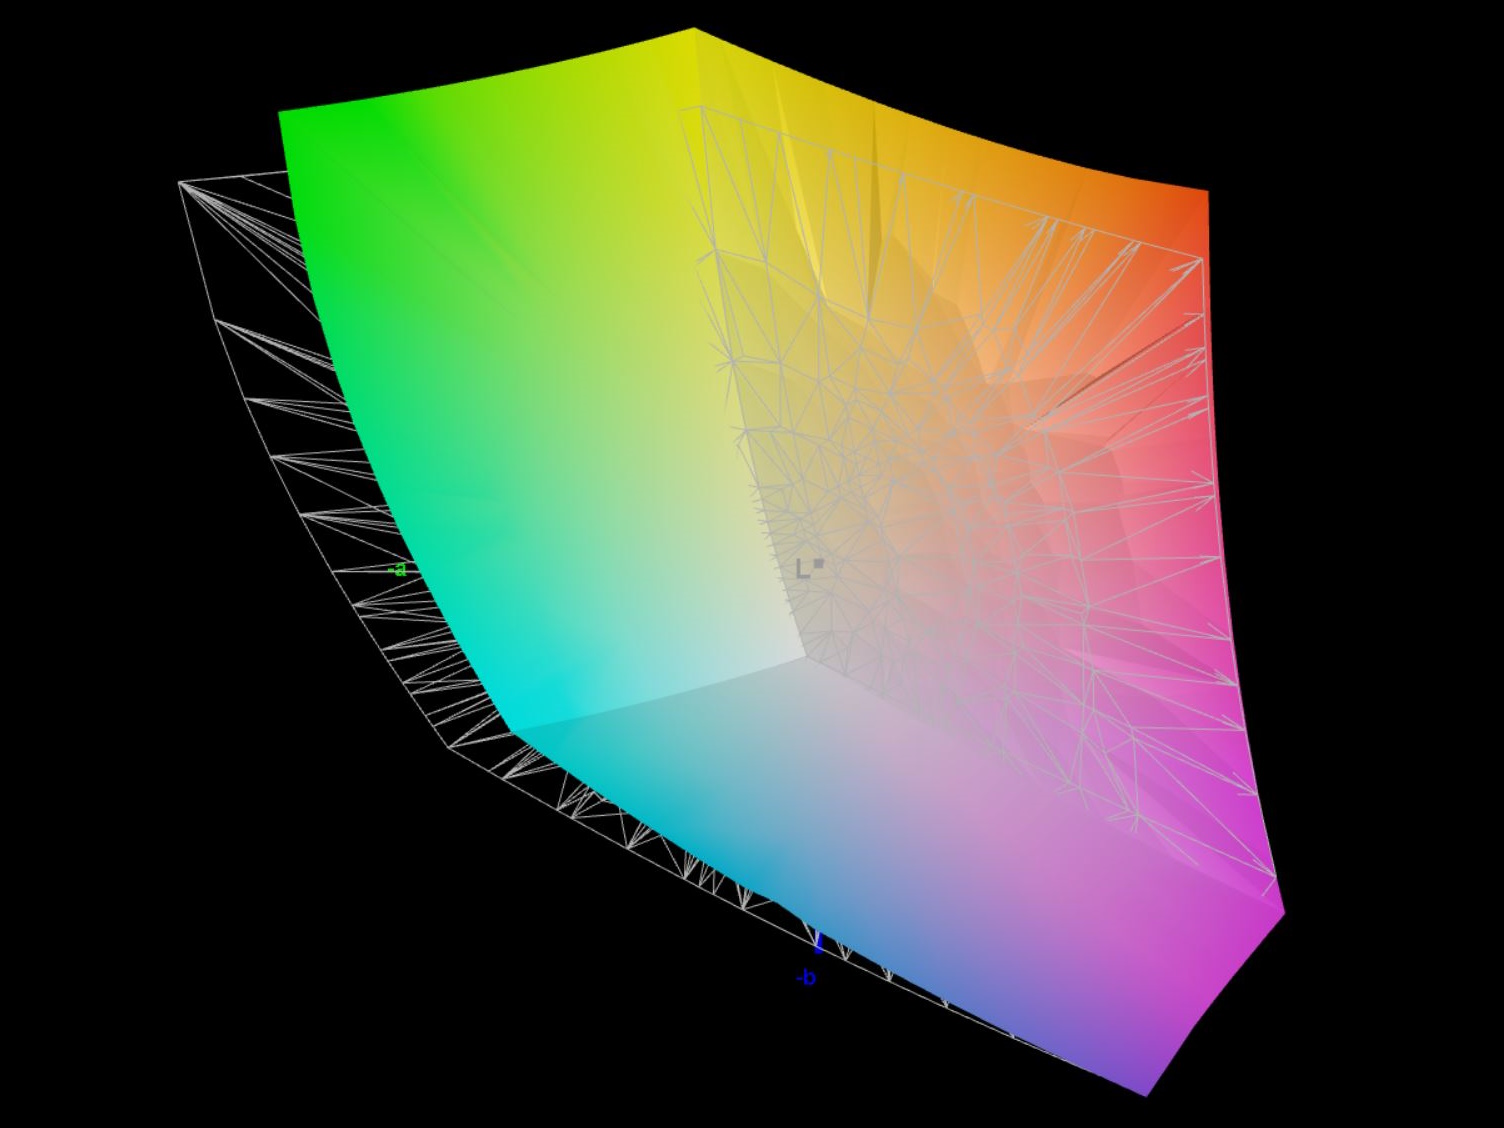
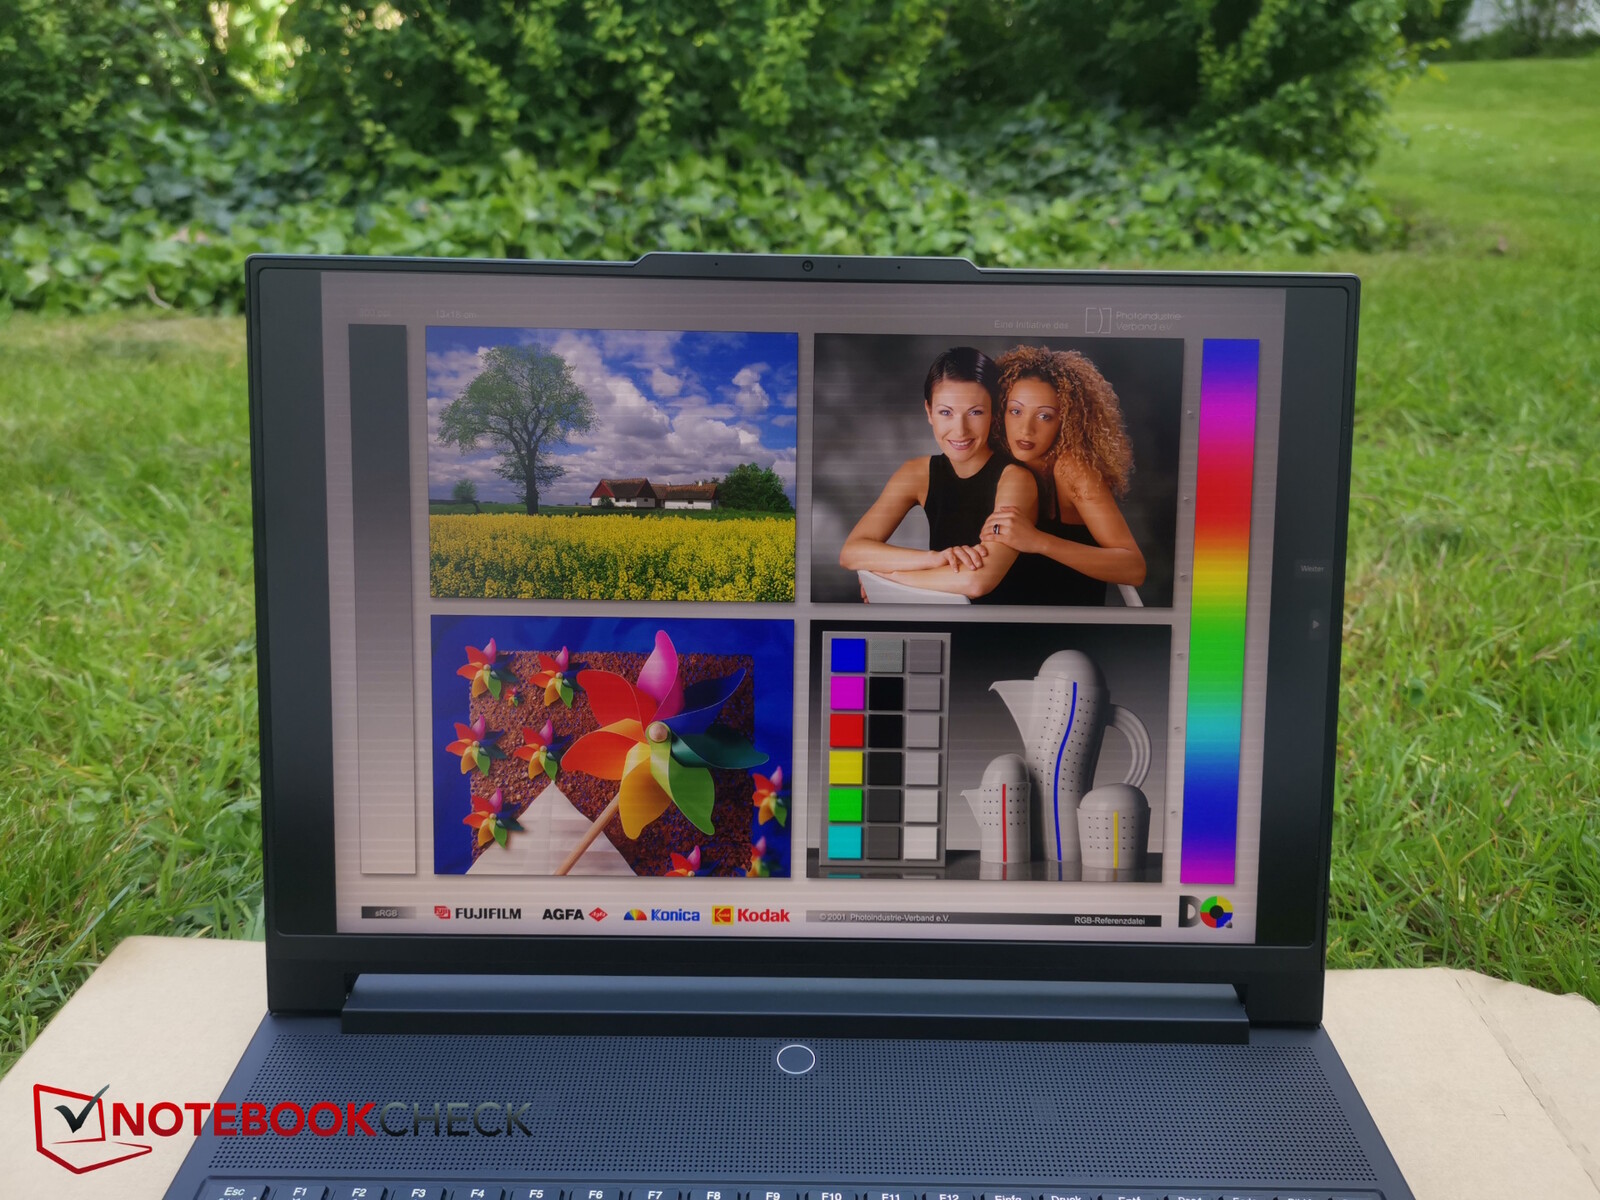
Display - 1.200-nits MiniLED
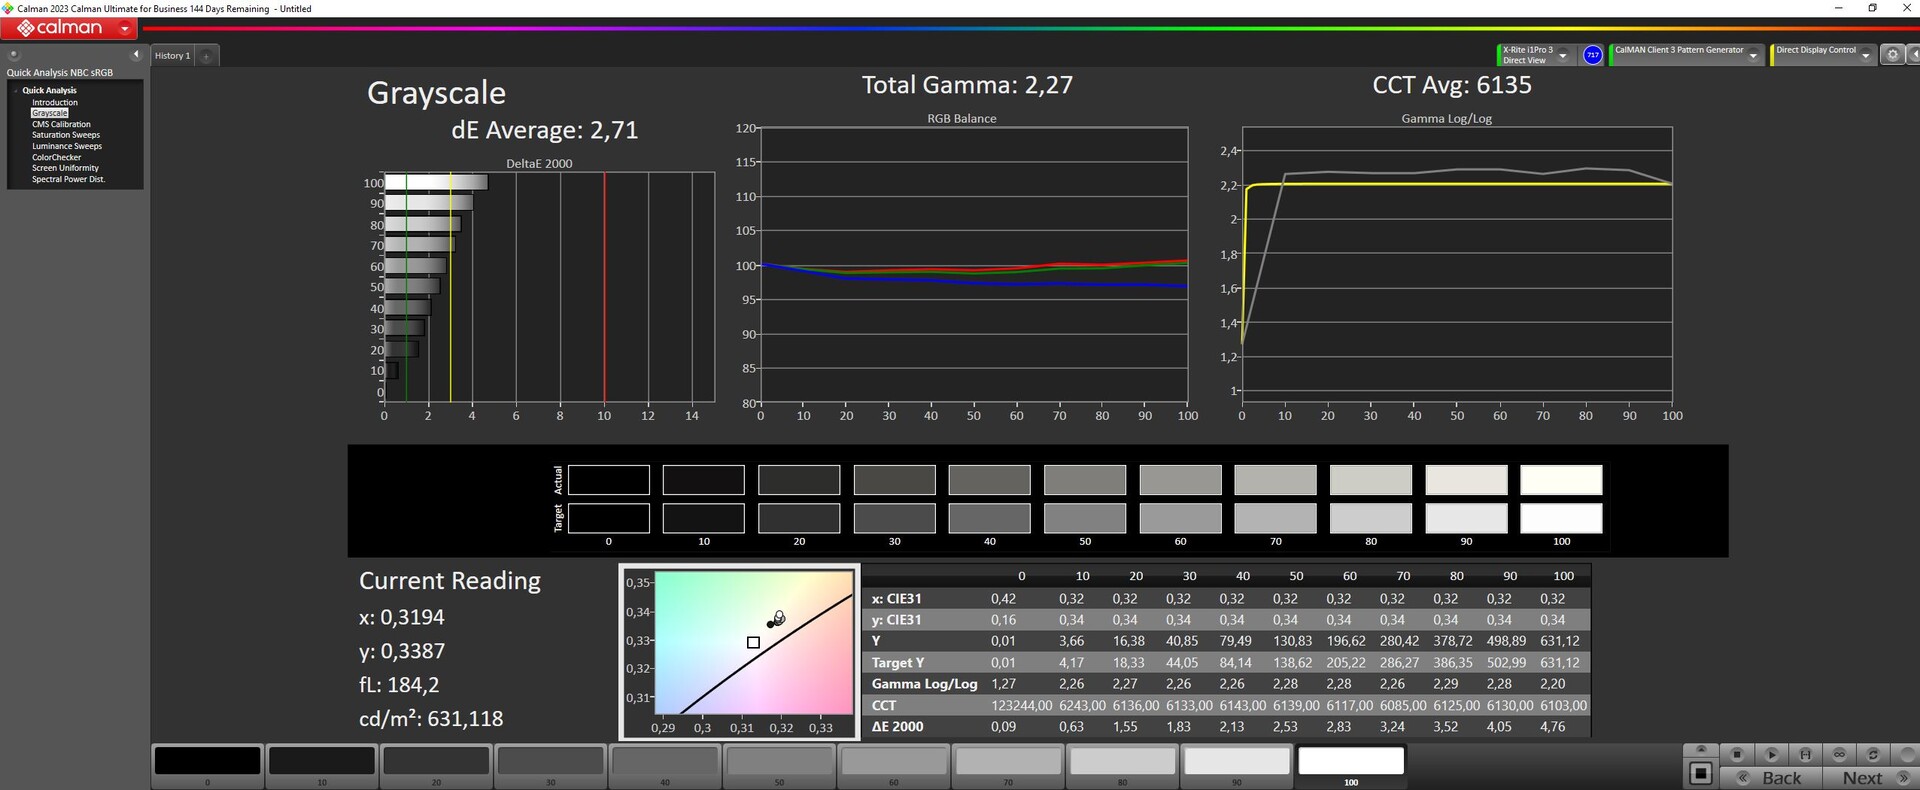
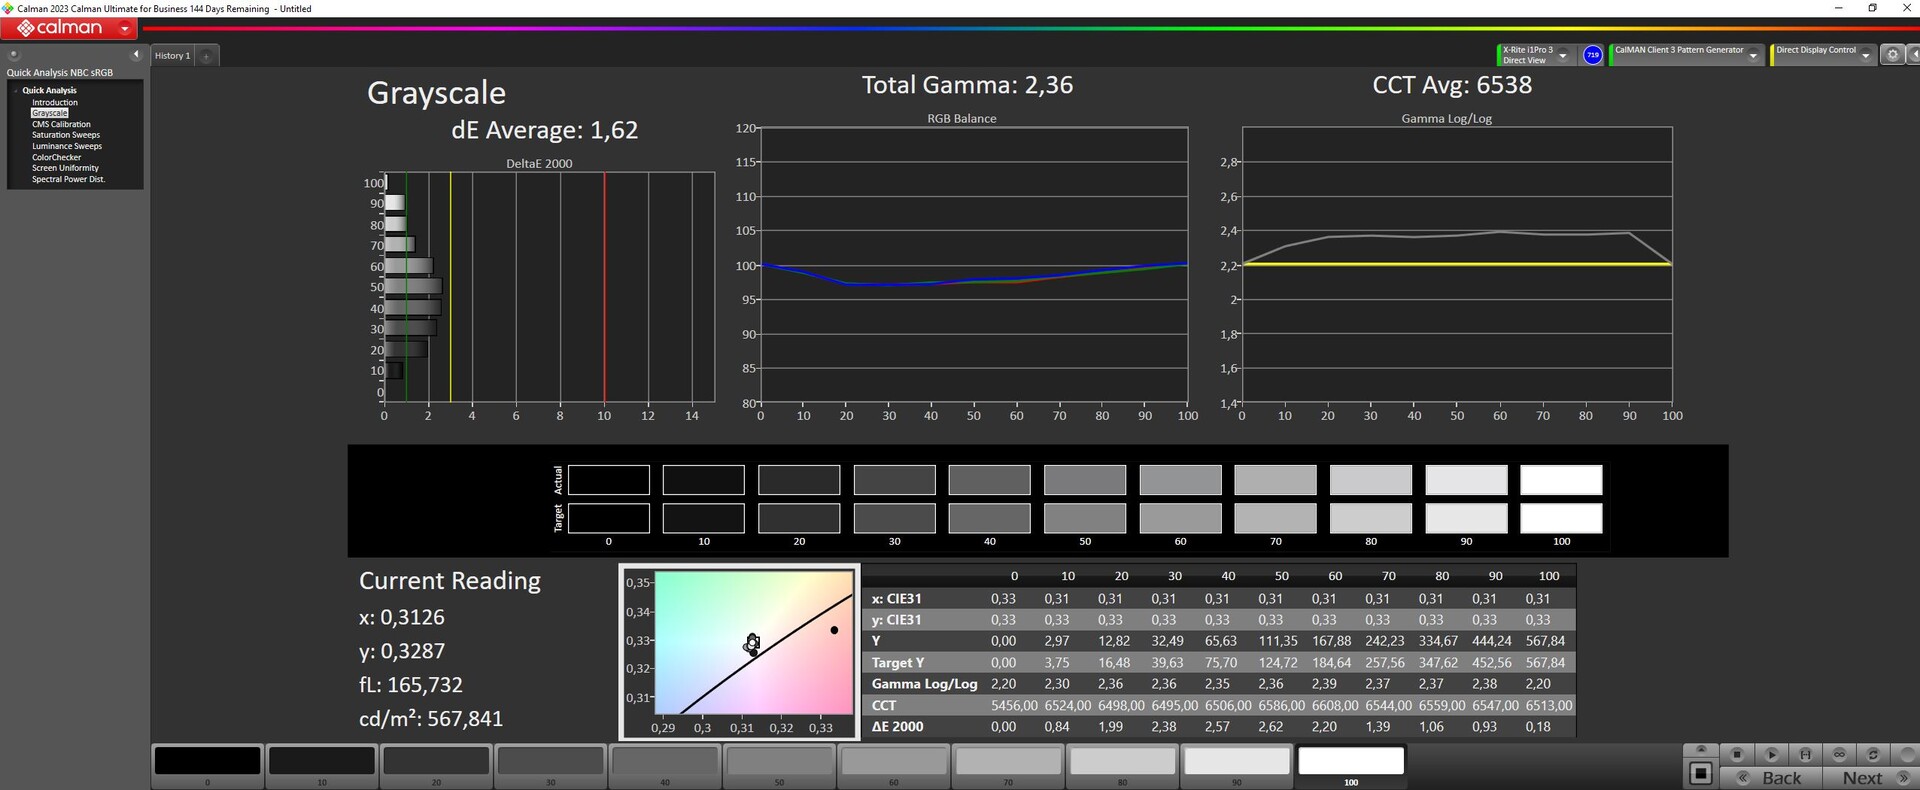
Den 16-tums 3,2K (3.200 x 2.000) mini LED-skärmen med Dolby Vision och G-Sync är fortfarande en av huvudattraktionerna i Legion 9. Den sägs ha en ljusstyrka på upp till 1 200 nits och uppfyller därför HDR 1000-standarden. Vi uppmätte faktiskt mer än 1.000 nits i HDR-läge.
I SD-läge med bättre färgprecision lyser skärmen fortfarande med ett genomsnitt på 664 nits! Vid 43 procents ljusstyrka ligger ljusstyrkan på cirka 150 nits, vilket är det värde vi använder i vissa av våra batteritester. Svartnivån är utmärkt tack vare minilysdioderna som kan stängas av i många zoner, vilket leder till mycket höga kontraster.
Det finns ingen bakgrundsbelysning som blöder alls och dess svarstider är också tillräckligt snabba, även om de naturligtvis inte är riktigt på OLED-nivå. Vi kunde mäta PWM, om än med en ganska hög frekvens på 5 kHz till 40 kHz, vilket inte borde vara ett problem ens för känsliga personer.
| |||||||||||||||||||||||||
Distribution av ljusstyrkan: 91 %
Mitt på batteriet: 630 cd/m²
Kontrast: 21033:1 (Svärta: 0.03 cd/m²)
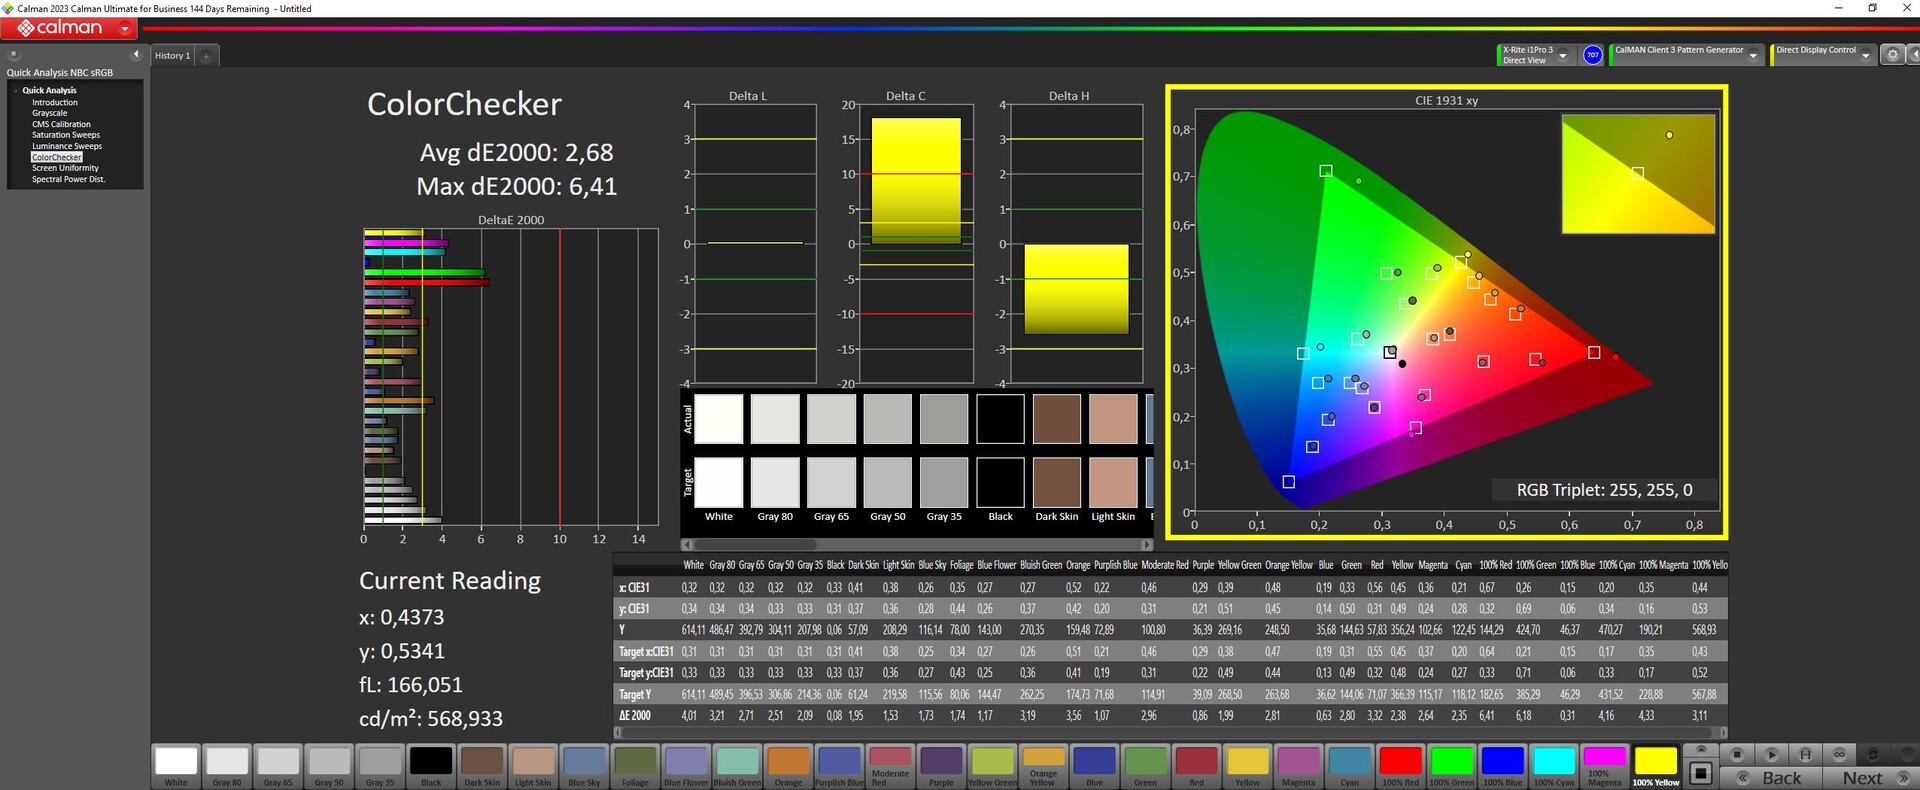
ΔE Color 2.68 | 0.5-29.43 Ø4.87, calibrated: 2.68
ΔE Greyscale 2.71 | 0.5-98 Ø5.1
86.6% AdobeRGB 1998 (Argyll 2.2.0 3D)
99.9% sRGB (Argyll 2.2.0 3D)
95.3% Display P3 (Argyll 2.2.0 3D)
Gamma: 2.27
| Lenovo Legion 9 16IRX9, RTX 4090 CSOT T3 MNG007ZA2-2, MiniLED, 3200x2000, 16" | Lenovo Legion 9 16IRX8 CSOT T3 MNG007ZA2-2, Mini-LED, 3200x2000, 16" | Razer Blade 16 2024, RTX 4090 Samsung SDC41AB (ATNA60DL03-0), OLED, 2560x1600, 16" | Alienware m18 R2 BOE NE18NZ1, IPS, 2560x1600, 18" | Asus ROG Strix Scar 18 G834JYR (2024) BOE NE180QDM-NM1, Mini LED, 2560x1600, 18" | Medion Erazer Beast X40 2024 BOE NE170QDM-NZ1, IPS, 2560x1600, 17" | |
|---|---|---|---|---|---|---|
| Display | 1% | 5% | 2% | 3% | -16% | |
| Display P3 Coverage | 95.3 | 97.2 2% | 99.1 4% | 97.8 3% | 99.9 5% | 68.1 -29% |
| sRGB Coverage | 99.9 | 99.9 0% | 99.9 0% | 99.5 0% | 100 0% | 99.5 0% |
| AdobeRGB 1998 Coverage | 86.6 | 87 0% | 95.6 10% | 88.9 3% | 90 4% | 69 -20% |
| Response Times | -12% | 37% | 27% | 1% | 19% | |
| Response Time Grey 50% / Grey 80% * | 12.6 ? | 13.3 ? -6% | 0.24 ? 98% | 5.3 ? 58% | 12 ? 5% | 11.7 ? 7% |
| Response Time Black / White * | 10 ? | 11.6 ? -16% | 0.4 ? 96% | 10.4 ? -4% | 10.7 ? -7% | 6.9 ? 31% |
| PWM Frequency | 5430 | 4742 -13% | 960 -82% | 5733 ? 6% | ||
| Screen | -0% | 21% | -107% | 14% | -136% | |
| Brightness middle | 631 | 674.9 7% | 418 -34% | 271.8 -57% | 937 48% | 422 -33% |
| Brightness | 664 | 682 3% | 420 -37% | 275 -59% | 934 41% | 388 -42% |
| Brightness Distribution | 91 | 96 5% | 98 8% | 78 -14% | 89 -2% | 87 -4% |
| Black Level * | 0.03 | 0.04 -33% | 0.02 33% | 0.27 -800% | 0.066 -120% | 0.42 -1300% |
| Contrast | 21033 | 16873 -20% | 20900 -1% | 1007 -95% | 14197 -33% | 1005 -95% |
| Colorchecker dE 2000 * | 2.68 | 2.56 4% | 1.07 60% | 2.48 7% | 1.52 43% | 1.42 47% |
| Colorchecker dE 2000 max. * | 6.41 | 4.16 35% | 4.04 37% | 5.59 13% | 2.82 56% | 1.97 69% |
| Colorchecker dE 2000 calibrated * | 2.68 | 2.47 8% | 1.07 60% | 0.56 79% | 1.21 55% | 0.7 74% |
| Greyscale dE 2000 * | 2.71 | 3 -11% | 1.12 59% | 3.7 -37% | 1.7 37% | 1.2 56% |
| Gamma | 2.27 97% | 2.38 92% | 2.29 96% | 2.2 100% | 2.042 108% | 2.078 106% |
| CCT | 6135 106% | 6799 96% | 6417 101% | 6355 102% | 6578 99% | 6581 99% |
| Totalt genomsnitt (program/inställningar) | -4% /
-2% | 21% /
21% | -26% /
-65% | 6% /
9% | -44% /
-89% |
* ... mindre är bättre
DisplayP3 täcks till cirka 95 procent, sRGB helt och hållet och AdobeRGB till 86-87 procent.
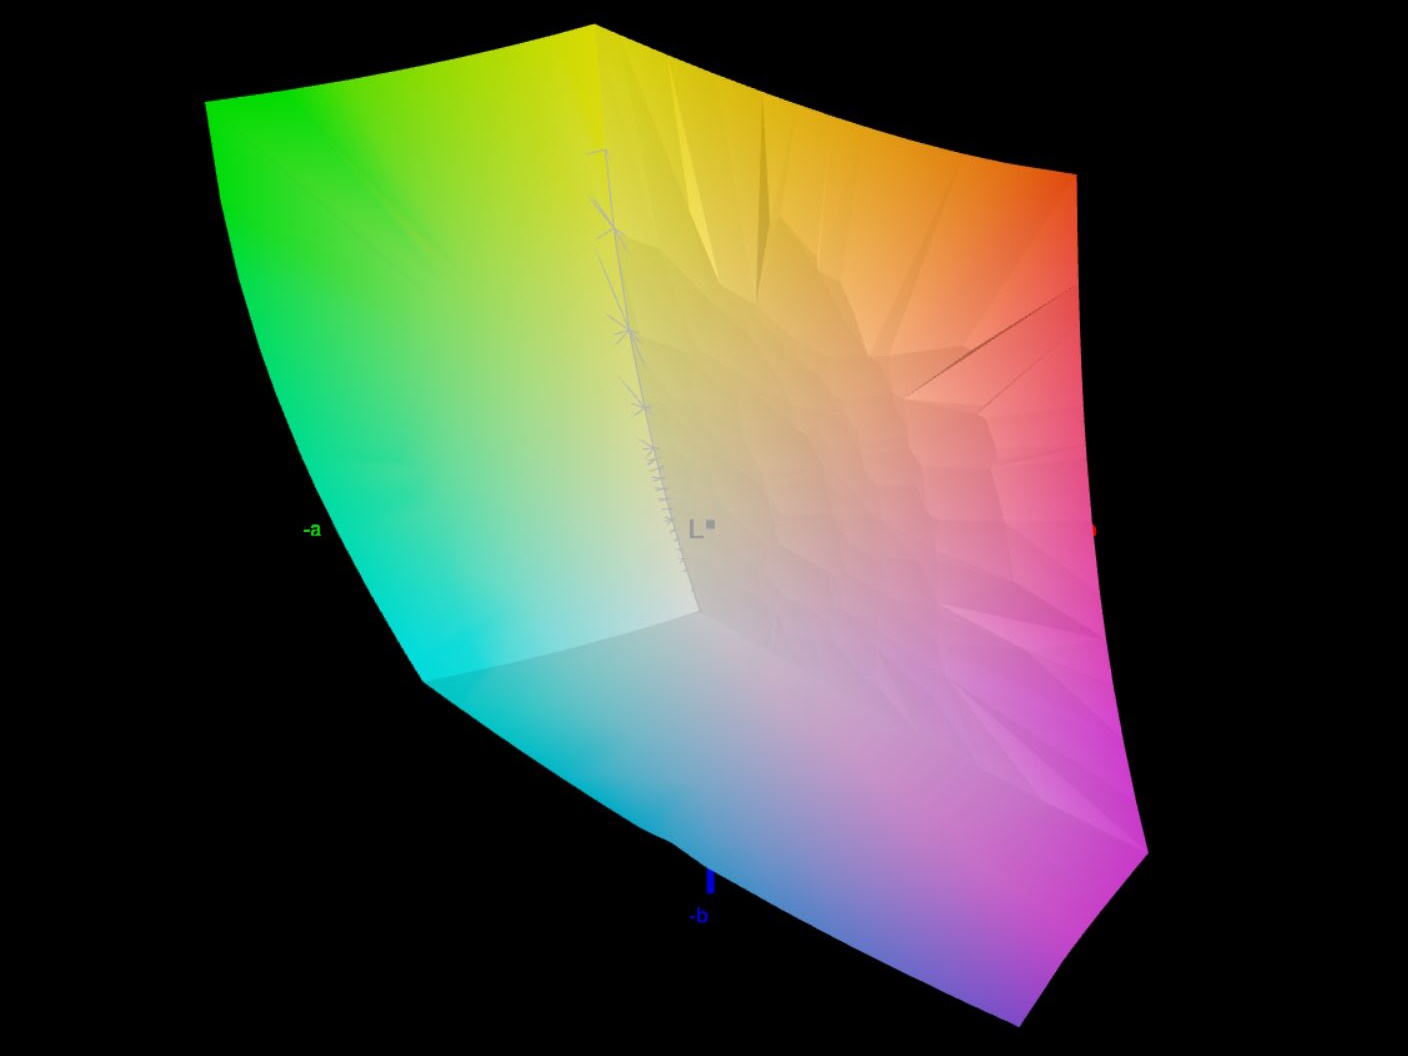
Ex works, skärmen är korrekt kalibrerad mot P3-standarden. Vår omkalibrering förbättrade dess DeltaE-värden för gråskala men försämrade dess DeltaE-värden för ClocChecker, varför det inte är värt ansträngningen. Färgavvikelserna är dock inte idealiska med ett genomsnitt på 2,68 och avvikelser på upp till 6,41.

Visa svarstider
| ↔ Svarstid svart till vitt | ||
|---|---|---|
| 10 ms ... stiga ↗ och falla ↘ kombinerat | ↗ 5.2 ms stiga |  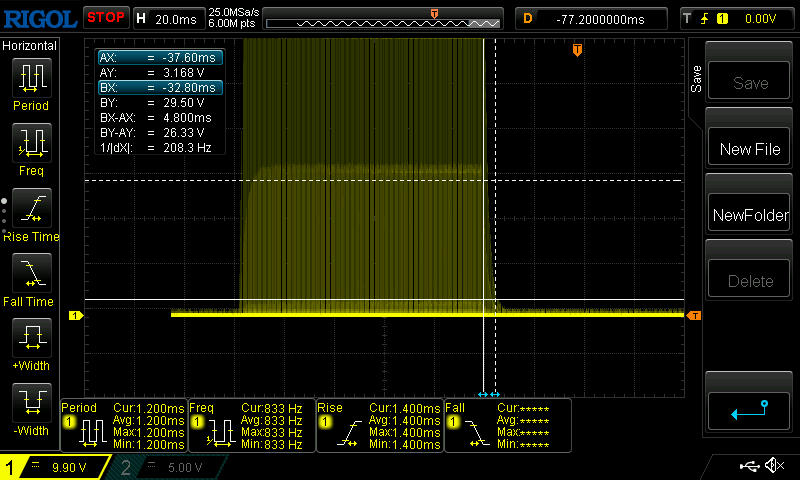 |
| ↘ 4.8 ms hösten | ||
| Skärmen visar bra svarsfrekvens i våra tester, men kan vara för långsam för konkurrenskraftiga spelare. I jämförelse sträcker sig alla testade enheter från 0.1 (minst) till 240 (maximalt) ms. » 24 % av alla enheter är bättre. Det betyder att den uppmätta svarstiden är bättre än genomsnittet av alla testade enheter (20.8 ms). | ||
| ↔ Svarstid 50 % grått till 80 % grått | ||
| 12.6 ms ... stiga ↗ och falla ↘ kombinerat | ↗ 6.6 ms stiga | 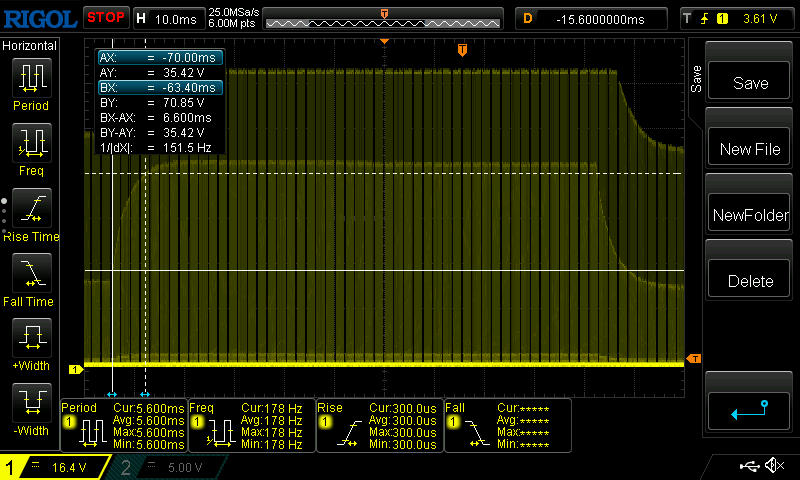 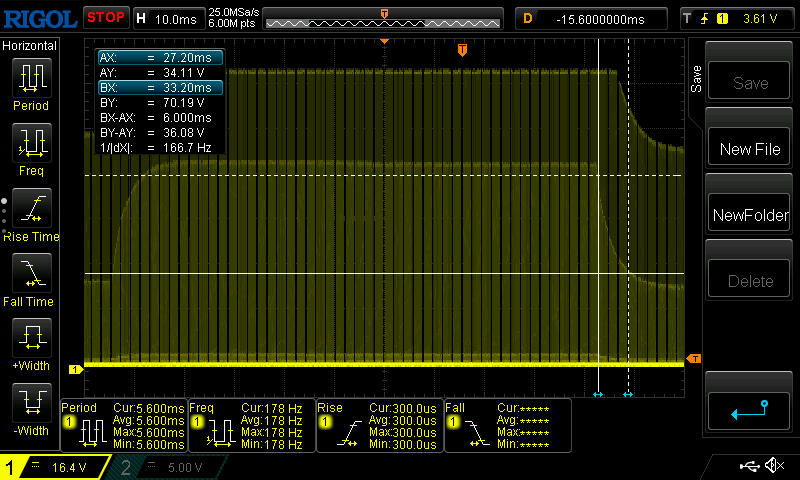 |
| ↘ 6 ms hösten | ||
| Skärmen visar bra svarsfrekvens i våra tester, men kan vara för långsam för konkurrenskraftiga spelare. I jämförelse sträcker sig alla testade enheter från 0.165 (minst) till 636 (maximalt) ms. » 23 % av alla enheter är bättre. Det betyder att den uppmätta svarstiden är bättre än genomsnittet av alla testade enheter (32.5 ms). | ||
Skärmflimmer / PWM (Puls-Width Modulation)
| Skärmflimmer / PWM upptäckt | 5430 Hz Amplitude: 8 % | |
Displayens bakgrundsbelysning flimrar vid 5430 Hz (i värsta fall, t.ex. med PWM) . Frekvensen för 5430 Hz är ganska hög, så de flesta användare som är känsliga för PWM bör inte märka något flimmer. Som jämförelse: 53 % av alla testade enheter använder inte PWM för att dämpa skärmen. Om PWM upptäcktes mättes ett medelvärde av 8516 (minst: 5 - maximum: 343500) Hz. | ||

Utomhus är synligheten ganska god tack vare skärmens höga ljusstyrka och matta yta. Trots detta bör direkt solljus undvikas.

Prestanda - Hög, men inte helt problemfri
Den nya i9-14900HX i kombination med den kraftfulla RTX 4090 och 64 GB RAM gör Legion 9i helt klart till en avancerad spelare. Detta antyds också av den utskjutande designen på baksidan, vilket är anledningen till att skapare kanske letar efter mer subtila alternativ trots enhetens potentiellt höga prestanda.
Testförhållanden
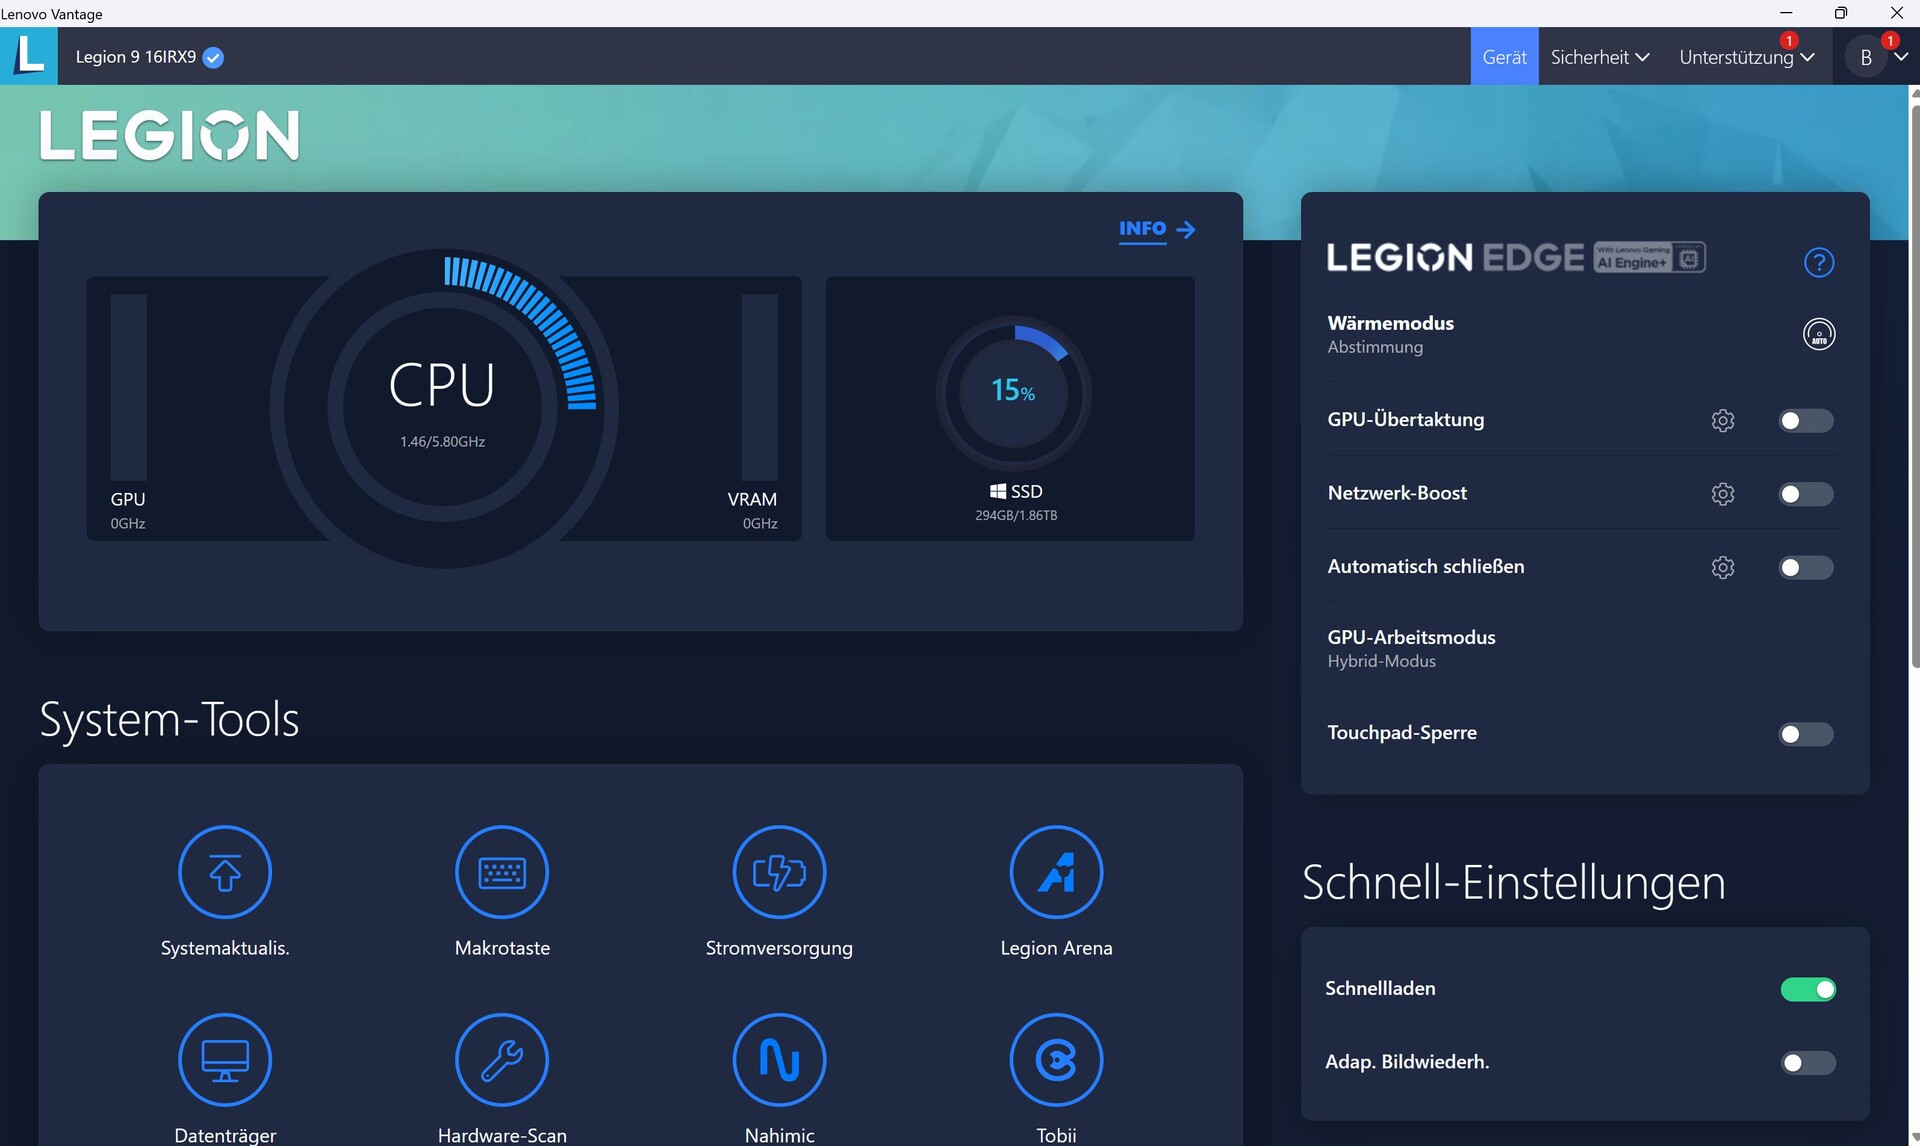
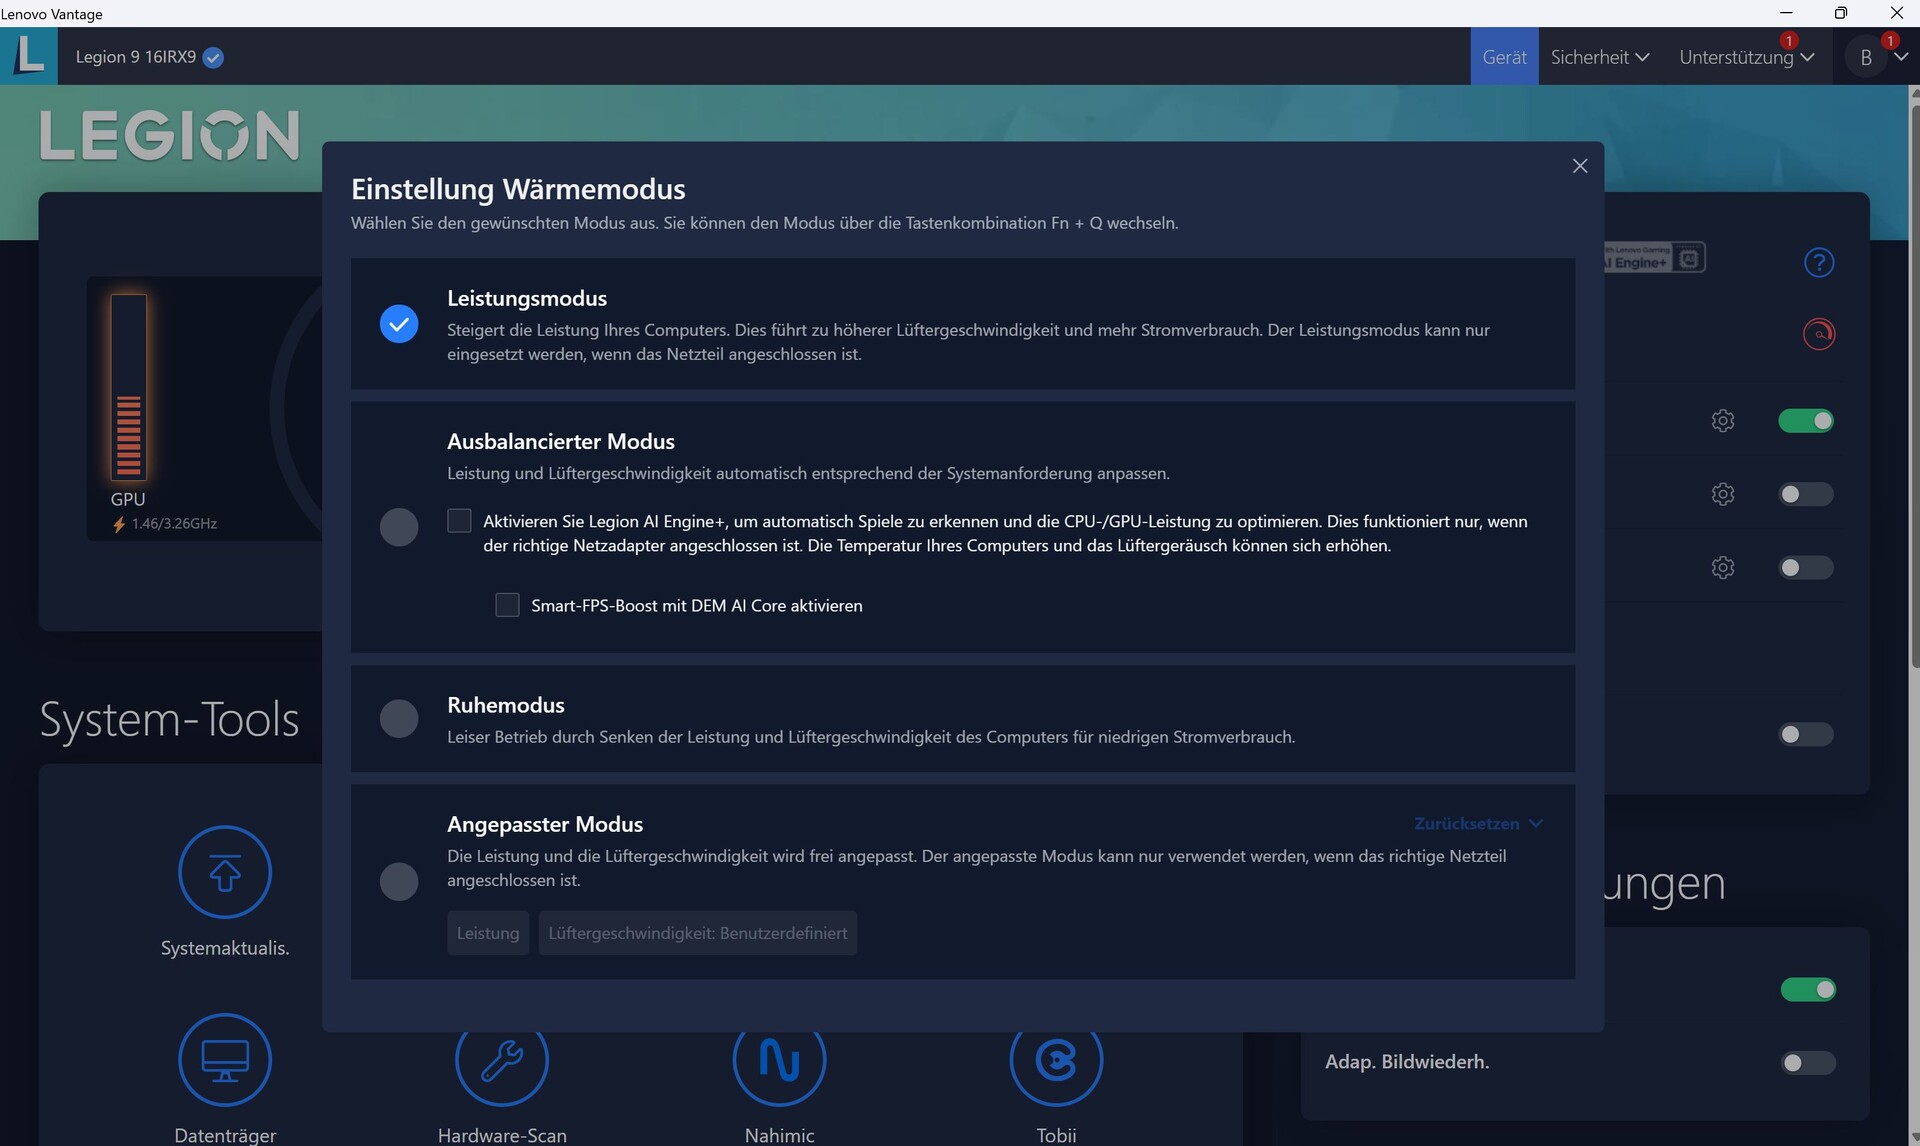
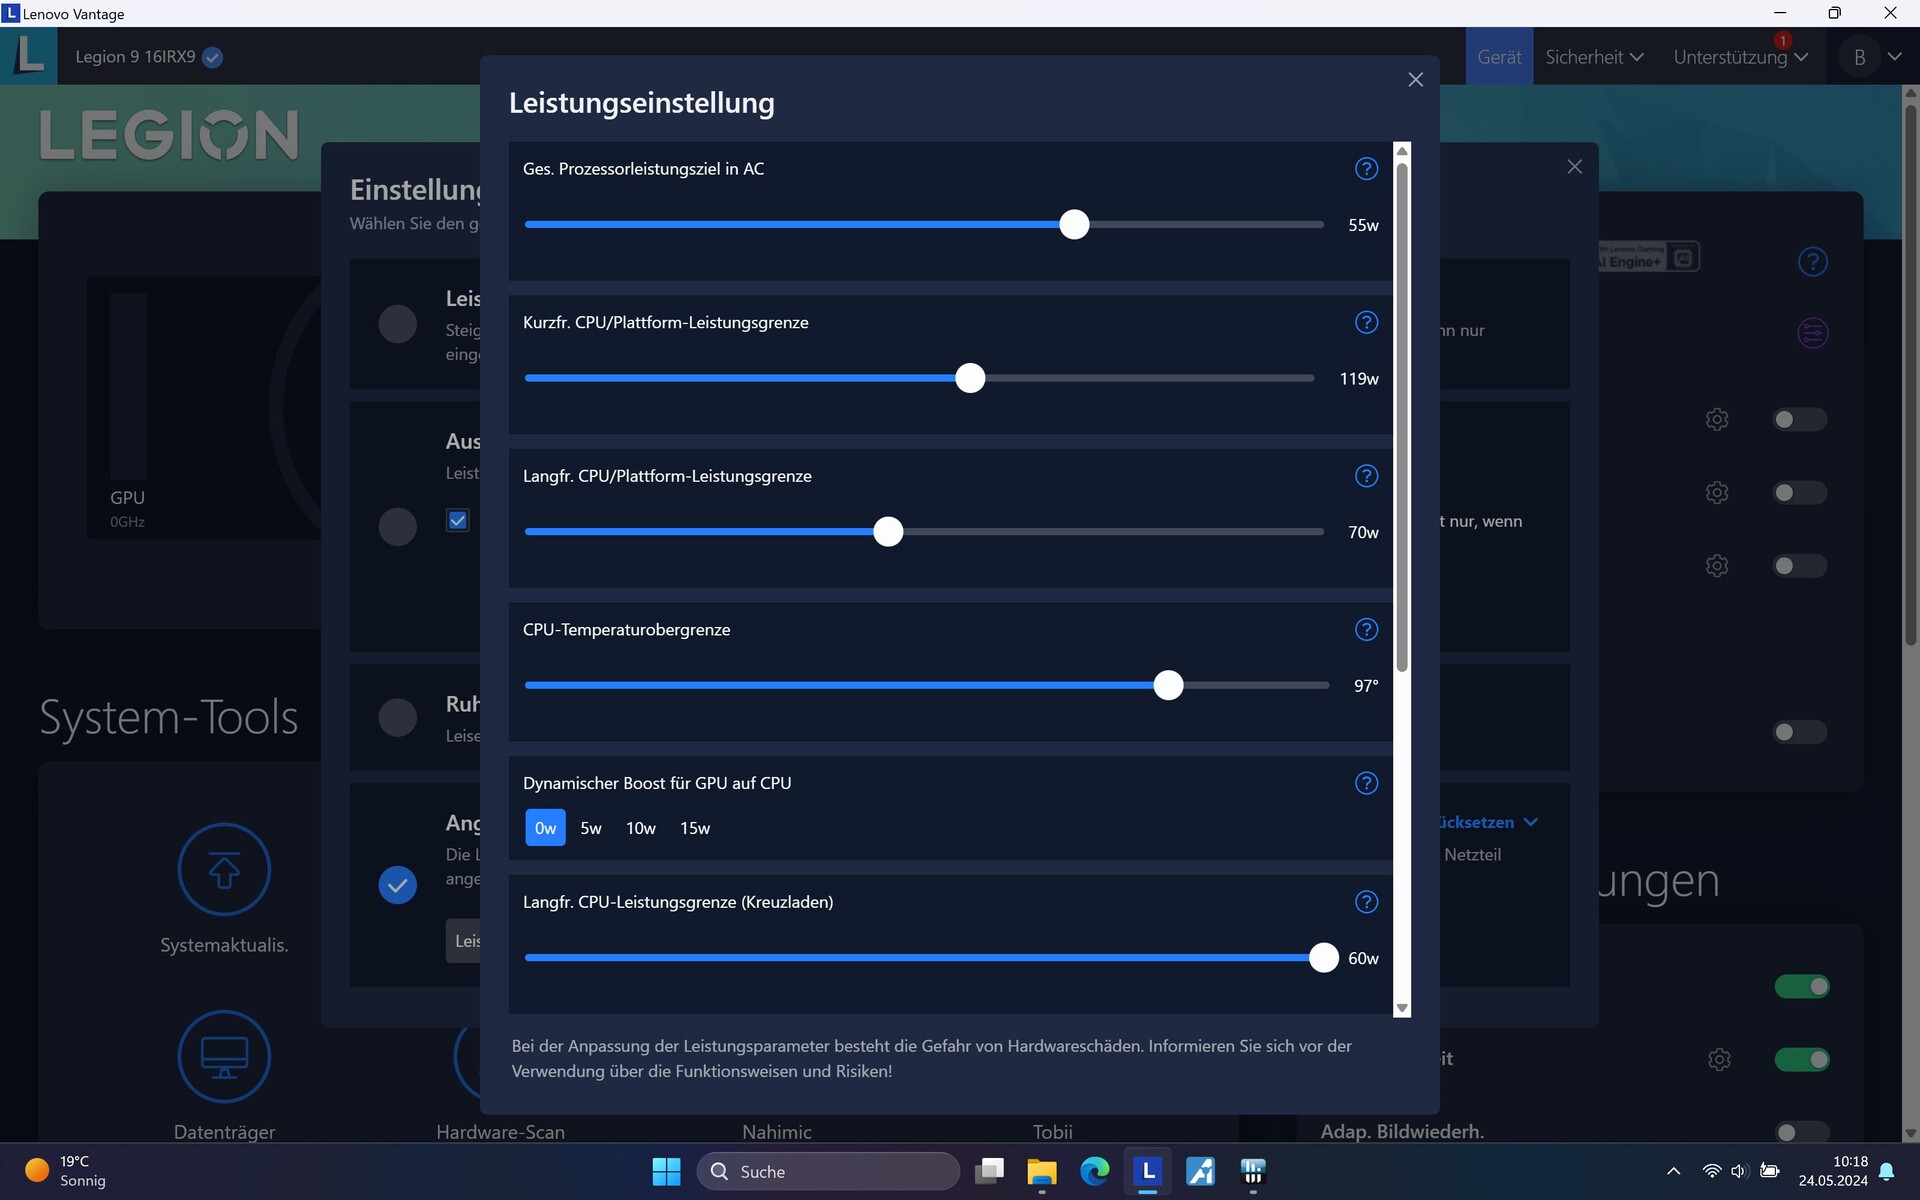
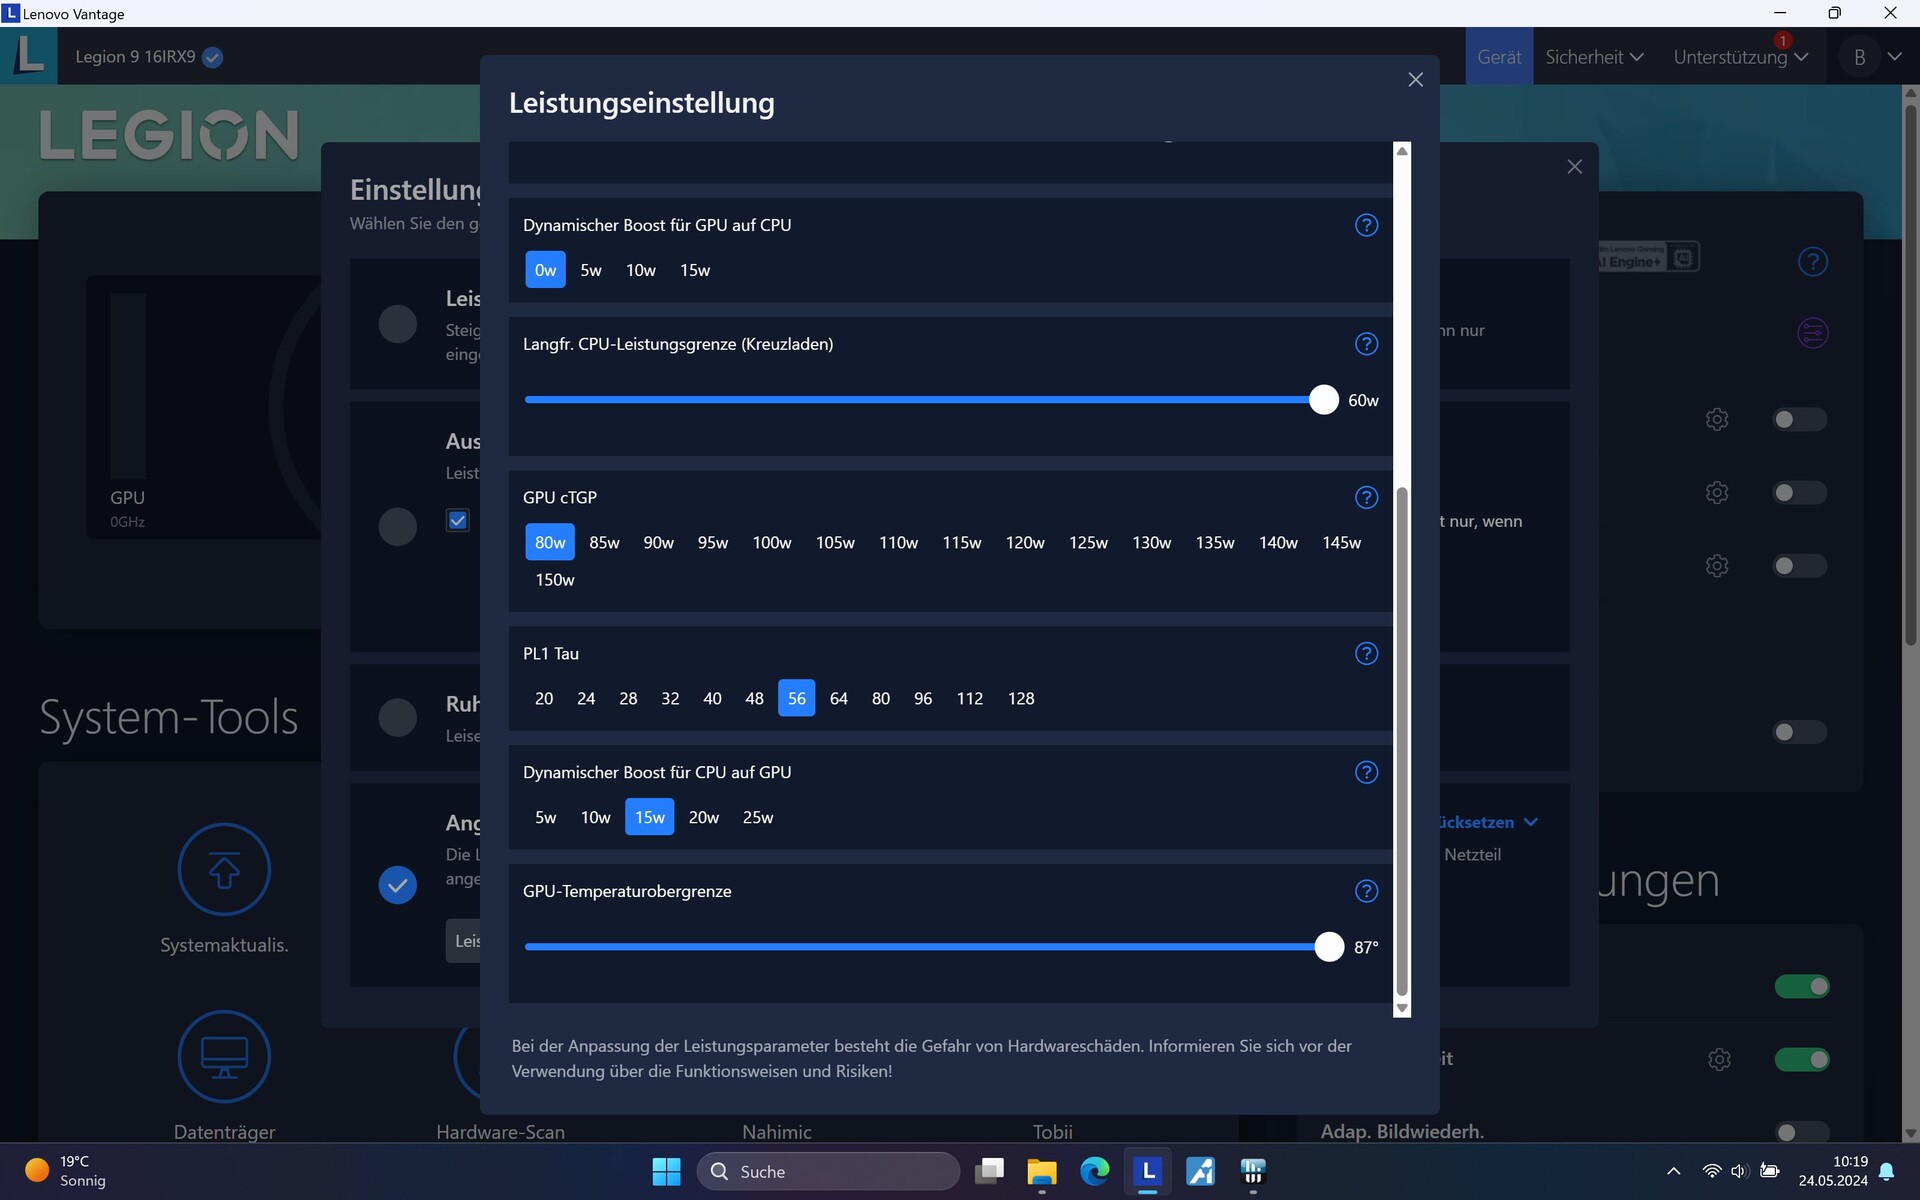
Lenovo Vantage är namnet på Legion 9:s Control Center, och det innehåller prestandaprofilerna Performance, Balanced (här kan du också välja AI för optimering) och Quiet. Det finns också det anpassade läget som låter dig ställa in olika parametrar manuellt.
Tyvärr irriterade Vantage oss ibland med reklam, till exempel för Amazon Music, YouTube-appar etc. Det beror på att marknadsföringsmeddelanden är aktiva som standard i Vantage och att man först måste stänga av dem för att slippa bli störd av dem.
Vi valde läget Prestanda för våra riktmärken, men lämnade omkopplaren för GPU-överklockning avaktiverad.

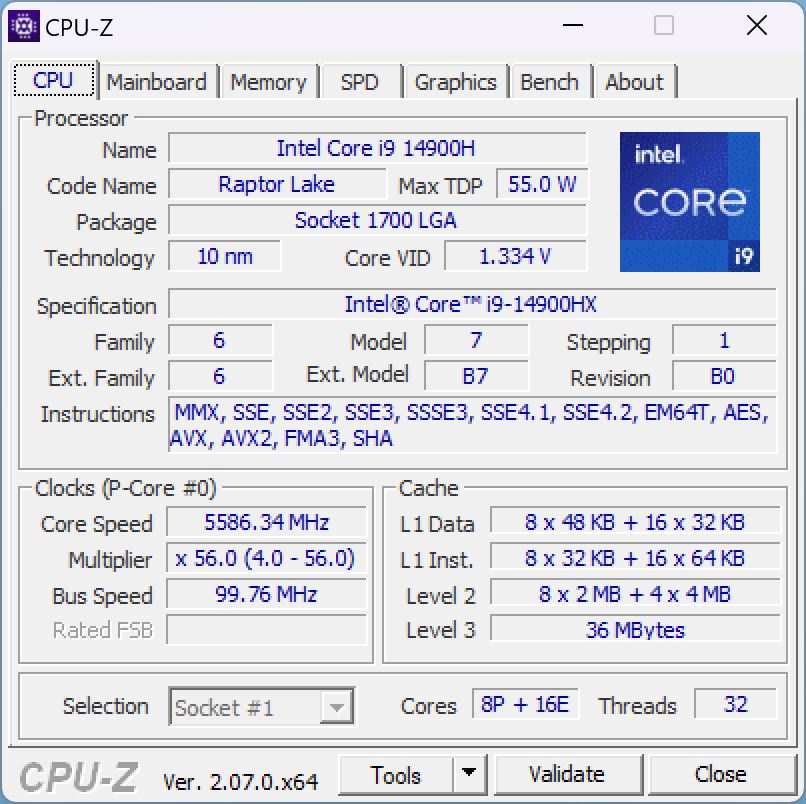
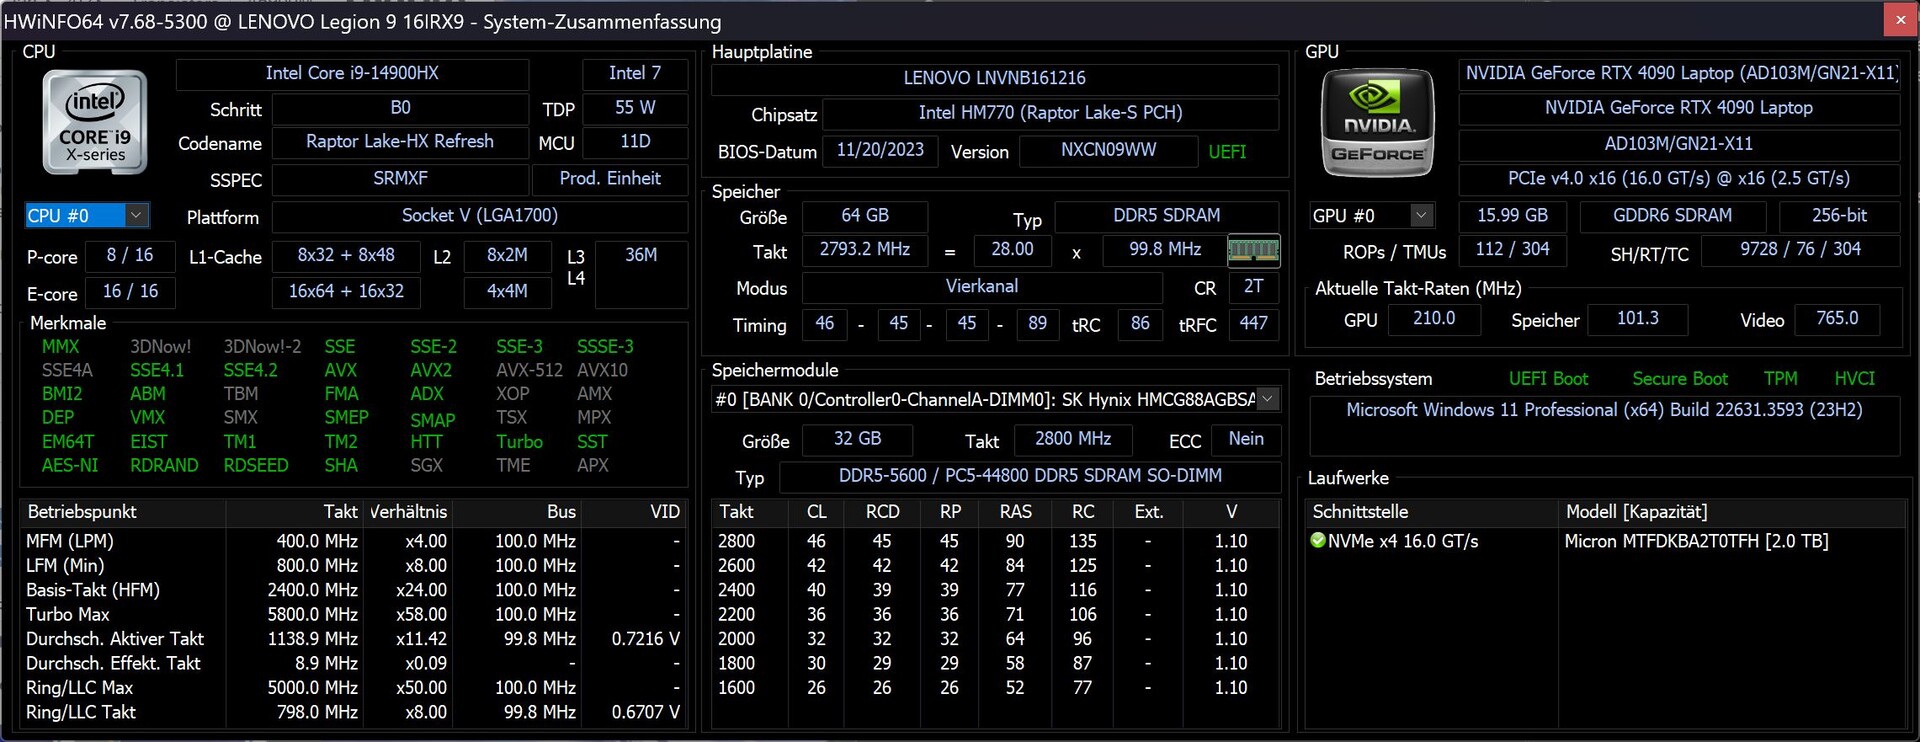
Processor
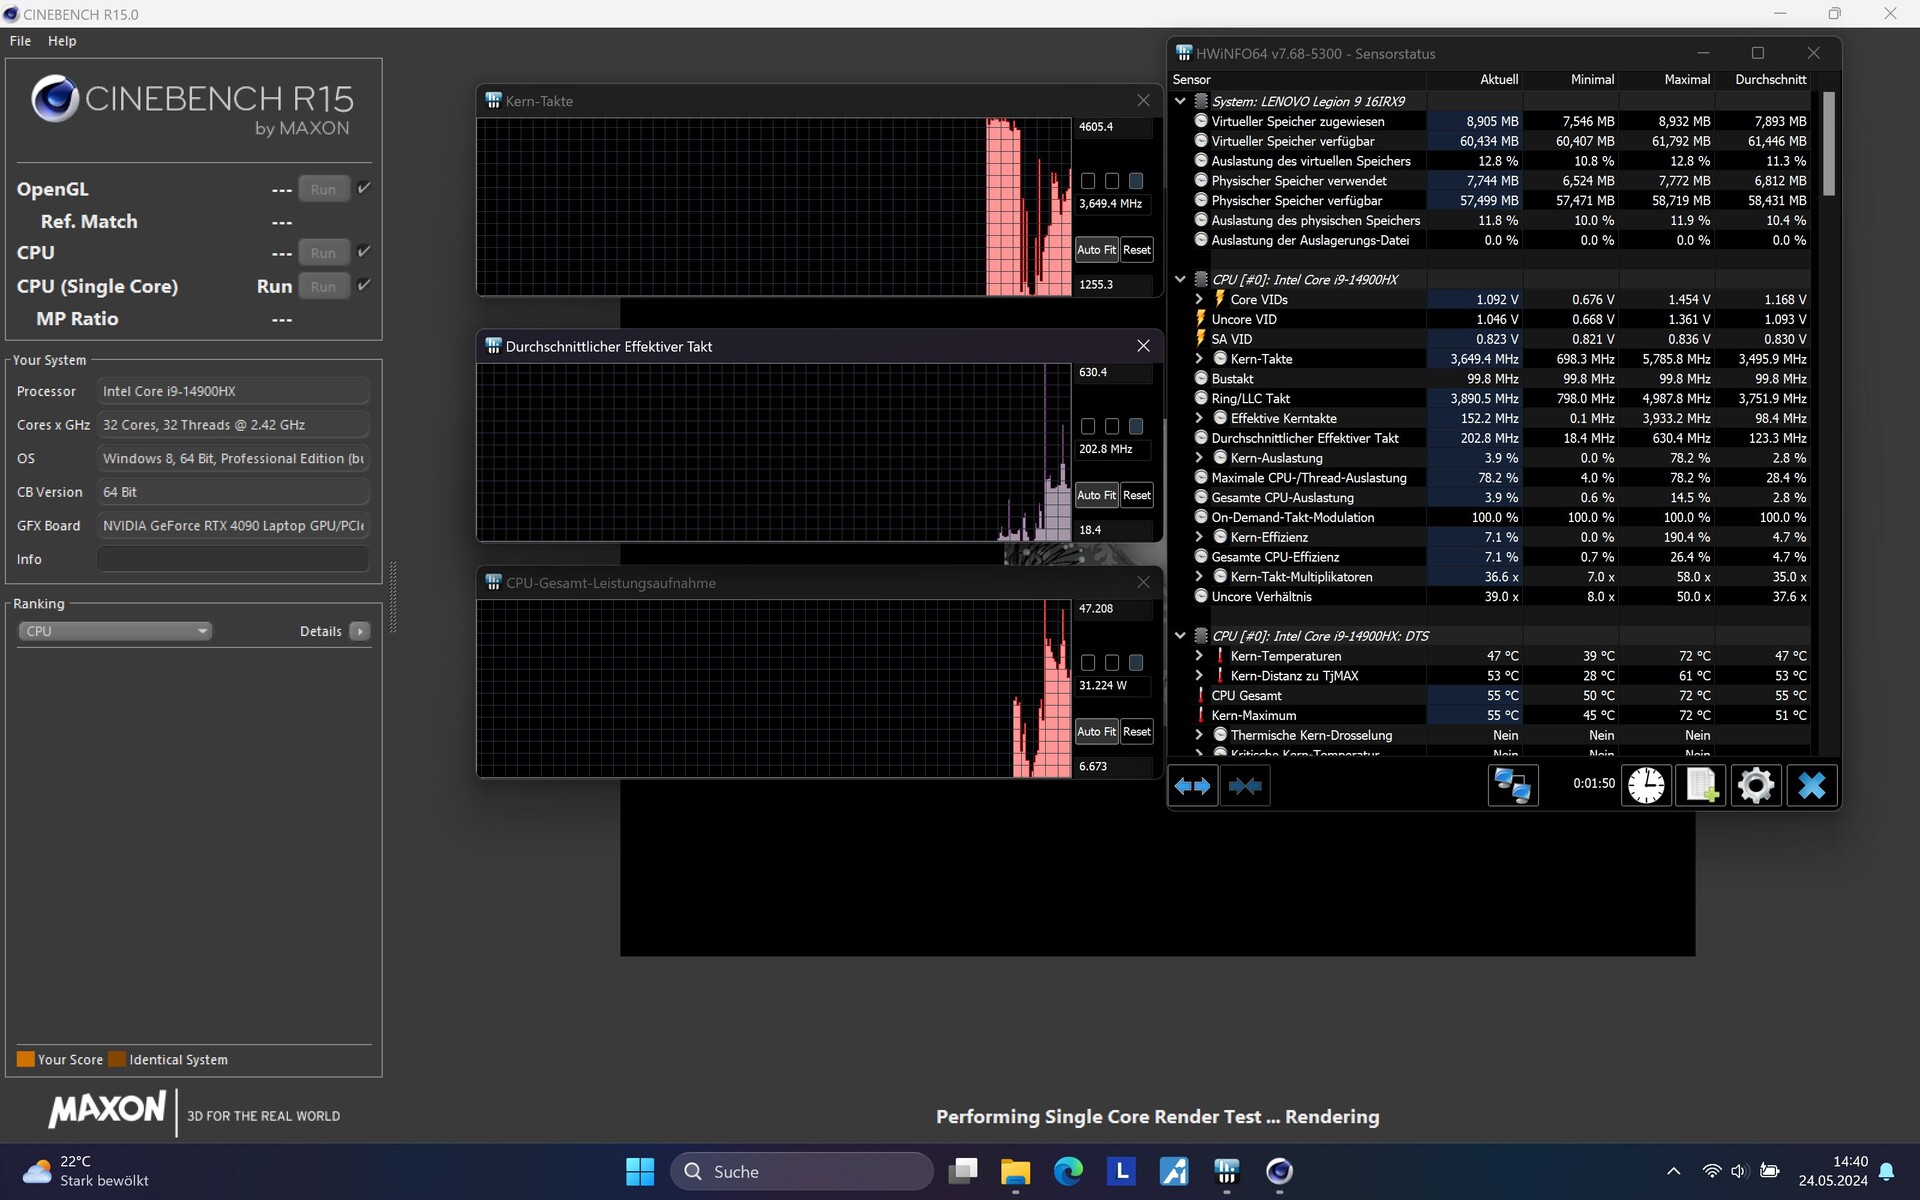
I9-14900HX i9-14900HX är en high-end CPU från den senaste Raptor Lake Refresh-serien från Intel. Dess 8 P-kärnor klockar i upp till 5,8 GHz och de 16 E-kärnornas basklockfrekvens är 1,6 GHz. Tillsammans kan de bearbeta totalt 32 trådar.
Under Cinebench R15-loopen hade vår Legion 9i den högsta initiala prestandan, men till skillnad från konkurrenterna med samma CPU sjönk prestandan konsekvent över tid - med cirka 7,5 procent efter en halvtimme. Därefter låg prestandan bara strax över den hos föregångaren med i9-13980HX. Trots detta är processorn i Legion 9 fortfarande en av de snabbaste i jämförelsefältet, även om prestandaökningen jämfört med föregångaren är ganska låg.
Medan dess multi-thread-prestanda är bortom allt tvivel, försvagades
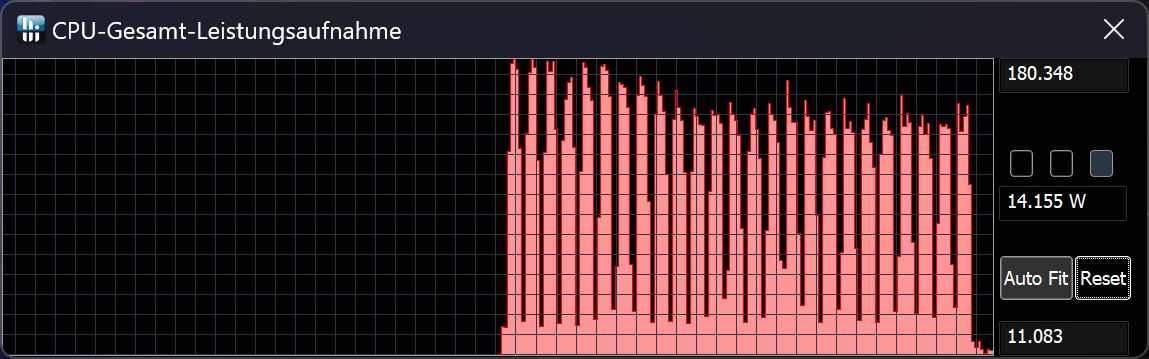
Legion 9i tydligt när det gällde dess single-core-prestanda i alla CPU-benchmarks. Detta var reproducerbart - uppenbarligen är dess single-core-prestandareserver inte uttömda i Performance-läget, för vilket du manuellt måste öka nyckeltalen med Customized-läget.Vi tog därför en titt på nyckeltalen: I Cinebench R15 Single Core klockades kärnan inledningsvis upp till 4,6 GHz. Efter cirka 50 sekunder sjönk kärnklockan kortvarigt till bara 1,2 GHz och stabiliserades sedan mellan 3 och 3,5 GHz. TDP var cirka 30 watt. I ett annat test var fallet betydligt mindre uttalat.
Med strömkontakten utdragen sjönk dess multi-thread-prestanda i Cinebench R15 med cirka 48,5 procent, dvs. nästan hälften jämfört med att använda den bärbara datorn ansluten till elnätet!
| Prestandaprofil/mätvärde | Cinebench-15-Score 1st run | CPU-strömförbrukning i watt |
|---|---|---|
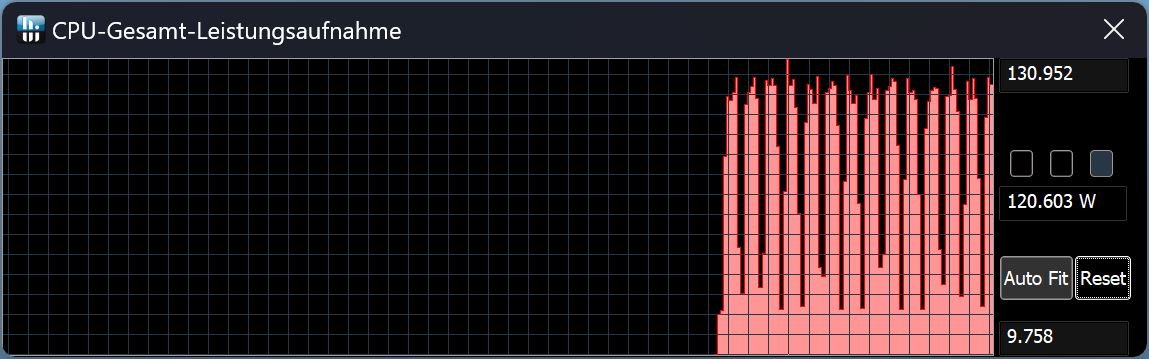
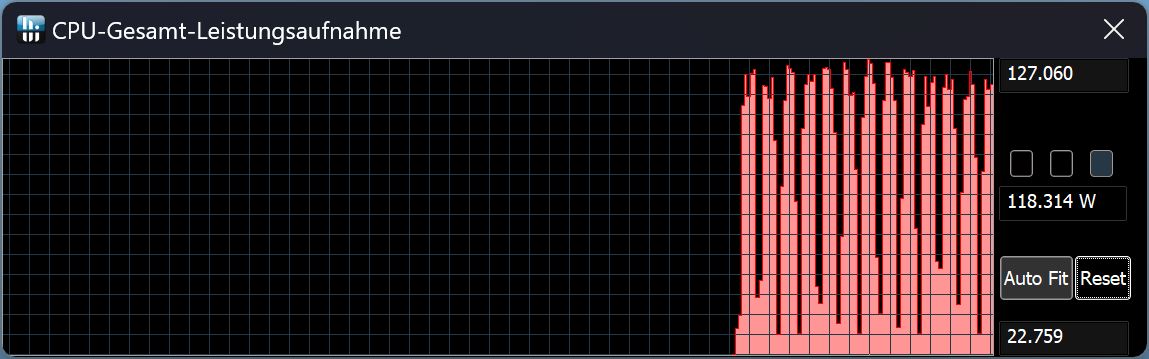
| Prestanda utan CPU-överklockning | 4.879 | 140 - 180 |
| Balanserad med AI | 4.115 | 120 - 130 |
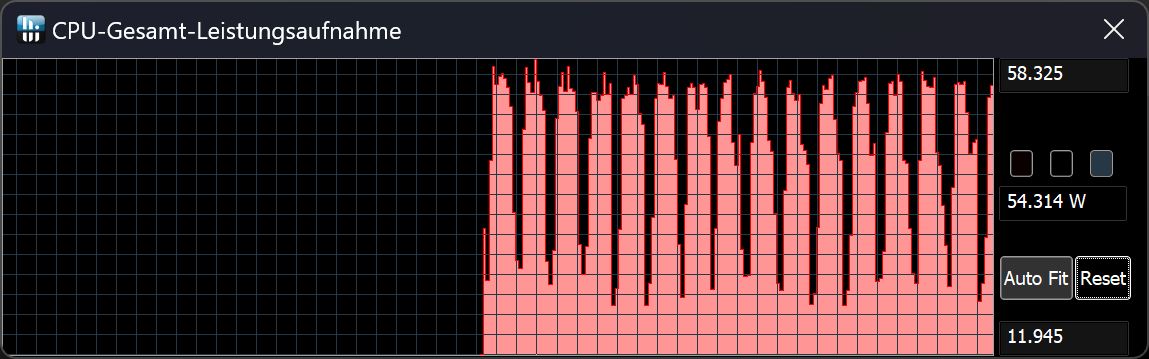
| Balanserad utan AI | 4.091 | 115 - 127 |
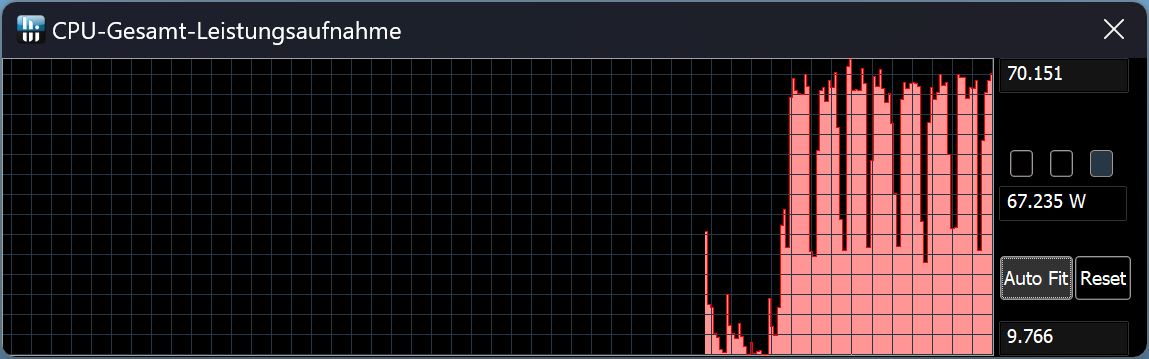
| Tyst | 2.938 | 65 - 70 |
| Batteri | 2.516 | 40 - 58 |
Cinebench R15 Multi continuous test
Cinebench R23: Multi Core | Single Core
Cinebench R20: CPU (Multi Core) | CPU (Single Core)
Cinebench R15: CPU Multi 64Bit | CPU Single 64Bit
Blender: v2.79 BMW27 CPU
7-Zip 18.03: 7z b 4 | 7z b 4 -mmt1
Geekbench 6.4: Multi-Core | Single-Core
Geekbench 5.5: Multi-Core | Single-Core
HWBOT x265 Benchmark v2.2: 4k Preset
LibreOffice : 20 Documents To PDF
R Benchmark 2.5: Overall mean
| CPU Performance Rating | |
| Alienware m18 R2 | |
| Lenovo Legion 9 16IRX8 | |
| Razer Blade 16 2024, RTX 4090 | |
| Asus ROG Strix Scar 18 G834JYR (2024) | |
| Genomsnitt Intel Core i9-14900HX | |
| Lenovo Legion 9 16IRX9, RTX 4090 | |
| Medion Erazer Beast X40 2024 | |
| Genomsnitt av klass Gaming | |
| Cinebench R23 / Multi Core | |
| Lenovo Legion 9 16IRX9, RTX 4090 | |
| Alienware m18 R2 | |
| Lenovo Legion 9 16IRX8 | |
| Razer Blade 16 2024, RTX 4090 | |
| Genomsnitt Intel Core i9-14900HX (17078 - 36249, n=37) | |
| Asus ROG Strix Scar 18 G834JYR (2024) | |
| Medion Erazer Beast X40 2024 | |
| Genomsnitt av klass Gaming (5668 - 39652, n=151, senaste 2 åren) | |
| Cinebench R23 / Single Core | |
| Alienware m18 R2 | |
| Medion Erazer Beast X40 2024 | |
| Asus ROG Strix Scar 18 G834JYR (2024) | |
| Genomsnitt Intel Core i9-14900HX (1720 - 2245, n=37) | |
| Lenovo Legion 9 16IRX8 | |
| Razer Blade 16 2024, RTX 4090 | |
| Genomsnitt av klass Gaming (1136 - 2252, n=151, senaste 2 åren) | |
| Lenovo Legion 9 16IRX9, RTX 4090 | |
| Cinebench R20 / CPU (Multi Core) | |
| Lenovo Legion 9 16IRX9, RTX 4090 | |
| Alienware m18 R2 | |
| Lenovo Legion 9 16IRX8 | |
| Genomsnitt Intel Core i9-14900HX (6579 - 13832, n=37) | |
| Razer Blade 16 2024, RTX 4090 | |
| Asus ROG Strix Scar 18 G834JYR (2024) | |
| Medion Erazer Beast X40 2024 | |
| Genomsnitt av klass Gaming (2179 - 15517, n=151, senaste 2 åren) | |
| Cinebench R20 / CPU (Single Core) | |
| Medion Erazer Beast X40 2024 | |
| Alienware m18 R2 | |
| Asus ROG Strix Scar 18 G834JYR (2024) | |
| Genomsnitt Intel Core i9-14900HX (657 - 859, n=37) | |
| Razer Blade 16 2024, RTX 4090 | |
| Lenovo Legion 9 16IRX8 | |
| Genomsnitt av klass Gaming (439 - 866, n=151, senaste 2 åren) | |
| Lenovo Legion 9 16IRX9, RTX 4090 | |
| Cinebench R15 / CPU Multi 64Bit | |
| Lenovo Legion 9 16IRX9, RTX 4090 | |
| Alienware m18 R2 | |
| Lenovo Legion 9 16IRX8 | |
| Razer Blade 16 2024, RTX 4090 | |
| Genomsnitt Intel Core i9-14900HX (3263 - 5589, n=38) | |
| Asus ROG Strix Scar 18 G834JYR (2024) | |
| Genomsnitt av klass Gaming (905 - 6074, n=154, senaste 2 åren) | |
| Medion Erazer Beast X40 2024 | |
| Cinebench R15 / CPU Single 64Bit | |
| Alienware m18 R2 | |
| Medion Erazer Beast X40 2024 | |
| Razer Blade 16 2024, RTX 4090 | |
| Genomsnitt Intel Core i9-14900HX (247 - 323, n=37) | |
| Lenovo Legion 9 16IRX8 | |
| Asus ROG Strix Scar 18 G834JYR (2024) | |
| Genomsnitt av klass Gaming (191.9 - 343, n=151, senaste 2 åren) | |
| Lenovo Legion 9 16IRX9, RTX 4090 | |
| Blender / v2.79 BMW27 CPU | |
| Genomsnitt av klass Gaming (81 - 555, n=144, senaste 2 åren) | |
| Medion Erazer Beast X40 2024 | |
| Genomsnitt Intel Core i9-14900HX (91 - 206, n=37) | |
| Asus ROG Strix Scar 18 G834JYR (2024) | |
| Razer Blade 16 2024, RTX 4090 | |
| Lenovo Legion 9 16IRX9, RTX 4090 | |
| Lenovo Legion 9 16IRX8 | |
| Alienware m18 R2 | |
| 7-Zip 18.03 / 7z b 4 | |
| Lenovo Legion 9 16IRX9, RTX 4090 | |
| Alienware m18 R2 | |
| Lenovo Legion 9 16IRX8 | |
| Razer Blade 16 2024, RTX 4090 | |
| Asus ROG Strix Scar 18 G834JYR (2024) | |
| Genomsnitt Intel Core i9-14900HX (66769 - 136645, n=37) | |
| Medion Erazer Beast X40 2024 | |
| Genomsnitt av klass Gaming (23795 - 144064, n=149, senaste 2 åren) | |
| 7-Zip 18.03 / 7z b 4 -mmt1 | |
| Medion Erazer Beast X40 2024 | |
| Asus ROG Strix Scar 18 G834JYR (2024) | |
| Alienware m18 R2 | |
| Genomsnitt Intel Core i9-14900HX (5452 - 7545, n=37) | |
| Razer Blade 16 2024, RTX 4090 | |
| Lenovo Legion 9 16IRX8 | |
| Genomsnitt av klass Gaming (4199 - 7573, n=149, senaste 2 åren) | |
| Lenovo Legion 9 16IRX9, RTX 4090 | |
| Geekbench 6.4 / Multi-Core | |
| Alienware m18 R2 | |
| Asus ROG Strix Scar 18 G834JYR (2024) | |
| Razer Blade 16 2024, RTX 4090 | |
| Lenovo Legion 9 16IRX9, RTX 4090 | |
| Lenovo Legion 9 16IRX8 | |
| Genomsnitt Intel Core i9-14900HX (13158 - 19665, n=37) | |
| Medion Erazer Beast X40 2024 | |
| Genomsnitt av klass Gaming (5340 - 21668, n=119, senaste 2 åren) | |
| Geekbench 6.4 / Single-Core | |
| Medion Erazer Beast X40 2024 | |
| Alienware m18 R2 | |
| Asus ROG Strix Scar 18 G834JYR (2024) | |
| Genomsnitt Intel Core i9-14900HX (2419 - 3129, n=37) | |
| Razer Blade 16 2024, RTX 4090 | |
| Lenovo Legion 9 16IRX8 | |
| Genomsnitt av klass Gaming (1490 - 3219, n=119, senaste 2 åren) | |
| Lenovo Legion 9 16IRX9, RTX 4090 | |
| Geekbench 5.5 / Multi-Core | |
| Lenovo Legion 9 16IRX9, RTX 4090 | |
| Alienware m18 R2 | |
| Lenovo Legion 9 16IRX8 | |
| Asus ROG Strix Scar 18 G834JYR (2024) | |
| Genomsnitt Intel Core i9-14900HX (8618 - 23194, n=37) | |
| Razer Blade 16 2024, RTX 4090 | |
| Medion Erazer Beast X40 2024 | |
| Genomsnitt av klass Gaming (4557 - 25855, n=148, senaste 2 åren) | |
| Geekbench 5.5 / Single-Core | |
| Alienware m18 R2 | |
| Medion Erazer Beast X40 2024 | |
| Lenovo Legion 9 16IRX8 | |
| Razer Blade 16 2024, RTX 4090 | |
| Asus ROG Strix Scar 18 G834JYR (2024) | |
| Genomsnitt Intel Core i9-14900HX (1669 - 2210, n=37) | |
| Genomsnitt av klass Gaming (986 - 2423, n=148, senaste 2 åren) | |
| Lenovo Legion 9 16IRX9, RTX 4090 | |
| HWBOT x265 Benchmark v2.2 / 4k Preset | |
| Alienware m18 R2 | |
| Lenovo Legion 9 16IRX8 | |
| Lenovo Legion 9 16IRX9, RTX 4090 | |
| Razer Blade 16 2024, RTX 4090 | |
| Genomsnitt Intel Core i9-14900HX (16.8 - 38.9, n=37) | |
| Asus ROG Strix Scar 18 G834JYR (2024) | |
| Medion Erazer Beast X40 2024 | |
| Genomsnitt av klass Gaming (6.72 - 42.9, n=148, senaste 2 åren) | |
| LibreOffice / 20 Documents To PDF | |
| Lenovo Legion 9 16IRX9, RTX 4090 | |
| Genomsnitt av klass Gaming (19 - 96.6, n=147, senaste 2 åren) | |
| Razer Blade 16 2024, RTX 4090 | |
| Alienware m18 R2 | |
| Asus ROG Strix Scar 18 G834JYR (2024) | |
| Medion Erazer Beast X40 2024 | |
| Genomsnitt Intel Core i9-14900HX (19 - 85.1, n=37) | |
| Lenovo Legion 9 16IRX8 | |
| R Benchmark 2.5 / Overall mean | |
| Lenovo Legion 9 16IRX9, RTX 4090 | |
| Genomsnitt av klass Gaming (0.3609 - 0.759, n=150, senaste 2 åren) | |
| Asus ROG Strix Scar 18 G834JYR (2024) | |
| Genomsnitt Intel Core i9-14900HX (0.3604 - 0.4859, n=37) | |
| Lenovo Legion 9 16IRX8 | |
| Razer Blade 16 2024, RTX 4090 | |
| Alienware m18 R2 | |
| Medion Erazer Beast X40 2024 | |
* ... mindre är bättre
AIDA64: FP32 Ray-Trace | FPU Julia | CPU SHA3 | CPU Queen | FPU SinJulia | FPU Mandel | CPU AES | CPU ZLib | FP64 Ray-Trace | CPU PhotoWorxx
| Performance Rating | |
| Alienware m18 R2 | |
| Lenovo Legion 9 16IRX9, RTX 4090 | |
| Lenovo Legion 9 16IRX8 | |
| Razer Blade 16 2024, RTX 4090 | |
| Asus ROG Strix Scar 18 G834JYR (2024) | |
| Genomsnitt Intel Core i9-14900HX | |
| Medion Erazer Beast X40 2024 | |
| Genomsnitt av klass Gaming | |
| AIDA64 / FP32 Ray-Trace | |
| Alienware m18 R2 | |
| Lenovo Legion 9 16IRX9, RTX 4090 | |
| Lenovo Legion 9 16IRX8 | |
| Razer Blade 16 2024, RTX 4090 | |
| Asus ROG Strix Scar 18 G834JYR (2024) | |
| Genomsnitt Intel Core i9-14900HX (13098 - 33474, n=36) | |
| Genomsnitt av klass Gaming (4986 - 81639, n=147, senaste 2 åren) | |
| Medion Erazer Beast X40 2024 | |
| AIDA64 / FPU Julia | |
| Alienware m18 R2 | |
| Lenovo Legion 9 16IRX9, RTX 4090 | |
| Lenovo Legion 9 16IRX8 | |
| Asus ROG Strix Scar 18 G834JYR (2024) | |
| Razer Blade 16 2024, RTX 4090 | |
| Genomsnitt Intel Core i9-14900HX (67573 - 166040, n=36) | |
| Genomsnitt av klass Gaming (25360 - 252486, n=147, senaste 2 åren) | |
| Medion Erazer Beast X40 2024 | |
| AIDA64 / CPU SHA3 | |
| Alienware m18 R2 | |
| Lenovo Legion 9 16IRX9, RTX 4090 | |
| Lenovo Legion 9 16IRX8 | |
| Asus ROG Strix Scar 18 G834JYR (2024) | |
| Razer Blade 16 2024, RTX 4090 | |
| Genomsnitt Intel Core i9-14900HX (3589 - 7979, n=36) | |
| Medion Erazer Beast X40 2024 | |
| Genomsnitt av klass Gaming (1339 - 10389, n=147, senaste 2 åren) | |
| AIDA64 / CPU Queen | |
| Asus ROG Strix Scar 18 G834JYR (2024) | |
| Alienware m18 R2 | |
| Razer Blade 16 2024, RTX 4090 | |
| Genomsnitt Intel Core i9-14900HX (118405 - 148966, n=36) | |
| Lenovo Legion 9 16IRX8 | |
| Medion Erazer Beast X40 2024 | |
| Lenovo Legion 9 16IRX9, RTX 4090 | |
| Genomsnitt av klass Gaming (50699 - 200651, n=147, senaste 2 åren) | |
| AIDA64 / FPU SinJulia | |
| Alienware m18 R2 | |
| Lenovo Legion 9 16IRX9, RTX 4090 | |
| Asus ROG Strix Scar 18 G834JYR (2024) | |
| Razer Blade 16 2024, RTX 4090 | |
| Lenovo Legion 9 16IRX8 | |
| Genomsnitt Intel Core i9-14900HX (10475 - 18517, n=36) | |
| Medion Erazer Beast X40 2024 | |
| Genomsnitt av klass Gaming (4800 - 32988, n=147, senaste 2 åren) | |
| AIDA64 / FPU Mandel | |
| Alienware m18 R2 | |
| Lenovo Legion 9 16IRX9, RTX 4090 | |
| Lenovo Legion 9 16IRX8 | |
| Razer Blade 16 2024, RTX 4090 | |
| Asus ROG Strix Scar 18 G834JYR (2024) | |
| Genomsnitt Intel Core i9-14900HX (32543 - 83662, n=36) | |
| Genomsnitt av klass Gaming (12321 - 134044, n=147, senaste 2 åren) | |
| Medion Erazer Beast X40 2024 | |
| AIDA64 / CPU AES | |
| Genomsnitt Intel Core i9-14900HX (86964 - 241777, n=36) | |
| Alienware m18 R2 | |
| Lenovo Legion 9 16IRX9, RTX 4090 | |
| Lenovo Legion 9 16IRX8 | |
| Razer Blade 16 2024, RTX 4090 | |
| Asus ROG Strix Scar 18 G834JYR (2024) | |
| Genomsnitt av klass Gaming (19065 - 328679, n=147, senaste 2 åren) | |
| Medion Erazer Beast X40 2024 | |
| AIDA64 / CPU ZLib | |
| Alienware m18 R2 | |
| Lenovo Legion 9 16IRX9, RTX 4090 | |
| Lenovo Legion 9 16IRX8 | |
| Razer Blade 16 2024, RTX 4090 | |
| Genomsnitt Intel Core i9-14900HX (1054 - 2292, n=36) | |
| Asus ROG Strix Scar 18 G834JYR (2024) | |
| Medion Erazer Beast X40 2024 | |
| Genomsnitt av klass Gaming (373 - 2531, n=147, senaste 2 åren) | |
| AIDA64 / FP64 Ray-Trace | |
| Alienware m18 R2 | |
| Lenovo Legion 9 16IRX8 | |
| Lenovo Legion 9 16IRX9, RTX 4090 | |
| Razer Blade 16 2024, RTX 4090 | |
| Asus ROG Strix Scar 18 G834JYR (2024) | |
| Genomsnitt Intel Core i9-14900HX (6809 - 18349, n=36) | |
| Genomsnitt av klass Gaming (2540 - 43430, n=147, senaste 2 åren) | |
| Medion Erazer Beast X40 2024 | |
| AIDA64 / CPU PhotoWorxx | |
| Lenovo Legion 9 16IRX9, RTX 4090 | |
| Lenovo Legion 9 16IRX8 | |
| Alienware m18 R2 | |
| Asus ROG Strix Scar 18 G834JYR (2024) | |
| Razer Blade 16 2024, RTX 4090 | |
| Medion Erazer Beast X40 2024 | |
| Genomsnitt Intel Core i9-14900HX (23903 - 54702, n=36) | |
| Genomsnitt av klass Gaming (10805 - 60161, n=147, senaste 2 åren) | |
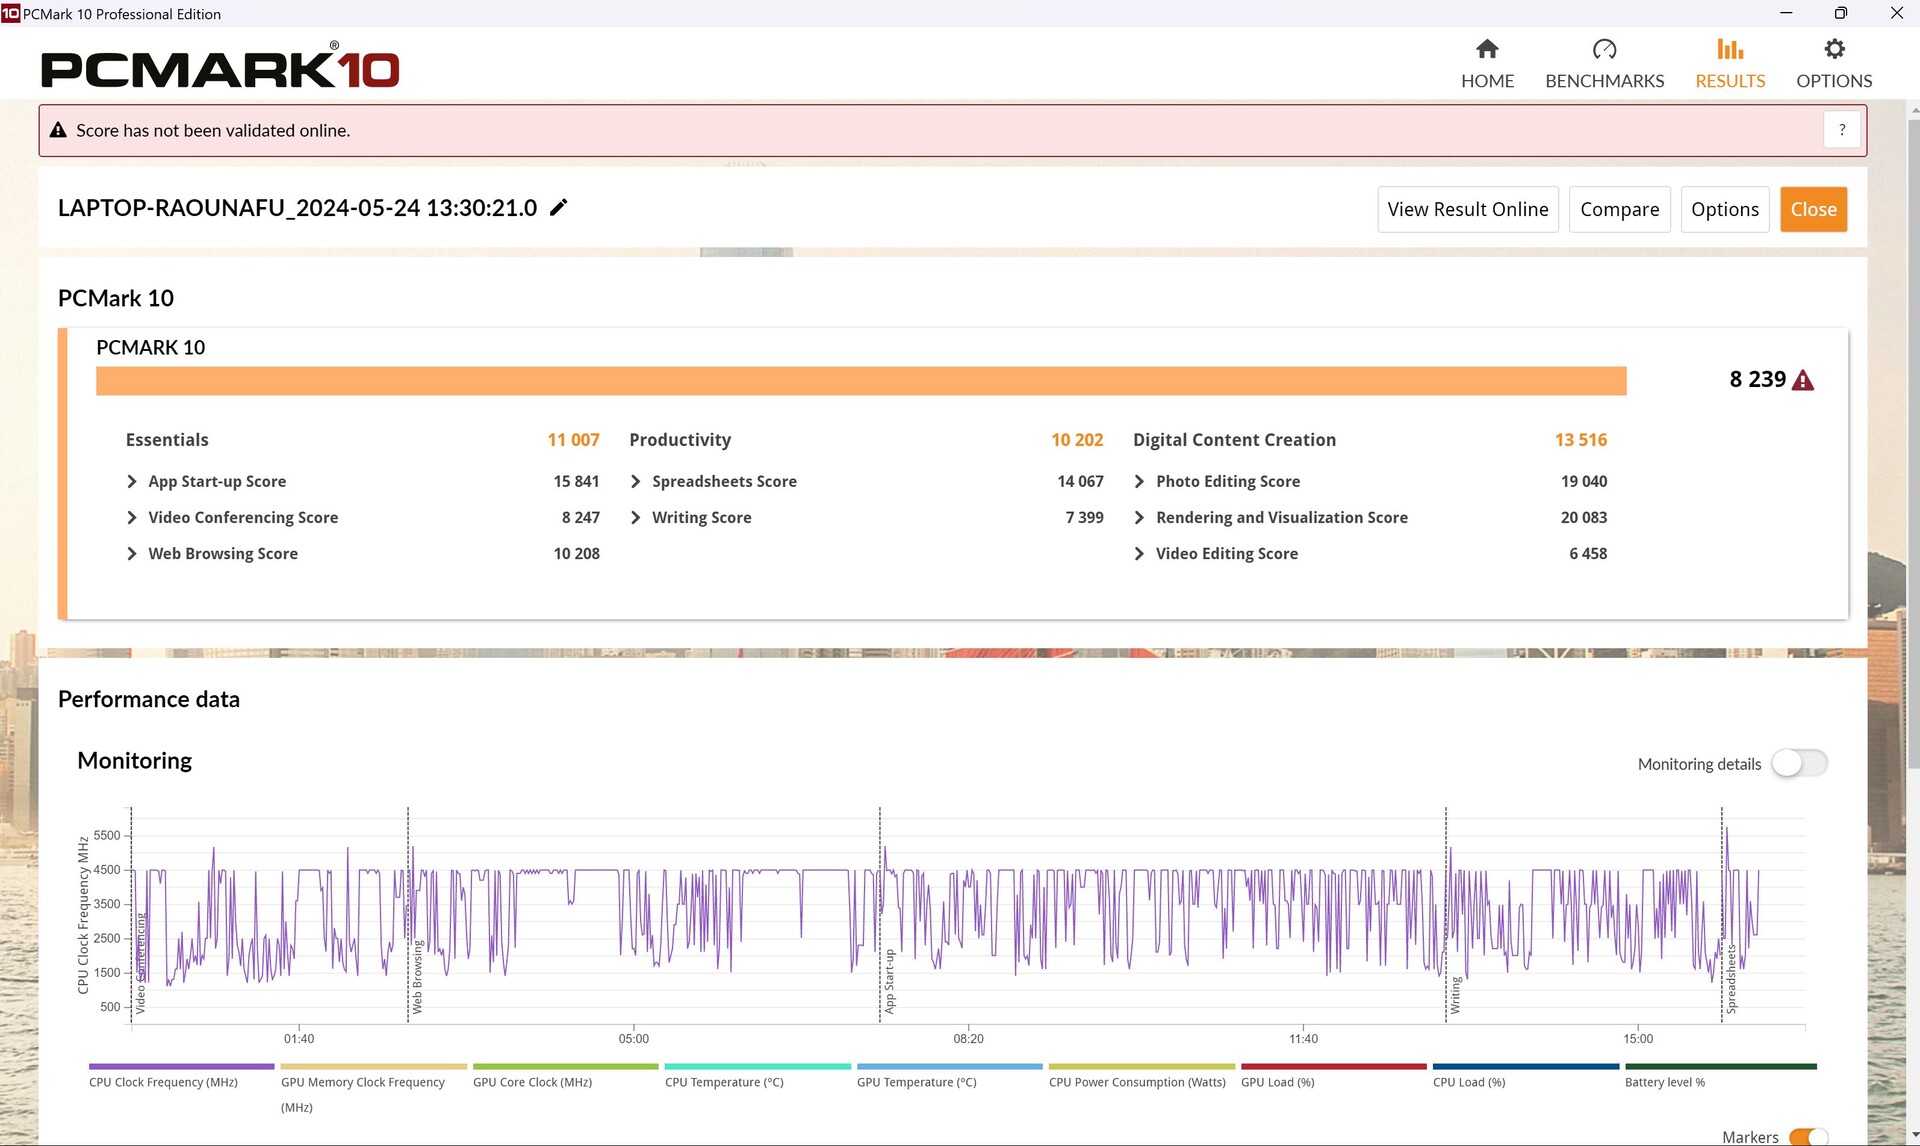
Systemets prestanda
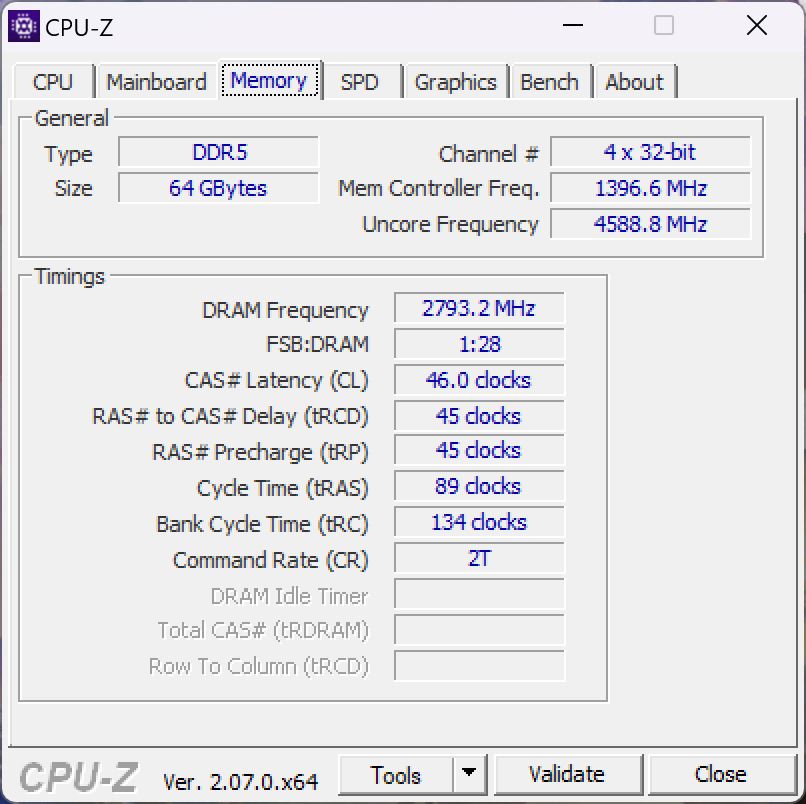
Dess prestanda i PCMark 10 var cirka 5 procent under den genomsnittliga bärbara datorn med samma CPU/GPU-kombination. Aida visade också att även om dess RAM-minne erbjuder bra läs- och skrivhastigheter, är minneslatensen ovanligt hög, vilket leder till sämre resultat än väntat i vissa benchmarks, som här.
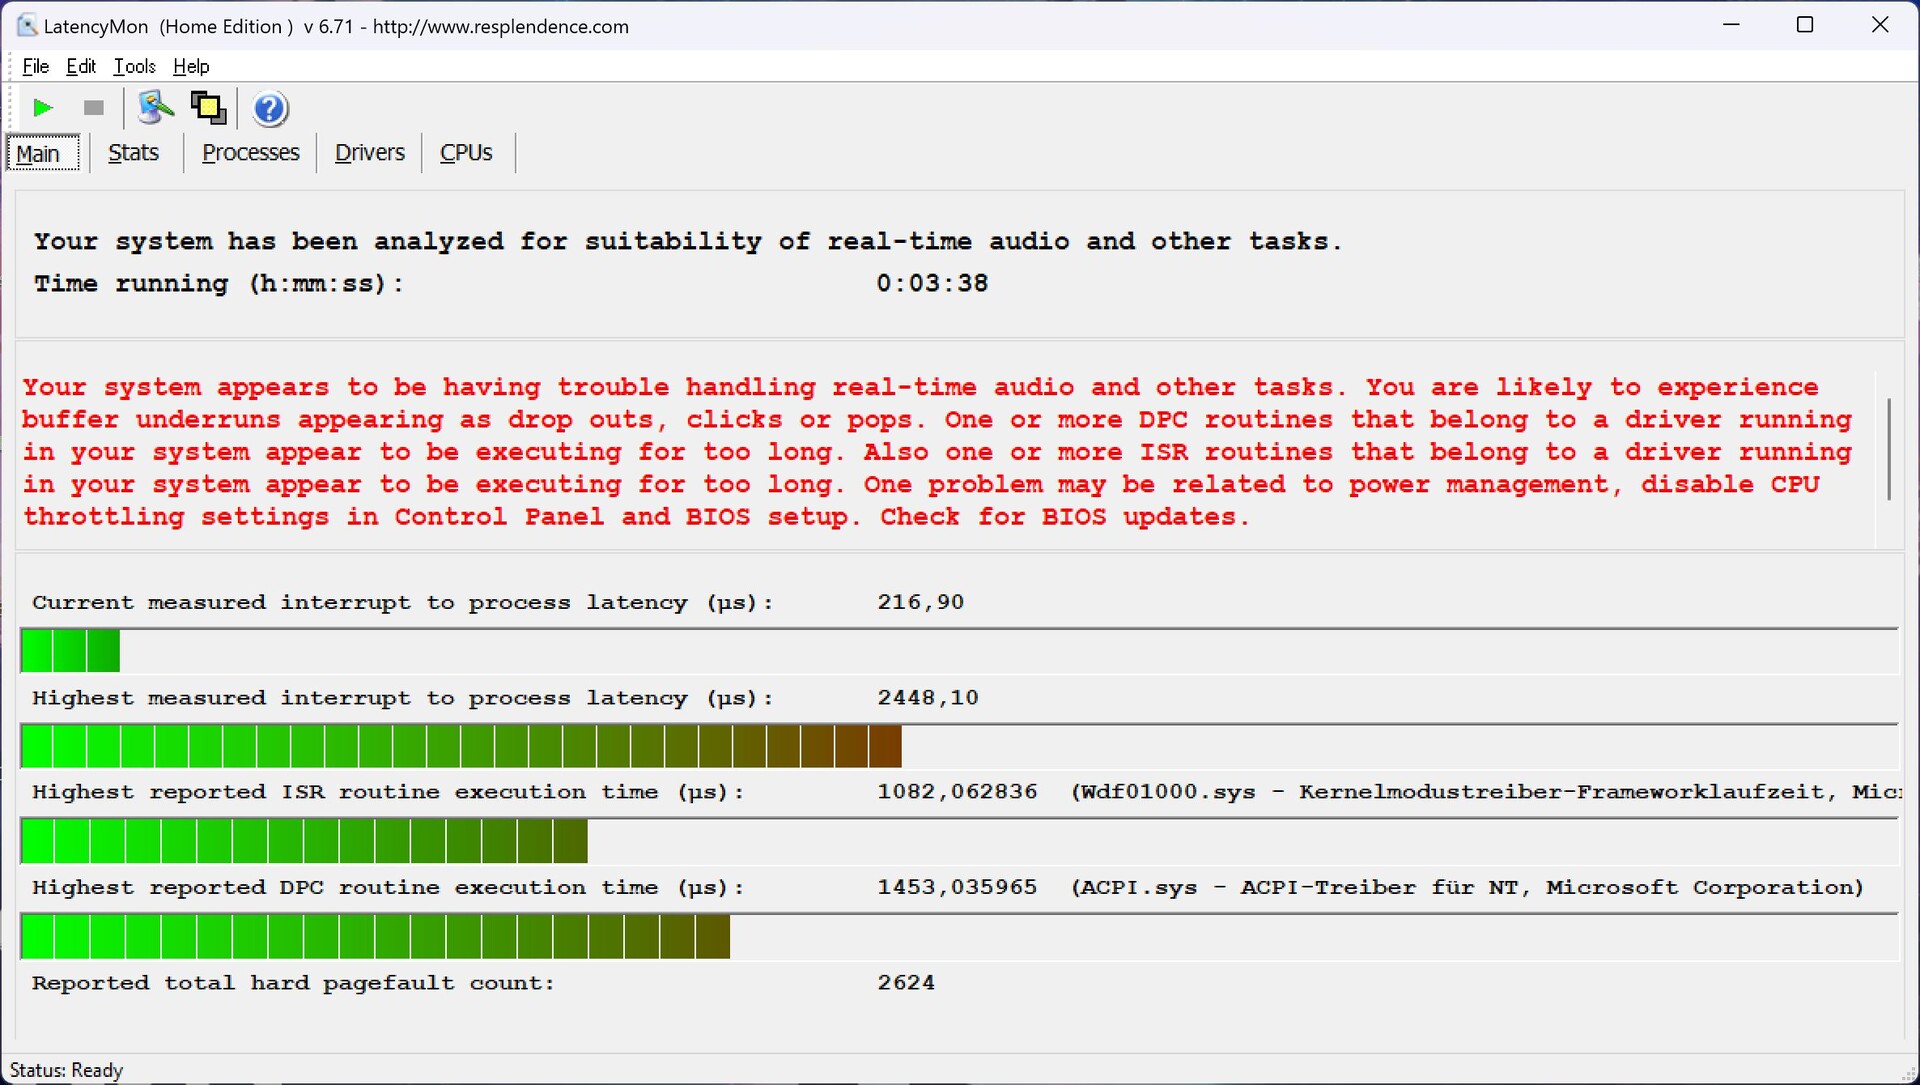
Subjektivt märkte vi att även om den bärbara datorn går smidigt för det mesta, "hakar" den ibland upp sig när vi kör spel. Detta bekräftades också av bildhastighetsgrafen för Far Cry 5, till exempel, där dess bildhastighet verkar sjunka kort, vilket verkar inträffa oftare. Dess DPC-latens är också ganska hög, se nästa avsnitt. Dess resultat med webbapplikationer var också upprepade gånger svaga.
CrossMark: Overall | Productivity | Creativity | Responsiveness
WebXPRT 3: Overall
WebXPRT 4: Overall
Mozilla Kraken 1.1: Total
| PCMark 10 / Score | |
| Alienware m18 R2 | |
| Lenovo Legion 9 16IRX8 | |
| Medion Erazer Beast X40 2024 | |
| Asus ROG Strix Scar 18 G834JYR (2024) | |
| Genomsnitt Intel Core i9-14900HX, NVIDIA GeForce RTX 4090 Laptop GPU (8230 - 9234, n=13) | |
| Razer Blade 16 2024, RTX 4090 | |
| Lenovo Legion 9 16IRX9, RTX 4090 | |
| Genomsnitt av klass Gaming (5776 - 9852, n=133, senaste 2 åren) | |
| PCMark 10 / Essentials | |
| Lenovo Legion 9 16IRX8 | |
| Alienware m18 R2 | |
| Asus ROG Strix Scar 18 G834JYR (2024) | |
| Genomsnitt Intel Core i9-14900HX, NVIDIA GeForce RTX 4090 Laptop GPU (10778 - 11628, n=13) | |
| Lenovo Legion 9 16IRX9, RTX 4090 | |
| Razer Blade 16 2024, RTX 4090 | |
| Medion Erazer Beast X40 2024 | |
| Genomsnitt av klass Gaming (9057 - 12600, n=133, senaste 2 åren) | |
| PCMark 10 / Productivity | |
| Medion Erazer Beast X40 2024 | |
| Alienware m18 R2 | |
| Razer Blade 16 2024, RTX 4090 | |
| Lenovo Legion 9 16IRX8 | |
| Genomsnitt Intel Core i9-14900HX, NVIDIA GeForce RTX 4090 Laptop GPU (9458 - 11759, n=13) | |
| Asus ROG Strix Scar 18 G834JYR (2024) | |
| Lenovo Legion 9 16IRX9, RTX 4090 | |
| Genomsnitt av klass Gaming (6662 - 14612, n=133, senaste 2 åren) | |
| PCMark 10 / Digital Content Creation | |
| Alienware m18 R2 | |
| Lenovo Legion 9 16IRX8 | |
| Asus ROG Strix Scar 18 G834JYR (2024) | |
| Medion Erazer Beast X40 2024 | |
| Genomsnitt Intel Core i9-14900HX, NVIDIA GeForce RTX 4090 Laptop GPU (13219 - 16462, n=13) | |
| Lenovo Legion 9 16IRX9, RTX 4090 | |
| Razer Blade 16 2024, RTX 4090 | |
| Genomsnitt av klass Gaming (6807 - 18475, n=133, senaste 2 åren) | |
| CrossMark / Overall | |
| Asus ROG Strix Scar 18 G834JYR (2024) | |
| Razer Blade 16 2024, RTX 4090 | |
| Medion Erazer Beast X40 2024 | |
| Genomsnitt Intel Core i9-14900HX, NVIDIA GeForce RTX 4090 Laptop GPU (1877 - 2344, n=10) | |
| Alienware m18 R2 | |
| Lenovo Legion 9 16IRX9, RTX 4090 | |
| Lenovo Legion 9 16IRX8 | |
| Genomsnitt av klass Gaming (1247 - 2344, n=114, senaste 2 åren) | |
| CrossMark / Productivity | |
| Medion Erazer Beast X40 2024 | |
| Asus ROG Strix Scar 18 G834JYR (2024) | |
| Razer Blade 16 2024, RTX 4090 | |
| Genomsnitt Intel Core i9-14900HX, NVIDIA GeForce RTX 4090 Laptop GPU (1738 - 2162, n=10) | |
| Alienware m18 R2 | |
| Genomsnitt av klass Gaming (1299 - 2204, n=114, senaste 2 åren) | |
| Lenovo Legion 9 16IRX8 | |
| Lenovo Legion 9 16IRX9, RTX 4090 | |
| CrossMark / Creativity | |
| Asus ROG Strix Scar 18 G834JYR (2024) | |
| Razer Blade 16 2024, RTX 4090 | |
| Alienware m18 R2 | |
| Genomsnitt Intel Core i9-14900HX, NVIDIA GeForce RTX 4090 Laptop GPU (2195 - 2660, n=10) | |
| Medion Erazer Beast X40 2024 | |
| Lenovo Legion 9 16IRX8 | |
| Lenovo Legion 9 16IRX9, RTX 4090 | |
| Genomsnitt av klass Gaming (1275 - 2660, n=114, senaste 2 åren) | |
| CrossMark / Responsiveness | |
| Asus ROG Strix Scar 18 G834JYR (2024) | |
| Medion Erazer Beast X40 2024 | |
| Genomsnitt Intel Core i9-14900HX, NVIDIA GeForce RTX 4090 Laptop GPU (1478 - 2327, n=10) | |
| Razer Blade 16 2024, RTX 4090 | |
| Alienware m18 R2 | |
| Lenovo Legion 9 16IRX9, RTX 4090 | |
| Genomsnitt av klass Gaming (1030 - 2330, n=114, senaste 2 åren) | |
| Lenovo Legion 9 16IRX8 | |
| WebXPRT 3 / Overall | |
| Lenovo Legion 9 16IRX8 | |
| Razer Blade 16 2024, RTX 4090 | |
| Medion Erazer Beast X40 2024 | |
| Alienware m18 R2 | |
| Genomsnitt Intel Core i9-14900HX, NVIDIA GeForce RTX 4090 Laptop GPU (279 - 339, n=10) | |
| Asus ROG Strix Scar 18 G834JYR (2024) | |
| Genomsnitt av klass Gaming (215 - 480, n=127, senaste 2 åren) | |
| Lenovo Legion 9 16IRX9, RTX 4090 | |
| WebXPRT 4 / Overall | |
| Alienware m18 R2 | |
| Lenovo Legion 9 16IRX8 | |
| Asus ROG Strix Scar 18 G834JYR (2024) | |
| Medion Erazer Beast X40 2024 | |
| Genomsnitt Intel Core i9-14900HX, NVIDIA GeForce RTX 4090 Laptop GPU (246 - 309, n=8) | |
| Genomsnitt av klass Gaming (176.4 - 335, n=115, senaste 2 åren) | |
| Lenovo Legion 9 16IRX9, RTX 4090 | |
| Mozilla Kraken 1.1 / Total | |
| Lenovo Legion 9 16IRX9, RTX 4090 | |
| Genomsnitt av klass Gaming (409 - 674, n=139, senaste 2 åren) | |
| Genomsnitt Intel Core i9-14900HX, NVIDIA GeForce RTX 4090 Laptop GPU (428 - 535, n=11) | |
| Razer Blade 16 2024, RTX 4090 | |
| Asus ROG Strix Scar 18 G834JYR (2024) | |
| Lenovo Legion 9 16IRX8 | |
| Medion Erazer Beast X40 2024 | |
| Alienware m18 R2 | |
* ... mindre är bättre
| PCMark 10 Score | 8239 poäng | |
Hjälp | ||
| AIDA64 / Memory Copy | |
| Asus ROG Strix Scar 18 G834JYR (2024) | |
| Lenovo Legion 9 16IRX9, RTX 4090 | |
| Alienware m18 R2 | |
| Razer Blade 16 2024, RTX 4090 | |
| Lenovo Legion 9 16IRX8 | |
| Medion Erazer Beast X40 2024 | |
| Genomsnitt Intel Core i9-14900HX (38028 - 83392, n=36) | |
| Genomsnitt av klass Gaming (21750 - 97515, n=147, senaste 2 åren) | |
| AIDA64 / Memory Read | |
| Asus ROG Strix Scar 18 G834JYR (2024) | |
| Razer Blade 16 2024, RTX 4090 | |
| Alienware m18 R2 | |
| Lenovo Legion 9 16IRX8 | |
| Medion Erazer Beast X40 2024 | |
| Lenovo Legion 9 16IRX9, RTX 4090 | |
| Genomsnitt Intel Core i9-14900HX (43306 - 87568, n=36) | |
| Genomsnitt av klass Gaming (22956 - 102937, n=147, senaste 2 åren) | |
| AIDA64 / Memory Write | |
| Lenovo Legion 9 16IRX9, RTX 4090 | |
| Asus ROG Strix Scar 18 G834JYR (2024) | |
| Medion Erazer Beast X40 2024 | |
| Alienware m18 R2 | |
| Lenovo Legion 9 16IRX8 | |
| Razer Blade 16 2024, RTX 4090 | |
| Genomsnitt Intel Core i9-14900HX (37146 - 80589, n=36) | |
| Genomsnitt av klass Gaming (22297 - 108954, n=147, senaste 2 åren) | |
| AIDA64 / Memory Latency | |
| Genomsnitt av klass Gaming (59.5 - 259, n=147, senaste 2 åren) | |
| Lenovo Legion 9 16IRX9, RTX 4090 | |
| Alienware m18 R2 | |
| Genomsnitt Intel Core i9-14900HX (76.1 - 105, n=36) | |
| Lenovo Legion 9 16IRX8 | |
| Razer Blade 16 2024, RTX 4090 | |
| Asus ROG Strix Scar 18 G834JYR (2024) | |
| Medion Erazer Beast X40 2024 | |
* ... mindre är bättre
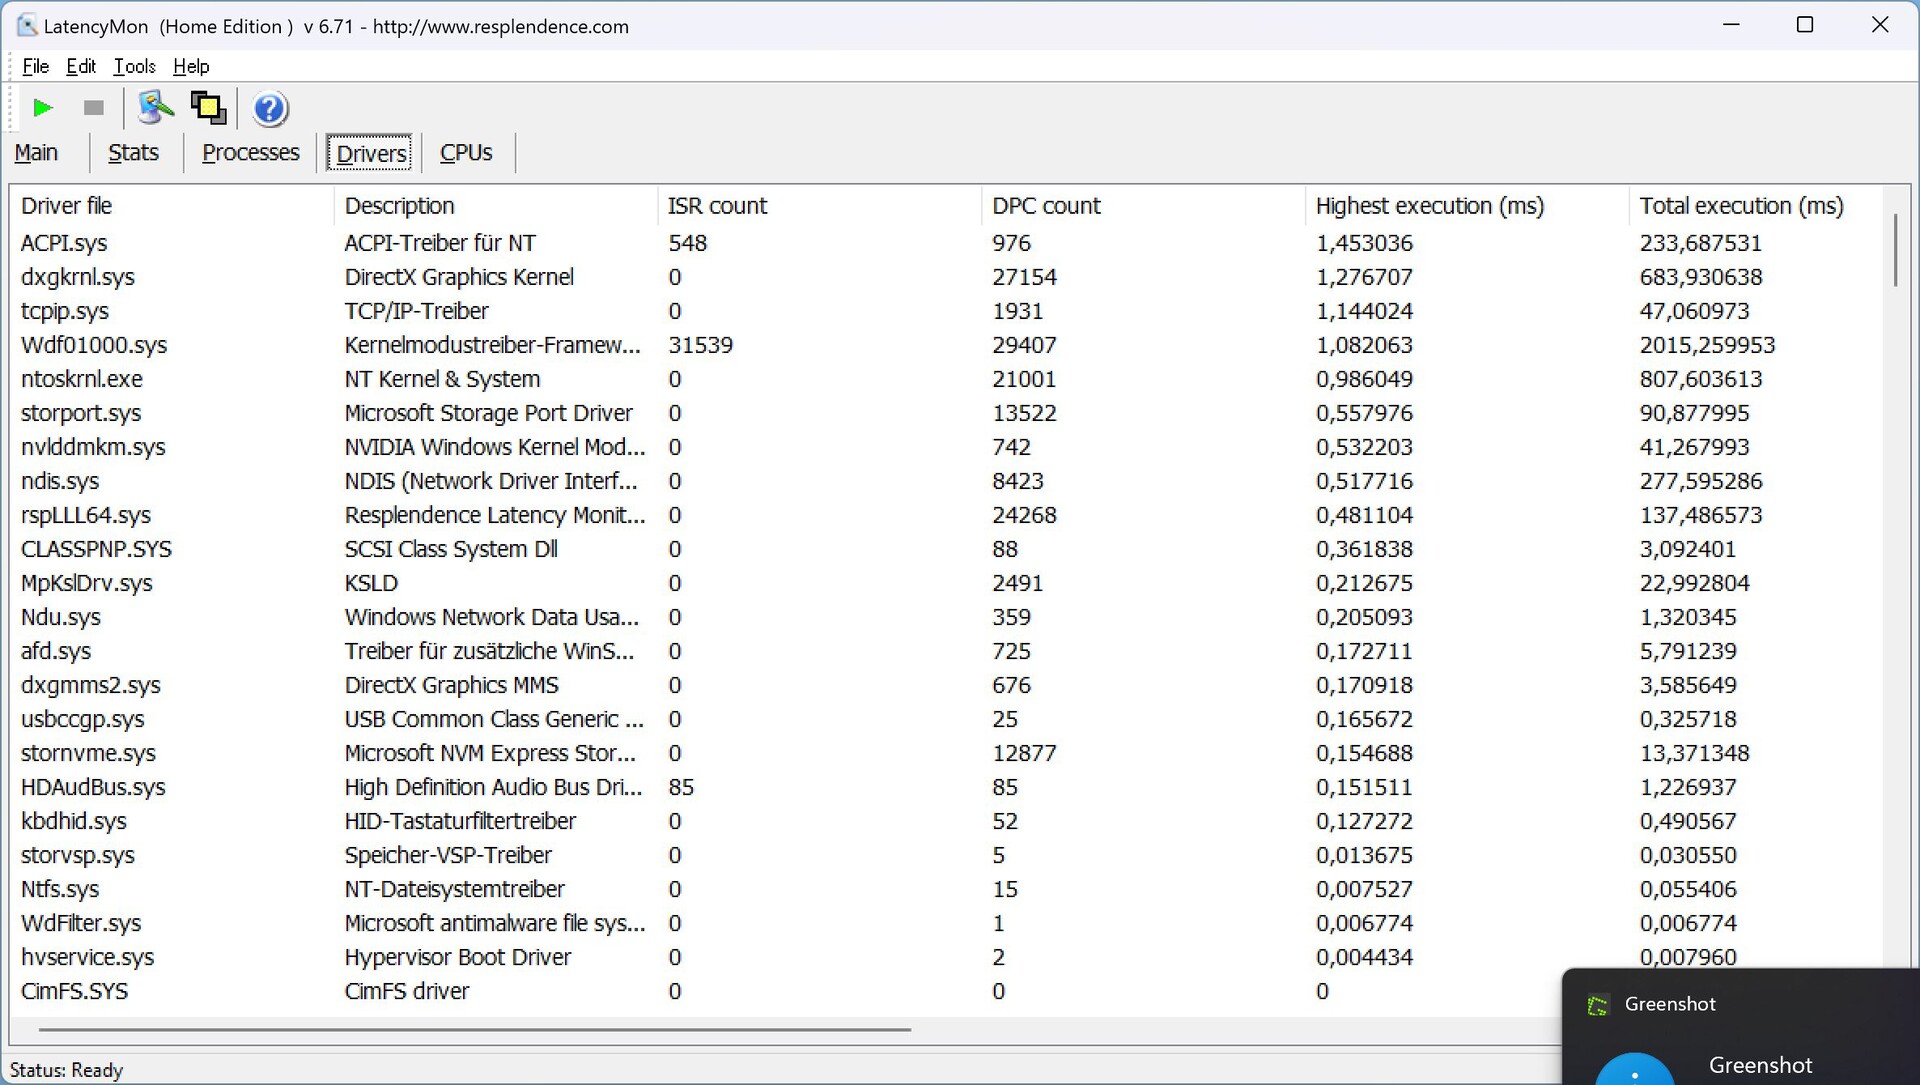
DPC-latenstider
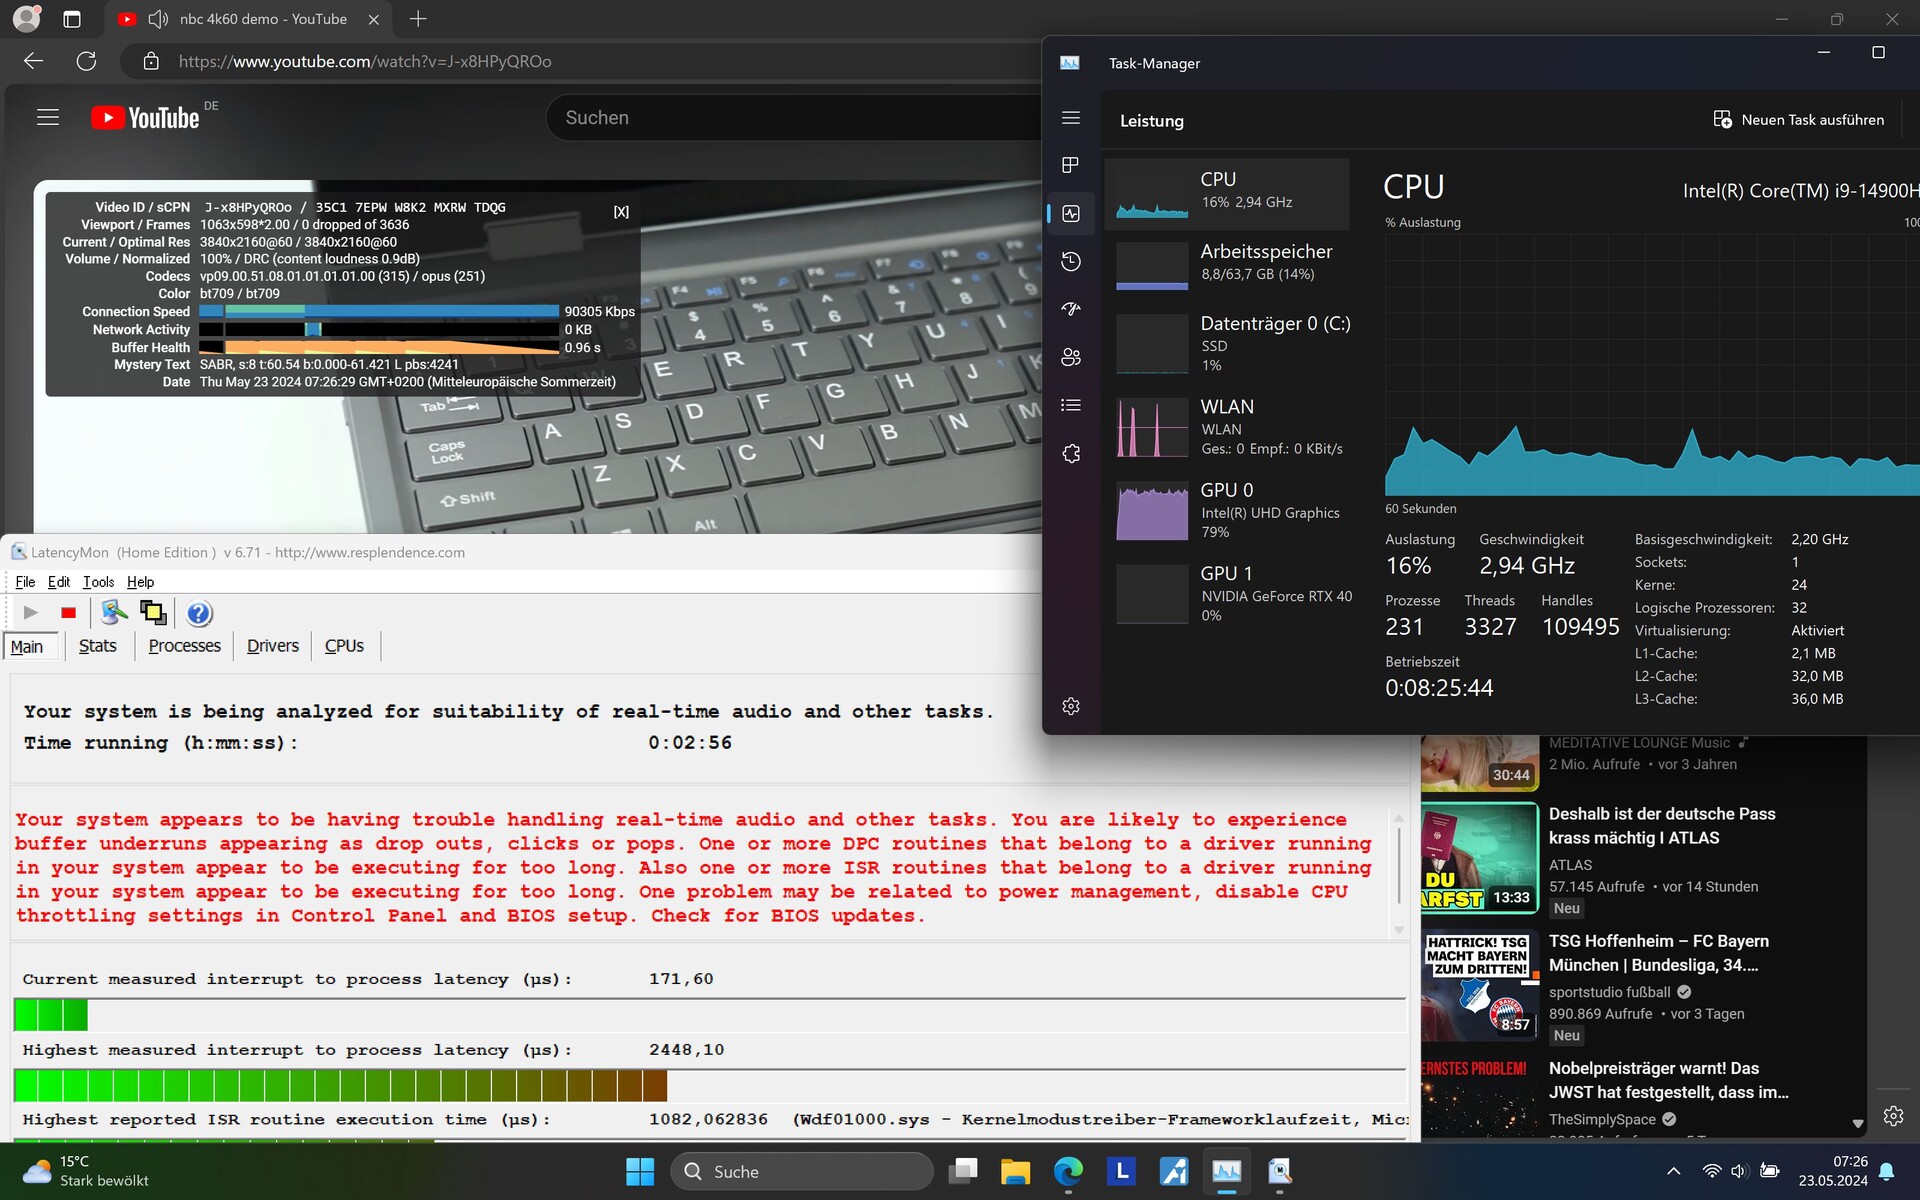
De första fördröjningarna uppstod så snart webbläsaren öppnades. Värdet ökade minimalt när man öppnade flera flikar på vår webbplats. Det var dock främst uppspelning av vår YouTube-video i 4K/60 fps som fick latensvärdet att skjuta i höjden.
Dessutom låg den interna GPU-belastningen - som var aktiv i det här fallet - konstant på ovanligt höga 79 %; värden på runt 20 % är normalt! Trots detta fanns det inga tappade bildrutor att klaga på.
| DPC Latencies / LatencyMon - interrupt to process latency (max), Web, Youtube, Prime95 | |
| Alienware m18 R2 | |
| Lenovo Legion 9 16IRX9, RTX 4090 | |
| Lenovo Legion 9 16IRX8 | |
| Razer Blade 16 2024, RTX 4090 | |
| Medion Erazer Beast X40 2024 | |
| Asus ROG Strix Scar 18 G834JYR (2024) | |
* ... mindre är bättre
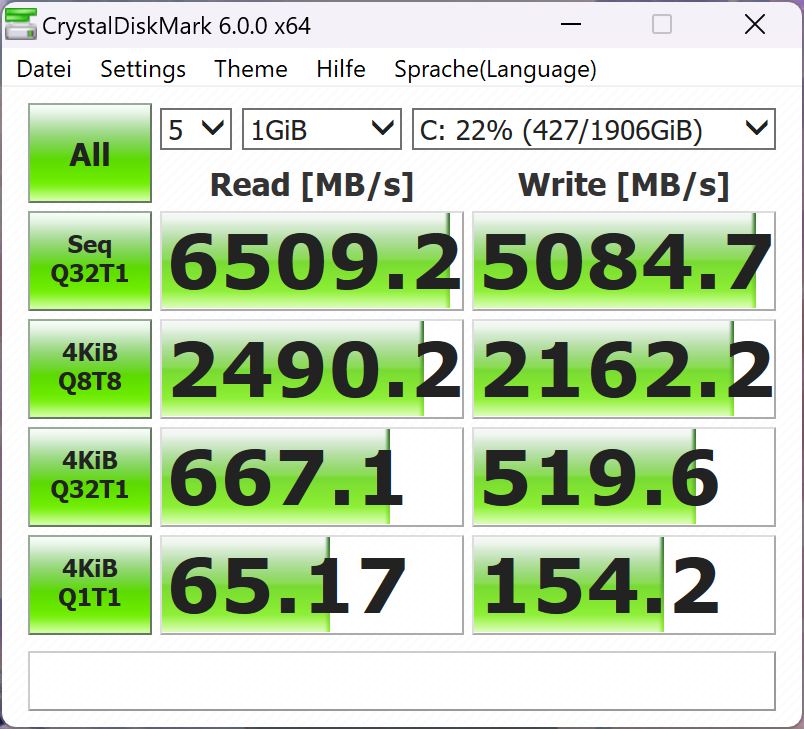
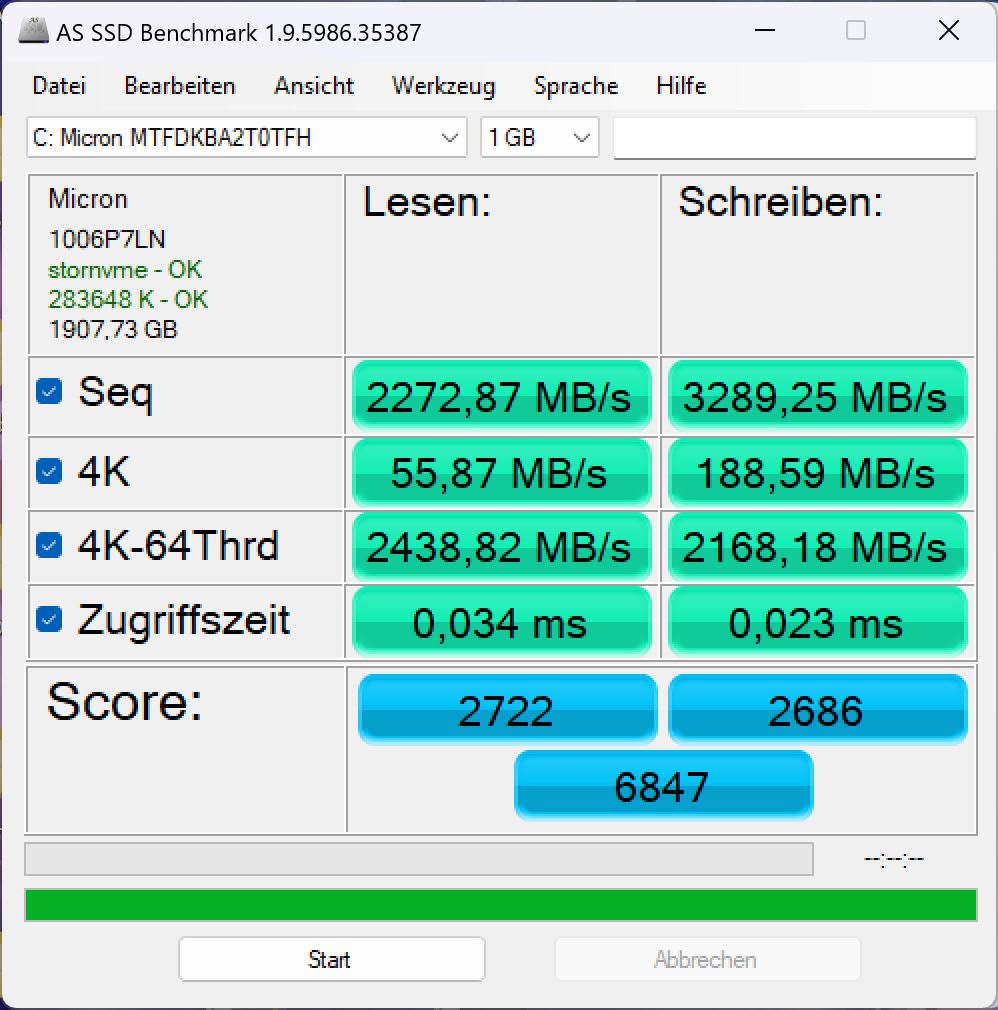
Lagringsenhet
Lenovo har installerat en Micron 3400 med 2 TB lagringsutrymme i vår testmodell. Den är rankad 121:a i vår SSD-bästalistavilket innebär att den i bästa fall ligger i mellanklassen. Enligt Micron ska den uppnå sekventiella läshastigheter på upp till 6 600 MB/s och sekventiella skrivhastigheter på 5 000 MB/s, men vår modell var lika långt ifrån detta som den genomsnittliga bärbara datorn med samma SSD i vår databas. Endast Crystaldiskmark kunde bekräfta höga värden, medan DiskSpd och AS SSD mätte betydligt lägre datahastigheter.
Den bärbara datorns kontinuerliga belastningsbeteende är ovanligt: Medan andra modeller ibland värms upp efter en viss tid och sedan stryps, uppträdde lagringsenheten i Legion 9 exakt tvärtom. I början av testet fluktuerade dess prestanda kraftigt och sjönk upprepade gånger. Men SSD-enheten kördes sedan konstant med maximal hastighet under de sista två tredjedelarna av testet. Detta kan vara ett tecken på att kylsystemet i Legion 9i kommer igång lite för sent, eller att det når sin optimala kylkapacitet för sent.

* ... mindre är bättre
Reading continuous performance: DiskSpd Read Loop, Queue Depth 8
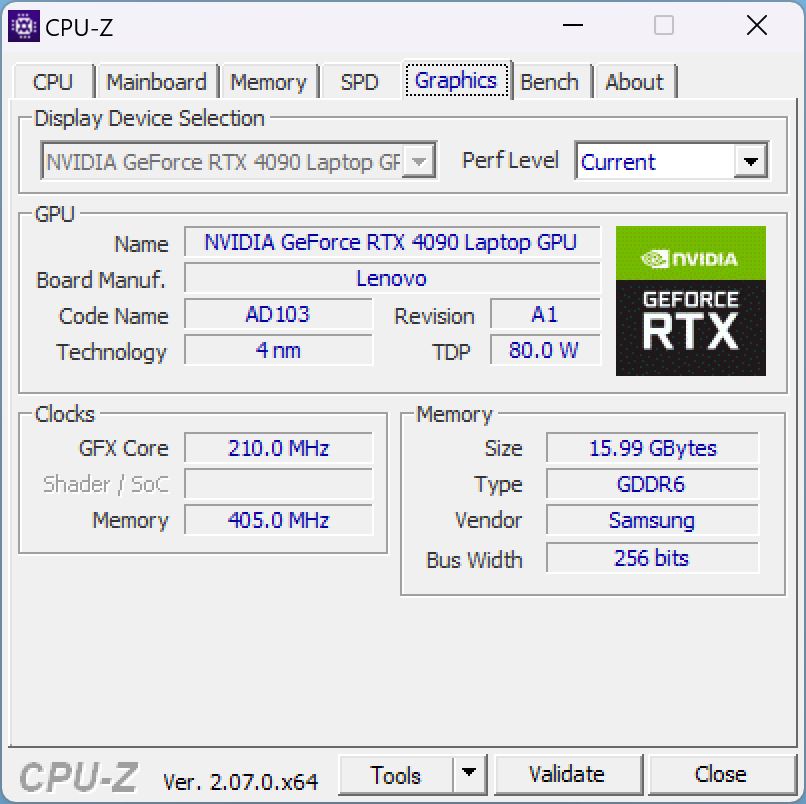
Grafikkort
Nvidia Geforce Nvidia Geforce RTX 4090 i Legion 9i är den nuvarande spjutspetsen bland grafikkort för bärbara datorer. Följaktligen bör det kunna köra alla aktuella spel i hög upplösning och maximala detaljer.
I de syntetiska 3DMark-testerna var prestandan ungefär på den förväntade nivån, men återigen var den lite i underkant och den direkta konkurrensen var ofta några procentenheter snabbare - av en händelse också den betydligt mindre och tunnare Blade 16.
Om du kopplar bort den bärbara datorn från strömförsörjningen sjunker dess Fire Strike poäng med cirka 40 procent när det gäller 3D-prestanda.
När det gäller spel är prestandan ungefär jämförbar med Razer Blade 16. Resultaten skulle möjligen vara högre om det inte vore för de tidigare nämnda korta bildfrekvensfallen. Du kan se problemet ganska tydligt i bildfrekvensvärdena för vårt 1-timmars Witcher 3 -test. Bildfrekvensminskningarna inträffade främst i de tidiga stadierna, varefter systemet kördes stabilt och dess prestanda var i nivå med konkurrenterna.
Endast när man kör mycket aktuella och krävande spel som Skull & Bones glider dess 4K-bildfrekvens ibland under 60 fps-markeringen, annars körs alla spel smidigt med över 60 fps, även i 4K.
| Prestandaprofil/mätvärde | Witcher 3 fps start | Witcher 3 fps efter 10 min | Förbrukning i watt | GPU strömförbrukning i watt | Avg GPU klocka i MHz | Brusemissioner i dB |
|---|---|---|---|---|---|---|
| Prestanda | 203 | 192 | 246 | 162 | 2.120 | 55,32 |
| Prestanda med GPU-boost | 201 | 193 | 254 | 160,5 | 2 180 | 55,32 |
| Balanserad med AI | 197 | 182 | 254 | 159 | 2 080 | 54,81 |
| Balanserad utan AI | 161 | 145 | 184 | 103 | 1.530 | 47,98 |
| Tyst | 108 | 60 | 101 | 43 | först 1.000, efter 2 min 800 | 32,19 |
| 3DMark 11 Performance | 46826 poäng | |
| 3DMark Cloud Gate Standard Score | 67697 poäng | |
| 3DMark Fire Strike Score | 34686 poäng | |
| 3DMark Time Spy Score | 20099 poäng | |
Hjälp | ||
* ... mindre är bättre
| The Witcher 3 - 1920x1080 Ultra Graphics & Postprocessing (HBAO+) | |
| Lenovo Legion 9 16IRX8 | |
| Alienware m18 R2 | |
| Medion Erazer Beast X40 2024 | |
| Lenovo Legion 9 16IRX9, RTX 4090 | |
| Razer Blade 16 2024, RTX 4090 | |
| Asus ROG Strix Scar 18 G834JYR (2024) | |
| Genomsnitt av klass Gaming (18.4 - 214, n=119, senaste 2 åren) | |
| GTA V - 1920x1080 Highest Settings possible AA:4xMSAA + FX AF:16x | |
| Lenovo Legion 9 16IRX8 | |
| Medion Erazer Beast X40 2024 | |
| Razer Blade 16 2024, RTX 4090 | |
| Alienware m18 R2 | |
| Lenovo Legion 9 16IRX9, RTX 4090 | |
| Asus ROG Strix Scar 18 G834JYR (2024) | |
| Genomsnitt av klass Gaming (12.1 - 168.2, n=132, senaste 2 åren) | |
Witcher 3 FPS diagram
| låg | med. | hög | ultra | QHD | 4K DLSS | 4K FSR | 4K | |
|---|---|---|---|---|---|---|---|---|
| GTA V (2015) | 186.9 | 185.2 | 183.3 | 136.2 | 138.9 | 95 | ||
| The Witcher 3 (2015) | 540 | 494 | 370 | 203.4 | 165 | 104.5 | ||
| Dota 2 Reborn (2015) | 201 | 181.8 | 174.4 | 164.5 | 160.8 | |||
| Final Fantasy XV Benchmark (2018) | 228 | 194.9 | 165.1 | 142 | ||||
| X-Plane 11.11 (2018) | 193.5 | 166.3 | 125.6 | 109.6 | ||||
| Far Cry 5 (2018) | 201 | 173 | 166 | 155 | 146 | 104 | ||
| Strange Brigade (2018) | 499 | 403 | 387 | 369 | 290 | |||
| F1 23 (2023) | 151.5 | 149.2 | 144.6 | |||||
| Cyberpunk 2077 2.2 Phantom Liberty (2023) | 127 | 86 | ||||||
| Skull & Bones (2024) | 164 | 140 | 149 | 118 | 98 | 90 | 81 | 61 |
| F1 24 (2024) | 339 | 304 | 113.6 | 72.1 |
Utsläpp & effekt - Högt och varmt
Bullerutsläpp
I viloläge på skrivbordet är den bärbara datorns fläktar oftast tysta. Ibland kan de öka hastigheten en kort stund, men sedan lugna ner sig igen. Men så snart du placerar enheten även under vardagliga belastningar som att surfa på webben, börjar fläktarna snabbt att arbeta, även i tyst läge.
Under 3DMark06 ökade fläktarna först kontinuerligt till strax över 40 dB, lugnade sedan ner sig igen till 35 dB innan de planade ut på cirka 39 dB under den sista tredjedelen. Detta kan också vara ett tecken på att systemet anpassar sin kylning och prestanda till de termiska förhållandena för sent och först efter en tid når de optimala värdena.
När du spelar och i Performance-läge kör fläktarna på cirka 55 dB som mest, vilket är ganska högt i jämförelse; Blade 16, till exempel, förblir tystare. I läget Balanced (utan AI) sjunker den bärbara datorns ljudnivå till mer måttliga 47 dB, men då minskar spelprestandan märkbart, nämligen med 20 till 25 procent.
Ljudnivå
| Låg belastning |
| 23 / 23 / 23 dB(A) |
| Hög belastning |
| 39 / 55.56 dB(A) |
 | ||
30 dB tyst 40 dB(A) hörbar 50 dB(A) högt ljud |
||
min: | ||
| Lenovo Legion 9 16IRX9, RTX 4090 NVIDIA GeForce RTX 4090 Laptop GPU, i9-14900HX, Micron 3400 2TB MTFDKBA2T0TFH | Lenovo Legion 9 16IRX8 NVIDIA GeForce RTX 4090 Laptop GPU, i9-13980HX, 2x SK Hynix HFS001TEJ9X115N (RAID 0) | Razer Blade 16 2024, RTX 4090 NVIDIA GeForce RTX 4090 Laptop GPU, i9-14900HX, Samsung PM9A1 MZVL22T0HBLB | Alienware m18 R2 NVIDIA GeForce RTX 4090 Laptop GPU, i9-14900HX, SK Hynix PC811 HFS002TEM9X152N | Asus ROG Strix Scar 18 G834JYR (2024) NVIDIA GeForce RTX 4090 Laptop GPU, i9-14900HX, Samsung PM9A1a MZVL22T0HDLB | Medion Erazer Beast X40 2024 NVIDIA GeForce RTX 4090 Laptop GPU, i9-14900HX, Phison E18-1TB-PHISON-SSD-BICS5 | |
|---|---|---|---|---|---|---|
| Noise | -2% | -1% | -5% | -13% | -15% | |
| av / miljö * | 23 | 23.7 -3% | 23 -0% | 23.6 -3% | 24 -4% | 25 -9% |
| Idle Minimum * | 23 | 24 -4% | 23 -0% | 23.8 -3% | 27 -17% | 28 -22% |
| Idle Average * | 23 | 24 -4% | 23 -0% | 26.1 -13% | 28 -22% | 29 -26% |
| Idle Maximum * | 23 | 30.4 -32% | 27.66 -20% | 31.5 -37% | 32 -39% | 32 -39% |
| Load Average * | 39 | 30.4 22% | 43.76 -12% | 31.5 19% | 50 -28% | 48 -23% |
| Witcher 3 ultra * | 55.32 | 52.2 6% | 46.81 15% | 52.1 6% | 50 10% | 50 10% |
| Load Maximum * | 55.56 | 54.9 1% | 50.37 9% | 56.6 -2% | 52 6% | 52 6% |
* ... mindre är bättre
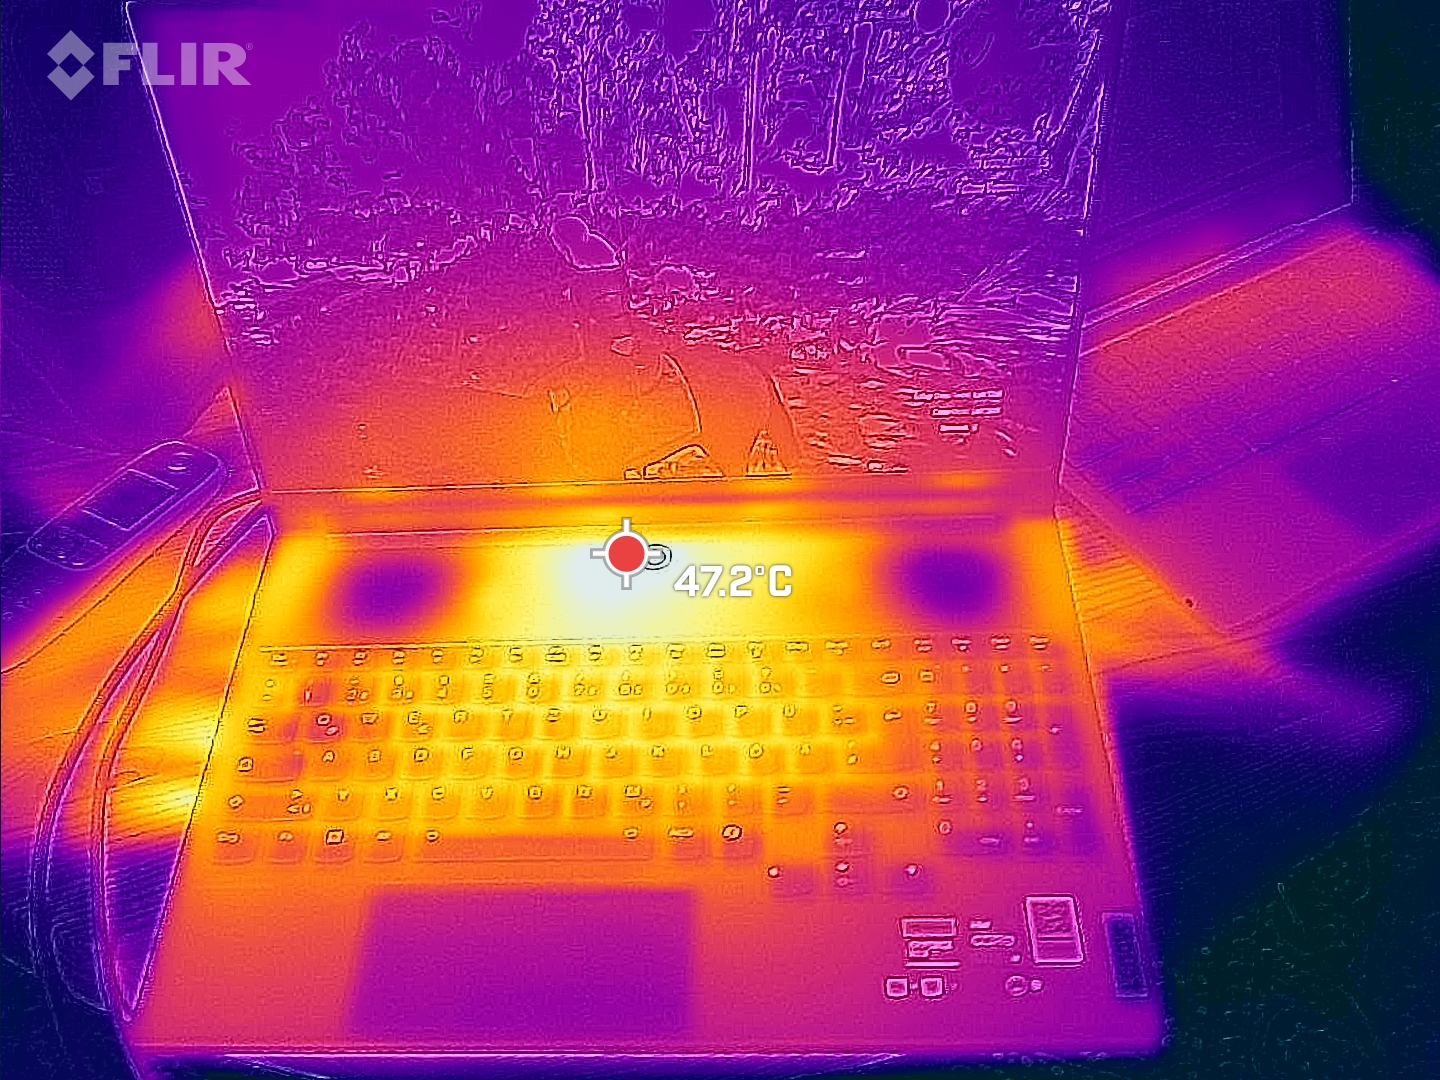
Temperatur
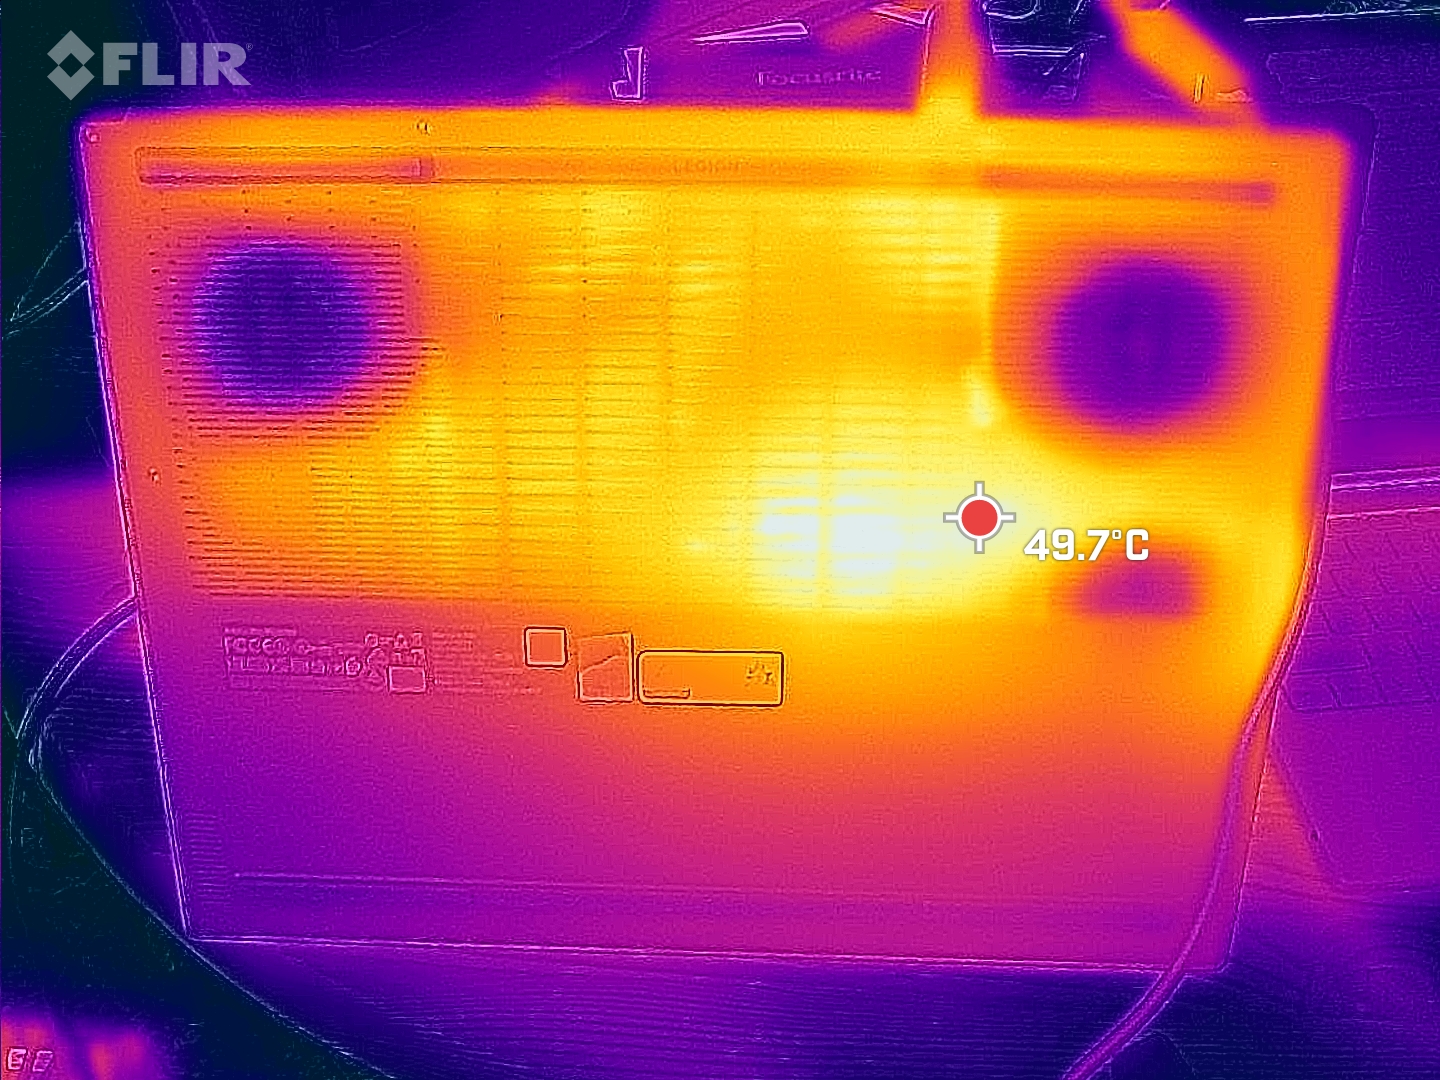
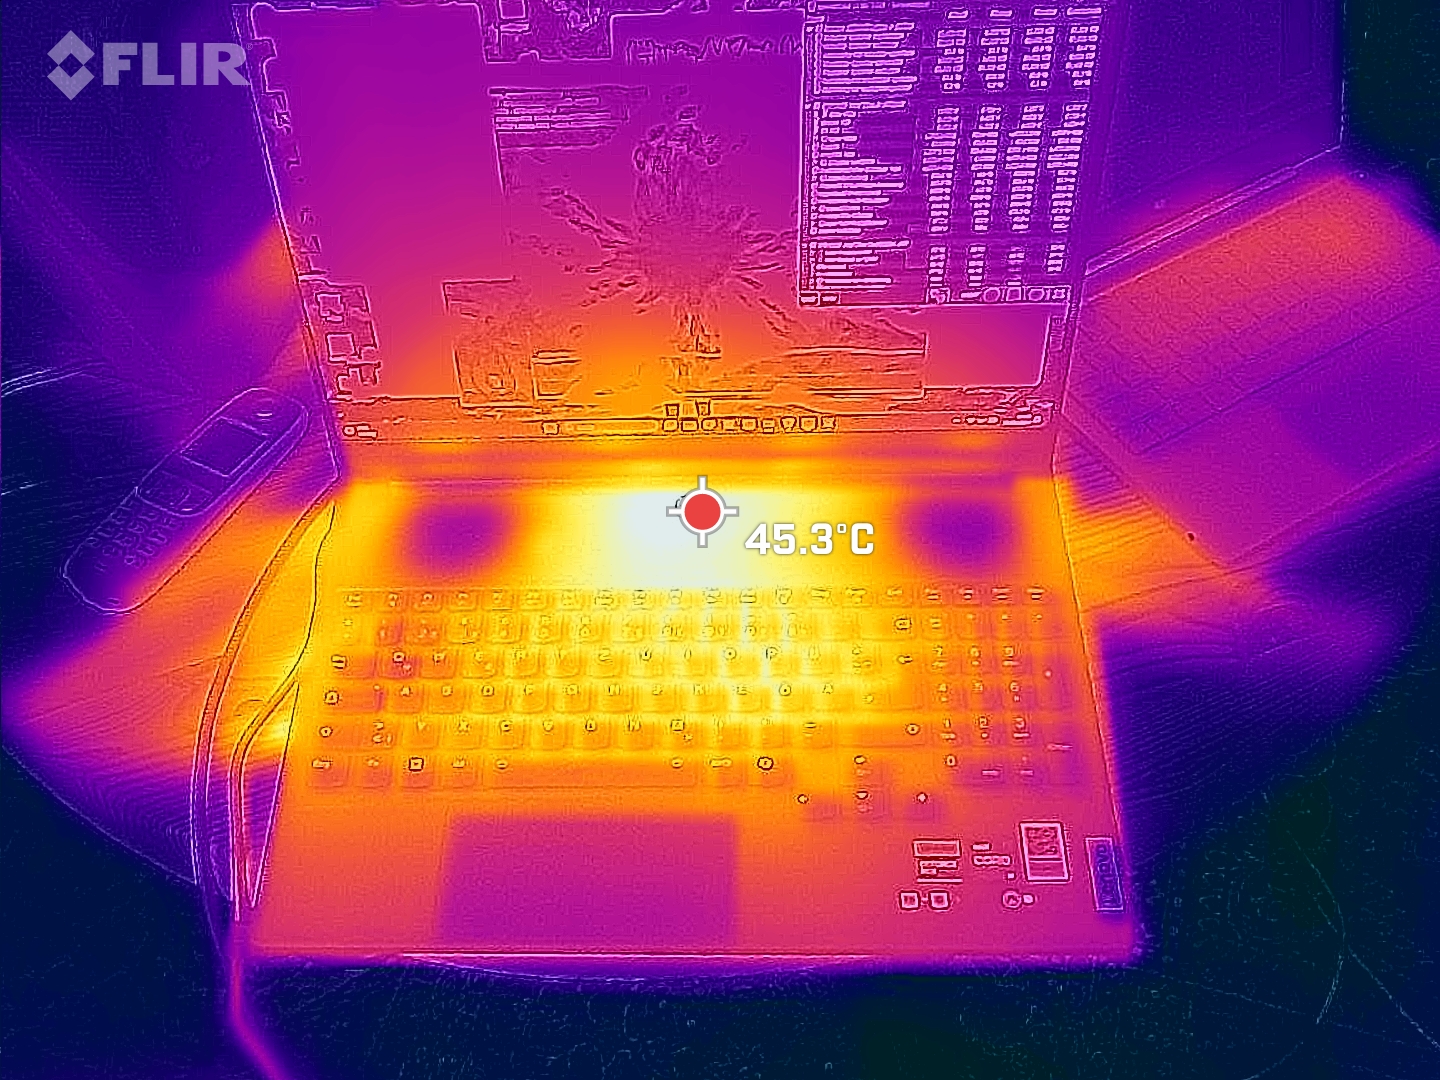
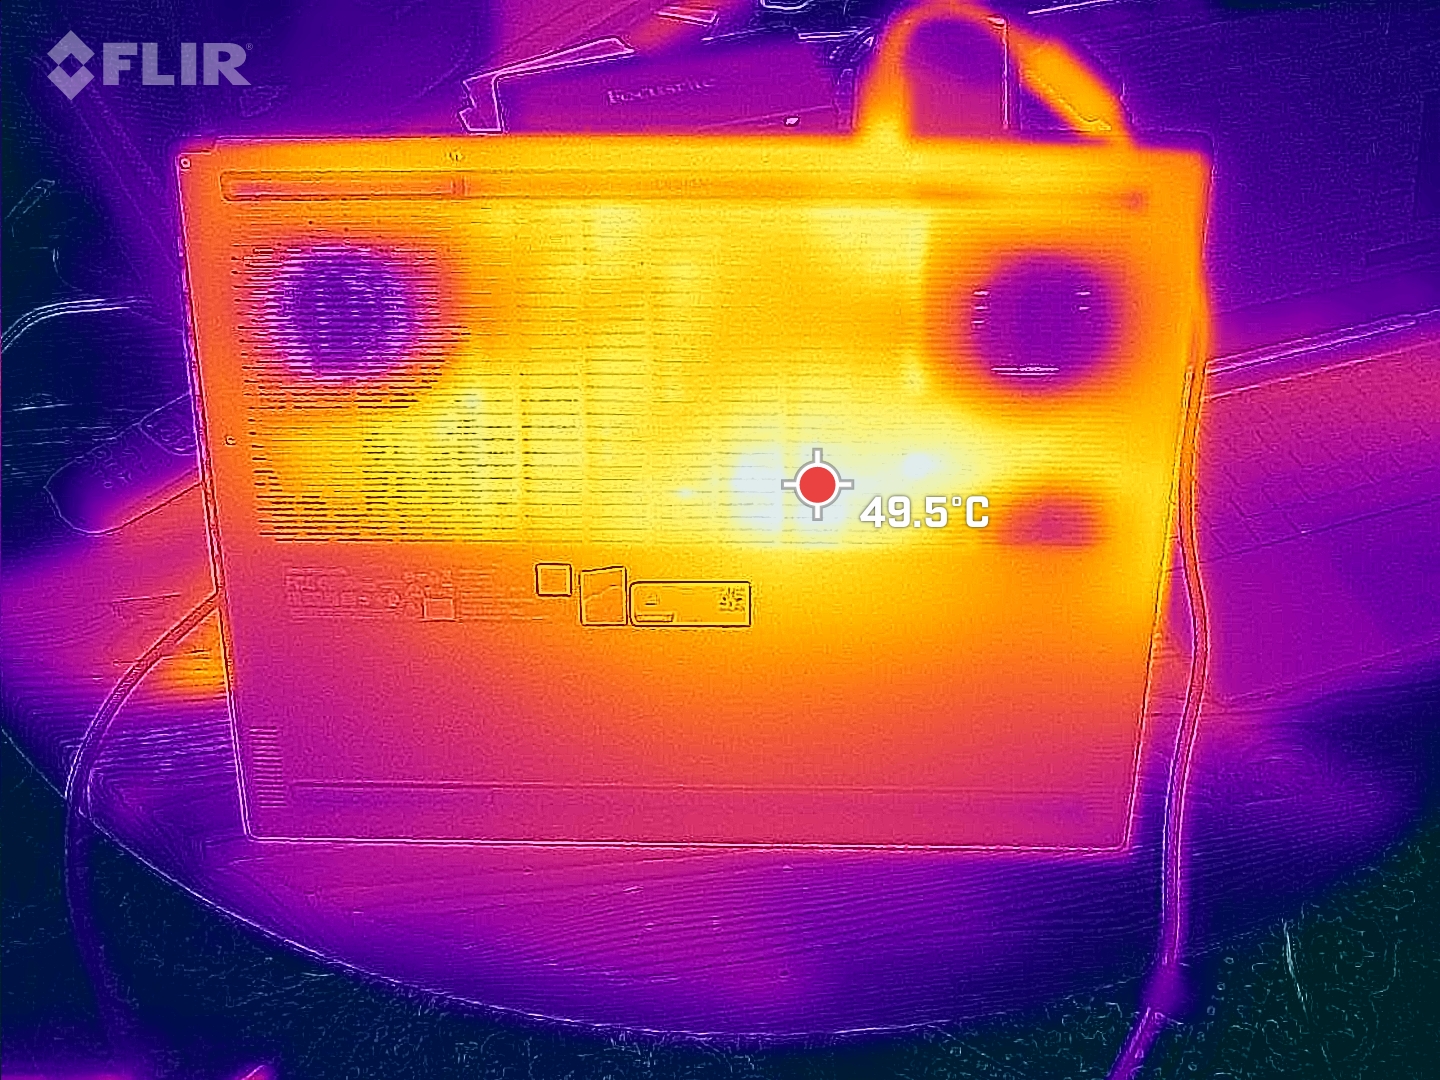
Trots det ganska högljudda kylsystemet är den bärbara datorns temperaturer ganska höga i jämförelse. De hetaste punkterna vid spel och annan tung belastning är i mitten och mot skärmen. Det kan också bli ganska varmt runt WASD-tangenterna - vi uppmätte 46 °C. Åtminstone handledsstöden är fortfarande okej. Inte ens föregångaren var perfekt i det här avseendet, men Lenovo har uppenbarligen inte gjort några förbättringar.
(-) Den maximala temperaturen på ovansidan är 56 °C / 133 F, jämfört med genomsnittet av 40.4 °C / 105 F , allt från 21.2 till 68.8 °C för klassen Gaming.
(-) Botten värms upp till maximalt 53 °C / 127 F, jämfört med genomsnittet av 43.2 °C / 110 F
(±) Vid tomgångsbruk är medeltemperaturen för ovansidan 33.6 °C / 92 F, jämfört med enhetsgenomsnittet på 33.9 °C / ### class_avg_f### F.
(-) När du spelar The Witcher 3 är medeltemperaturen för ovansidan 42.3 °C / 108 F, jämfört med enhetsgenomsnittet på 33.9 °C / ## #class_avg_f### F.
(±) Handledsstöden och pekplattan kan bli väldigt varma vid beröring med maximalt 36 °C / 96.8 F.
(-) Medeltemperaturen för handledsstödsområdet på liknande enheter var 28.9 °C / 84 F (-7.1 °C / -12.8 F).
| Lenovo Legion 9 16IRX9, RTX 4090 Intel Core i9-14900HX, NVIDIA GeForce RTX 4090 Laptop GPU | Lenovo Legion 9 16IRX8 Intel Core i9-13980HX, NVIDIA GeForce RTX 4090 Laptop GPU | Razer Blade 16 2024, RTX 4090 Intel Core i9-14900HX, NVIDIA GeForce RTX 4090 Laptop GPU | Alienware m18 R2 Intel Core i9-14900HX, NVIDIA GeForce RTX 4090 Laptop GPU | Asus ROG Strix Scar 18 G834JYR (2024) Intel Core i9-14900HX, NVIDIA GeForce RTX 4090 Laptop GPU | Medion Erazer Beast X40 2024 Intel Core i9-14900HX, NVIDIA GeForce RTX 4090 Laptop GPU | |
|---|---|---|---|---|---|---|
| Heat | 11% | 21% | 9% | 17% | 13% | |
| Maximum Upper Side * | 56 | 49.6 11% | 45 20% | 41.2 26% | 49 12% | 47 16% |
| Maximum Bottom * | 53 | 48.6 8% | 45 15% | 34.6 35% | 47 11% | 54 -2% |
| Idle Upper Side * | 38 | 33.2 13% | 29 24% | 42.8 -13% | 29 24% | 30 21% |
| Idle Bottom * | 39 | 34.2 12% | 30 23% | 43.6 -12% | 31 21% | 32 18% |
* ... mindre är bättre
Högtalare
Det hörbara området är mycket linjärt, de höga och mellersta tonerna är välbalanserade. Basen är dock naturligt reducerad, men fortfarande märkbar. Högtalarna skulle också behöva vara lite mer kraftfulla, dvs. högre.
Lenovo Legion 9 16IRX9, RTX 4090 ljudanalys
(±) | högtalarljudstyrkan är genomsnittlig men bra (78.96 dB)
Bas 100 - 315 Hz
(±) | reducerad bas - i genomsnitt 13.2% lägre än medianen
(±) | linjäriteten för basen är genomsnittlig (8.9% delta till föregående frekvens)
Mellan 400 - 2000 Hz
(+) | balanserad mellan - endast 3.2% från medianen
(+) | mids är linjära (3.4% delta till föregående frekvens)
Högsta 2 - 16 kHz
(+) | balanserade toppar - endast 1.8% från medianen
(+) | toppar är linjära (4% delta till föregående frekvens)
Totalt 100 - 16 000 Hz
(+) | det totala ljudet är linjärt (11.3% skillnad mot median)
Jämfört med samma klass
» 8% av alla testade enheter i den här klassen var bättre, 3% liknande, 89% sämre
» Den bästa hade ett delta på 6%, genomsnittet var 18%, sämst var 132%
Jämfört med alla testade enheter
» 6% av alla testade enheter var bättre, 2% liknande, 92% sämre
» Den bästa hade ett delta på 4%, genomsnittet var 24%, sämst var 134%
Razer Blade 16 2024, RTX 4090 ljudanalys
(±) | högtalarljudstyrkan är genomsnittlig men bra (81.16 dB)
Bas 100 - 315 Hz
(±) | reducerad bas - i genomsnitt 8.2% lägre än medianen
(±) | linjäriteten för basen är genomsnittlig (7.4% delta till föregående frekvens)
Mellan 400 - 2000 Hz
(+) | balanserad mellan - endast 3.3% från medianen
(+) | mids är linjära (5.9% delta till föregående frekvens)
Högsta 2 - 16 kHz
(+) | balanserade toppar - endast 1.6% från medianen
(+) | toppar är linjära (3.1% delta till föregående frekvens)
Totalt 100 - 16 000 Hz
(+) | det totala ljudet är linjärt (9.2% skillnad mot median)
Jämfört med samma klass
» 3% av alla testade enheter i den här klassen var bättre, 1% liknande, 96% sämre
» Den bästa hade ett delta på 6%, genomsnittet var 18%, sämst var 132%
Jämfört med alla testade enheter
» 3% av alla testade enheter var bättre, 1% liknande, 97% sämre
» Den bästa hade ett delta på 4%, genomsnittet var 24%, sämst var 134%
Strömförbrukning
Förbrukningen kan vara något förbättrad jämfört med den tidigare modellen, både vid tomgångskörning och annars. Men inte mycket - till och med 18-tumskonkurrenterna är ofta mer sparsamma, åtminstone vid tomgångskörning.
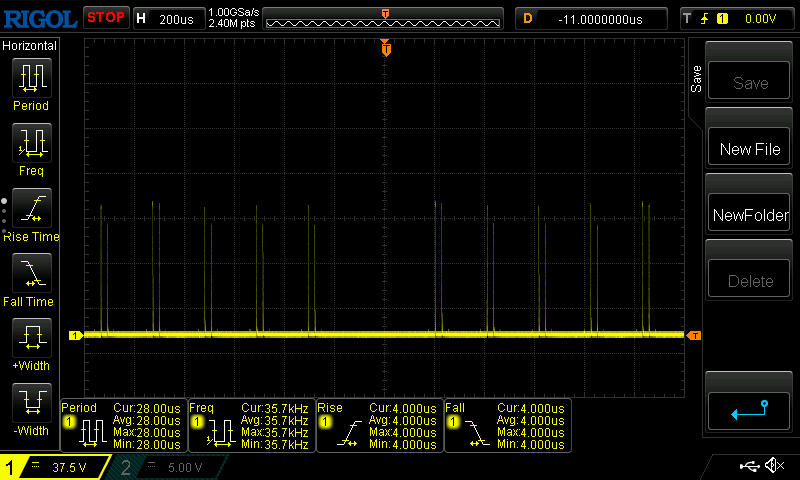
Det förmodade problemet med den nya Legion 9 kan ses igen i dess förbrukningsdiagram, eftersom dess förbrukning (och därmed också dess prestanda) sjönk mycket kort från tid till annan i olika tester. Det som fortfarande var normalt i Cinebench 23 var inte längre det i Witcher 3 eller Furmark-testerna.
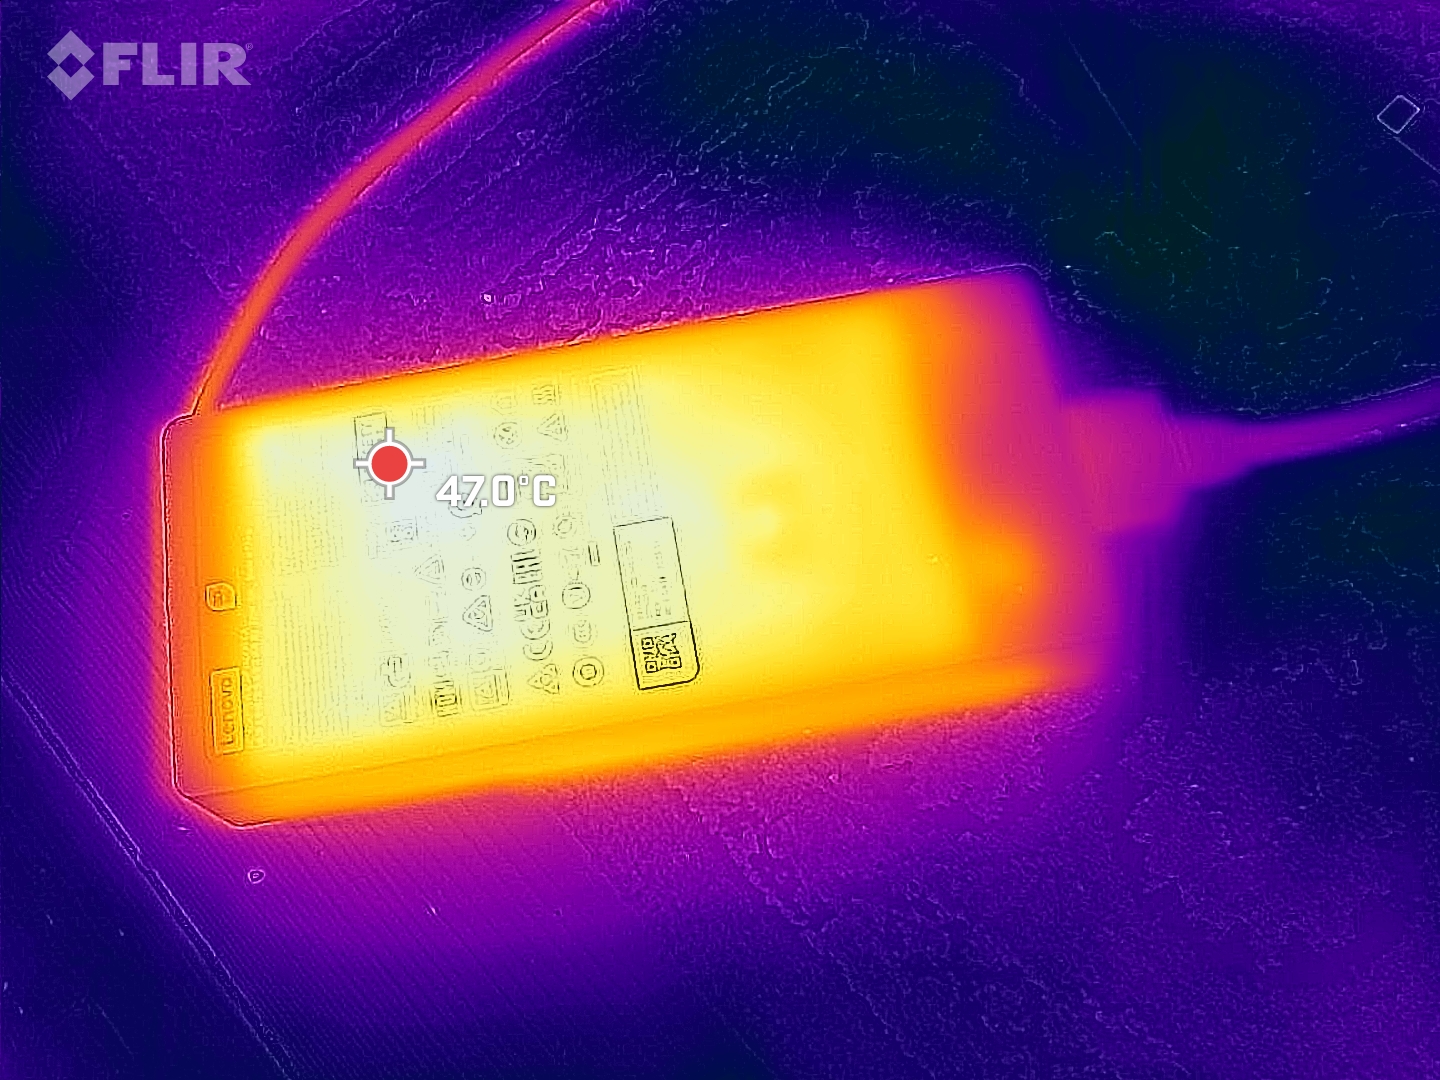
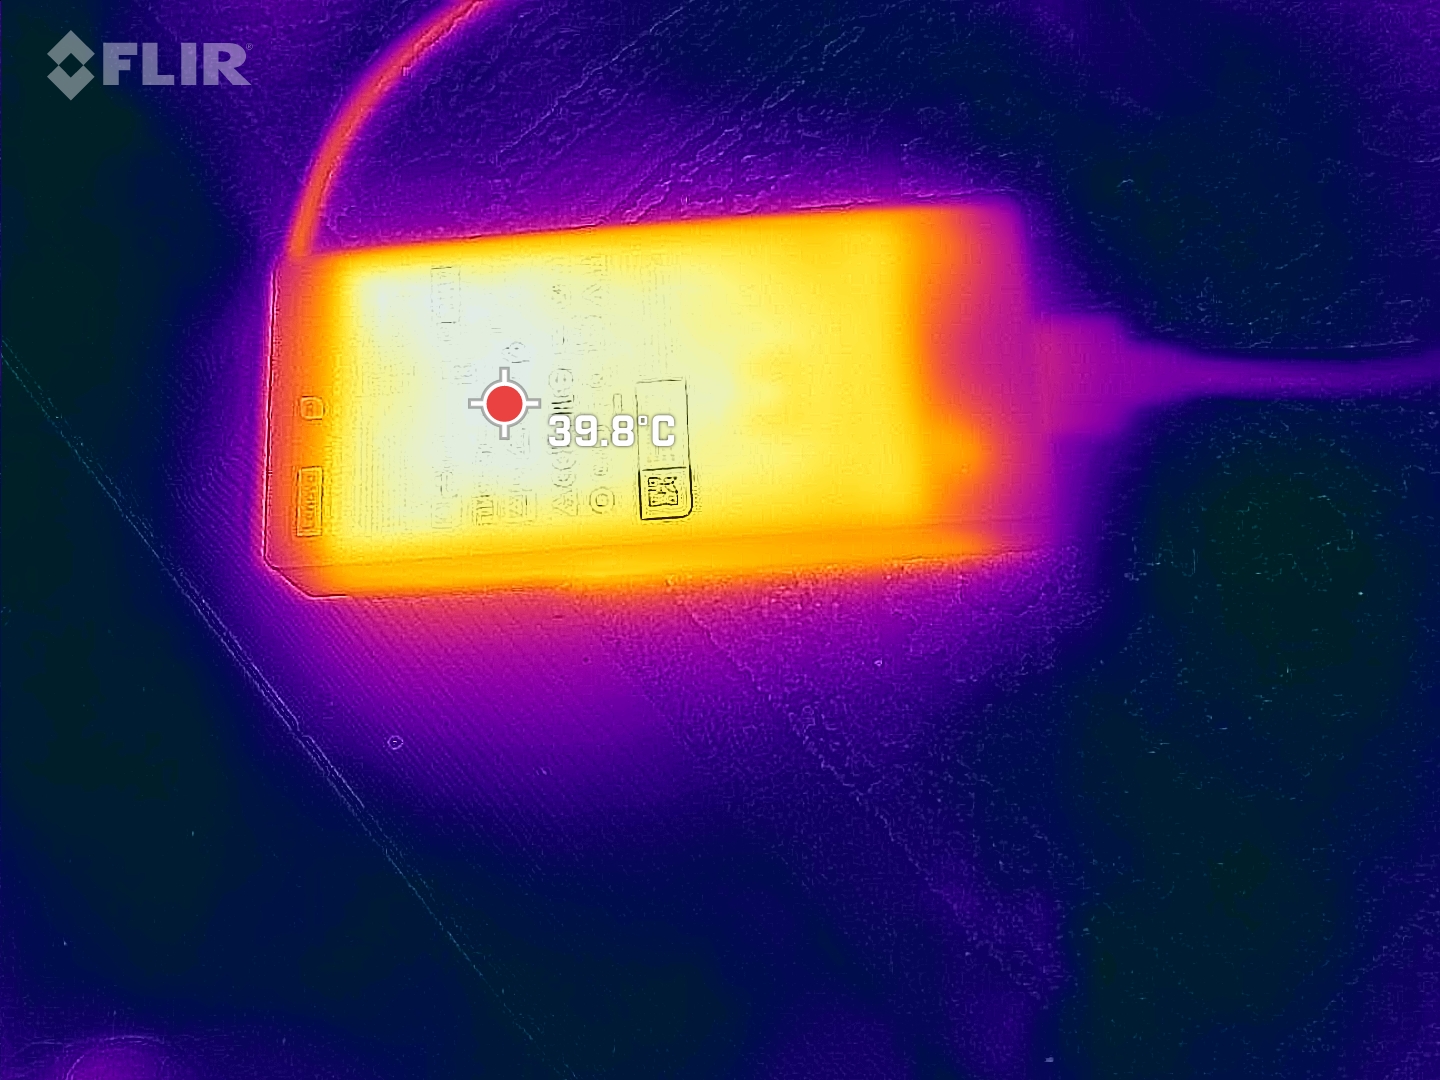
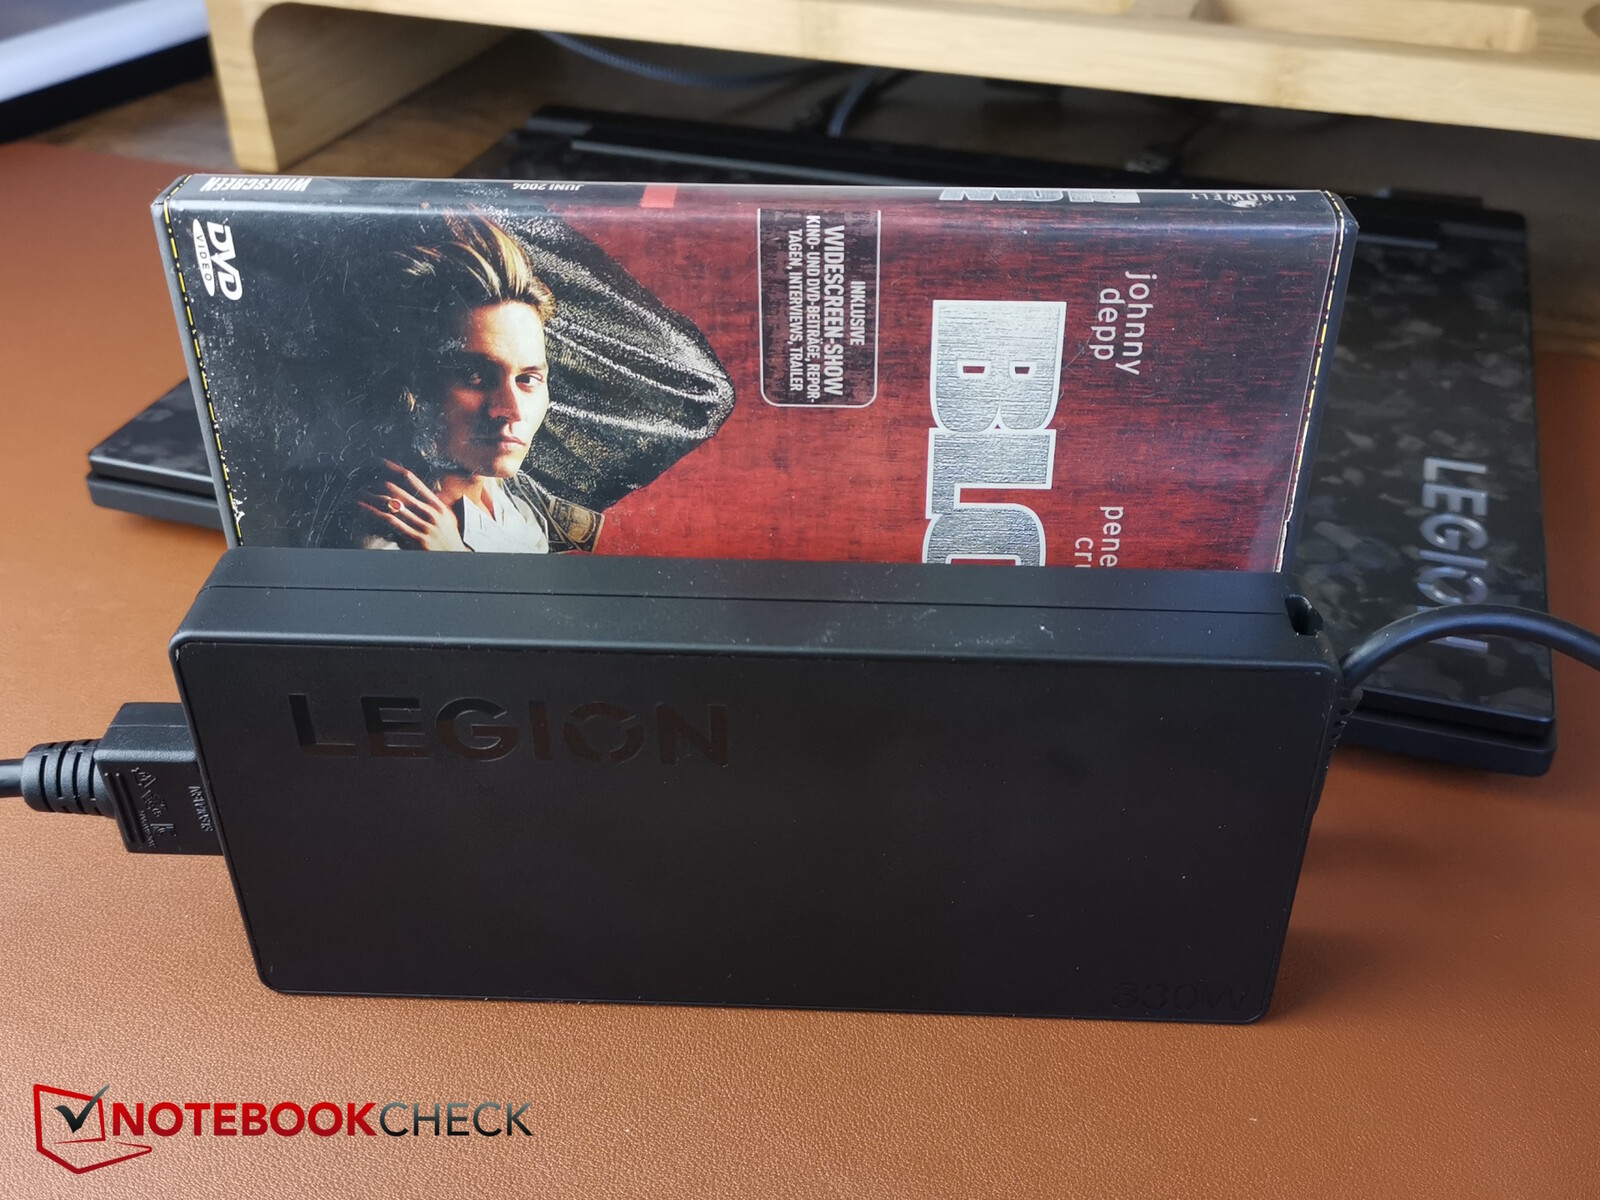
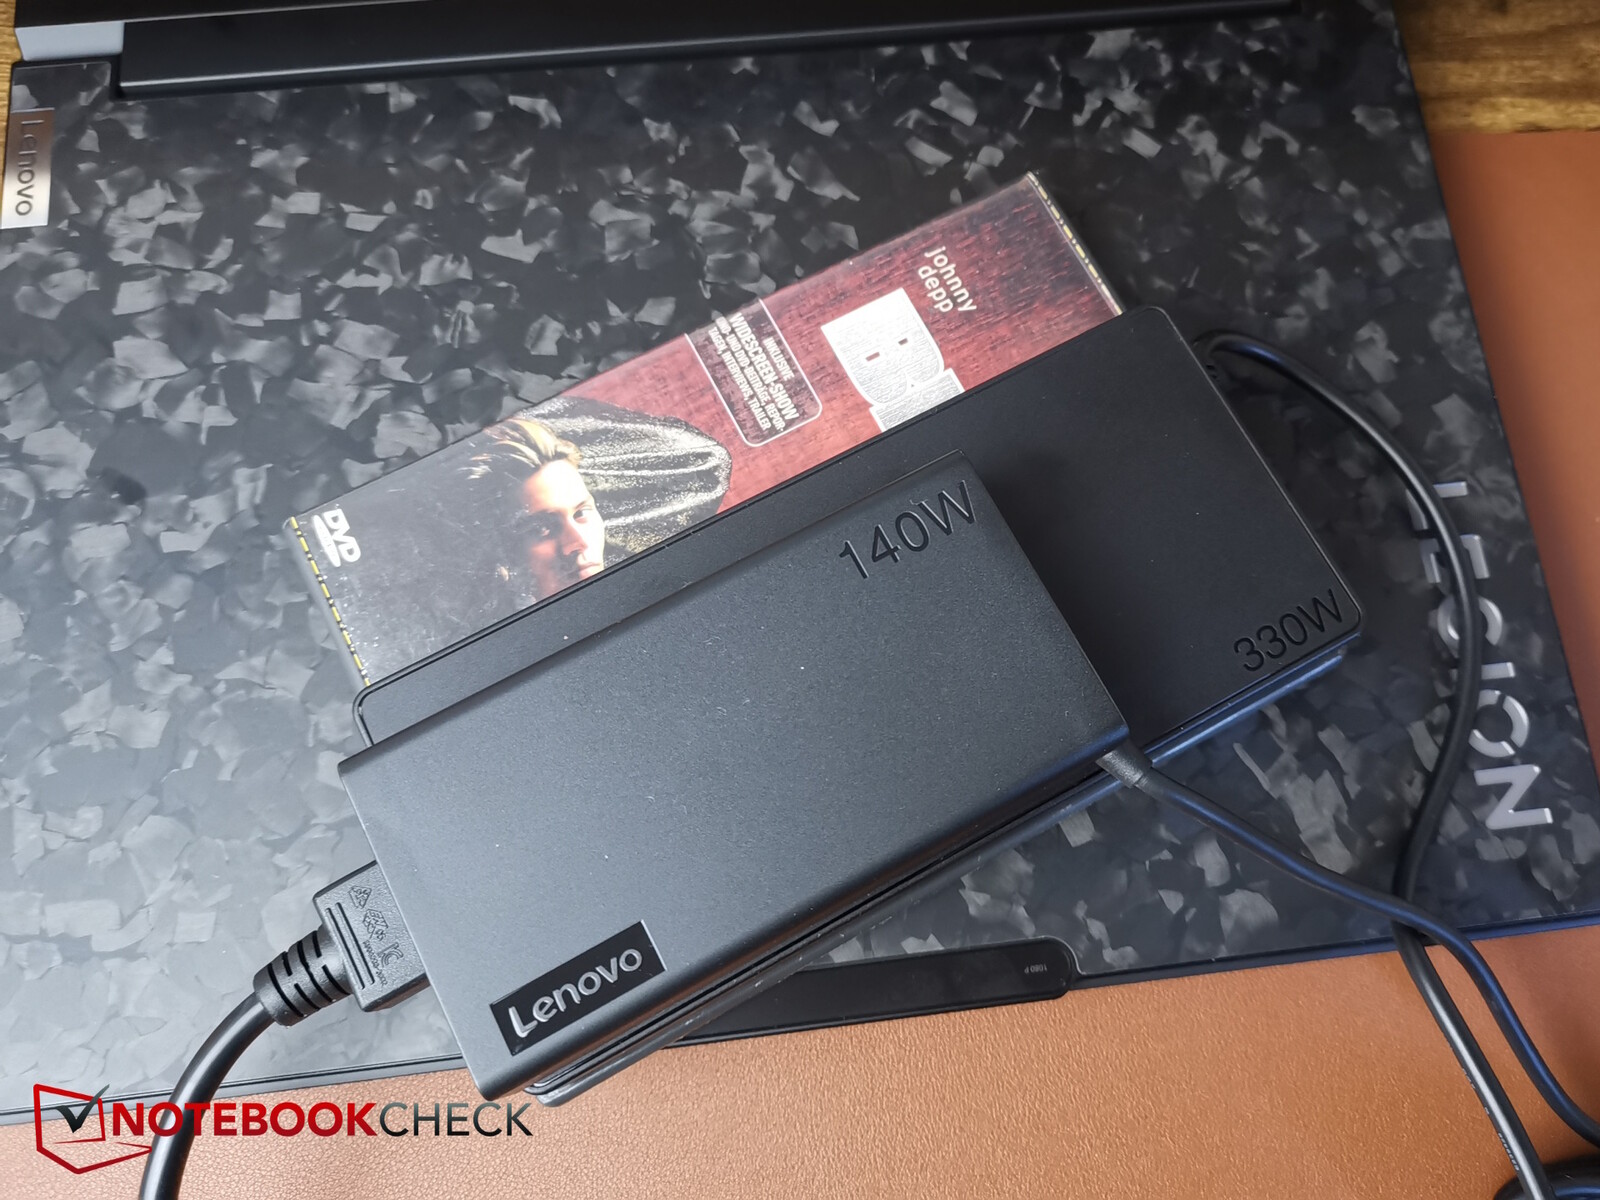
Vi uppmätte en kortvarig maximal förbrukning på 323 watt med hjälp av den platta och relativt lilla strömförsörjningsenheten. Denna enhet är konstruerad för 330 watt och bör därför inte ha några problem med att förse den bärbara datorn med ström i alla situationer.
En unik funktion: Legion 9 levereras också med ett andra nätaggregat, ett mycket mindre USB-C-strömaggregat på 140 watt. Om du inte spelar är den mindre adaptern naturligtvis ännu bättre lämpad för användning på resande fot.
| Av/Standby | |
| Låg belastning | |
| Hög belastning |
|
Förklaring:
min: | |
| Lenovo Legion 9 16IRX9, RTX 4090 i9-14900HX, NVIDIA GeForce RTX 4090 Laptop GPU, Micron 3400 2TB MTFDKBA2T0TFH, MiniLED, 3200x2000, 16" | Lenovo Legion 9 16IRX8 i9-13980HX, NVIDIA GeForce RTX 4090 Laptop GPU, 2x SK Hynix HFS001TEJ9X115N (RAID 0), Mini-LED, 3200x2000, 16" | Razer Blade 16 2024, RTX 4090 i9-14900HX, NVIDIA GeForce RTX 4090 Laptop GPU, Samsung PM9A1 MZVL22T0HBLB, OLED, 2560x1600, 16" | Asus ROG Strix Scar 18 G834JYR (2024) i9-14900HX, NVIDIA GeForce RTX 4090 Laptop GPU, Samsung PM9A1a MZVL22T0HDLB, Mini LED, 2560x1600, 18" | Medion Erazer Beast X40 2024 i9-14900HX, NVIDIA GeForce RTX 4090 Laptop GPU, Phison E18-1TB-PHISON-SSD-BICS5, IPS, 2560x1600, 17" | Genomsnitt NVIDIA GeForce RTX 4090 Laptop GPU | Genomsnitt av klass Gaming | |
|---|---|---|---|---|---|---|---|
| Power Consumption | -34% | 12% | 11% | 13% | 1% | 22% | |
| Idle Minimum * | 20.5 | 32.3 -58% | 16.9 18% | 14 32% | 7 66% | 16.2 ? 21% | 13.4 ? 35% |
| Idle Average * | 27.7 | 42.6 -54% | 17.8 36% | 17 39% | 15 46% | 23.1 ? 17% | 18.9 ? 32% |
| Idle Maximum * | 32.1 | 57.9 -80% | 19.6 39% | 24 25% | 33 -3% | 34.2 ? -7% | 26.3 ? 18% |
| Load Average * | 105 | 121 -15% | 128 -22% | 143 -36% | 134 -28% | 130.5 ? -24% | 102.7 ? 2% |
| Witcher 3 ultra * | 246 | 254 -3% | 243 1% | 251 -2% | 280 -14% | ||
| Load Maximum * | 323 | 297.7 8% | 328 -2% | 302 7% | 294 9% | 324 ? -0% | 244 ? 24% |
* ... mindre är bättre
Power consumption Witcher 3 / stress test
Power consumption with external monitor
Körtider
Det inbyggda batteriet har en kapacitet på cirka 100 Wh, vilket är i nivå med konkurrenterna. Trots detta är dess drifttider ofta kortare - ett problem som dess föregångare och andra bärbara datorer med MiniLED-skärmar redan har att kämpa med. Även om drifttiden har förbättrats, får jämförelseenheterna (förutom den bärbara Alienware-datorn) längre drifttid ur sina batterier. Detsamma gäller till exempel Asus ROG Scar Strix, som också har en MiniLED-skärm.
Ändå räcker det för knappt 5 timmars videotittande eller surfande på nätet med ljusstyrkan reducerad till 150 nits. Asus-enheten varar över 6 timmar här.
Lenovos bärbara dator stöder en snabbladdningsfunktion, som först måste aktiveras i Vantage-programvaran. Efter det tar en full laddning bara cirka en timme.
| Lenovo Legion 9 16IRX9, RTX 4090 i9-14900HX, NVIDIA GeForce RTX 4090 Laptop GPU, 99.99 Wh | Lenovo Legion 9 16IRX8 i9-13980HX, NVIDIA GeForce RTX 4090 Laptop GPU, 99.9 Wh | Razer Blade 16 2024, RTX 4090 i9-14900HX, NVIDIA GeForce RTX 4090 Laptop GPU, 95.2 Wh | Alienware m18 R2 i9-14900HX, NVIDIA GeForce RTX 4090 Laptop GPU, 97 Wh | Asus ROG Strix Scar 18 G834JYR (2024) i9-14900HX, NVIDIA GeForce RTX 4090 Laptop GPU, 90 Wh | Medion Erazer Beast X40 2024 i9-14900HX, NVIDIA GeForce RTX 4090 Laptop GPU, 99.8 Wh | Genomsnitt av klass Gaming | |
|---|---|---|---|---|---|---|---|
| Batteridrifttid | -50% | 10% | 0% | 24% | 29% | 17% | |
| H.264 | 294 | 456 55% | 447 52% | 447 ? 52% | |||
| WiFi v1.3 | 290 | 159 -45% | 329 13% | 290 0% | 461 59% | 374 29% | 387 ? 33% |
| Load | 129 | 58 -55% | 79 -39% | 77 -40% | 84.5 ? -34% | ||
| Reader / Idle | 404 | 612 | 585 ? |
För
Emot
Utlåtande - Fler problem än väntat
I förhållande till sitt pris är Lenovo Legion 9i en high-end gamer med en attraktiv design, bra material, bra byggkvalitet och en ljusstark Mini LED-skärm med HDR1000. Dess platta strömförsörjning som inte finns hos konkurrenterna samt dess extra 140-watts USB-C-strömförsörjning kan klassas som ytterligare pluspoäng.
Men medan de mindre Legion -modellerna imponerar med sin goda systemoptimering, lider toppmodellen av betydligt fler svagheter och problem än väntat. Först och främst är det latensproblemen som inte bara blev uppenbara under LatencyMon-testet - vi märkte dem också när vi testade RAM-latens och även när du spelar spel kan du se några synliga tappade bildrutor. Till detta kommer dess ovanligt svaga enkärniga prestanda. Ett annat större problem är dess suboptimala kylsystem. Det verkar som om det kyler för sent och ibland för lite, vilket till exempel resulterar i att SSD-enheten stryps. Dessutom blir det väldigt högljutt under belastning, samtidigt som det inte förhindrar höga yttemperaturer lika bra som konkurrenterna gör. Även om batteritiden har förbättrats är den inte lika bra som konkurrenternas. Så totalt sett finns det gott om utrymme för förbättringar.
Legion 9i är en snygg high-end gamer men till skillnad från de mindre Legion modellerna så är det den dyra high-end modellen som får lida av irriterande problem som ett suboptimalt kylsystem och stora latensproblem.
Ett alternativ kan till exempel vara Razer Blade 16, som levererar jämförbar prestanda i ett mindre chassi och inte har lika många problem som Legion 9i. Bortsett från detta kändes föregångaren faktiskt som ett mer moget system och den har till och med högre prestanda som ett resultat av efterföljarens många problem. Som ett resultat är den nya Legion 9i för närvarande inte värd att köpa.
Uppdatering i september 2024: En BIOS-uppdatering har kommit som åtgärdar problemen med bildfrekvensen.
Pris och tillgänglighet
Vår konfiguration av Lenovo Legion 9 16IRX9 eller Lenovo Legion 9i kan köpas direkt från Lenovo för 3.804,66 US-dollar.
Obs: Vi har nyligen uppdaterat vårt betygssystem och resultaten från version 8 är inte jämförbara med resultaten från version 7. Mer information finns tillgänglig här .
Lenovo Legion 9 16IRX9, RTX 4090
- 09/27/2024 v8
Christian Hintze
 Total Sustainability Score:
 Genomskinlighet
Valet av enheter som ska granskas görs av vår redaktion. Testprovet gavs till författaren som ett lån av tillverkaren eller återförsäljaren för denna recension. Långivaren hade inget inflytande på denna recension och inte heller fick tillverkaren en kopia av denna recension innan publiceringen. Det fanns ingen skyldighet att publicera denna recension. Vi accepterar aldrig ersättning eller betalning i utbyte mot våra recensioner. Som ett oberoende medieföretag är Notebookcheck inte föremål för auktoritet från tillverkare, återförsäljare eller förlag.
This is how Notebookcheck is testingEvery year, Notebookcheck independently reviews hundreds of laptops and smartphones using standardized procedures to ensure that all results are comparable. We have continuously developed our test methods for around 20 years and set industry standards in the process. In our test labs, high-quality measuring equipment is utilized by experienced technicians and editors. These tests involve a multi-stage validation process. Our complex rating system is based on hundreds of well-founded measurements and benchmarks, which maintains objectivity.
Price comparison

