

Recension av Dell Inspiron 16 Plus 7640 bärbar dator: Små men viktiga förändringar jämfört med förra årets modell

Inspiron 16 Plus 7640, med det passande namnet, ersätter Inspiron 16 Plus 7630 från 2023 med nya AI-klara processorer istället för förra årets Raptor Lake-H-alternativ. Bortsett från några andra mindre förändringar inifrån och ut är modellen i stort sett identisk med sin föregångare och därför rekommenderar vi att du kollar in vår recension på Inspiron 15 Plus 7630 för att lära dig mer om de fysiska egenskaperna hos Inspiron 15 Plus 7640.
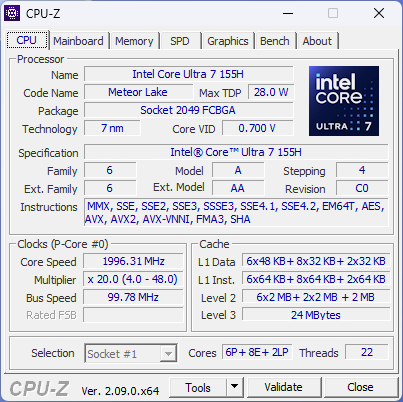
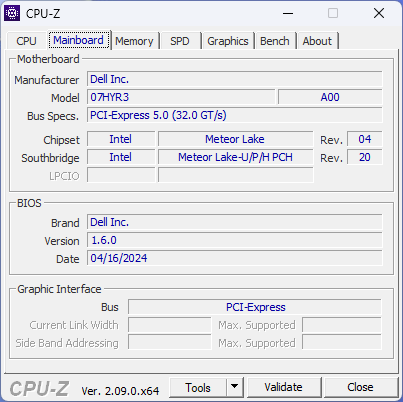
Inspiron 16 Plus 7640 finns i många olika konfigurationer, från 13:e generationens Core i7-13620H till 14:e generationens Core Ultra 9 185H, integrerad UHD- eller Arc-grafik till diskret GeForce RTX 4060, och 1200p- eller 1600p-skärmalternativ. AMD Zen 4 SKU:er med Ryzen 5 8540U eller Ryzen 7 8840U finns också tillgängliga, men endast för den vanliga Inspiron 16 7640 non-Plus-modellen utan diskret grafik eller 1600p-alternativ. Vår testenhet är en övre konfiguration med Core Ultra 7 155H, 1600p-skärm och RTX 4060-grafik för cirka $1300 i detaljhandeln.
Konkurrenter inkluderar andra 16-tums multimedia-bärbara datorer i mellanklassen som Asus VivoBook Pro 16, Lenovo Yoga 7 2-in-1 16IML9eller HP Envy 16-serien.
Fler Dell-recensioner:
Potentiella konkurrenter i jämförelse
Gradering | Datum | Modell | Vikt | Höjd | Storlek | Upplösning | Pris |
|---|---|---|---|---|---|---|---|
| 83.4 % | 06/2024 | Dell Inspiron 16 Plus 7640 Ultra 7 155H, NVIDIA GeForce RTX 4060 Laptop GPU | 2.2 kg | 19.9 mm | 16.00" | 2560x1600 | |
| 87.1 % v7 (old) | 08/2023 | Dell Inspiron 16 Plus 7630 i7-13700H, NVIDIA GeForce RTX 4060 Laptop GPU | 2.2 kg | 19.95 mm | 16.00" | 2560x1600 | |
| 87.4 % v7 (old) | 08/2022 | Dell Inspiron 16 Plus 7620 i7-12700H, GeForce RTX 3050 Ti Laptop GPU | 2.1 kg | 18.99 mm | 16.00" | 3072x1920 | |
| 90.4 % v7 (old) | 03/2024 | Samsung Galaxy Book4 Ultra Ultra 7 155H, NVIDIA GeForce RTX 4050 Laptop GPU | 1.8 kg | 17 mm | 16.00" | 2880x1800 | |
| 89.1 % v7 (old) | 02/2024 | Lenovo Legion 5 16IRX G9 i7-14650HX, NVIDIA GeForce RTX 4060 Laptop GPU | 2.4 kg | 25.2 mm | 16.00" | 2560x1600 | |
| 87.6 % v7 (old) | 11/2023 | Asus VivoBook Pro 16 K6602VU i9-13900H, NVIDIA GeForce RTX 4050 Laptop GPU | 1.9 kg | 19 mm | 16.00" | 3200x2000 |
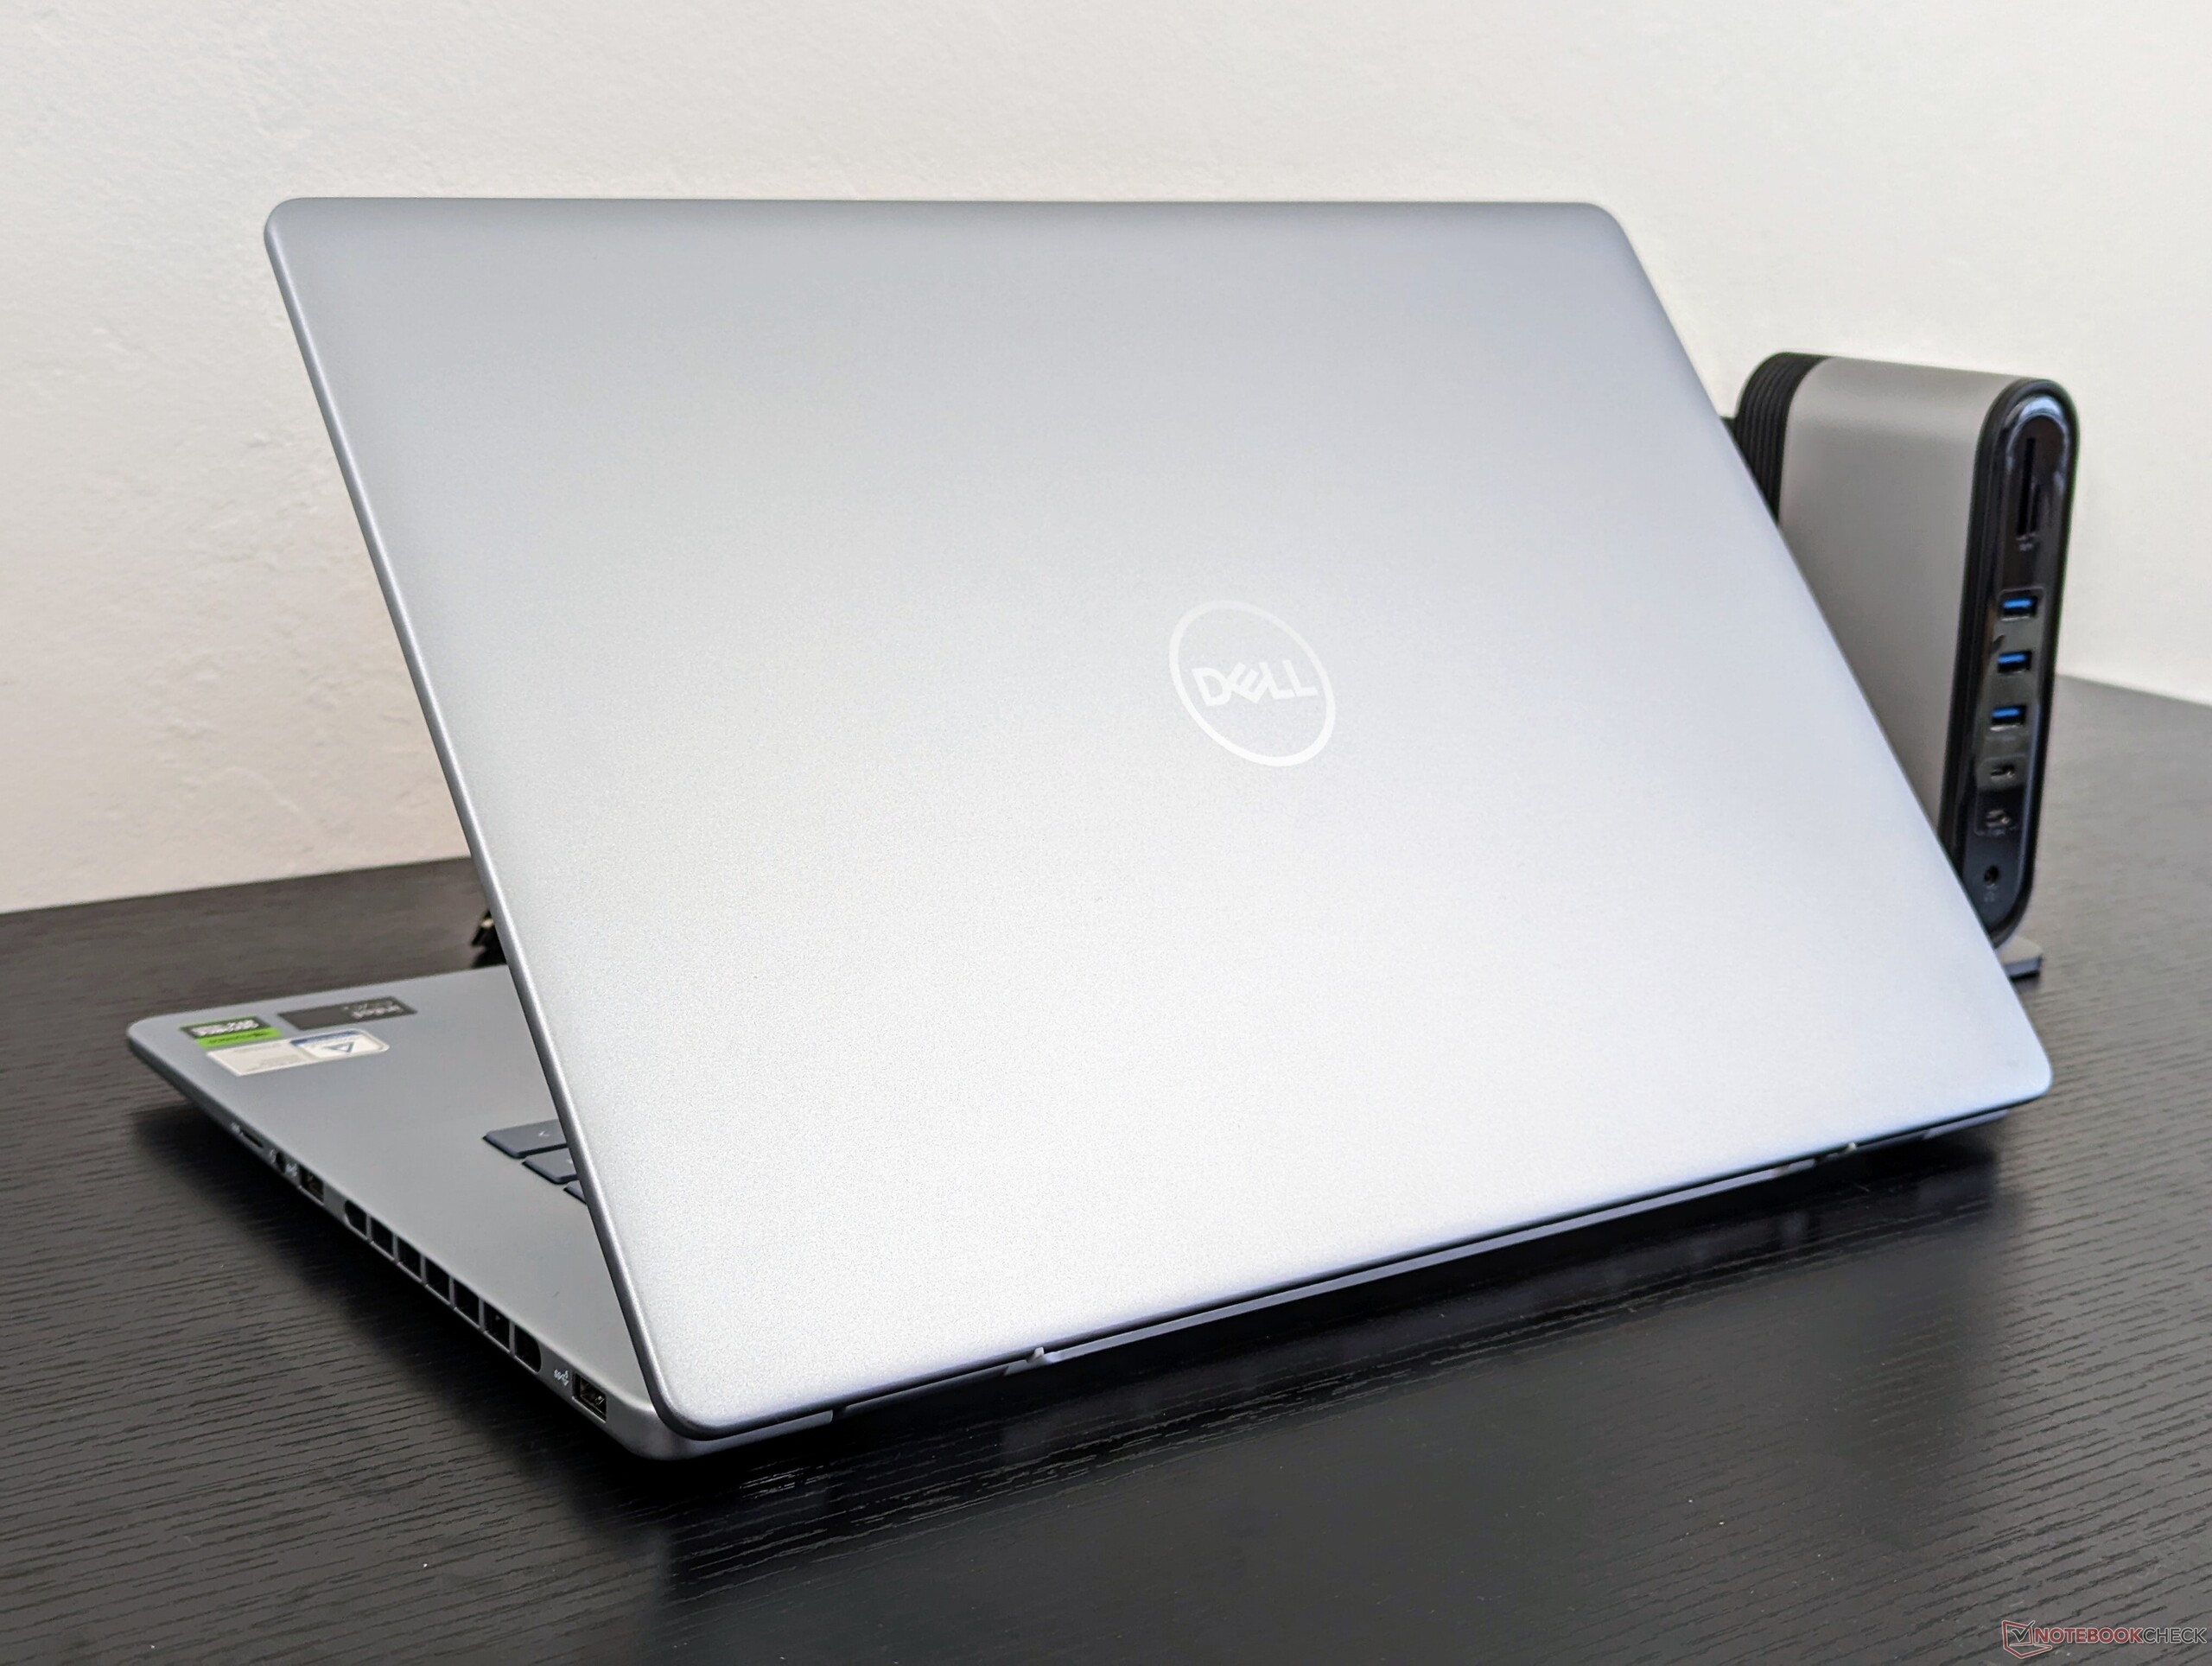
Hölje - fler och större ventilationsöppningar
Modellen har fått en ny dedikerad Co-Pilot-tangent som ersätter Ctrl-tangenten på höger sida av tangentbordet. Handledsstödet är plattare, basen är rundare och ventilationsgallren på baksidan och sidorna har fått en ny design och är större än tidigare. Chassimaterial och portar är i övrigt oförändrade för liknande första intryck och dimensioner.
SD-kortläsare
| SD Card Reader | |
| average JPG Copy Test (av. of 3 runs) | |
| Asus VivoBook Pro 16 K6602VU (Angelbird AV Pro V60) | |
| Samsung Galaxy Book4 Ultra (Angelbird AV Pro V60) | |
| Lenovo Legion 5 16IRX G9 | |
| Dell Inspiron 16 Plus 7620 (Toshiba Exceria Pro SDXC 64 GB UHS-II) | |
| Dell Inspiron 16 Plus 7640 (Angelbird AV Pro V60) | |
| Dell Inspiron 16 Plus 7630 (AV Pro SD microSD 128 GB V60) | |
| maximum AS SSD Seq Read Test (1GB) | |
| Asus VivoBook Pro 16 K6602VU (Angelbird AV Pro V60) | |
| Samsung Galaxy Book4 Ultra (Angelbird AV Pro V60) | |
| Lenovo Legion 5 16IRX G9 | |
| Dell Inspiron 16 Plus 7640 (Angelbird AV Pro V60) | |
| Dell Inspiron 16 Plus 7620 (Toshiba Exceria Pro SDXC 64 GB UHS-II) | |
| Dell Inspiron 16 Plus 7630 (AV Pro SD microSD 128 GB V60) | |
Kommunikation
| Networking | |
| iperf3 transmit AXE11000 | |
| Samsung Galaxy Book4 Ultra | |
| Asus VivoBook Pro 16 K6602VU | |
| Lenovo Legion 5 16IRX G9 | |
| Dell Inspiron 16 Plus 7630 | |
| Dell Inspiron 16 Plus 7640 | |
| iperf3 receive AXE11000 | |
| Samsung Galaxy Book4 Ultra | |
| Asus VivoBook Pro 16 K6602VU | |
| Lenovo Legion 5 16IRX G9 | |
| Dell Inspiron 16 Plus 7630 | |
| Dell Inspiron 16 Plus 7640 | |
| iperf3 transmit AXE11000 6GHz | |
| Dell Inspiron 16 Plus 7630 | |
| Asus VivoBook Pro 16 K6602VU | |
| Dell Inspiron 16 Plus 7620 | |
| Dell Inspiron 16 Plus 7640 | |
| iperf3 receive AXE11000 6GHz | |
| Asus VivoBook Pro 16 K6602VU | |
| Dell Inspiron 16 Plus 7630 | |
| Dell Inspiron 16 Plus 7620 | |
| Dell Inspiron 16 Plus 7640 | |
Webbkamera
Beskriv webbkamerans kvalitet, lägg till bilder från testdiagram.


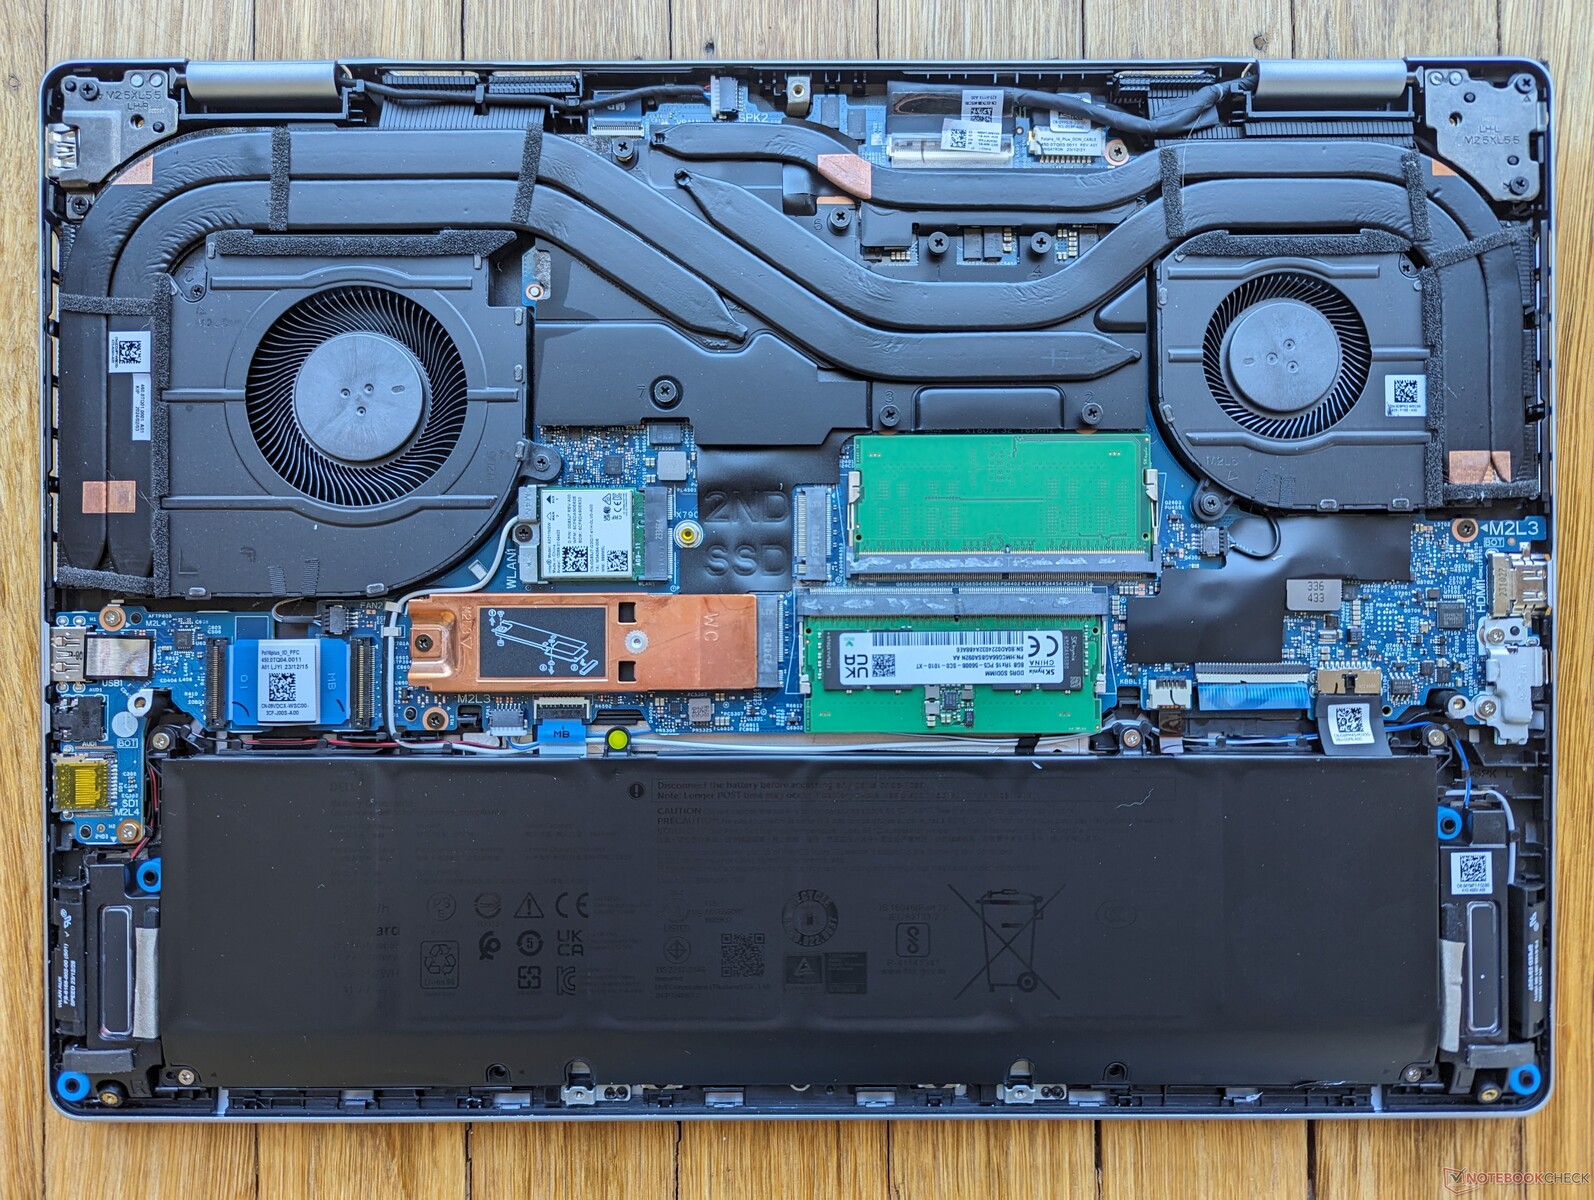
Underhåll
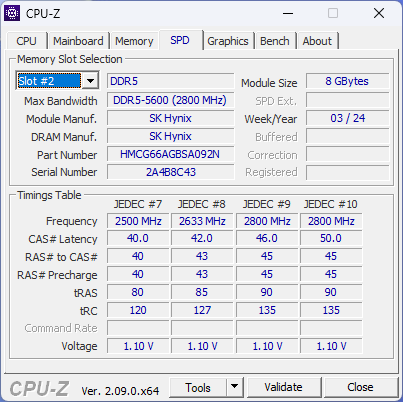
När man öppnar upp systemet ser man en stor skillnad mellan det och dess omedelbara föregångare: stöd för en sekundär M.2 2230 SSD. Annars verkar allt annat vara mestadels identiskt med Inspiron 16 Plus 7630, vilket visas av bilderna nedan.

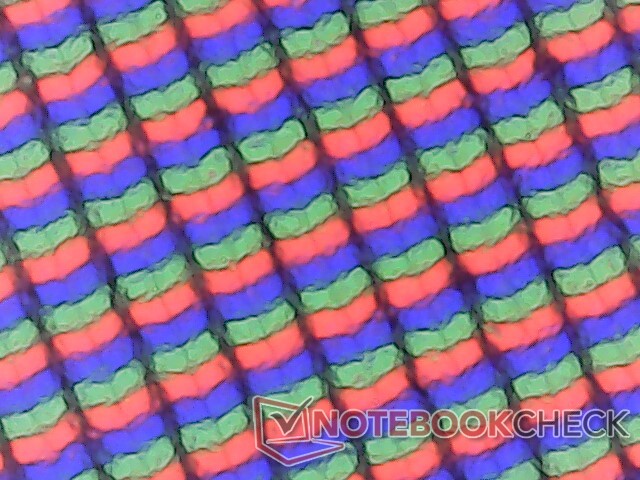
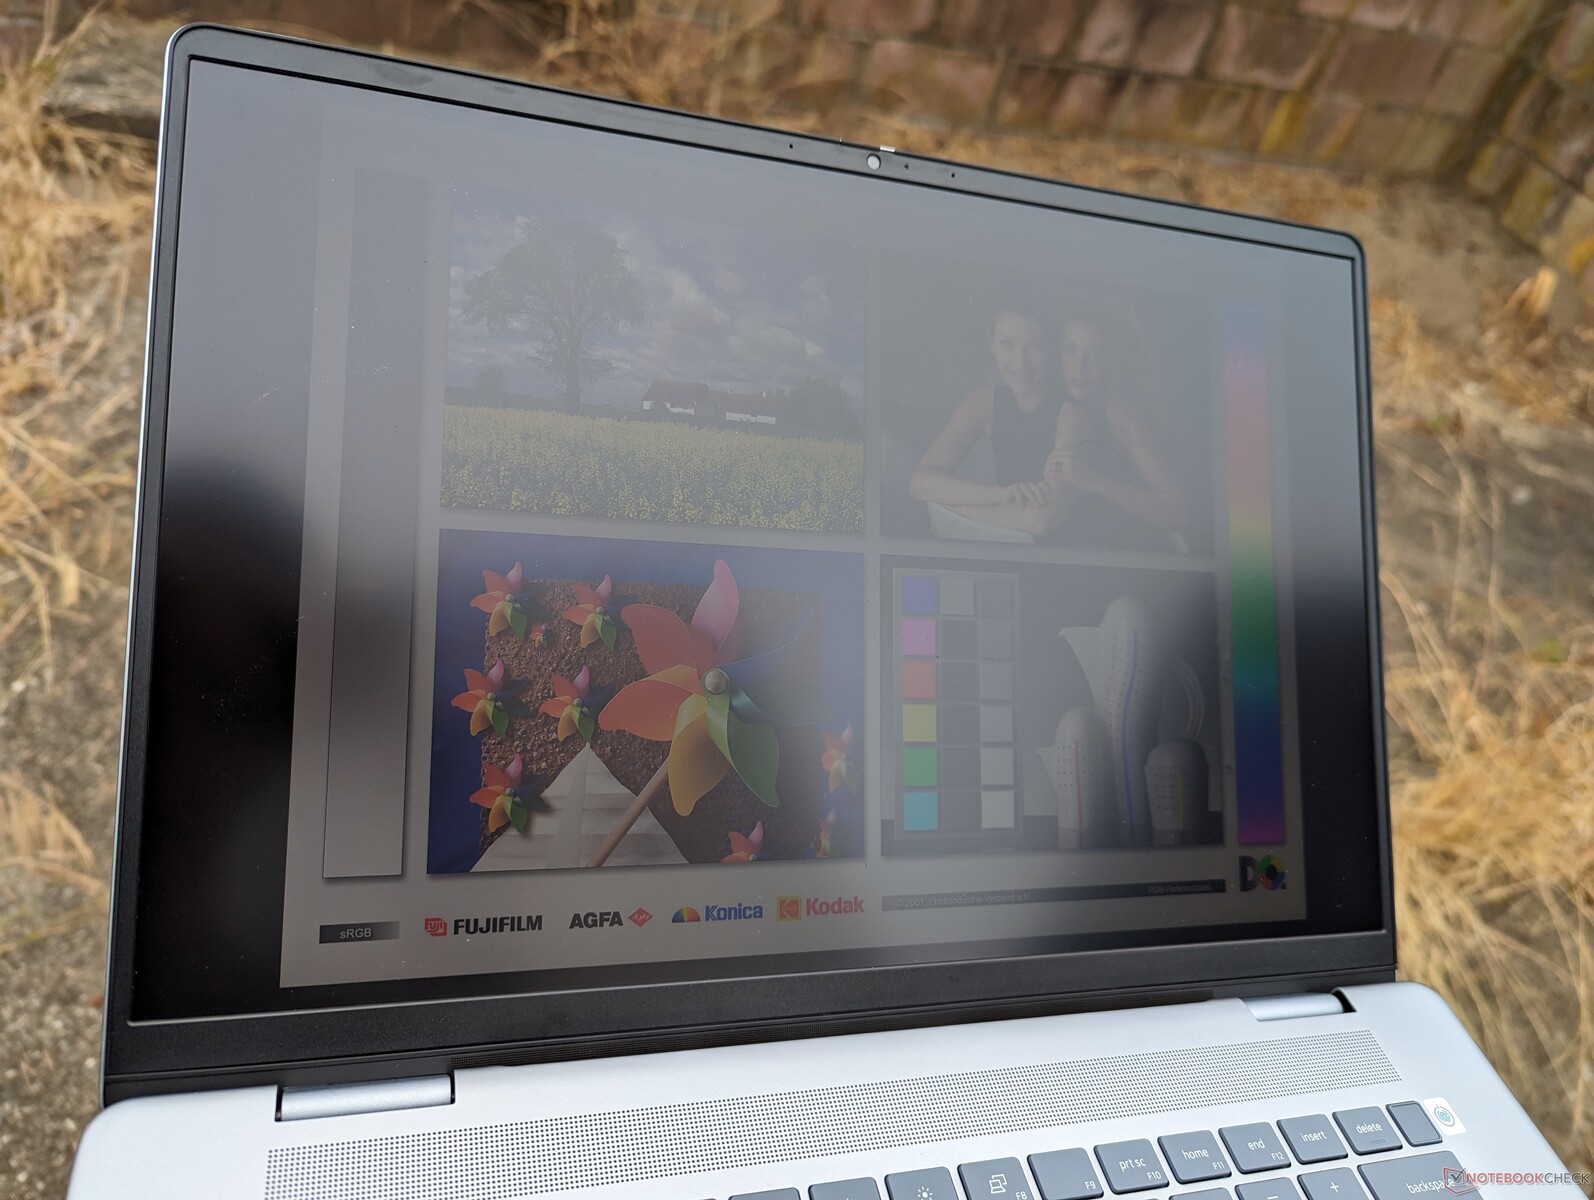
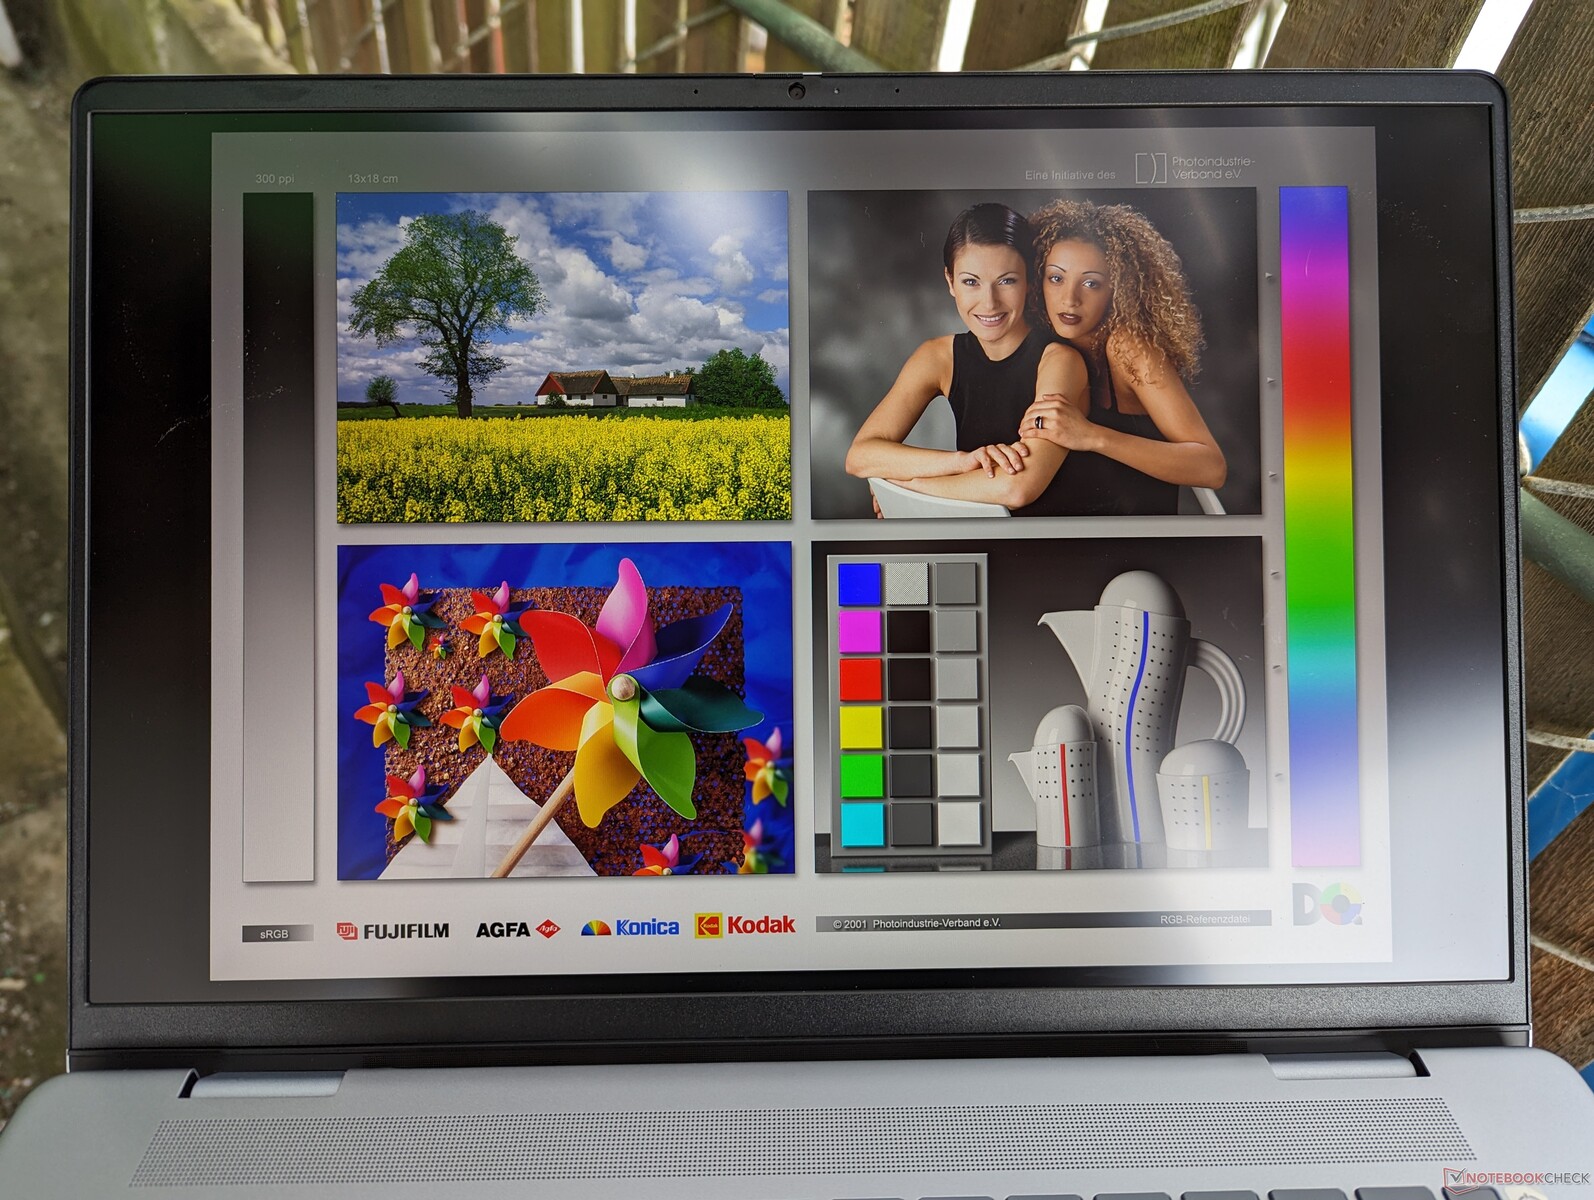
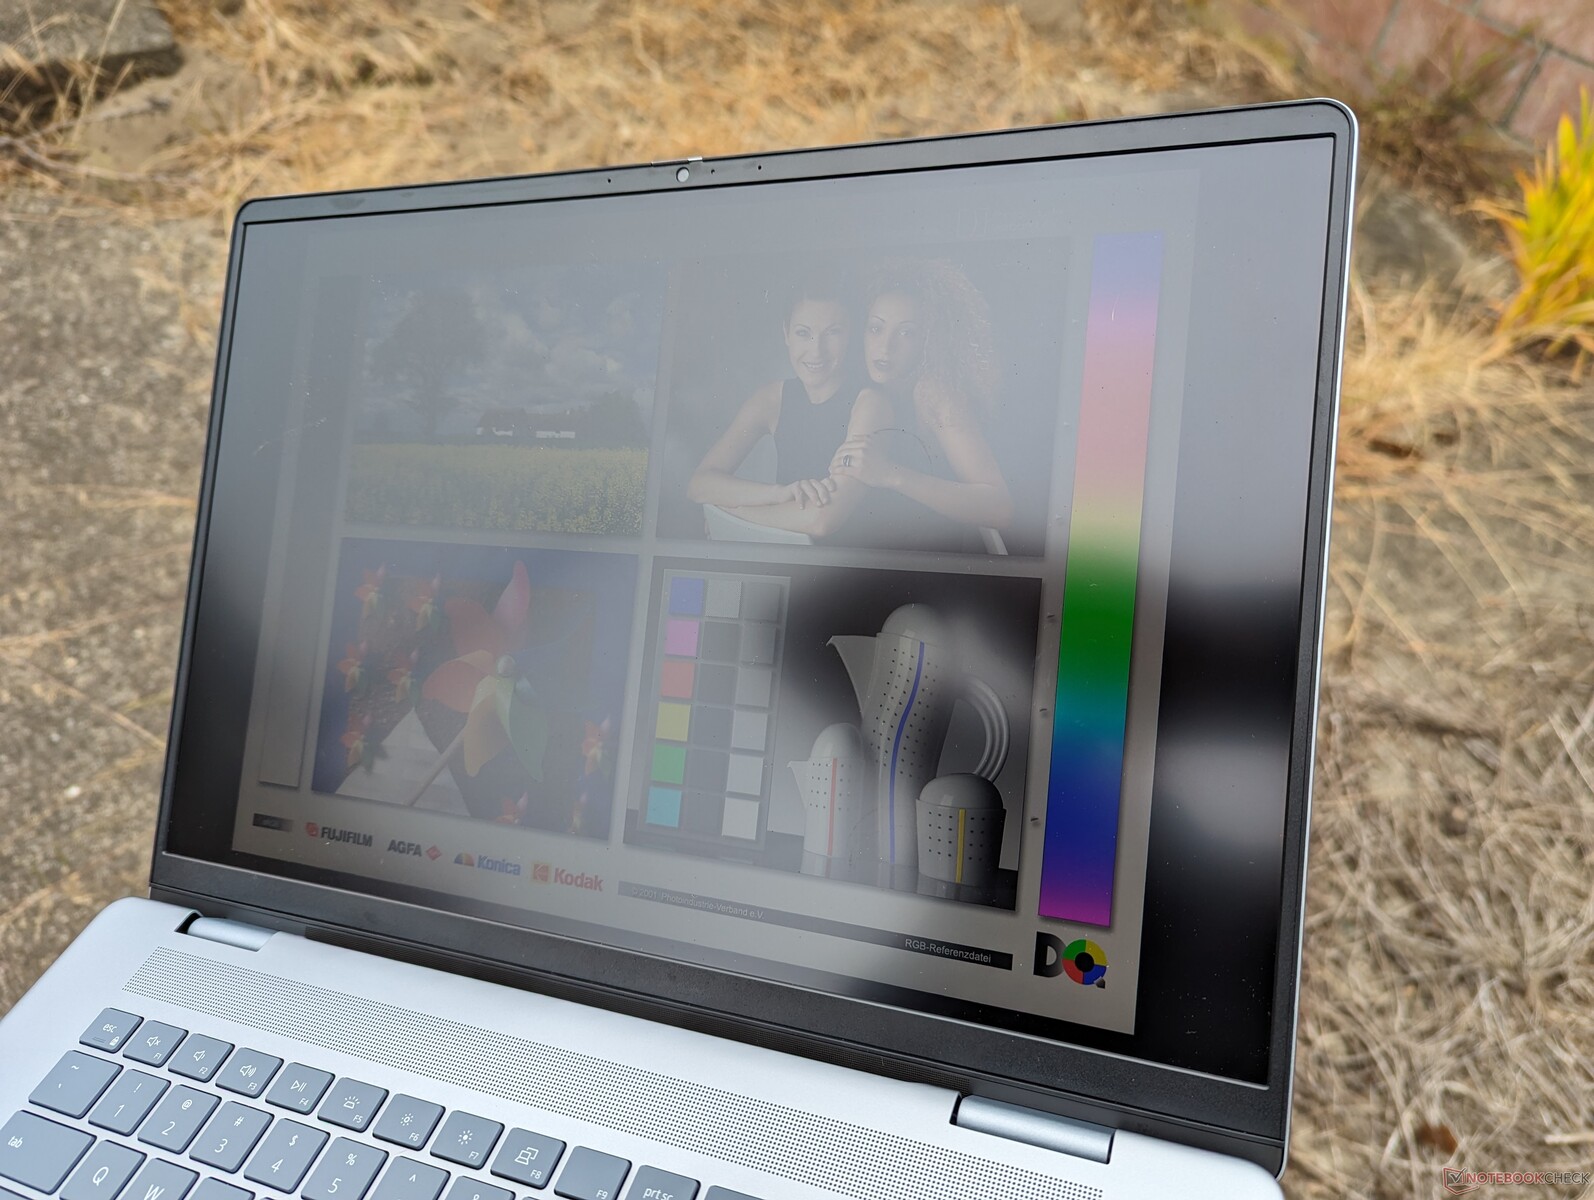
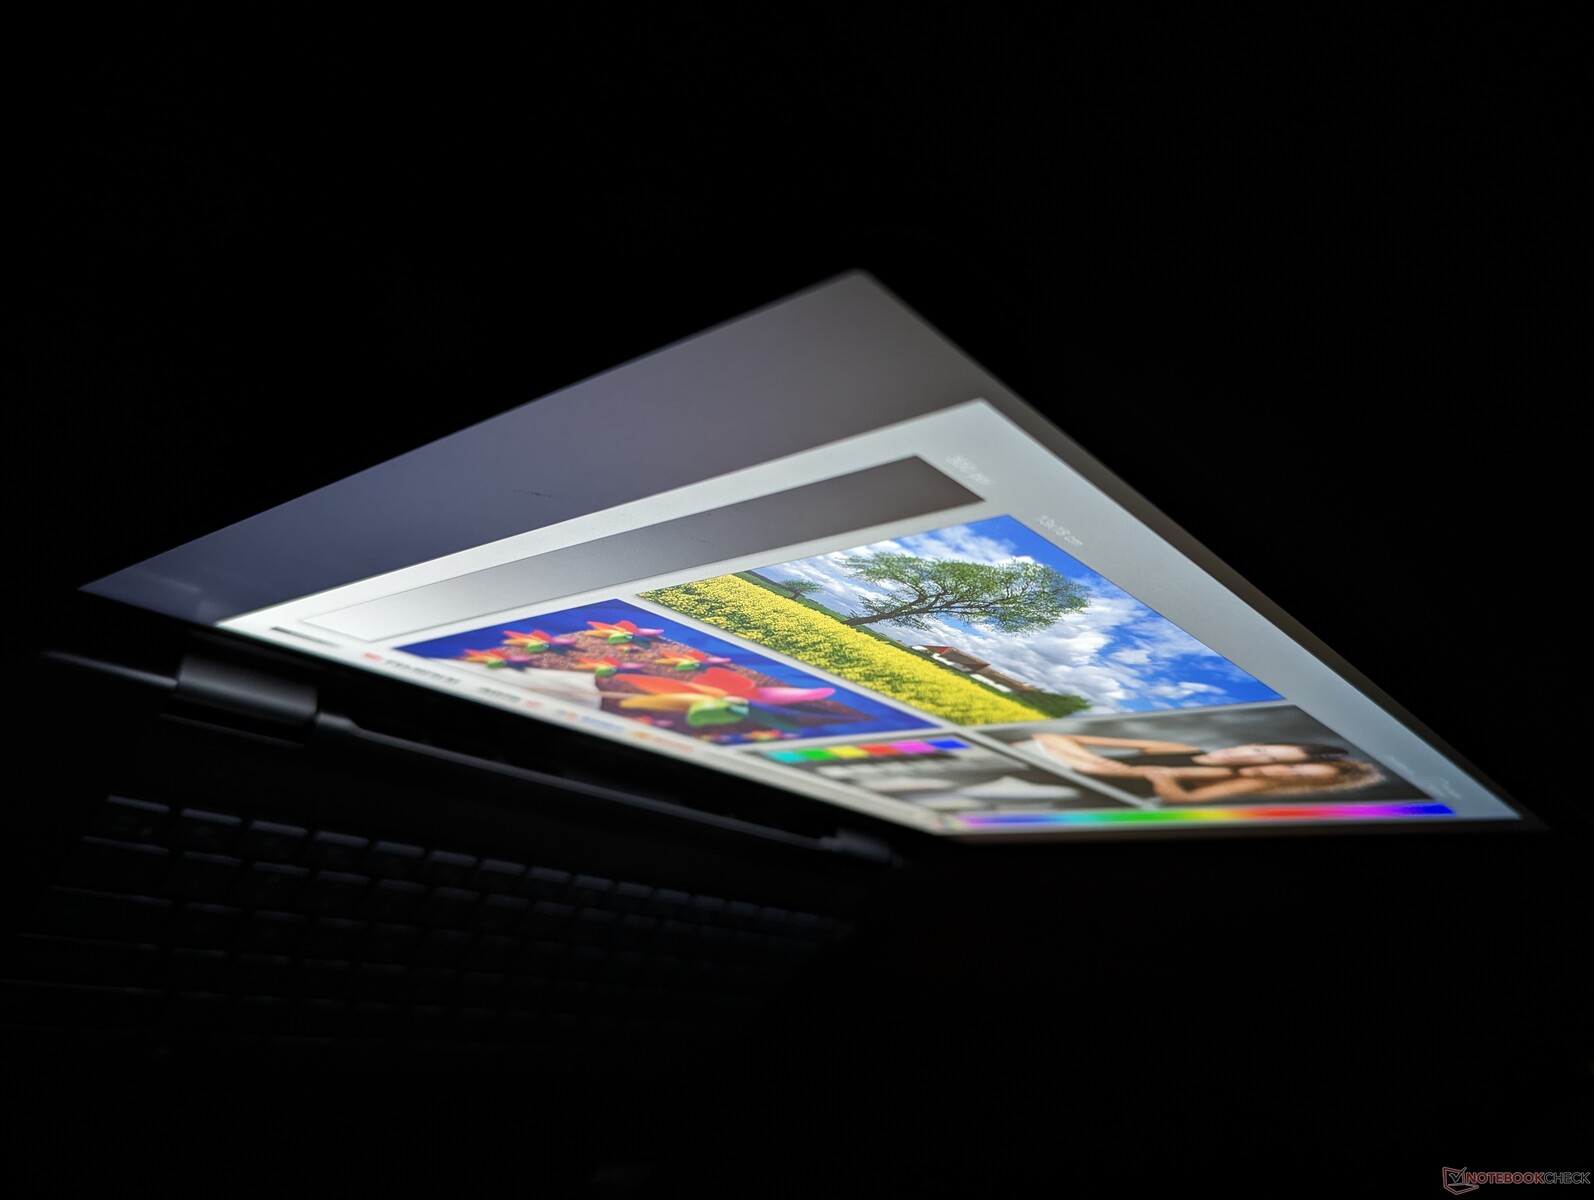
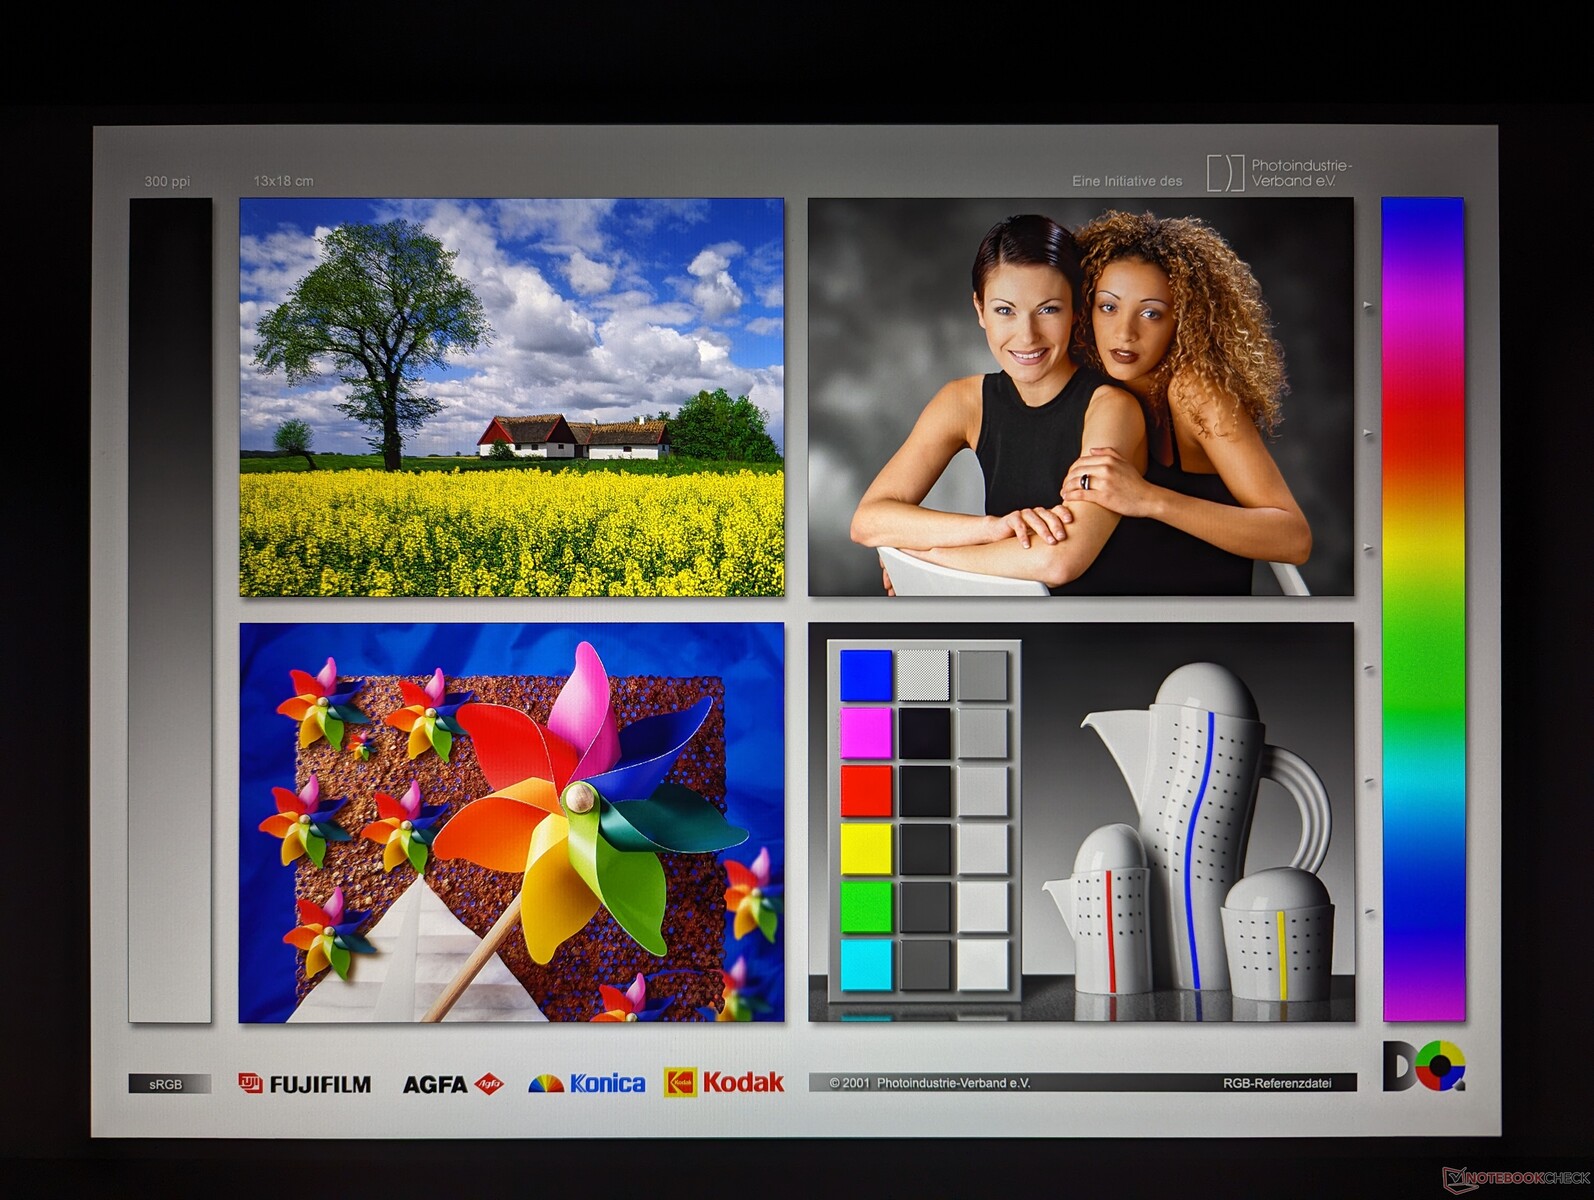
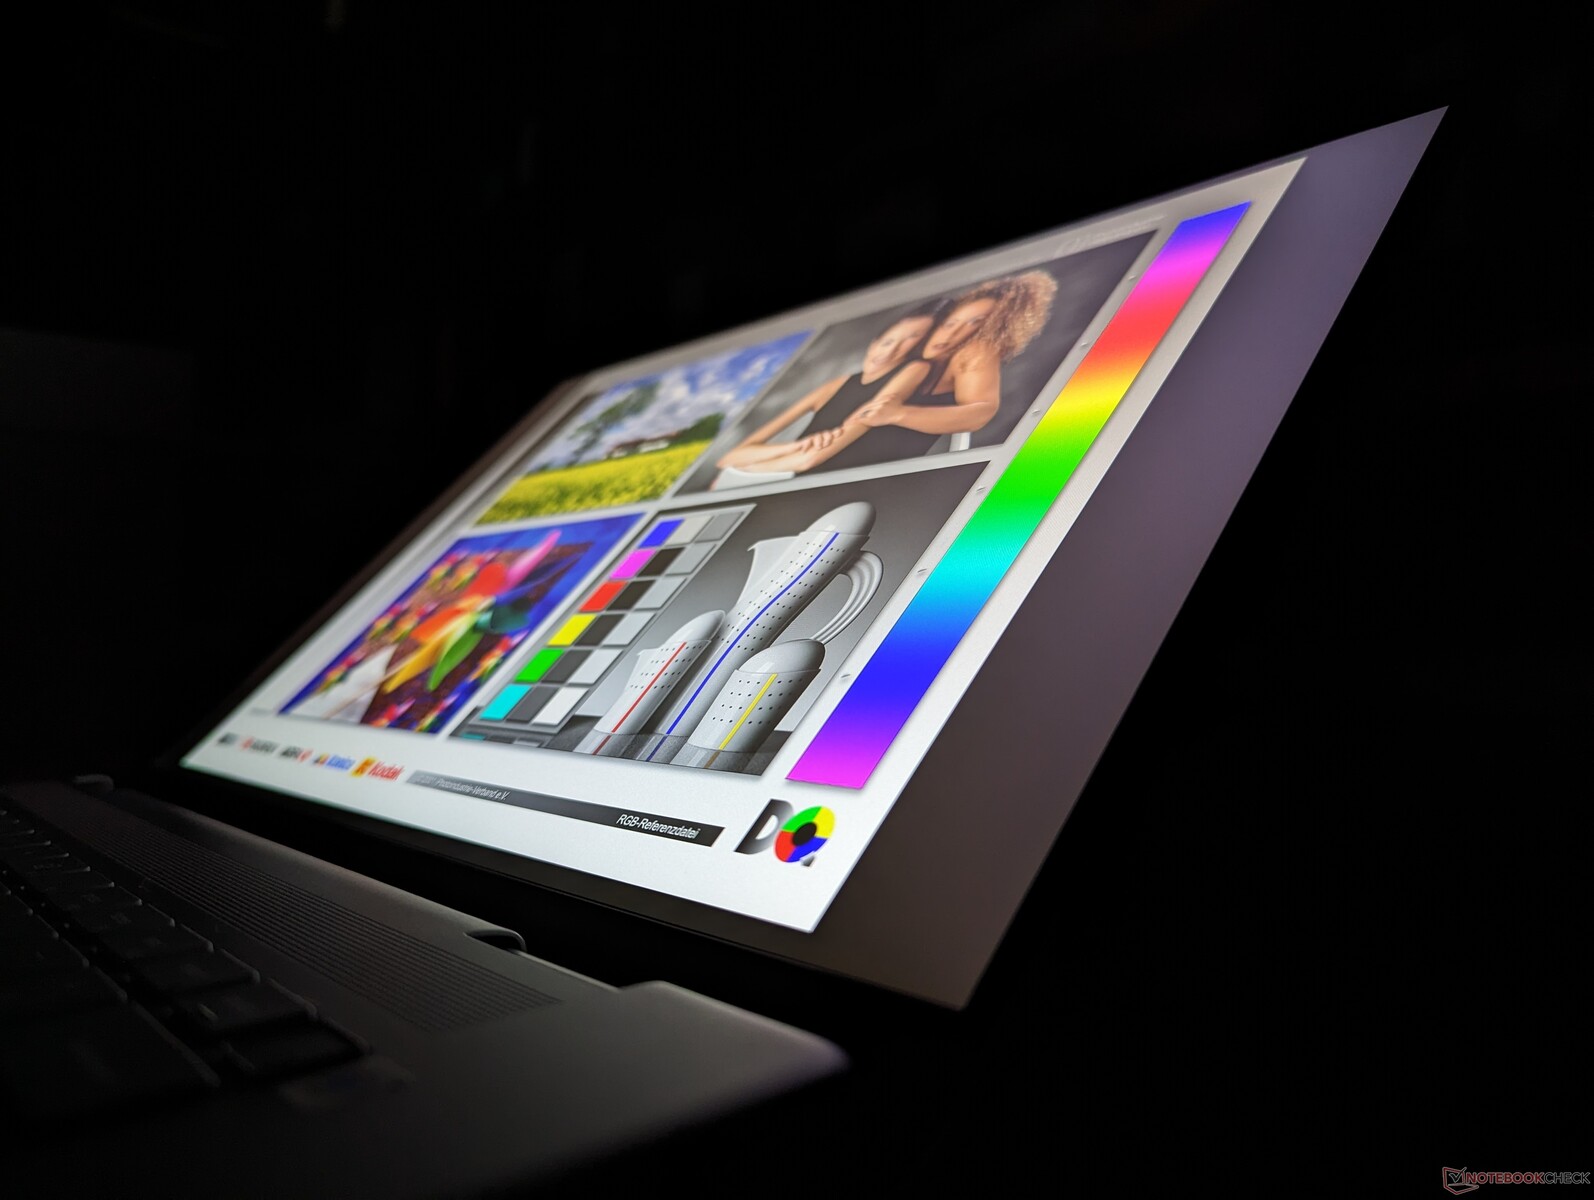
Skärm - FHD+ och QHD+-alternativ
Två displayalternativ finns tillgängliga enligt följande:
- 1920 x 1200, 60 Hz, pekskärm, glansig
- 2560 x 1600, 120 Hz, beröringsfri skärm, matt
Vår enhet levereras med den fetmarkerade panelen ovan. Observera att den officiella Dell-produktsidan felaktigt listar 60 Hz för 1600p-panelen i skrivande stund; vi kan bekräfta att den här panelen stöder inbyggda uppdateringsfrekvenser på 120 Hz och 48 Hz utan G-Sync-stöd, ungefär som på förra årets Inspiron 16 Plus 7630.
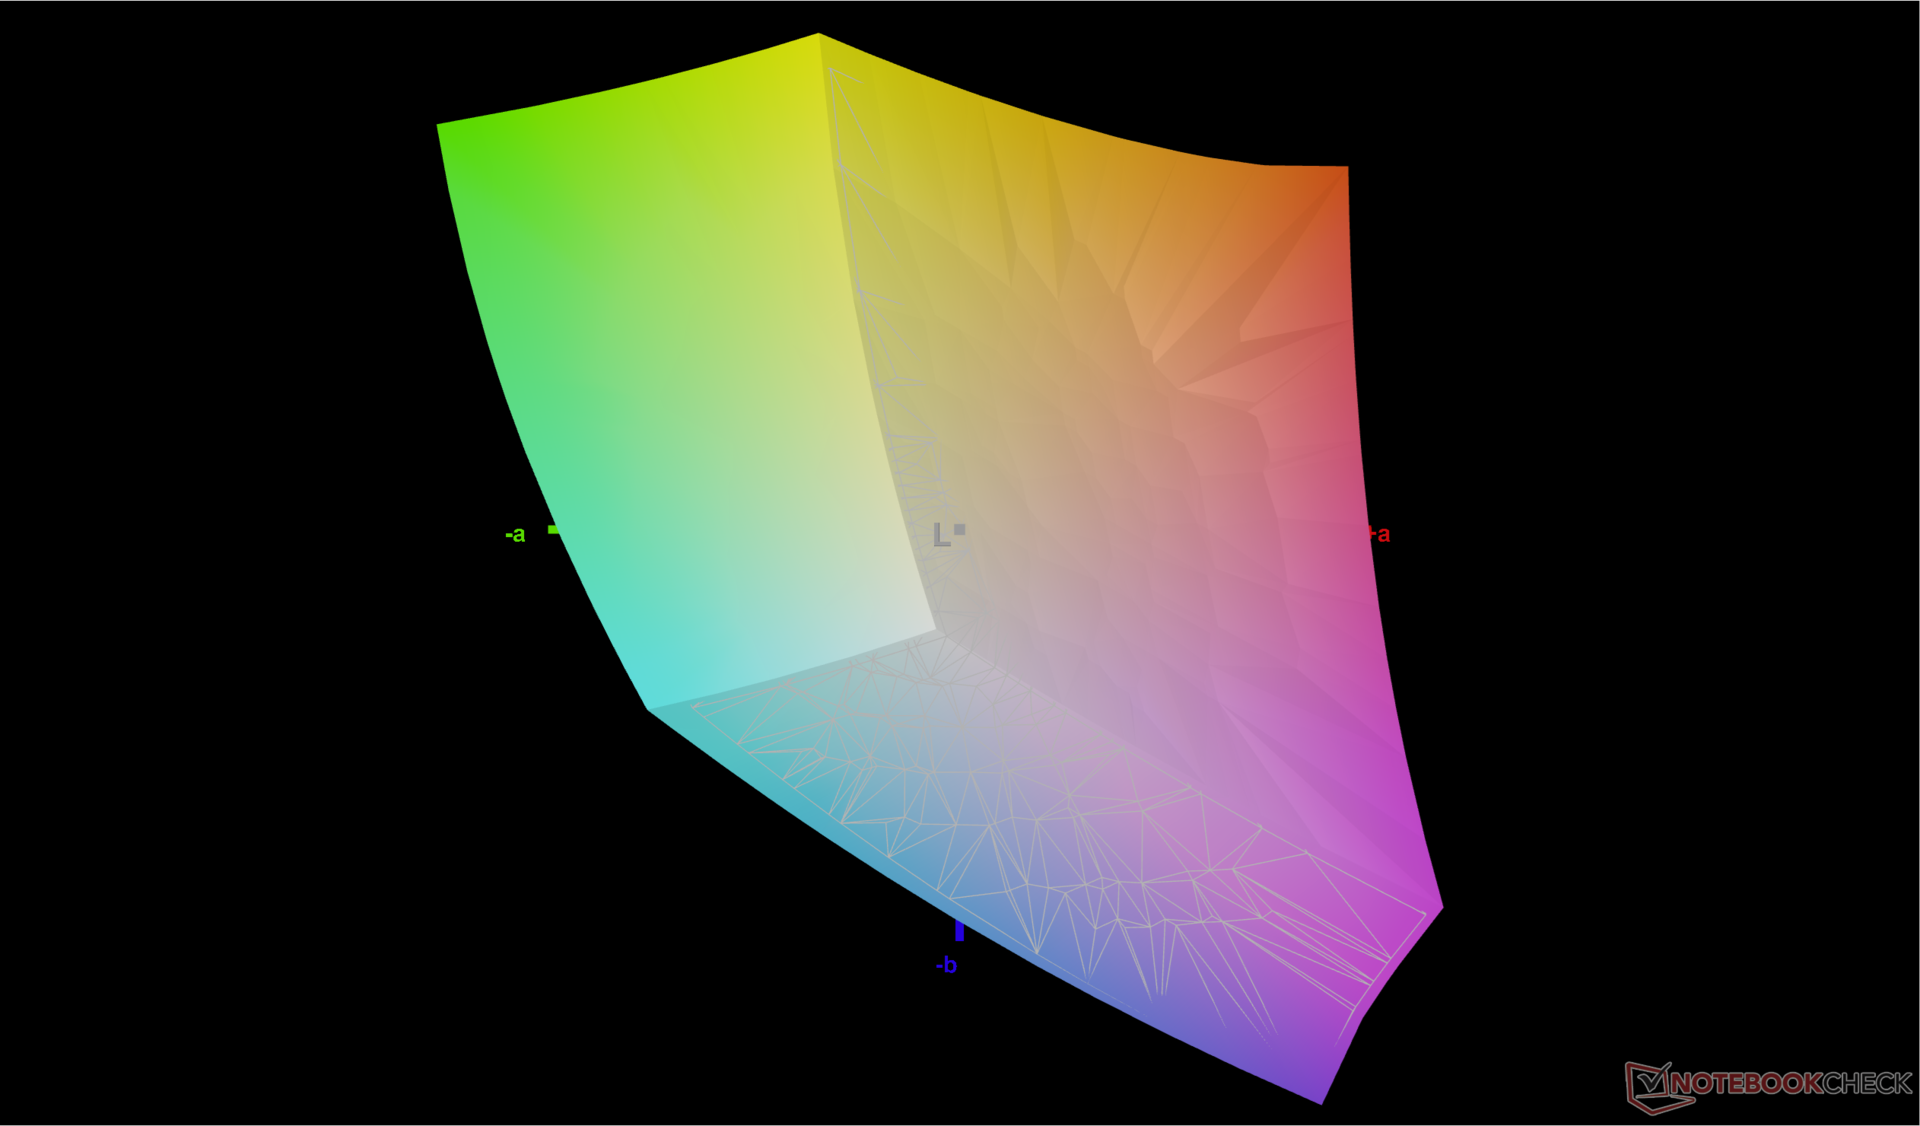
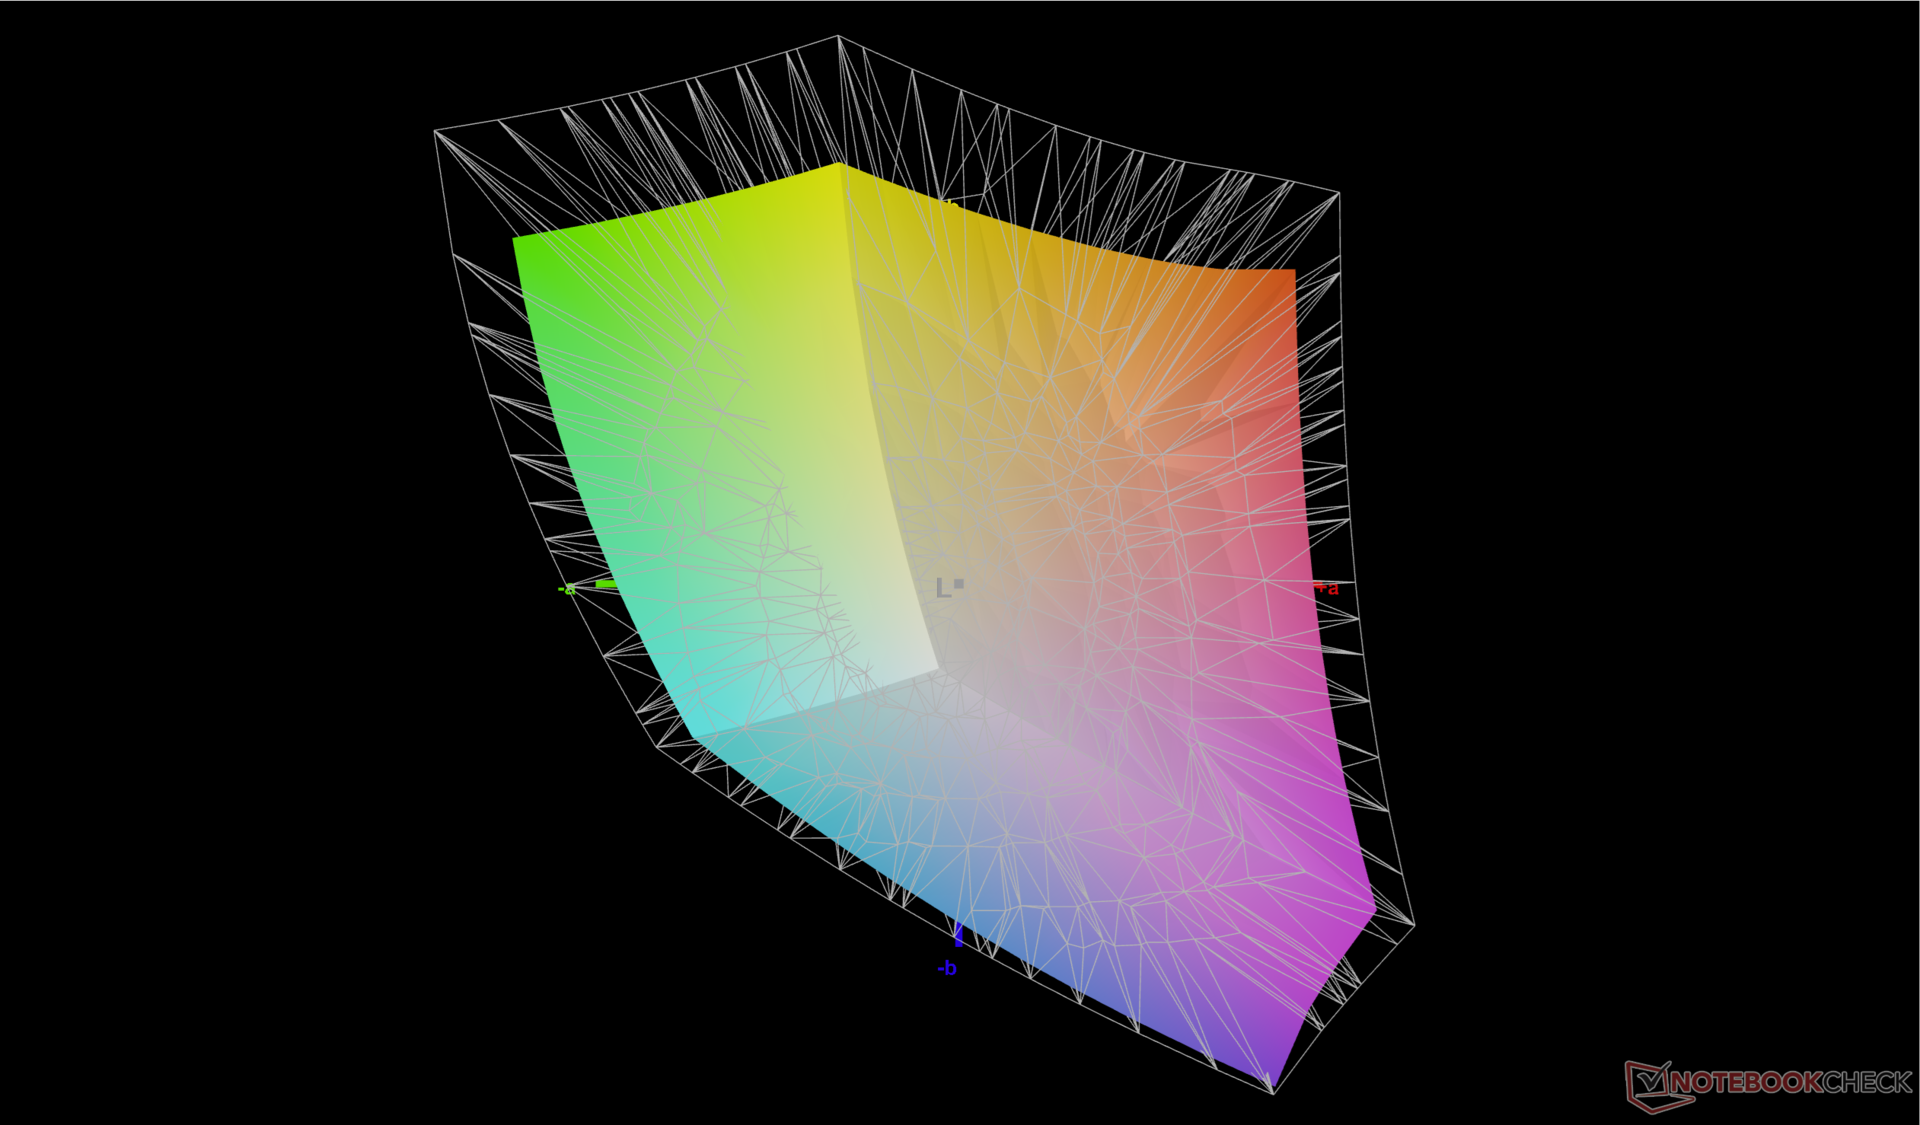
Intressant nog har Dell bytt panelleverantör från LG Philips till AU Optronics för årets Inspiron 16 Plus 7640. Den nyare panelen ger snabbare svarstider för att minimera spökbilder samtidigt som den erbjuder liknande sRGB-färger, ljusstyrka och kontrastförhållanden som tidigare.
| |||||||||||||||||||||||||
Distribution av ljusstyrkan: 89 %
Mitt på batteriet: 314.7 cd/m²
Kontrast: 1124:1 (Svärta: 0.28 cd/m²)
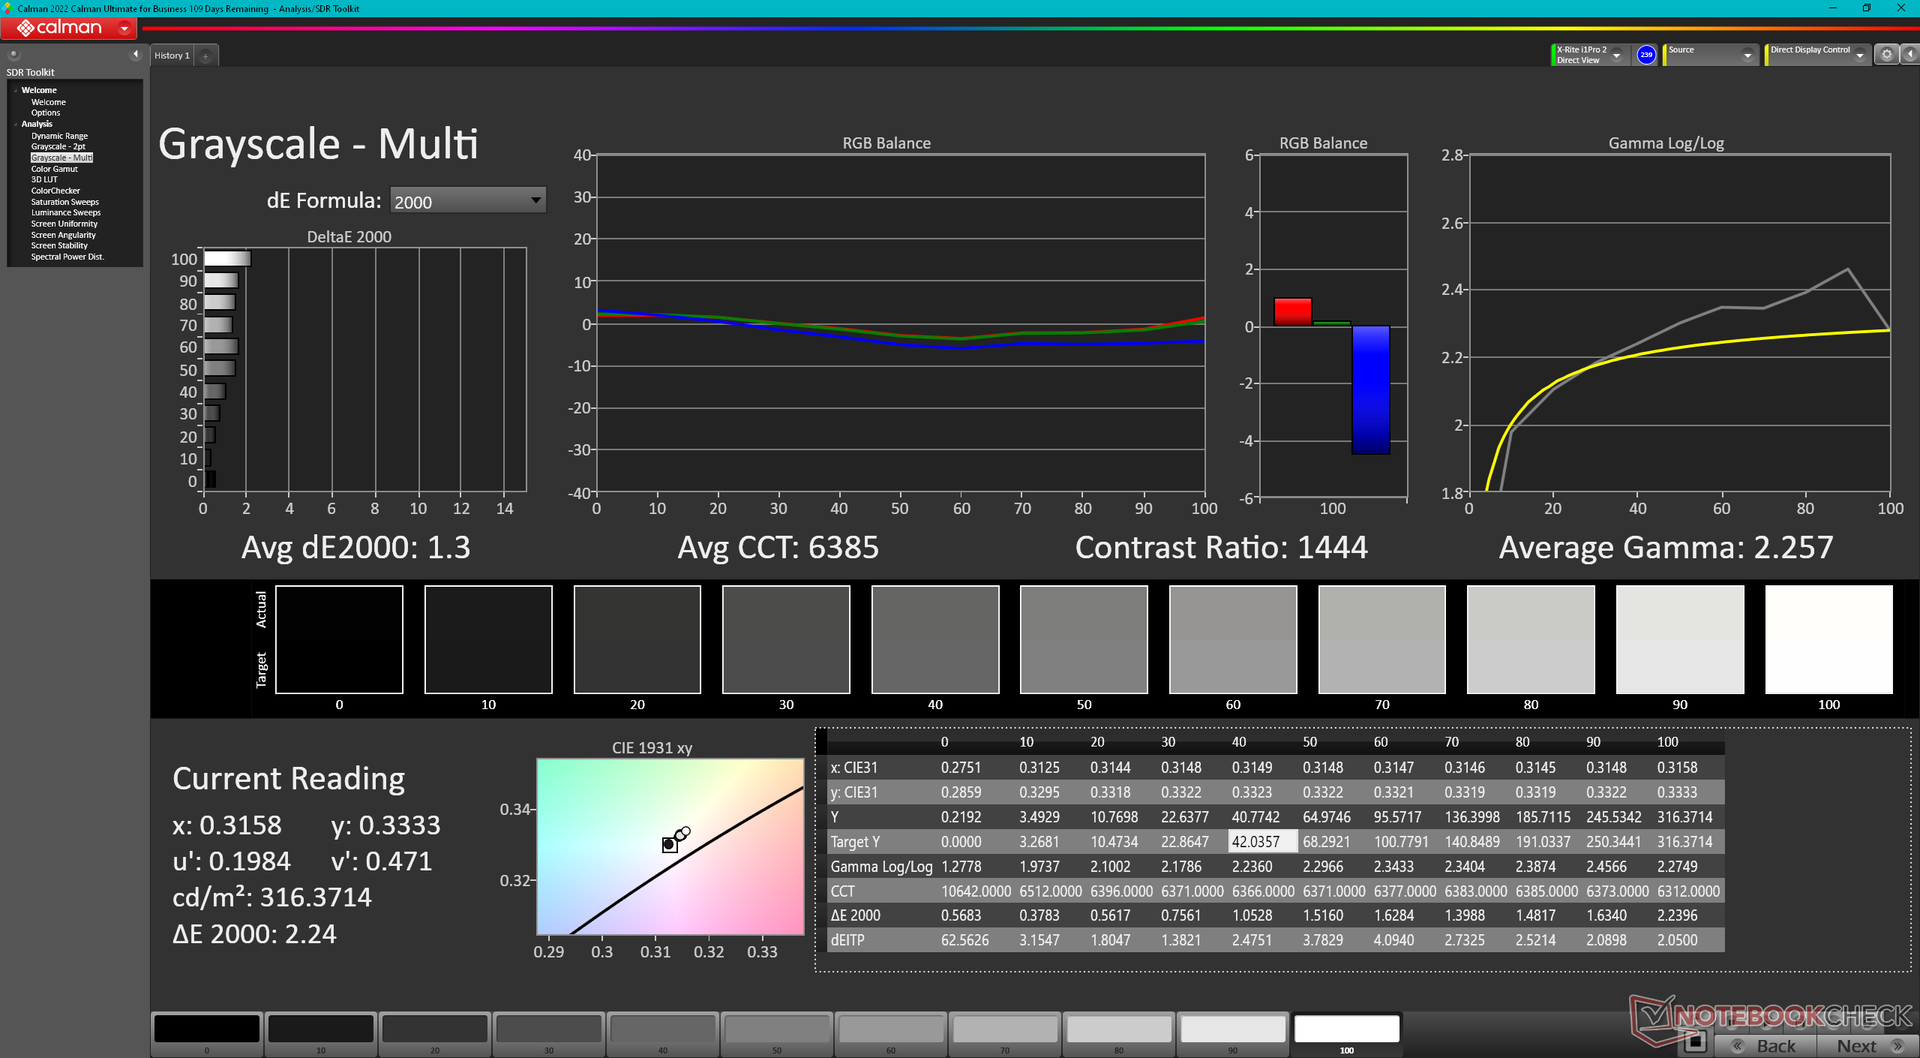
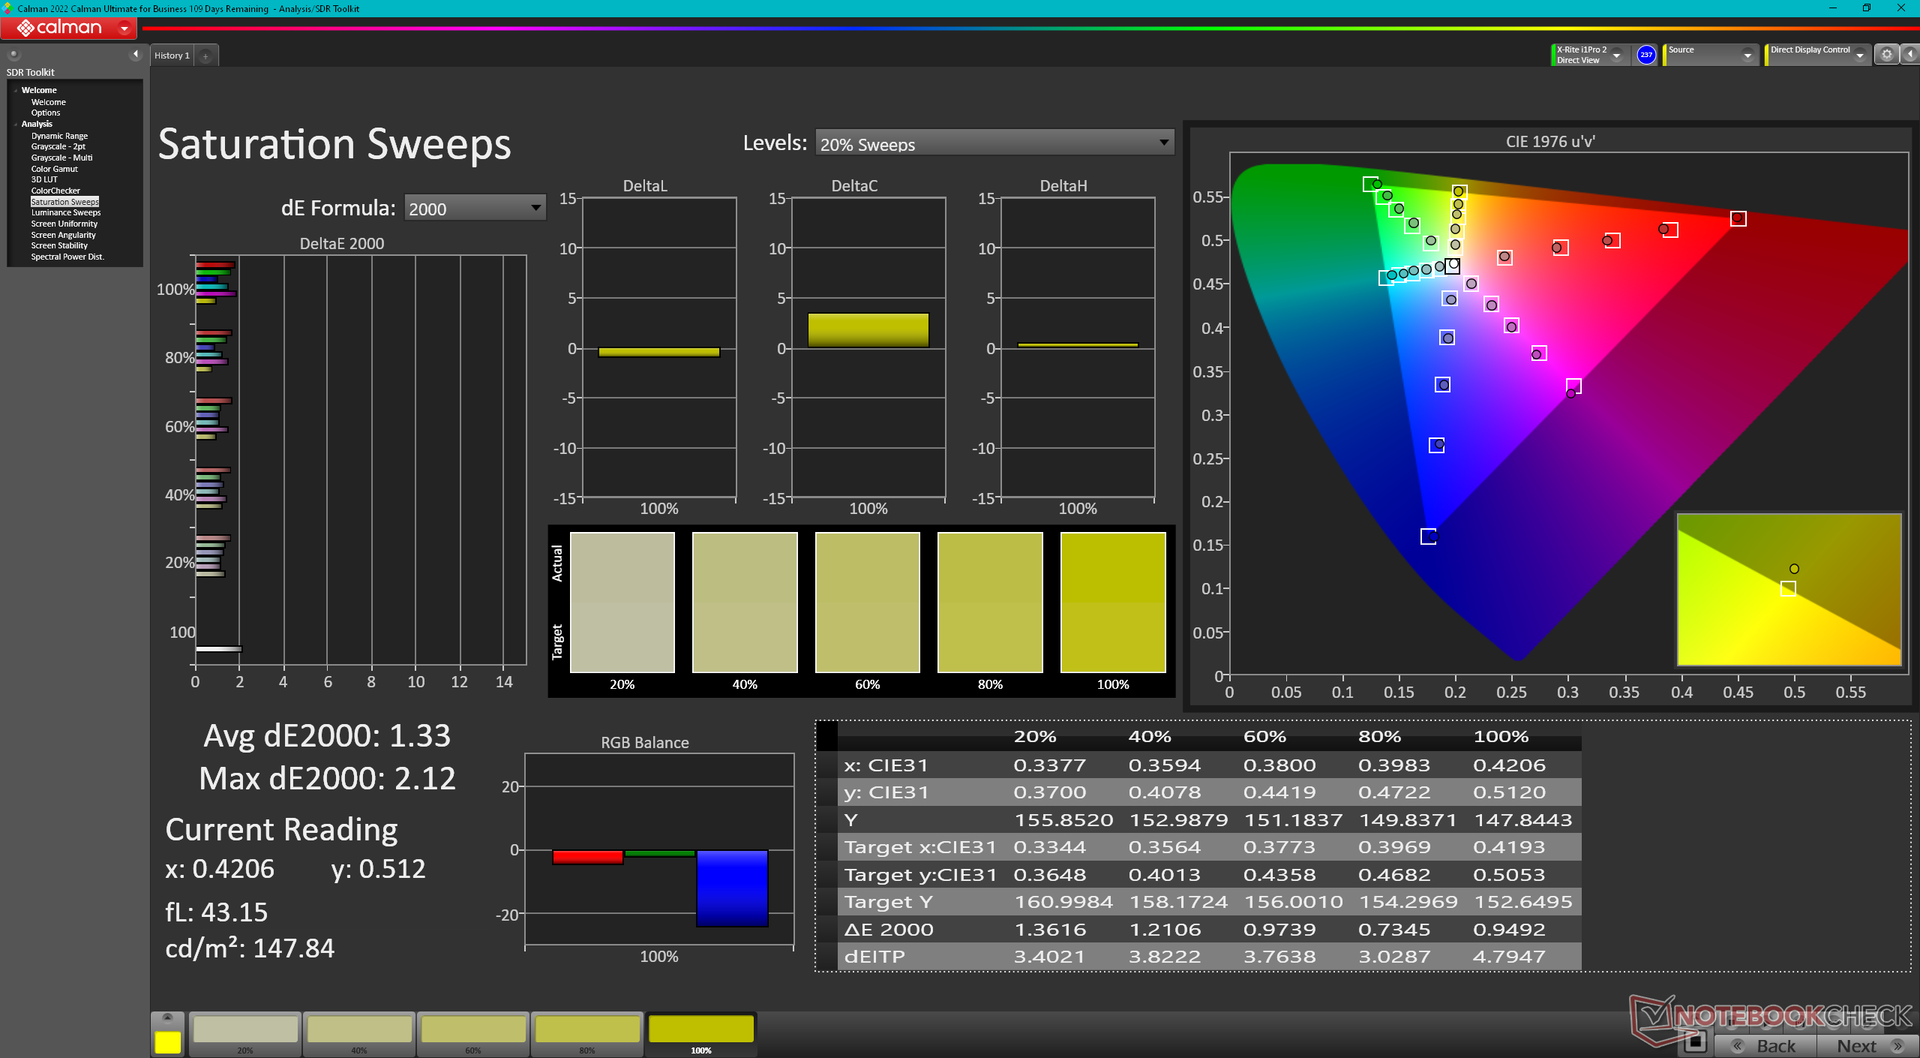
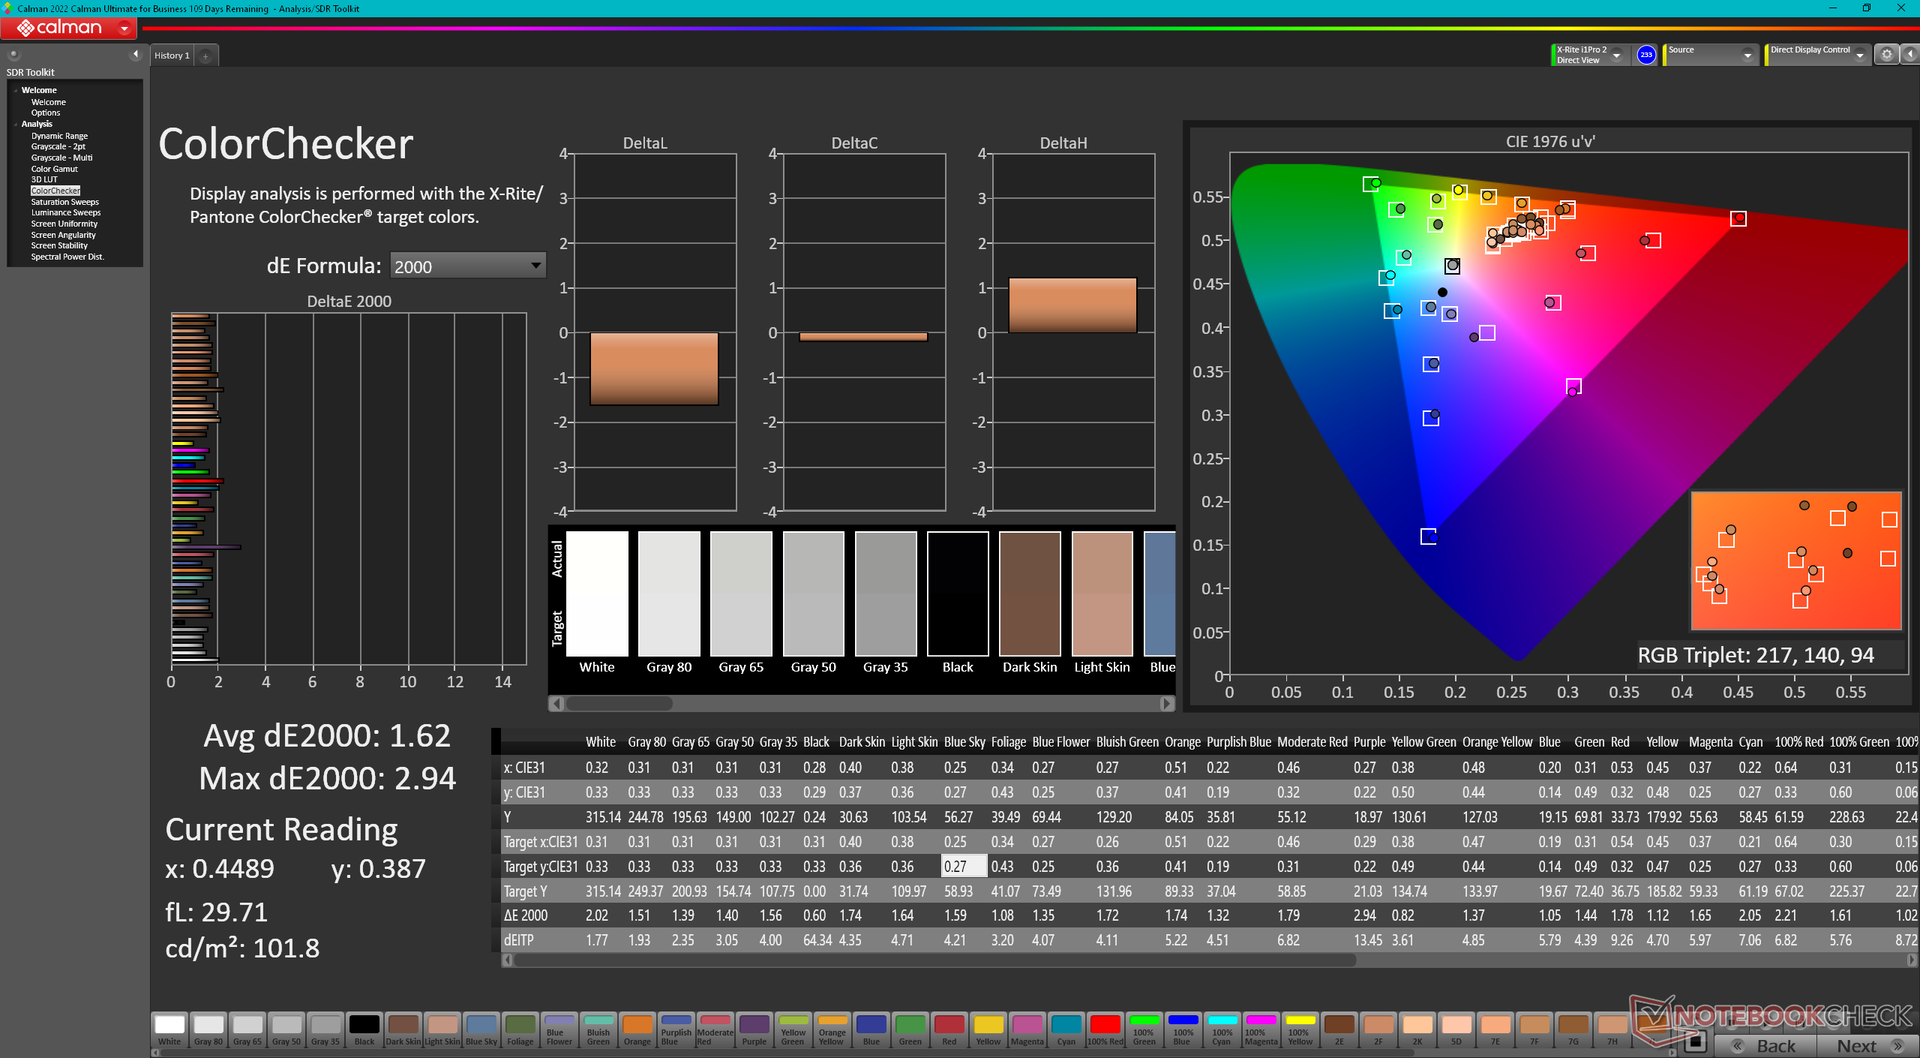
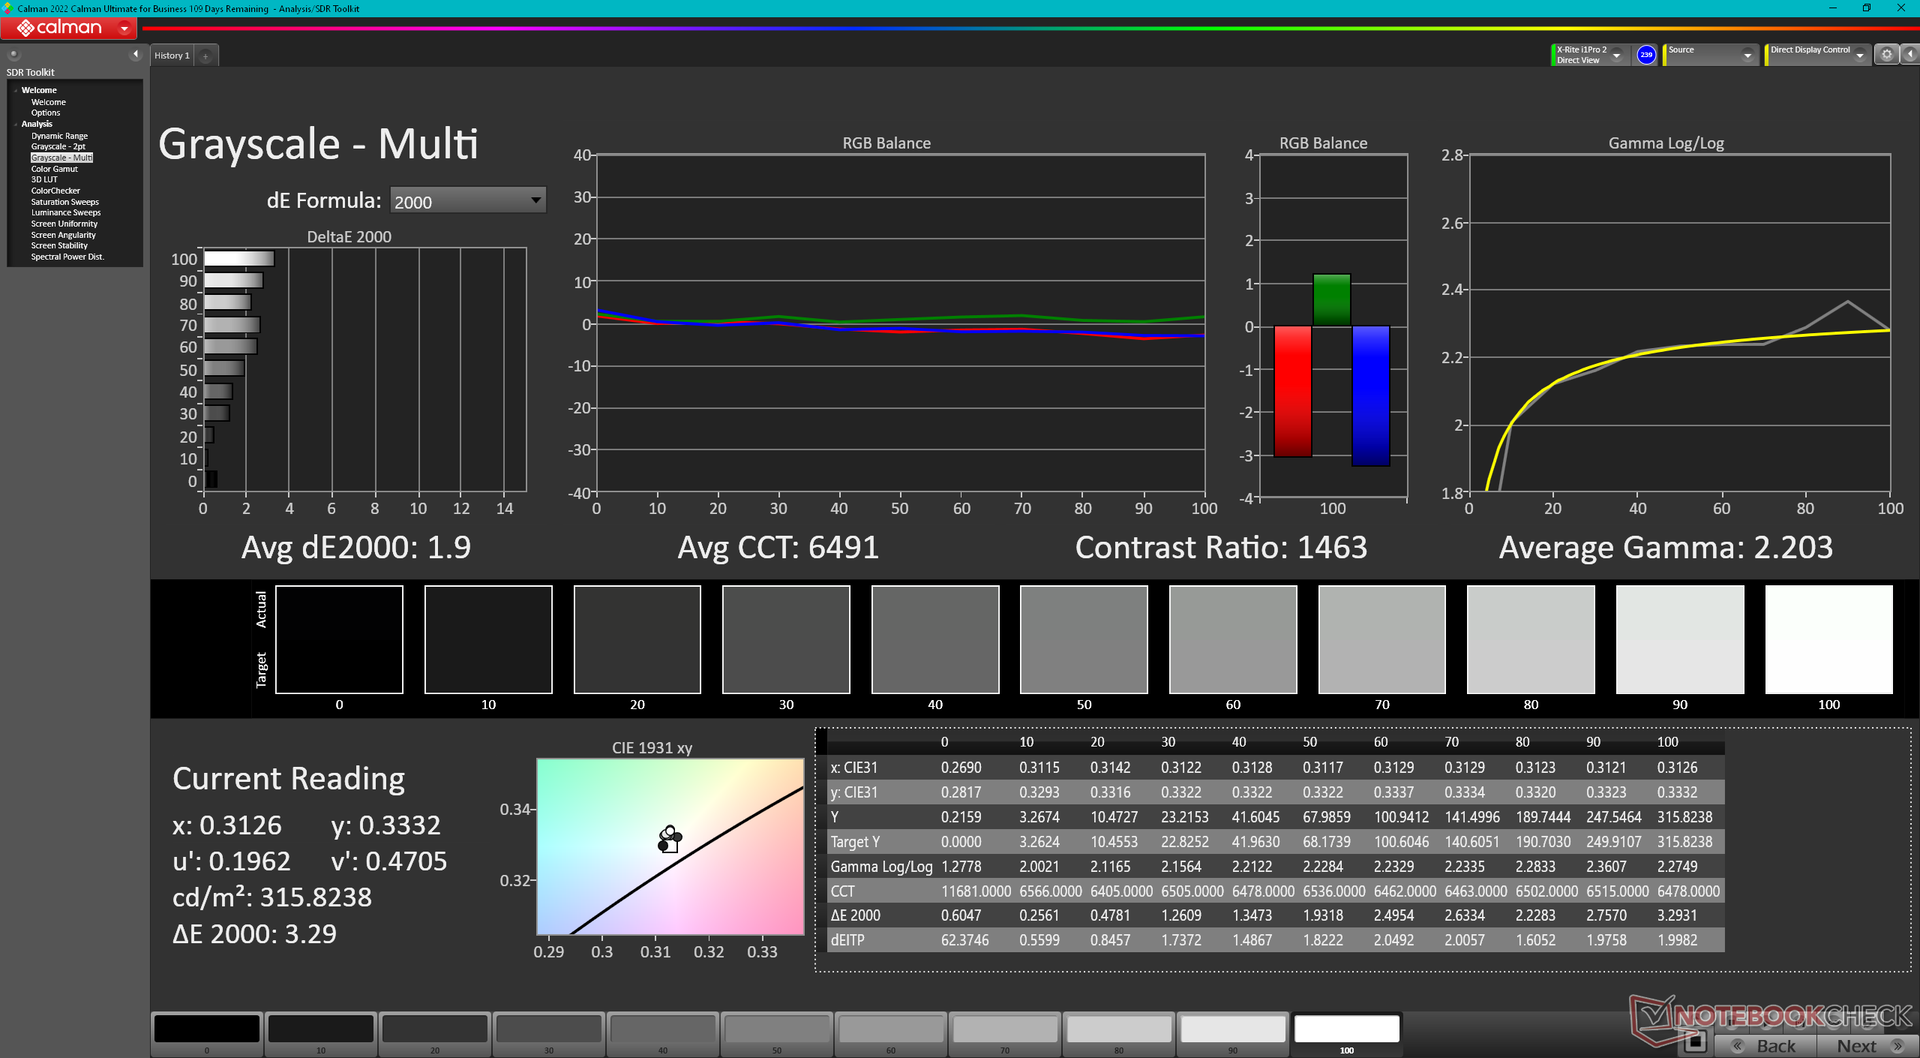
ΔE Color 1.62 | 0.5-29.43 Ø4.87, calibrated: 1.08
ΔE Greyscale 1.3 | 0.5-98 Ø5.1
76.7% AdobeRGB 1998 (Argyll 2.2.0 3D)
99.8% sRGB (Argyll 2.2.0 3D)
76% Display P3 (Argyll 2.2.0 3D)
Gamma: 2.26
| Dell Inspiron 16 Plus 7640 AU Optronics B160QAN, IPS, 2560x1600, 16" | Dell Inspiron 16 Plus 7630 LG Philips 160WQ2, IPS, 2560x1600, 16" | Dell Inspiron 16 Plus 7620 BOE NE16N41, IPS, 3072x1920, 16" | Samsung Galaxy Book4 Ultra ATNA60CL07-0, OLED, 2880x1800, 16" | Lenovo Legion 5 16IRX G9 NE160QDM-NZ3, IPS, 2560x1600, 16" | Asus VivoBook Pro 16 K6602VU Samsung ATNA60BX01-1, OLED, 3200x2000, 16" | |
|---|---|---|---|---|---|---|
| Display | -5% | -4% | 15% | -3% | 19% | |
| Display P3 Coverage | 76 | 70.1 -8% | 70.8 -7% | 98.6 30% | 72.4 -5% | 98.7 30% |
| sRGB Coverage | 99.8 | 99.6 0% | 99.5 0% | 99.9 0% | 100 0% | 99.7 0% |
| AdobeRGB 1998 Coverage | 76.7 | 72.3 -6% | 73.2 -5% | 88.5 15% | 74.1 -3% | 96.5 26% |
| Response Times | -38% | -54% | 97% | 51% | 61% | |
| Response Time Grey 50% / Grey 80% * | 25.6 ? | 35 ? -37% | 38 ? -48% | 0.54 ? 98% | 12.5 ? 51% | 0.68 ? 97% |
| Response Time Black / White * | 17.6 ? | 24.2 ? -38% | 28 ? -59% | 0.69 ? 96% | 8.7 ? 51% | 13.2 ? 25% |
| PWM Frequency | 240 ? | 240 ? | ||||
| Screen | -57% | -2% | 5% | 25% | -68% | |
| Brightness middle | 314.7 | 299.4 -5% | 288.9 -8% | 390 24% | 526 67% | 353 12% |
| Brightness | 291 | 290 0% | 276 -5% | 393 35% | 500 72% | 354 22% |
| Brightness Distribution | 89 | 92 3% | 92 3% | 98 10% | 87 -2% | 98 10% |
| Black Level * | 0.28 | 0.21 25% | 0.26 7% | 0.33 -18% | ||
| Contrast | 1124 | 1426 27% | 1111 -1% | 1594 42% | ||
| Colorchecker dE 2000 * | 1.62 | 4.25 -162% | 1.88 -16% | 1.4 14% | 1.2 26% | 4.23 -161% |
| Colorchecker dE 2000 max. * | 2.94 | 6.71 -128% | 4.37 -49% | 2.7 8% | 2.1 29% | 7.13 -143% |
| Colorchecker dE 2000 calibrated * | 1.08 | 0.52 52% | 0.42 61% | 1 7% | 2.42 -124% | |
| Greyscale dE 2000 * | 1.3 | 5.5 -323% | 1.4 -8% | 2.1 -62% | 1.3 -0% | 2.5 -92% |
| Gamma | 2.26 97% | 2.35 94% | 2.3 96% | 2.27 97% | 2.23 99% | 2.4 92% |
| CCT | 6385 102% | 6368 102% | 6634 98% | 6431 101% | 6391 102% | 6642 98% |
| Totalt genomsnitt (program/inställningar) | -33% /
-43% | -20% /
-10% | 39% /
24% | 24% /
23% | 4% /
-25% |
* ... mindre är bättre
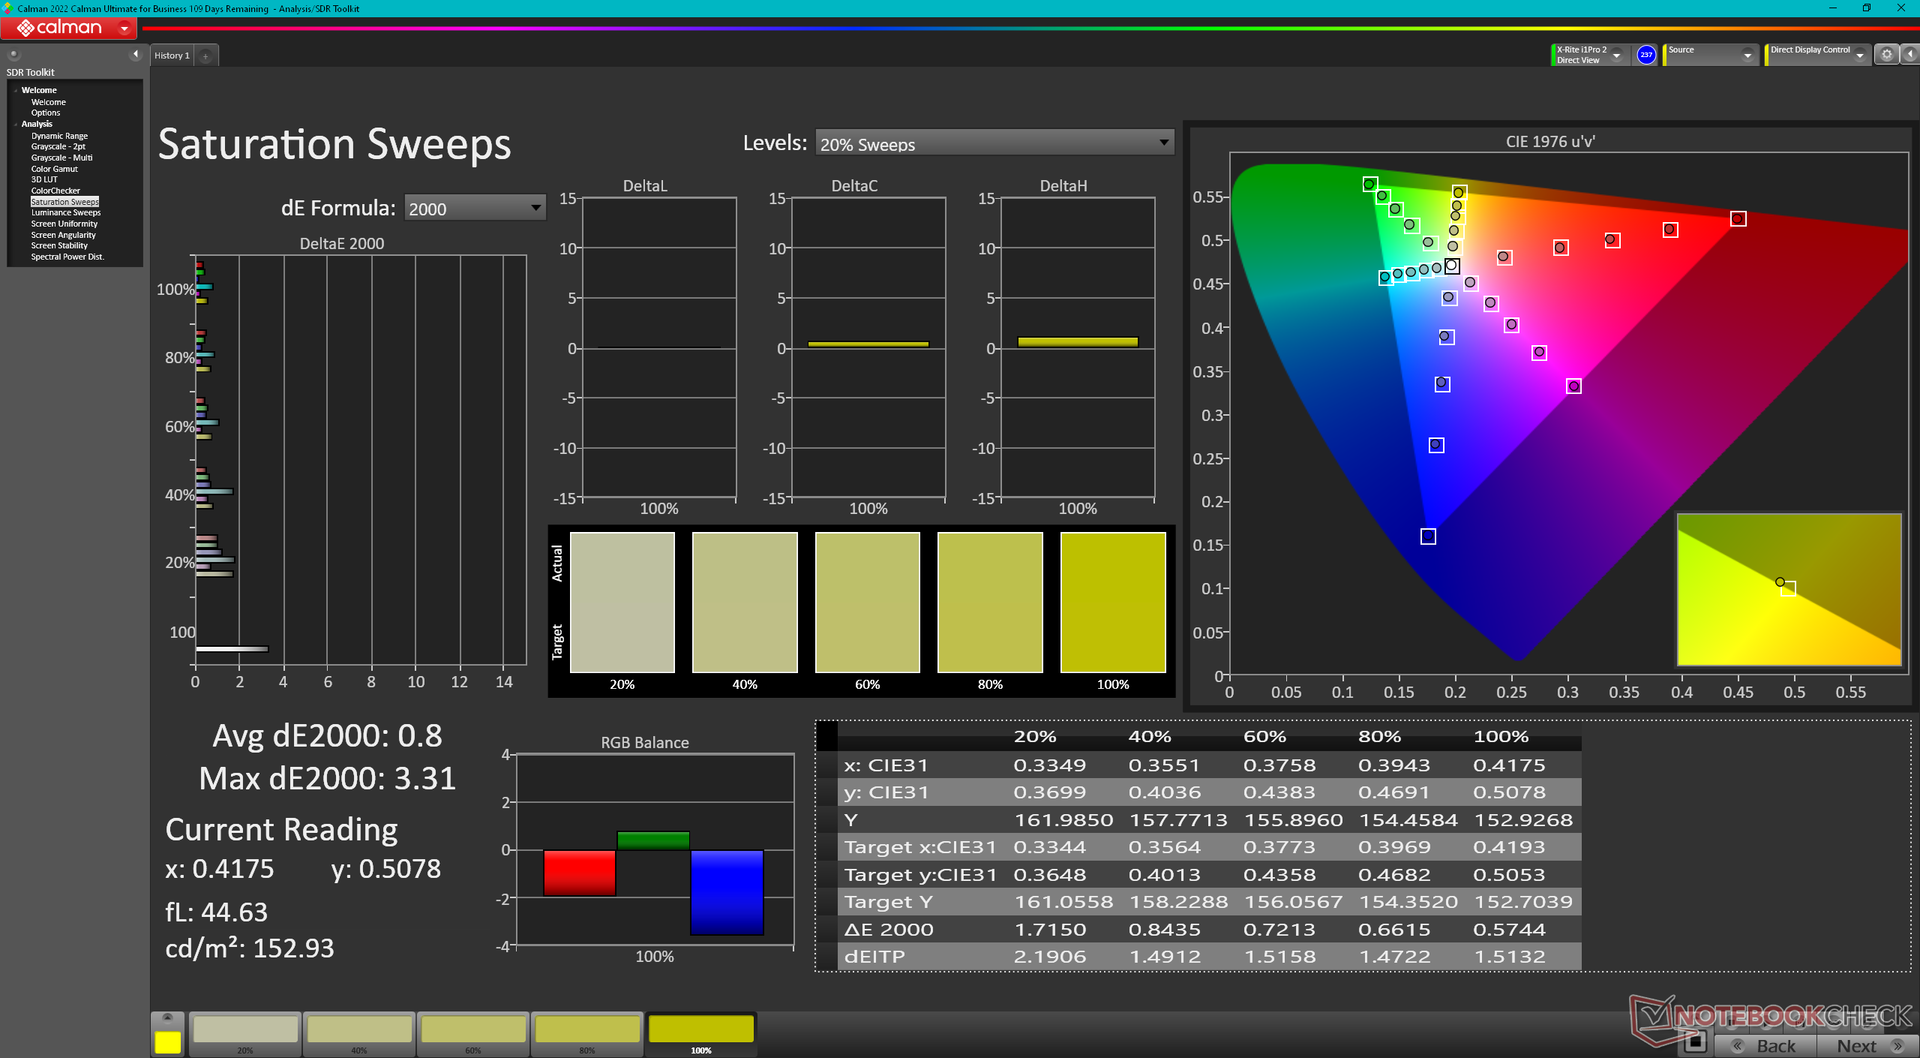
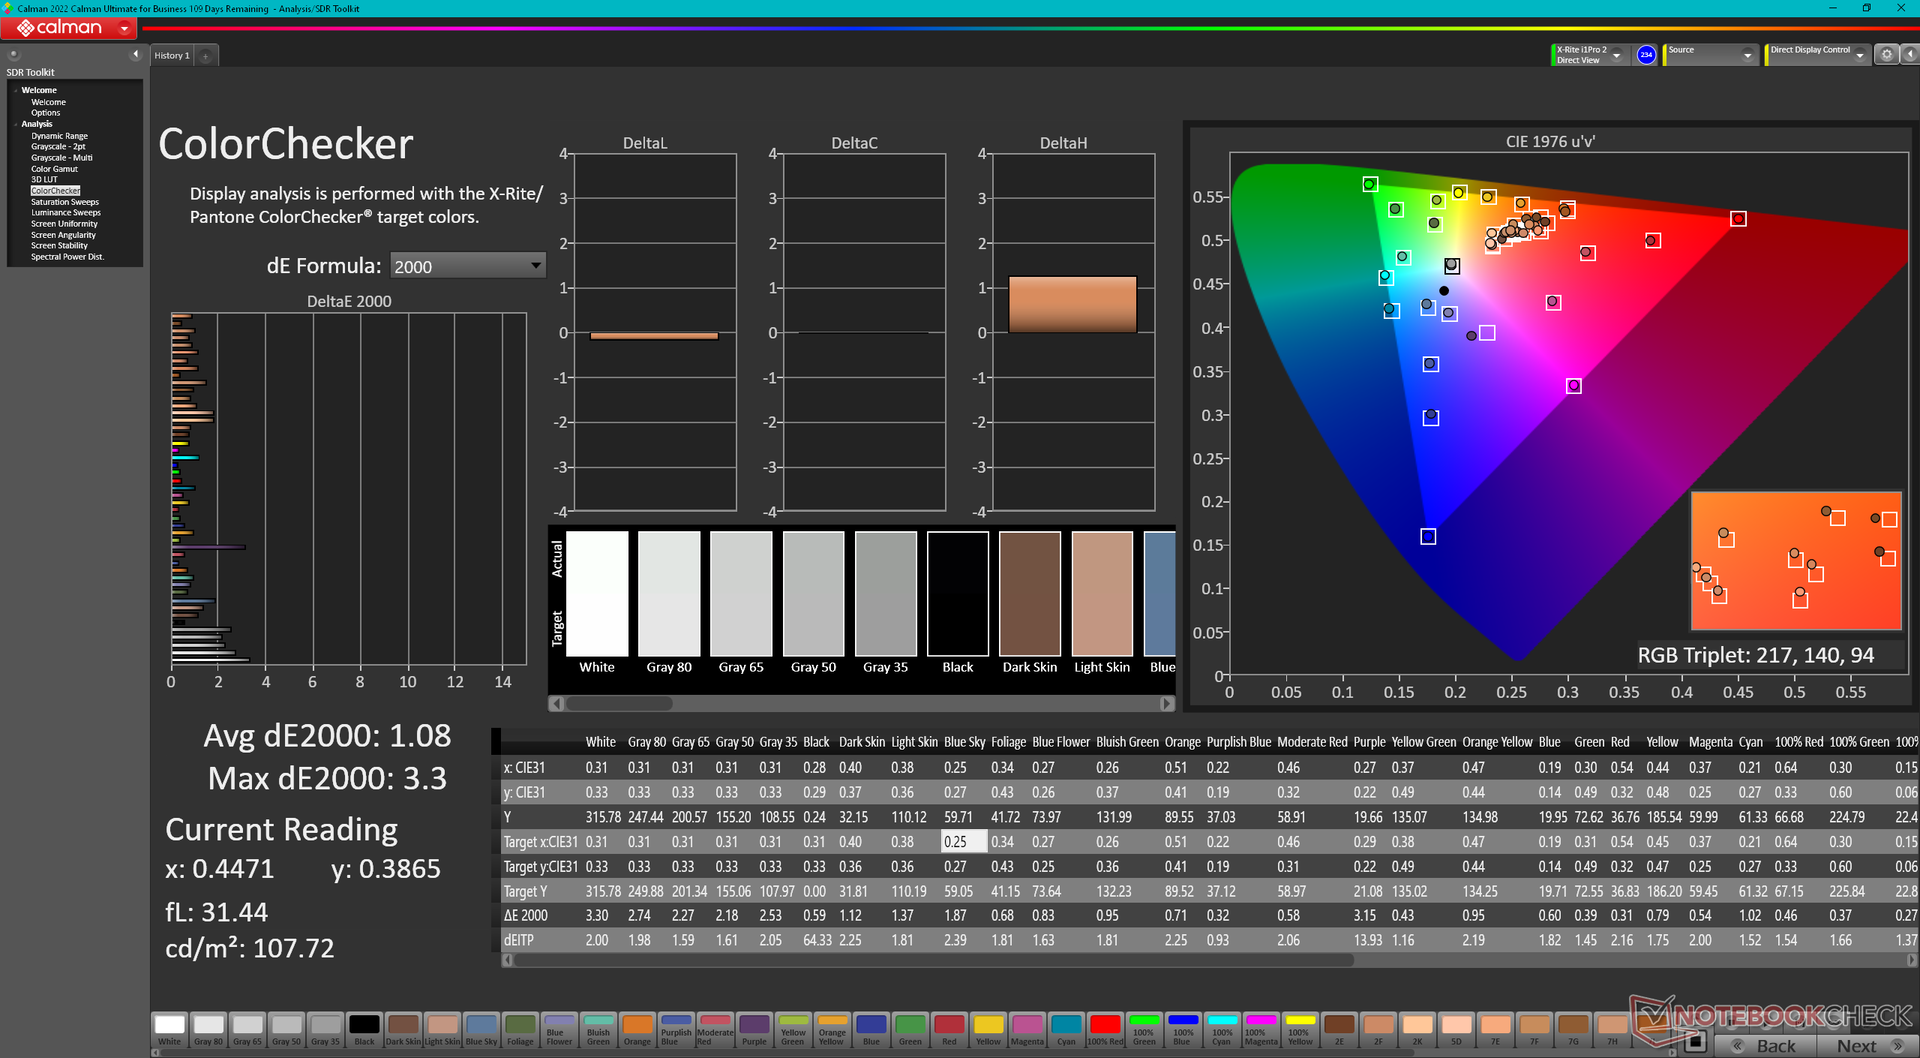
Skärmen levereras välkalibrerad direkt från förpackningen, vilket är förvånande med tanke på att Inspiron-serien vanligtvis är mer budgetvänlig med mindre fokus på färgnoggrannhet än den mer avancerade XPS-serien. Att försöka kalibrera panelen själva skulle bara resultera i små förbättringar av de genomsnittliga deltaE-värdena, vilket visas i skärmdumparna nedan. En slutanvändarkalibrering är därför inte nödvändig för de flesta användare.
Visa svarstider
| ↔ Svarstid svart till vitt | ||
|---|---|---|
| 17.6 ms ... stiga ↗ och falla ↘ kombinerat | ↗ 8.5 ms stiga | 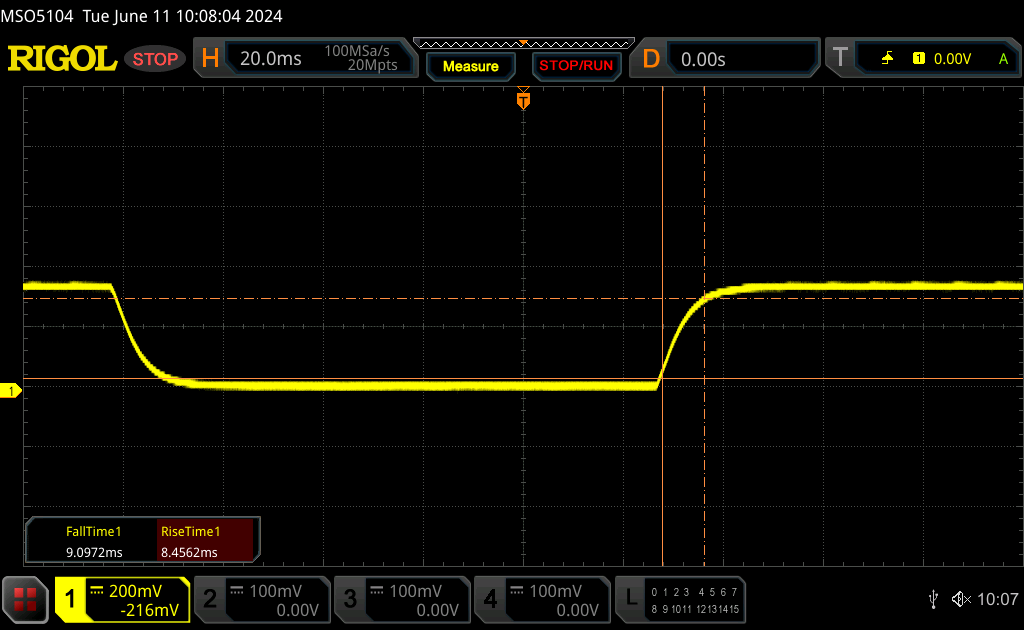 |
| ↘ 9.1 ms hösten | ||
| Skärmen visar bra svarsfrekvens i våra tester, men kan vara för långsam för konkurrenskraftiga spelare. I jämförelse sträcker sig alla testade enheter från 0.1 (minst) till 240 (maximalt) ms. » 36 % av alla enheter är bättre. Det betyder att den uppmätta svarstiden är bättre än genomsnittet av alla testade enheter (20.8 ms). | ||
| ↔ Svarstid 50 % grått till 80 % grått | ||
| 25.6 ms ... stiga ↗ och falla ↘ kombinerat | ↗ 12.3 ms stiga | 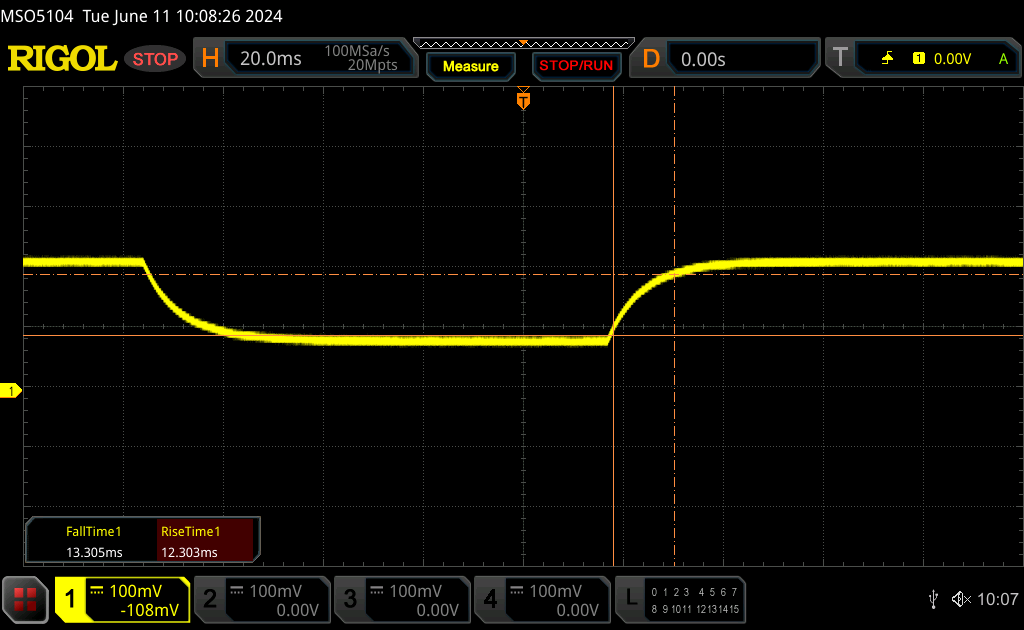 |
| ↘ 13.3 ms hösten | ||
| Skärmen visar relativt långsamma svarsfrekvenser i våra tester och kan vara för långsam för spelare. I jämförelse sträcker sig alla testade enheter från 0.165 (minst) till 636 (maximalt) ms. » 33 % av alla enheter är bättre. Det betyder att den uppmätta svarstiden är bättre än genomsnittet av alla testade enheter (32.5 ms). | ||
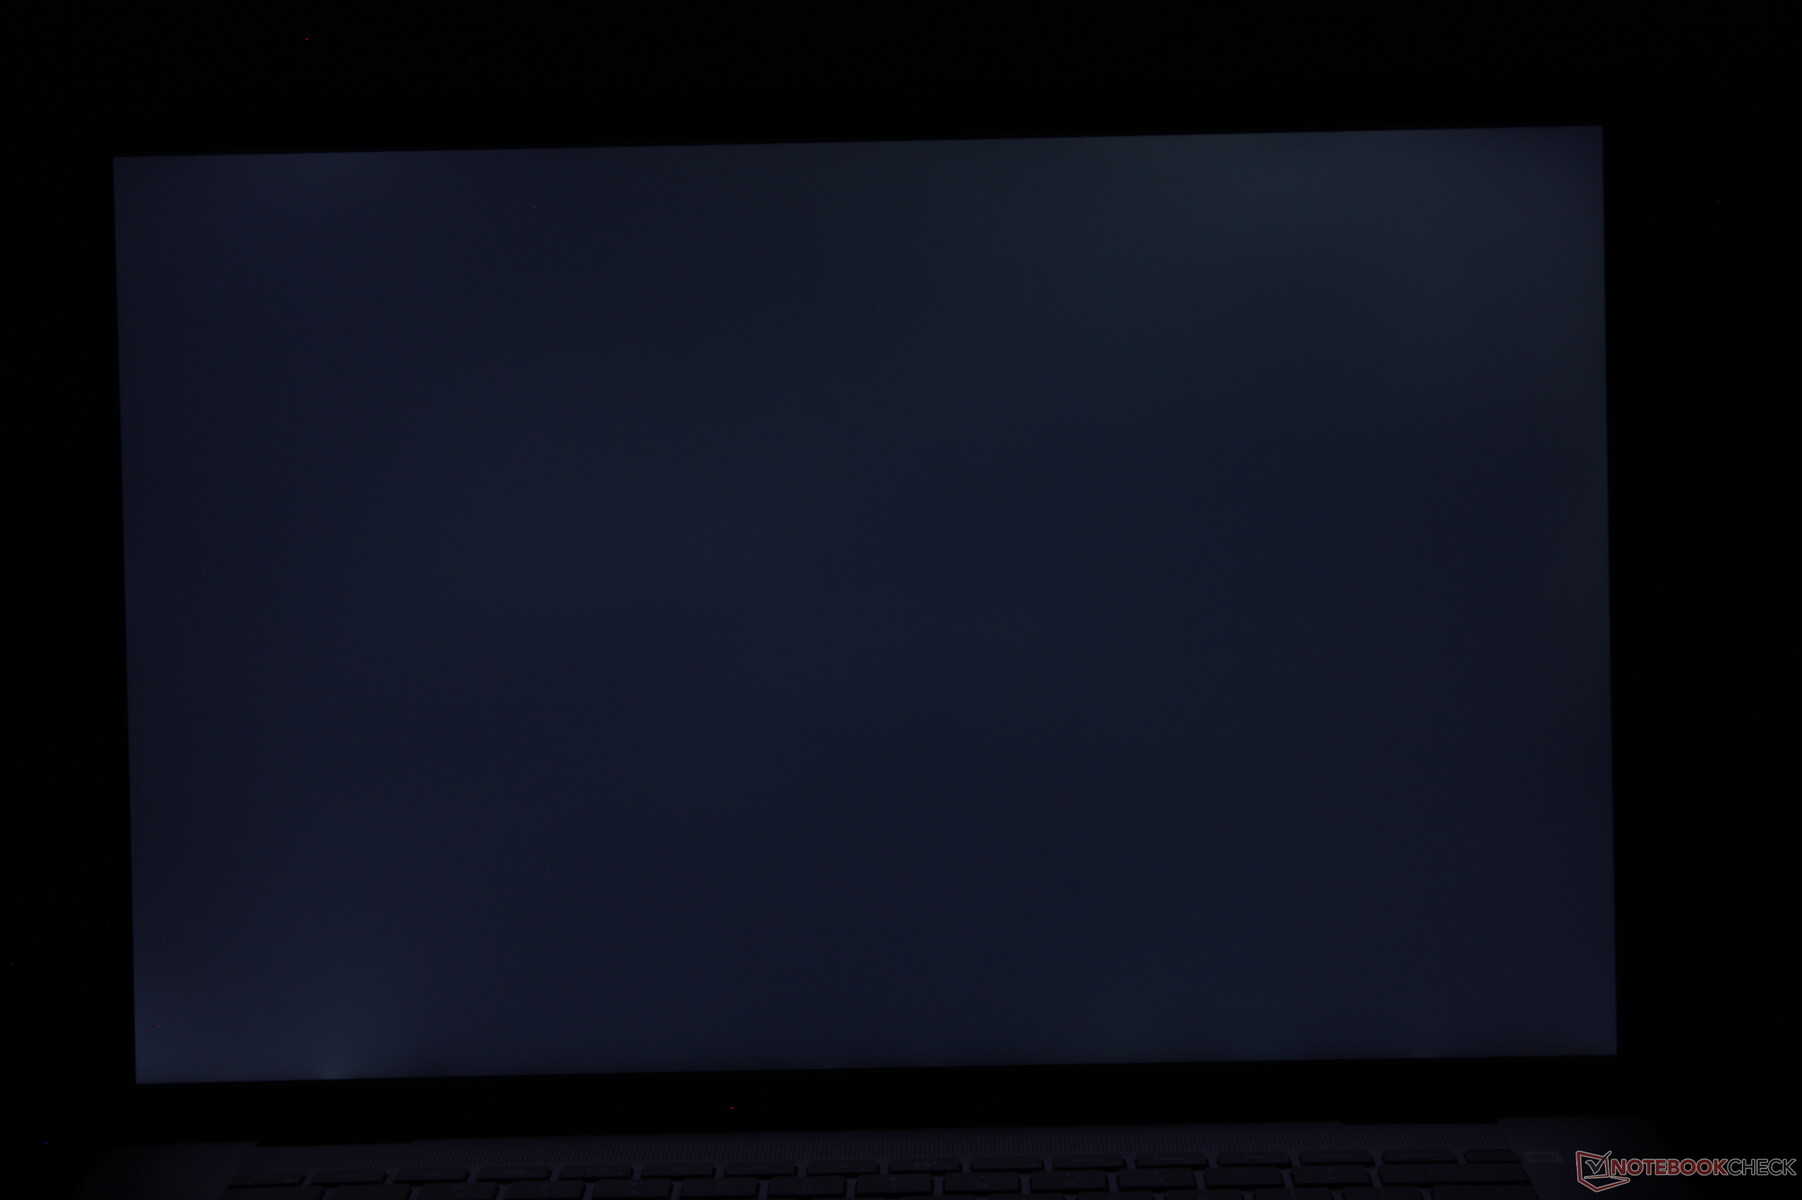
Skärmflimmer / PWM (Puls-Width Modulation)
| Skärmflimmer / PWM upptäcktes inte | 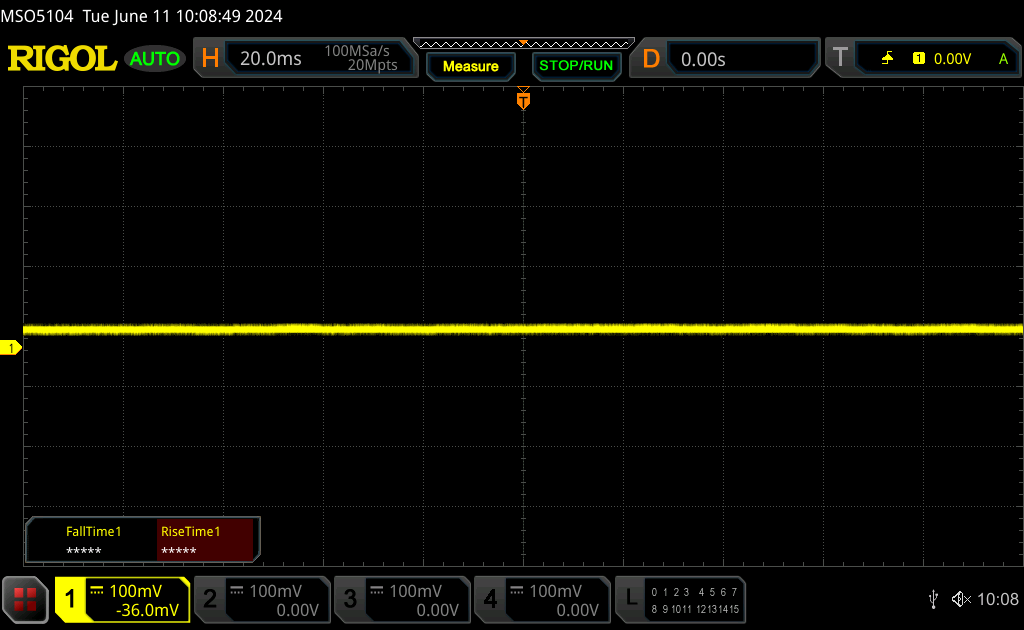 | ||
Som jämförelse: 53 % av alla testade enheter använder inte PWM för att dämpa skärmen. Om PWM upptäcktes mättes ett medelvärde av 8516 (minst: 5 - maximum: 343500) Hz. | |||
Prestanda - AI-beredd
Testförhållanden
Vi ställde in Windows i prestandaläge innan vi körde nedanstående benchmarks.
Processor
Våra Core Ultra 7 155H prestanda är utmärkt med multithread-resultat som är 15 till 20 procent snabbare än andra bärbara datorer med samma processor. Jämfört med Core i7-13700H i förra årets Inspiron 16 Plus 7630 är den nyare processorn dock bara cirka 10 procent snabbare, vilket gör att den inte märks för de allra flesta uppgifter. Faktum är att den äldre processorn verkar ha en liten fördel när det gäller enkel trådade arbetsbelastningar.
Naturligtvis ligger Core Ultra 7 155H:s joker i den integrerade NPU:n som bör komma väl till pass för AI-accelererade uppgifter när de blir mer lättillgängliga. Dess användbarhet är annars extremt begränsad i skrivande stund.
Cinebench R15 Multi Loop
Cinebench R23: Multi Core | Single Core
Cinebench R20: CPU (Multi Core) | CPU (Single Core)
Cinebench R15: CPU Multi 64Bit | CPU Single 64Bit
Blender: v2.79 BMW27 CPU
7-Zip 18.03: 7z b 4 | 7z b 4 -mmt1
Geekbench 6.4: Multi-Core | Single-Core
Geekbench 5.5: Multi-Core | Single-Core
HWBOT x265 Benchmark v2.2: 4k Preset
LibreOffice : 20 Documents To PDF
R Benchmark 2.5: Overall mean
* ... mindre är bättre
AIDA64: FP32 Ray-Trace | FPU Julia | CPU SHA3 | CPU Queen | FPU SinJulia | FPU Mandel | CPU AES | CPU ZLib | FP64 Ray-Trace | CPU PhotoWorxx
| Performance Rating | |
| Lenovo Legion 5 16IRX G9 | |
| Asus VivoBook Pro 16 K6602VU | |
| Samsung Galaxy Book4 Ultra | |
| Dell Inspiron 16 Plus 7640 | |
| Genomsnitt Intel Core Ultra 7 155H | |
| Dell Inspiron 16 Plus 7630 | |
| Dell Inspiron 16 Plus 7620 | |
| AIDA64 / FP32 Ray-Trace | |
| Lenovo Legion 5 16IRX G9 | |
| Dell Inspiron 16 Plus 7640 | |
| Dell Inspiron 16 Plus 7630 | |
| Asus VivoBook Pro 16 K6602VU | |
| Samsung Galaxy Book4 Ultra | |
| Genomsnitt Intel Core Ultra 7 155H (6670 - 18470, n=50) | |
| Dell Inspiron 16 Plus 7620 | |
| AIDA64 / FPU Julia | |
| Lenovo Legion 5 16IRX G9 | |
| Asus VivoBook Pro 16 K6602VU | |
| Samsung Galaxy Book4 Ultra | |
| Dell Inspiron 16 Plus 7640 | |
| Genomsnitt Intel Core Ultra 7 155H (40905 - 93181, n=50) | |
| Dell Inspiron 16 Plus 7630 | |
| Dell Inspiron 16 Plus 7620 | |
| AIDA64 / CPU SHA3 | |
| Lenovo Legion 5 16IRX G9 | |
| Dell Inspiron 16 Plus 7640 | |
| Asus VivoBook Pro 16 K6602VU | |
| Samsung Galaxy Book4 Ultra | |
| Genomsnitt Intel Core Ultra 7 155H (1940 - 4436, n=50) | |
| Dell Inspiron 16 Plus 7630 | |
| Dell Inspiron 16 Plus 7620 | |
| AIDA64 / CPU Queen | |
| Dell Inspiron 16 Plus 7630 | |
| Lenovo Legion 5 16IRX G9 | |
| Asus VivoBook Pro 16 K6602VU | |
| Dell Inspiron 16 Plus 7620 | |
| Dell Inspiron 16 Plus 7640 | |
| Samsung Galaxy Book4 Ultra | |
| Genomsnitt Intel Core Ultra 7 155H (64698 - 94181, n=50) | |
| AIDA64 / FPU SinJulia | |
| Lenovo Legion 5 16IRX G9 | |
| Dell Inspiron 16 Plus 7640 | |
| Samsung Galaxy Book4 Ultra | |
| Genomsnitt Intel Core Ultra 7 155H (5639 - 10647, n=50) | |
| Dell Inspiron 16 Plus 7630 | |
| Asus VivoBook Pro 16 K6602VU | |
| Dell Inspiron 16 Plus 7620 | |
| AIDA64 / FPU Mandel | |
| Lenovo Legion 5 16IRX G9 | |
| Dell Inspiron 16 Plus 7640 | |
| Samsung Galaxy Book4 Ultra | |
| Genomsnitt Intel Core Ultra 7 155H (18236 - 47685, n=50) | |
| Asus VivoBook Pro 16 K6602VU | |
| Dell Inspiron 16 Plus 7630 | |
| Dell Inspiron 16 Plus 7620 | |
| AIDA64 / CPU AES | |
| Asus VivoBook Pro 16 K6602VU | |
| Lenovo Legion 5 16IRX G9 | |
| Genomsnitt Intel Core Ultra 7 155H (45713 - 152179, n=50) | |
| Samsung Galaxy Book4 Ultra | |
| Dell Inspiron 16 Plus 7640 | |
| Dell Inspiron 16 Plus 7620 | |
| Dell Inspiron 16 Plus 7630 | |
| AIDA64 / CPU ZLib | |
| Lenovo Legion 5 16IRX G9 | |
| Dell Inspiron 16 Plus 7640 | |
| Dell Inspiron 16 Plus 7620 | |
| Samsung Galaxy Book4 Ultra | |
| Asus VivoBook Pro 16 K6602VU | |
| Genomsnitt Intel Core Ultra 7 155H (557 - 1250, n=50) | |
| Dell Inspiron 16 Plus 7630 | |
| AIDA64 / FP64 Ray-Trace | |
| Lenovo Legion 5 16IRX G9 | |
| Asus VivoBook Pro 16 K6602VU | |
| Dell Inspiron 16 Plus 7640 | |
| Dell Inspiron 16 Plus 7630 | |
| Samsung Galaxy Book4 Ultra | |
| Genomsnitt Intel Core Ultra 7 155H (3569 - 9802, n=50) | |
| Dell Inspiron 16 Plus 7620 | |
| AIDA64 / CPU PhotoWorxx | |
| Samsung Galaxy Book4 Ultra | |
| Genomsnitt Intel Core Ultra 7 155H (32719 - 54223, n=50) | |
| Dell Inspiron 16 Plus 7640 | |
| Asus VivoBook Pro 16 K6602VU | |
| Dell Inspiron 16 Plus 7630 | |
| Dell Inspiron 16 Plus 7620 | |
| Lenovo Legion 5 16IRX G9 | |
Stresstest
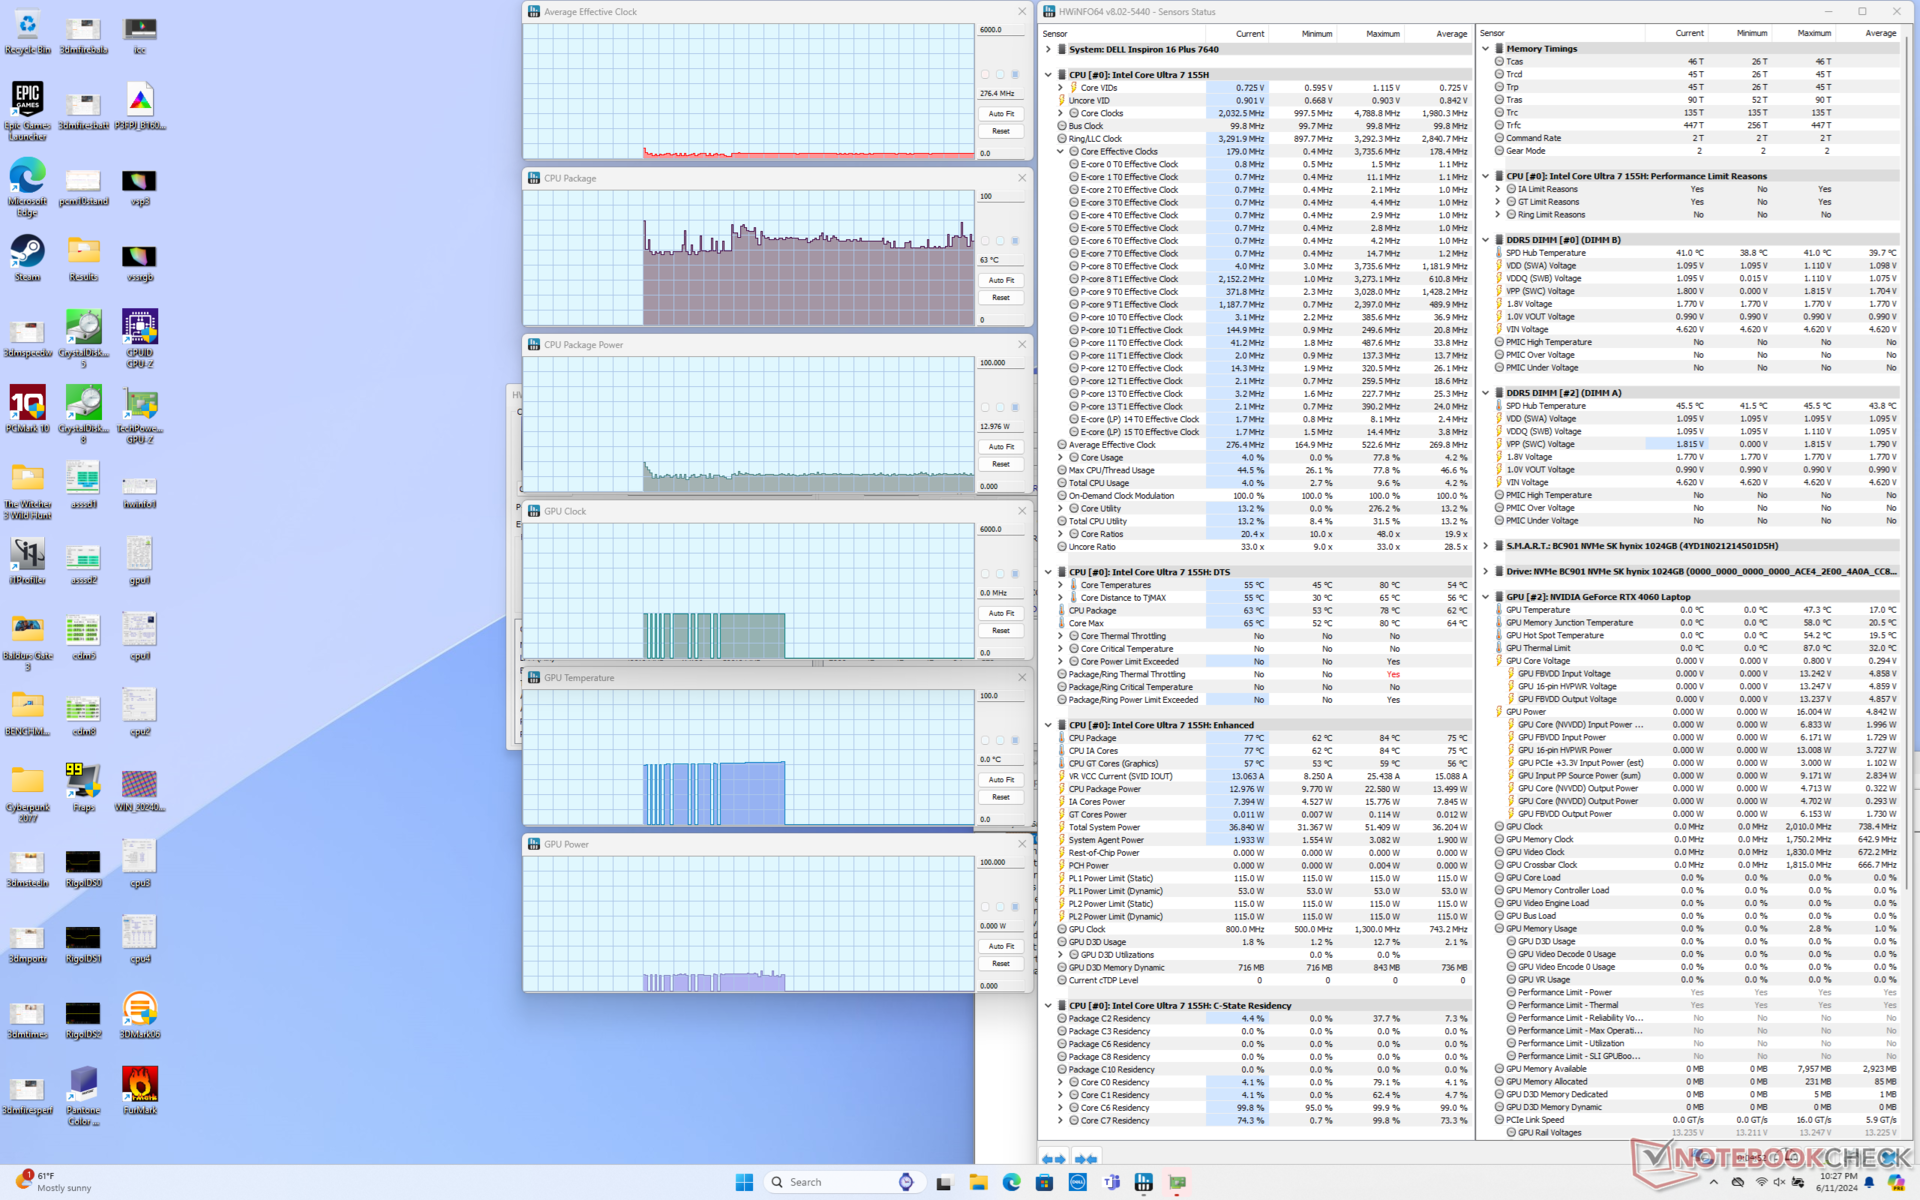
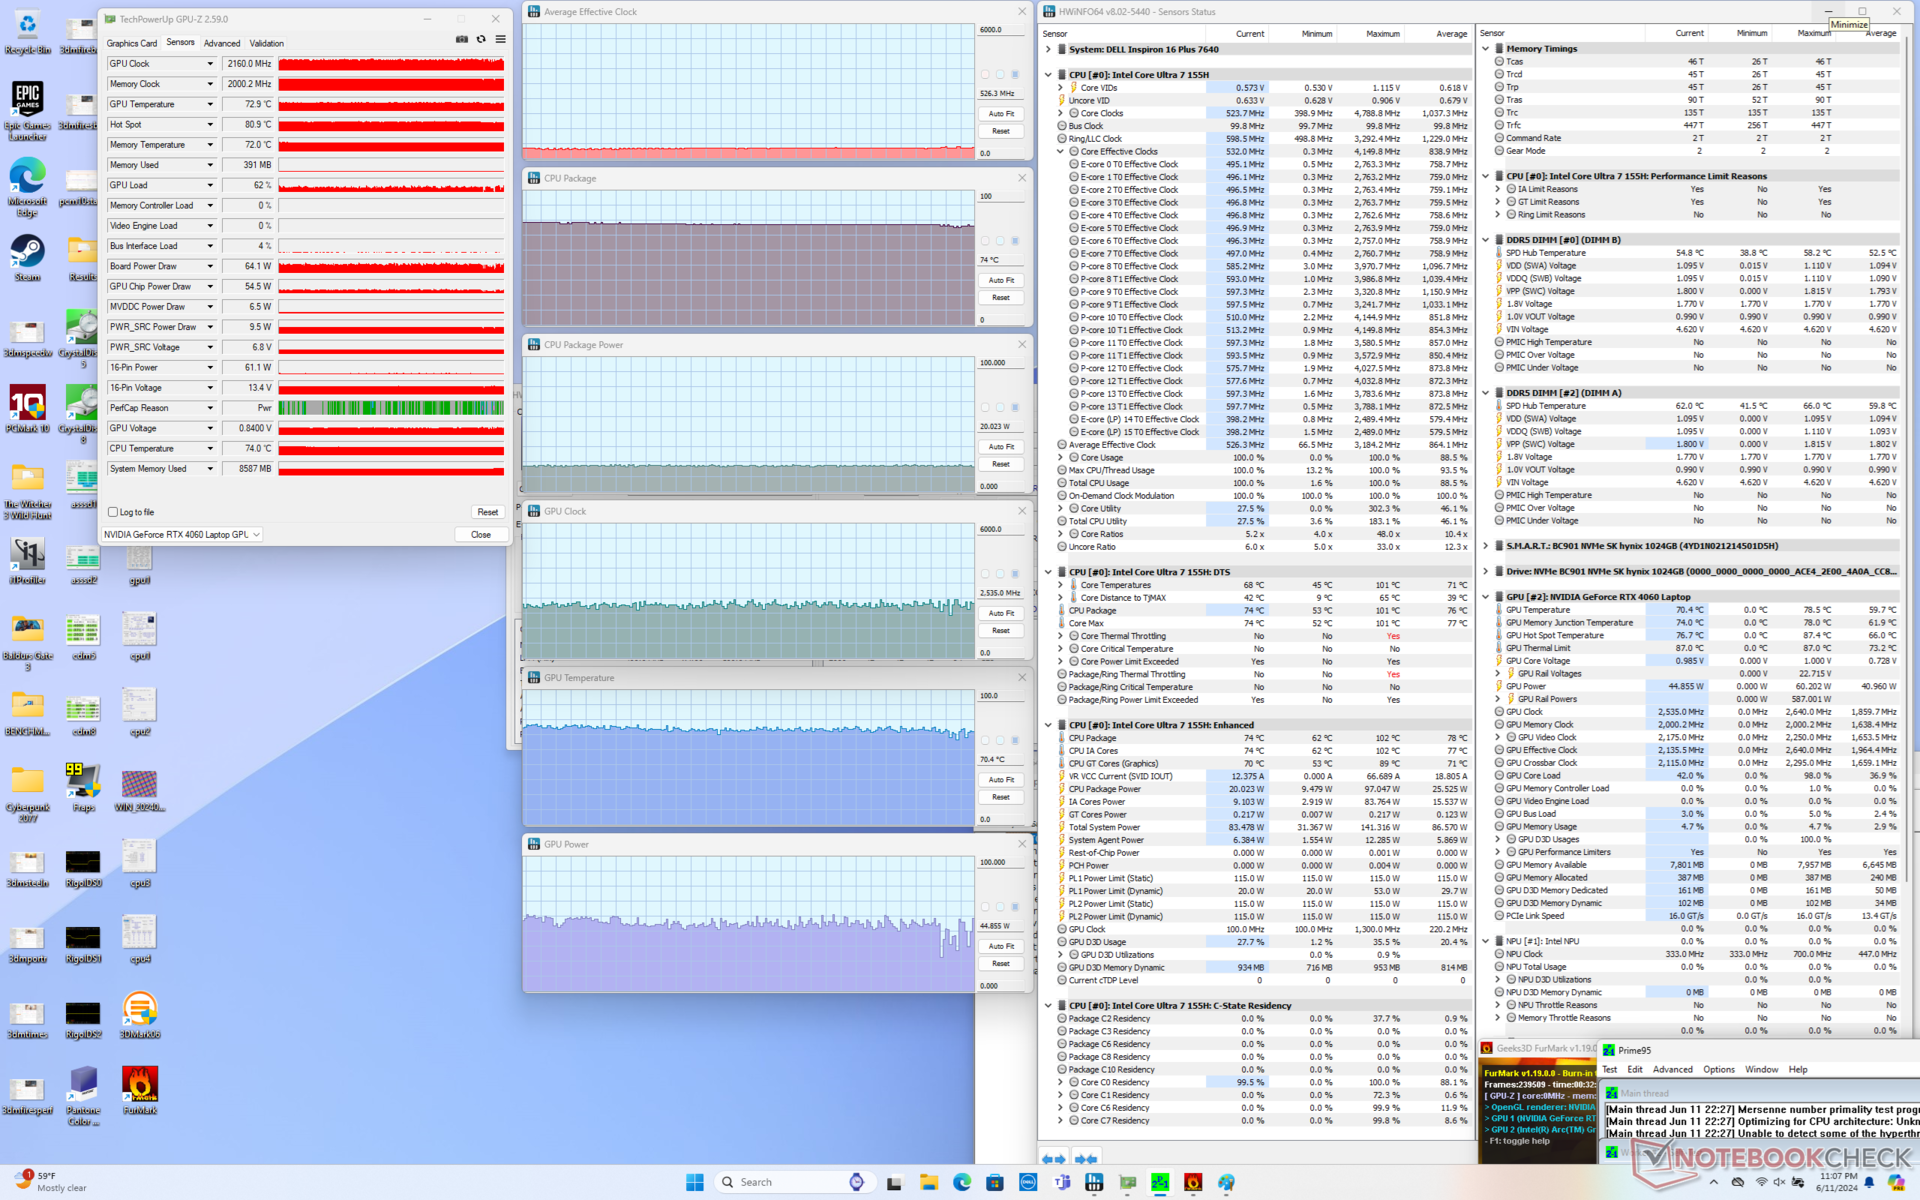
Processorn ökade till 3,2 GHz i genomsnitt, 97 W och 101 C under cirka 25 sekunder när Prime95-stress initierades. Därefter sjönk den till ~ 2,3 GHz och 44 W för att bibehålla en svalare kärntemperatur på 83 C. Turbo Boost-prestanda är därför kortlivad på systemet, liknande det vi observerade på föregångarmodellen.
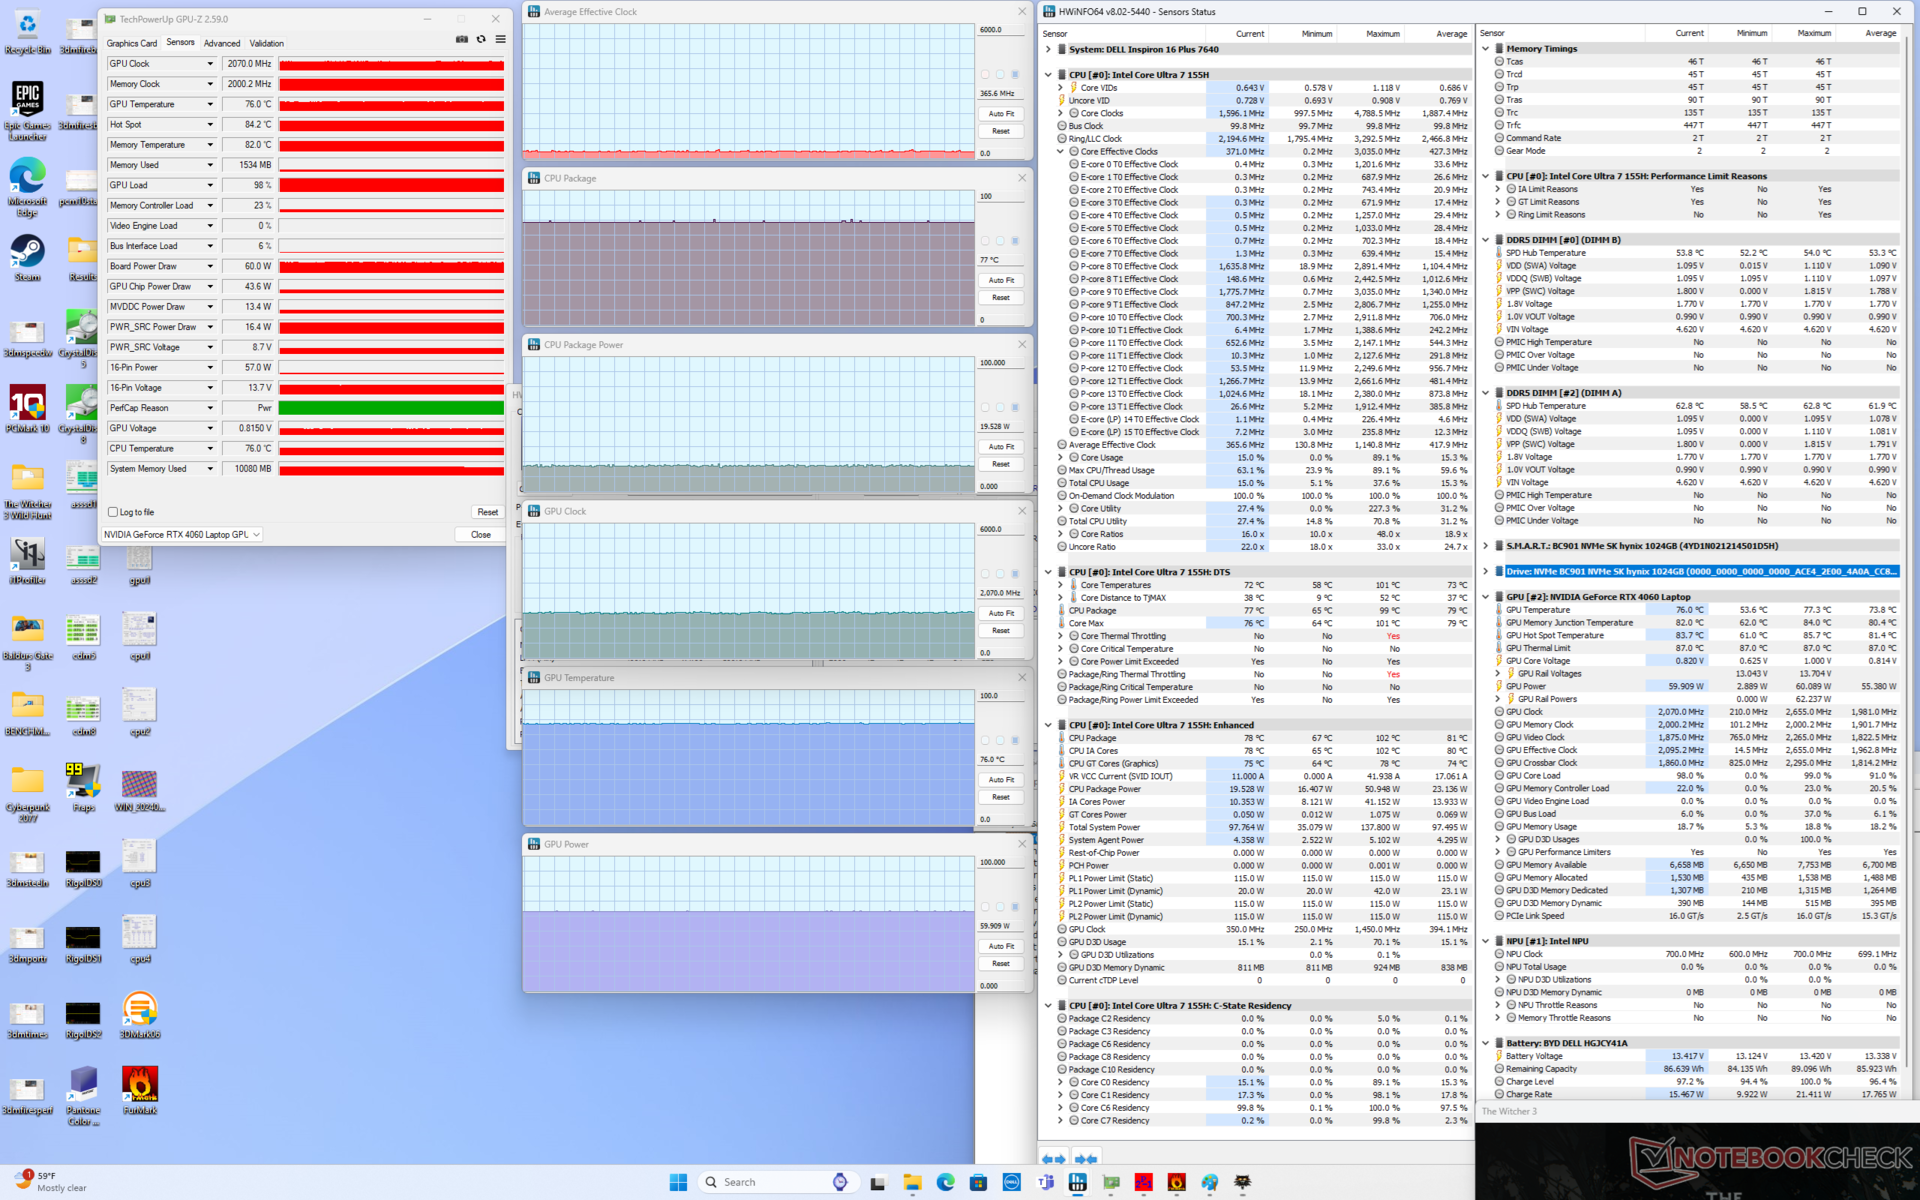
Nvidias GPU skulle stabiliseras vid 2070 MHz, 76 C och 60 W när den kördes Witcher 3 jämfört med 2250 MHz, 72 C och 69 W på förra årets modell under liknande testförhållanden. Dessa resultat kompletterar den generellt långsammare prestandan i spel som beskrivs i avsnittet om spelprestanda nedan. GPU-effekten på den nya Dell-modellen skulle nå ett tak på 60 W jämfört med 70 W på den äldre Dell-modellen även när den var inställd på prestandaläge.

| Genomsnittlig CPU-klocka (GHz) | GPU-klocka (MHz) | Genomsnittlig CPU-temperatur (°C) | Genomsnittlig GPU-temperatur (°C) | |
| System i viloläge | -- | -- | 63 | 45 |
| Prime95 Stress | 2.1 - 2.4 | -- | 83 | 56 |
| Prime95 + FurMark Stress | 0,5 | 2160 | 74 | 70 |
| Witcher 3 Stress | 0,4 | 2070 | 77 | 77 |
Systemets prestanda
PCMark-resultaten är jämförbara med förra årets modell trots CPU-uppgraderingen, vilket visar att den nyare modellen inte nödvändigtvis är snabbare när det gäller de flesta dagliga funktioner.

CrossMark: Overall | Productivity | Creativity | Responsiveness
WebXPRT 3: Overall
WebXPRT 4: Overall
Mozilla Kraken 1.1: Total
| PCMark 10 / Score | |
| Dell Inspiron 16 Plus 7630 | |
| Lenovo Legion 5 16IRX G9 | |
| Asus VivoBook Pro 16 K6602VU | |
| Dell Inspiron 16 Plus 7640 | |
| Genomsnitt Intel Core Ultra 7 155H, NVIDIA GeForce RTX 4060 Laptop GPU (6751 - 7370, n=5) | |
| Samsung Galaxy Book4 Ultra | |
| Dell Inspiron 16 Plus 7620 | |
| PCMark 10 / Essentials | |
| Dell Inspiron 16 Plus 7630 | |
| Lenovo Legion 5 16IRX G9 | |
| Samsung Galaxy Book4 Ultra | |
| Dell Inspiron 16 Plus 7640 | |
| Asus VivoBook Pro 16 K6602VU | |
| Dell Inspiron 16 Plus 7620 | |
| Genomsnitt Intel Core Ultra 7 155H, NVIDIA GeForce RTX 4060 Laptop GPU (9476 - 10446, n=5) | |
| PCMark 10 / Productivity | |
| Dell Inspiron 16 Plus 7630 | |
| Lenovo Legion 5 16IRX G9 | |
| Samsung Galaxy Book4 Ultra | |
| Dell Inspiron 16 Plus 7620 | |
| Genomsnitt Intel Core Ultra 7 155H, NVIDIA GeForce RTX 4060 Laptop GPU (8079 - 9477, n=5) | |
| Asus VivoBook Pro 16 K6602VU | |
| Dell Inspiron 16 Plus 7640 | |
| PCMark 10 / Digital Content Creation | |
| Lenovo Legion 5 16IRX G9 | |
| Dell Inspiron 16 Plus 7630 | |
| Dell Inspiron 16 Plus 7640 | |
| Asus VivoBook Pro 16 K6602VU | |
| Genomsnitt Intel Core Ultra 7 155H, NVIDIA GeForce RTX 4060 Laptop GPU (9811 - 11620, n=5) | |
| Samsung Galaxy Book4 Ultra | |
| Dell Inspiron 16 Plus 7620 | |
| CrossMark / Overall | |
| Lenovo Legion 5 16IRX G9 | |
| Dell Inspiron 16 Plus 7630 | |
| Dell Inspiron 16 Plus 7620 | |
| Samsung Galaxy Book4 Ultra | |
| Asus VivoBook Pro 16 K6602VU | |
| Dell Inspiron 16 Plus 7640 | |
| Genomsnitt Intel Core Ultra 7 155H, NVIDIA GeForce RTX 4060 Laptop GPU (1540 - 1746, n=5) | |
| CrossMark / Productivity | |
| Lenovo Legion 5 16IRX G9 | |
| Dell Inspiron 16 Plus 7630 | |
| Asus VivoBook Pro 16 K6602VU | |
| Samsung Galaxy Book4 Ultra | |
| Dell Inspiron 16 Plus 7620 | |
| Genomsnitt Intel Core Ultra 7 155H, NVIDIA GeForce RTX 4060 Laptop GPU (1436 - 1684, n=5) | |
| Dell Inspiron 16 Plus 7640 | |
| CrossMark / Creativity | |
| Lenovo Legion 5 16IRX G9 | |
| Dell Inspiron 16 Plus 7630 | |
| Samsung Galaxy Book4 Ultra | |
| Dell Inspiron 16 Plus 7640 | |
| Dell Inspiron 16 Plus 7620 | |
| Genomsnitt Intel Core Ultra 7 155H, NVIDIA GeForce RTX 4060 Laptop GPU (1811 - 1929, n=5) | |
| Asus VivoBook Pro 16 K6602VU | |
| CrossMark / Responsiveness | |
| Lenovo Legion 5 16IRX G9 | |
| Dell Inspiron 16 Plus 7630 | |
| Asus VivoBook Pro 16 K6602VU | |
| Dell Inspiron 16 Plus 7620 | |
| Samsung Galaxy Book4 Ultra | |
| Genomsnitt Intel Core Ultra 7 155H, NVIDIA GeForce RTX 4060 Laptop GPU (1165 - 1631, n=5) | |
| Dell Inspiron 16 Plus 7640 | |
| WebXPRT 3 / Overall | |
| Dell Inspiron 16 Plus 7630 | |
| Lenovo Legion 5 16IRX G9 | |
| Dell Inspiron 16 Plus 7620 | |
| Dell Inspiron 16 Plus 7640 | |
| Genomsnitt Intel Core Ultra 7 155H, NVIDIA GeForce RTX 4060 Laptop GPU (274 - 290, n=5) | |
| Samsung Galaxy Book4 Ultra | |
| WebXPRT 4 / Overall | |
| Lenovo Legion 5 16IRX G9 | |
| Dell Inspiron 16 Plus 7630 | |
| Dell Inspiron 16 Plus 7620 | |
| Samsung Galaxy Book4 Ultra | |
| Dell Inspiron 16 Plus 7640 | |
| Genomsnitt Intel Core Ultra 7 155H, NVIDIA GeForce RTX 4060 Laptop GPU (236 - 262, n=5) | |
| Asus VivoBook Pro 16 K6602VU | |
| Mozilla Kraken 1.1 / Total | |
| Genomsnitt Intel Core Ultra 7 155H, NVIDIA GeForce RTX 4060 Laptop GPU (519 - 585, n=5) | |
| Asus VivoBook Pro 16 K6602VU | |
| Dell Inspiron 16 Plus 7620 | |
| Dell Inspiron 16 Plus 7640 | |
| Dell Inspiron 16 Plus 7630 | |
| Lenovo Legion 5 16IRX G9 | |
| Samsung Galaxy Book4 Ultra | |
* ... mindre är bättre
| PCMark 10 Score | 7042 poäng | |
Hjälp | ||
| AIDA64 / Memory Copy | |
| Samsung Galaxy Book4 Ultra | |
| Genomsnitt Intel Core Ultra 7 155H (62397 - 96791, n=50) | |
| Dell Inspiron 16 Plus 7640 | |
| Lenovo Legion 5 16IRX G9 | |
| Dell Inspiron 16 Plus 7630 | |
| Asus VivoBook Pro 16 K6602VU | |
| Dell Inspiron 16 Plus 7620 | |
| AIDA64 / Memory Read | |
| Samsung Galaxy Book4 Ultra | |
| Genomsnitt Intel Core Ultra 7 155H (60544 - 90647, n=50) | |
| Dell Inspiron 16 Plus 7640 | |
| Lenovo Legion 5 16IRX G9 | |
| Dell Inspiron 16 Plus 7630 | |
| Asus VivoBook Pro 16 K6602VU | |
| Dell Inspiron 16 Plus 7620 | |
| AIDA64 / Memory Write | |
| Samsung Galaxy Book4 Ultra | |
| Genomsnitt Intel Core Ultra 7 155H (58692 - 93451, n=50) | |
| Dell Inspiron 16 Plus 7640 | |
| Asus VivoBook Pro 16 K6602VU | |
| Dell Inspiron 16 Plus 7630 | |
| Dell Inspiron 16 Plus 7620 | |
| Lenovo Legion 5 16IRX G9 | |
| AIDA64 / Memory Latency | |
| Genomsnitt Intel Core Ultra 7 155H (116.2 - 233, n=50) | |
| Samsung Galaxy Book4 Ultra | |
| Dell Inspiron 16 Plus 7640 | |
| Dell Inspiron 16 Plus 7620 | |
| Dell Inspiron 16 Plus 7630 | |
| Asus VivoBook Pro 16 K6602VU | |
| Lenovo Legion 5 16IRX G9 | |
* ... mindre är bättre
DPC-fördröjning
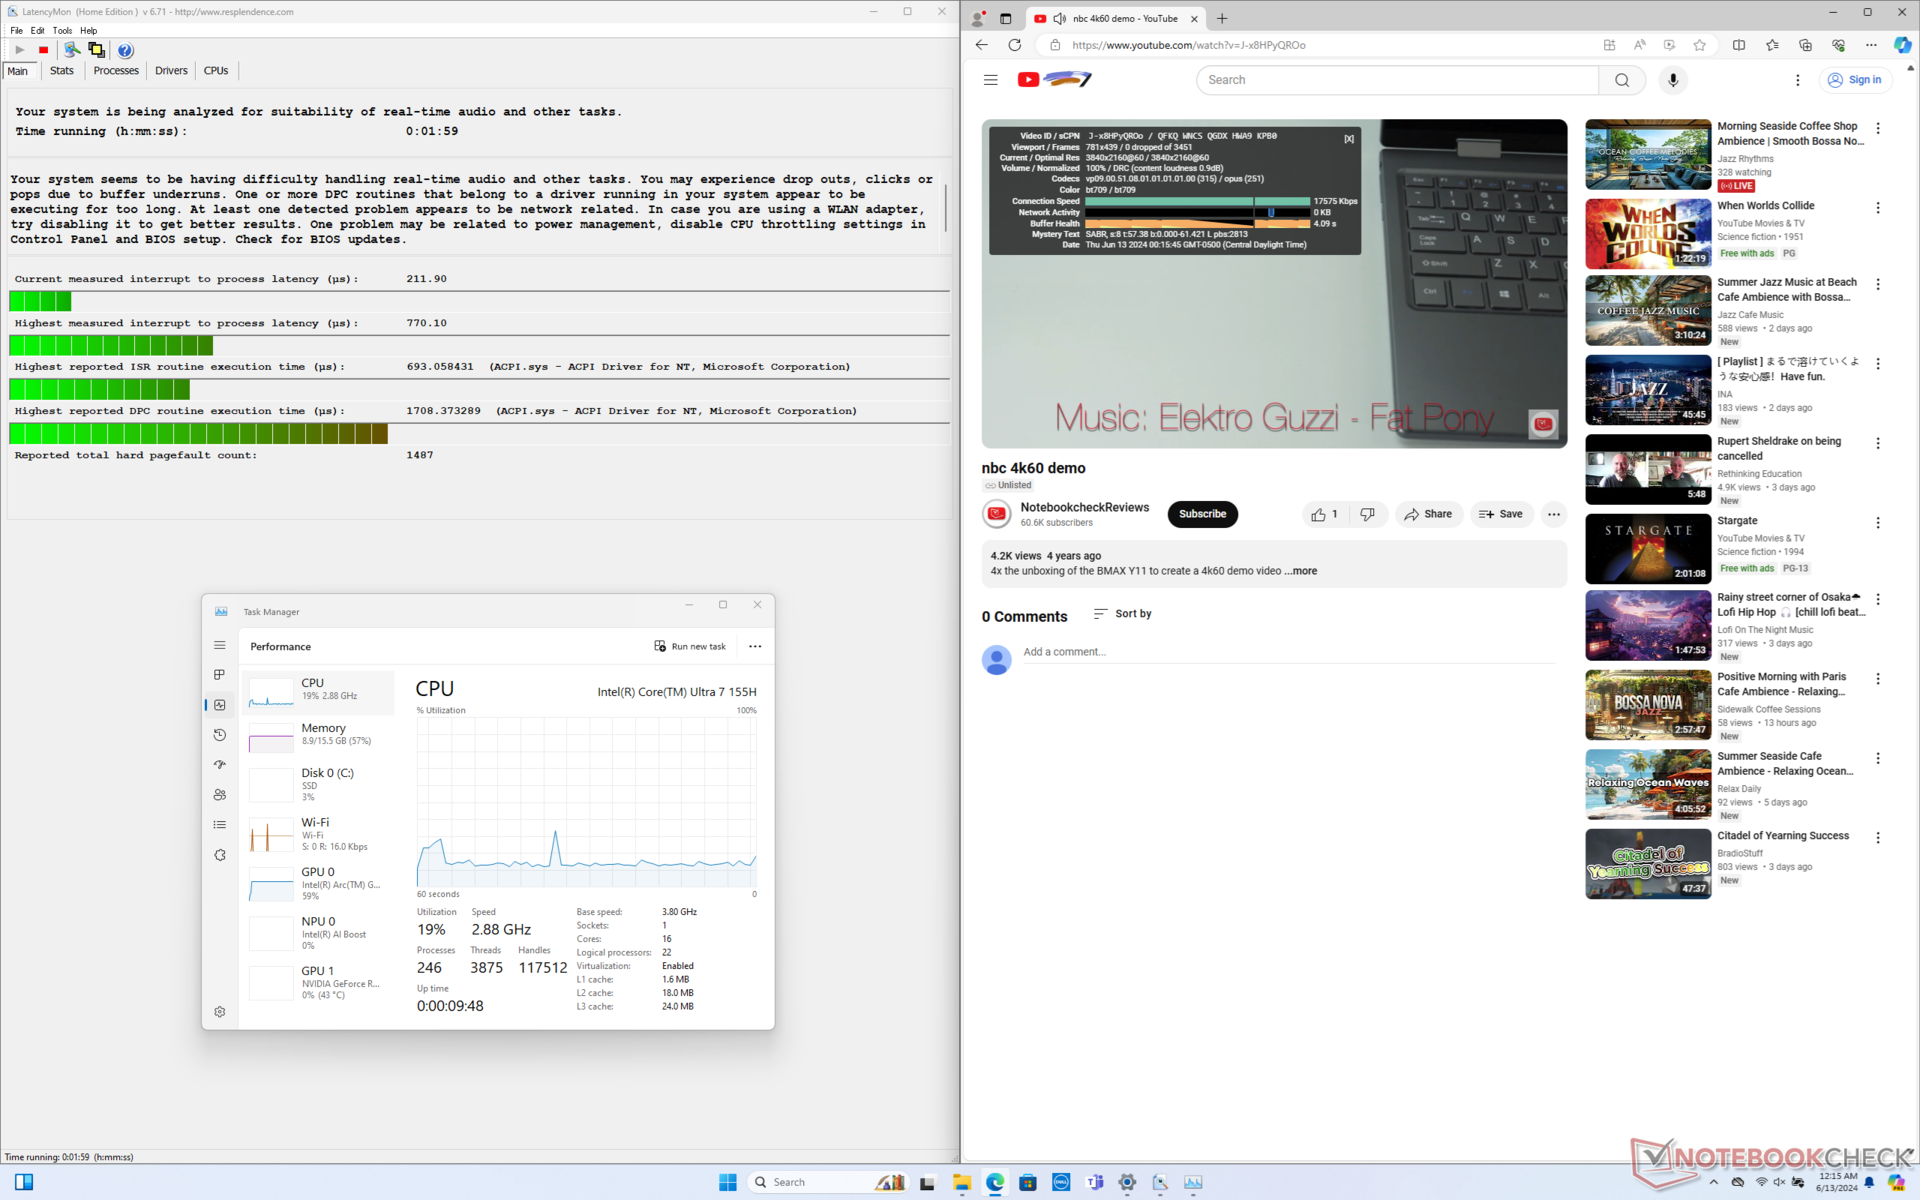
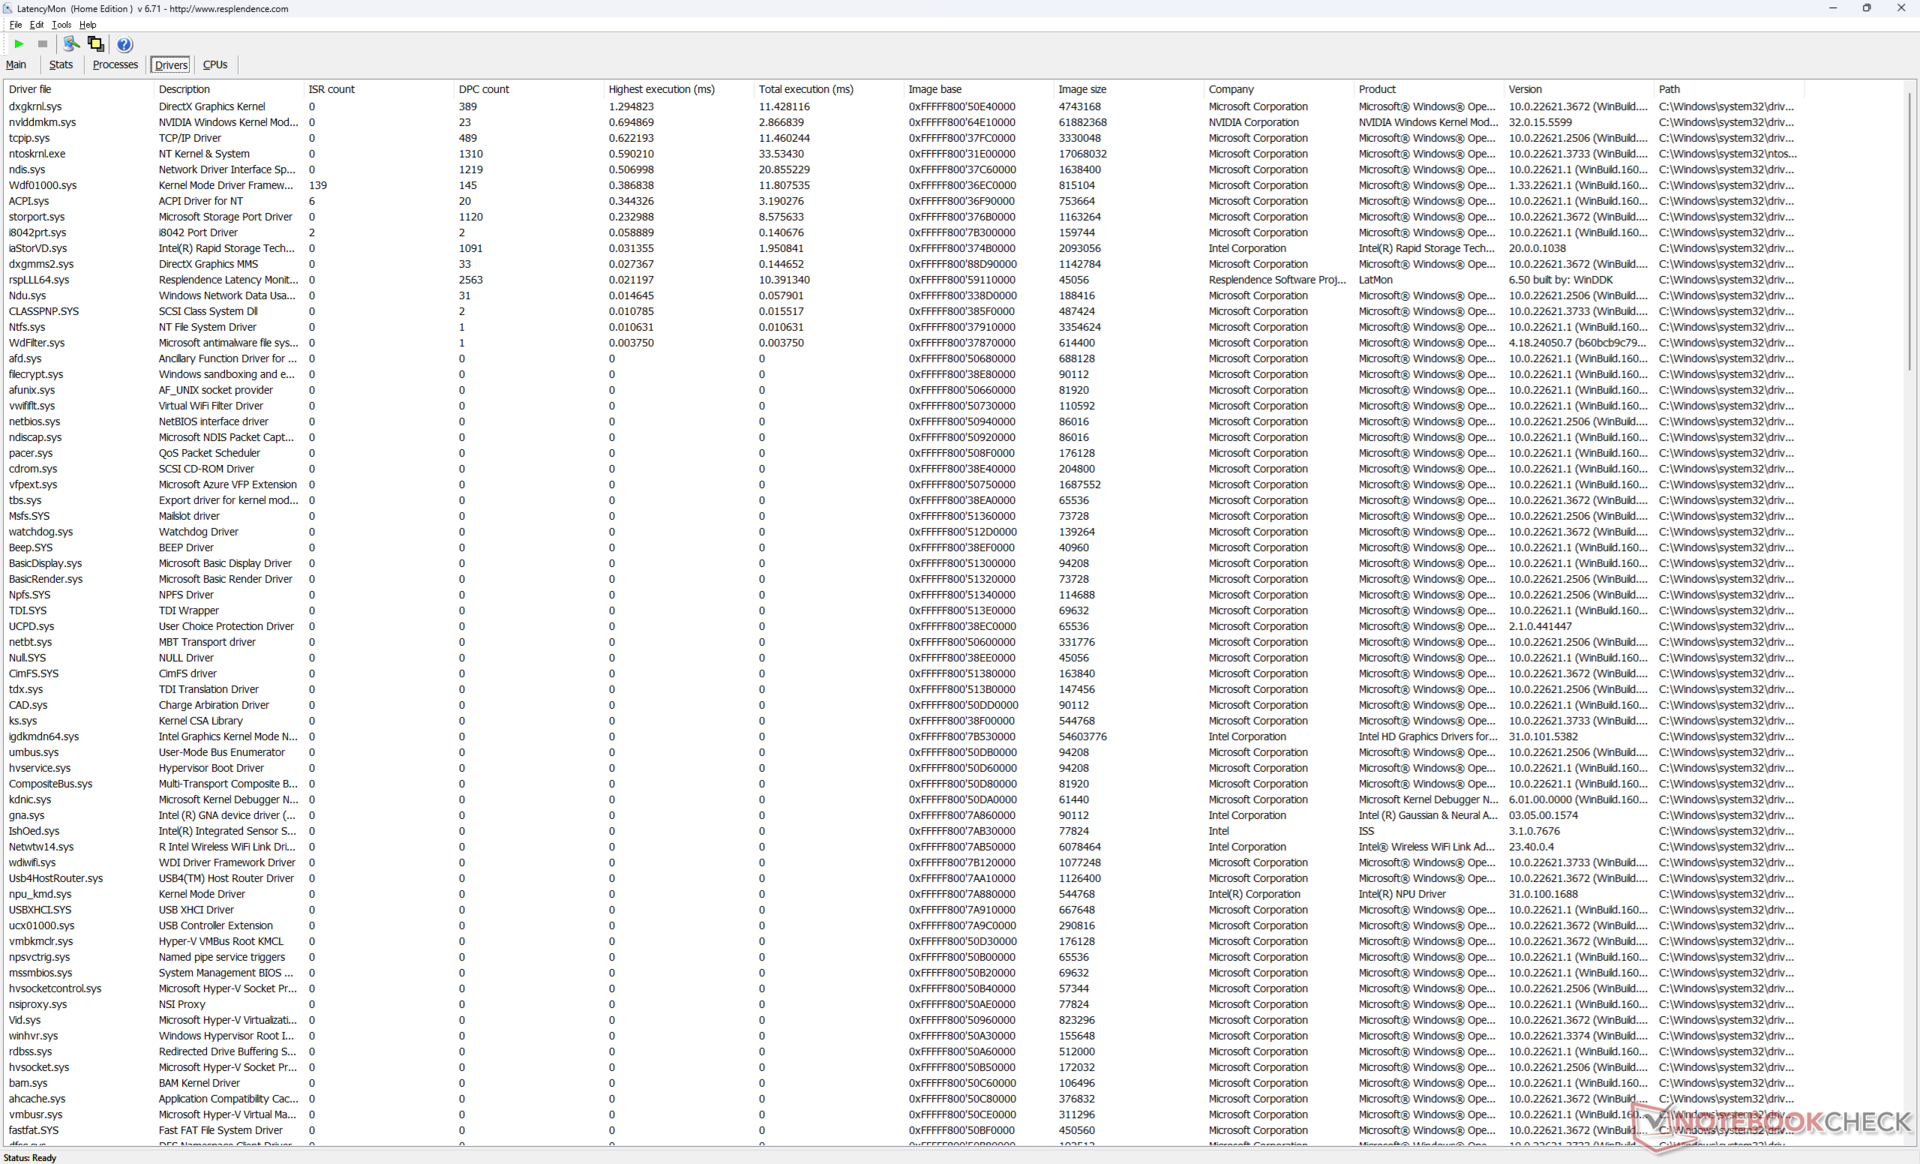
LatencyMon avslöjar endast mindre DPC-problem när du öppnar flera webbläsarflikar på vår hemsida. uppspelning av 4K-video med 60 FPS är annars perfekt utan några tappade bildrutor.
| DPC Latencies / LatencyMon - interrupt to process latency (max), Web, Youtube, Prime95 | |
| Lenovo Legion 5 16IRX G9 | |
| Asus VivoBook Pro 16 K6602VU | |
| Dell Inspiron 16 Plus 7630 | |
| Dell Inspiron 16 Plus 7620 | |
| Dell Inspiron 16 Plus 7640 | |
| Samsung Galaxy Book4 Ultra | |
* ... mindre är bättre
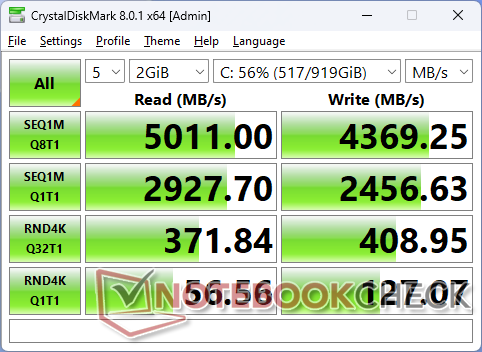
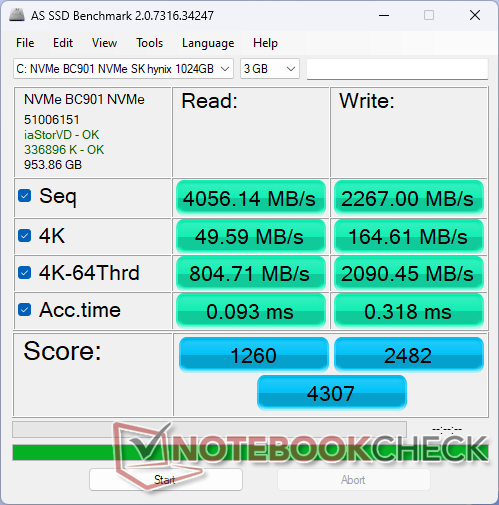
Lagringsenheter
Vår testenhet levereras med en långsammare SK Hynix-enhet istället för Western Digital-enheten på förra årets modell. SK Hynix-enheten är märkbart långsammare, vilket framgår av våra benchmarktester, men den lider inte av några problem med prestandastrypning, vilket ger stabilare överföringshastigheter överlag.

| Drive Performance Rating - Percent | |
| Lenovo Legion 5 16IRX G9 | |
| Samsung Galaxy Book4 Ultra | |
| Dell Inspiron 16 Plus 7630 | |
| Asus VivoBook Pro 16 K6602VU | |
| Dell Inspiron 16 Plus 7640 | |
| Dell Inspiron 16 Plus 7620 | |
* ... mindre är bättre
Disk Throttling: DiskSpd Read Loop, Queue Depth 8
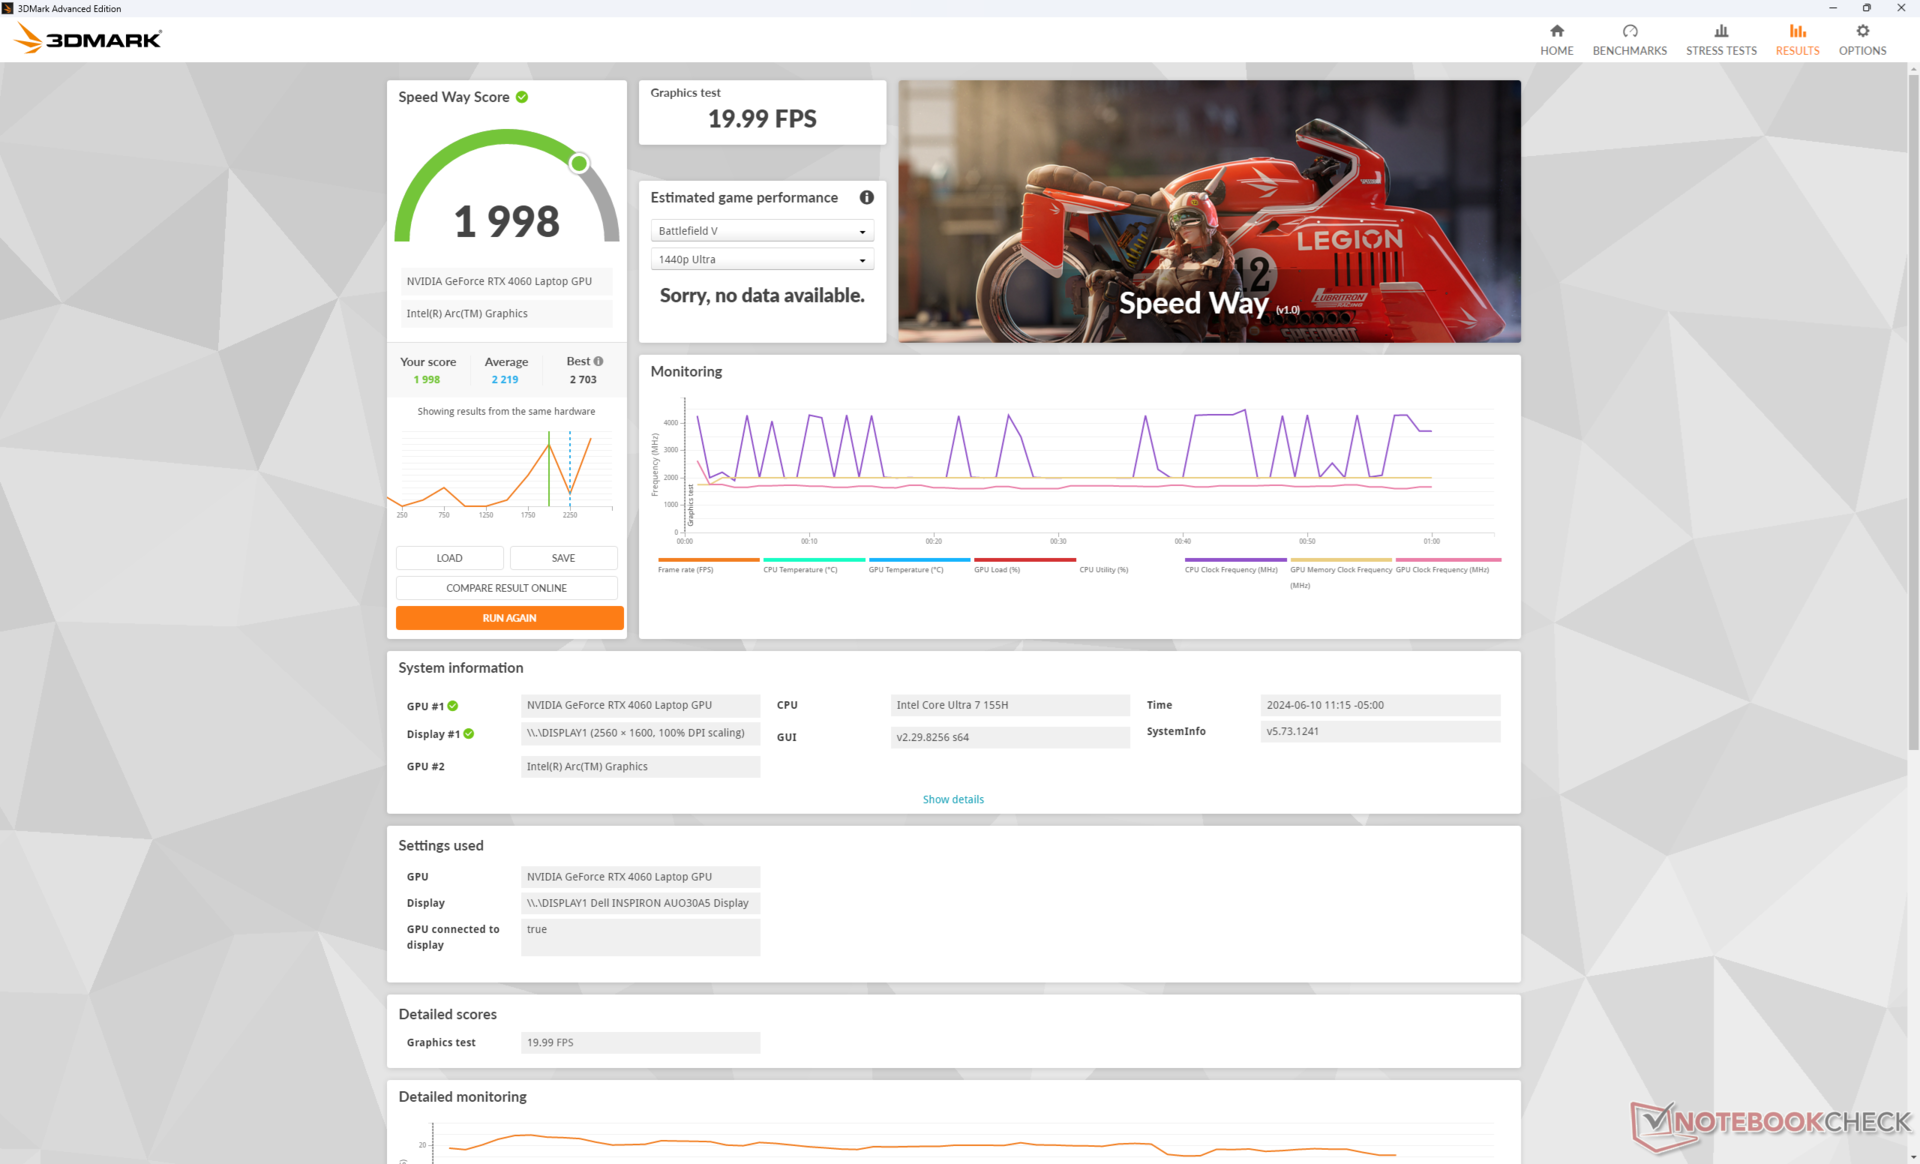
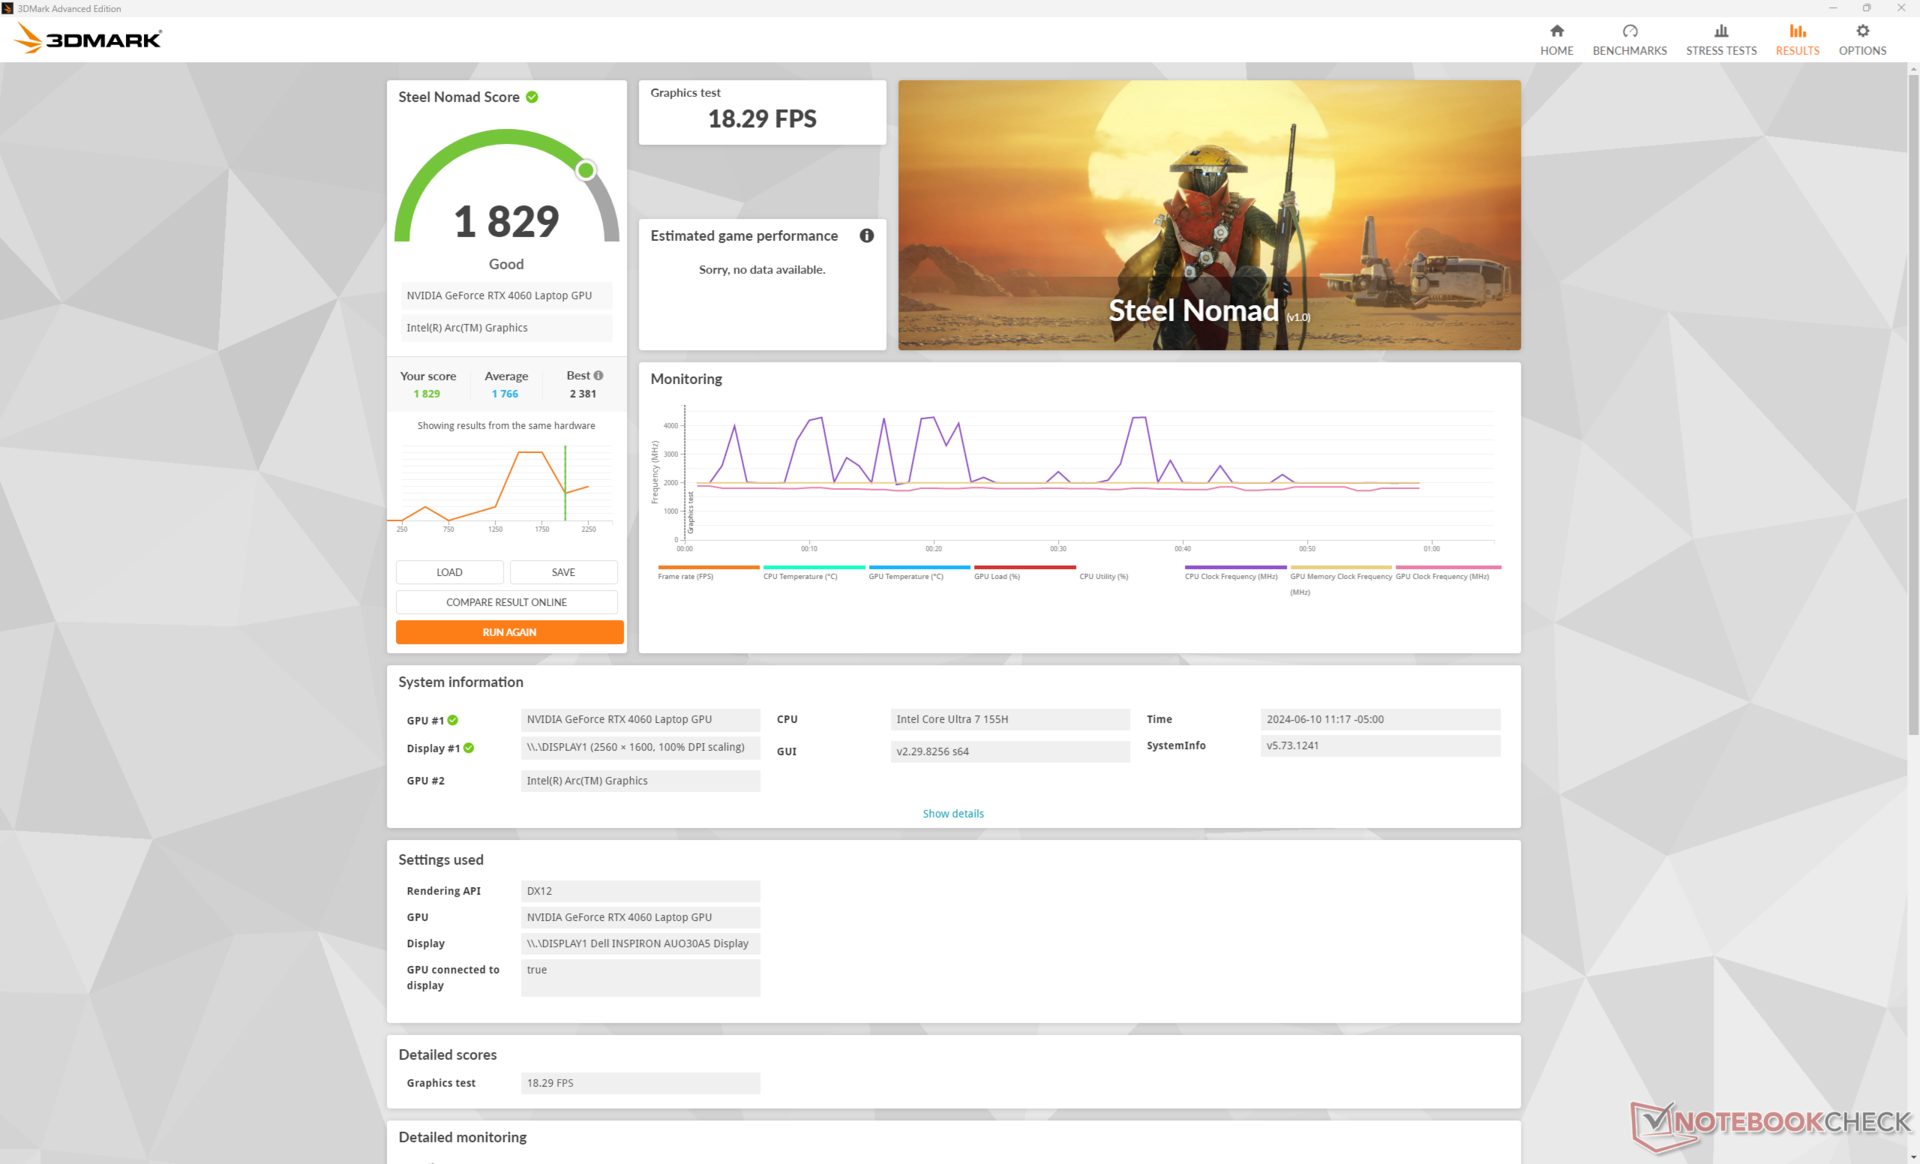
GPU-prestanda
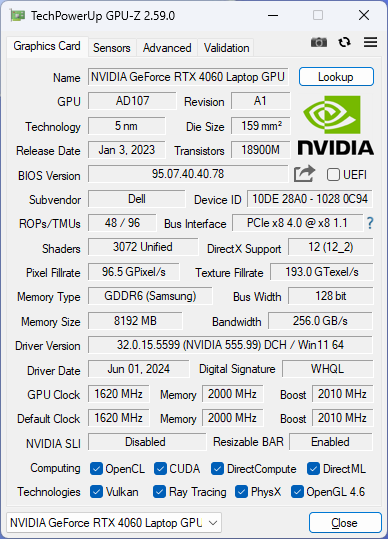
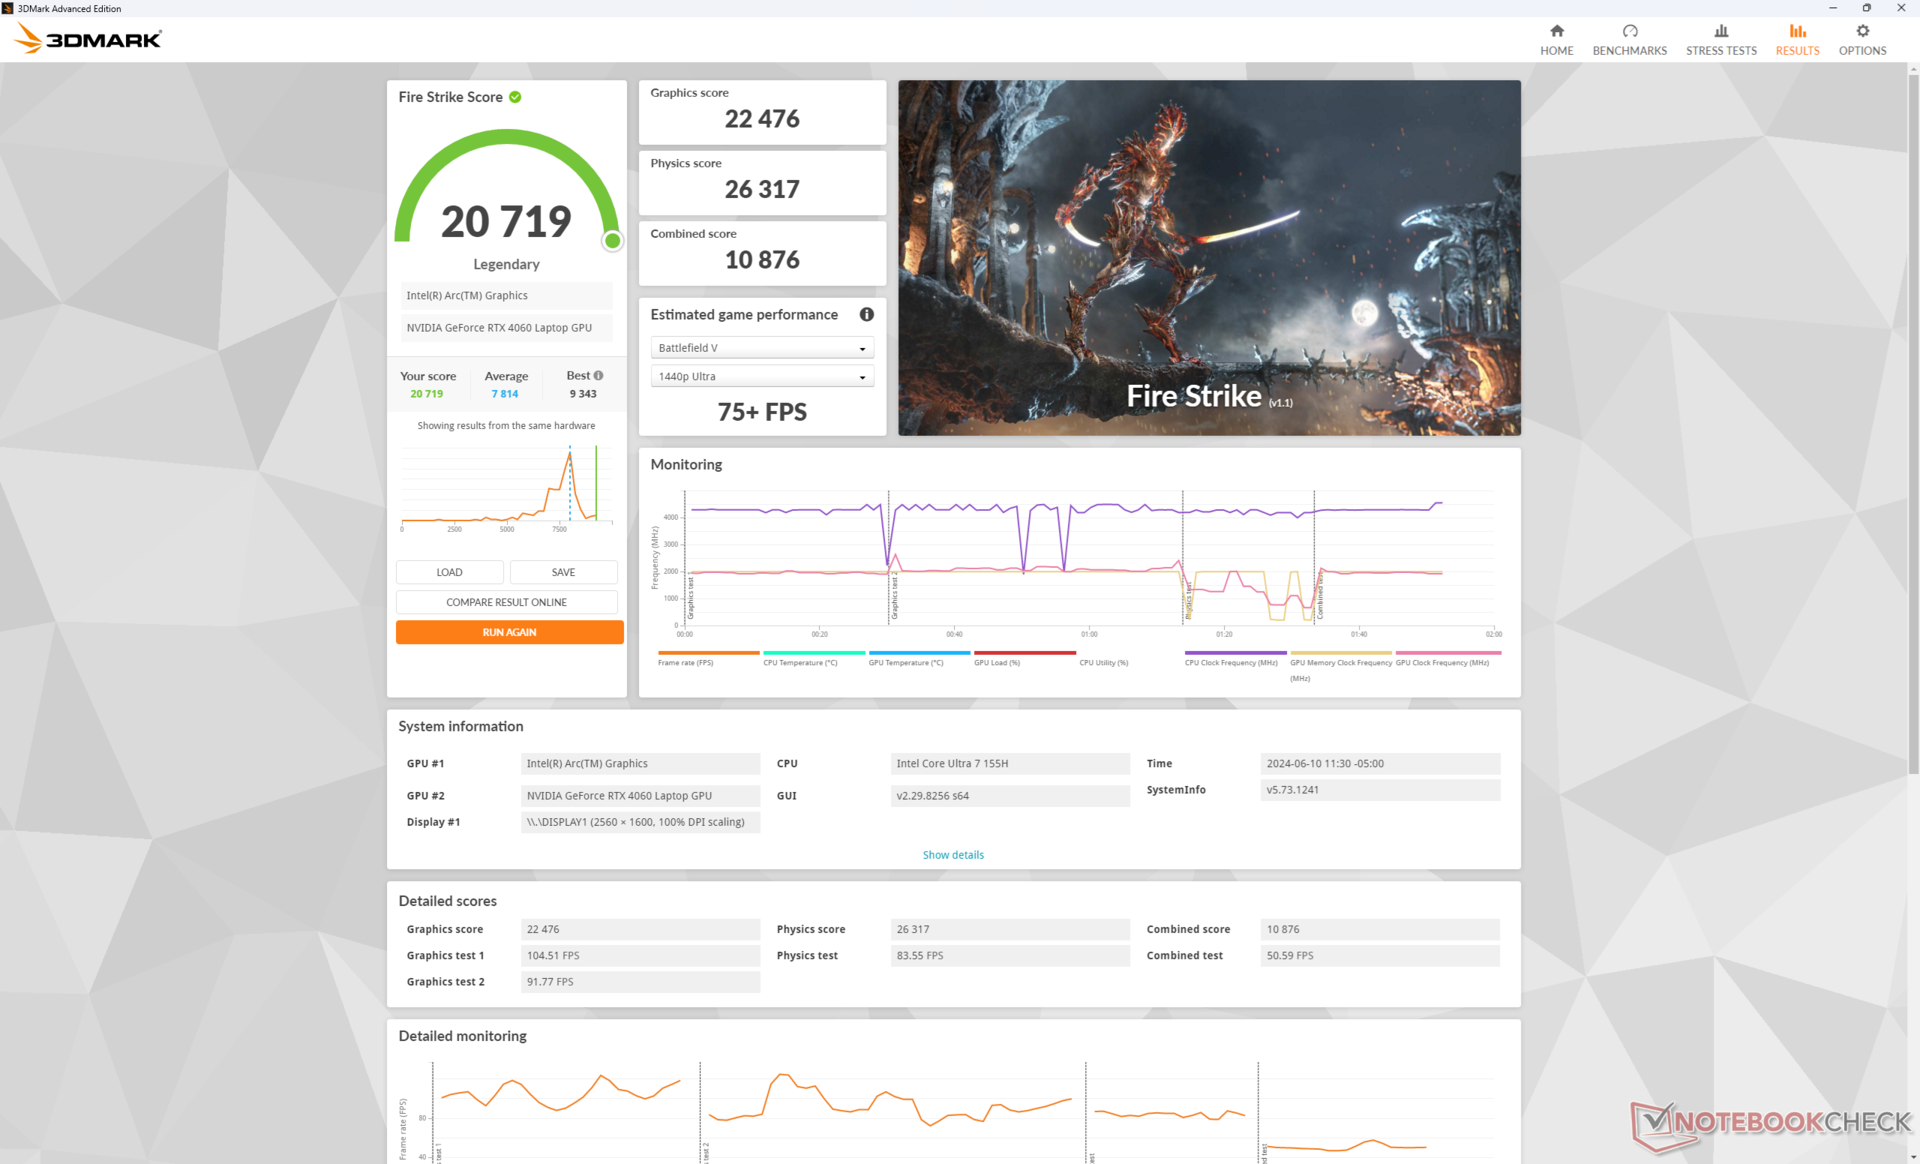
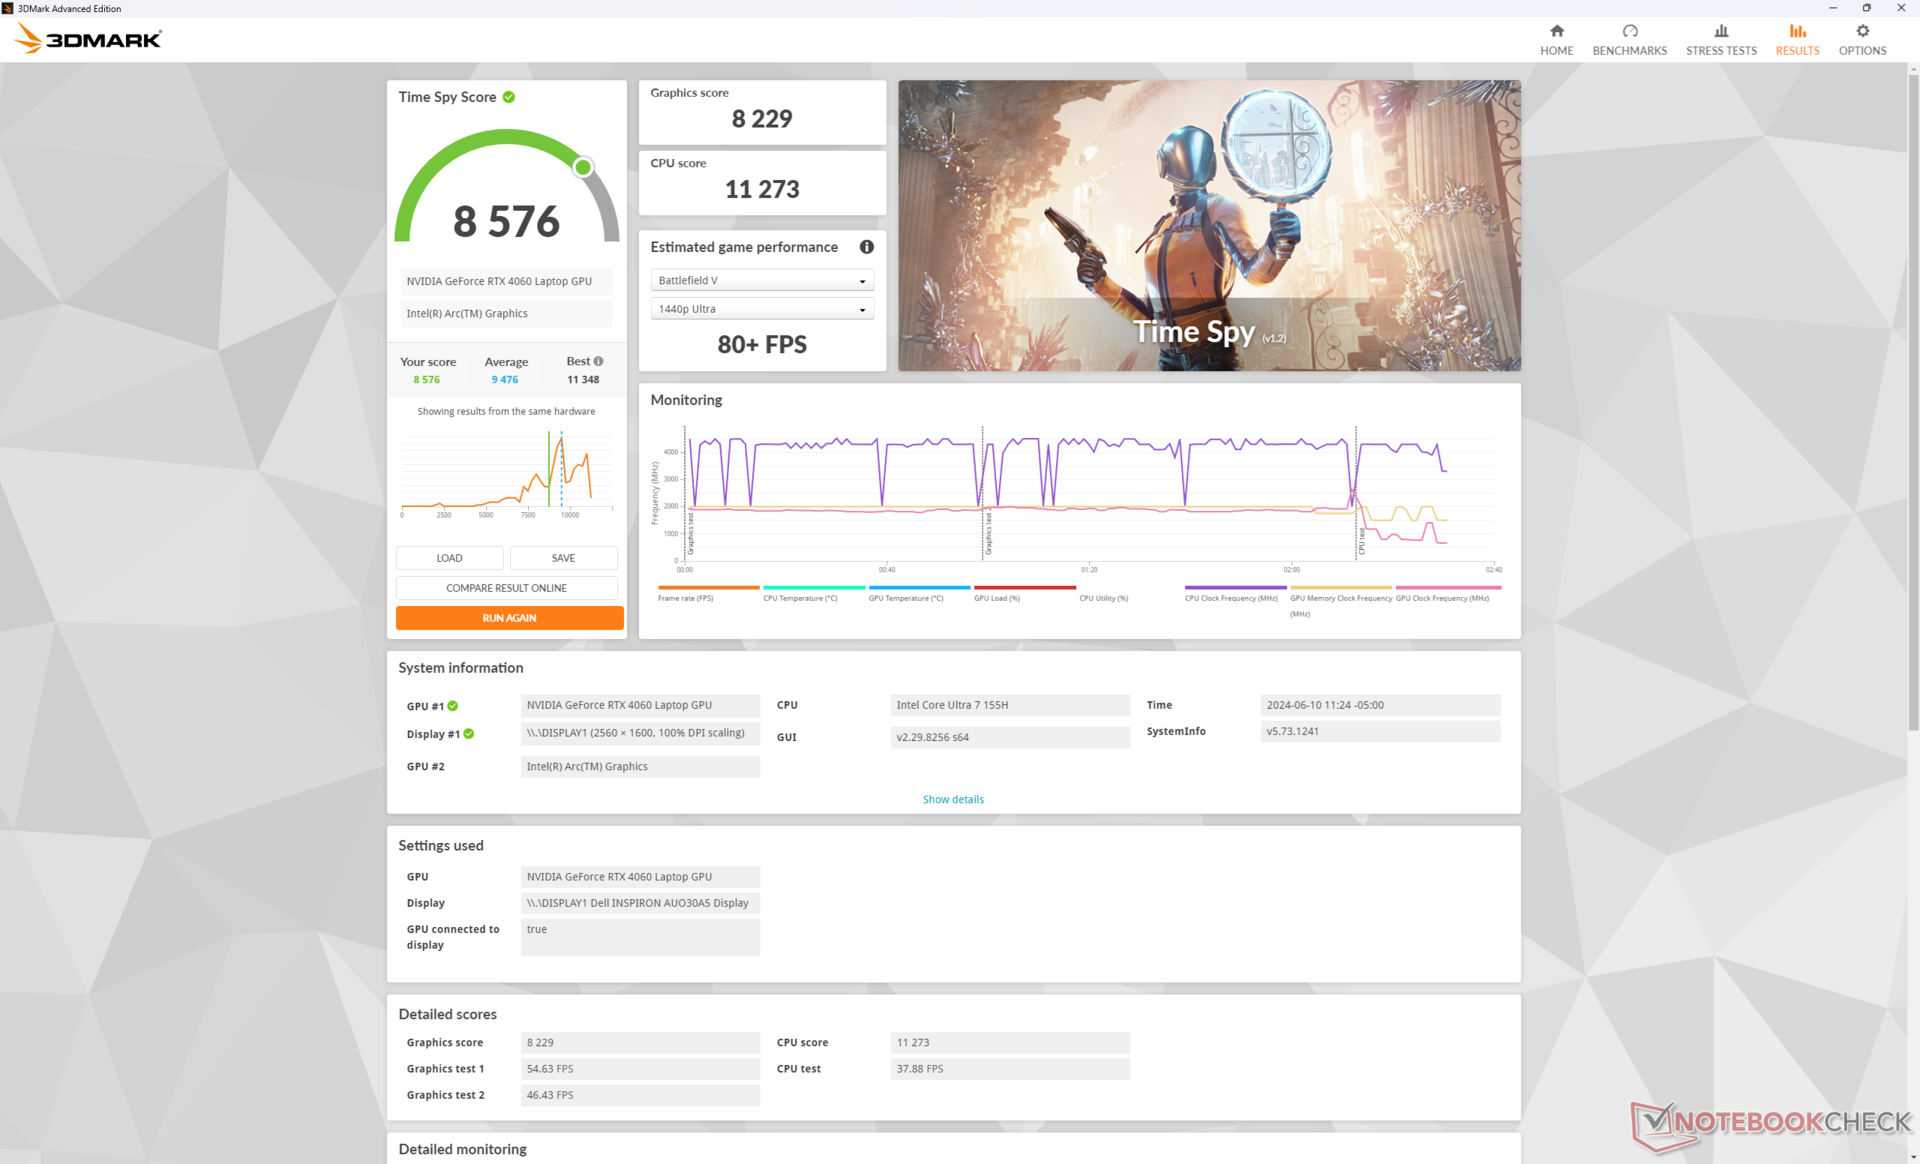
Nvidias GPU-alternativ förblir desamma med GeForce RTX 4050 och 4060 alternativ. 3DMark-resultaten är några procentenheter högre än tidigare, men detta kan tyvärr inte översättas till faktisk spelprestanda.
En nedgradering till RTX 4050 förväntas påverka prestandan med bara 10 procent. Att välja bort diskret grafik helt och hållet kommer att påverka prestandan mycket mer markant med 60 till 80 procent.
| Kraftprofil | Grafikpoäng | Fysikpoäng | Kombinerad poäng |
| Prestanda-läge | 22476 | 26317 | 10876 |
| Balanserat läge | 22542 (-0%) | 27226 (-0%) | 10829 (-0%) |
| Batteridrift | 21957 (-2%) | 26817 (-0%) | 9623 (-12%) |
Att köra i balanserat läge istället för prestandaläge verkar inte påverka prestandan på något betydande sätt, vilket framgår av vår resultattabell Fire Strike ovan. Även körning på batterier bevarar prestandan ganska bra.
| 3DMark 11 Performance | 21491 poäng | |
| 3DMark Fire Strike Score | 20719 poäng | |
| 3DMark Time Spy Score | 8576 poäng | |
| 3DMark Steel Nomad Score | 1829 poäng | |
Hjälp | ||
* ... mindre är bättre
Prestanda för spel
Prestanda i spel har inte förändrats och det kan till och med vara något sämre än tidigare. Final Fantasy XV kan till exempel köras 10 procent långsammare än på Inspiron 16 Plus 7630 och mindre underskott kan observeras på andra spel också, inklusive F1 22 och Strange Brigade.
| Performance Rating - Percent | |
| Lenovo Legion 5 16IRX G9 | |
| Dell Inspiron 16 Plus 7630 | |
| Dell Inspiron 16 Plus 7640 | |
| Asus VivoBook Pro 16 K6602VU | |
| Dell Inspiron 16 Plus 7620 -1! | |
| Samsung Galaxy Book4 Ultra | |
| The Witcher 3 - 1920x1080 Ultra Graphics & Postprocessing (HBAO+) | |
| Lenovo Legion 5 16IRX G9 | |
| Dell Inspiron 16 Plus 7630 | |
| Dell Inspiron 16 Plus 7640 | |
| Asus VivoBook Pro 16 K6602VU | |
| Dell Inspiron 16 Plus 7620 | |
| Samsung Galaxy Book4 Ultra | |
| Final Fantasy XV Benchmark - 1920x1080 High Quality | |
| Lenovo Legion 5 16IRX G9 | |
| Dell Inspiron 16 Plus 7630 | |
| Dell Inspiron 16 Plus 7640 | |
| Asus VivoBook Pro 16 K6602VU | |
| Samsung Galaxy Book4 Ultra | |
| Dell Inspiron 16 Plus 7620 | |
| Strange Brigade - 1920x1080 ultra AA:ultra AF:16 | |
| Lenovo Legion 5 16IRX G9 | |
| Dell Inspiron 16 Plus 7630 | |
| Dell Inspiron 16 Plus 7640 | |
| Asus VivoBook Pro 16 K6602VU | |
| Samsung Galaxy Book4 Ultra | |
| Dell Inspiron 16 Plus 7620 | |
| Dota 2 Reborn - 1920x1080 ultra (3/3) best looking | |
| Lenovo Legion 5 16IRX G9 | |
| Dell Inspiron 16 Plus 7630 | |
| Dell Inspiron 16 Plus 7620 | |
| Dell Inspiron 16 Plus 7640 | |
| Samsung Galaxy Book4 Ultra | |
| Asus VivoBook Pro 16 K6602VU | |
| X-Plane 11.11 - 1920x1080 high (fps_test=3) | |
| Lenovo Legion 5 16IRX G9 | |
| Dell Inspiron 16 Plus 7630 | |
| Asus VivoBook Pro 16 K6602VU | |
| Dell Inspiron 16 Plus 7620 | |
| Dell Inspiron 16 Plus 7640 | |
| Samsung Galaxy Book4 Ultra | |
| Far Cry 5 - 1920x1080 Ultra Preset AA:T | |
| Lenovo Legion 5 16IRX G9 | |
| Dell Inspiron 16 Plus 7640 | |
| Asus VivoBook Pro 16 K6602VU | |
| Dell Inspiron 16 Plus 7630 | |
| Samsung Galaxy Book4 Ultra | |
| Cyberpunk 2077 2.2 Phantom Liberty | |
| 1920x1080 Low Preset (FSR off) | |
| Lenovo Legion 5 16IRX G9 | |
| Genomsnitt NVIDIA GeForce RTX 4060 Laptop GPU (96.7 - 136.1, n=22) | |
| Framework Laptop 16 | |
| Dell Inspiron 16 Plus 7640 | |
| Lenovo Yoga 7 2-in-1 16IML9 | |
| 1920x1080 Medium Preset (FSR off) | |
| Lenovo Legion 5 16IRX G9 | |
| Genomsnitt NVIDIA GeForce RTX 4060 Laptop GPU (77.7 - 110.4, n=23) | |
| Dell Inspiron 16 Plus 7640 | |
| Framework Laptop 16 | |
| Lenovo Yoga 7 2-in-1 16IML9 | |
| 1920x1080 High Preset (FSR off) | |
| Lenovo Legion 5 16IRX G9 | |
| Genomsnitt NVIDIA GeForce RTX 4060 Laptop GPU (65.2 - 102, n=26) | |
| Dell Inspiron 16 Plus 7640 | |
| Framework Laptop 16 | |
| Lenovo Yoga 7 2-in-1 16IML9 | |
| 1920x1080 Ultra Preset (FSR off) | |
| Lenovo Legion 5 16IRX G9 | |
| Genomsnitt NVIDIA GeForce RTX 4060 Laptop GPU (56.4 - 93.1, n=31) | |
| Framework Laptop 16 | |
| Dell Inspiron 16 Plus 7640 | |
| Lenovo Yoga 7 2-in-1 16IML9 | |
| 2560x1440 Ultra Preset (FSR off) | |
| Lenovo Legion 5 16IRX G9 | |
| Genomsnitt NVIDIA GeForce RTX 4060 Laptop GPU (32.9 - 51.8, n=19) | |
| Framework Laptop 16 | |
| Dell Inspiron 16 Plus 7640 | |
Witcher 3 FPS Chart
| låg | med. | hög | ultra | QHD | |
|---|---|---|---|---|---|
| The Witcher 3 (2015) | 375.8 | 276.8 | 160.3 | 84.1 | 61.9 |
| Dota 2 Reborn (2015) | 173.5 | 152.1 | 143.2 | 135.1 | |
| Final Fantasy XV Benchmark (2018) | 137.6 | 98.4 | 78.8 | 58.8 | |
| X-Plane 11.11 (2018) | 123.7 | 109 | 86.5 | ||
| Far Cry 5 (2018) | 138 | 125 | 118 | 110 | 83 |
| Strange Brigade (2018) | 360 | 225 | 178.1 | 153.5 | 105.2 |
| Tiny Tina's Wonderlands (2022) | 177.4 | 116 | 91.9 | 71.1 | 48 |
| F1 22 (2022) | 197 | 184.3 | 151.3 | 51.8 | 32.1 |
| Baldur's Gate 3 (2023) | 111.1 | 93.2 | 82.4 | 76.7 | 53.2 |
| Cyberpunk 2077 2.2 Phantom Liberty (2023) | 96.8 | 83.1 | 69.9 | 59.8 | 36.8 |
Utsläpp
Systemljud - högt när du spelar
De interna fläktarna är tystare under längre tid än på förra årets modell. När man kör 3DMark 06, till exempel, ligger fläktljudet runt 29 dB(A) i slutet av den första benchmark-scenen medan Inspiron 16 Plus 7630 blir mycket högre med 35 dB(A). De två bärbara datorerna stabiliserar sig annars på över 50 dB(A) vardera när de kör mer krävande belastningar som spel under en längre tidsperiod.
Ljudnivå
| Låg belastning |
| 24.2 / 24.2 / 24.2 dB(A) |
| Hög belastning |
| 28.9 / 51 dB(A) |
 | ||
30 dB tyst 40 dB(A) hörbar 50 dB(A) högt ljud |
||
min: | ||
| Dell Inspiron 16 Plus 7640 NVIDIA GeForce RTX 4060 Laptop GPU, Ultra 7 155H, SK hynix BC901 HFS001TEJ4X164N | Dell Inspiron 16 Plus 7630 NVIDIA GeForce RTX 4060 Laptop GPU, i7-13700H, WD PC SN740 SDDPTQD-1T00 | Dell Inspiron 16 Plus 7620 GeForce RTX 3050 Ti Laptop GPU, i7-12700H, Kioxia BG5 KBG50ZNS512G | Samsung Galaxy Book4 Ultra NVIDIA GeForce RTX 4050 Laptop GPU, Ultra 7 155H, Samsung PM9A1 MZVL2512HCJQ | Lenovo Legion 5 16IRX G9 NVIDIA GeForce RTX 4060 Laptop GPU, i7-14650HX, Samsung PM9A1 MZVL21T0HCLR | Asus VivoBook Pro 16 K6602VU NVIDIA GeForce RTX 4050 Laptop GPU, i9-13900H, Micron 2400 MTFDKBA1T0QFM | |
|---|---|---|---|---|---|---|
| Noise | -2% | -13% | 0% | -17% | -11% | |
| av / miljö * | 23.8 | 23.2 3% | 23.3 2% | 24.2 -2% | 24 -1% | 20.96 12% |
| Idle Minimum * | 24.2 | 23.2 4% | 25.7 -6% | 24.2 -0% | 24 1% | 25.28 -4% |
| Idle Average * | 24.2 | 23.2 4% | 26.1 -8% | 24.2 -0% | 28.8 -19% | 25.28 -4% |
| Idle Maximum * | 24.2 | 23.2 4% | 30.6 -26% | 24.2 -0% | 32 -32% | 25.28 -4% |
| Load Average * | 28.9 | 35.1 -21% | 46.2 -60% | 37.9 -31% | 45.5 -57% | 51.88 -80% |
| Witcher 3 ultra * | 51 | 52.5 -3% | 49.2 4% | 41.7 18% | 53.1 -4% | 49 4% |
| Load Maximum * | 51 | 52.5 -3% | 49.4 3% | 41.7 18% | 55.7 -9% | 51.8 -2% |
* ... mindre är bättre
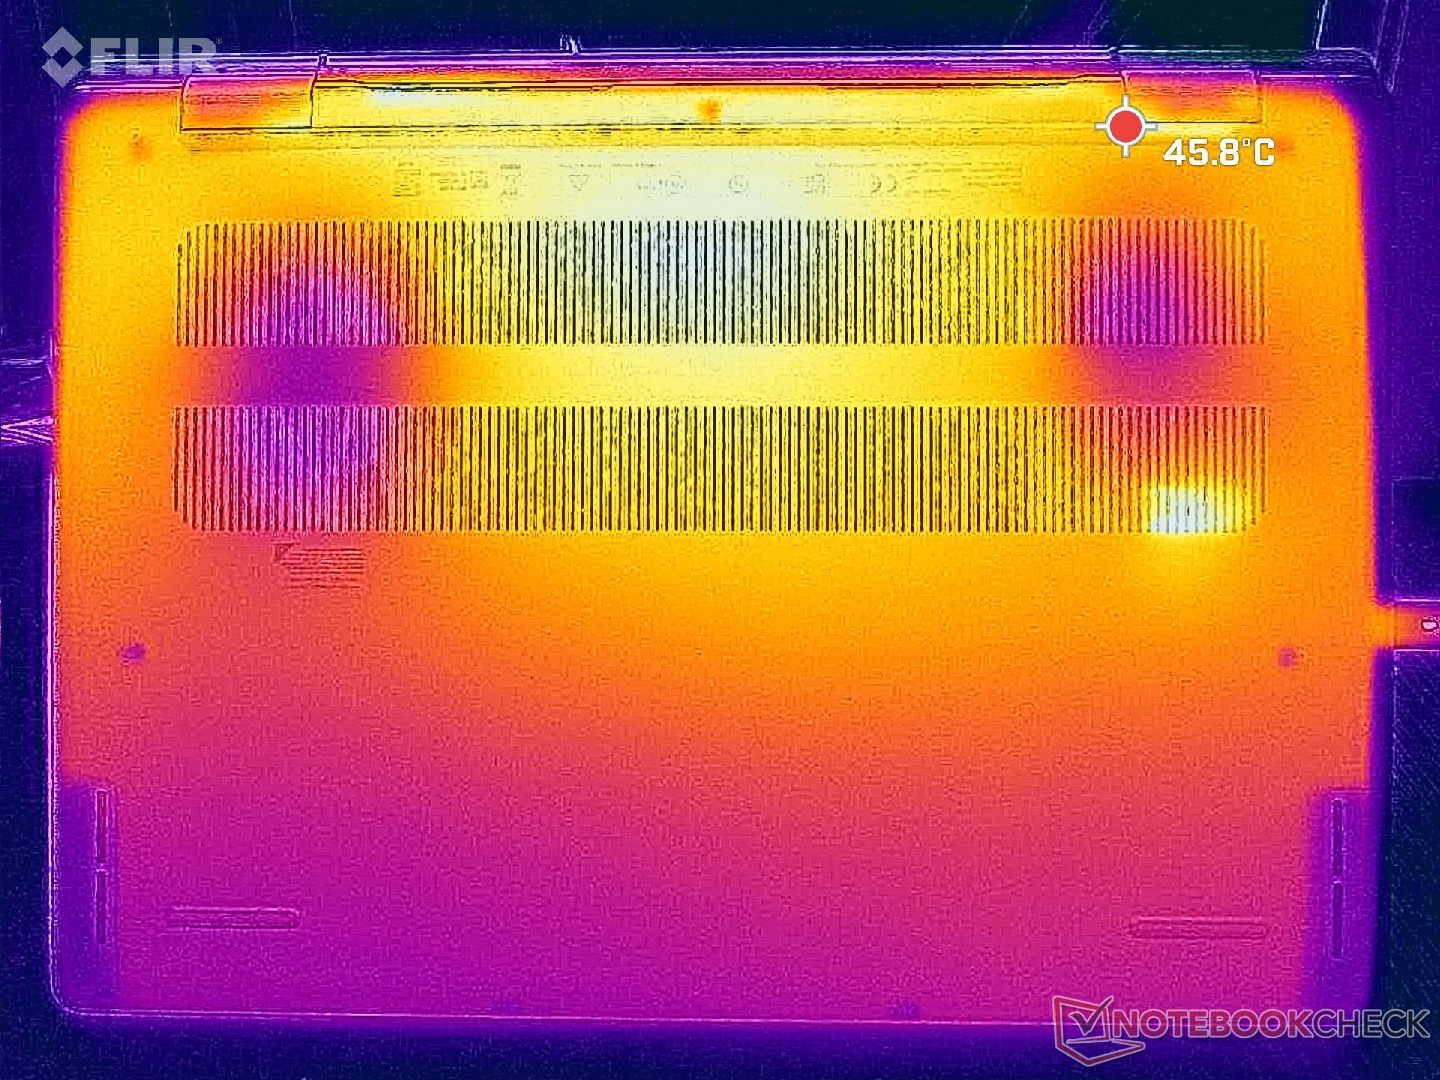
Temperatur
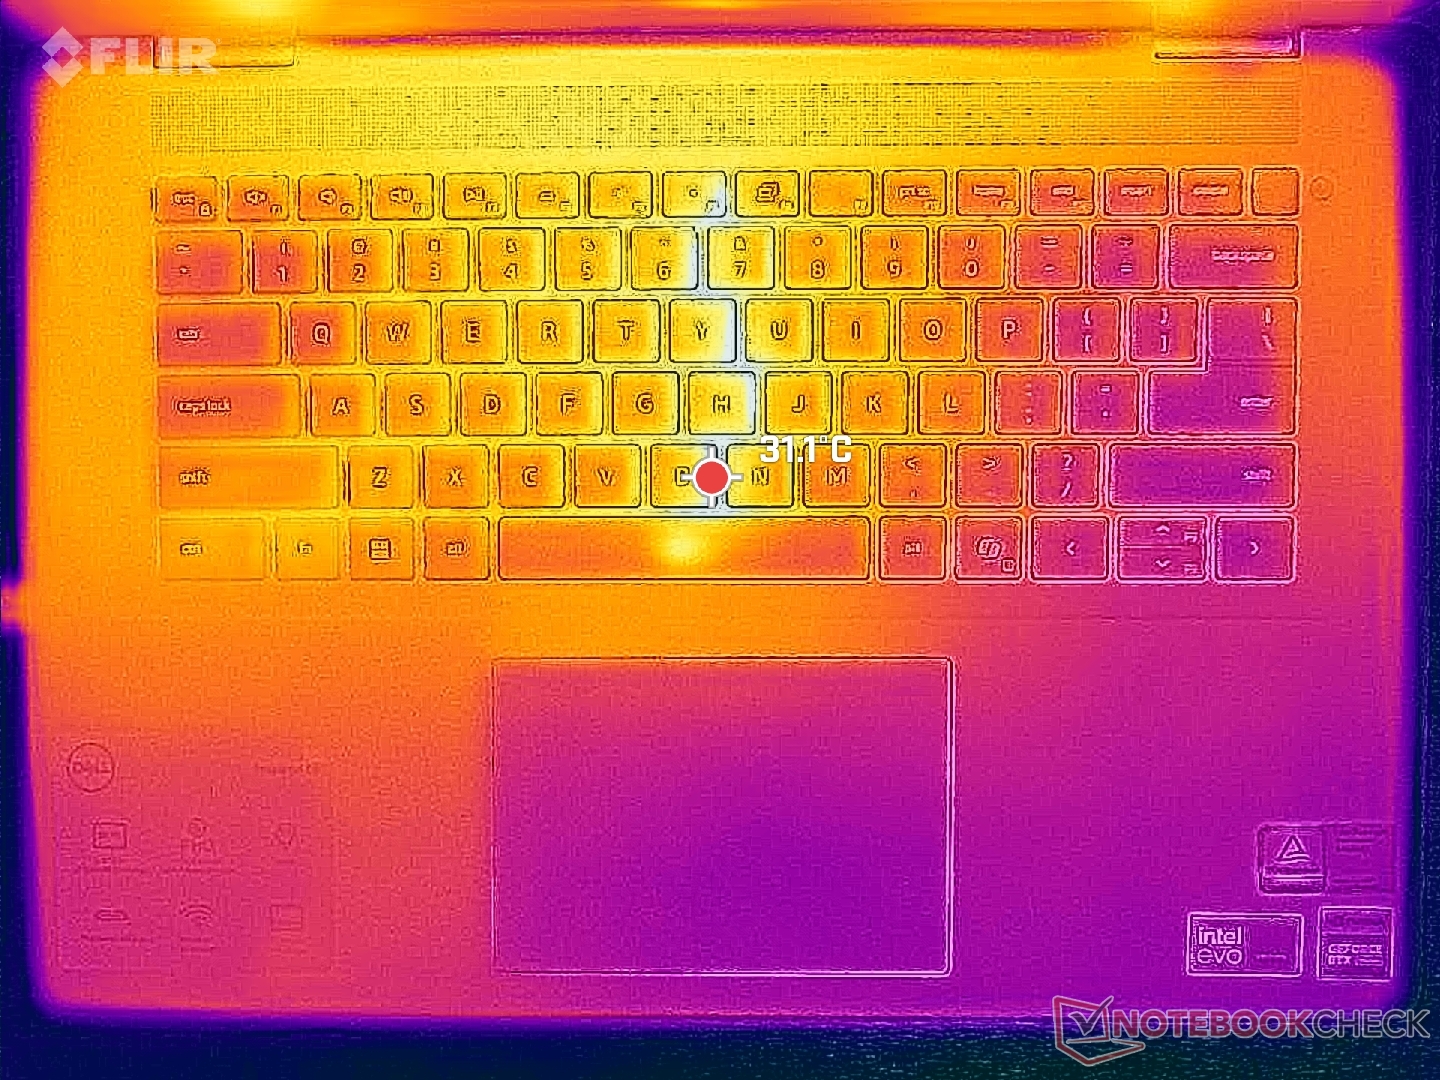
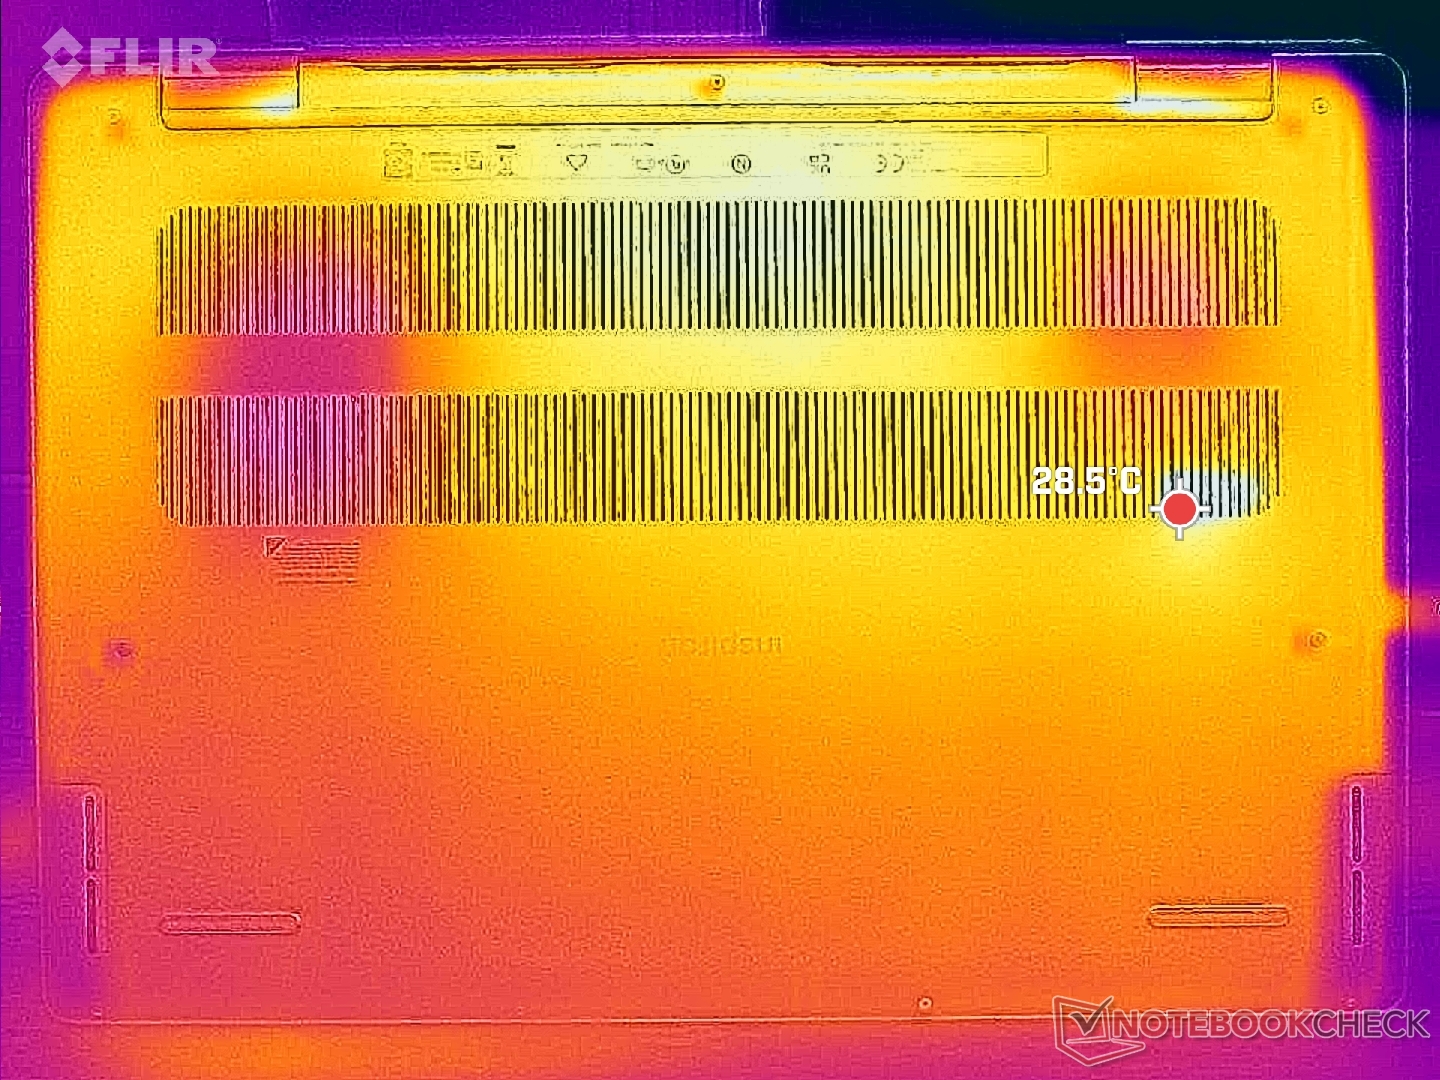
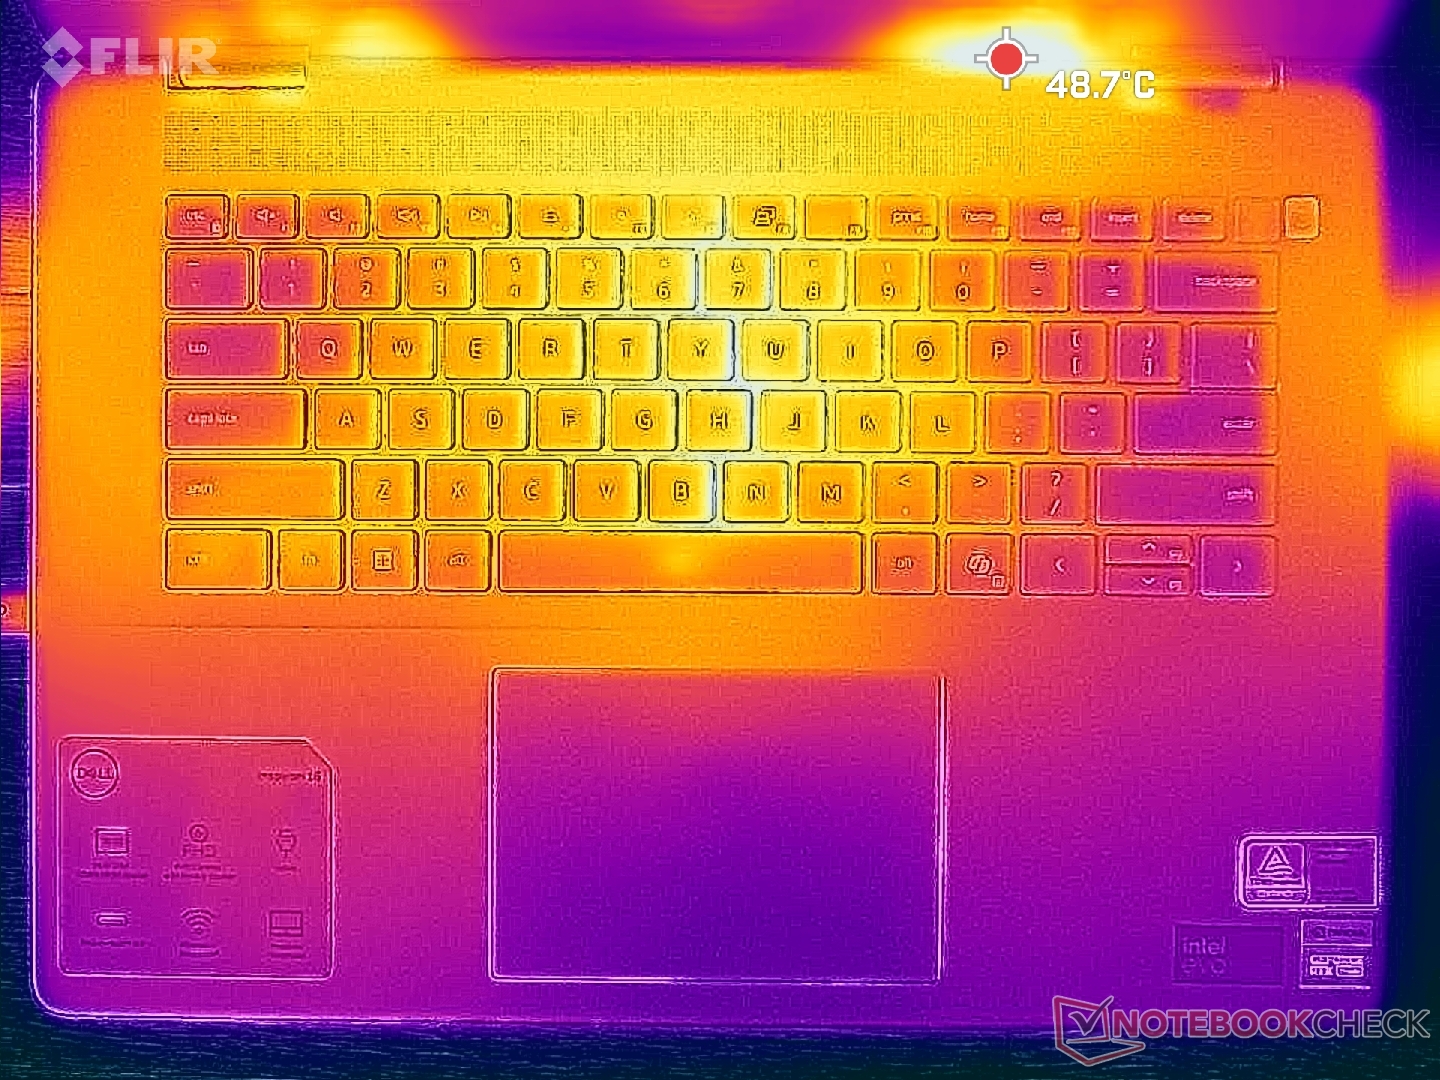
Yttemperaturerna kan bli ganska varma trots de många ventilationsgallren längs kanterna. Hot spots vid spelande kan nå 43 C på både C- och D-locket på chassit för att vara jämförbart med Lenovo Legion 5i 16 G9 bärbar dator för spel.
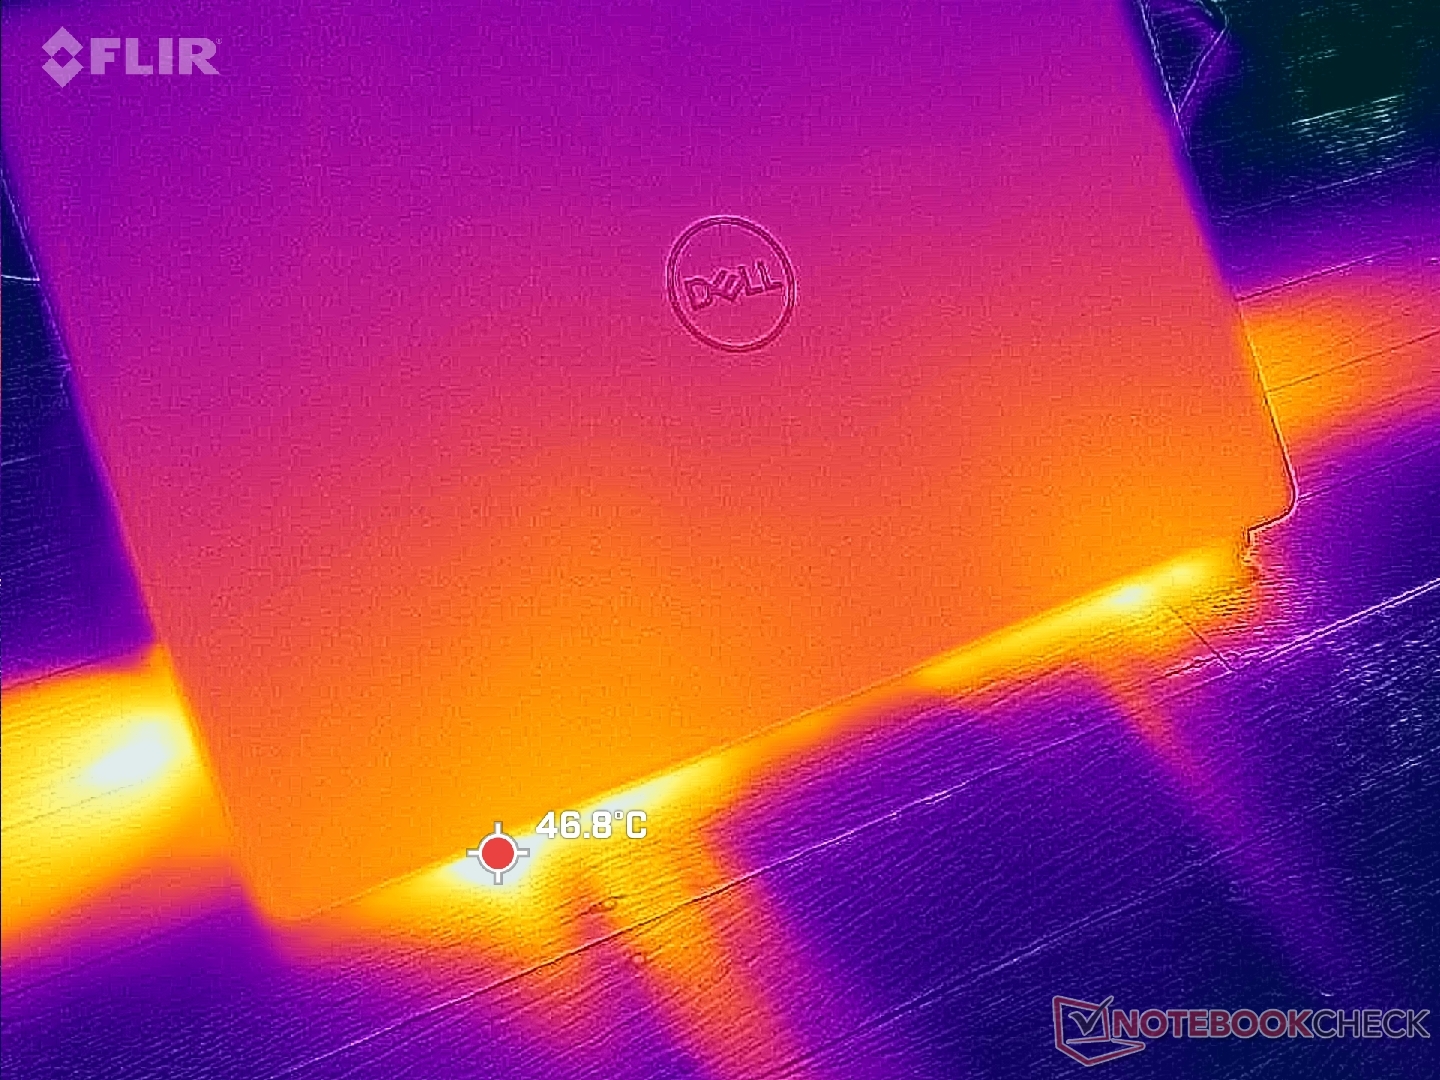
(±) Den maximala temperaturen på ovansidan är 43.4 °C / 110 F, jämfört med genomsnittet av 36.9 °C / 98 F , allt från 21.1 till 71 °C för klassen Multimedia.
(±) Botten värms upp till maximalt 41.6 °C / 107 F, jämfört med genomsnittet av 39.2 °C / 103 F
(+) Vid tomgångsbruk är medeltemperaturen för ovansidan 29.9 °C / 86 F, jämfört med enhetsgenomsnittet på 31.3 °C / ### class_avg_f### F.
(+) Handledsstöden och pekplattan når maximal hudtemperatur (35.2 °C / 95.4 F) och är därför inte varma.
(-) Medeltemperaturen för handledsstödsområdet på liknande enheter var 28.8 °C / 83.8 F (-6.4 °C / -11.6 F).
| Dell Inspiron 16 Plus 7640 Intel Core Ultra 7 155H, NVIDIA GeForce RTX 4060 Laptop GPU | Dell Inspiron 16 Plus 7630 Intel Core i7-13700H, NVIDIA GeForce RTX 4060 Laptop GPU | Dell Inspiron 16 Plus 7620 Intel Core i7-12700H, NVIDIA GeForce RTX 3050 Ti Laptop GPU | Samsung Galaxy Book4 Ultra Intel Core Ultra 7 155H, NVIDIA GeForce RTX 4050 Laptop GPU | Lenovo Legion 5 16IRX G9 Intel Core i7-14650HX, NVIDIA GeForce RTX 4060 Laptop GPU | Asus VivoBook Pro 16 K6602VU Intel Core i9-13900H, NVIDIA GeForce RTX 4050 Laptop GPU | |
|---|---|---|---|---|---|---|
| Heat | -7% | -0% | 17% | 0% | -14% | |
| Maximum Upper Side * | 43.4 | 47.8 -10% | 46 -6% | 38.5 11% | 40.4 7% | 42.6 2% |
| Maximum Bottom * | 41.6 | 42.2 -1% | 45.8 -10% | 41.2 1% | 43.8 -5% | 48.4 -16% |
| Idle Upper Side * | 32.8 | 35.2 -7% | 29.2 11% | 23.5 28% | 30.3 8% | 39.4 -20% |
| Idle Bottom * | 32.4 | 35 -8% | 31 4% | 24.1 26% | 35.3 -9% | 39.8 -23% |
* ... mindre är bättre
Högtalare
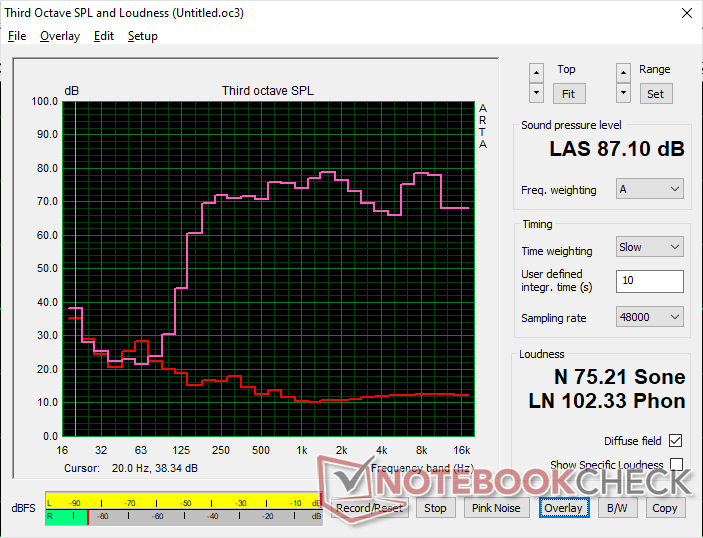
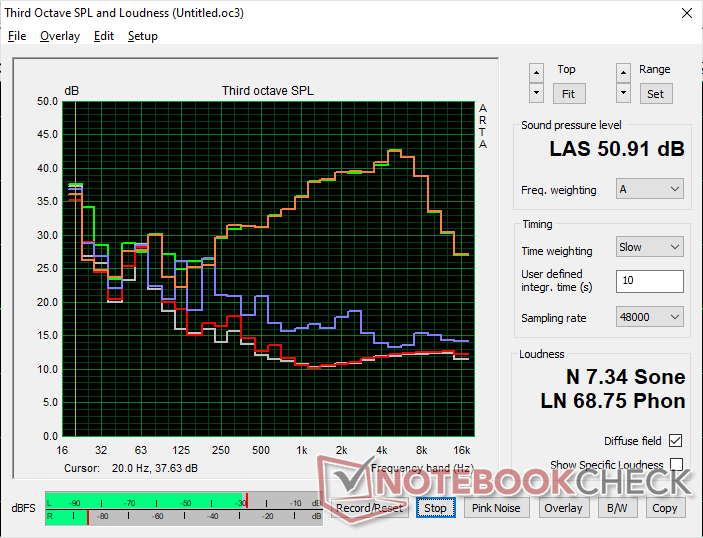
Dell Inspiron 16 Plus 7640 ljudanalys
(+) | högtalare kan spela relativt högt (87.1 dB)
Bas 100 - 315 Hz
(±) | reducerad bas - i genomsnitt 13.9% lägre än medianen
(±) | linjäriteten för basen är genomsnittlig (13.7% delta till föregående frekvens)
Mellan 400 - 2000 Hz
(+) | balanserad mellan - endast 3.6% från medianen
(+) | mids är linjära (3.4% delta till föregående frekvens)
Högsta 2 - 16 kHz
(+) | balanserade toppar - endast 4.3% från medianen
(+) | toppar är linjära (5.7% delta till föregående frekvens)
Totalt 100 - 16 000 Hz
(+) | det totala ljudet är linjärt (11.3% skillnad mot median)
Jämfört med samma klass
» 13% av alla testade enheter i den här klassen var bättre, 4% liknande, 83% sämre
» Den bästa hade ett delta på 5%, genomsnittet var 18%, sämst var 45%
Jämfört med alla testade enheter
» 6% av alla testade enheter var bättre, 2% liknande, 92% sämre
» Den bästa hade ett delta på 4%, genomsnittet var 24%, sämst var 134%
Apple MacBook Pro 16 2021 M1 Pro ljudanalys
(+) | högtalare kan spela relativt högt (84.7 dB)
Bas 100 - 315 Hz
(+) | bra bas - bara 3.8% från medianen
(+) | basen är linjär (5.2% delta till föregående frekvens)
Mellan 400 - 2000 Hz
(+) | balanserad mellan - endast 1.3% från medianen
(+) | mids är linjära (2.1% delta till föregående frekvens)
Högsta 2 - 16 kHz
(+) | balanserade toppar - endast 1.9% från medianen
(+) | toppar är linjära (2.7% delta till föregående frekvens)
Totalt 100 - 16 000 Hz
(+) | det totala ljudet är linjärt (4.6% skillnad mot median)
Jämfört med samma klass
» 0% av alla testade enheter i den här klassen var bättre, 0% liknande, 100% sämre
» Den bästa hade ett delta på 5%, genomsnittet var 18%, sämst var 45%
Jämfört med alla testade enheter
» 0% av alla testade enheter var bättre, 0% liknande, 100% sämre
» Den bästa hade ett delta på 4%, genomsnittet var 24%, sämst var 134%
Energiförvaltning
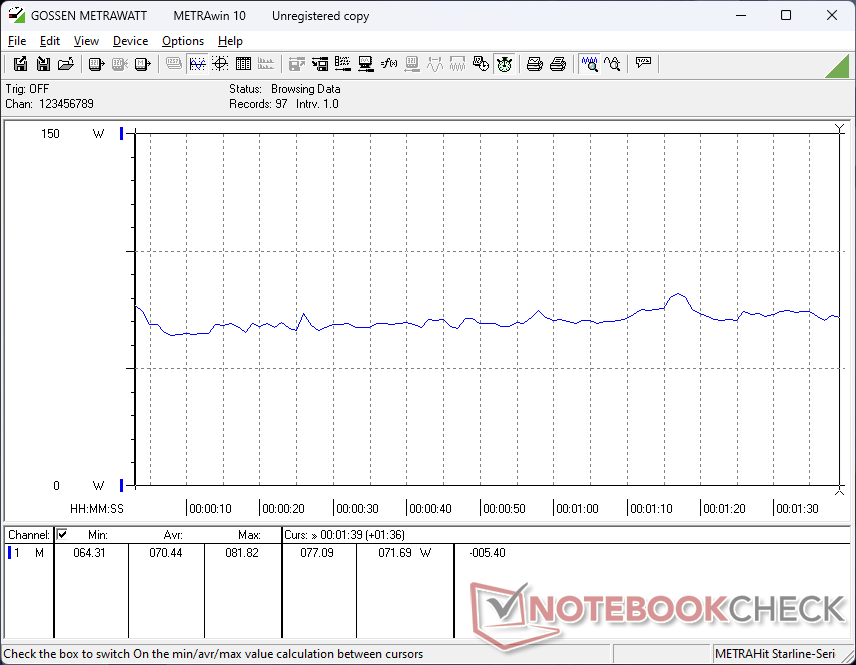
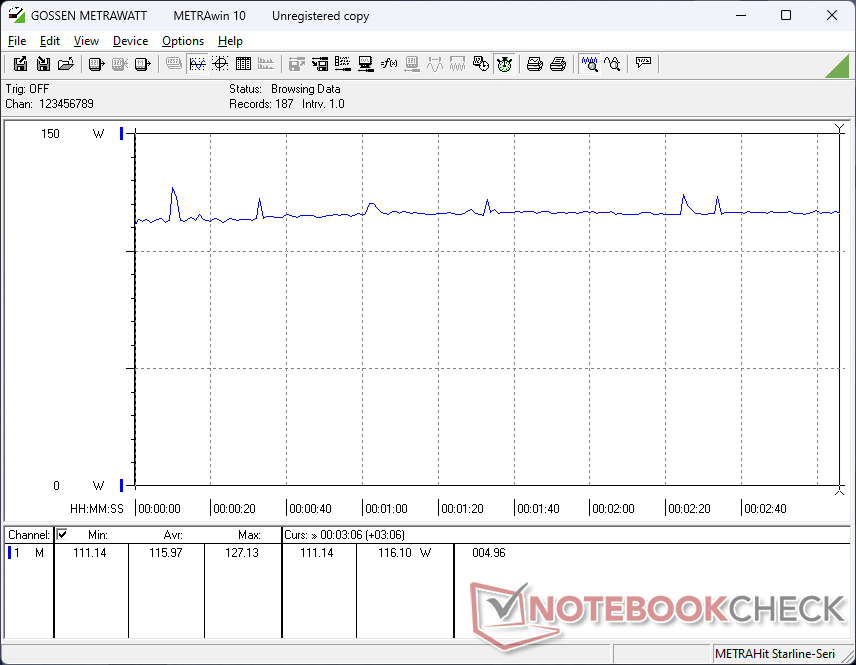
Strömförbrukning
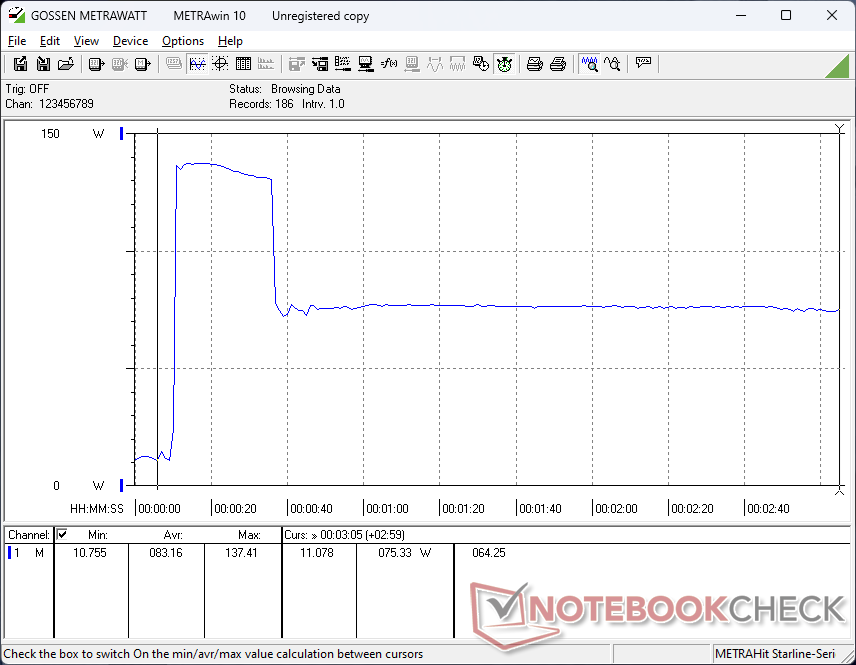
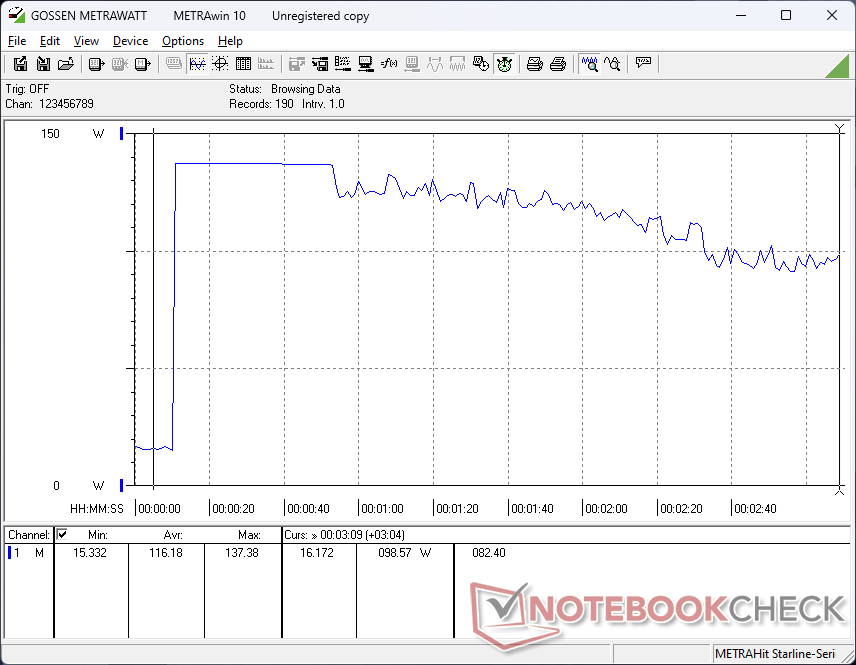
Strömförbrukningen är märkbart lägre än på förra årets modell vid tomgångskörning på skrivbordet, vilket kan förklara den generellt längre batteritiden i nästa avsnitt nedan. Systemet kräver mellan 4 W och 16 W jämfört med 16 W till 21 W på Inspiron 16 Plus 7630. Förbrukningen när man kör mer krävande applikationer som spel är annars nästan densamma om inte något lägre med några watt.
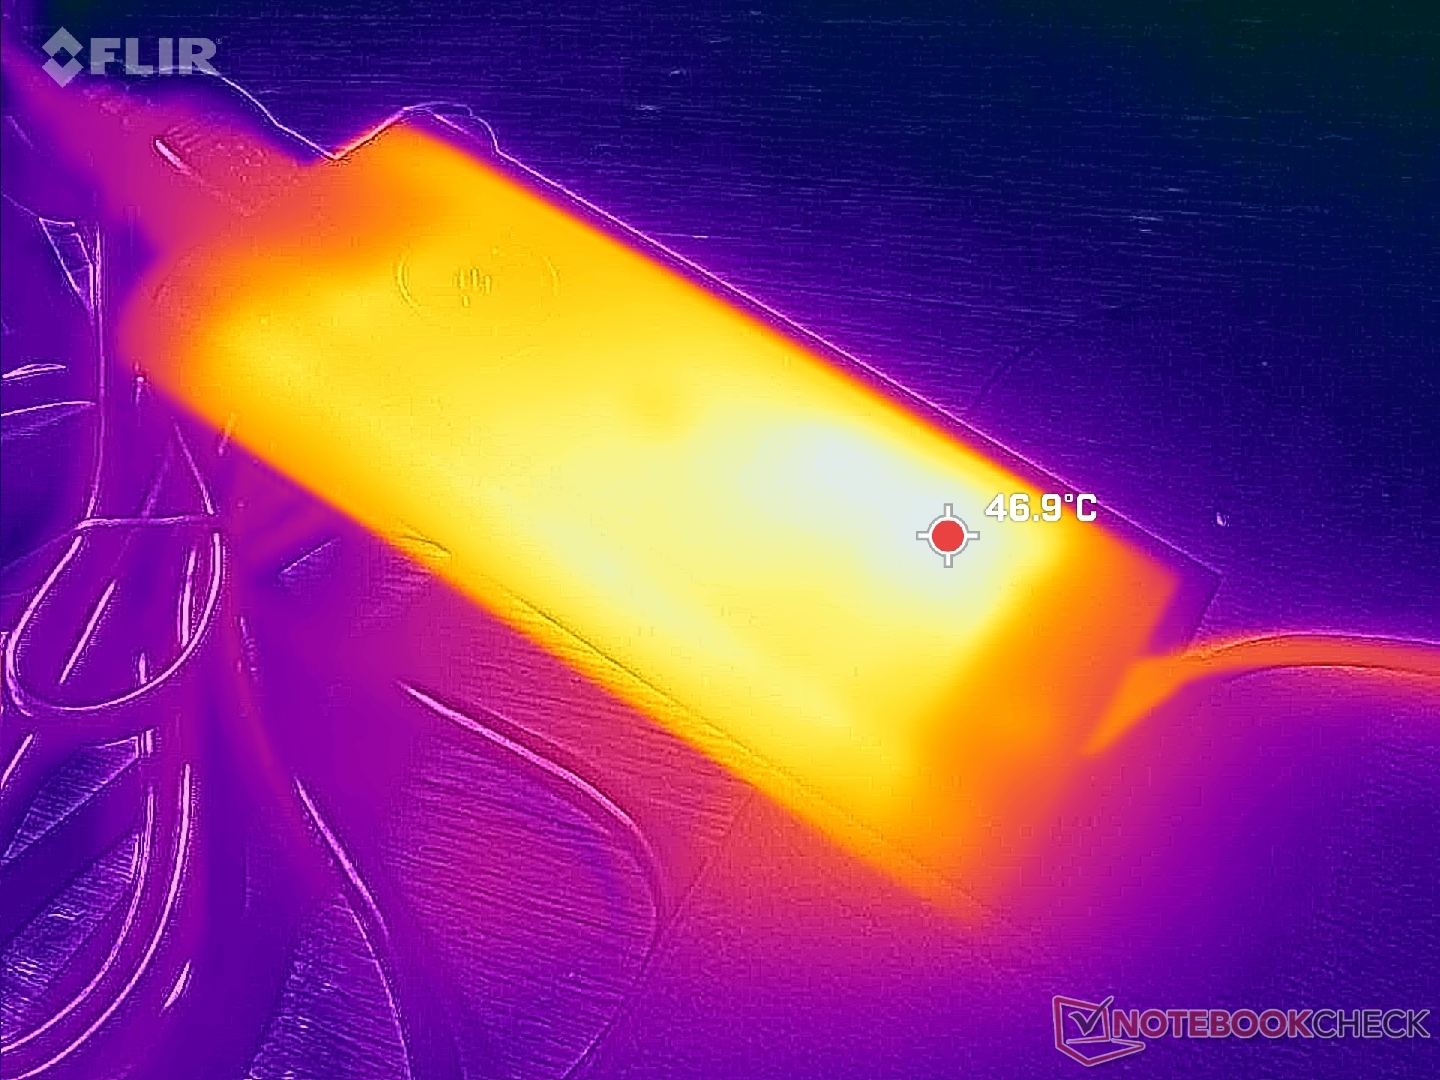
Intressant nog levereras modellen med en universell 130 W USB-C AC-adapter (~14,3 x 6,5 x 2,2 cm) istället för den 130 W proprietära AC-fatladdaren som följde med förra årets modell. Portarna till AC-adapterns fat finns dock kvar, vilket innebär att du fortfarande kan ladda systemet via en kompatibel fatladdare. Vi kan registrera en tillfällig maximal dragning på 138 W när vi kör Prime95 och FurMark samtidigt.
| Av/Standby | |
| Låg belastning | |
| Hög belastning |
|
Förklaring:
min: | |
| Dell Inspiron 16 Plus 7640 Ultra 7 155H, NVIDIA GeForce RTX 4060 Laptop GPU, SK hynix BC901 HFS001TEJ4X164N, IPS, 2560x1600, 16" | Dell Inspiron 16 Plus 7630 i7-13700H, NVIDIA GeForce RTX 4060 Laptop GPU, WD PC SN740 SDDPTQD-1T00, IPS, 2560x1600, 16" | Dell Inspiron 16 Plus 7620 i7-12700H, GeForce RTX 3050 Ti Laptop GPU, Kioxia BG5 KBG50ZNS512G, IPS, 3072x1920, 16" | Samsung Galaxy Book4 Ultra Ultra 7 155H, NVIDIA GeForce RTX 4050 Laptop GPU, Samsung PM9A1 MZVL2512HCJQ, OLED, 2880x1800, 16" | Lenovo Legion 5 16IRX G9 i7-14650HX, NVIDIA GeForce RTX 4060 Laptop GPU, Samsung PM9A1 MZVL21T0HCLR, IPS, 2560x1600, 16" | Asus VivoBook Pro 16 K6602VU i9-13900H, NVIDIA GeForce RTX 4050 Laptop GPU, Micron 2400 MTFDKBA1T0QFM, OLED, 3200x2000, 16" | |
|---|---|---|---|---|---|---|
| Power Consumption | -82% | -30% | 9% | -113% | -116% | |
| Idle Minimum * | 4.2 | 15.6 -271% | 6.8 -62% | 4.8 -14% | 15.4 -267% | 21.06 -401% |
| Idle Average * | 6.9 | 17.7 -157% | 9.6 -39% | 7.5 -9% | 19.7 -186% | 24.27 -252% |
| Idle Maximum * | 15.2 | 20.6 -36% | 17 -12% | 7.9 48% | 20.7 -36% | 25.12 -65% |
| Load Average * | 70.4 | 87.4 -24% | 117.5 -67% | 79.3 -13% | 102.6 -46% | 52.4 26% |
| Witcher 3 ultra * | 115.9 | 121.7 -5% | 113.1 2% | 79.2 32% | 191.3 -65% | 110.2 5% |
| Load Maximum * | 137.4 | 138 -0% | 137.4 -0% | 125 9% | 246.6 -79% | 146 -6% |
* ... mindre är bättre
Power Consumption Witcher 3 / Stresstest
Power Consumption external Monitor
Batteritid
Körtiderna är mycket längre än tidigare, sannolikt på grund av optimeringar och bytet till en nyare generation Intel-processor. Vi kan registrera en verklig WLAN-batteritid på nästan 13,5 timmar jämfört med 9,5 timmar på förra årets modell.
Laddning från tom till full kapacitet tar cirka 2 timmar med den medföljande USB-C-adaptern.
| Dell Inspiron 16 Plus 7640 Ultra 7 155H, NVIDIA GeForce RTX 4060 Laptop GPU, 90 Wh | Dell Inspiron 16 Plus 7630 i7-13700H, NVIDIA GeForce RTX 4060 Laptop GPU, 86 Wh | Dell Inspiron 16 Plus 7620 i7-12700H, GeForce RTX 3050 Ti Laptop GPU, 86 Wh | Samsung Galaxy Book4 Ultra Ultra 7 155H, NVIDIA GeForce RTX 4050 Laptop GPU, 76 Wh | Lenovo Legion 5 16IRX G9 i7-14650HX, NVIDIA GeForce RTX 4060 Laptop GPU, 80 Wh | Asus VivoBook Pro 16 K6602VU i9-13900H, NVIDIA GeForce RTX 4050 Laptop GPU, 96 Wh | |
|---|---|---|---|---|---|---|
| Batteridrifttid | -29% | -28% | -18% | -44% | -24% | |
| WiFi v1.3 | 799 | 566 -29% | 575 -28% | 656 -18% | 444 -44% | 606 -24% |
| Reader / Idle | 1055 | 1114 | ||||
| Load | 85 | 69 | 78 | 46 | ||
| H.264 | 1076 | 576 | 585 |
För
Emot
Utlåtande - Lappa ihop några små hål
Medan 2024 Inspiron 16 Plus 7640 kan se mycket ut som 2023-versionen 2023-versionenmen den tillför tillräckligt mycket utöver den förväntade årliga processoruppgraderingen som intresserade köpare kanske vill vara medvetna om. Den nyare modellen stöder upp till två SSD-enheter, erbjuder snabbare svarstider i svartvitt och grått, längre batteritid och AI-acceleration. Dessa förändringar under huven är viktiga för entusiaster som värdesätter lagringsexpansion, snabba spel, resor och AI-assisterade program som Co-Pilot. Inspiron 16 Plus 7640 blir en no-brainer jämfört med sin föregångare i detta avseende.
Inspiron 16 Plus 7640 tar itu med några av nackdelarna med sin föregångare för att bli en ännu bättre multimediamaskin än tidigare. Single-thread CPU-prestanda och spelprestanda tar dock ett litet steg bakåt.
Tyvärr har spelprestandan fått sig en törn med den nya modellen eftersom de flesta spel tenderar att gå lite långsammare än tidigare. Hardcore-spelare kan tycka att det är en besvikelse, men underskottet borde inte vara tillräckligt för att avskräcka casual-spelare som Inspiron-serien var utformad för. Spelare som verkligen vill pressa ut mer prestanda ur sina bärbara datorer måste överväga större och dyrare modeller som de från Dell G16-serien, Asus Zephyrus G16-serieneller Razer Blade 16-serien där TGP ofta kan nå tresiffriga tal.
Pris och tillgänglighet
Vår testkonfiguration med Core Ultra 7, RTX 4060 och 1600p levereras för närvarande direkt från Dell för $1300. Samtidigt börjar den billigare Core i7 med UHD Graphics SKU på bara 900 $.
Dell Inspiron 16 Plus 7640
- 06/21/2024 v8
Allen Ngo
Genomskinlighet
Valet av enheter som ska granskas görs av vår redaktion. Testprovet gavs till författaren som ett lån av tillverkaren eller återförsäljaren för denna recension. Långivaren hade inget inflytande på denna recension och inte heller fick tillverkaren en kopia av denna recension innan publiceringen. Det fanns ingen skyldighet att publicera denna recension. Vi accepterar aldrig ersättning eller betalning i utbyte mot våra recensioner. Som ett oberoende medieföretag är Notebookcheck inte föremål för auktoritet från tillverkare, återförsäljare eller förlag.
This is how Notebookcheck is testingEvery year, Notebookcheck independently reviews hundreds of laptops and smartphones using standardized procedures to ensure that all results are comparable. We have continuously developed our test methods for around 20 years and set industry standards in the process. In our test labs, high-quality measuring equipment is utilized by experienced technicians and editors. These tests involve a multi-stage validation process. Our complex rating system is based on hundreds of well-founded measurements and benchmarks, which maintains objectivity.
Price comparison

