Notebookcheck Logo

Recension av Dell Precision 7670 Performance - Debut för Nvidia RTX A5500

Core i9-12950HX kraft.

"Performance"- eller "Ultimate"-versionen av Precision 7670 är något tjockare, men har en betydligt snabbare GPU än det tunnare alternativet. CPU Turbo Boost kunde dock vara lite bättre.

Dell tar stora risker med sin nya Precision 7670-serie. Det är inte bara den den första bärbara datorn i produktion som använder CAMMutan själva serien består av en tunnare modell och en kraftfullare tjockare modell (kallad "Performance"- eller "Ultimate"-modell) beroende på konfiguration. Vi recenserade den tunnare modellen förra månaden och nu ska vi alltså ta en titt på den tjockare modellen.

Bortsett från deras små skillnader i Z-höjd har de två modellerna exakt samma chassikonstruktion och funktioner. Vi rekommenderar att du kollar in vår befintliga granskning av den tunnare Precision 7670 för att lära dig mer om de fysiska egenskaperna hos serien.

Vår specifika recensionsenhet är den högsta konfigurationen med Core i9-12950HX CPU, RTX A5500 GPU och 2400p 16:10 OLED pekskärm för cirka 7000 USD. Lägre SKU:er går ner till Core i7-12850HX eller RTX A4500, men alla alternativ kommer med samma 2400p IPS pekskärm. Den tunnare Precision 7670 kan däremot bara gå upp till RTX A2000 GPU.

Bland konkurrenterna i detta område finns andra 16-tums mobila arbetsstationer som t.ex.MSI CreatorPro Z16P,HP ZBook Studio 16, ellerLenovo ThinkPad P1 G4.

Fler recensioner av Dell:

Dell Precision 7000 7670 Performance (Precision 7000 Serie)
Processor
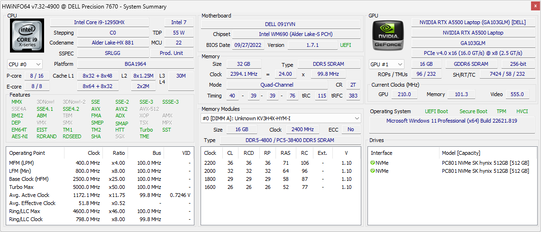
Intel Core i9-12950HX 16 x 1.7 - 5 GHz, 147 W PL2 / Short Burst, 76 W PL1 / Sustained, Alder Lake-HX
Grafikkort
NVIDIA RTX A5500 Laptop GPU - 16 GB VRAM, Kärna: 1380 MHz, Minne: 1750 MHz, 135 W TDP, GDDR6, 526.67, Optimus
Minne
16 GB 
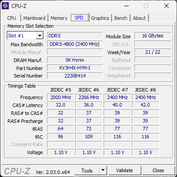
, CAMM DDR5-4800, Dual-Channel
Skärm
16.00 tum 16:10, 3840 x 2400 pixlar 283 PPI, 10-point capacitive, Samsung 160YV03, OLED, glansig: ja, 60 Hz
Moderkort
Intel WM690 (Alder Lake-S PCH)
Ljudkort
Intel Alder Lake-S PCH - cAVS (Audio, Voice, Speech)
Anslutningar
5 USB 3.1 Gen2, 2 Thunderbolt, 1 HDMI, 2 DisplayPort, 1 Kensingtonlås, Ljudanslutningar: 3.5 mm headset, Kortläsare: SD, Brightness Sensor
Nätverk
Intel Ethernet Connection I219-LM (10/100/1000MBit/s), Intel Wi-Fi 6E AX211 (a/b/g/h/n = Wi-Fi 4/ac = Wi-Fi 5/ax = Wi-Fi 6/ Wi-Fi 6E 6 GHz), Bluetooth 5.2
Storlek
höjd x bredd x djup (i mm) 25.95 x 356 x 258.34
Batteri
93 Wh Litiumpolymer, 6-cell
Operativsystem
Microsoft Windows 11 Pro
Camera
Webbkamera: 1080p30
Primary Camera: 2.1 MPix
Övrigt
Högtalare: Stereo, Waves Max Pro, Tangentbord: Chiclet, Tangentbordsbelysning: ja, Dell Optimizer, Power Manager, Command, PremierColor, Digital Delivery, Pair, 36 Månader Garanti
Vikt
2.849 kg, Strömförsörjning: 674 g
Pris
7000 USD
Note: The manufacturer may use components from different suppliers including display panels, drives or memory sticks with similar specifications.


Potentiella konkurrenter i jämförelse

Rating
Date
Model
Weight
Height
Size
Resolution
Price
89.1 %
v7 (old)
12/2022
Dell Precision 7000 7670 Performance
i9-12950HX, RTX A5500 Laptop GPU
2.8 kg25.95 mm16.00"3840x2400
84.3 %
v7 (old)
11/2022
MSI CreatorPro Z16P B12UKST
i7-12700H, RTX A3000 Laptop GPU
2.4 kg19 mm16.00"2560x1600
90.1 %
v7 (old)
11/2022
HP ZBook Studio 16 G9 62U04EA
i7-12800H, RTX A2000 Laptop GPU
1.8 kg19 mm16.00"3840x2400
82.9 %
v7 (old)
10/2022
HP ZBook Firefly 16 G9-6B897EA
i7-1265U, T550 Laptop GPU
2 kg19.2 mm16.00"1920x1200
89.3 %
v7 (old)
02/2022
Lenovo ThinkPad P1 G4-20Y4Z9DVUS
i7-11800H, T1200 Laptop GPU
1.8 kg17.7 mm16.00"2560x1600
88.4 %
v7 (old)
10/2022
Dell Precision 7670
i7-12850HX, RTX A2000 Laptop GPU
2.7 kg24.7 mm16.00"3840x2400

Hölje

Längd och bredd är identiska med den vanliga smalare Precision 7670, medan tjockleken och vikten har ökat med cirka 1,3 mm respektive 100 g. Det är svårt att märka skillnaderna i praktiken eftersom den vanliga Precision 7670 redan är en av de tjockare och tyngre mobila arbetsstationerna.

Storleksjämförelse

356 mm 258.34 mm 25.95 mm 2.8 kg356 mm 258.34 mm 24.7 mm 2.7 kg359 mm 256 mm 19 mm 2.4 kg358.7 mm 251 mm 19.2 mm 2 kg359.5 mm 253.8 mm 17.7 mm 1.8 kg356 mm 242 mm 19 mm 1.8 kg297 mm 210 mm 1 mm 5.7 g

SD-kortläsare

SD Card Reader
average JPG Copy Test (av. of 3 runs)
Lenovo ThinkPad P1 G4-20Y4Z9DVUS
Intel Core i7-11800H (Angelbird AV Pro V60)
207 MB/s +36%
Dell Precision 7670
Intel Core i7-12850HX (Toshiba Exceria Pro SDXC 64 GB UHS-II)
189.6 MB/s +25%
Dell Precision 7000 7670 Performance
Intel Core i9-12950HX (Toshiba Exceria Pro SDXC 64 GB UHS-II)
151.9 MB/s
MSI CreatorPro Z16P B12UKST
Intel Core i7-12700H (AV Pro V60)
81.3 MB/s -46%
HP ZBook Studio 16 G9 62U04EA
Intel Core i7-12800H (Angelbird AV PRO V60)
72.9 MB/s -52%
maximum AS SSD Seq Read Test (1GB)
Dell Precision 7670
Intel Core i7-12850HX (Toshiba Exceria Pro SDXC 64 GB UHS-II)
195.8 MB/s +2%
Dell Precision 7000 7670 Performance
Intel Core i9-12950HX (Toshiba Exceria Pro SDXC 64 GB UHS-II)
191.9 MB/s
Lenovo ThinkPad P1 G4-20Y4Z9DVUS
Intel Core i7-11800H (Angelbird AV Pro V60)
188 MB/s -2%
MSI CreatorPro Z16P B12UKST
Intel Core i7-12700H (AV Pro V60)
85.5 MB/s -55%
HP ZBook Studio 16 G9 62U04EA
Intel Core i7-12800H (Angelbird AV PRO V60)
79.6 MB/s -59%

Kommunikation

Även om Intel AX211 finns på alla Precision 7670 SKU:er är prestandan långsammare än förväntat på vår specifika testenhet. Den genomsnittliga överföringshastigheten är endast 891 Mbps när den är kopplad till vårt 6 Ghz-nätverk, jämfört med nästan dubbelt så hög hastighet på MSI CreatorPro Z16P eller HP ZBook Firefly 16 G9 båda med samma AX211-modul. Vi upprepade det här testet sex gånger på två olika dagar bara för att vara säkra, men resultaten blev inte bättre.

WLAN-modulen kan inte tas bort. Antenner för WAN-modulen ingår inte heller
Networking
iperf3 transmit AX12
Lenovo ThinkPad P1 G4-20Y4Z9DVUS
Intel Wi-Fi 6E AX210
1506 (796min - 1696max) MBit/s
iperf3 receive AX12
Lenovo ThinkPad P1 G4-20Y4Z9DVUS
Intel Wi-Fi 6E AX210
1361 (1205min - 1473max) MBit/s
iperf3 receive AXE11000 6GHz
MSI CreatorPro Z16P B12UKST
Killer Wi-Fi 6E AX1675i 160MHz Wireless Network Adapter
1690 (1617min, 1618.16P1 - 1721max) MBit/s +19%
HP ZBook Studio 16 G9 62U04EA
Intel Wi-Fi 6E AX211
1646 (1567min, 1579.18P1 - 1666max) MBit/s +16%
HP ZBook Firefly 16 G9-6B897EA
Intel Wi-Fi 6E AX211
1610 (1594min - 1622max) MBit/s +13%
Dell Precision 7000 7670 Performance
Intel Wi-Fi 6E AX211
1422 (1354min - 1449max) MBit/s
Dell Precision 7670
Intel Wi-Fi 6E AX211
1291 (749min - 1395max) MBit/s -9%
iperf3 receive AXE11000
Dell Precision 7000 7670 Performance
Intel Wi-Fi 6E AX211
986 (492min - 1309max) MBit/s
iperf3 transmit AXE11000
Dell Precision 7000 7670 Performance
Intel Wi-Fi 6E AX211
1113 (638min - 1357max) MBit/s
iperf3 transmit AXE11000 6GHz
MSI CreatorPro Z16P B12UKST
Killer Wi-Fi 6E AX1675i 160MHz Wireless Network Adapter
1659 (1602min, 1605.19P1 - 1702max) MBit/s +86%
HP ZBook Firefly 16 G9-6B897EA
Intel Wi-Fi 6E AX211
1629 (1540min - 1665max) MBit/s +83%
HP ZBook Studio 16 G9 62U04EA
Intel Wi-Fi 6E AX211
1622 (1552min, 1563.02P1 - 1659max) MBit/s +82%
Dell Precision 7670
Intel Wi-Fi 6E AX211
1097 (844min - 1256max) MBit/s +23%
Dell Precision 7000 7670 Performance
Intel Wi-Fi 6E AX211
891 (528min - 1091max) MBit/s
050100150200250300350400450500550600650700750800850900950100010501100115012001250130013501400Tooltip
Dell Precision 7000 7670 Performance; iperf3 transmit AXE11000 6GHz; iperf 3.1.3: Ø873 (528-1091)
Dell Precision 7000 7670 Performance; iperf3 receive AXE11000 6GHz; iperf 3.1.3: Ø1421 (1354-1449)

Webbkamera

ColorChecker
10.9 ∆E
10.6 ∆E
9.5 ∆E
16.4 ∆E
12.7 ∆E
11.4 ∆E
7.8 ∆E
5.9 ∆E
12.8 ∆E
7.2 ∆E
12.1 ∆E
5.9 ∆E
3.2 ∆E
10.7 ∆E
15.4 ∆E
5.5 ∆E
9.9 ∆E
9.5 ∆E
11.4 ∆E
13 ∆E
11.3 ∆E
13 ∆E
9.1 ∆E
6.5 ∆E
ColorChecker Dell Precision 7000 7670 Performance: 10.07 ∆E min: 3.24 - max: 16.41 ∆E

Underhåll

Bottenpanelen är fäst med sex Philips-skruvar för enkel service. De inre delarna liknar den smalare Precision 7670 förutom skillnaderna i batterikapacitet, antal tillgängliga lagringsfack och förekomsten av en liten kylfläns.

Precision 7670 Prestanda
Precision 7670 för jämförelse

Skärm

Skärmalternativen är identiska med dem som finns på den tunnare Precision 7670. Vår testenhet använder samma Samsung 160YV03 OLED-panel som lovar fulla P3-färger.

OLED-subpixelmatris
OLED-subpixelmatris
Dell PremierColor är förinstallerad
333.9
cd/m²
326.9
cd/m²
328.2
cd/m²
330.5
cd/m²
325.2
cd/m²
326.9
cd/m²
328.1
cd/m²
325.1
cd/m²
330.3
cd/m²
Distribution av ljusstyrkan
Samsung 160YV03 tested with X-Rite i1Pro 2
Max: 333.9 cd/m² (Nits) Medel: 328.3 cd/m² Minimum: 0.77 cd/m²
Distribution av ljusstyrkan: 97 %
Mitt på batteriet: 325.2 cd/m²
Kontrast: ∞:1 (Svärta: 0 cd/m²)
ΔE Color 4.59 | 0.5-29.43 Ø4.92
ΔE Greyscale 2.5 | 0.5-98 Ø5.2
98.1% AdobeRGB 1998 (Argyll 2.2.0 3D)
100% sRGB (Argyll 2.2.0 3D)
99.9% Display P3 (Argyll 2.2.0 3D)
Gamma: 2.1
Dell Precision 7000 7670 Performance
Samsung 160YV03, OLED, 3840x2400, 16"
MSI CreatorPro Z16P B12UKST
B160QAN02.N, IPS, 2560x1600, 16"
HP ZBook Studio 16 G9 62U04EA
BOE0A52, IPS, 3840x2400, 16"
HP ZBook Firefly 16 G9-6B897EA
BOE0A02, IPS, 1920x1200, 16"
Lenovo ThinkPad P1 G4-20Y4Z9DVUS
NE160QDM-N63, IPS, 2560x1600, 16"
Dell Precision 7670
Samsung 160YV03, OLED, 3840x2400, 16"
Display
-4%
-5%
-22%
-17%
-0%
Display P3 Coverage
99.9
97.6
-2%
97.5
-2%
68.1
-32%
72.7
-27%
99.9
0%
sRGB Coverage
100
99.9
0%
99.9
0%
96.1
-4%
99.3
-1%
100
0%
AdobeRGB 1998 Coverage
98.1
87.4
-11%
86.3
-12%
70
-29%
74.7
-24%
97.5
-1%
Response Times
-441%
-475%
-1843%
-1550%
-2%
Response Time Grey 50% / Grey 80% *
1.84 ?(0.92, 0.92)
12.8 ?(6.2, 6.6)
-596%
15.3 ?(6.9, 8.4)
-732%
52.8 ?(22.9, 29.9)
-2770%
40.8
-2117%
1.9 ?(1.1, 0.8)
-3%
Response Time Black / White *
1.92 ?(0.92, 1)
7.4 ?(3.4, 4)
-285%
6.1 ?(2.1, 4)
-218%
19.5 ?(6, 13.5)
-916%
20.8
-983%
2 ?(0.8, 1.2)
-4%
PWM Frequency
59.52 ?(100)
59.5 ?(100)
0%
Screen
32%
50%
4%
7%
2%
Brightness middle
325.2
407
25%
554
70%
526
62%
441
36%
340.1
5%
Brightness
328
388
18%
516
57%
499
52%
420
28%
342
4%
Brightness Distribution
97
88
-9%
84
-13%
93
-4%
90
-7%
98
1%
Black Level *
0.36
0.47
0.31
0.27
Colorchecker dE 2000 *
4.59
1.3
72%
1
78%
3.6
22%
2.6
43%
2.5
46%
Colorchecker dE 2000 max. *
7.65
2.5
67%
2.4
69%
6.6
14%
6
22%
8.19
-7%
Greyscale dE 2000 *
2.5
2.1
16%
1.6
36%
5.5
-120%
4.5
-80%
3.5
-40%
Gamma
2.1 105%
2.26 97%
2.29 96%
2.02 109%
2.18 101%
2.12 104%
CCT
6541 99%
6437 101%
6458 101%
6527 100%
6623 98%
6704 97%
Contrast
1131
1179
1697
1633
Colorchecker dE 2000 calibrated *
0.7
0.6
2.6
1.2
Total Average (Program / Settings)
-138% / -64%
-143% / -61%
-620% / -339%
-520% / -283%
0% / 0%

* ... smaller is better

Display Response Times

Display response times show how fast the screen is able to change from one color to the next. Slow response times can lead to afterimages and can cause moving objects to appear blurry (ghosting). Gamers of fast-paced 3D titles should pay special attention to fast response times.
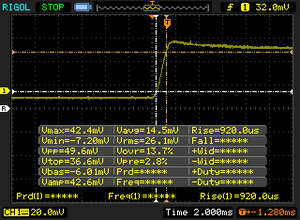
       Response Time Black to White
1.92 ms ... rise ↗ and fall ↘ combined↗ 0.92 ms rise
↘ 1 ms fall
The screen shows very fast response rates in our tests and should be very well suited for fast-paced gaming.
In comparison, all tested devices range from 0.1 (minimum) to 240 (maximum) ms. » 7 % of all devices are better.
This means that the measured response time is better than the average of all tested devices (21 ms).
       Response Time 50% Grey to 80% Grey
1.84 ms ... rise ↗ and fall ↘ combined↗ 0.92 ms rise
↘ 0.92 ms fall
The screen shows very fast response rates in our tests and should be very well suited for fast-paced gaming.
In comparison, all tested devices range from 0.165 (minimum) to 636 (maximum) ms. » 6 % of all devices are better.
This means that the measured response time is better than the average of all tested devices (32.9 ms).

Screen Flickering / PWM (Pulse-Width Modulation)

To dim the screen, some notebooks will simply cycle the backlight on and off in rapid succession - a method called Pulse Width Modulation (PWM) . This cycling frequency should ideally be undetectable to the human eye. If said frequency is too low, users with sensitive eyes may experience strain or headaches or even notice the flickering altogether.
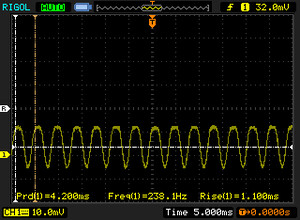
Screen flickering / PWM detected 59.52 Hz ≤ 100 % brightness setting

The display backlight flickers at 59.52 Hz (worst case, e.g., utilizing PWM) Flickering detected at a brightness setting of 100 % and below. There should be no flickering or PWM above this brightness setting.

The frequency of 59.52 Hz is very low, so the flickering may cause eyestrain and headaches after extended use.

In comparison: 53 % of all tested devices do not use PWM to dim the display. If PWM was detected, an average of 8746 (minimum: 5 - maximum: 343500) Hz was measured.

jämfört med sRGB
jämfört med sRGB
mot P3
mot P3
Gråskala (standardinställning för vibrerande färg)
Mättnadssvep (standardinställning för Vibrant)
ColorChecker (standardinställning för vibrerande färg)
Gråskala (DCI-P3-inställning)
Mättnadssvep (DCI-P3-inställning)
ColorChecker (DCI-P3-inställning)

Flimmer finns på alla ljusstyrkor, vilket är vanligt med OLED-paneler. Vi kan registrera en frekvens på 238,1 Hz från 0 till 57 procent ljusstyrka och 59,5 Hz från 58 procent till maximal ljusstyrka.

0 procent ljusstyrka
25 procent ljusstyrka
50 procent ljusstyrka
75 procent ljusstyrka
100 procent ljusstyrka
Utomhus under en ljusmulen dag med mulet väder
Utomhus i skugga
Utomhus i skugga
Utomhus under en ljusmulen dag med mulet väder
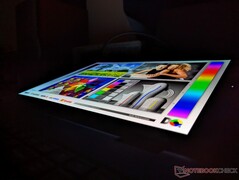
Breda OLED-vinklar
Breda OLED-vinklar

Prestanda


Provningsförhållanden

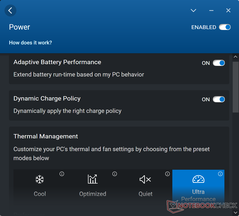
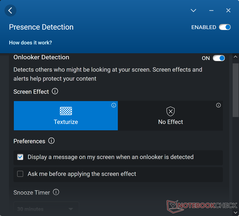
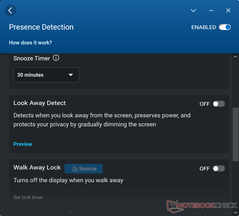
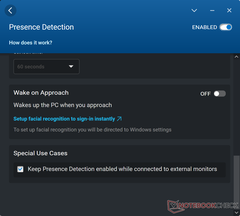
Vi ställde vår enhet till Ultra Performance-läge via Dell Optimizer-programvaran och GPU:n till diskret grafik innan vi körde några av prestandanivåerna nedan. Det rekommenderas starkt att ägare bekantar sig med Optimizer eftersom det är navet för att kontrollera många specifika funktioner i den bärbara datorn, inklusive närvarodetektering och laddningsbeteende

Vi kan inte hitta någon MUX-switch någonstans i programvaran eller BIOS.

Processor

Prestandan för flera trådar är endast 8-14 procent snabbare än den förCore i7-12850HX i vår smalare Precision 7670. Den smala marginalen är inte oväntad, men den mer överraskande aspekten är den något dåliga Turbo Boost-hållbarheten hos vårCore i9-12950HX. När vi körde CineBench R15 xT i en slinga sjönk prestandan med cirka 17 procent med tiden i stället för att vara konstant hela tiden. Prestandaunderskottet liknar det vi observerade på den vanliga Precision 7670 trots den tjockare profilen på vår Performance-modell.

Cinebench R15 Multi Loop

0140280420560700840980112012601400154016801820196021002240238025202660Tooltip
Dell Precision 7000 7670 Performance Intel Core i9-12950HX: Ø2311 (2236.26-2768.74)
MSI CreatorPro Z16P B12UKST Intel Core i7-12700H: Ø2211 (2130.95-2274.54)
HP ZBook Studio 16 G9 62U04EA Intel Core i7-12800H: Ø2518 (2462.45-2642.53)
HP ZBook Firefly 16 G9-6B897EA Intel Core i7-1265U: Ø664 (658.25-723.46)
Lenovo ThinkPad P1 G4-20Y4Z9DVUS Intel Core i7-11800H: Ø1876 (1827.4-2112.04)
Dell Precision 7670 Intel Core i7-12850HX: Ø1890 (1813.24-2431.76)
Cinebench R20: CPU (Multi Core) | CPU (Single Core)
Cinebench R23: Multi Core | Single Core
Cinebench R15: CPU Multi 64Bit | CPU Single 64Bit
Blender: v2.79 BMW27 CPU
7-Zip 18.03: 7z b 4 | 7z b 4 -mmt1
Geekbench 5.5: Multi-Core | Single-Core
HWBOT x265 Benchmark v2.2: 4k Preset
LibreOffice : 20 Documents To PDF
R Benchmark 2.5: Overall mean
Cinebench R20 / CPU (Multi Core)
Average Intel Core i9-12950HX
  (6625 - 8777, n=7)
7689 Points +16%
MSI CreatorPro Z16P B12UKST
Intel Core i7-12700H
6742 Points +2%
Dell Precision 7000 7670 Performance
Intel Core i9-12950HX
6625 Points
HP ZBook Studio 16 G9 62U04EA
Intel Core i7-12800H
6433 Points -3%
Dell Precision 7670
Intel Core i7-12850HX
6217 Points -6%
Lenovo ThinkPad P1 G4-20Y4Z9DVUS
Intel Core i7-11800H
4776 Points -28%
HP ZBook Firefly 16 G9-6B897EA
Intel Core i7-1265U
1669 Points -75%
Cinebench R20 / CPU (Single Core)
Average Intel Core i9-12950HX
  (703 - 741, n=7)
727 Points +3%
HP ZBook Studio 16 G9 62U04EA
Intel Core i7-12800H
714 Points +2%
Dell Precision 7000 7670 Performance
Intel Core i9-12950HX
703 Points
Dell Precision 7670
Intel Core i7-12850HX
687 Points -2%
MSI CreatorPro Z16P B12UKST
Intel Core i7-12700H
675 Points -4%
Lenovo ThinkPad P1 G4-20Y4Z9DVUS
Intel Core i7-11800H
585 Points -17%
HP ZBook Firefly 16 G9-6B897EA
Intel Core i7-1265U
542 Points -23%
Cinebench R23 / Multi Core
Average Intel Core i9-12950HX
  (16277 - 23113, n=7)
19930 Points +22%
MSI CreatorPro Z16P B12UKST
Intel Core i7-12700H
17228 Points +6%
HP ZBook Studio 16 G9 62U04EA
Intel Core i7-12800H
16597 Points +2%
Dell Precision 7000 7670 Performance
Intel Core i9-12950HX
16277 (14241.1min - 16276.6max) Points
Dell Precision 7670
Intel Core i7-12850HX
15093 (12275min - 15093.4max) Points -7%
Lenovo ThinkPad P1 G4-20Y4Z9DVUS
Intel Core i7-11800H
12382 Points -24%
HP ZBook Firefly 16 G9-6B897EA
Intel Core i7-1265U
4340 Points -73%
Cinebench R23 / Single Core
HP ZBook Studio 16 G9 62U04EA
Intel Core i7-12800H
1859 Points +27%
Average Intel Core i9-12950HX
  (1465 - 1922, n=7)
1835 Points +25%
MSI CreatorPro Z16P B12UKST
Intel Core i7-12700H
1738 Points +19%
Dell Precision 7670
Intel Core i7-12850HX
1596 Points +9%
Lenovo ThinkPad P1 G4-20Y4Z9DVUS
Intel Core i7-11800H
1510 Points +3%
Dell Precision 7000 7670 Performance
Intel Core i9-12950HX
1465 Points
HP ZBook Firefly 16 G9-6B897EA
Intel Core i7-1265U
1144 Points -22%
Cinebench R15 / CPU Multi 64Bit
Average Intel Core i9-12950HX
  (2464 - 3530, n=7)
3090 Points +12%
Dell Precision 7000 7670 Performance
Intel Core i9-12950HX
2769 (2236.26min - 2768.74max) Points
HP ZBook Studio 16 G9 62U04EA
Intel Core i7-12800H
2518 (2462.45min, 2463.98P1 - 2642.53max) Points -9%
Dell Precision 7670
Intel Core i7-12850HX
2432 (1813.24min - 2431.76max) Points -12%
MSI CreatorPro Z16P B12UKST
Intel Core i7-12700H
2211 (2130.95min, 2137.41P1 - 2274.54max) Points -20%
Lenovo ThinkPad P1 G4-20Y4Z9DVUS
Intel Core i7-11800H
2112 (1827.4min - 2112.04max) Points -24%
HP ZBook Firefly 16 G9-6B897EA
Intel Core i7-1265U
723 (658.25min - 723.46max) Points -74%
Cinebench R15 / CPU Single 64Bit
HP ZBook Studio 16 G9 62U04EA
Intel Core i7-12800H
269 Points +1%
Dell Precision 7000 7670 Performance
Intel Core i9-12950HX
266 Points
Average Intel Core i9-12950HX
  (167 - 276, n=7)
257 Points -3%
Dell Precision 7670
Intel Core i7-12850HX
253 Points -5%
MSI CreatorPro Z16P B12UKST
Intel Core i7-12700H
238 Points -11%
Lenovo ThinkPad P1 G4-20Y4Z9DVUS
Intel Core i7-11800H
231 Points -13%
HP ZBook Firefly 16 G9-6B897EA
Intel Core i7-1265U
206 Points -23%
Blender / v2.79 BMW27 CPU
HP ZBook Firefly 16 G9-6B897EA
Intel Core i7-1265U
684 Seconds * -254%
Lenovo ThinkPad P1 G4-20Y4Z9DVUS
Intel Core i7-11800H
250 Seconds * -30%
Dell Precision 7670
Intel Core i7-12850HX
205 Seconds * -6%
MSI CreatorPro Z16P B12UKST
Intel Core i7-12700H
201 Seconds * -4%
Dell Precision 7000 7670 Performance
Intel Core i9-12950HX
193 Seconds *
HP ZBook Studio 16 G9 62U04EA
Intel Core i7-12800H
192 Seconds * +1%
Average Intel Core i9-12950HX
  (138 - 193, n=7)
171.4 Seconds * +11%
7-Zip 18.03 / 7z b 4
Average Intel Core i9-12950HX
  (65637 - 85019, n=7)
77515 MIPS +18%
HP ZBook Studio 16 G9 62U04EA
Intel Core i7-12800H
68930 MIPS +5%
MSI CreatorPro Z16P B12UKST
Intel Core i7-12700H
66768 MIPS +2%
Dell Precision 7000 7670 Performance
Intel Core i9-12950HX
65637 MIPS
Dell Precision 7670
Intel Core i7-12850HX
53893 MIPS -18%
Lenovo ThinkPad P1 G4-20Y4Z9DVUS
Intel Core i7-11800H
50077 MIPS -24%
HP ZBook Firefly 16 G9-6B897EA
Intel Core i7-1265U
20087 MIPS -69%
7-Zip 18.03 / 7z b 4 -mmt1
Average Intel Core i9-12950HX
  (6022 - 6318, n=7)
6174 MIPS +3%
Dell Precision 7000 7670 Performance
Intel Core i9-12950HX
6022 MIPS
HP ZBook Studio 16 G9 62U04EA
Intel Core i7-12800H
5976 MIPS -1%
MSI CreatorPro Z16P B12UKST
Intel Core i7-12700H
5765 MIPS -4%
Dell Precision 7670
Intel Core i7-12850HX
5608 MIPS -7%
Lenovo ThinkPad P1 G4-20Y4Z9DVUS
Intel Core i7-11800H
5596 MIPS -7%
HP ZBook Firefly 16 G9-6B897EA
Intel Core i7-1265U
4979 MIPS -17%
Geekbench 5.5 / Multi-Core
Average Intel Core i9-12950HX
  (14028 - 16009, n=7)
15046 Points +6%
Dell Precision 7000 7670 Performance
Intel Core i9-12950HX
14197 Points
HP ZBook Studio 16 G9 62U04EA
Intel Core i7-12800H
12940 Points -9%
MSI CreatorPro Z16P B12UKST
Intel Core i7-12700H
12125 Points -15%
Dell Precision 7670
Intel Core i7-12850HX
11509 Points -19%
Lenovo ThinkPad P1 G4-20Y4Z9DVUS
Intel Core i7-11800H
8272 Points -42%
HP ZBook Firefly 16 G9-6B897EA
Intel Core i7-1265U
5022 Points -65%
Geekbench 5.5 / Single-Core
Dell Precision 7000 7670 Performance
Intel Core i9-12950HX
1914 Points
Average Intel Core i9-12950HX
  (1847 - 1945, n=7)
1891 Points -1%
HP ZBook Studio 16 G9 62U04EA
Intel Core i7-12800H
1838 Points -4%
HP ZBook Firefly 16 G9-6B897EA
Intel Core i7-1265U
1791 Points -6%
MSI CreatorPro Z16P B12UKST
Intel Core i7-12700H
1788 Points -7%
Dell Precision 7670
Intel Core i7-12850HX
1777 Points -7%
Lenovo ThinkPad P1 G4-20Y4Z9DVUS
Intel Core i7-11800H
1572 Points -18%
HWBOT x265 Benchmark v2.2 / 4k Preset
Average Intel Core i9-12950HX
  (18.6 - 26.5, n=7)
22.3 fps +20%
HP ZBook Studio 16 G9 62U04EA
Intel Core i7-12800H
19.4 fps +4%
MSI CreatorPro Z16P B12UKST
Intel Core i7-12700H
19.4 fps +4%
Dell Precision 7000 7670 Performance
Intel Core i9-12950HX
18.6 fps
Dell Precision 7670
Intel Core i7-12850HX
17.3 fps -7%
Lenovo ThinkPad P1 G4-20Y4Z9DVUS
Intel Core i7-11800H
14.2 fps -24%
HP ZBook Firefly 16 G9-6B897EA
Intel Core i7-1265U
5.09 fps -73%
LibreOffice / 20 Documents To PDF
HP ZBook Firefly 16 G9-6B897EA
Intel Core i7-1265U
52 s * -19%
Lenovo ThinkPad P1 G4-20Y4Z9DVUS
Intel Core i7-11800H
50.2 s * -15%
Dell Precision 7670
Intel Core i7-12850HX
48.6 s * -11%
Dell Precision 7000 7670 Performance
Intel Core i9-12950HX
43.7 s *
HP ZBook Studio 16 G9 62U04EA
Intel Core i7-12800H
43.4 s * +1%
Average Intel Core i9-12950HX
  (34.7 - 45.4, n=7)
40.2 s * +8%
MSI CreatorPro Z16P B12UKST
Intel Core i7-12700H
38.2 s * +13%
R Benchmark 2.5 / Overall mean
Lenovo ThinkPad P1 G4-20Y4Z9DVUS
Intel Core i7-11800H
0.559 sec * -26%
HP ZBook Firefly 16 G9-6B897EA
Intel Core i7-1265U
0.544 sec * -22%
Dell Precision 7670
Intel Core i7-12850HX
0.4698 sec * -5%
MSI CreatorPro Z16P B12UKST
Intel Core i7-12700H
0.4541 sec * -2%
Dell Precision 7000 7670 Performance
Intel Core i9-12950HX
0.4454 sec *
HP ZBook Studio 16 G9 62U04EA
Intel Core i7-12800H
0.4442 sec * -0%
Average Intel Core i9-12950HX
  (0.4251 - 0.4515, n=7)
0.4374 sec * +2%

* ... smaller is better

Cinebench R15 CPU Multi 64Bit
2769 Points
Cinebench R15 OpenGL 64Bit
366 fps
Cinebench R15 Ref. Match 64Bit
99.6 %
Cinebench R15 CPU Single 64Bit
266 Points
Cinebench R20 CPU (Multi Core)
6625 Points
Cinebench R20 CPU (Single Core)
703 Points
Cinebench R23 Single Core
1465 Points
Cinebench R23 Multi Core
16277 Points
Hjälp
Performance Rating
Average Intel Core i9-12950HX
 
98 pt
MSI CreatorPro Z16P B12UKST
Intel Core i7-12700H, RTX A3000 Laptop GPU
87 pt
HP ZBook Studio 16 G9 62U04EA
Intel Core i7-12800H, RTX A2000 Laptop GPU
85.1 pt
Dell Precision 7000 7670 Performance
Intel Core i9-12950HX, RTX A5500 Laptop GPU
84.4 pt
Lenovo ThinkPad P1 G4-20Y4Z9DVUS
Intel Core i7-11800H, T1200 Laptop GPU
76.3 pt
Dell Precision 7670
Intel Core i7-12850HX, RTX A2000 Laptop GPU
70.1 pt
HP ZBook Firefly 16 G9-6B897EA
Intel Core i7-1265U, T550 Laptop GPU
25.4 pt
AIDA64 / FP32 Ray-Trace
Average Intel Core i9-12950HX
  (15499 - 22868, n=7)
17911 KRay/s +16%
Dell Precision 7000 7670 Performance
Intel Core i9-12950HX, RTX A5500 Laptop GPU
15499 KRay/s
Lenovo ThinkPad P1 G4-20Y4Z9DVUS
Intel Core i7-11800H, T1200 Laptop GPU
15248 KRay/s -2%
HP ZBook Studio 16 G9 62U04EA
Intel Core i7-12800H, RTX A2000 Laptop GPU
15206 KRay/s -2%
MSI CreatorPro Z16P B12UKST
Intel Core i7-12700H, RTX A3000 Laptop GPU
14572 KRay/s -6%
Dell Precision 7670
Intel Core i7-12850HX, RTX A2000 Laptop GPU
12983 KRay/s -16%
HP ZBook Firefly 16 G9-6B897EA
Intel Core i7-1265U, T550 Laptop GPU
2619 KRay/s -83%
AIDA64 / FPU Julia
Average Intel Core i9-12950HX
  (77846 - 115907, n=7)
92341 Points +19%
HP ZBook Studio 16 G9 62U04EA
Intel Core i7-12800H, RTX A2000 Laptop GPU
80002 Points +3%
Dell Precision 7000 7670 Performance
Intel Core i9-12950HX, RTX A5500 Laptop GPU
77846 Points
MSI CreatorPro Z16P B12UKST
Intel Core i7-12700H, RTX A3000 Laptop GPU
73967 Points -5%
Dell Precision 7670
Intel Core i7-12850HX, RTX A2000 Laptop GPU
68219 Points -12%
Lenovo ThinkPad P1 G4-20Y4Z9DVUS
Intel Core i7-11800H, T1200 Laptop GPU
63515 Points -18%
HP ZBook Firefly 16 G9-6B897EA
Intel Core i7-1265U, T550 Laptop GPU
12909 Points -83%
AIDA64 / CPU SHA3
Lenovo ThinkPad P1 G4-20Y4Z9DVUS
Intel Core i7-11800H, T1200 Laptop GPU
4217 MB/s +23%
Average Intel Core i9-12950HX
  (3426 - 5069, n=7)
4106 MB/s +20%
HP ZBook Studio 16 G9 62U04EA
Intel Core i7-12800H, RTX A2000 Laptop GPU
3684 MB/s +8%
MSI CreatorPro Z16P B12UKST
Intel Core i7-12700H, RTX A3000 Laptop GPU
3648 MB/s +6%
Dell Precision 7000 7670 Performance
Intel Core i9-12950HX, RTX A5500 Laptop GPU
3426 MB/s
Dell Precision 7670
Intel Core i7-12850HX, RTX A2000 Laptop GPU
3098 MB/s -10%
HP ZBook Firefly 16 G9-6B897EA
Intel Core i7-1265U, T550 Laptop GPU
824 MB/s -76%
AIDA64 / CPU Queen
HP ZBook Studio 16 G9 62U04EA
Intel Core i7-12800H, RTX A2000 Laptop GPU
108084 Points +4%
Average Intel Core i9-12950HX
  (102752 - 104726, n=7)
103895 Points 0%
Dell Precision 7000 7670 Performance
Intel Core i9-12950HX, RTX A5500 Laptop GPU
103714 Points
MSI CreatorPro Z16P B12UKST
Intel Core i7-12700H, RTX A3000 Laptop GPU
101642 Points -2%
Lenovo ThinkPad P1 G4-20Y4Z9DVUS
Intel Core i7-11800H, T1200 Laptop GPU
91827 Points -11%
HP ZBook Firefly 16 G9-6B897EA
Intel Core i7-1265U, T550 Laptop GPU
65027 Points -37%
Dell Precision 7670
Intel Core i7-12850HX, RTX A2000 Laptop GPU
26716 Points -74%
AIDA64 / FPU SinJulia
Average Intel Core i9-12950HX
  (10134 - 12823, n=7)
11619 Points +15%
Dell Precision 7000 7670 Performance
Intel Core i9-12950HX, RTX A5500 Laptop GPU
10134 Points
Dell Precision 7670
Intel Core i7-12850HX, RTX A2000 Laptop GPU
9869 Points -3%
Lenovo ThinkPad P1 G4-20Y4Z9DVUS
Intel Core i7-11800H, T1200 Laptop GPU
9783 Points -3%
HP ZBook Studio 16 G9 62U04EA
Intel Core i7-12800H, RTX A2000 Laptop GPU
9658 Points -5%
MSI CreatorPro Z16P B12UKST
Intel Core i7-12700H, RTX A3000 Laptop GPU
9475 Points -7%
HP ZBook Firefly 16 G9-6B897EA
Intel Core i7-1265U, T550 Laptop GPU
3105 Points -69%
AIDA64 / FPU Mandel
Average Intel Core i9-12950HX
  (37146 - 57340, n=7)
44595 Points +20%
HP ZBook Studio 16 G9 62U04EA
Intel Core i7-12800H, RTX A2000 Laptop GPU
38179 Points +3%
Lenovo ThinkPad P1 G4-20Y4Z9DVUS
Intel Core i7-11800H, T1200 Laptop GPU
37783 Points +2%
Dell Precision 7000 7670 Performance
Intel Core i9-12950HX, RTX A5500 Laptop GPU
37146 Points
MSI CreatorPro Z16P B12UKST
Intel Core i7-12700H, RTX A3000 Laptop GPU
35917 Points -3%
Dell Precision 7670
Intel Core i7-12850HX, RTX A2000 Laptop GPU
34218 Points -8%
HP ZBook Firefly 16 G9-6B897EA
Intel Core i7-1265U, T550 Laptop GPU
6967 Points -81%
AIDA64 / CPU AES
MSI CreatorPro Z16P B12UKST
Intel Core i7-12700H, RTX A3000 Laptop GPU
132156 MB/s +82%
Average Intel Core i9-12950HX
  (72599 - 181128, n=7)
119390 MB/s +64%
Lenovo ThinkPad P1 G4-20Y4Z9DVUS
Intel Core i7-11800H, T1200 Laptop GPU
88402 MB/s +22%
HP ZBook Studio 16 G9 62U04EA
Intel Core i7-12800H, RTX A2000 Laptop GPU
73928 MB/s +2%
Dell Precision 7000 7670 Performance
Intel Core i9-12950HX, RTX A5500 Laptop GPU
72599 MB/s
Dell Precision 7670
Intel Core i7-12850HX, RTX A2000 Laptop GPU
63362 MB/s -13%
HP ZBook Firefly 16 G9-6B897EA
Intel Core i7-1265U, T550 Laptop GPU
19489 MB/s -73%
AIDA64 / CPU ZLib
Average Intel Core i9-12950HX
  (996 - 1417, n=7)
1195 MB/s +20%
HP ZBook Studio 16 G9 62U04EA
Intel Core i7-12800H, RTX A2000 Laptop GPU
1047 MB/s +5%
MSI CreatorPro Z16P B12UKST
Intel Core i7-12700H, RTX A3000 Laptop GPU
1013 MB/s +2%
Dell Precision 7000 7670 Performance
Intel Core i9-12950HX, RTX A5500 Laptop GPU
996 MB/s
Dell Precision 7670
Intel Core i7-12850HX, RTX A2000 Laptop GPU
817 MB/s -18%
Lenovo ThinkPad P1 G4-20Y4Z9DVUS
Intel Core i7-11800H, T1200 Laptop GPU
804 MB/s -19%
HP ZBook Firefly 16 G9-6B897EA
Intel Core i7-1265U, T550 Laptop GPU
314 MB/s -68%
AIDA64 / FP64 Ray-Trace
Average Intel Core i9-12950HX
  (8455 - 12432, n=7)
9620 KRay/s +14%
HP ZBook Studio 16 G9 62U04EA
Intel Core i7-12800H, RTX A2000 Laptop GPU
8559 KRay/s +1%
Dell Precision 7000 7670 Performance
Intel Core i9-12950HX, RTX A5500 Laptop GPU
8455 KRay/s
Lenovo ThinkPad P1 G4-20Y4Z9DVUS
Intel Core i7-11800H, T1200 Laptop GPU
8170 KRay/s -3%
MSI CreatorPro Z16P B12UKST
Intel Core i7-12700H, RTX A3000 Laptop GPU
7829 KRay/s -7%
Dell Precision 7670
Intel Core i7-12850HX, RTX A2000 Laptop GPU
7671 KRay/s -9%
HP ZBook Firefly 16 G9-6B897EA
Intel Core i7-1265U, T550 Laptop GPU
1473 KRay/s -83%
AIDA64 / CPU PhotoWorxx
MSI CreatorPro Z16P B12UKST
Intel Core i7-12700H, RTX A3000 Laptop GPU
42574 MPixel/s 0%
Dell Precision 7000 7670 Performance
Intel Core i9-12950HX, RTX A5500 Laptop GPU
42472 MPixel/s
Dell Precision 7670
Intel Core i7-12850HX, RTX A2000 Laptop GPU
42035 MPixel/s -1%
Average Intel Core i9-12950HX
  (35479 - 42655, n=7)
40844 MPixel/s -4%
HP ZBook Studio 16 G9 62U04EA
Intel Core i7-12800H, RTX A2000 Laptop GPU
38574 MPixel/s -9%
HP ZBook Firefly 16 G9-6B897EA
Intel Core i7-1265U, T550 Laptop GPU
20213 MPixel/s -52%
Lenovo ThinkPad P1 G4-20Y4Z9DVUS
Intel Core i7-11800H, T1200 Laptop GPU
15524 MPixel/s -63%

Systemets prestanda

PCMark-resultaten är jämförbara med de mobila arbetsstationer av högre kvalitet som för närvarande finns tillgängliga, inklusiveHP ZBook Fury 15 G8.

PCMark 10 / Score
MSI CreatorPro Z16P B12UKST
RTX A3000 Laptop GPU, i7-12700H, Samsung PM9A1 MZVL21T0HCLR
7086 Points +3%
MSI WE76 11UM-456
RTX A5000 Laptop GPU, i9-11980HK, Samsung PM9A1 MZVL22T0HBLB
7023 Points +2%
Average Intel Core i9-12950HX, NVIDIA RTX A5500 Laptop GPU
  (6883 - 7236, n=3)
7012 Points +2%
Dell Precision 7000 7670 Performance
RTX A5500 Laptop GPU, i9-12950HX
6883 Points
Dell Precision 7670
RTX A2000 Laptop GPU, i7-12850HX, SK Hynix HFS001TEJ9X115N
6663 Points -3%
HP ZBook Studio 16 G9 62U04EA
RTX A2000 Laptop GPU, i7-12800H, Micron 3400 1TB MTFDKBA1T0TFH
6321 Points -8%
Lenovo ThinkPad P1 G4-20Y4Z9DVUS
T1200 Laptop GPU, i7-11800H, Samsung PM9A1 MZVL2512HCJQ
6147 Points -11%
HP ZBook Firefly 16 G9-6B897EA
T550 Laptop GPU, i7-1265U, Samsung PM9A1 MZVL21T0HCLR
5634 Points -18%
PCMark 10 / Essentials
Dell Precision 7000 7670 Performance
RTX A5500 Laptop GPU, i9-12950HX
11465 Points
Average Intel Core i9-12950HX, NVIDIA RTX A5500 Laptop GPU
  (10898 - 11465, n=3)
11107 Points -3%
MSI CreatorPro Z16P B12UKST
RTX A3000 Laptop GPU, i7-12700H, Samsung PM9A1 MZVL21T0HCLR
10583 Points -8%
Dell Precision 7670
RTX A2000 Laptop GPU, i7-12850HX, SK Hynix HFS001TEJ9X115N
10555 Points -8%
HP ZBook Firefly 16 G9-6B897EA
T550 Laptop GPU, i7-1265U, Samsung PM9A1 MZVL21T0HCLR
10250 Points -11%
Lenovo ThinkPad P1 G4-20Y4Z9DVUS
T1200 Laptop GPU, i7-11800H, Samsung PM9A1 MZVL2512HCJQ
9956 Points -13%
MSI WE76 11UM-456
RTX A5000 Laptop GPU, i9-11980HK, Samsung PM9A1 MZVL22T0HBLB
9591 Points -16%
HP ZBook Studio 16 G9 62U04EA
RTX A2000 Laptop GPU, i7-12800H, Micron 3400 1TB MTFDKBA1T0TFH
9431 Points -18%
PCMark 10 / Productivity
MSI WE76 11UM-456
RTX A5000 Laptop GPU, i9-11980HK, Samsung PM9A1 MZVL22T0HBLB
9604 Points +19%
MSI CreatorPro Z16P B12UKST
RTX A3000 Laptop GPU, i7-12700H, Samsung PM9A1 MZVL21T0HCLR
9351 Points +16%
Dell Precision 7670
RTX A2000 Laptop GPU, i7-12850HX, SK Hynix HFS001TEJ9X115N
9008 Points +12%
Average Intel Core i9-12950HX, NVIDIA RTX A5500 Laptop GPU
  (8054 - 9489, n=3)
8833 Points +10%
HP ZBook Firefly 16 G9-6B897EA
T550 Laptop GPU, i7-1265U, Samsung PM9A1 MZVL21T0HCLR
8562 Points +6%
Lenovo ThinkPad P1 G4-20Y4Z9DVUS
T1200 Laptop GPU, i7-11800H, Samsung PM9A1 MZVL2512HCJQ
8353 Points +4%
Dell Precision 7000 7670 Performance
RTX A5500 Laptop GPU, i9-12950HX
8054 Points
HP ZBook Studio 16 G9 62U04EA
RTX A2000 Laptop GPU, i7-12800H, Micron 3400 1TB MTFDKBA1T0TFH
7889 Points -2%
PCMark 10 / Digital Content Creation
MSI WE76 11UM-456
RTX A5000 Laptop GPU, i9-11980HK, Samsung PM9A1 MZVL22T0HBLB
10203 Points +6%
MSI CreatorPro Z16P B12UKST
RTX A3000 Laptop GPU, i7-12700H, Samsung PM9A1 MZVL21T0HCLR
9757 Points +2%
Dell Precision 7000 7670 Performance
RTX A5500 Laptop GPU, i9-12950HX
9583 Points
Average Intel Core i9-12950HX, NVIDIA RTX A5500 Laptop GPU
  (9155 - 9944, n=3)
9561 Points 0%
HP ZBook Studio 16 G9 62U04EA
RTX A2000 Laptop GPU, i7-12800H, Micron 3400 1TB MTFDKBA1T0TFH
9212 Points -4%
Dell Precision 7670
RTX A2000 Laptop GPU, i7-12850HX, SK Hynix HFS001TEJ9X115N
8443 Points -12%
Lenovo ThinkPad P1 G4-20Y4Z9DVUS
T1200 Laptop GPU, i7-11800H, Samsung PM9A1 MZVL2512HCJQ
7581 Points -21%
HP ZBook Firefly 16 G9-6B897EA
T550 Laptop GPU, i7-1265U, Samsung PM9A1 MZVL21T0HCLR
5530 Points -42%
CrossMark / Overall
MSI CreatorPro Z16P B12UKST
RTX A3000 Laptop GPU, i7-12700H, Samsung PM9A1 MZVL21T0HCLR
1932 Points +7%
Average Intel Core i9-12950HX, NVIDIA RTX A5500 Laptop GPU
  (1801 - 1889, n=3)
1859 Points +3%
HP ZBook Studio 16 G9 62U04EA
RTX A2000 Laptop GPU, i7-12800H, Micron 3400 1TB MTFDKBA1T0TFH
1843 Points +2%
Dell Precision 7000 7670 Performance
RTX A5500 Laptop GPU, i9-12950HX
1801 Points
MSI WE76 11UM-456
RTX A5000 Laptop GPU, i9-11980HK, Samsung PM9A1 MZVL22T0HBLB
1674 Points -7%
HP ZBook Firefly 16 G9-6B897EA
T550 Laptop GPU, i7-1265U, Samsung PM9A1 MZVL21T0HCLR
1623 Points -10%
Lenovo ThinkPad P1 G4-20Y4Z9DVUS
T1200 Laptop GPU, i7-11800H, Samsung PM9A1 MZVL2512HCJQ
1526 Points -15%
Dell Precision 7670
RTX A2000 Laptop GPU, i7-12850HX, SK Hynix HFS001TEJ9X115N
1509 Points -16%
CrossMark / Productivity
MSI CreatorPro Z16P B12UKST
RTX A3000 Laptop GPU, i7-12700H, Samsung PM9A1 MZVL21T0HCLR
1823 Points +8%
Average Intel Core i9-12950HX, NVIDIA RTX A5500 Laptop GPU
  (1684 - 1785, n=3)
1741 Points +3%
HP ZBook Studio 16 G9 62U04EA
RTX A2000 Laptop GPU, i7-12800H, Micron 3400 1TB MTFDKBA1T0TFH
1723 Points +2%
Dell Precision 7000 7670 Performance
RTX A5500 Laptop GPU, i9-12950HX
1684 Points
MSI WE76 11UM-456
RTX A5000 Laptop GPU, i9-11980HK, Samsung PM9A1 MZVL22T0HBLB
1625 Points -4%
HP ZBook Firefly 16 G9-6B897EA
T550 Laptop GPU, i7-1265U, Samsung PM9A1 MZVL21T0HCLR
1592 Points -5%
Lenovo ThinkPad P1 G4-20Y4Z9DVUS
T1200 Laptop GPU, i7-11800H, Samsung PM9A1 MZVL2512HCJQ
1521 Points -10%
Dell Precision 7670
RTX A2000 Laptop GPU, i7-12850HX, SK Hynix HFS001TEJ9X115N
1445 Points -14%
CrossMark / Creativity
Average Intel Core i9-12950HX, NVIDIA RTX A5500 Laptop GPU
  (2042 - 2192, n=3)
2118 Points +4%
HP ZBook Studio 16 G9 62U04EA
RTX A2000 Laptop GPU, i7-12800H, Micron 3400 1TB MTFDKBA1T0TFH
2091 Points +2%
MSI CreatorPro Z16P B12UKST
RTX A3000 Laptop GPU, i7-12700H, Samsung PM9A1 MZVL21T0HCLR
2071 Points +1%
Dell Precision 7000 7670 Performance
RTX A5500 Laptop GPU, i9-12950HX
2042 Points
MSI WE76 11UM-456
RTX A5000 Laptop GPU, i9-11980HK, Samsung PM9A1 MZVL22T0HBLB
1783 Points -13%
HP ZBook Firefly 16 G9-6B897EA
T550 Laptop GPU, i7-1265U, Samsung PM9A1 MZVL21T0HCLR
1751 Points -14%
Dell Precision 7670
RTX A2000 Laptop GPU, i7-12850HX, SK Hynix HFS001TEJ9X115N
1682 Points -18%
Lenovo ThinkPad P1 G4-20Y4Z9DVUS
T1200 Laptop GPU, i7-11800H, Samsung PM9A1 MZVL2512HCJQ
1606 Points -21%
CrossMark / Responsiveness
MSI CreatorPro Z16P B12UKST
RTX A3000 Laptop GPU, i7-12700H, Samsung PM9A1 MZVL21T0HCLR
1865 Points +23%
HP ZBook Studio 16 G9 62U04EA
RTX A2000 Laptop GPU, i7-12800H, Micron 3400 1TB MTFDKBA1T0TFH
1545 Points +2%
Average Intel Core i9-12950HX, NVIDIA RTX A5500 Laptop GPU
  (1501 - 1585, n=3)
1533 Points +1%
Dell Precision 7000 7670 Performance
RTX A5500 Laptop GPU, i9-12950HX
1514 Points
MSI WE76 11UM-456
RTX A5000 Laptop GPU, i9-11980HK, Samsung PM9A1 MZVL22T0HBLB
1513 Points 0%
HP ZBook Firefly 16 G9-6B897EA
T550 Laptop GPU, i7-1265U, Samsung PM9A1 MZVL21T0HCLR
1367 Points -10%
Lenovo ThinkPad P1 G4-20Y4Z9DVUS
T1200 Laptop GPU, i7-11800H, Samsung PM9A1 MZVL2512HCJQ
1323 Points -13%
Dell Precision 7670
RTX A2000 Laptop GPU, i7-12850HX, SK Hynix HFS001TEJ9X115N
1238 Points -18%
PCMark 10 Score
6883 poäng
Hjälp
AIDA64 / Memory Copy
Dell Precision 7000 7670 Performance
Intel Core i9-12950HX, RTX A5500 Laptop GPU
64170 MB/s
Average Intel Core i9-12950HX
  (59731 - 64732, n=7)
63039 MB/s -2%
Dell Precision 7670
Intel Core i7-12850HX, RTX A2000 Laptop GPU
62841 MB/s -2%
MSI CreatorPro Z16P B12UKST
Intel Core i7-12700H, RTX A3000 Laptop GPU
62711 MB/s -2%
HP ZBook Studio 16 G9 62U04EA
Intel Core i7-12800H, RTX A2000 Laptop GPU
61978 MB/s -3%
HP ZBook Firefly 16 G9-6B897EA
Intel Core i7-1265U, T550 Laptop GPU
55090 MB/s -14%
Lenovo ThinkPad P1 G4-20Y4Z9DVUS
Intel Core i7-11800H, T1200 Laptop GPU
39344 MB/s -39%
AIDA64 / Memory Read
Dell Precision 7670
Intel Core i7-12850HX, RTX A2000 Laptop GPU
68747 MB/s 0%
Dell Precision 7000 7670 Performance
Intel Core i9-12950HX, RTX A5500 Laptop GPU
68608 MB/s
Average Intel Core i9-12950HX
  (59744 - 70359, n=7)
66028 MB/s -4%
MSI CreatorPro Z16P B12UKST
Intel Core i7-12700H, RTX A3000 Laptop GPU
65648 MB/s -4%
HP ZBook Studio 16 G9 62U04EA
Intel Core i7-12800H, RTX A2000 Laptop GPU
65470 MB/s -5%
HP ZBook Firefly 16 G9-6B897EA
Intel Core i7-1265U, T550 Laptop GPU
52496 MB/s -23%
Lenovo ThinkPad P1 G4-20Y4Z9DVUS
Intel Core i7-11800H, T1200 Laptop GPU
40872 MB/s -40%
AIDA64 / Memory Write
MSI CreatorPro Z16P B12UKST
Intel Core i7-12700H, RTX A3000 Laptop GPU
65459 MB/s 0%
Dell Precision 7000 7670 Performance
Intel Core i9-12950HX, RTX A5500 Laptop GPU
65376 MB/s
HP ZBook Studio 16 G9 62U04EA
Intel Core i7-12800H, RTX A2000 Laptop GPU
64424 MB/s -1%
Dell Precision 7670
Intel Core i7-12850HX, RTX A2000 Laptop GPU
64365 MB/s -2%
Average Intel Core i9-12950HX
  (57750 - 67899, n=7)
63186 MB/s -3%
HP ZBook Firefly 16 G9-6B897EA
Intel Core i7-1265U, T550 Laptop GPU
61651 MB/s -6%
Lenovo ThinkPad P1 G4-20Y4Z9DVUS
Intel Core i7-11800H, T1200 Laptop GPU
40723 MB/s -38%
AIDA64 / Memory Latency
MSI CreatorPro Z16P B12UKST
Intel Core i7-12700H, RTX A3000 Laptop GPU
95.2 ns * -13%
HP ZBook Firefly 16 G9-6B897EA
Intel Core i7-1265U, T550 Laptop GPU
90.5 ns * -7%
HP ZBook Studio 16 G9 62U04EA
Intel Core i7-12800H, RTX A2000 Laptop GPU
89.3 ns * -6%
Dell Precision 7670
Intel Core i7-12850HX, RTX A2000 Laptop GPU
88.5 ns * -5%
Average Intel Core i9-12950HX
  (84.5 - 92.2, n=7)
87.9 ns * -4%
Dell Precision 7000 7670 Performance
Intel Core i9-12950HX, RTX A5500 Laptop GPU
84.5 ns *
Lenovo ThinkPad P1 G4-20Y4Z9DVUS
Intel Core i7-11800H, T1200 Laptop GPU
83.8 ns * +1%

* ... smaller is better

DPC-latenstid

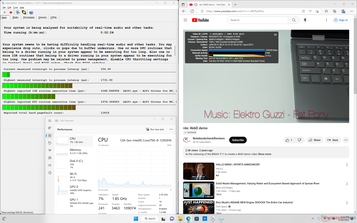
LatencyMon avslöjar DPC-problem när man öppnar flera webbläsarflikar på vår hemsida, även efter flera omprovningar. uppspelning av 4K-video vid 60 FPS är i övrigt smidig och utan några tappade bilder.

DPC Latencies / LatencyMon - interrupt to process latency (max), Web, Youtube, Prime95
Dell Precision 7000 7670 Performance
RTX A5500 Laptop GPU, i9-12950HX
1731.9 μs *
Lenovo ThinkPad P1 G4-20Y4Z9DVUS
T1200 Laptop GPU, i7-11800H, Samsung PM9A1 MZVL2512HCJQ
1419 μs * +18%
Dell Precision 7670
RTX A2000 Laptop GPU, i7-12850HX, SK Hynix HFS001TEJ9X115N
1205.3 μs * +30%
HP ZBook Studio 16 G9 62U04EA
RTX A2000 Laptop GPU, i7-12800H, Micron 3400 1TB MTFDKBA1T0TFH
1136.6 μs * +34%
HP ZBook Firefly 16 G9-6B897EA
T550 Laptop GPU, i7-1265U, Samsung PM9A1 MZVL21T0HCLR
1004.6 μs * +42%
MSI CreatorPro Z16P B12UKST
RTX A3000 Laptop GPU, i7-12700H, Samsung PM9A1 MZVL21T0HCLR
512.3 μs * +70%

* ... smaller is better

Lagringsenheter

Användare kan installera upp till tre PCIe4 x4 NVMe M.2 2280 SSD-diskar istället för bara två på den smalare vanliga modellen. två SK Hynix PC801 enheterna i vår enhet är installerade i RAID 0-konfiguration för vansinnigt höga sekventiella läs- och skrivhastigheter i verkligheten på cirka 13000 MB/s respektive 10000 MB/s. Varje SSD-fack har en egen värmespridare och en egen termisk kudde för värmeavledning.

AS SSD
AS SSD
CDM 8
CDM 8
Två M.2 2280-kortplatser under höger handflatsstöd
Upptaget SSD-fack nära mitten. Dell erbjuder som tillval en liten lucka på bottenplattan för att underlätta åtkomsten till denna enhet utan att behöva ta bort hela bottenplattan
CDM 5/6 Read Seq Q32T1: 12608 MB/s
CDM 5/6 Write Seq Q32T1: 9095 MB/s
CDM 5/6 Read 4K Q32T1: 789.1 MB/s
CDM 5/6 Write 4K Q32T1: 573.5 MB/s
CDM 5 Read Seq: 8343 MB/s
CDM 5 Write Seq: 7516 MB/s
CDM 5/6 Read 4K: 59.98 MB/s
CDM 5/6 Write 4K: 139.7 MB/s
Drive Performance Rating - Percent
MSI CreatorPro Z16P B12UKST -8!
Samsung PM9A1 MZVL21T0HCLR
93 pt
Dell Precision 7670
SK Hynix HFS001TEJ9X115N
73.7 pt
Dell Precision 7000 7670 Performance
 
73.2 pt
HP ZBook Studio 16 G9 62U04EA
Micron 3400 1TB MTFDKBA1T0TFH
68.4 pt
Lenovo ThinkPad P1 G4-20Y4Z9DVUS
Samsung PM9A1 MZVL2512HCJQ
67.6 pt
HP ZBook Firefly 16 G9-6B897EA
Samsung PM9A1 MZVL21T0HCLR
66 pt
Global Average -3
 
45.4 pt
DiskSpd
seq read
HP ZBook Firefly 16 G9-6B897EA
Samsung PM9A1 MZVL21T0HCLR
3673 (3577.53min - 3673.16max) MB/s +28%
HP ZBook Studio 16 G9 62U04EA
Micron 3400 1TB MTFDKBA1T0TFH
3491 (3384.54min - 3491.28max) MB/s +22%
Lenovo ThinkPad P1 G4-20Y4Z9DVUS
Samsung PM9A1 MZVL2512HCJQ
3198 (2801.23min - 3198.05max) MB/s +12%
Dell Precision 7670
SK Hynix HFS001TEJ9X115N
2931 (2920.07min - 2930.98max) MB/s +2%
Dell Precision 7000 7670 Performance
 
2866 (2835.56min - 2866.32max) MB/s
Global Average -3
  (38.2 - 7045, n=1705)
2341 MB/s -18%
seq write
Dell Precision 7670
SK Hynix HFS001TEJ9X115N
7185 (7028.4min - 7184.53max) MB/s 0%
Dell Precision 7000 7670 Performance
 
7175 (1565.94min - 7174.57max) MB/s
HP ZBook Studio 16 G9 62U04EA
Micron 3400 1TB MTFDKBA1T0TFH
3248 (2832.2min - 3247.86max) MB/s -55%
HP ZBook Firefly 16 G9-6B897EA
Samsung PM9A1 MZVL21T0HCLR
2780 (2579.79min - 2779.77max) MB/s -61%
Lenovo ThinkPad P1 G4-20Y4Z9DVUS
Samsung PM9A1 MZVL2512HCJQ
2767 (2739.3min - 2767.11max) MB/s -61%
Global Average -3
  (38.2 - 9307, n=1705)
2377 MB/s -67%
seq q8 t1 read
Lenovo ThinkPad P1 G4-20Y4Z9DVUS
Samsung PM9A1 MZVL2512HCJQ
6742 (5587.44min - 6742.34max) MB/s +16%
HP ZBook Studio 16 G9 62U04EA
Micron 3400 1TB MTFDKBA1T0TFH
6607 (6240.5min - 6607.08max) MB/s +13%
HP ZBook Firefly 16 G9-6B897EA
Samsung PM9A1 MZVL21T0HCLR
6422 (6030.88min - 6421.85max) MB/s +10%
Dell Precision 7670
SK Hynix HFS001TEJ9X115N
5974 (5689.31min - 5973.95max) MB/s +3%
Dell Precision 7000 7670 Performance
 
5828 (5235.35min - 5828.4max) MB/s
Global Average -3
  (38.5 - 16089, n=1705)
3940 MB/s -32%
seq q8 t1 write
Dell Precision 7670
SK Hynix HFS001TEJ9X115N
9243 (9104.19min - 9242.96max) MB/s +1%
Dell Precision 7000 7670 Performance
 
9136 (9087.94min - 9136.03max) MB/s
HP ZBook Firefly 16 G9-6B897EA
Samsung PM9A1 MZVL21T0HCLR
4945 (3908.4min - 4945.26max) MB/s -46%
Lenovo ThinkPad P1 G4-20Y4Z9DVUS
Samsung PM9A1 MZVL2512HCJQ
4844 (4829.73min - 4844.04max) MB/s -47%
HP ZBook Studio 16 G9 62U04EA
Micron 3400 1TB MTFDKBA1T0TFH
4543 (4312.16min - 4542.64max) MB/s -50%
Global Average -3
  (38.2 - 14571, n=1705)
2969 MB/s -68%
4k q1 t1 read
HP ZBook Firefly 16 G9-6B897EA
Samsung PM9A1 MZVL21T0HCLR
76.6 (75.8min - 76.56max) MB/s +69%
Lenovo ThinkPad P1 G4-20Y4Z9DVUS
Samsung PM9A1 MZVL2512HCJQ
66.8 (66.72min - 66.78max) MB/s +47%
Dell Precision 7670
SK Hynix HFS001TEJ9X115N
58.8 (58.07min - 58.79max) MB/s +30%
Global Average -3
  (0.67 - 361, n=1705)
58.2 MB/s +28%
HP ZBook Studio 16 G9 62U04EA
Micron 3400 1TB MTFDKBA1T0TFH
49.4 (46.05min - 49.39max) MB/s +9%
Dell Precision 7000 7670 Performance
 
45.4 (43.55min - 45.41max) MB/s
4k q1 t1 write
Global Average -3
  (1.23 - 435, n=1704)
165.7 MB/s +24%
HP ZBook Studio 16 G9 62U04EA
Micron 3400 1TB MTFDKBA1T0TFH
153 (151.36min - 152.95max) MB/s +15%
HP ZBook Firefly 16 G9-6B897EA
Samsung PM9A1 MZVL21T0HCLR
150.6 (147.55min - 150.64max) MB/s +13%
Lenovo ThinkPad P1 G4-20Y4Z9DVUS
Samsung PM9A1 MZVL2512HCJQ
140 (139.56min - 139.91max) MB/s +5%
Dell Precision 7670
SK Hynix HFS001TEJ9X115N
135.6 (133.9min - 135.64max) MB/s +2%
Dell Precision 7000 7670 Performance
 
133.3 (131.44min - 133.32max) MB/s
4k q32 t16 read
Global Average -3
  (1.03 - 6172, n=1704)
1409 MB/s +18%
Dell Precision 7000 7670 Performance
 
1190 (1106.16min - 1189.5max) MB/s
Dell Precision 7670
SK Hynix HFS001TEJ9X115N
1176 (1023.94min - 1175.98max) MB/s -1%
Lenovo ThinkPad P1 G4-20Y4Z9DVUS
Samsung PM9A1 MZVL2512HCJQ
934 (920.06min - 933.51max) MB/s -22%
HP ZBook Studio 16 G9 62U04EA
Micron 3400 1TB MTFDKBA1T0TFH
920 (850.96min - 920.44max) MB/s -23%
HP ZBook Firefly 16 G9-6B897EA
Samsung PM9A1 MZVL21T0HCLR
577 (387.58min - 576.63max) MB/s -52%
4k q32 t16 write
Dell Precision 7000 7670 Performance
 
1243 (1141.93min - 1243.27max) MB/s
Global Average -3
  (1.5 - 5171, n=1704)
1210 MB/s -3%
Dell Precision 7670
SK Hynix HFS001TEJ9X115N
1192 (947.36min - 1192.4max) MB/s -4%
HP ZBook Studio 16 G9 62U04EA
Micron 3400 1TB MTFDKBA1T0TFH
425 (417.87min - 425.06max) MB/s -66%
HP ZBook Firefly 16 G9-6B897EA
Samsung PM9A1 MZVL21T0HCLR
360 (248.27min - 360.4max) MB/s -71%
Lenovo ThinkPad P1 G4-20Y4Z9DVUS
Samsung PM9A1 MZVL2512HCJQ
291 (285.97min - 290.61max) MB/s -77%
AS SSD
Score Total
MSI CreatorPro Z16P B12UKST
Samsung PM9A1 MZVL21T0HCLR
8992 Points +112%
HP ZBook Studio 16 G9 62U04EA
Micron 3400 1TB MTFDKBA1T0TFH
5422 Points +28%
Lenovo ThinkPad P1 G4-20Y4Z9DVUS
Samsung PM9A1 MZVL2512HCJQ
5398 Points +27%
Dell Precision 7000 7670 Performance
 
4244 Points
Dell Precision 7670
SK Hynix HFS001TEJ9X115N
4226 Points 0%
HP ZBook Firefly 16 G9-6B897EA
Samsung PM9A1 MZVL21T0HCLR
4201 Points -1%
Global Average -3
  (19 - 13854, n=3375)
2869 Points -32%
Score Read
MSI CreatorPro Z16P B12UKST
Samsung PM9A1 MZVL21T0HCLR
3378 Points +96%
Dell Precision 7670
SK Hynix HFS001TEJ9X115N
1730 Points 0%
Dell Precision 7000 7670 Performance
 
1722 Points
Lenovo ThinkPad P1 G4-20Y4Z9DVUS
Samsung PM9A1 MZVL2512HCJQ
1534 Points -11%
HP ZBook Studio 16 G9 62U04EA
Micron 3400 1TB MTFDKBA1T0TFH
1490 Points -13%
Global Average -3
  (6 - 4721, n=3376)
1103 Points -36%
HP ZBook Firefly 16 G9-6B897EA
Samsung PM9A1 MZVL21T0HCLR
983 Points -43%
Score Write
MSI CreatorPro Z16P B12UKST
Samsung PM9A1 MZVL21T0HCLR
3941 Points +133%
HP ZBook Studio 16 G9 62U04EA
Micron 3400 1TB MTFDKBA1T0TFH
3258 Points +93%
Lenovo ThinkPad P1 G4-20Y4Z9DVUS
Samsung PM9A1 MZVL2512HCJQ
3177 Points +88%
HP ZBook Firefly 16 G9-6B897EA
Samsung PM9A1 MZVL21T0HCLR
2814 Points +67%
Dell Precision 7000 7670 Performance
 
1688 Points
Dell Precision 7670
SK Hynix HFS001TEJ9X115N
1662 Points -2%
Global Average -3
  (4 - 7208, n=3376)
1231 Points -27%
Seq Read
Dell Precision 7000 7670 Performance
 
7378.74 MB/s
Dell Precision 7670
SK Hynix HFS001TEJ9X115N
7153.24 MB/s -3%
MSI CreatorPro Z16P B12UKST
Samsung PM9A1 MZVL21T0HCLR
5033 MB/s -32%
HP ZBook Firefly 16 G9-6B897EA
Samsung PM9A1 MZVL21T0HCLR
4900 MB/s -34%
HP ZBook Studio 16 G9 62U04EA
Micron 3400 1TB MTFDKBA1T0TFH
4845 MB/s -34%
Lenovo ThinkPad P1 G4-20Y4Z9DVUS
Samsung PM9A1 MZVL2512HCJQ
4112 MB/s -44%
Global Average -3
  (226 - 12763, n=3592)
1945 MB/s -74%
Seq Write
Dell Precision 7000 7670 Performance
 
6301.74 MB/s
Dell Precision 7670
SK Hynix HFS001TEJ9X115N
5986.45 MB/s -5%
MSI CreatorPro Z16P B12UKST
Samsung PM9A1 MZVL21T0HCLR
3879 MB/s -38%
HP ZBook Studio 16 G9 62U04EA
Micron 3400 1TB MTFDKBA1T0TFH
2831 MB/s -55%
HP ZBook Firefly 16 G9-6B897EA
Samsung PM9A1 MZVL21T0HCLR
2420 MB/s -62%
Lenovo ThinkPad P1 G4-20Y4Z9DVUS
Samsung PM9A1 MZVL2512HCJQ
1785 MB/s -72%
Global Average -3
  (52.2 - 11316, n=3595)
1309 MB/s -79%
4K Read
MSI CreatorPro Z16P B12UKST
Samsung PM9A1 MZVL21T0HCLR
84 MB/s +53%
HP ZBook Firefly 16 G9-6B897EA
Samsung PM9A1 MZVL21T0HCLR
72.61 MB/s +32%
Lenovo ThinkPad P1 G4-20Y4Z9DVUS
Samsung PM9A1 MZVL2512HCJQ
72.2 MB/s +31%
HP ZBook Studio 16 G9 62U04EA
Micron 3400 1TB MTFDKBA1T0TFH
59.57 MB/s +8%
Dell Precision 7000 7670 Performance
 
54.93 MB/s
Dell Precision 7670
SK Hynix HFS001TEJ9X115N
54.37 MB/s -1%
Global Average -3
  (6.08 - 314, n=3585)
42 MB/s -24%
4K Write
MSI CreatorPro Z16P B12UKST
Samsung PM9A1 MZVL21T0HCLR
217.2 MB/s +66%
HP ZBook Firefly 16 G9-6B897EA
Samsung PM9A1 MZVL21T0HCLR
191.99 MB/s +47%
HP ZBook Studio 16 G9 62U04EA
Micron 3400 1TB MTFDKBA1T0TFH
168.04 MB/s +29%
Lenovo ThinkPad P1 G4-20Y4Z9DVUS
Samsung PM9A1 MZVL2512HCJQ
164 MB/s +26%
Dell Precision 7000 7670 Performance
 
130.56 MB/s
Dell Precision 7670
SK Hynix HFS001TEJ9X115N
128.07 MB/s -2%
Global Average -3
  (13.3 - 512, n=3585)
112 MB/s -14%
4K-64 Read
MSI CreatorPro Z16P B12UKST
Samsung PM9A1 MZVL21T0HCLR
2790.34 MB/s +200%
Lenovo ThinkPad P1 G4-20Y4Z9DVUS
Samsung PM9A1 MZVL2512HCJQ
1050 MB/s +13%
Dell Precision 7670
SK Hynix HFS001TEJ9X115N
960.49 MB/s +3%
HP ZBook Studio 16 G9 62U04EA
Micron 3400 1TB MTFDKBA1T0TFH
945.86 MB/s +2%
Dell Precision 7000 7670 Performance
 
928.92 MB/s
Global Average -3
  (13.1 - 3600, n=3584)
814 MB/s -12%
HP ZBook Firefly 16 G9-6B897EA
Samsung PM9A1 MZVL21T0HCLR
420.81 MB/s -55%
4K-64 Write
MSI CreatorPro Z16P B12UKST
Samsung PM9A1 MZVL21T0HCLR
3336.29 MB/s +260%
Lenovo ThinkPad P1 G4-20Y4Z9DVUS
Samsung PM9A1 MZVL2512HCJQ
2835 MB/s +206%
HP ZBook Studio 16 G9 62U04EA
Micron 3400 1TB MTFDKBA1T0TFH
2807.07 MB/s +203%
HP ZBook Firefly 16 G9-6B897EA
Samsung PM9A1 MZVL21T0HCLR
2379.47 MB/s +157%
Dell Precision 7670
SK Hynix HFS001TEJ9X115N
935.09 MB/s +1%
Dell Precision 7000 7670 Performance
 
927.41 MB/s
Global Average -3
  (13.7 - 5909, n=3582)
926 MB/s 0%
Access Time Read
Global Average -3
  (0.012 - 33, n=3516)
0.63 ms * -1365%
Dell Precision 7670
SK Hynix HFS001TEJ9X115N
0.055 ms * -28%
Dell Precision 7000 7670 Performance
 
0.043 ms *
Lenovo ThinkPad P1 G4-20Y4Z9DVUS
Samsung PM9A1 MZVL2512HCJQ
0.028 ms * +35%
HP ZBook Studio 16 G9 62U04EA
Micron 3400 1TB MTFDKBA1T0TFH
0.027 ms * +37%
HP ZBook Firefly 16 G9-6B897EA
Samsung PM9A1 MZVL21T0HCLR
0.025 ms * +42%
MSI CreatorPro Z16P B12UKST
Samsung PM9A1 MZVL21T0HCLR
0.022 ms * +49%
Access Time Write
Global Average -3
  (0.011 - 60.7, n=3558)
0.538 ms * -504%
Dell Precision 7670
SK Hynix HFS001TEJ9X115N
0.089 ms * -0%
Dell Precision 7000 7670 Performance
 
0.089 ms *
Lenovo ThinkPad P1 G4-20Y4Z9DVUS
Samsung PM9A1 MZVL2512HCJQ
0.024 ms * +73%
HP ZBook Firefly 16 G9-6B897EA
Samsung PM9A1 MZVL21T0HCLR
0.023 ms * +74%
HP ZBook Studio 16 G9 62U04EA
Micron 3400 1TB MTFDKBA1T0TFH
0.023 ms * +74%
MSI CreatorPro Z16P B12UKST
Samsung PM9A1 MZVL21T0HCLR
0.019 ms * +79%

* ... smaller is better

Disk Throttling: DiskSpd Read Loop, Queue Depth 8

0240480720960120014401680192021602400264028803120336036003840408043204560Tooltip
Dell Precision 7000 7670 Performance: Ø4562 (3855.24-4790.1)

GPU-prestanda

RTX A5500 är ungefär 60 till 80 procent snabbare än RTX A2000 i den smalare Precision 7670 för att vara en av de snabbaste mobila arbetsstationerna på marknaden. Det är inte så mycket bättre än den två år gamla Quadro RTX 5000 i Acer ConceptD 9 Pro eller Asus ProArt StudioBook Pro X, även när det gäller ray-tracing-prestanda. RTX A5000 i den större 17,3-tums MSI WE76 presterar bättre än vår RTX A500 i de flesta benchmarks.

3DMark 11
3DMark 11
Fire Strike
Fire Strike
Fire Strike Ultra
Fire Strike Ultra
Time Spy
Time Spy
Speed Way
Speed Way
 
3DMark
1920x1080 Fire Strike Graphics
MSI WE76 11UM-456
NVIDIA RTX A5000 Laptop GPU, Intel Core i9-11980HK
29610 Points +13%
Dell Precision 7000 7670 Performance
NVIDIA RTX A5500 Laptop GPU, Intel Core i9-12950HX
26260 Points
Acer ConceptD 9 Pro
NVIDIA Quadro RTX 5000 (Laptop), Intel Core i9-9980HK
24354 Points -7%
Average of class Workstation
  (6121 - 45600, n=29, last 2 years)
20806 Points -21%
MSI CreatorPro Z16P B12UKST
NVIDIA RTX A3000 Laptop GPU, Intel Core i7-12700H
19710 Points -25%
Dell Precision 7550
NVIDIA Quadro RTX 5000 Max-Q, Intel Xeon W-10885M
19342 Points -26%
HP ZBook Fury 17 G7 119W5EA
NVIDIA Quadro RTX 4000 Max-Q, Intel Core i9-10885H
17049 Points -35%
Dell Precision 7670
NVIDIA RTX A2000 Laptop GPU, Intel Core i7-12850HX
14295 Points -46%
HP ZBook Studio G7
NVIDIA Quadro RTX 3000 Max-Q, Intel Core i9-10885H
13617 Points -48%
HP ZBook Studio 16 G9 62U04EA
NVIDIA RTX A2000 Laptop GPU, Intel Core i7-12800H
13157 Points -50%
Lenovo ThinkPad P1 G4-20Y4Z9DVUS
NVIDIA T1200 Laptop GPU, Intel Core i7-11800H
10134 Points -61%
Lenovo ThinkPad P15 Gen1-20ST000DGE
NVIDIA Quadro T1000 (Laptop), Intel Core i7-10750H
8757 Points -67%
Dell Precision 3000 3551
NVIDIA Quadro P620, Intel Core i9-10885H
4600 Points -82%
Lenovo ThinkPad P15s Gen1-20T4000JGE
NVIDIA Quadro P520, Intel Core i7-10510U
3281 Points -88%
2560x1440 Time Spy Graphics
MSI WE76 11UM-456
NVIDIA RTX A5000 Laptop GPU, Intel Core i9-11980HK
11580 Points +21%
Acer ConceptD 9 Pro
NVIDIA Quadro RTX 5000 (Laptop), Intel Core i9-9980HK
9956 Points +4%
Dell Precision 7000 7670 Performance
NVIDIA RTX A5500 Laptop GPU, Intel Core i9-12950HX
9568 Points
Average of class Workstation
  (1997 - 19741, n=29, last 2 years)
8356 Points -13%
Dell Precision 7550
NVIDIA Quadro RTX 5000 Max-Q, Intel Xeon W-10885M
7349 Points -23%
MSI CreatorPro Z16P B12UKST
NVIDIA RTX A3000 Laptop GPU, Intel Core i7-12700H
7320 Points -23%
HP ZBook Fury 17 G7 119W5EA
NVIDIA Quadro RTX 4000 Max-Q, Intel Core i9-10885H
6764 Points -29%
Dell Precision 7670
NVIDIA RTX A2000 Laptop GPU, Intel Core i7-12850HX
5831 Points -39%
HP ZBook Studio G7
NVIDIA Quadro RTX 3000 Max-Q, Intel Core i9-10885H
5048 Points -47%
HP ZBook Studio 16 G9 62U04EA
NVIDIA RTX A2000 Laptop GPU, Intel Core i7-12800H
5016 Points -48%
Lenovo ThinkPad P1 G4-20Y4Z9DVUS
NVIDIA T1200 Laptop GPU, Intel Core i7-11800H
3595 Points -62%
Lenovo ThinkPad P15 Gen1-20ST000DGE
NVIDIA Quadro T1000 (Laptop), Intel Core i7-10750H
3273 Points -66%
Dell Precision 3000 3551
NVIDIA Quadro P620, Intel Core i9-10885H
1393 Points -85%
Lenovo ThinkPad P15s Gen1-20T4000JGE
NVIDIA Quadro P520, Intel Core i7-10510U
1024 Points -89%
2560x1440 Speed Way Score
Average of class Workstation
  (973 - 4196, n=16, last 2 years)
2601 Points +15%
Dell Precision 7000 7670 Performance
NVIDIA RTX A5500 Laptop GPU, Intel Core i9-12950HX
2253 Points
2560x1440 Time Spy Score
MSI WE76 11UM-456
NVIDIA RTX A5000 Laptop GPU, Intel Core i9-11980HK
11185 Points +13%
Dell Precision 7000 7670 Performance
NVIDIA RTX A5500 Laptop GPU, Intel Core i9-12950HX
9872 Points
Acer ConceptD 9 Pro
NVIDIA Quadro RTX 5000 (Laptop), Intel Core i9-9980HK
9779 Points -1%
Average of class Workstation
  (2244 - 18674, n=29, last 2 years)
8565 Points -13%
MSI CreatorPro Z16P B12UKST
NVIDIA RTX A3000 Laptop GPU, Intel Core i7-12700H
7703 Points -22%
Dell Precision 7550
NVIDIA Quadro RTX 5000 Max-Q, Intel Xeon W-10885M
7579 Points -23%
HP ZBook Fury 17 G7 119W5EA
NVIDIA Quadro RTX 4000 Max-Q, Intel Core i9-10885H
6724 Points -32%
Dell Precision 7670
NVIDIA RTX A2000 Laptop GPU, Intel Core i7-12850HX
6314 Points -36%
HP ZBook Studio 16 G9 62U04EA
NVIDIA RTX A2000 Laptop GPU, Intel Core i7-12800H
5523 Points -44%
HP ZBook Studio G7
NVIDIA Quadro RTX 3000 Max-Q, Intel Core i9-10885H
5357 Points -46%
Lenovo ThinkPad P1 G4-20Y4Z9DVUS
NVIDIA T1200 Laptop GPU, Intel Core i7-11800H
3937 Points -60%
Lenovo ThinkPad P15 Gen1-20ST000DGE
NVIDIA Quadro T1000 (Laptop), Intel Core i7-10750H
3565 Points -64%
Dell Precision 3000 3551
NVIDIA Quadro P620, Intel Core i9-10885H
1593 Points -84%
Lenovo ThinkPad P15s Gen1-20T4000JGE
NVIDIA Quadro P520, Intel Core i7-10510U
1154 Points -88%
2560x1440 Port Royal Graphics
MSI WE76 11UM-456
NVIDIA RTX A5000 Laptop GPU, Intel Core i9-11980HK
7194 Points +15%
Average of class Workstation
  (2649 - 10321, n=16, last 2 years)
6430 Points +3%
Dell Precision 7000 7670 Performance
NVIDIA RTX A5500 Laptop GPU, Intel Core i9-12950HX
6248 Points
Acer ConceptD 9 Pro
NVIDIA Quadro RTX 5000 (Laptop), Intel Core i9-9980HK
6097 Points -2%
Dell Precision 7550
NVIDIA Quadro RTX 5000 Max-Q, Intel Xeon W-10885M
4391 Points -30%
MSI CreatorPro Z16P B12UKST
NVIDIA RTX A3000 Laptop GPU, Intel Core i7-12700H
4296 Points -31%
Dell Precision 7670
NVIDIA RTX A2000 Laptop GPU, Intel Core i7-12850HX
3385 Points -46%
HP ZBook Studio G7
NVIDIA Quadro RTX 3000 Max-Q, Intel Core i9-10885H
2956 Points -53%
3DMark 11 - 1280x720 Performance GPU
MSI WE76 11UM-456
NVIDIA RTX A5000 Laptop GPU, Intel Core i9-11980HK
41904 Points +18%
Dell Precision 7000 7670 Performance
NVIDIA RTX A5500 Laptop GPU, Intel Core i9-12950HX
35376 Points
Acer ConceptD 9 Pro
NVIDIA Quadro RTX 5000 (Laptop), Intel Core i9-9980HK
32999 Points -7%
Average of class Workstation
  (9356 - 59715, n=29, last 2 years)
29325 Points -17%
Dell Precision 7550
NVIDIA Quadro RTX 5000 Max-Q, Intel Xeon W-10885M
26242 Points -26%
MSI CreatorPro Z16P B12UKST
NVIDIA RTX A3000 Laptop GPU, Intel Core i7-12700H
25990 Points -27%
HP ZBook Fury 17 G7 119W5EA
NVIDIA Quadro RTX 4000 Max-Q, Intel Core i9-10885H
23684 Points -33%
Dell Precision 7670
NVIDIA RTX A2000 Laptop GPU, Intel Core i7-12850HX
19673 Points -44%
HP ZBook Studio 16 G9 62U04EA
NVIDIA RTX A2000 Laptop GPU, Intel Core i7-12800H
18058 Points -49%
HP ZBook Studio G7
NVIDIA Quadro RTX 3000 Max-Q, Intel Core i9-10885H
17523 Points -50%
Lenovo ThinkPad P1 G4-20Y4Z9DVUS
NVIDIA T1200 Laptop GPU, Intel Core i7-11800H
14387 Points -59%
Lenovo ThinkPad P15 Gen1-20ST000DGE
NVIDIA Quadro T1000 (Laptop), Intel Core i7-10750H
11377 Points -68%
Dell Precision 3000 3551
NVIDIA Quadro P620, Intel Core i9-10885H
5850 Points -83%
Lenovo ThinkPad P15s Gen1-20T4000JGE
NVIDIA Quadro P520, Intel Core i7-10510U
4243 Points -88%
SPECviewperf 2020
3840x2160 3ds Max (3dsmax-07)
MSI WE76 11UM-456
NVIDIA RTX A5000 Laptop GPU, Intel Core i9-11980HK
86.9 fps +18%
Dell Precision 7000 7670 Performance
NVIDIA RTX A5500 Laptop GPU, Intel Core i9-12950HX
73.68 fps
Average of class Workstation
  (17.1 - 114.5, n=15, last 2 years)
70.2 fps -5%
HP ZBook Fury 17 G7 119W5EA
NVIDIA Quadro RTX 4000 Max-Q, Intel Core i9-10885H
45.25 fps -39%
Dell Precision 7670
NVIDIA RTX A2000 Laptop GPU, Intel Core i7-12850HX
45.1 fps -39%
HP ZBook Studio 16 G9 62U04EA
NVIDIA RTX A2000 Laptop GPU, Intel Core i7-12800H
42.46 fps -42%
3840x2160 CATIA (catia-06)
MSI WE76 11UM-456
NVIDIA RTX A5000 Laptop GPU, Intel Core i9-11980HK
64.2 fps +2%
Dell Precision 7000 7670 Performance
NVIDIA RTX A5500 Laptop GPU, Intel Core i9-12950HX
62.74 fps
Average of class Workstation
  (12.9 - 80.9, n=15, last 2 years)
54.4 fps -13%
Dell Precision 7670
NVIDIA RTX A2000 Laptop GPU, Intel Core i7-12850HX
37.48 fps -40%
HP ZBook Fury 17 G7 119W5EA
NVIDIA Quadro RTX 4000 Max-Q, Intel Core i9-10885H
35.99 fps -43%
HP ZBook Studio 16 G9 62U04EA
NVIDIA RTX A2000 Laptop GPU, Intel Core i7-12800H
35.95 fps -43%
3840x2160 Creo (creo-03)
MSI WE76 11UM-456
NVIDIA RTX A5000 Laptop GPU, Intel Core i9-11980HK
101.6 fps +82%
Average of class Workstation
  (37.6 - 144.9, n=15, last 2 years)
86.4 fps +55%
Dell Precision 7670
NVIDIA RTX A2000 Laptop GPU, Intel Core i7-12850HX
61.57 fps +10%
HP ZBook Studio 16 G9 62U04EA
NVIDIA RTX A2000 Laptop GPU, Intel Core i7-12800H
61.34 fps +10%
HP ZBook Fury 17 G7 119W5EA
NVIDIA Quadro RTX 4000 Max-Q, Intel Core i9-10885H
58.7 fps +5%
Dell Precision 7000 7670 Performance
NVIDIA RTX A5500 Laptop GPU, Intel Core i9-12950HX
55.8 fps
3840x2160 Energy (energy-03)
Average of class Workstation
  (12.8 - 709, n=15, last 2 years)
85 fps +277%
MSI WE76 11UM-456
NVIDIA RTX A5000 Laptop GPU, Intel Core i9-11980HK
83.3 fps +269%
HP ZBook Studio 16 G9 62U04EA
NVIDIA RTX A2000 Laptop GPU, Intel Core i7-12800H
68.83 fps +205%
HP ZBook Fury 17 G7 119W5EA
NVIDIA Quadro RTX 4000 Max-Q, Intel Core i9-10885H
41.38 fps +83%
Dell Precision 7000 7670 Performance
NVIDIA RTX A5500 Laptop GPU, Intel Core i9-12950HX
22.57 fps
Dell Precision 7670
NVIDIA RTX A2000 Laptop GPU, Intel Core i7-12850HX
11.3 fps -50%
3840x2160 Maya (maya-06)
Dell Precision 7000 7670 Performance
NVIDIA RTX A5500 Laptop GPU, Intel Core i9-12950HX
184.72 fps
Average of class Workstation
  (66.7 - 299, n=15, last 2 years)
176.9 fps -4%
MSI WE76 11UM-456
NVIDIA RTX A5000 Laptop GPU, Intel Core i9-11980HK
129.5 fps -30%
Dell Precision 7670
NVIDIA RTX A2000 Laptop GPU, Intel Core i7-12850HX
88.9 fps -52%
HP ZBook Studio 16 G9 62U04EA
NVIDIA RTX A2000 Laptop GPU, Intel Core i7-12800H
79.76 fps -57%
HP ZBook Fury 17 G7 119W5EA
NVIDIA Quadro RTX 4000 Max-Q, Intel Core i9-10885H
75.8 fps -59%
3840x2160 Medical (medical-03)
Average of class Workstation
  (8.89 - 69.5, n=15, last 2 years)
31.4 fps +29%
Dell Precision 7000 7670 Performance
NVIDIA RTX A5500 Laptop GPU, Intel Core i9-12950HX
24.29 fps
MSI WE76 11UM-456
NVIDIA RTX A5000 Laptop GPU, Intel Core i9-11980HK
23.53 fps -3%
HP ZBook Fury 17 G7 119W5EA
NVIDIA Quadro RTX 4000 Max-Q, Intel Core i9-10885H
14.57 fps -40%
Dell Precision 7670
NVIDIA RTX A2000 Laptop GPU, Intel Core i7-12850HX
12.59 fps -48%
HP ZBook Studio 16 G9 62U04EA
NVIDIA RTX A2000 Laptop GPU, Intel Core i7-12800H
10.02 fps -59%
3840x2160 Siemens NX (snx-04)
Dell Precision 7000 7670 Performance
NVIDIA RTX A5500 Laptop GPU, Intel Core i9-12950HX
279.37 fps
Average of class Workstation
  (34.4 - 362, n=14, last 2 years)
209 fps -25%
MSI WE76 11UM-456
NVIDIA RTX A5000 Laptop GPU, Intel Core i9-11980HK
133.4 fps -52%
Dell Precision 7670
NVIDIA RTX A2000 Laptop GPU, Intel Core i7-12850HX
118.88 fps -57%
HP ZBook Studio 16 G9 62U04EA
NVIDIA RTX A2000 Laptop GPU, Intel Core i7-12800H
116.2 fps -58%
HP ZBook Fury 17 G7 119W5EA
NVIDIA Quadro RTX 4000 Max-Q, Intel Core i9-10885H
111.4 fps -60%
3840x2160 Solidworks (solidworks-05)
Average of class Workstation
  (29.9 - 160.1, n=9, last 2 years)
102.2 fps 0%
Dell Precision 7000 7670 Performance
NVIDIA RTX A5500 Laptop GPU, Intel Core i9-12950HX
102.16 fps
MSI WE76 11UM-456
NVIDIA RTX A5000 Laptop GPU, Intel Core i9-11980HK
82.4 fps -19%
HP ZBook Fury 17 G7 119W5EA
NVIDIA Quadro RTX 4000 Max-Q, Intel Core i9-10885H
63.1 fps -38%
Dell Precision 7670
NVIDIA RTX A2000 Laptop GPU, Intel Core i7-12850HX
59.37 fps -42%
HP ZBook Studio 16 G9 62U04EA
NVIDIA RTX A2000 Laptop GPU, Intel Core i7-12800H
51.19 fps -50%
1920x1080 3ds Max (3dsmax-07)
Dell Precision 7000 7670 Performance
NVIDIA RTX A5500 Laptop GPU, Intel Core i9-12950HX
131.34 fps
MSI WE76 11UM-456
NVIDIA RTX A5000 Laptop GPU, Intel Core i9-11980HK
129.6 fps -1%
MSI CreatorPro Z16P B12UKST
NVIDIA RTX A3000 Laptop GPU, Intel Core i7-12700H
103.02 fps -22%
Average of class Workstation
  (28.5 - 208, n=28, last 2 years)
96.6 fps -26%
Dell Precision 7670
NVIDIA RTX A2000 Laptop GPU, Intel Core i7-12850HX
69.89 fps -47%
HP ZBook Studio G7
NVIDIA Quadro RTX 3000 Max-Q, Intel Core i9-10885H
65.5 fps -50%
HP ZBook Fury 17 G7 119W5EA
NVIDIA Quadro RTX 4000 Max-Q, Intel Core i9-10885H
64.1 fps -51%
HP ZBook Studio 16 G9 62U04EA
NVIDIA RTX A2000 Laptop GPU, Intel Core i7-12800H
62.64 fps -52%
Lenovo ThinkPad P1 G4-20Y4Z9DVUS
NVIDIA T1200 Laptop GPU, Intel Core i7-11800H
50.2 fps -62%
Lenovo ThinkPad P15 Gen1-20ST000DGE
NVIDIA Quadro T1000 (Laptop), Intel Core i7-10750H
45.26 fps -66%
Lenovo ThinkPad P15s Gen1-20T4000JGE
NVIDIA Quadro P520, Intel Core i7-10510U
11.78 fps -91%
1920x1080 CATIA (catia-06)
MSI WE76 11UM-456
NVIDIA RTX A5000 Laptop GPU, Intel Core i9-11980HK
106 fps +2%
Dell Precision 7000 7670 Performance
NVIDIA RTX A5500 Laptop GPU, Intel Core i9-12950HX
103.9 fps
MSI CreatorPro Z16P B12UKST
NVIDIA RTX A3000 Laptop GPU, Intel Core i7-12700H
80.27 fps -23%
Average of class Workstation
  (21 - 131.4, n=28, last 2 years)
78.5 fps -24%
Dell Precision 7670
NVIDIA RTX A2000 Laptop GPU, Intel Core i7-12850HX
65.05 fps -37%
HP ZBook Fury 17 G7 119W5EA
NVIDIA Quadro RTX 4000 Max-Q, Intel Core i9-10885H
60.5 fps -42%
HP ZBook Studio 16 G9 62U04EA
NVIDIA RTX A2000 Laptop GPU, Intel Core i7-12800H
57.81 fps -44%
HP ZBook Studio G7
NVIDIA Quadro RTX 3000 Max-Q, Intel Core i9-10885H
56.4 fps -46%
Lenovo ThinkPad P1 G4-20Y4Z9DVUS
NVIDIA T1200 Laptop GPU, Intel Core i7-11800H
41.6 fps -60%
Lenovo ThinkPad P15 Gen1-20ST000DGE
NVIDIA Quadro T1000 (Laptop), Intel Core i7-10750H
33.57 fps -68%
Lenovo ThinkPad P15s Gen1-20T4000JGE
NVIDIA Quadro P520, Intel Core i7-10510U
12.9 fps -88%
1920x1080 Creo (creo-03)
Dell Precision 7000 7670 Performance
NVIDIA RTX A5500 Laptop GPU, Intel Core i9-12950HX
155.32 fps
MSI WE76 11UM-456
NVIDIA RTX A5000 Laptop GPU, Intel Core i9-11980HK
132.6 fps -15%
Dell Precision 7670
NVIDIA RTX A2000 Laptop GPU, Intel Core i7-12850HX
111.74 fps -28%
Average of class Workstation
  (45.9 - 169.5, n=28, last 2 years)
110.2 fps -29%
MSI CreatorPro Z16P B12UKST
NVIDIA RTX A3000 Laptop GPU, Intel Core i7-12700H
101.07 fps -35%
HP ZBook Studio G7
NVIDIA Quadro RTX 3000 Max-Q, Intel Core i9-10885H
101 fps -35%
HP ZBook Studio 16 G9 62U04EA
NVIDIA RTX A2000 Laptop GPU, Intel Core i7-12800H
93.92 fps -40%
HP ZBook Fury 17 G7 119W5EA
NVIDIA Quadro RTX 4000 Max-Q, Intel Core i9-10885H
88.3 fps -43%
Lenovo ThinkPad P1 G4-20Y4Z9DVUS
NVIDIA T1200 Laptop GPU, Intel Core i7-11800H
78.7 fps -49%
Lenovo ThinkPad P15 Gen1-20ST000DGE
NVIDIA Quadro T1000 (Laptop), Intel Core i7-10750H
67.5 fps -57%
Lenovo ThinkPad P15s Gen1-20T4000JGE
NVIDIA Quadro P520, Intel Core i7-10510U
24.11 fps -84%
1920x1080 Energy (energy-03)
MSI WE76 11UM-456
NVIDIA RTX A5000 Laptop GPU, Intel Core i9-11980HK
71.6 fps +11%
Dell Precision 7000 7670 Performance
NVIDIA RTX A5500 Laptop GPU, Intel Core i9-12950HX
64.62 fps
Average of class Workstation
  (2.78 - 109.7, n=28, last 2 years)
48.8 fps -24%
MSI CreatorPro Z16P B12UKST
NVIDIA RTX A3000 Laptop GPU, Intel Core i7-12700H
44.7 fps -31%
Dell Precision 7670
NVIDIA RTX A2000 Laptop GPU, Intel Core i7-12850HX
35.95 fps -44%
HP ZBook Fury 17 G7 119W5EA
NVIDIA Quadro RTX 4000 Max-Q, Intel Core i9-10885H
35.71 fps -45%
HP ZBook Studio 16 G9 62U04EA
NVIDIA RTX A2000 Laptop GPU, Intel Core i7-12800H
33.53 fps -48%
HP ZBook Studio G7
NVIDIA Quadro RTX 3000 Max-Q, Intel Core i9-10885H
29.3 fps -55%
Lenovo ThinkPad P1 G4-20Y4Z9DVUS
NVIDIA T1200 Laptop GPU, Intel Core i7-11800H
19.3 fps -70%
Lenovo ThinkPad P15 Gen1-20ST000DGE
NVIDIA Quadro T1000 (Laptop), Intel Core i7-10750H
15.63 fps -76%
Lenovo ThinkPad P15s Gen1-20T4000JGE
NVIDIA Quadro P520, Intel Core i7-10510U
0.77 fps -99%
1920x1080 Maya (maya-06)
Dell Precision 7000 7670 Performance
NVIDIA RTX A5500 Laptop GPU, Intel Core i9-12950HX
365.31 fps
Average of class Workstation
  (102 - 660, n=28, last 2 years)
310 fps -15%
MSI CreatorPro Z16P B12UKST
NVIDIA RTX A3000 Laptop GPU, Intel Core i7-12700H
286.54 fps -22%
MSI WE76 11UM-456
NVIDIA RTX A5000 Laptop GPU, Intel Core i9-11980HK
270.1 fps -26%
Dell Precision 7670
NVIDIA RTX A2000 Laptop GPU, Intel Core i7-12850HX
241.79 fps -34%
HP ZBook Studio G7
NVIDIA Quadro RTX 3000 Max-Q, Intel Core i9-10885H
177 fps -52%
HP ZBook Studio 16 G9 62U04EA
NVIDIA RTX A2000 Laptop GPU, Intel Core i7-12800H
172.4 fps -53%
HP ZBook Fury 17 G7 119W5EA
NVIDIA Quadro RTX 4000 Max-Q, Intel Core i9-10885H
159.9 fps -56%
Lenovo ThinkPad P1 G4-20Y4Z9DVUS
NVIDIA T1200 Laptop GPU, Intel Core i7-11800H
144.9 fps -60%
Lenovo ThinkPad P15 Gen1-20ST000DGE
NVIDIA Quadro T1000 (Laptop), Intel Core i7-10750H
134.3 fps -63%
Lenovo ThinkPad P15s Gen1-20T4000JGE
NVIDIA Quadro P520, Intel Core i7-10510U
50.1 fps -86%
1920x1080 Medical (medical-03)
Dell Precision 7000 7670 Performance
NVIDIA RTX A5500 Laptop GPU, Intel Core i9-12950HX
64.66 fps
Average of class Workstation
  (15.6 - 152, n=28, last 2 years)
62.1 fps -4%
MSI WE76 11UM-456
NVIDIA RTX A5000 Laptop GPU, Intel Core i9-11980HK
56.6 fps -12%
MSI CreatorPro Z16P B12UKST
NVIDIA RTX A3000 Laptop GPU, Intel Core i7-12700H
46.59 fps -28%
Dell Precision 7670
NVIDIA RTX A2000 Laptop GPU, Intel Core i7-12850HX
38.36 fps -41%
HP ZBook Fury 17 G7 119W5EA
NVIDIA Quadro RTX 4000 Max-Q, Intel Core i9-10885H
38.33 fps -41%
HP ZBook Studio G7
NVIDIA Quadro RTX 3000 Max-Q, Intel Core i9-10885H
33.9 fps -48%
HP ZBook Studio 16 G9 62U04EA
NVIDIA RTX A2000 Laptop GPU, Intel Core i7-12800H
31.84 fps -51%
Lenovo ThinkPad P1 G4-20Y4Z9DVUS
NVIDIA T1200 Laptop GPU, Intel Core i7-11800H
24.85 fps -62%
Lenovo ThinkPad P15 Gen1-20ST000DGE
NVIDIA Quadro T1000 (Laptop), Intel Core i7-10750H
19.16 fps -70%
Lenovo ThinkPad P15s Gen1-20T4000JGE
NVIDIA Quadro P520, Intel Core i7-10510U
8.33 fps -87%
1920x1080 Siemens NX (snx-04)
Dell Precision 7000 7670 Performance
NVIDIA RTX A5500 Laptop GPU, Intel Core i9-12950HX
394.74 fps
MSI CreatorPro Z16P B12UKST
NVIDIA RTX A3000 Laptop GPU, Intel Core i7-12700H
284.49 fps -28%
Average of class Workstation
  (22.3 - 554, n=28, last 2 years)
276 fps -30%
MSI WE76 11UM-456
NVIDIA RTX A5000 Laptop GPU, Intel Core i9-11980HK
260.5 fps -34%
Dell Precision 7670
NVIDIA RTX A2000 Laptop GPU, Intel Core i7-12850HX
219.04 fps -45%
HP ZBook Studio G7
NVIDIA Quadro RTX 3000 Max-Q, Intel Core i9-10885H
184 fps -53%
HP ZBook Fury 17 G7 119W5EA
NVIDIA Quadro RTX 4000 Max-Q, Intel Core i9-10885H
181 fps -54%
HP ZBook Studio 16 G9 62U04EA
NVIDIA RTX A2000 Laptop GPU, Intel Core i7-12800H
179.08 fps -55%
Lenovo ThinkPad P1 G4-20Y4Z9DVUS
NVIDIA T1200 Laptop GPU, Intel Core i7-11800H
164.1 fps -58%
Lenovo ThinkPad P15 Gen1-20ST000DGE
NVIDIA Quadro T1000 (Laptop), Intel Core i7-10750H
132.7 fps -66%
Lenovo ThinkPad P15s Gen1-20T4000JGE
NVIDIA Quadro P520, Intel Core i7-10510U
49.66 fps -87%
1920x1080 Solidworks (solidworks-05)
Dell Precision 7000 7670 Performance
NVIDIA RTX A5500 Laptop GPU, Intel Core i9-12950HX
239.05 fps
Average of class Workstation
  (50.6 - 347, n=21, last 2 years)
179.3 fps -25%
MSI CreatorPro Z16P B12UKST
NVIDIA RTX A3000 Laptop GPU, Intel Core i7-12700H
170.08 fps -29%
MSI WE76 11UM-456
NVIDIA RTX A5000 Laptop GPU, Intel Core i9-11980HK
169 fps -29%
Dell Precision 7670
NVIDIA RTX A2000 Laptop GPU, Intel Core i7-12850HX
142.27 fps -40%
HP ZBook Studio 16 G9 62U04EA
NVIDIA RTX A2000 Laptop GPU, Intel Core i7-12800H
114.52 fps -52%
HP ZBook Fury 17 G7 119W5EA
NVIDIA Quadro RTX 4000 Max-Q, Intel Core i9-10885H
114.4 fps -52%
HP ZBook Studio G7
NVIDIA Quadro RTX 3000 Max-Q, Intel Core i9-10885H
93.8 fps -61%
Lenovo ThinkPad P1 G4-20Y4Z9DVUS
NVIDIA T1200 Laptop GPU, Intel Core i7-11800H
91.2 fps -62%
Lenovo ThinkPad P15 Gen1-20ST000DGE
NVIDIA Quadro T1000 (Laptop), Intel Core i7-10750H
78.8 fps -67%
Lenovo ThinkPad P15s Gen1-20T4000JGE
NVIDIA Quadro P520, Intel Core i7-10510U
26.4 fps -89%
SPECviewperf 13
Solidworks (sw-04)
Acer ConceptD 9 Pro
NVIDIA Quadro RTX 5000 (Laptop), Intel Core i9-9980HK
203.8 fps +4%
Dell Precision 7000 7670 Performance
NVIDIA RTX A5500 Laptop GPU, Intel Core i9-12950HX
196.77 fps
Average of class Workstation
  (91.8 - 230, n=25, last 2 years)
169.8 fps -14%
MSI WE76 11UM-456
NVIDIA RTX A5000 Laptop GPU, Intel Core i9-11980HK
157.7 fps -20%
Dell Precision 7670
NVIDIA RTX A2000 Laptop GPU, Intel Core i7-12850HX
152.94 fps -22%
MSI CreatorPro Z16P B12UKST
NVIDIA RTX A3000 Laptop GPU, Intel Core i7-12700H
151.63 fps -23%
Dell Precision 7550
NVIDIA Quadro RTX 5000 Max-Q, Intel Xeon W-10885M
150.4 fps -24%
Lenovo ThinkPad P1 G4-20Y4Z9DVUS
NVIDIA T1200 Laptop GPU, Intel Core i7-11800H
128.5 fps -35%
HP ZBook Studio G7
NVIDIA Quadro RTX 3000 Max-Q, Intel Core i9-10885H
126.7 fps -36%
HP ZBook Studio 16 G9 62U04EA
NVIDIA RTX A2000 Laptop GPU, Intel Core i7-12800H
121.26 fps -38%
HP ZBook Fury 17 G7 119W5EA
NVIDIA Quadro RTX 4000 Max-Q, Intel Core i9-10885H
112.1 fps -43%
Lenovo ThinkPad P15 Gen1-20ST000DGE
NVIDIA Quadro T1000 (Laptop), Intel Core i7-10750H
105.6 fps -46%
Dell Precision 3000 3551
NVIDIA Quadro P620, Intel Core i9-10885H
86.7 fps -56%
Lenovo ThinkPad P15s Gen1-20T4000JGE
NVIDIA Quadro P520, Intel Core i7-10510U
60.5 fps -69%
Siemens NX (snx-03)
Acer ConceptD 9 Pro
NVIDIA Quadro RTX 5000 (Laptop), Intel Core i9-9980HK
465.3 fps +18%
Dell Precision 7000 7670 Performance
NVIDIA RTX A5500 Laptop GPU, Intel Core i9-12950HX
393.1 fps
MSI WE76 11UM-456
NVIDIA RTX A5000 Laptop GPU, Intel Core i9-11980HK
319.2 fps -19%
Average of class Workstation
  (48.9 - 555, n=25, last 2 years)
303 fps -23%
Dell Precision 7550
NVIDIA Quadro RTX 5000 Max-Q, Intel Xeon W-10885M
295.2 fps -25%
MSI CreatorPro Z16P B12UKST
NVIDIA RTX A3000 Laptop GPU, Intel Core i7-12700H
279.21 fps -29%
HP ZBook Fury 17 G7 119W5EA
NVIDIA Quadro RTX 4000 Max-Q, Intel Core i9-10885H
225.4 fps -43%
Dell Precision 7670
NVIDIA RTX A2000 Laptop GPU, Intel Core i7-12850HX
218.66 fps -44%
HP ZBook Studio G7
NVIDIA Quadro RTX 3000 Max-Q, Intel Core i9-10885H
195.8 fps -50%
HP ZBook Studio 16 G9 62U04EA
NVIDIA RTX A2000 Laptop GPU, Intel Core i7-12800H
190.69 fps -51%
Lenovo ThinkPad P1 G4-20Y4Z9DVUS
NVIDIA T1200 Laptop GPU, Intel Core i7-11800H
161.3 fps -59%
Lenovo ThinkPad P15 Gen1-20ST000DGE
NVIDIA Quadro T1000 (Laptop), Intel Core i7-10750H
133.1 fps -66%
Dell Precision 3000 3551
NVIDIA Quadro P620, Intel Core i9-10885H
89 fps -77%
Lenovo ThinkPad P15s Gen1-20T4000JGE
NVIDIA Quadro P520, Intel Core i7-10510U
49.83 fps -87%
Showcase (showcase-02)
Dell Precision 7000 7670 Performance
NVIDIA RTX A5500 Laptop GPU, Intel Core i9-12950HX
135.67 fps
MSI WE76 11UM-456
NVIDIA RTX A5000 Laptop GPU, Intel Core i9-11980HK
131.9 fps -3%
Acer ConceptD 9 Pro
NVIDIA Quadro RTX 5000 (Laptop), Intel Core i9-9980HK
127.1 fps -6%
MSI CreatorPro Z16P B12UKST
NVIDIA RTX A3000 Laptop GPU, Intel Core i7-12700H
99.91 fps -26%
Average of class Workstation
  (28.6 - 190.3, n=25, last 2 years)
95.9 fps -29%
Dell Precision 7550
NVIDIA Quadro RTX 5000 Max-Q, Intel Xeon W-10885M
95.2 fps -30%
HP ZBook Fury 17 G7 119W5EA
NVIDIA Quadro RTX 4000 Max-Q, Intel Core i9-10885H
89.3 fps -34%
Dell Precision 7670
NVIDIA RTX A2000 Laptop GPU, Intel Core i7-12850HX
75.83 fps -44%
HP ZBook Studio G7
NVIDIA Quadro RTX 3000 Max-Q, Intel Core i9-10885H
71.5 fps -47%
HP ZBook Studio 16 G9 62U04EA
NVIDIA RTX A2000 Laptop GPU, Intel Core i7-12800H
67.42 fps -50%
Lenovo ThinkPad P1 G4-20Y4Z9DVUS
NVIDIA T1200 Laptop GPU, Intel Core i7-11800H
46.84 fps -65%
Lenovo ThinkPad P15 Gen1-20ST000DGE
NVIDIA Quadro T1000 (Laptop), Intel Core i7-10750H
45.71 fps -66%
Dell Precision 3000 3551
NVIDIA Quadro P620, Intel Core i9-10885H
25.28 fps -81%
Lenovo ThinkPad P15s Gen1-20T4000JGE
NVIDIA Quadro P520, Intel Core i7-10510U
14.52 fps -89%
Medical (medical-02)
Acer ConceptD 9 Pro
NVIDIA Quadro RTX 5000 (Laptop), Intel Core i9-9980HK
133.4 fps +1%
Dell Precision 7000 7670 Performance
NVIDIA RTX A5500 Laptop GPU, Intel Core i9-12950HX
132.32 fps
Average of class Workstation
  (37.3 - 272, n=25, last 2 years)
127.6 fps -4%
MSI WE76 11UM-456
NVIDIA RTX A5000 Laptop GPU, Intel Core i9-11980HK
119.1 fps -10%
MSI CreatorPro Z16P B12UKST
NVIDIA RTX A3000 Laptop GPU, Intel Core i7-12700H
102.82 fps -22%
Dell Precision 7550
NVIDIA Quadro RTX 5000 Max-Q, Intel Xeon W-10885M
97.7 fps -26%
HP ZBook Fury 17 G7 119W5EA
NVIDIA Quadro RTX 4000 Max-Q, Intel Core i9-10885H
81.9 fps -38%
Dell Precision 7670
NVIDIA RTX A2000 Laptop GPU, Intel Core i7-12850HX
77.52 fps -41%
HP ZBook Studio G7
NVIDIA Quadro RTX 3000 Max-Q, Intel Core i9-10885H
69.5 fps -47%
HP ZBook Studio 16 G9 62U04EA
NVIDIA RTX A2000 Laptop GPU, Intel Core i7-12800H
69.14 fps -48%
Lenovo ThinkPad P1 G4-20Y4Z9DVUS
NVIDIA T1200 Laptop GPU, Intel Core i7-11800H
53.6 fps -59%
Lenovo ThinkPad P15 Gen1-20ST000DGE
NVIDIA Quadro T1000 (Laptop), Intel Core i7-10750H
41.62 fps -69%
Dell Precision 3000 3551
NVIDIA Quadro P620, Intel Core i9-10885H
25.1 fps -81%
Lenovo ThinkPad P15s Gen1-20T4000JGE
NVIDIA Quadro P520, Intel Core i7-10510U
19.34 fps -85%
Maya (maya-05)
Acer ConceptD 9 Pro
NVIDIA Quadro RTX 5000 (Laptop), Intel Core i9-9980HK
340.8 fps +4%
Dell Precision 7000 7670 Performance
NVIDIA RTX A5500 Laptop GPU, Intel Core i9-12950HX
329.25 fps
Average of class Workstation
  (103 - 449, n=25, last 2 years)
268 fps -19%
MSI WE76 11UM-456
NVIDIA RTX A5000 Laptop GPU, Intel Core i9-11980HK
250.4 fps -24%
MSI CreatorPro Z16P B12UKST
NVIDIA RTX A3000 Laptop GPU, Intel Core i7-12700H
228.37 fps -31%
Dell Precision 7550
NVIDIA Quadro RTX 5000 Max-Q, Intel Xeon W-10885M
210.4 fps -36%
Dell Precision 7670
NVIDIA RTX A2000 Laptop GPU, Intel Core i7-12850HX
206.15 fps -37%
HP ZBook Fury 17 G7 119W5EA
NVIDIA Quadro RTX 4000 Max-Q, Intel Core i9-10885H
162 fps -51%
HP ZBook Studio G7
NVIDIA Quadro RTX 3000 Max-Q, Intel Core i9-10885H
160.8 fps -51%
HP ZBook Studio 16 G9 62U04EA
NVIDIA RTX A2000 Laptop GPU, Intel Core i7-12800H
157.65 fps -52%
Lenovo ThinkPad P1 G4-20Y4Z9DVUS
NVIDIA T1200 Laptop GPU, Intel Core i7-11800H
127.8 fps -61%
Lenovo ThinkPad P15 Gen1-20ST000DGE
NVIDIA Quadro T1000 (Laptop), Intel Core i7-10750H
113.3 fps -66%
Dell Precision 3000 3551
NVIDIA Quadro P620, Intel Core i9-10885H
68.3 fps -79%
Lenovo ThinkPad P15s Gen1-20T4000JGE
NVIDIA Quadro P520, Intel Core i7-10510U
40.97 fps -88%
Energy (energy-02)
MSI WE76 11UM-456
NVIDIA RTX A5000 Laptop GPU, Intel Core i9-11980HK
74.3 fps +17%
Dell Precision 7000 7670 Performance
NVIDIA RTX A5500 Laptop GPU, Intel Core i9-12950HX
63.6 fps
Acer ConceptD 9 Pro
NVIDIA Quadro RTX 5000 (Laptop), Intel Core i9-9980HK
57.3 fps -10%
Average of class Workstation
  (2.77 - 109.7, n=25, last 2 years)
51.9 fps -18%
MSI CreatorPro Z16P B12UKST
NVIDIA RTX A3000 Laptop GPU, Intel Core i7-12700H
44.09 fps -31%
Dell Precision 7550
NVIDIA Quadro RTX 5000 Max-Q, Intel Xeon W-10885M
36.8 fps -42%
Dell Precision 7670
NVIDIA RTX A2000 Laptop GPU, Intel Core i7-12850HX
36.03 fps -43%
HP ZBook Fury 17 G7 119W5EA
NVIDIA Quadro RTX 4000 Max-Q, Intel Core i9-10885H
35.33 fps -44%
HP ZBook Studio 16 G9 62U04EA
NVIDIA RTX A2000 Laptop GPU, Intel Core i7-12800H
33.46 fps -47%
HP ZBook Studio G7
NVIDIA Quadro RTX 3000 Max-Q, Intel Core i9-10885H
27.08 fps -57%
Lenovo ThinkPad P1 G4-20Y4Z9DVUS
NVIDIA T1200 Laptop GPU, Intel Core i7-11800H
19.29 fps -70%
Lenovo ThinkPad P15 Gen1-20ST000DGE
NVIDIA Quadro T1000 (Laptop), Intel Core i7-10750H
15.62 fps -75%
Dell Precision 3000 3551
NVIDIA Quadro P620, Intel Core i9-10885H
8.07 fps -87%
Lenovo ThinkPad P15s Gen1-20T4000JGE
NVIDIA Quadro P520, Intel Core i7-10510U
0.77 fps -99%
Creo (creo-02)
Acer ConceptD 9 Pro
NVIDIA Quadro RTX 5000 (Laptop), Intel Core i9-9980HK
319.8 fps +4%
Dell Precision 7000 7670 Performance
NVIDIA RTX A5500 Laptop GPU, Intel Core i9-12950HX
308.79 fps
MSI WE76 11UM-456
NVIDIA RTX A5000 Laptop GPU, Intel Core i9-11980HK
251.7 fps -18%
Average of class Workstation
  (76.8 - 425, n=25, last 2 years)
247 fps -20%
MSI CreatorPro Z16P B12UKST
NVIDIA RTX A3000 Laptop GPU, Intel Core i7-12700H
235.49 fps -24%
Dell Precision 7550
NVIDIA Quadro RTX 5000 Max-Q, Intel Xeon W-10885M
224.9 fps -27%
HP ZBook Studio G7
NVIDIA Quadro RTX 3000 Max-Q, Intel Core i9-10885H
168.3 fps -45%
HP ZBook Fury 17 G7 119W5EA
NVIDIA Quadro RTX 4000 Max-Q, Intel Core i9-10885H
162.1 fps -48%
HP ZBook Studio 16 G9 62U04EA
NVIDIA RTX A2000 Laptop GPU, Intel Core i7-12800H
149 fps -52%
Lenovo ThinkPad P1 G4-20Y4Z9DVUS
NVIDIA T1200 Laptop GPU, Intel Core i7-11800H
132.9 fps -57%
Lenovo ThinkPad P15 Gen1-20ST000DGE
NVIDIA Quadro T1000 (Laptop), Intel Core i7-10750H
109.5 fps -65%
Dell Precision 3000 3551
NVIDIA Quadro P620, Intel Core i9-10885H
66.2 fps -79%
Lenovo ThinkPad P15s Gen1-20T4000JGE
NVIDIA Quadro P520, Intel Core i7-10510U
36.01 fps -88%
Catia (catia-05)
Dell Precision 7000 7670 Performance
NVIDIA RTX A5500 Laptop GPU, Intel Core i9-12950HX
340.21 fps
Acer ConceptD 9 Pro
NVIDIA Quadro RTX 5000 (Laptop), Intel Core i9-9980HK
338.9 fps 0%
MSI WE76 11UM-456
NVIDIA RTX A5000 Laptop GPU, Intel Core i9-11980HK
280.9 fps -17%
Average of class Workstation
  (99.5 - 418, n=25, last 2 years)
272 fps -20%
MSI CreatorPro Z16P B12UKST
NVIDIA RTX A3000 Laptop GPU, Intel Core i7-12700H
252.25 fps -26%
Dell Precision 7550
NVIDIA Quadro RTX 5000 Max-Q, Intel Xeon W-10885M
242.9 fps -29%
Dell Precision 7670
NVIDIA RTX A2000 Laptop GPU, Intel Core i7-12850HX
230.27 fps -32%
HP ZBook Studio G7
NVIDIA Quadro RTX 3000 Max-Q, Intel Core i9-10885H
194.8 fps -43%
HP ZBook Studio 16 G9 62U04EA
NVIDIA RTX A2000 Laptop GPU, Intel Core i7-12800H
185.92 fps -45%
HP ZBook Fury 17 G7 119W5EA
NVIDIA Quadro RTX 4000 Max-Q, Intel Core i9-10885H
181.6 fps -47%
Lenovo ThinkPad P1 G4-20Y4Z9DVUS
NVIDIA T1200 Laptop GPU, Intel Core i7-11800H
169.4 fps -50%
Lenovo ThinkPad P15 Gen1-20ST000DGE
NVIDIA Quadro T1000 (Laptop), Intel Core i7-10750H
130.5 fps -62%
Dell Precision 3000 3551
NVIDIA Quadro P620, Intel Core i9-10885H
76.6 fps -77%
Lenovo ThinkPad P15s Gen1-20T4000JGE
NVIDIA Quadro P520, Intel Core i7-10510U
48.59 fps -86%
SPECviewperf 12
1900x1060 Solidworks (sw-03)
Acer ConceptD 9 Pro
NVIDIA Quadro RTX 5000 (Laptop), Intel Core i9-9980HK
230.1 fps +19%
Dell Precision 7000 7670 Performance
NVIDIA RTX A5500 Laptop GPU, Intel Core i9-12950HX
193.85 fps
Average of class Workstation
  (88.8 - 226, n=14, last 2 years)
175.5 fps -9%
Dell Precision 7670
NVIDIA RTX A2000 Laptop GPU, Intel Core i7-12850HX
142.51 fps -26%
Dell Precision 7550
NVIDIA Quadro RTX 5000 Max-Q, Intel Xeon W-10885M
138.4 fps -29%
Dell Precision 3000 3551
NVIDIA Quadro P620, Intel Core i9-10885H
93.9 fps -52%
1900x1060 Siemens NX (snx-02)
Acer ConceptD 9 Pro
NVIDIA Quadro RTX 5000 (Laptop), Intel Core i9-9980HK
258.1 fps +20%
Dell Precision 7000 7670 Performance
NVIDIA RTX A5500 Laptop GPU, Intel Core i9-12950HX
214.7 fps
Average of class Workstation
  (27.2 - 309, n=14, last 2 years)
198 fps -8%
Dell Precision 7550
NVIDIA Quadro RTX 5000 Max-Q, Intel Xeon W-10885M
127.5 fps -41%
Dell Precision 7670
NVIDIA RTX A2000 Laptop GPU, Intel Core i7-12850HX
121.11 fps -44%
Dell Precision 3000 3551
NVIDIA Quadro P620, Intel Core i9-10885H
49.5 fps -77%
1900x1060 Showcase (showcase-01)
Dell Precision 7000 7670 Performance
NVIDIA RTX A5500 Laptop GPU, Intel Core i9-12950HX
135.36 fps
Acer ConceptD 9 Pro
NVIDIA Quadro RTX 5000 (Laptop), Intel Core i9-9980HK
126.4 fps -7%
Average of class Workstation
  (30.5 - 172.5, n=14, last 2 years)
119.9 fps -11%
Dell Precision 7550
NVIDIA Quadro RTX 5000 Max-Q, Intel Xeon W-10885M
96.1 fps -29%
Dell Precision 7670
NVIDIA RTX A2000 Laptop GPU, Intel Core i7-12850HX
76.6 fps -43%
Dell Precision 3000 3551
NVIDIA Quadro P620, Intel Core i9-10885H
26.84 fps -80%
1900x1060 Medical (medical-01)
Acer ConceptD 9 Pro
NVIDIA Quadro RTX 5000 (Laptop), Intel Core i9-9980HK
109.3 fps +21%
Average of class Workstation
  (29.5 - 136.7, n=9, last 2 years)
93.6 fps +3%
Dell Precision 7000 7670 Performance
NVIDIA RTX A5500 Laptop GPU, Intel Core i9-12950HX
90.48 fps
Dell Precision 7550
NVIDIA Quadro RTX 5000 Max-Q, Intel Xeon W-10885M
63.3 fps -30%
Dell Precision 7670
NVIDIA RTX A2000 Laptop GPU, Intel Core i7-12850HX
49.9 fps -45%
Dell Precision 3000 3551
NVIDIA Quadro P620, Intel Core i9-10885H
14.32 fps -84%
1900x1060 Maya (maya-04)
Acer ConceptD 9 Pro
NVIDIA Quadro RTX 5000 (Laptop), Intel Core i9-9980HK
179 fps +10%
Dell Precision 7000 7670 Performance
NVIDIA RTX A5500 Laptop GPU, Intel Core i9-12950HX
162.27 fps
Average of class Workstation
  (62.9 - 232, n=14, last 2 years)
154.9 fps -5%
Dell Precision 7670
NVIDIA RTX A2000 Laptop GPU, Intel Core i7-12850HX
102.25 fps -37%
Dell Precision 7550
NVIDIA Quadro RTX 5000 Max-Q, Intel Xeon W-10885M
76.4 fps -53%
Dell Precision 3000 3551
NVIDIA Quadro P620, Intel Core i9-10885H
41.03 fps -75%
1900x1060 Energy (energy-01)
Acer ConceptD 9 Pro
NVIDIA Quadro RTX 5000 (Laptop), Intel Core i9-9980HK
26 fps +44%
Average of class Workstation
  (15.1 - 31.5, n=8, last 2 years)
22.7 fps +26%
Dell Precision 7000 7670 Performance
NVIDIA RTX A5500 Laptop GPU, Intel Core i9-12950HX
18.04 fps
Dell Precision 7550
NVIDIA Quadro RTX 5000 Max-Q, Intel Xeon W-10885M
13.93 fps -23%
Dell Precision 7670
NVIDIA RTX A2000 Laptop GPU, Intel Core i7-12850HX
12.13 fps -33%
Dell Precision 3000 3551
NVIDIA Quadro P620, Intel Core i9-10885H
3.86 fps -79%
1900x1060 Creo (creo-01)
Dell Precision 7000 7670 Performance
NVIDIA RTX A5500 Laptop GPU, Intel Core i9-12950HX
174.43 fps
Acer ConceptD 9 Pro
NVIDIA Quadro RTX 5000 (Laptop), Intel Core i9-9980HK
172.1 fps -1%
Average of class Workstation
  (86.9 - 206, n=13, last 2 years)
159.8 fps -8%
Dell Precision 7550
NVIDIA Quadro RTX 5000 Max-Q, Intel Xeon W-10885M
136 fps -22%
Dell Precision 7670
NVIDIA RTX A2000 Laptop GPU, Intel Core i7-12850HX
125.61 fps -28%
Dell Precision 3000 3551
NVIDIA Quadro P620, Intel Core i9-10885H
59 fps -66%
1900x1060 Catia (catia-04)
Acer ConceptD 9 Pro
NVIDIA Quadro RTX 5000 (Laptop), Intel Core i9-9980HK
220 fps +5%
Dell Precision 7000 7670 Performance
NVIDIA RTX A5500 Laptop GPU, Intel Core i9-12950HX
209.89 fps
Average of class Workstation
  (73.8 - 270, n=14, last 2 years)
198.7 fps -5%
Dell Precision 7670
NVIDIA RTX A2000 Laptop GPU, Intel Core i7-12850HX
147.68 fps -30%
Dell Precision 7550
NVIDIA Quadro RTX 5000 Max-Q, Intel Xeon W-10885M
125 fps -40%
Dell Precision 3000 3551
NVIDIA Quadro P620, Intel Core i9-10885H
53.2 fps -75%
3DMark 11 Performance
29929 poäng
3DMark Fire Strike Score
22698 poäng
3DMark Time Spy Score
9872 poäng
Hjälp
Blender
v3.3 Classroom OPTIX/RTX
HP ZBook Firefly 16 G9-6B897EA
NVIDIA T550 Laptop GPU, Intel Core i7-1265U
269 Seconds * -976%
HP ZBook Studio 16 G9 62U04EA
NVIDIA RTX A2000 Laptop GPU, Intel Core i7-12800H
53 Seconds * -112%
Dell Precision 7670
NVIDIA RTX A2000 Laptop GPU, Intel Core i7-12850HX
42 Seconds * -68%
MSI CreatorPro Z16P B12UKST
NVIDIA RTX A3000 Laptop GPU, Intel Core i7-12700H
34 Seconds * -36%
Dell Precision 7000 7670 Performance
NVIDIA RTX A5500 Laptop GPU, Intel Core i9-12950HX
25 Seconds *
v3.3 Classroom CUDA
HP ZBook Firefly 16 G9-6B897EA
NVIDIA T550 Laptop GPU, Intel Core i7-1265U
285 Seconds * -650%
HP ZBook Studio 16 G9 62U04EA
NVIDIA RTX A2000 Laptop GPU, Intel Core i7-12800H
93 Seconds * -145%
Dell Precision 7670
NVIDIA RTX A2000 Laptop GPU, Intel Core i7-12850HX
79 Seconds * -108%
MSI CreatorPro Z16P B12UKST
NVIDIA RTX A3000 Laptop GPU, Intel Core i7-12700H
60 Seconds * -58%
Dell Precision 7000 7670 Performance
NVIDIA RTX A5500 Laptop GPU, Intel Core i9-12950HX
38 Seconds *
v3.3 Classroom CPU
HP ZBook Firefly 16 G9-6B897EA
NVIDIA T550 Laptop GPU, Intel Core i7-1265U
1326 Seconds * -293%
Dell Precision 7670
NVIDIA RTX A2000 Laptop GPU, Intel Core i7-12850HX
359 Seconds * -7%
MSI CreatorPro Z16P B12UKST
NVIDIA RTX A3000 Laptop GPU, Intel Core i7-12700H
339 Seconds * -1%
HP ZBook Studio 16 G9 62U04EA
NVIDIA RTX A2000 Laptop GPU, Intel Core i7-12800H
337 Seconds * -0%
Dell Precision 7000 7670 Performance
NVIDIA RTX A5500 Laptop GPU, Intel Core i9-12950HX
337 Seconds *

* ... smaller is better

Performance Rating - Percent
Dell Precision 7000 7670 Performance
Intel Core i9-12950HX, NVIDIA RTX A5500 Laptop GPU
100 pt
MSI CreatorPro Z16P B12UKST
Intel Core i7-12700H, NVIDIA RTX A3000 Laptop GPU
76.4 pt
Dell Precision 7670
Intel Core i7-12850HX, NVIDIA RTX A2000 Laptop GPU
68.6 pt
HP ZBook Studio 16 G9 62U04EA
Intel Core i7-12800H, NVIDIA RTX A2000 Laptop GPU
68.3 pt
Lenovo ThinkPad P1 G4-20Y4Z9DVUS -2!
Intel Core i7-11800H, NVIDIA T1200 Laptop GPU
54.6 pt
HP ZBook Firefly 16 G9-6B897EA
Intel Core i7-1265U, NVIDIA T550 Laptop GPU
32.7 pt
The Witcher 3 - 1920x1080 Ultra Graphics & Postprocessing (HBAO+)
Dell Precision 7000 7670 Performance
Intel Core i9-12950HX, NVIDIA RTX A5500 Laptop GPU
101.5 (95min) fps
MSI CreatorPro Z16P B12UKST
Intel Core i7-12700H, NVIDIA RTX A3000 Laptop GPU
59.6 (54min, 56P1) fps -41%
Dell Precision 7670
Intel Core i7-12850HX, NVIDIA RTX A2000 Laptop GPU
57.4 (55min) fps -43%
HP ZBook Studio 16 G9 62U04EA
Intel Core i7-12800H, NVIDIA RTX A2000 Laptop GPU
48.8 (46min, 47P1) fps -52%
Lenovo ThinkPad P1 G4-20Y4Z9DVUS
Intel Core i7-11800H, NVIDIA T1200 Laptop GPU
36.7 (34min, 35P1) fps -64%
HP ZBook Firefly 16 G9-6B897EA
Intel Core i7-1265U, NVIDIA T550 Laptop GPU
19.9 (18min, 18P1) fps -80%
GTA V - 1920x1080 Highest Settings possible AA:4xMSAA + FX AF:16x
Dell Precision 7000 7670 Performance
Intel Core i9-12950HX, NVIDIA RTX A5500 Laptop GPU
102.6 (9.38min, 71.4P1) fps
MSI CreatorPro Z16P B12UKST
Intel Core i7-12700H, NVIDIA RTX A3000 Laptop GPU
95.3 (6.43min, 66.7P1) fps -7%
Dell Precision 7670
Intel Core i7-12850HX, NVIDIA RTX A2000 Laptop GPU
79.1 (5.42min, 52.6P1) fps -23%
HP ZBook Studio 16 G9 62U04EA
Intel Core i7-12800H, NVIDIA RTX A2000 Laptop GPU
72.1 (6.57min, 47.6P1) fps -30%
HP ZBook Firefly 16 G9-6B897EA
Intel Core i7-1265U, NVIDIA T550 Laptop GPU
29.2 (9.17min, 18.9P1) fps -72%
Final Fantasy XV Benchmark - 1920x1080 High Quality
Dell Precision 7000 7670 Performance
Intel Core i9-12950HX, NVIDIA RTX A5500 Laptop GPU
107.8 fps
MSI CreatorPro Z16P B12UKST
Intel Core i7-12700H, NVIDIA RTX A3000 Laptop GPU
64.3 fps -40%
Dell Precision 7670
Intel Core i7-12850HX, NVIDIA RTX A2000 Laptop GPU
60.6 fps -44%
HP ZBook Studio 16 G9 62U04EA
Intel Core i7-12800H, NVIDIA RTX A2000 Laptop GPU
56.4 fps -48%
Lenovo ThinkPad P1 G4-20Y4Z9DVUS
Intel Core i7-11800H, NVIDIA T1200 Laptop GPU
39 fps -64%
HP ZBook Firefly 16 G9-6B897EA
Intel Core i7-1265U, NVIDIA T550 Laptop GPU
22.3 fps -79%
Strange Brigade - 1920x1080 ultra AA:ultra AF:16
Dell Precision 7000 7670 Performance
Intel Core i9-12950HX, NVIDIA RTX A5500 Laptop GPU
177.9 (33.9min, 130.7P1) fps
MSI CreatorPro Z16P B12UKST
Intel Core i7-12700H, NVIDIA RTX A3000 Laptop GPU
108 fps -39%
Dell Precision 7670
Intel Core i7-12850HX, NVIDIA RTX A2000 Laptop GPU
103.5 (61.1min, 79.3P1) fps -42%
HP ZBook Studio 16 G9 62U04EA
Intel Core i7-12800H, NVIDIA RTX A2000 Laptop GPU
92 fps -48%
HP ZBook Firefly 16 G9-6B897EA
Intel Core i7-1265U, NVIDIA T550 Laptop GPU
36 fps -80%
Dota 2 Reborn - 1920x1080 ultra (3/3) best looking
Dell Precision 7000 7670 Performance
Intel Core i9-12950HX, NVIDIA RTX A5500 Laptop GPU
152.9 (133.1min) fps
HP ZBook Studio 16 G9 62U04EA
Intel Core i7-12800H, NVIDIA RTX A2000 Laptop GPU
149.4 (119.4min) fps -2%
MSI CreatorPro Z16P B12UKST
Intel Core i7-12700H, NVIDIA RTX A3000 Laptop GPU
147.1 (127.8min) fps -4%
Dell Precision 7670
Intel Core i7-12850HX, NVIDIA RTX A2000 Laptop GPU
128.8 (100.1min) fps -16%
Lenovo ThinkPad P1 G4-20Y4Z9DVUS
Intel Core i7-11800H, NVIDIA T1200 Laptop GPU
116 (100.4min) fps -24%
HP ZBook Firefly 16 G9-6B897EA
Intel Core i7-1265U, NVIDIA T550 Laptop GPU
85.2 (74.6min) fps -44%
X-Plane 11.11 - 1920x1080 high (fps_test=3)
Dell Precision 7000 7670 Performance
Intel Core i9-12950HX, NVIDIA RTX A5500 Laptop GPU
107.8 fps
MSI CreatorPro Z16P B12UKST
Intel Core i7-12700H, NVIDIA RTX A3000 Laptop GPU
97.5 fps -10%
HP ZBook Studio 16 G9 62U04EA
Intel Core i7-12800H, NVIDIA RTX A2000 Laptop GPU
97 fps -10%
Dell Precision 7670
Intel Core i7-12850HX, NVIDIA RTX A2000 Laptop GPU
85.5 fps -21%
Lenovo ThinkPad P1 G4-20Y4Z9DVUS
Intel Core i7-11800H, NVIDIA T1200 Laptop GPU
75.6 fps -30%
HP ZBook Firefly 16 G9-6B897EA
Intel Core i7-1265U, NVIDIA T550 Laptop GPU
55.5 fps -49%
Final Fantasy XV Benchmark
1280x720 Lite Quality
MSI WE76 11UM-456
Intel Core i9-11980HK, NVIDIA RTX A5000 Laptop GPU
184 fps +8%
MSI CreatorPro Z16P B12UKST
Intel Core i7-12700H, NVIDIA RTX A3000 Laptop GPU
176 fps +3%
Dell Precision 7000 7670 Performance
Intel Core i9-12950HX, NVIDIA RTX A5500 Laptop GPU
170.1 fps
Dell Precision 7550
Intel Xeon W-10885M, NVIDIA Quadro RTX 5000 Max-Q
154 fps -9%
HP ZBook Studio 16 G9 62U04EA
Intel Core i7-12800H, NVIDIA RTX A2000 Laptop GPU
141.7 fps -17%
Dell Precision 7670
Intel Core i7-12850HX, NVIDIA RTX A2000 Laptop GPU
129.5 fps -24%
HP ZBook Fury 17 G7 119W5EA
Intel Core i9-10885H, NVIDIA Quadro RTX 4000 Max-Q
118 fps -31%
Lenovo ThinkPad P1 G4-20Y4Z9DVUS
Intel Core i7-11800H, NVIDIA T1200 Laptop GPU
102 fps -40%
Dell Precision 3000 3551
Intel Core i9-10885H, NVIDIA Quadro P620
51.7 fps -70%
1920x1080 Standard Quality
MSI WE76 11UM-456
Intel Core i9-11980HK, NVIDIA RTX A5000 Laptop GPU
144 fps +4%
Dell Precision 7000 7670 Performance
Intel Core i9-12950HX, NVIDIA RTX A5500 Laptop GPU
138.9 fps
Dell Precision 7550
Intel Xeon W-10885M, NVIDIA Quadro RTX 5000 Max-Q
99.7 fps -28%
HP ZBook Fury 17 G7 119W5EA
Intel Core i9-10885H, NVIDIA Quadro RTX 4000 Max-Q
86.5 fps -38%
MSI CreatorPro Z16P B12UKST
Intel Core i7-12700H, NVIDIA RTX A3000 Laptop GPU
83.8 fps -40%
Dell Precision 7670
Intel Core i7-12850HX, NVIDIA RTX A2000 Laptop GPU
80.4 fps -42%
HP ZBook Studio 16 G9 62U04EA
Intel Core i7-12800H, NVIDIA RTX A2000 Laptop GPU
78 fps -44%
Lenovo ThinkPad P1 G4-20Y4Z9DVUS
Intel Core i7-11800H, NVIDIA T1200 Laptop GPU
56.5 fps -59%
Dell Precision 3000 3551
Intel Core i9-10885H, NVIDIA Quadro P620
25.8 fps -81%
1920x1080 High Quality
MSI WE76 11UM-456
Intel Core i9-11980HK, NVIDIA RTX A5000 Laptop GPU
108 fps 0%
Dell Precision 7000 7670 Performance
Intel Core i9-12950HX, NVIDIA RTX A5500 Laptop GPU
107.8 fps
Dell Precision 7550
Intel Xeon W-10885M, NVIDIA Quadro RTX 5000 Max-Q
77.3 fps -28%
HP ZBook Fury 17 G7 119W5EA
Intel Core i9-10885H, NVIDIA Quadro RTX 4000 Max-Q
68.3 fps -37%
MSI CreatorPro Z16P B12UKST
Intel Core i7-12700H, NVIDIA RTX A3000 Laptop GPU
64.3 fps -40%
Dell Precision 7670
Intel Core i7-12850HX, NVIDIA RTX A2000 Laptop GPU
60.6 fps -44%
HP ZBook Studio 16 G9 62U04EA
Intel Core i7-12800H, NVIDIA RTX A2000 Laptop GPU
56.4 fps -48%
Lenovo ThinkPad P1 G4-20Y4Z9DVUS
Intel Core i7-11800H, NVIDIA T1200 Laptop GPU
39 fps -64%
Dell Precision 3000 3551
Intel Core i9-10885H, NVIDIA Quadro P620
18.5 fps -83%
2560x1440 High Quality
MSI WE76 11UM-456
Intel Core i9-11980HK, NVIDIA RTX A5000 Laptop GPU
83.6 fps +6%
Dell Precision 7000 7670 Performance
Intel Core i9-12950HX, NVIDIA RTX A5500 Laptop GPU
78.9 fps
Dell Precision 7550
Intel Xeon W-10885M, NVIDIA Quadro RTX 5000 Max-Q
56 fps -29%
HP ZBook Fury 17 G7 119W5EA
Intel Core i9-10885H, NVIDIA Quadro RTX 4000 Max-Q
46.3 fps -41%
MSI CreatorPro Z16P B12UKST
Intel Core i7-12700H, NVIDIA RTX A3000 Laptop GPU
45.6 fps -42%
Dell Precision 7670
Intel Core i7-12850HX, NVIDIA RTX A2000 Laptop GPU
44.4 fps -44%
HP ZBook Studio 16 G9 62U04EA
Intel Core i7-12800H, NVIDIA RTX A2000 Laptop GPU
41 fps -48%
Lenovo ThinkPad P1 G4-20Y4Z9DVUS
Intel Core i7-11800H, NVIDIA T1200 Laptop GPU
26.6 fps -66%
3840x2160 High Quality
MSI WE76 11UM-456
Intel Core i9-11980HK, NVIDIA RTX A5000 Laptop GPU
51.1 fps +17%
Dell Precision 7000 7670 Performance
Intel Core i9-12950HX, NVIDIA RTX A5500 Laptop GPU
43.5 fps
Dell Precision 7550
Intel Xeon W-10885M, NVIDIA Quadro RTX 5000 Max-Q
32.8 fps -25%
HP ZBook Fury 17 G7 119W5EA
Intel Core i9-10885H, NVIDIA Quadro RTX 4000 Max-Q
29.7 fps -32%
Dell Precision 7670
Intel Core i7-12850HX, NVIDIA RTX A2000 Laptop GPU
26 fps -40%
HP ZBook Studio 16 G9 62U04EA
Intel Core i7-12800H, NVIDIA RTX A2000 Laptop GPU
23.1 fps -47%
The Witcher 3
1024x768 Low Graphics & Postprocessing
Dell Precision 7000 7670 Performance
Intel Core i9-12950HX, NVIDIA RTX A5500 Laptop GPU
421.2 (406min) fps
MSI CreatorPro Z16P B12UKST
Intel Core i7-12700H, NVIDIA RTX A3000 Laptop GPU
381 fps -10%
Acer ConceptD 9 Pro
Intel Core i9-9980HK, NVIDIA Quadro RTX 5000 (Laptop)
375.3 fps -11%
MSI WE76 11UM-456
Intel Core i9-11980HK, NVIDIA RTX A5000 Laptop GPU
354 fps -16%
Dell Precision 7550
Intel Xeon W-10885M, NVIDIA Quadro RTX 5000 Max-Q
299 (228min) fps -29%
Dell Precision 7670
Intel Core i7-12850HX, NVIDIA RTX A2000 Laptop GPU
297.1 (160min) fps -29%
HP ZBook Studio 16 G9 62U04EA
Intel Core i7-12800H, NVIDIA RTX A2000 Laptop GPU
282 fps -33%
HP ZBook Studio G7
Intel Core i9-10885H, NVIDIA Quadro RTX 3000 Max-Q
270 fps -36%
HP ZBook Fury 17 G7 119W5EA
Intel Core i9-10885H, NVIDIA Quadro RTX 4000 Max-Q
221 fps -48%
Lenovo ThinkPad P1 G4-20Y4Z9DVUS
Intel Core i7-11800H, NVIDIA T1200 Laptop GPU
198 fps -53%
Lenovo ThinkPad P15 Gen1-20ST000DGE
Intel Core i7-10750H, NVIDIA Quadro T1000 (Laptop)
189 (160min) fps -55%
Dell Precision 3000 3551
Intel Core i9-10885H, NVIDIA Quadro P620
90.7 (87min) fps -78%
Lenovo ThinkPad P15s Gen1-20T4000JGE
Intel Core i7-10510U, NVIDIA Quadro P520
61.9 (37min) fps -85%
1366x768 Medium Graphics & Postprocessing
Acer ConceptD 9 Pro
Intel Core i9-9980HK, NVIDIA Quadro RTX 5000 (Laptop)
308.5 fps +1%
Dell Precision 7000 7670 Performance
Intel Core i9-12950HX, NVIDIA RTX A5500 Laptop GPU
306.8 (281min) fps
MSI WE76 11UM-456
Intel Core i9-11980HK, NVIDIA RTX A5000 Laptop GPU
271 fps -12%
MSI CreatorPro Z16P B12UKST
Intel Core i7-12700H, NVIDIA RTX A3000 Laptop GPU
262 fps -15%
Dell Precision 7550
Intel Xeon W-10885M, NVIDIA Quadro RTX 5000 Max-Q
249.4 (223min) fps -19%
HP ZBook Studio 16 G9 62U04EA
Intel Core i7-12800H, NVIDIA RTX A2000 Laptop GPU
188 fps -39%
Dell Precision 7670
Intel Core i7-12850HX, NVIDIA RTX A2000 Laptop GPU
181.7 (152min) fps -41%
HP ZBook Studio G7
Intel Core i9-10885H, NVIDIA Quadro RTX 3000 Max-Q
181 fps -41%
HP ZBook Fury 17 G7 119W5EA
Intel Core i9-10885H, NVIDIA Quadro RTX 4000 Max-Q
178 (25min) fps -42%
Lenovo ThinkPad P1 G4-20Y4Z9DVUS
Intel Core i7-11800H, NVIDIA T1200 Laptop GPU
125 fps -59%
Lenovo ThinkPad P15 Gen1-20ST000DGE
Intel Core i7-10750H, NVIDIA Quadro T1000 (Laptop)
114 (96min) fps -63%
Dell Precision 3000 3551
Intel Core i9-10885H, NVIDIA Quadro P620
51.7 (49min) fps -83%
Lenovo ThinkPad P15s Gen1-20T4000JGE
Intel Core i7-10510U, NVIDIA Quadro P520
26.3 (16min) fps -91%
1920x1080 High Graphics & Postprocessing (Nvidia HairWorks Off)
Dell Precision 7000 7670 Performance
Intel Core i9-12950HX, NVIDIA RTX A5500 Laptop GPU
205.4 (192min) fps
Acer ConceptD 9 Pro
Intel Core i9-9980HK, NVIDIA Quadro RTX 5000 (Laptop)
198.6 fps -3%
MSI WE76 11UM-456
Intel Core i9-11980HK, NVIDIA RTX A5000 Laptop GPU
179 fps -13%
MSI CreatorPro Z16P B12UKST
Intel Core i7-12700H, NVIDIA RTX A3000 Laptop GPU
151 fps -26%
Dell Precision 7550
Intel Xeon W-10885M, NVIDIA Quadro RTX 5000 Max-Q
139.1 (63min) fps -32%
HP ZBook Fury 17 G7 119W5EA
Intel Core i9-10885H, NVIDIA Quadro RTX 4000 Max-Q
115 fps -44%
Dell Precision 7670
Intel Core i7-12850HX, NVIDIA RTX A2000 Laptop GPU
108.6 (55min) fps -47%
HP ZBook Studio 16 G9 62U04EA
Intel Core i7-12800H, NVIDIA RTX A2000 Laptop GPU
103 fps -50%
HP ZBook Studio G7
Intel Core i9-10885H, NVIDIA Quadro RTX 3000 Max-Q
97 fps -53%
Lenovo ThinkPad P1 G4-20Y4Z9DVUS
Intel Core i7-11800H, NVIDIA T1200 Laptop GPU
71 fps -65%
Lenovo ThinkPad P15 Gen1-20ST000DGE
Intel Core i7-10750H, NVIDIA Quadro T1000 (Laptop)
62.9 (51min) fps -69%
Dell Precision 3000 3551
Intel Core i9-10885H, NVIDIA Quadro P620
31.5 (28min) fps -85%
Lenovo ThinkPad P15s Gen1-20T4000JGE
Intel Core i7-10510U, NVIDIA Quadro P520
18.7 (15min) fps -91%
1920x1080 Ultra Graphics & Postprocessing (HBAO+)
Acer ConceptD 9 Pro
Intel Core i9-9980HK, NVIDIA Quadro RTX 5000 (Laptop)
109.9 fps +8%
Dell Precision 7000 7670 Performance
Intel Core i9-12950HX, NVIDIA RTX A5500 Laptop GPU
101.5 (95min) fps
MSI WE76 11UM-456
Intel Core i9-11980HK, NVIDIA RTX A5000 Laptop GPU
98.3 (94min, 95P1) fps -3%
Dell Precision 7550
Intel Xeon W-10885M, NVIDIA Quadro RTX 5000 Max-Q
77.3 (73min) fps -24%
HP ZBook Fury 17 G7 119W5EA
Intel Core i9-10885H, NVIDIA Quadro RTX 4000 Max-Q
62.6 (58min, 59P1) fps -38%
MSI CreatorPro Z16P B12UKST
Intel Core i7-12700H, NVIDIA RTX A3000 Laptop GPU
59.6 (54min, 56P1) fps -41%
Dell Precision 7670
Intel Core i7-12850HX, NVIDIA RTX A2000 Laptop GPU
57.4 (55min) fps -43%
HP ZBook Studio G7
Intel Core i9-10885H, NVIDIA Quadro RTX 3000 Max-Q
52.1 (49min, 50P1) fps -49%
HP ZBook Studio 16 G9 62U04EA
Intel Core i7-12800H, NVIDIA RTX A2000 Laptop GPU
48.8 (46min, 47P1) fps -52%
Lenovo ThinkPad P1 G4-20Y4Z9DVUS
Intel Core i7-11800H, NVIDIA T1200 Laptop GPU
36.7 (34min, 35P1) fps -64%
Lenovo ThinkPad P15 Gen1-20ST000DGE
Intel Core i7-10750H, NVIDIA Quadro T1000 (Laptop)
35 (28min) fps -66%
Dell Precision 3000 3551
Intel Core i9-10885H, NVIDIA Quadro P620
16.5 (14min) fps -84%
Cyberpunk 2077 1.6
1920x1080 Low Preset
Dell Precision 7000 7670 Performance
Intel Core i9-12950HX, NVIDIA RTX A5500 Laptop GPU
93.9 (36.1min) fps
Dell Precision 7670
Intel Core i7-12850HX, NVIDIA RTX A2000 Laptop GPU
78.5 (15.4min) fps -16%
MSI CreatorPro Z16P B12UKST
Intel Core i7-12700H, NVIDIA RTX A3000 Laptop GPU
77 fps -18%
HP ZBook Studio 16 G9 62U04EA
Intel Core i7-12800H, NVIDIA RTX A2000 Laptop GPU
69 fps -27%
1920x1080 Medium Preset
Dell Precision 7000 7670 Performance
Intel Core i9-12950HX, NVIDIA RTX A5500 Laptop GPU
80.2 (44.1min) fps
MSI CreatorPro Z16P B12UKST
Intel Core i7-12700H, NVIDIA RTX A3000 Laptop GPU
66 fps -18%
Dell Precision 7670
Intel Core i7-12850HX, NVIDIA RTX A2000 Laptop GPU
65.1 (34.4min) fps -19%
HP ZBook Studio 16 G9 62U04EA
Intel Core i7-12800H, NVIDIA RTX A2000 Laptop GPU
59 fps -26%
1920x1080 High Preset
Dell Precision 7000 7670 Performance
Intel Core i9-12950HX, NVIDIA RTX A5500 Laptop GPU
79.3 (38.3min) fps
Dell Precision 7670
Intel Core i7-12850HX, NVIDIA RTX A2000 Laptop GPU
55 (33.3min) fps -31%
MSI CreatorPro Z16P B12UKST
Intel Core i7-12700H, NVIDIA RTX A3000 Laptop GPU
53 fps -33%
HP ZBook Studio 16 G9 62U04EA
Intel Core i7-12800H, NVIDIA RTX A2000 Laptop GPU
44 fps -45%
1920x1080 Ultra Preset
Dell Precision 7000 7670 Performance
Intel Core i9-12950HX, NVIDIA RTX A5500 Laptop GPU
75.7 (39.6min) fps
Dell Precision 7670
Intel Core i7-12850HX, NVIDIA RTX A2000 Laptop GPU
44.3 (29.7min) fps -41%
MSI CreatorPro Z16P B12UKST
Intel Core i7-12700H, NVIDIA RTX A3000 Laptop GPU
43 fps -43%
HP ZBook Studio 16 G9 62U04EA
Intel Core i7-12800H, NVIDIA RTX A2000 Laptop GPU
37 fps -51%
2560x1440 Ultra Preset
Dell Precision 7000 7670 Performance
Intel Core i9-12950HX, NVIDIA RTX A5500 Laptop GPU
45.3 (29.4min) fps
Dell Precision 7670
Intel Core i7-12850HX, NVIDIA RTX A2000 Laptop GPU
27.4 (18.3min) fps -40%
MSI CreatorPro Z16P B12UKST
Intel Core i7-12700H, NVIDIA RTX A3000 Laptop GPU
27 fps -40%
HP ZBook Studio 16 G9 62U04EA
Intel Core i7-12800H, NVIDIA RTX A2000 Laptop GPU
23 fps -49%
3840x2160 Ultra Preset
Dell Precision 7000 7670 Performance
Intel Core i9-12950HX, NVIDIA RTX A5500 Laptop GPU
17.8 (12.5min) fps

Vid tomgångskörning på Witcher 3 i en timme kunde vi registrera stora nedgångar i bildfrekvensen ungefär 10 minuter in i testet, vilket framgår av diagrammet nedan. Detta tyder på dålig programprioritering eller avbrytande bakgrundsaktivitet som potentiellt kan störa prestandan hos huvudprogrammet i fokus.

Witcher 3 FPS Chart

05101520253035404550556065707580859095Tooltip
Dell Precision 7000 7670 Performance i9-12950HX, RTX A5500 Laptop GPU: Ø92.6 (1-100)
lågmed.högultraQHD4K
GTA V (2015) 183.4 178.1 166.2 102.6 99.2
The Witcher 3 (2015) 421.2 306.8 205.4 101.5 62.5
Dota 2 Reborn (2015) 193.3 171.3 161.8 152.9 131.4
Final Fantasy XV Benchmark (2018) 170.1 138.9 107.8 78.9 43.5
X-Plane 11.11 (2018) 146.2 134.3 107.8 92.7
Strange Brigade (2018) 377 244 200 177.9 129.3
Metro Exodus (2019) 171 125.8 95.3 75.7 58.5 31.3
Borderlands 3 (2019) 162.9 135.4 110.4 89.3 62.7 30.2
Gears Tactics (2020) 314.1 189.7 139.2 110.1 77.1 34.9
Horizon Zero Dawn (2020) 139 130 111 101 89 42
Watch Dogs Legion (2020) 119 98 93 77 58 30
Dirt 5 (2020) 167.6 130 114.8 92.2 71.9 39.8
Hitman 3 (2021) 229 186.6 179.9 161.4 104.6 43.8
Far Cry 6 (2021) 132 115 104 95 79 42
Guardians of the Galaxy (2021) 142 124 137 134 104 49
God of War (2022) 128.9 119.6 105.6 79 62.2 35.6
Cyberpunk 2077 1.6 (2022) 93.9 80.2 79.3 75.7 45.3 17.8
F1 22 (2022) 190.8 188.2 163.1 66.4 40.8 18.8

Utsläpp

Systembrus

Fläktarna i Precision 7670 Performance tenderar att pulsa oftare än fläktarna i den smalare Precision 7670, sannolikt på grund av det högre Turbo Boost-tak som Core i9-12950HX har jämfört med Core i7-12850HX. Detta bör dock inte vara något problem när strömprofilen är inställd på balanserat eller tyst läge

Det totala fläktljudet är generellt sett tystare än vad vi registrerade på den smalare Precision 7670. Spelbelastningar skulle stabilisera sig i intervallet 42 till 47 dB(A) jämfört med 45 till 49 dB(A) på den mindre modellen. Vi kan nå ett maximum på 48 dB(A) när både CPU och GPU är 100 procent utnyttjade.

Liten kylfläns på Precision 7670 Prestanda som annars inte finns på den smalare modellen
Kylningslösningen är i övrigt nästan identisk med den smalare Precision 7670
Profil för fläktljud (vit: Bakgrund, röd: Systemet vilar, Blå: 3DMark 06, Orange: Witcher 3, Grön: Prime95+FurMark stress)

Ljudnivå

Låg belastning
24 / 24 / 38 dB(A)
Hög belastning
46.3 / 47.9 dB(A)
  red to green bar
 
 
30 dB
tyst
40 dB(A)
hörbar
50 dB(A)
högt ljud
 
min: dark, med: mid, max: light   Earthworks M23R, Arta (15 cm avstånd)   environment noise: 23.9 dB(A)
dB(A) 0102030405060708090Deep BassMiddle BassHigh BassLower RangeMidsHigher MidsLower HighsMid HighsUpper HighsSuper Highs2036.737.837.53833.32532.334.230.131.829.23126.52821.924.123.94024.328.323.32425.35026.628.623.426.124.66329.429.226.127.127.78028.428.524.624.727.910027.127.122.422.728.212525.92820.42029.616027.428.322.122.127.720029.629.122.423.23025029.930.515.916.533.231529.831.316.517.633.440029.931.915.515.133.150030.633.212.312.733.963030.532.710.810.634.780030.333.29.810.235100030.733.312.911.734.8125031.334.59.39.536.5160031.834.59.79.537.1200028.933.310.21034.7250028.83510.510.335.8315028.935.210.810.836.6400030.236.111.11137.3500032.137.411.811.637.9630028.334.411.711.635.1800023.831.111.711.732.11000021.529.812.211.831.11250017.726.112.211.6271600014.620.711.910.920.2SPL41.946.42423.947.7N4.15.70.60.66.3median 29.6median 32.7median 11.9median 11.6median 33.9Delta3.233.22.73.1hearing rangehide median Fan NoiseDell Precision 7000 7670 Performance
Dell Precision 7000 7670 Performance
RTX A5500 Laptop GPU, i9-12950HX
MSI CreatorPro Z16P B12UKST
RTX A3000 Laptop GPU, i7-12700H, Samsung PM9A1 MZVL21T0HCLR
HP ZBook Studio 16 G9 62U04EA
RTX A2000 Laptop GPU, i7-12800H, Micron 3400 1TB MTFDKBA1T0TFH
HP ZBook Firefly 16 G9-6B897EA
T550 Laptop GPU, i7-1265U, Samsung PM9A1 MZVL21T0HCLR
Lenovo ThinkPad P1 G4-20Y4Z9DVUS
T1200 Laptop GPU, i7-11800H, Samsung PM9A1 MZVL2512HCJQ
Dell Precision 7670
RTX A2000 Laptop GPU, i7-12850HX, SK Hynix HFS001TEJ9X115N
Noise
1%
3%
10%
2%
4%
off / environment *
23.9
24.1
-1%
24
-0%
23.8
-0%
24.3
-2%
22.7
5%
Idle Minimum *
24
27.1
-13%
24
-0%
23.8
1%
24.3
-1%
22.9
5%
Idle Average *
24
27.1
-13%
27.7
-15%
23.8
1%
24.3
-1%
22.9
5%
Idle Maximum *
38
27.1
29%
27.7
27%
23.8
37%
26.6
30%
24.5
36%
Load Average *
46.3
42.9
7%
39.8
14%
39.4
15%
46.8
-1%
48.7
-5%
Witcher 3 ultra *
41.9
44
-5%
44.3
-6%
40.5
3%
46.8
-12%
45.2
-8%
Load Maximum *
47.9
47
2%
47.7
-0%
41.4
14%
46.8
2%
52.1
-9%

* ... smaller is better

Temperatur

Yttemperaturerna är faktiskt lite varmare än vad vi registrerade på den vanliga Precision 7670. Varma punkter på tangentbordet och baksidan när man kör krävande belastningar som spel under längre perioder kan nå omkring 40 C vardera jämfört med 35 C på den tunnare vanliga modellen. Dessa resultat matchar våra mätningar av kärntemperaturen i nästa avsnitt nedan där vår CPU och GPU skulle stabilisera sig vid varmare temperaturer.

Bakre avgasröret
Bakre avgasröret
AC-adaptern kan nå 39 C när du kör krävande belastningar under längre perioder
 53 °C48.4 °C46 °C 
 44.2 °C43.6 °C32.2 °C 
 29.6 °C29.6 °C28.2 °C 
Max: 53 °C
Medel: 39.4 °C
38.8 °C42 °C43.2 °C
26.2 °C33.8 °C34.2 °C
25.4 °C26.6 °C30.4 °C
Max: 43.2 °C
Medel: 33.4 °C
Strömförsörjning (max.)  47.2 °C | Rumstemperatur 20 °C | Fluke 62 Mini IR Thermometer
(-) The average temperature for the upper side under maximal load is 39.4 °C / 103 F, compared to the average of 32 °C / 90 F for the devices in the class Workstation.
(-) The maximum temperature on the upper side is 53 °C / 127 F, compared to the average of 38.2 °C / 101 F, ranging from 22.2 to 69.8 °C for the class Workstation.
(±) The bottom heats up to a maximum of 43.2 °C / 110 F, compared to the average of 41.2 °C / 106 F
(+) In idle usage, the average temperature for the upper side is 31.8 °C / 89 F, compared to the device average of 32 °C / 90 F.
(±) Playing The Witcher 3, the average temperature for the upper side is 37 °C / 99 F, compared to the device average of 32 °C / 90 F.
(+) The palmrests and touchpad are cooler than skin temperature with a maximum of 30.6 °C / 87.1 F and are therefore cool to the touch.
(-) The average temperature of the palmrest area of similar devices was 27.9 °C / 82.2 F (-2.7 °C / -4.9 F).
Systemet är tomt (överst)
Systemet är inaktivt (nedre delen)
Witcher 3 stress (överst)
Witcher 3 spänning (botten)
Prime95+FurMark stress (överst)
Prime95+FurMark stress (botten)
Dell Precision 7000 7670 Performance
Intel Core i9-12950HX, NVIDIA RTX A5500 Laptop GPU
MSI CreatorPro Z16P B12UKST
Intel Core i7-12700H, NVIDIA RTX A3000 Laptop GPU
HP ZBook Studio 16 G9 62U04EA
Intel Core i7-12800H, NVIDIA RTX A2000 Laptop GPU
HP ZBook Firefly 16 G9-6B897EA
Intel Core i7-1265U, NVIDIA T550 Laptop GPU
Lenovo ThinkPad P1 G4-20Y4Z9DVUS
Intel Core i7-11800H, NVIDIA T1200 Laptop GPU
Dell Precision 7670
Intel Core i7-12850HX, NVIDIA RTX A2000 Laptop GPU
Heat
-2%
9%
8%
7%
4%
Maximum Upper Side *
53
56.3
-6%
38.7
27%
42.1
21%
49.9
6%
51
4%
Maximum Bottom *
43.2
68.3
-58%
53.4
-24%
48
-11%
56.7
-31%
45.8
-6%
Idle Upper Side *
36.8
25.2
32%
27.3
26%
29.9
19%
25.5
31%
31.8
14%
Idle Bottom *
33.8
25.9
23%
31.6
7%
32.9
3%
26.2
22%
32.6
4%

* ... smaller is better

Stresstest

När Prime95 körs för att stressa processorn hoppar klockfrekvensen och temperaturen nästan omedelbart till 3,4 GHz respektive 99 C och en hög processoreffekt på 147 W. En så hög temperatur är inte hållbar och därför sjunker klockfrekvensen och temperaturen snabbt till mer stabila 2,3 GHz respektive 78 C och en slutlig processoreffekt på 76 W. Den stadiga, men betydande minskningen av Turbo Boost-potentialen stämmer överens med resultaten från CineBench R15 xT loop-testet ovan, där resultaten sjunker långsamt och sedan stabiliseras med tiden.

CPU- och GPU-temperaturer vid körning Witcher 3 skulle stabiliseras på 77 C respektive 82 C, jämfört med 70 C och 80 C på den vanliga tunnare Precision 7670.

Prestandan är begränsad om den körs på batteri. Fire Strike på batterier skulle ge fysik- och grafikpoäng 18901 respektive 9254 poäng, jämfört med 28197 och 26260 poäng när den körs på elnätet.

Systemet går på tomgång
Witcher 3 stress
Witcher 3 stress
Prime95 stress
Prime95 stress
Prime95+FurMark stress
CPU-klocka (GHz) GPU-klocka (MHz) Genomsnittlig CPU-temperatur (°C) Genomsnittlig GPU-temperatur (°C)
Systemets tomgång -- -- 50 53
Prime95 Stress 2.3 -- 78 59
Prime95 + FurMark Stress 0,8 - 1,4 500 - 1555 79 - 83 81
Witcher 3 Stress 1,1 1417 77 82

Högtalare

Kontrollera ljudet från de inbyggda högtalarna (ljud, brus, bas, maximal volym,...) i olika musikgenrer/telefoni, jämför inom enhetskategorin, specialfunktioner (programvara),... Hur kan externa ljudenheter anslutas? Testa ljudgränssnitten i förekommande fall. Analysera diagrammet över rosa brus.

Kortfattad granskning: Analys av högtalare. cirka 250 tecken

dB(A) 0102030405060708090Deep BassMiddle BassHigh BassLower RangeMidsHigher MidsLower HighsMid HighsUpper HighsSuper Highs2035.437.535.42534.430.134.43132.621.932.64033.723.333.75033.823.433.86335.526.135.58041.124.641.110049.222.449.212555.320.455.316064.322.164.320067.522.467.525067.115.967.131568.116.568.140071.715.571.750073.812.373.86307610.87680075.49.875.4100072.612.972.6125074.49.374.4160078.69.778.6200080.610.280.6250079.610.579.6315079.210.879.2400078.311.178.3500080.411.880.4630080.811.780.8800081.811.781.81000083.112.283.11250077.712.277.7160007711.977SPL91.12491.1N92.90.692.9median 77median 11.9median 77Delta5.43.25.426.325.821.422.12624.925.127.622.532.523.448.72655.818.860.922.167.2267019.372.317.674.217.774.319.575.31571.711.871.311.27410.574.21072.710.17210.67210.97511.374.811.671.71269.71269.612.371.112.669.61270.111.269.824.784.70.666.6median 12median 71.73.42.2hearing rangehide median Pink NoiseDell Precision 7000 7670 PerformanceApple MacBook Pro 16 2021 M1 Pro
Frequency diagram (checkboxes can be checked and unchecked to compare devices)
Dell Precision 7000 7670 Performance audio analysis

(+) | speakers can play relatively loud (91.1 dB)
Bass 100 - 315 Hz
(-) | nearly no bass - on average 15.1% lower than median
(±) | linearity of bass is average (7.1% delta to prev. frequency)
Mids 400 - 2000 Hz
(+) | balanced mids - only 2.9% away from median
(+) | mids are linear (3.7% delta to prev. frequency)
Highs 2 - 16 kHz
(+) | balanced highs - only 3.5% away from median
(+) | highs are linear (1.6% delta to prev. frequency)
Overall 100 - 16.000 Hz
(+) | overall sound is linear (10.4% difference to median)
Compared to same class
» 6% of all tested devices in this class were better, 3% similar, 91% worse
» The best had a delta of 7%, average was 18%, worst was 35%
Compared to all devices tested
» 4% of all tested devices were better, 1% similar, 95% worse
» The best had a delta of 4%, average was 25%, worst was 134%

Apple MacBook Pro 16 2021 M1 Pro audio analysis

(+) | speakers can play relatively loud (84.7 dB)
Bass 100 - 315 Hz
(+) | good bass - only 3.8% away from median
(+) | bass is linear (5.2% delta to prev. frequency)
Mids 400 - 2000 Hz
(+) | balanced mids - only 1.3% away from median
(+) | mids are linear (2.1% delta to prev. frequency)
Highs 2 - 16 kHz
(+) | balanced highs - only 1.9% away from median
(+) | highs are linear (2.7% delta to prev. frequency)
Overall 100 - 16.000 Hz
(+) | overall sound is linear (4.6% difference to median)
Compared to same class
» 0% of all tested devices in this class were better, 0% similar, 100% worse
» The best had a delta of 5%, average was 18%, worst was 45%
Compared to all devices tested
» 0% of all tested devices were better, 0% similar, 100% worse
» The best had a delta of 4%, average was 25%, worst was 134%

Energiförvaltning

Effektförbrukning

Den vanliga Precision 7670 är redan en kraftfull maskin och Precision 7670 Performance är ännu mer kraftfull. Bara tomgång på skrivbordet kräver mellan 16 W och 47 W beroende på ljusstyrkan, strömprofilen och OLED-färgerna på skärmen. De flesta andra arbetsstationer brukar vanligtvis sväva i mitten av 15 W i jämförelse

Vid krävande belastningar som spel drar vår enhet cirka 159 W jämfört med 134 W på den vanliga Precision 7670. Den 19-procentiga ökningen av strömförbrukningen är relativt liten med tanke på den 70-80-procentiga ökningen av grafikpotentialen jämfört med Quadro A2000

En medelstor (~15,2 x 7,8 x 2,3 cm) 240 W AC-adapter ingår medan den vanliga Precision 7670 levereras med en mindre 180 W AC-adapter. Vi kan registrera ett tillfälligt maximalt uttag på 311 W från adaptern när både CPU och GPU är 100 procent utnyttjade, vilket framgår av skärmdumparna nedan. Detta tyder både på begränsad Turbo Boost-prestanda och en potentiellt underkraftig adapter med tanke på hur krävande de interna delarna kan vara.

3DMark 06 strömförbrukning
Witcher 3 energiförbrukning
Om Prime95 startas skulle förbrukningen stiga till 222 W för att sedan sjunka och stabiliseras i intervallet 90 W-120 W på grund av temperaturgränserna
Prime95+FurMark stress inleddes vid 10s märket. Den initiala maximala förbrukningen på 311 W är betydligt högre än 240 W AC-adaptern
Strömförbrukning
Av/Standbydarklight 0.07 / 0.1 Watt
Låg belastningdarkmidlight 16.4 / 35.9 / 47 Watt
Hög belastning midlight 147.1 / 311 Watt
 color bar
Förklaring: min: dark, med: mid, max: light        Metrahit Energy
Dell Precision 7000 7670 Performance
i9-12950HX, RTX A5500 Laptop GPU, , OLED, 3840x2400, 16"
MSI CreatorPro Z16P B12UKST
i7-12700H, RTX A3000 Laptop GPU, Samsung PM9A1 MZVL21T0HCLR, IPS, 2560x1600, 16"
HP ZBook Studio 16 G9 62U04EA
i7-12800H, RTX A2000 Laptop GPU, Micron 3400 1TB MTFDKBA1T0TFH, IPS, 3840x2400, 16"
HP ZBook Firefly 16 G9-6B897EA
i7-1265U, T550 Laptop GPU, Samsung PM9A1 MZVL21T0HCLR, IPS, 1920x1200, 16"
Lenovo ThinkPad P1 G4-20Y4Z9DVUS
i7-11800H, T1200 Laptop GPU, Samsung PM9A1 MZVL2512HCJQ, IPS, 2560x1600, 16"
Dell Precision 7670
i7-12850HX, RTX A2000 Laptop GPU, SK Hynix HFS001TEJ9X115N, OLED, 3840x2400, 16"
MSI WE76 11UM-456
i9-11980HK, RTX A5000 Laptop GPU, Samsung PM9A1 MZVL22T0HBLB, IPS, 3840x2160, 17.3"
Power Consumption
37%
44%
73%
48%
36%
19%
Idle Minimum *
16.4
10.8
34%
7.2
56%
4.5
73%
9.9
40%
7.5
54%
10.5
36%
Idle Average *
35.9
16.3
55%
18.1
50%
8
78%
13.9
61%
9.5
74%
18.6
48%
Idle Maximum *
47
16.9
64%
18.5
61%
8.7
81%
14.6
69%
28.4
40%
20
57%
Load Average *
147.1
111.7
24%
112.8
23%
48.3
67%
95
35%
139.1
5%
132.4
10%
Witcher 3 ultra *
158.8
152.1
4%
106.7
33%
45.3
71%
98.9
38%
134
16%
232
-46%
Load Maximum *
311
177.4
43%
186
40%
94.7
70%
170.8
45%
220.8
29%
281.6
9%

* ... smaller is better

Power Consumption Witcher 3 / Stresstest

020406080100120140160180200220240260280300Tooltip
Dell Precision 7000 7670 Performance i9-12950HX, RTX A5500 Laptop GPU; Witcher 3 ultra: Ø158.8 (156.7-162.6)
Dell Precision 7670 i7-12850HX, RTX A2000 Laptop GPU; Witcher 3 ultra: Ø134 (130.6-149.8)
Dell Precision 7000 7670 Performance i9-12950HX, RTX A5500 Laptop GPU; 1280x720 Prime95 28.10 and Furmark 1.25: Ø192.6 (135.4-311)
Dell Precision 7670 i7-12850HX, RTX A2000 Laptop GPU; 1280x720 Prime95 28.10 and Furmark 1.25: Ø174.9 (114.6-220)
Dell Precision 7000 7670 Performance i9-12950HX, RTX A5500 Laptop GPU; Idle 150cd/m2: Ø20.1 (15.1-33.7)

Power Consumption external Monitor

0153045607590105120135150165180195210225Tooltip
Dell Precision 7000 7670 Performance i9-12950HX, RTX A5500 Laptop GPU; Prime95 V2810 Stress (external Monitor): Ø128.7 (89.5-222)
Dell Precision 7670 i7-12850HX, RTX A2000 Laptop GPU; Prime95 V2810 Stress (external Monitor): Ø132.7 (114.4-221)
Dell Precision 7000 7670 Performance i9-12950HX, RTX A5500 Laptop GPU; Cinebench R15 Multi (external Monitor): Ø198.5 (155.2-230)
Dell Precision 7670 i7-12850HX, RTX A2000 Laptop GPU; Cinebench R15 Multi (external Monitor): Ø185.9 (158-216)
Dell Precision 7000 7670 Performance i9-12950HX, RTX A5500 Laptop GPU; 1280x720 FurMark 1.19 GPU Stress Test (external Monitor): Ø144.6 (141-153.1)
Dell Precision 7670 i7-12850HX, RTX A2000 Laptop GPU; 1280x720 FurMark 1.19 GPU Stress Test (external Monitor): Ø132.4 (128.7-137.7)
Dell Precision 7000 7670 Performance i9-12950HX, RTX A5500 Laptop GPU; 1920x1080 The Witcher 3 ultra (external Monitor): Ø159.8 (157.1-174.6)
Dell Precision 7670 i7-12850HX, RTX A2000 Laptop GPU; 1920x1080 The Witcher 3 ultra (external Monitor): Ø133.7 (130.8-137)
Dell Precision 7000 7670 Performance i9-12950HX, RTX A5500 Laptop GPU; Idle 1min (external Monitor): Ø18.3 (14.7-28.7)

Batteritid

Batterikapaciteten är något större den här gången, 93 Wh jämfört med 83 Wh på den smalare Precision 7670. Trots detta är WLAN-driftstiden kortare med nästan en timme på vår Performance-modell på grund av de kraftfullare interiörerna.

Laddningen från tom till full kapacitet är fortfarande långsam och tar cirka 2,5 timmar.

Batteritid
WiFi Websurfing
4tim 40min
Dell Precision 7000 7670 Performance
i9-12950HX, RTX A5500 Laptop GPU, 93 Wh
MSI CreatorPro Z16P B12UKST
i7-12700H, RTX A3000 Laptop GPU, 90 Wh
HP ZBook Studio 16 G9 62U04EA
i7-12800H, RTX A2000 Laptop GPU, 86 Wh
HP ZBook Firefly 16 G9-6B897EA
i7-1265U, T550 Laptop GPU, 76 Wh
Lenovo ThinkPad P1 G4-20Y4Z9DVUS
i7-11800H, T1200 Laptop GPU, 90 Wh
Dell Precision 7670
i7-12850HX, RTX A2000 Laptop GPU, 83 Wh
Battery Runtime
24%
35%
178%
89%
27%
WiFi v1.3
280
348
24%
377
35%
779
178%
529
89%
355
27%
H.264
509
1104
Load
63
118
75
Reader / Idle
472

För

+ stöd för upp till 3x M.2 2280 SSD-diskar
+ Nvidia RTX A5500 GPU-alternativ
+ rimliga ljudnivåer för fläktar
+ stort batteri på 93 Wh
+ enkel service

Emot

- kunde varit bättre på att upprätthålla CPU Turbo Boost
- OLED-flimmer på alla ljusstyrkor
- mycket varma CPU-temperaturer
- problem med DPC-latens
- stor och tung

Omdöme

Recension av Dell Precision 7670 Performance. Testenhet tillhandahållen av Dell

Precision 7670 Performance är bara något tjockare och tyngre än 7670 Performance standard Precision 7670, men den erbjuder ungefär 10 procent respektive 80 procent snabbare CPU- och GPU-prestanda än standardmodellen om den konfigureras med de högsta processoralternativen. Om du inte har för avsikt att utnyttja GPU-fördelarna i synnerhet, finns det inte mycket anledning att äga Performance-modellen framför standardmodellen, eftersom de andra fördelarna är relativt små.

Precision 7670 Performance levererar när det gäller avancerade processoralternativ och funktioner. Trots detta är den begränsade Turbo Boost-potentialen, de höga kärntemperaturerna och problemen med DPC-latens lite tråkiga att se.

Det finns mycket utrymme för förbättringar när det gäller den totala prestandan. Trots att det är den tjockare Performance-modellen är kärntemperaturerna inte bättre än på standardmodellen. Följaktligen varar CPU Turbo Boost mycket kortare tid än förväntat, vilket målgruppen entusiaster kanske inte uppskattar. De höga DPC-latenserna, den ojämna WiFi-prestandan, den höga strömförbrukningen vid tomgång och det underdimensionerade nätadaptern är andra problem som inte alls borde förekomma på en professionell arbetsstation som denna.

Pris och tillgänglighet

Dell levererar nu Precision 7670 Performance från 5300 USD för baskonfigurationen upp till över 7000 USD när den är konfigurerad med samma CPU och GPU som vår testenhet.

Dell Precision 7000 7670 Performance - 12/03/2022 v7 (old)
Allen Ngo

Design
87 / 98 → 88%
Tangentbord
88%
Mus
90%
Anslutningar
74 / 80 → 92%
Vikt
58 / 10-66 → 85%
Batteri
62 / 95 → 65%
Skärm
86%
Spelprestanda
97%
Programprestanda
96%
Workstation
98%
Temperatur
86 / 95 → 91%
Ljudnivå
76 / 90 → 84%
Audio
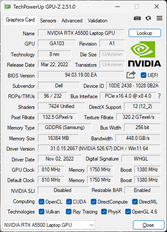
91%
Camera
43 / 85 → 50%
Medel
81%
89%
Workstation - Vägt medel

Price comparison

Please share our article, every link counts!
> Bärbara datorer, laptops - tester och nyheter > Tester > Recension av Dell Precision 7670 Performance - Debut för Nvidia RTX A5500
Allen Ngo, 2022-12- 4 (Update: 2022-12- 6)