GMK NucBox K9 mini PC recension: Core Ultra 5 125H med Arc 7-grafik

Efter att ha recenserat GMK NucBox K6 för några månader sedan är vi nu redo att ta itu med NucBox K9 komplett med den nyare AI-aktiverade Meteor Lake-H-processorn. Förutom CPU-bytet från AMD till Intel förblir dock chassit identiskt mellan de två modellerna och därför rekommenderar vi att du kollar in vår recension av NucBox K6 för att lära dig mer om systemets fysiska funktioner.
Vår testenhet är utrustad med Core Ultra 5 125H CPU, 1 TB SSD och 32 GB RAM för cirka 860 USD eller 570 USD om den är på rea. Användare kan konfigurera med inget RAM eller SSD alls för en barebones-installation, men Core Ultra 5 CPU är fast i alla alternativ.
Alternativen inkluderar andra minidatorer med prestanda som Beelink SER8, Bosgame M1eller Geekom AX8 Pro.
Fler GMKtec recensioner:
Potentiella konkurrenter i jämförelse
Gradering | Version | Datum | Modell | Vikt | Höjd | Storlek | Upplösning | Pris |
|---|---|---|---|---|---|---|---|---|
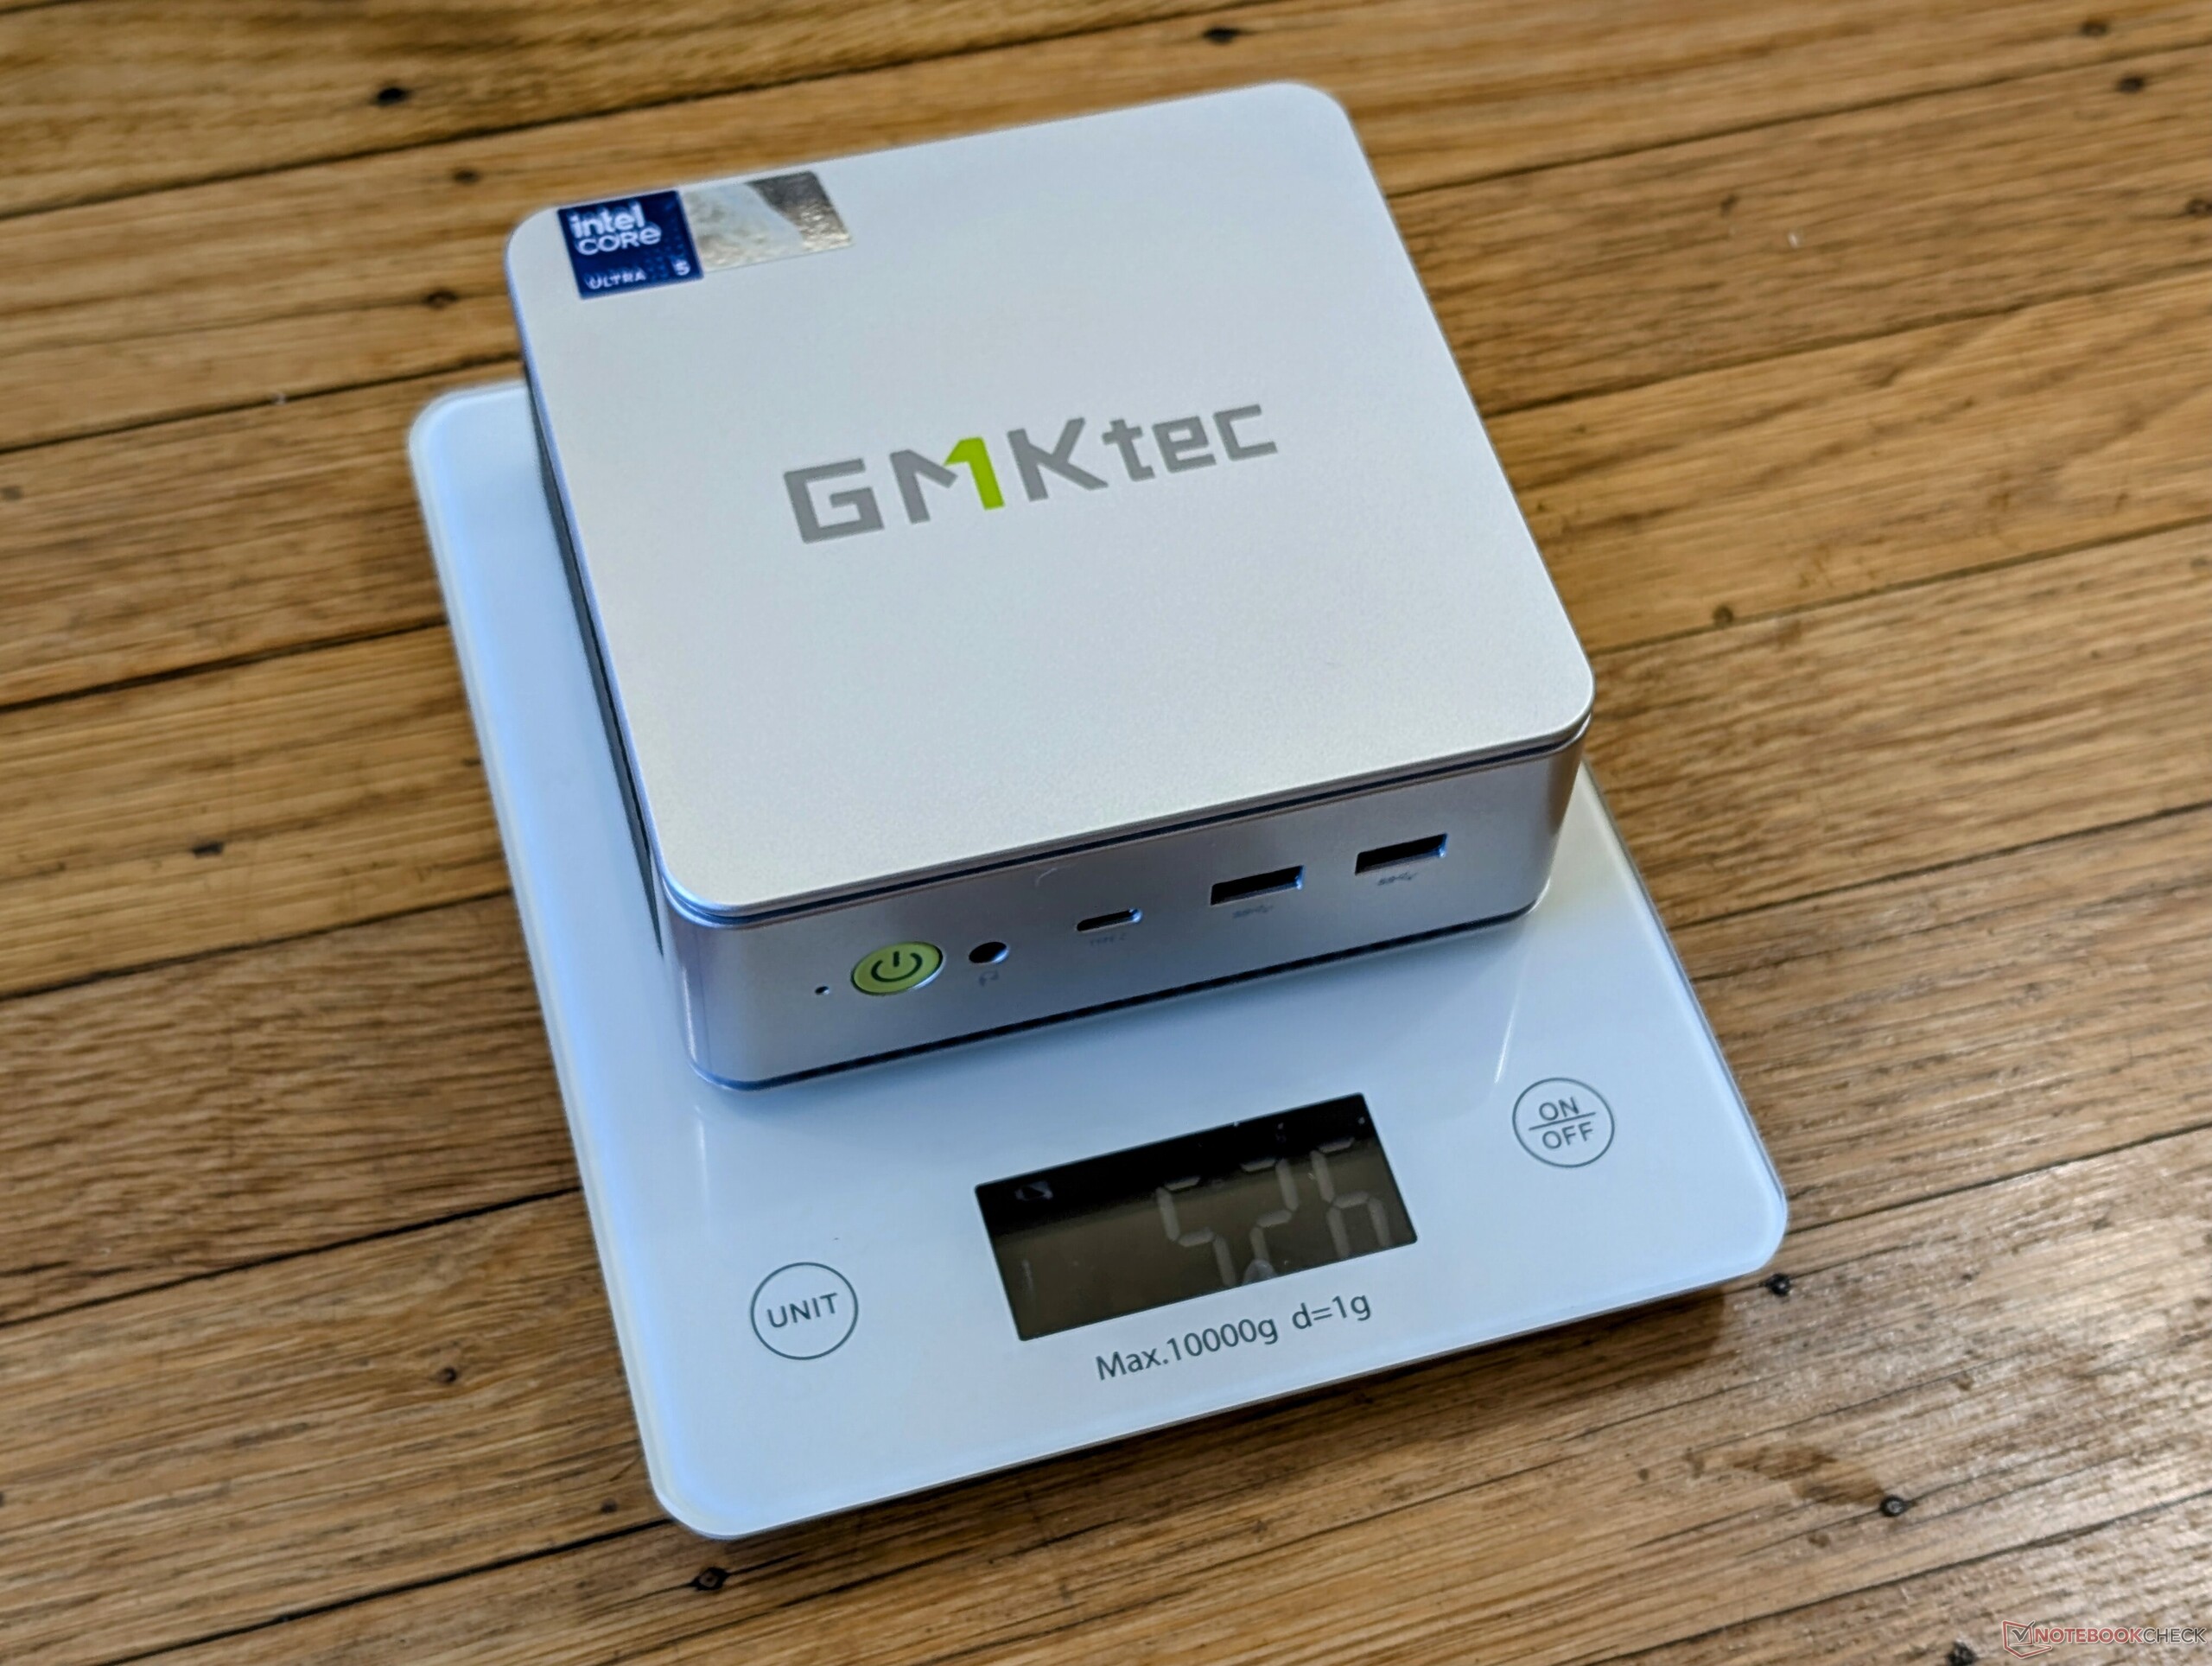
| 67.3 % | v8 | 09/2024 | GMK NucBox K9 Ultra 5 125H, Arc 7-Core | 528 g | 47 mm | x | ||
| 83.6 % v7 (old) | v7 (old) | 04/2024 | GMK NucBox K6 R7 7840HS, Radeon 780M | 514 g | 47 mm | x | ||
| 63.6 % | v8 | 07/2024 | GMK NucBox M6 R5 6600H, Radeon 660M | 526 g | 48 mm | x | ||
| 74.9 % | v8 | 07/2024 | Beelink SER8 R7 8845HS, Radeon 780M | 776 g | 44.7 mm | x | ||
v (old) | 12/2022 | Beelink SEi12 Core i5-1235U i5-1235U, Iris Xe G7 80EUs | 465 g | 42 mm | x | |||
| 84.5 % v7 (old) | v7 (old) | 05/2024 | BOSGAME M1 R7 7840HS, Radeon 780M | 766 g | 51 mm | x |
Obs: Vi har nyligen uppdaterat vårt betygssystem och resultaten från version 8 är inte jämförbara med resultaten från version 7. Mer information finns tillgänglig här .
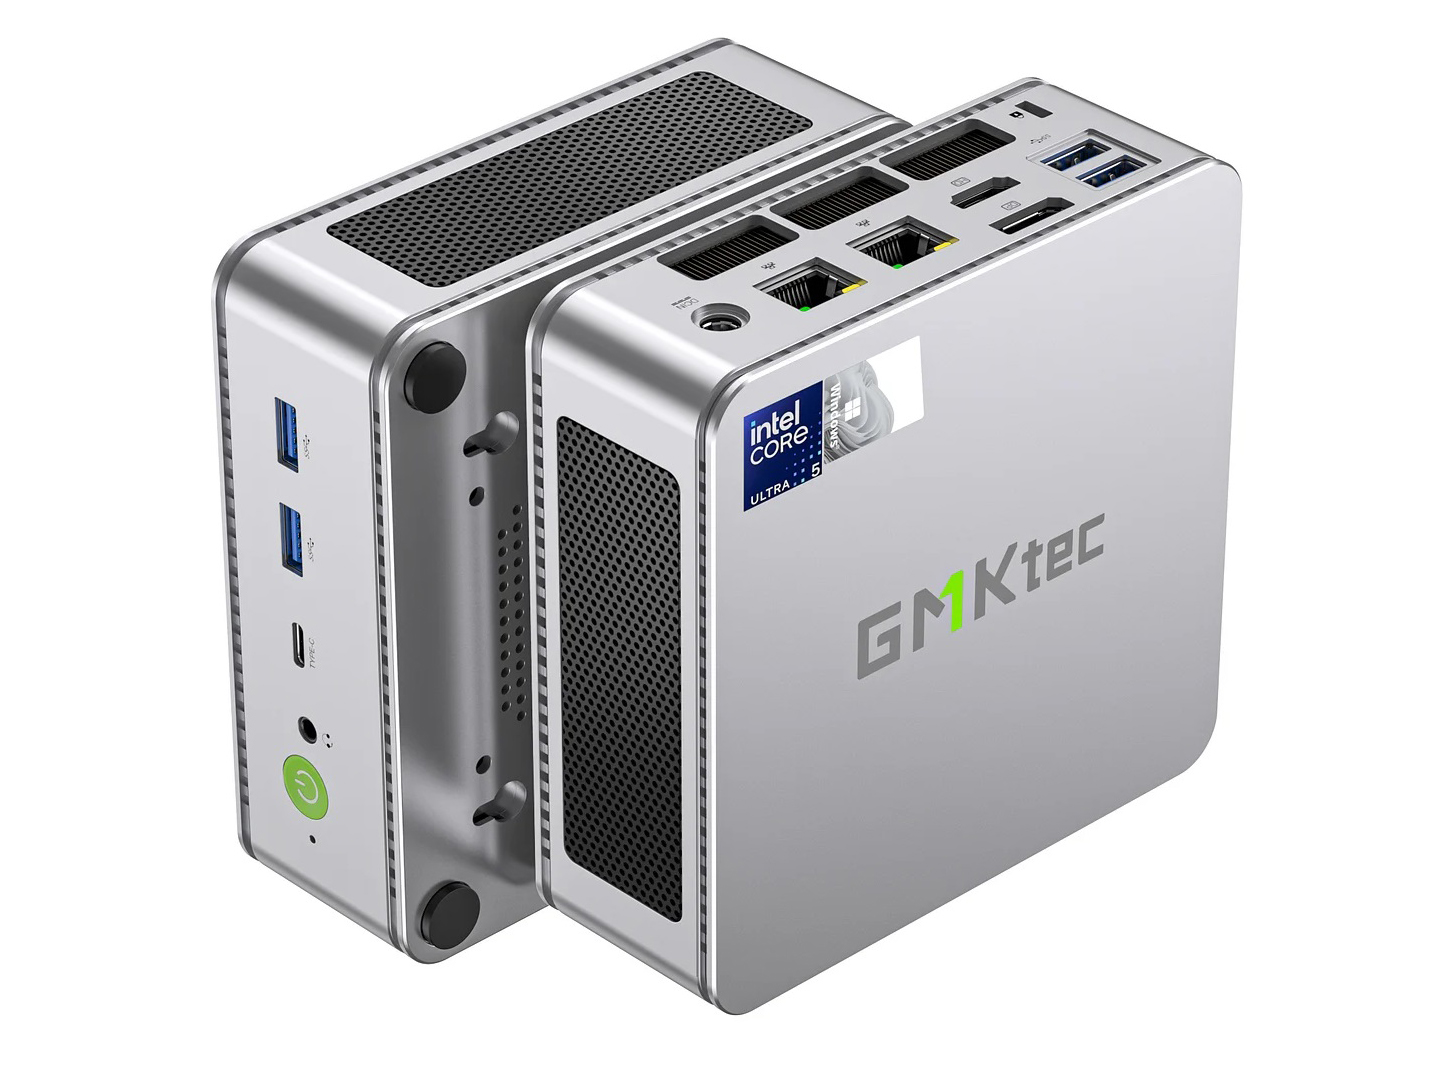
Case - En förändring av färg
Plast- och metallchassit är identiskt med den AMD-drivna NucBox K6, om än i en matt grå/silverfärg.
Anslutningsmöjligheter - Snabbare USB-portar
Medan portalternativ och positionering inte har ändrats från NucBox K6, har USB-portarna uppgraderats. Alla USB-A-portar är nu USB4 istället för 2.0 eller 3.2. Samtidigt har USB-C-portarna officiellt stöd för Thunderbolt 4.
USB-C-växelströmsadaptrar från tredje part kan driva systemet i stället för växelströmsadaptern om den kan ge tillräckligt med ström. Prestanda och kompatibilitet med alla USB-C-adaptrar är dock inte garanterad.
Kommunikation
En Intel AX201 levereras som standard istället för MediaTek RZ616 för Wi-Fi 6 och Bluetooth 5.2-anslutning. Wi-Fi 6E och Wi-Fi 7 ingår inte för att spara på kostnaderna.
| Networking | |
| iperf3 transmit AXE11000 | |
| GMK NucBox M6 | |
| Beelink SEi12 Core i5-1235U | |
| BOSGAME M1 | |
| GMK NucBox K9 | |
| Beelink SER8 | |
| GMK NucBox K6 | |
| iperf3 receive AXE11000 | |
| BOSGAME M1 | |
| GMK NucBox M6 | |
| Beelink SEi12 Core i5-1235U | |
| GMK NucBox K6 | |
| Beelink SER8 | |
| GMK NucBox K9 | |
| iperf3 transmit AXE11000 6GHz | |
| BOSGAME M1 | |
| GMK NucBox K6 | |
| GMK NucBox M6 | |
| iperf3 receive AXE11000 6GHz | |
| BOSGAME M1 | |
| GMK NucBox K6 | |
| GMK NucBox M6 | |
Underhåll
De uppgraderingsbara komponenterna är identiska med NucBox K6.
Hållbarhet
Tillverkaren marknadsför ett "Sustainably made"-system utan att gå in i detalj på vad det innebär. Själva förpackningen är mestadels av kartong med lite plastomslag.
Tillbehör och garanti
I förpackningen ingår ett VESA-monteringsfäste och en HDMI-kabel, förutom de vanliga dokumenten och nätadaptern. Ett års tillverkargaranti gäller om produkten köps i USA.
Prestanda - Meteor Lake Standard
Testförhållanden
Vi ställde in Windows i prestandaläge innan vi körde nedanstående benchmarks.
Processor
CPU-prestandan ligger där vi förväntar oss att den ska ligga i förhållande till andra datorer i vår databas med samma Core Ultra 5 125H processor. Meteor Lake-processorn är i klass med den senaste generationens Core i9-13900H vilket låter bra på pappret tills du kommer ihåg att den AMD-drivna NucBox K6 med den äldre Ryzen 7 7840HS är ännu snabbare än båda Intel-lösningarna. Därför är avsaknaden av ett Core Ultra 7-alternativ konstigt med tanke på att NucBox K9 är den nyare lådan.
Även om en integrerad AI ingår, är den inte kompatibel med Co-Pilot+.
Cinebench R15 Multi Loop
Cinebench R23: Multi Core | Single Core
Cinebench R20: CPU (Multi Core) | CPU (Single Core)
Cinebench R15: CPU Multi 64Bit | CPU Single 64Bit
Blender: v2.79 BMW27 CPU
7-Zip 18.03: 7z b 4 | 7z b 4 -mmt1
Geekbench 6.6: Multi-Core | Single-Core
Geekbench 5.5: Multi-Core | Single-Core
HWBOT x265 Benchmark v2.2: 4k Preset
LibreOffice : 20 Documents To PDF
R Benchmark 2.5: Overall mean
* ... mindre är bättre
AIDA64: FP32 Ray-Trace | FPU Julia | CPU SHA3 | CPU Queen | FPU SinJulia | FPU Mandel | CPU AES | CPU ZLib | FP64 Ray-Trace | CPU PhotoWorxx
| Performance rating | |
| Beelink SER8 | |
| BOSGAME M1 | |
| GMK NucBox K6 | |
| GMK NucBox M6 | |
| GMK NucBox K9 | |
| Genomsnitt Intel Core Ultra 5 125H | |
| Beelink SEi12 Core i5-1235U | |
| AIDA64 / FP32 Ray-Trace | |
| Beelink SER8 | |
| BOSGAME M1 | |
| GMK NucBox K6 | |
| GMK NucBox M6 | |
| GMK NucBox K9 | |
| Genomsnitt Intel Core Ultra 5 125H (7208 - 13639, n=8) | |
| Beelink SEi12 Core i5-1235U | |
| AIDA64 / FPU Julia | |
| Beelink SER8 | |
| BOSGAME M1 | |
| GMK NucBox K6 | |
| GMK NucBox M6 | |
| GMK NucBox K9 | |
| Genomsnitt Intel Core Ultra 5 125H (38292 - 70880, n=8) | |
| Beelink SEi12 Core i5-1235U | |
| AIDA64 / CPU SHA3 | |
| Beelink SER8 | |
| BOSGAME M1 | |
| GMK NucBox K6 | |
| GMK NucBox K9 | |
| Genomsnitt Intel Core Ultra 5 125H (1734 - 3404, n=8) | |
| GMK NucBox M6 | |
| Beelink SEi12 Core i5-1235U | |
| AIDA64 / CPU Queen | |
| BOSGAME M1 | |
| Beelink SER8 | |
| GMK NucBox K6 | |
| GMK NucBox M6 | |
| GMK NucBox K9 | |
| Genomsnitt Intel Core Ultra 5 125H (76983 - 79986, n=7) | |
| Beelink SEi12 Core i5-1235U | |
| AIDA64 / FPU SinJulia | |
| Beelink SER8 | |
| BOSGAME M1 | |
| GMK NucBox K6 | |
| GMK NucBox M6 | |
| GMK NucBox K9 | |
| Genomsnitt Intel Core Ultra 5 125H (5219 - 7851, n=8) | |
| Beelink SEi12 Core i5-1235U | |
| AIDA64 / FPU Mandel | |
| Beelink SER8 | |
| BOSGAME M1 | |
| GMK NucBox K6 | |
| GMK NucBox M6 | |
| GMK NucBox K9 | |
| Genomsnitt Intel Core Ultra 5 125H (19180 - 35321, n=8) | |
| Beelink SEi12 Core i5-1235U | |
| AIDA64 / CPU AES | |
| Beelink SER8 | |
| BOSGAME M1 | |
| GMK NucBox K6 | |
| GMK NucBox K9 | |
| GMK NucBox M6 | |
| Beelink SEi12 Core i5-1235U | |
| Genomsnitt Intel Core Ultra 5 125H (36196 - 108402, n=8) | |
| AIDA64 / CPU ZLib | |
| Beelink SER8 | |
| BOSGAME M1 | |
| GMK NucBox K6 | |
| GMK NucBox K9 | |
| Genomsnitt Intel Core Ultra 5 125H (485 - 994, n=8) | |
| GMK NucBox M6 | |
| Beelink SEi12 Core i5-1235U | |
| AIDA64 / FP64 Ray-Trace | |
| Beelink SER8 | |
| BOSGAME M1 | |
| GMK NucBox K6 | |
| GMK NucBox M6 | |
| GMK NucBox K9 | |
| Genomsnitt Intel Core Ultra 5 125H (3753 - 7221, n=8) | |
| Beelink SEi12 Core i5-1235U | |
| AIDA64 / CPU PhotoWorxx | |
| GMK NucBox K9 | |
| Genomsnitt Intel Core Ultra 5 125H (23499 - 49844, n=8) | |
| BOSGAME M1 | |
| GMK NucBox K6 | |
| Beelink SER8 | |
| GMK NucBox M6 | |
| Beelink SEi12 Core i5-1235U | |
Stresstest
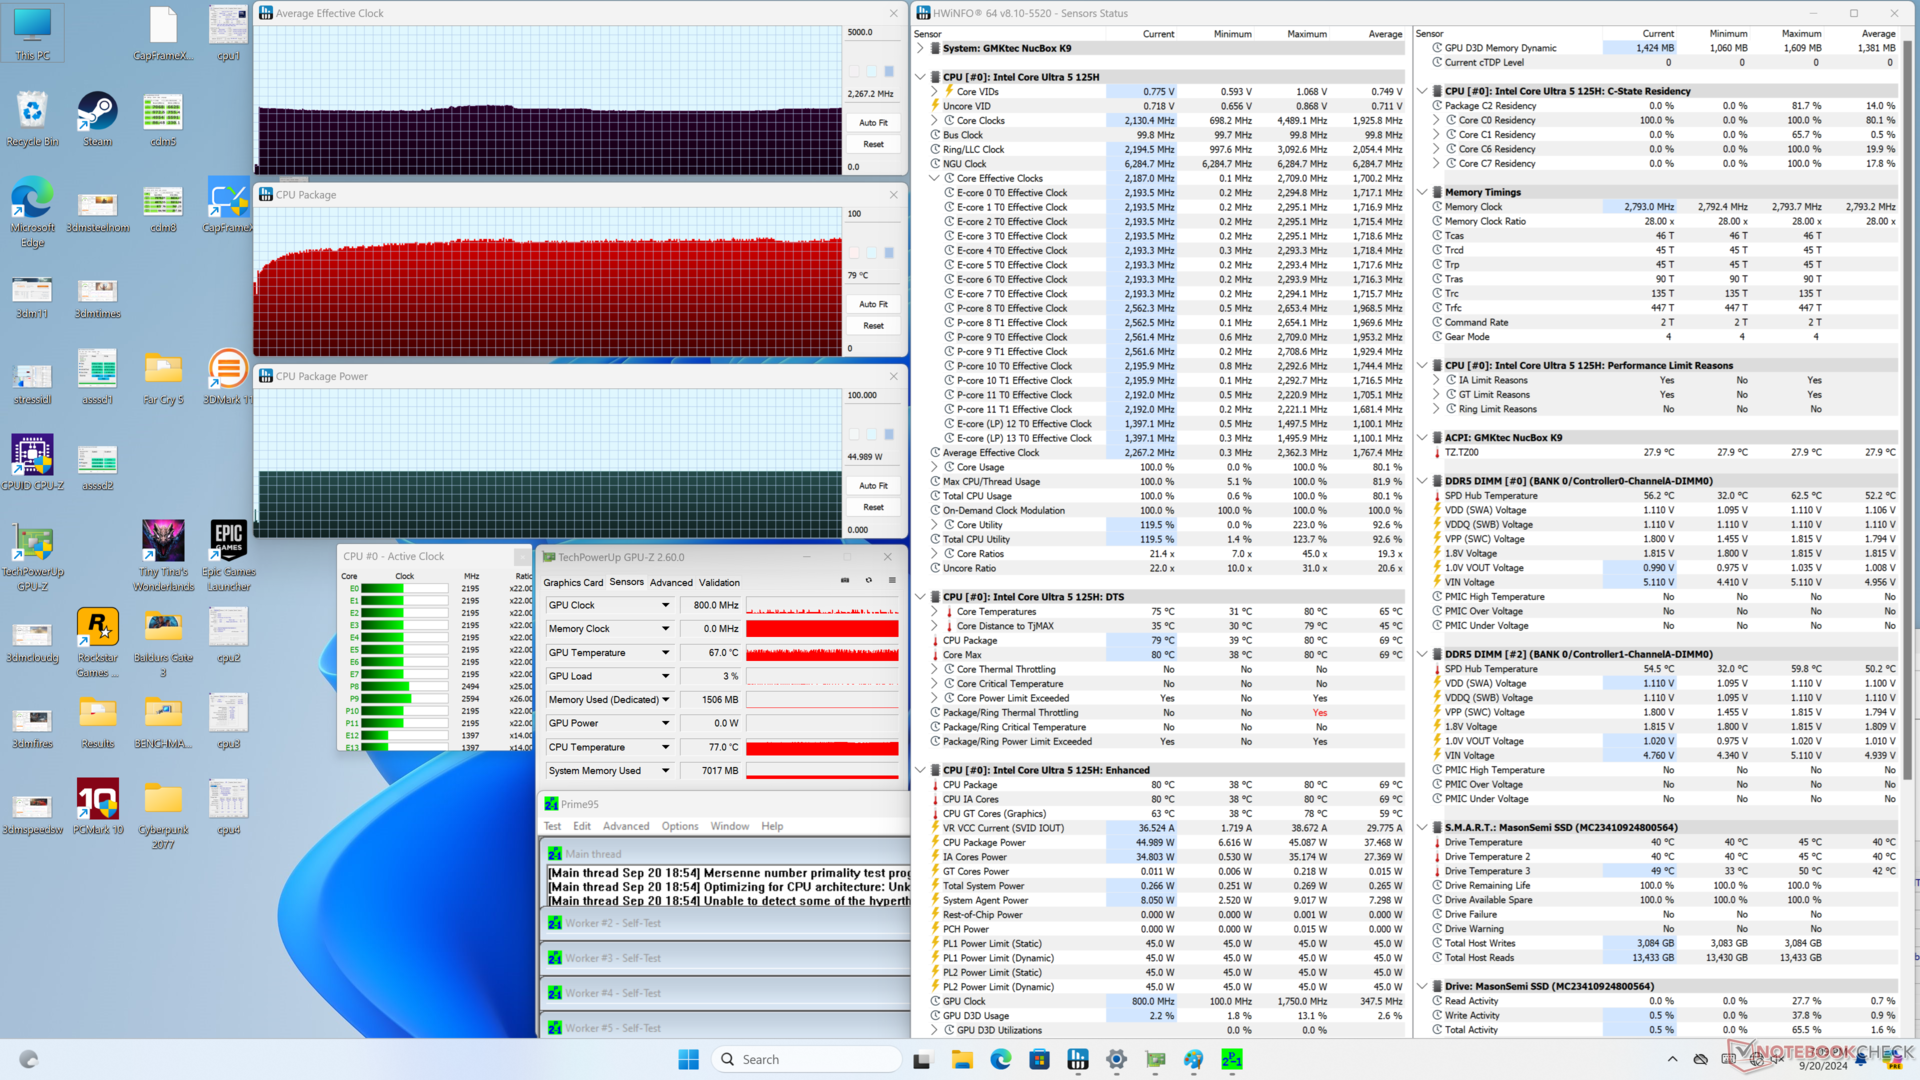
När Prime95-stress initierades ökade processorn till 2,3 GHz och 45 W och behöll sedan dessa värden under hela stresstestet. Kärntemperaturen nådde en platå på 80 C, vilket är något svalare än vad vi registrerade på den snabbare AMD-drivna NucBox K6.
När Cyberpunk 2077 kördes för att representera spelstress stabiliserades kärntemperaturen på 72 C, vilket liknar NucBox K6, även om NucBox K9 kör spel långsammare, vilket vårt avsnitt om spelprestanda nedan visar.

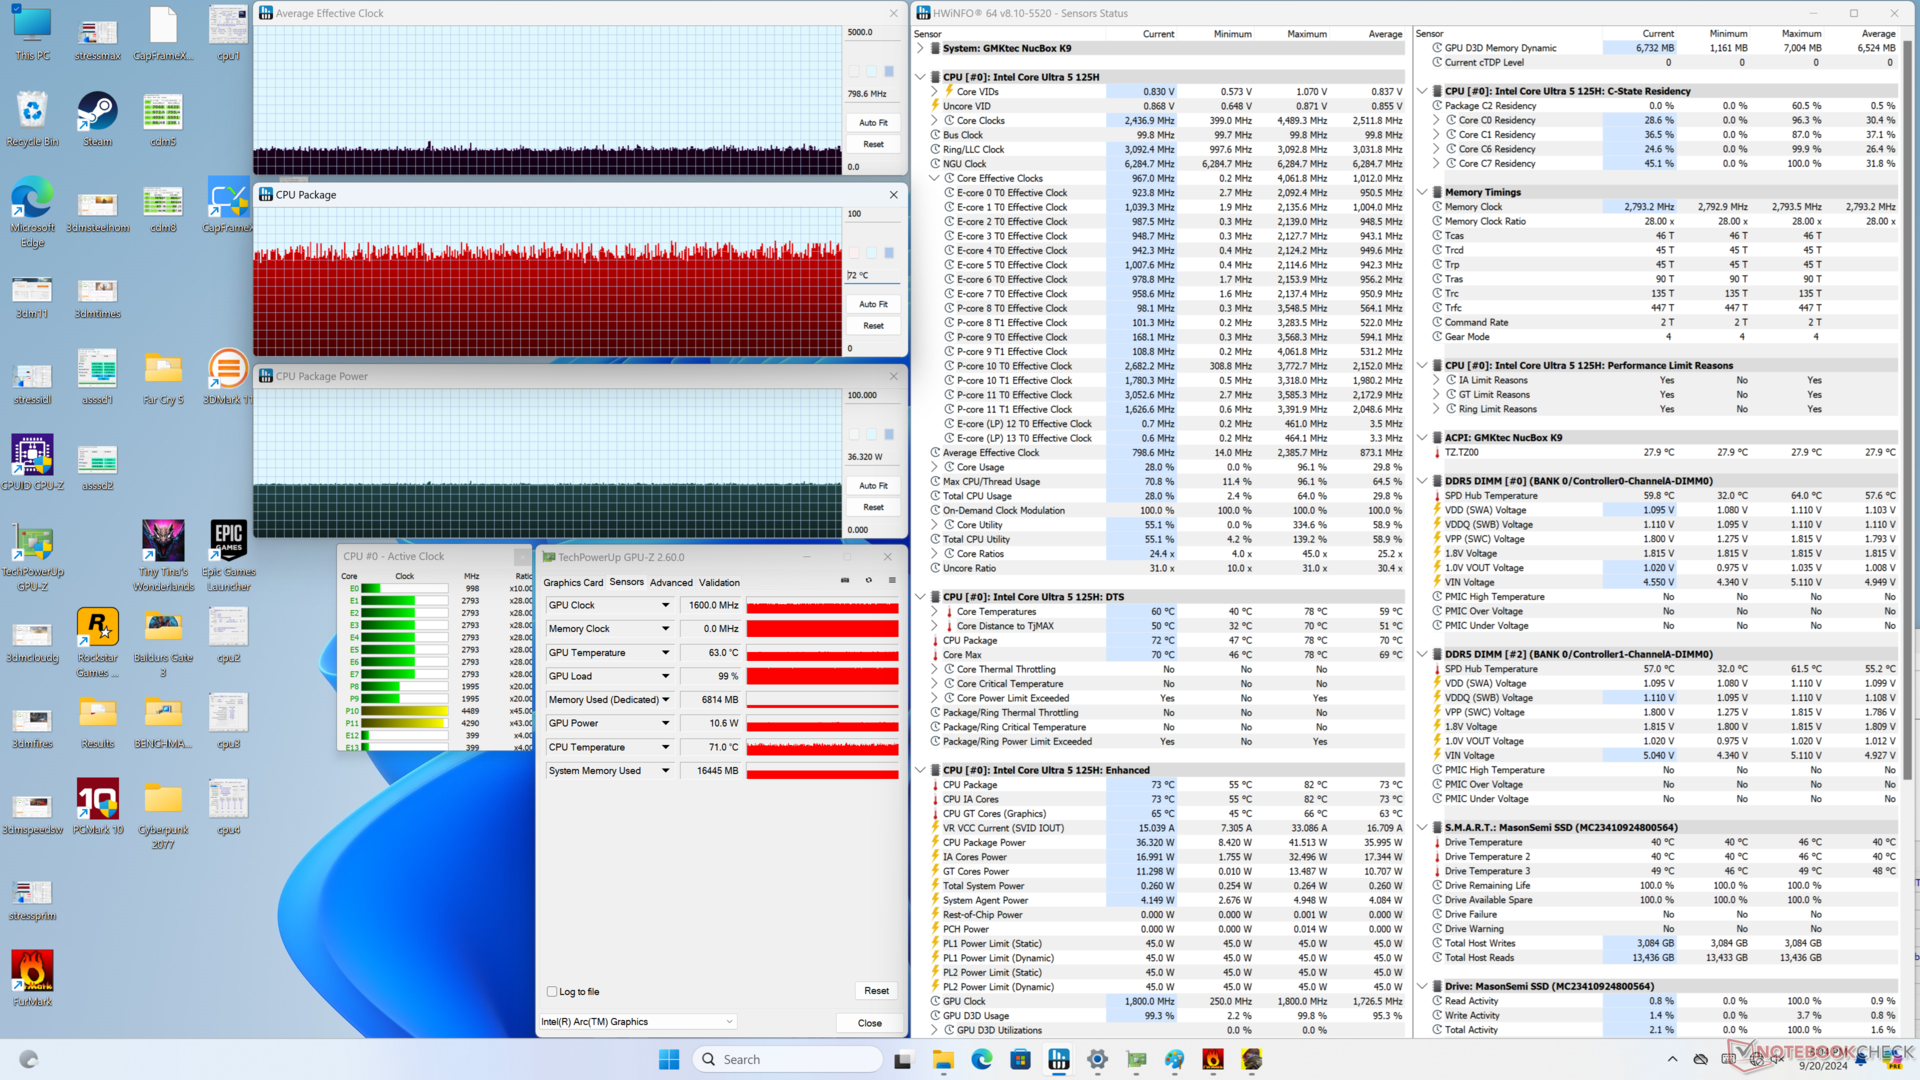
| Genomsnittlig CPU-klocka (GHz) | GPU-klocka (MHz) | Genomsnittlig CPU-temperatur (°C) | |
| System i viloläge | -- | -- | 40 |
| Prime95 Stress | 2.3 | -- | 79 |
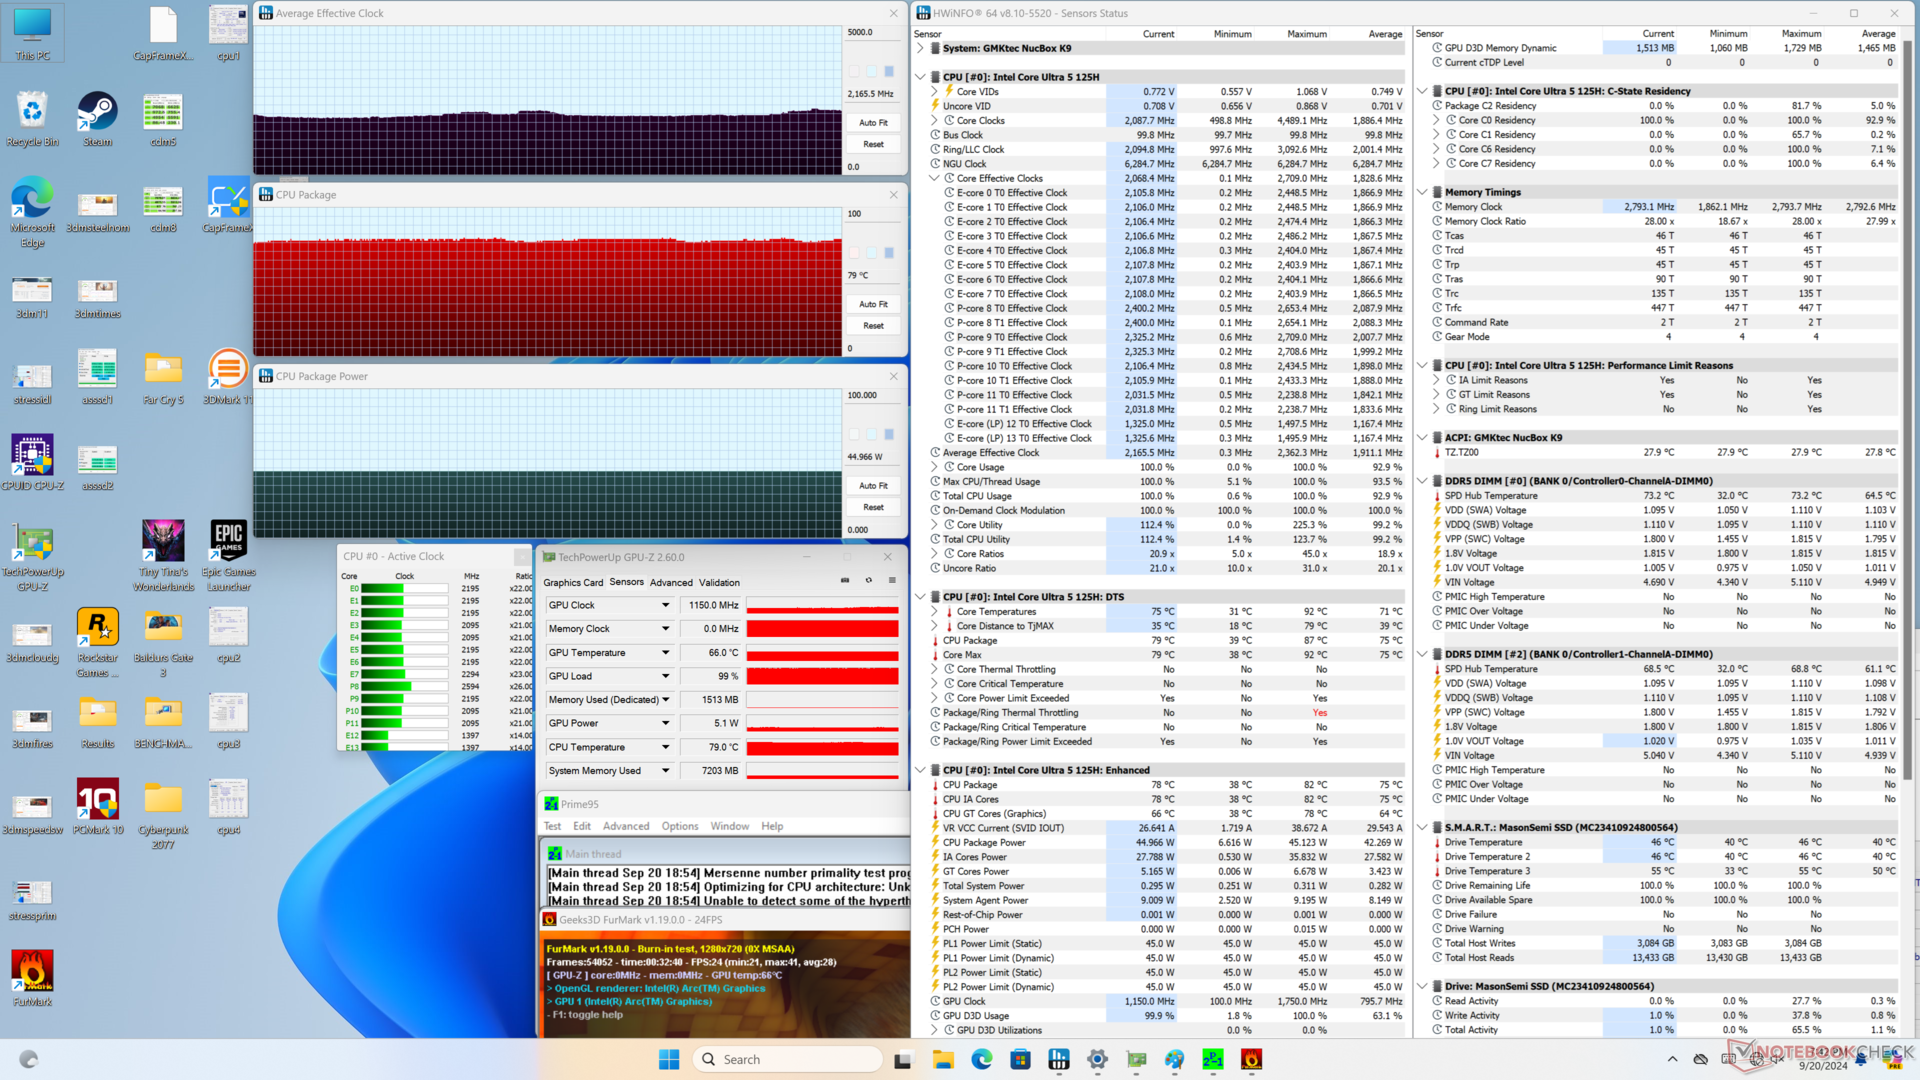
| Prime95 + FurMark Stress | 2.2 | 1150 | 79 |
| Cyberpunk 2077 Stress | 0,9 | 1600 | 72 |
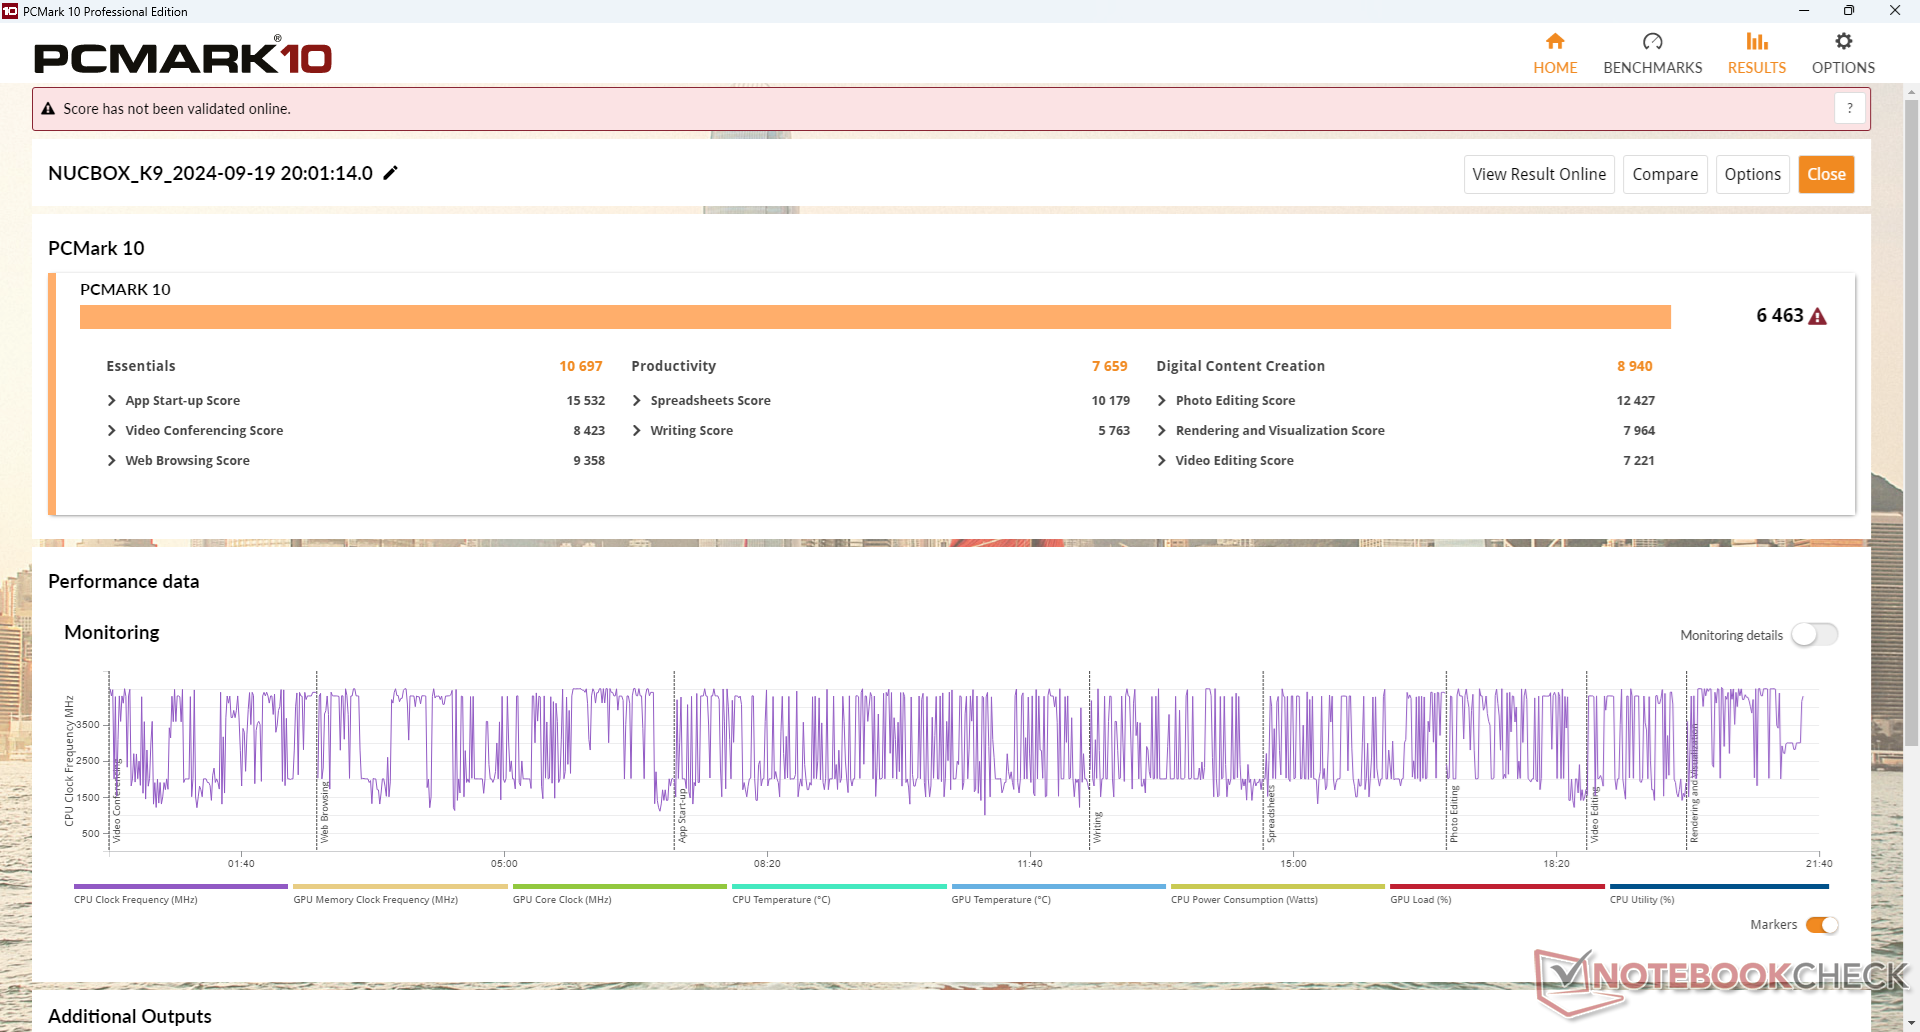
Systemets prestanda
CrossMark: Overall | Productivity | Creativity | Responsiveness
WebXPRT 3: Overall
WebXPRT 4: Overall
Mozilla Kraken 1.1: Total
| PCMark 10 / Score | |
| Beelink SER8 | |
| GMK NucBox K6 | |
| BOSGAME M1 | |
| GMK NucBox K9 | |
| Genomsnitt Intel Core Ultra 5 125H, Intel Arc 7-Core iGPU (6024 - 7240, n=8) | |
| GMK NucBox M6 | |
| Beelink SEi12 Core i5-1235U | |
| PCMark 10 / Essentials | |
| Beelink SER8 | |
| GMK NucBox K6 | |
| BOSGAME M1 | |
| Beelink SEi12 Core i5-1235U | |
| GMK NucBox K9 | |
| GMK NucBox M6 | |
| Genomsnitt Intel Core Ultra 5 125H, Intel Arc 7-Core iGPU (9427 - 10697, n=8) | |
| PCMark 10 / Productivity | |
| GMK NucBox K6 | |
| Beelink SER8 | |
| BOSGAME M1 | |
| GMK NucBox M6 | |
| Genomsnitt Intel Core Ultra 5 125H, Intel Arc 7-Core iGPU (7042 - 13501, n=8) | |
| GMK NucBox K9 | |
| Beelink SEi12 Core i5-1235U | |
| PCMark 10 / Digital Content Creation | |
| Beelink SER8 | |
| BOSGAME M1 | |
| GMK NucBox K6 | |
| GMK NucBox K9 | |
| Genomsnitt Intel Core Ultra 5 125H, Intel Arc 7-Core iGPU (8022 - 9506, n=8) | |
| GMK NucBox M6 | |
| Beelink SEi12 Core i5-1235U | |
| CrossMark / Overall | |
| BOSGAME M1 | |
| Beelink SER8 | |
| GMK NucBox K6 | |
| Beelink SEi12 Core i5-1235U | |
| GMK NucBox K9 | |
| Genomsnitt Intel Core Ultra 5 125H, Intel Arc 7-Core iGPU (1480 - 1633, n=7) | |
| GMK NucBox M6 | |
| CrossMark / Productivity | |
| BOSGAME M1 | |
| GMK NucBox K6 | |
| Beelink SER8 | |
| Beelink SEi12 Core i5-1235U | |
| GMK NucBox K9 | |
| GMK NucBox M6 | |
| Genomsnitt Intel Core Ultra 5 125H, Intel Arc 7-Core iGPU (1412 - 1594, n=7) | |
| CrossMark / Creativity | |
| BOSGAME M1 | |
| Beelink SER8 | |
| GMK NucBox K6 | |
| GMK NucBox K9 | |
| Genomsnitt Intel Core Ultra 5 125H, Intel Arc 7-Core iGPU (1520 - 1780, n=7) | |
| GMK NucBox M6 | |
| Beelink SEi12 Core i5-1235U | |
| CrossMark / Responsiveness | |
| Beelink SEi12 Core i5-1235U | |
| BOSGAME M1 | |
| Beelink SER8 | |
| GMK NucBox K6 | |
| GMK NucBox K9 | |
| GMK NucBox M6 | |
| Genomsnitt Intel Core Ultra 5 125H, Intel Arc 7-Core iGPU (1171 - 1520, n=7) | |
| WebXPRT 3 / Overall | |
| Beelink SER8 | |
| GMK NucBox K6 | |
| BOSGAME M1 | |
| Beelink SEi12 Core i5-1235U | |
| GMK NucBox K9 | |
| Genomsnitt Intel Core Ultra 5 125H, Intel Arc 7-Core iGPU (245 - 263, n=8) | |
| GMK NucBox M6 | |
| WebXPRT 4 / Overall | |
| GMK NucBox K6 | |
| Beelink SER8 | |
| BOSGAME M1 | |
| Beelink SEi12 Core i5-1235U | |
| GMK NucBox K9 | |
| Genomsnitt Intel Core Ultra 5 125H, Intel Arc 7-Core iGPU (222 - 240, n=7) | |
| GMK NucBox M6 | |
| Mozilla Kraken 1.1 / Total | |
| GMK NucBox M6 | |
| Beelink SEi12 Core i5-1235U | |
| Genomsnitt Intel Core Ultra 5 125H, Intel Arc 7-Core iGPU (560 - 625, n=8) | |
| GMK NucBox K9 | |
| GMK NucBox K6 | |
| BOSGAME M1 | |
| Beelink SER8 | |
* ... mindre är bättre
| PCMark 10 Score | 6463 poäng | |
Hjälp | ||
| AIDA64 / Memory Copy | |
| Genomsnitt Intel Core Ultra 5 125H (37664 - 87473, n=8) | |
| BOSGAME M1 | |
| GMK NucBox K6 | |
| Beelink SER8 | |
| GMK NucBox K9 | |
| GMK NucBox M6 | |
| Beelink SEi12 Core i5-1235U | |
| AIDA64 / Memory Read | |
| GMK NucBox K9 | |
| Genomsnitt Intel Core Ultra 5 125H (41700 - 76803, n=8) | |
| Beelink SER8 | |
| BOSGAME M1 | |
| GMK NucBox K6 | |
| GMK NucBox M6 | |
| Beelink SEi12 Core i5-1235U | |
| AIDA64 / Memory Write | |
| BOSGAME M1 | |
| GMK NucBox K6 | |
| Beelink SER8 | |
| GMK NucBox K9 | |
| Genomsnitt Intel Core Ultra 5 125H (35730 - 72443, n=8) | |
| GMK NucBox M6 | |
| Beelink SEi12 Core i5-1235U | |
| AIDA64 / Memory Latency | |
| Genomsnitt Intel Core Ultra 5 125H (127.3 - 184.8, n=8) | |
| GMK NucBox K9 | |
| Beelink SEi12 Core i5-1235U | |
| BOSGAME M1 | |
| Beelink SER8 | |
| GMK NucBox K6 | |
| GMK NucBox M6 | |
* ... mindre är bättre
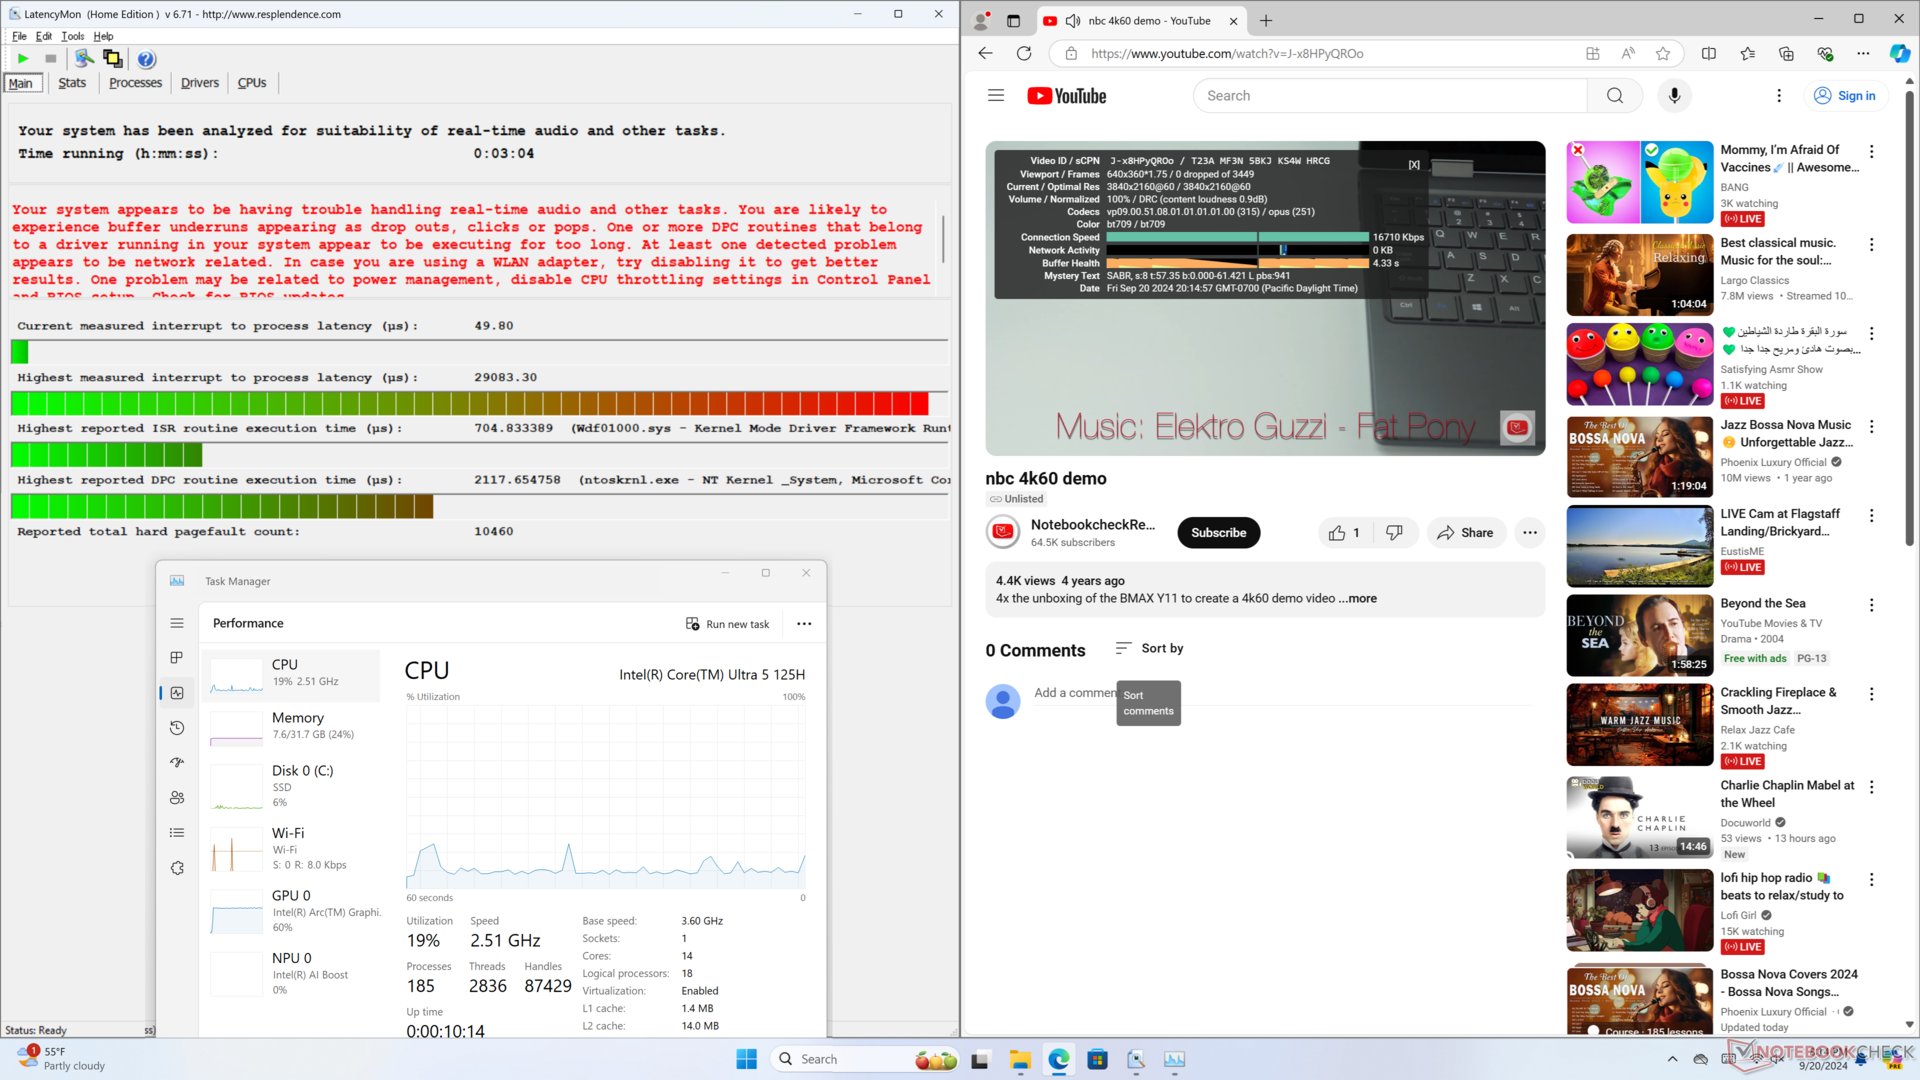
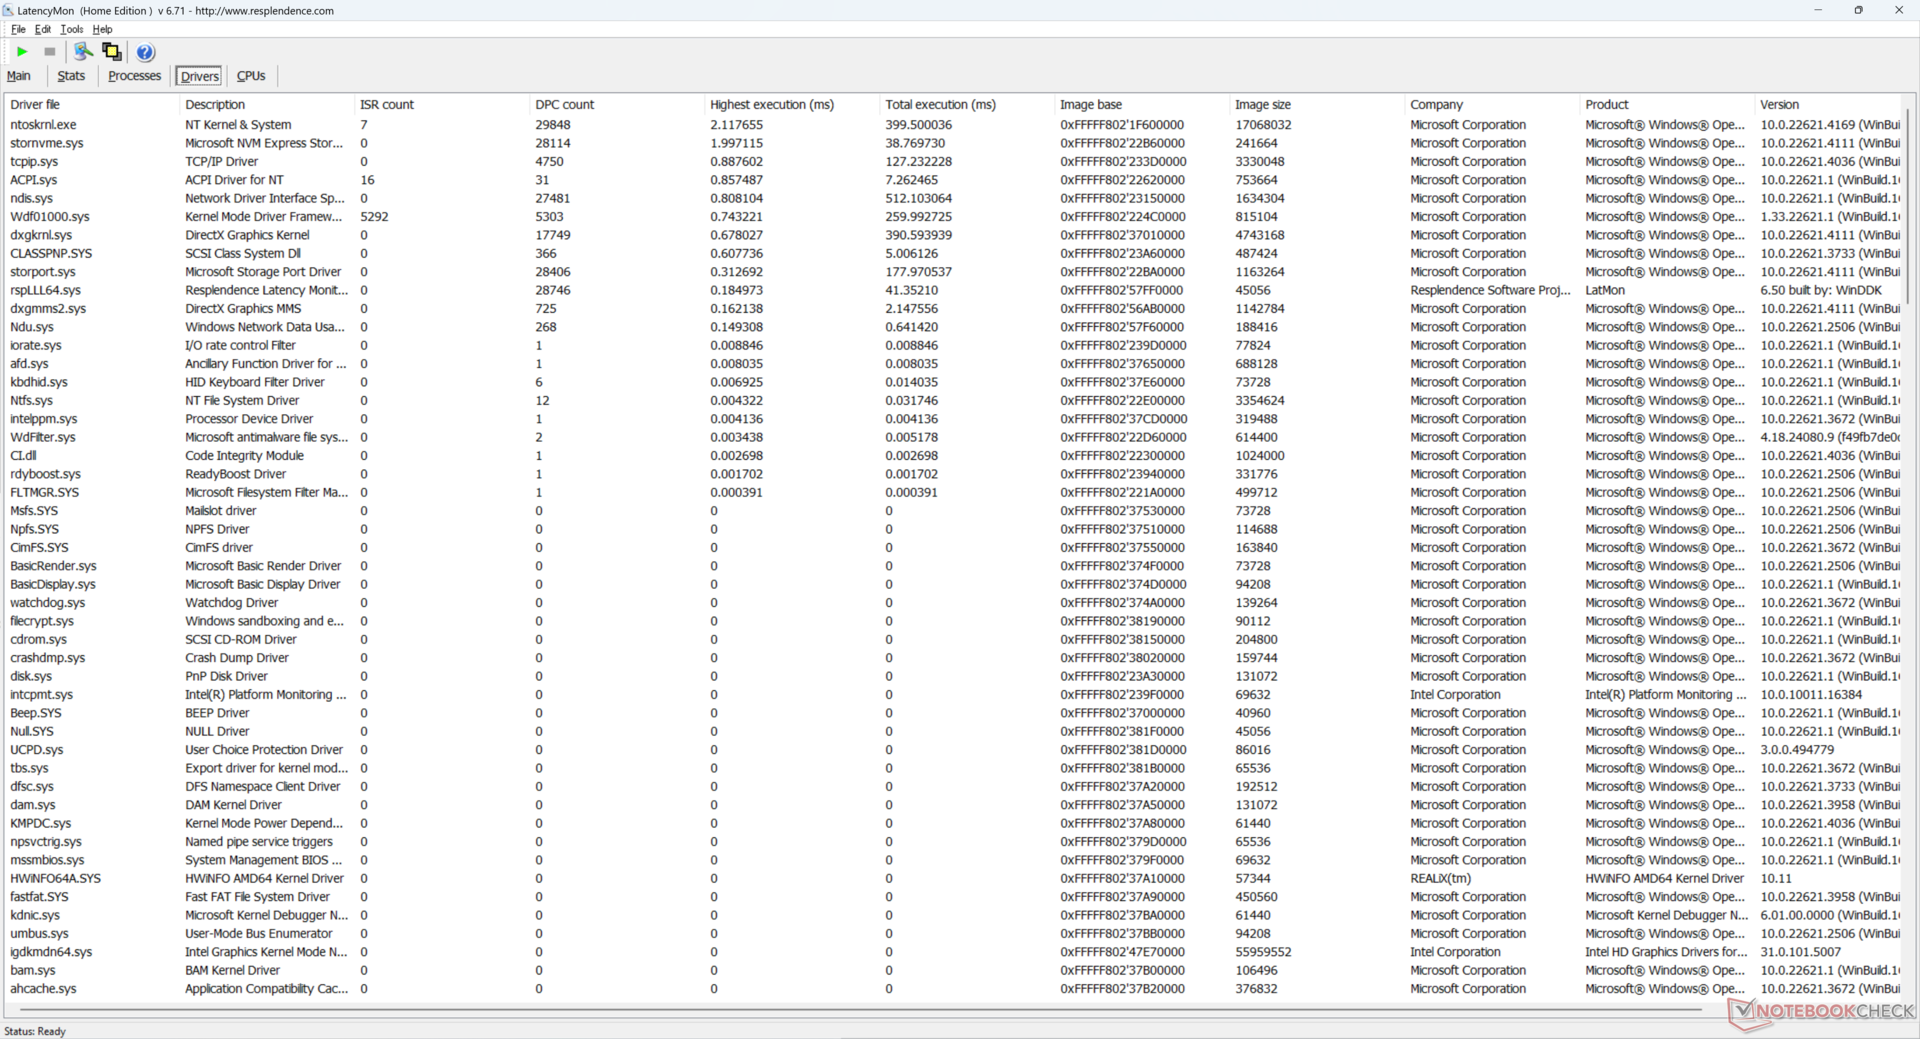
DPC-fördröjning
LatencyMon avslöjar DPC-problem relaterade till ntoskrnl.exe när du öppnar flera flikar på vår hemsida. 4K-videouppspelning med 60 FPS är annars perfekt utan några tappade bildrutor.
| DPC Latencies / LatencyMon - interrupt to process latency (max), Web, Youtube, Prime95 | |
| GMK NucBox K9 | |
| GMK NucBox M6 | |
| GMK NucBox K6 | |
| BOSGAME M1 | |
| Beelink SER8 | |
| Beelink SEi12 Core i5-1235U | |
* ... mindre är bättre
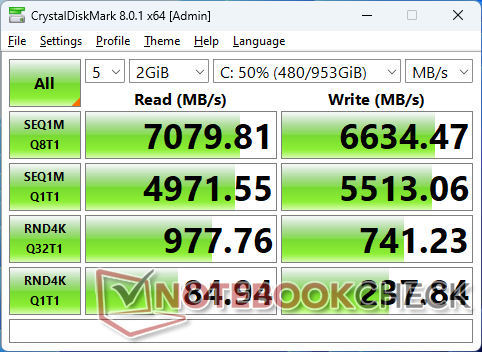
Lagringsenheter
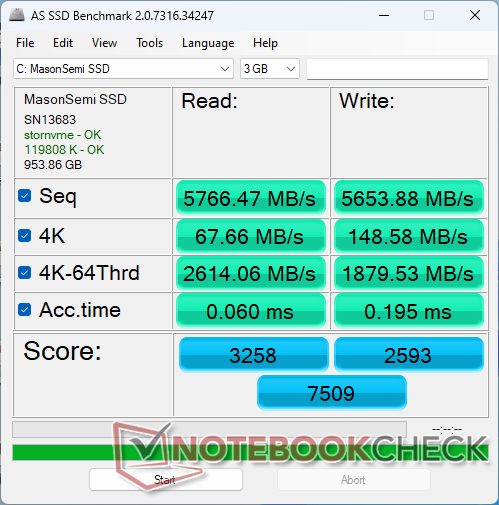
GMK använder samma 1 TB MasonSemi MC7000 PCIe4 x4 NVMe SSD för både sina NucBox K6- och K9-modeller. Prestandan är snabb och jämförbar med Samsung PM9A1-serien som vanligtvis finns på avancerade datorer trots det mindre kända varumärket. Vi kan inte observera någon anmärkningsvärd prestandahastighet när vi kör DiskSpd i en slinga.

| Drive Performance rating - Percent | |
| GMK NucBox K6 | |
| GMK NucBox K9 | |
| Beelink SEi12 Core i5-1235U | |
| Beelink SER8 | |
| BOSGAME M1 | |
| GMK NucBox M6 | |
* ... mindre är bättre
Disk Throttling: DiskSpd Read Loop, Queue Depth 8
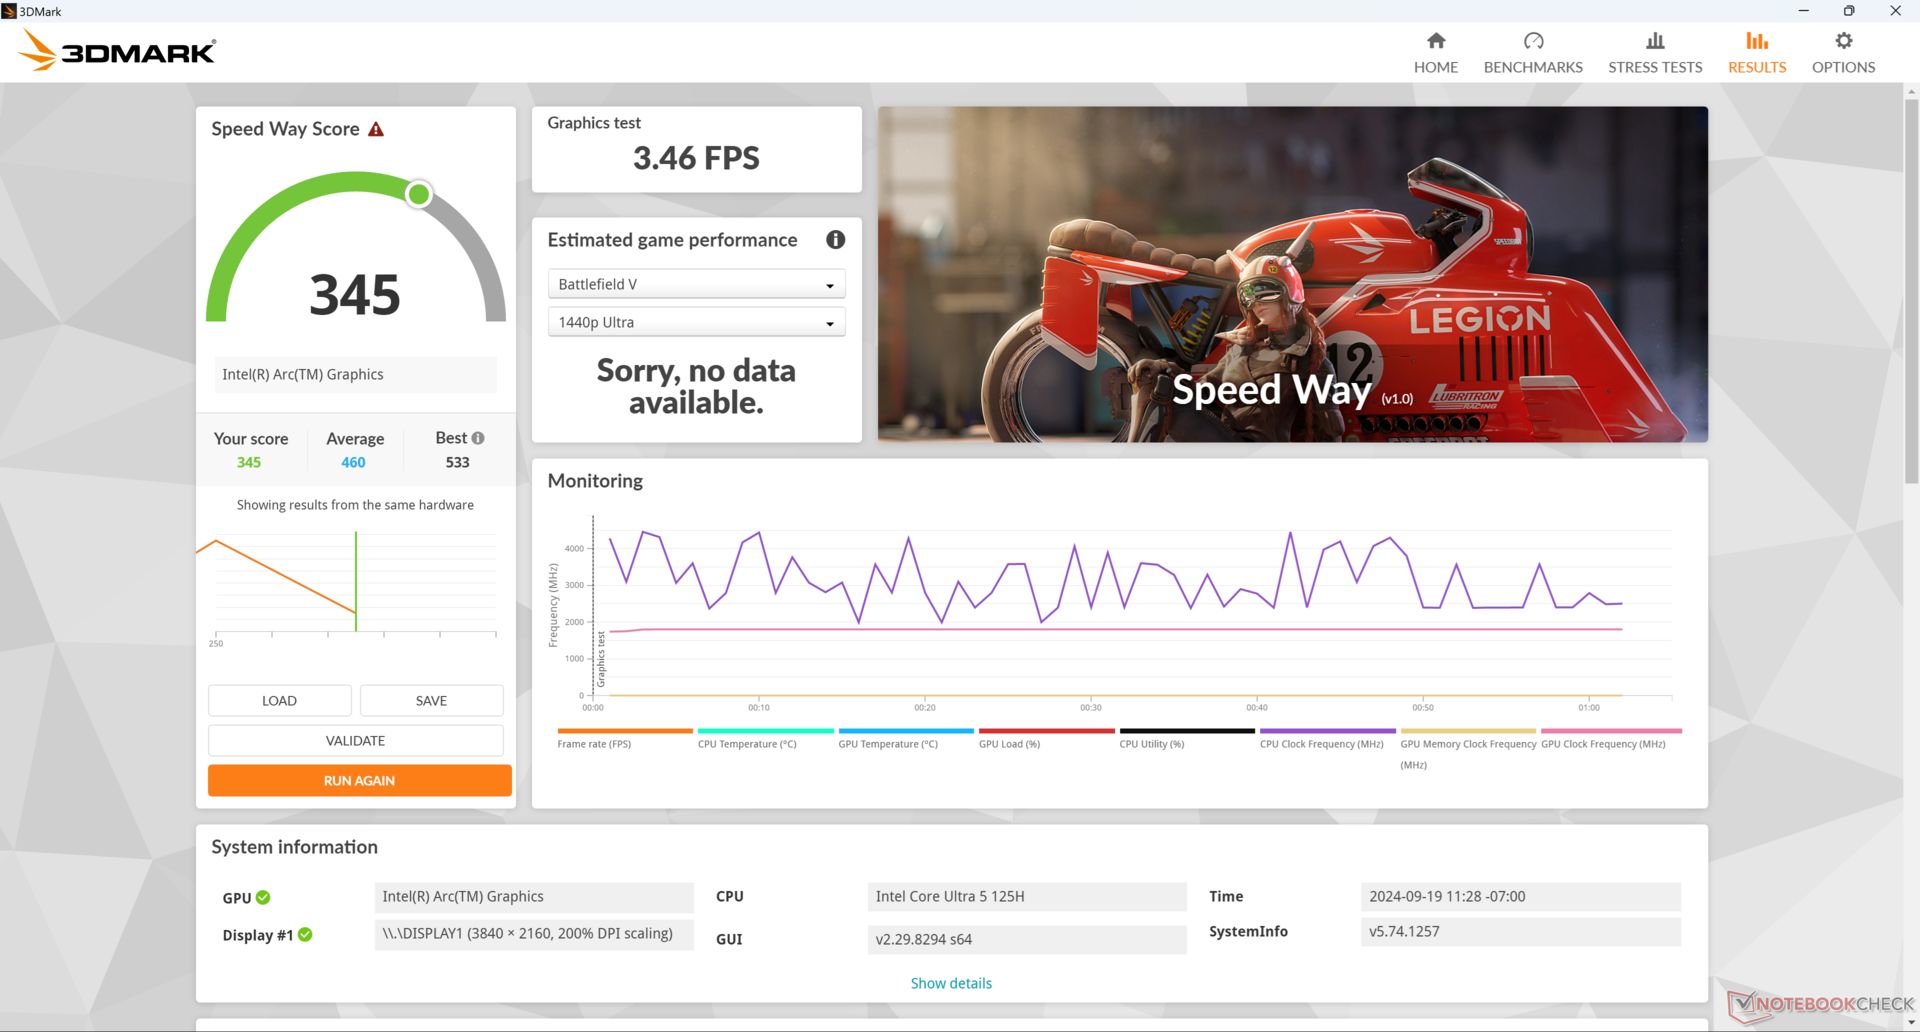
GPU-prestanda
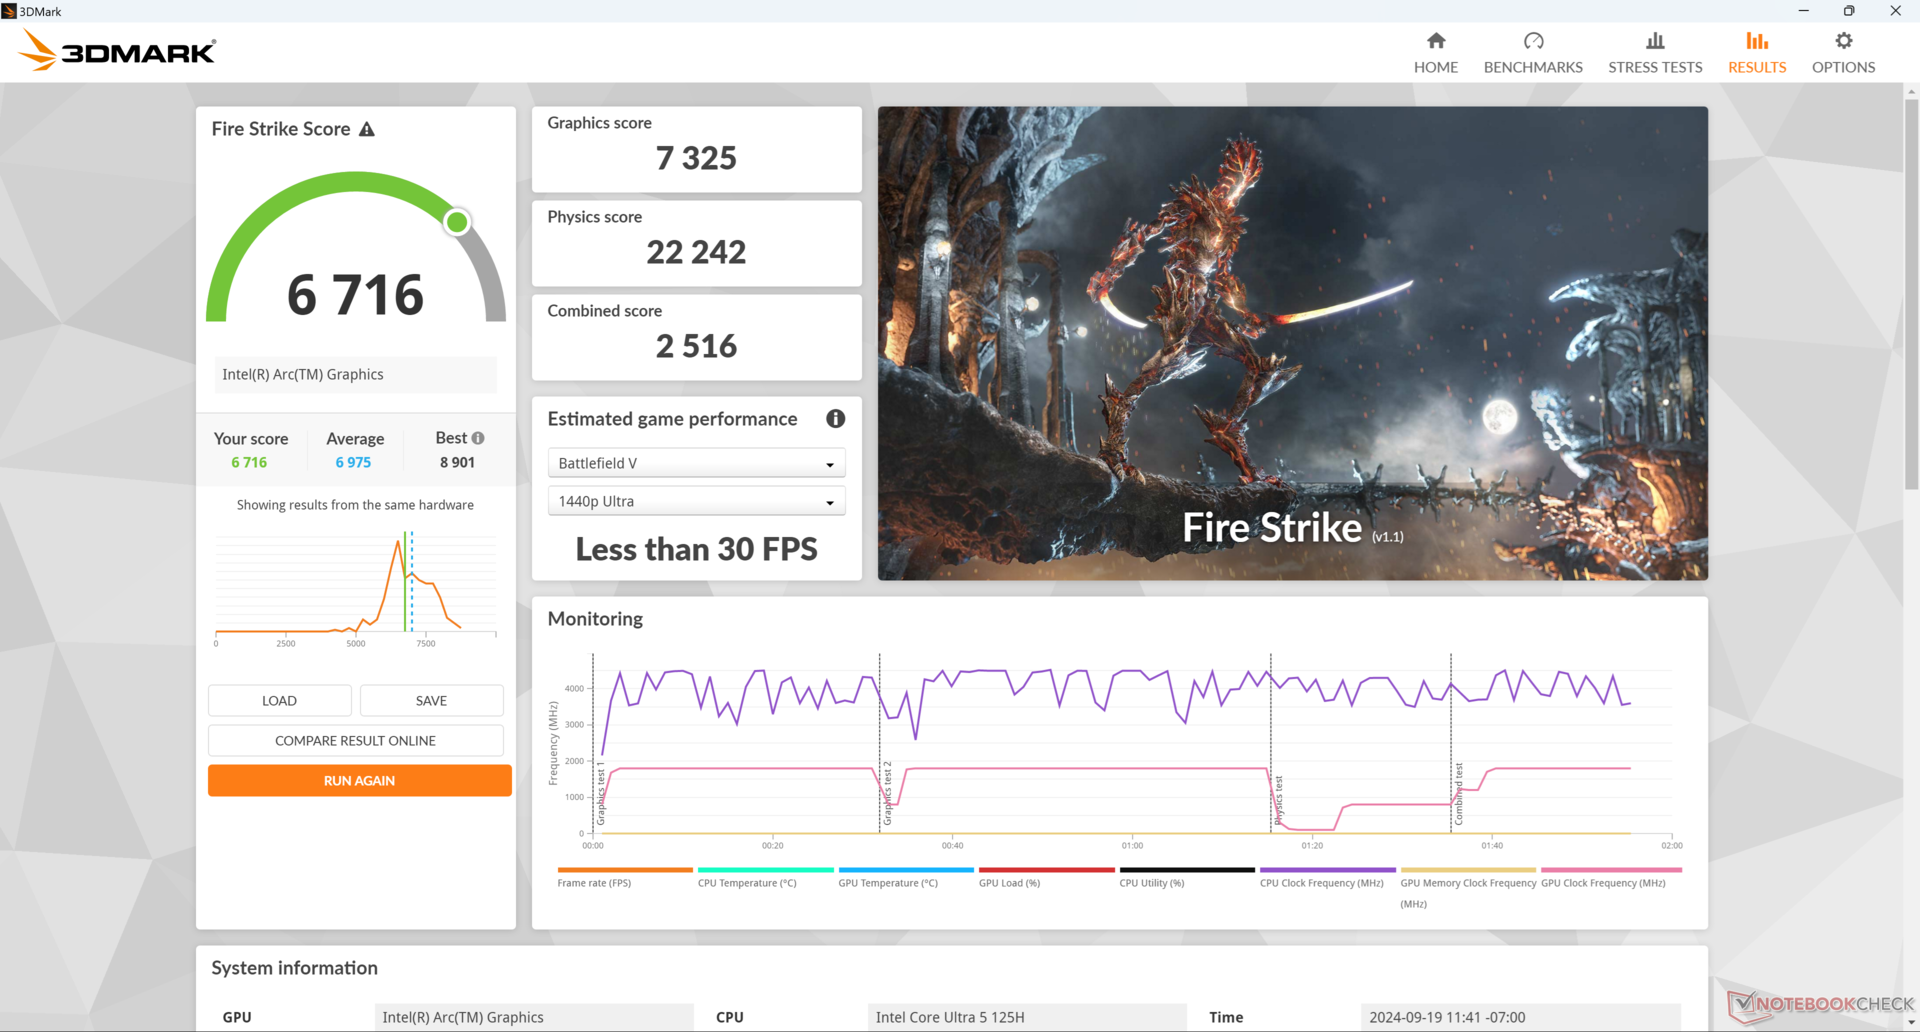
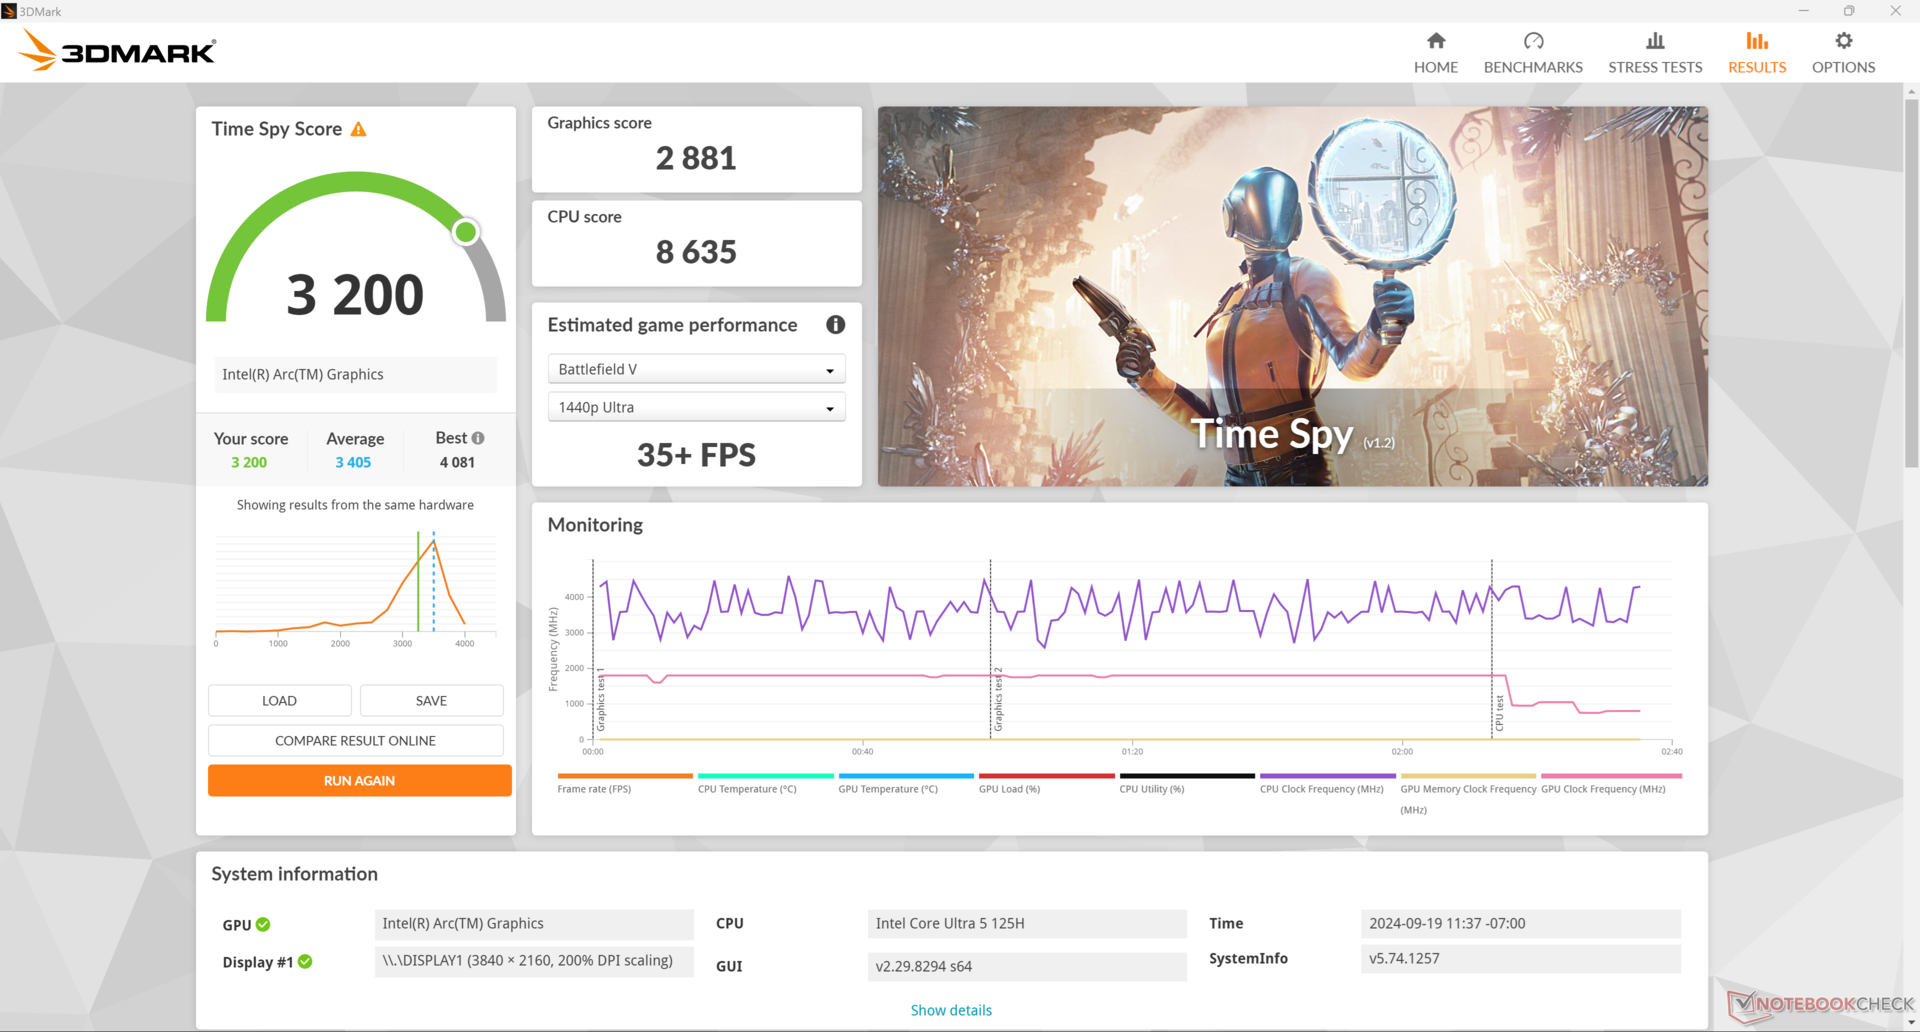
Grafikprestandan är något långsammare än den genomsnittliga datorn i vår databas med samma integrerad Arc 7 GPU med cirka 5 procent. Den integrerade Arc 8 GPU:n på avancerade Core Ultra 7-H- och Core Ultra 9-H-processorer är snabbare än vår Arc 7-lösning med cirka 15 procent, men det finns tyvärr inga sådana SKU:er tillgängliga med NucBox K9. Ändå är den totala prestandan jämförbar med den konkurrerande förra generationens Radeon 780M enligt 3DMark benchmarks.
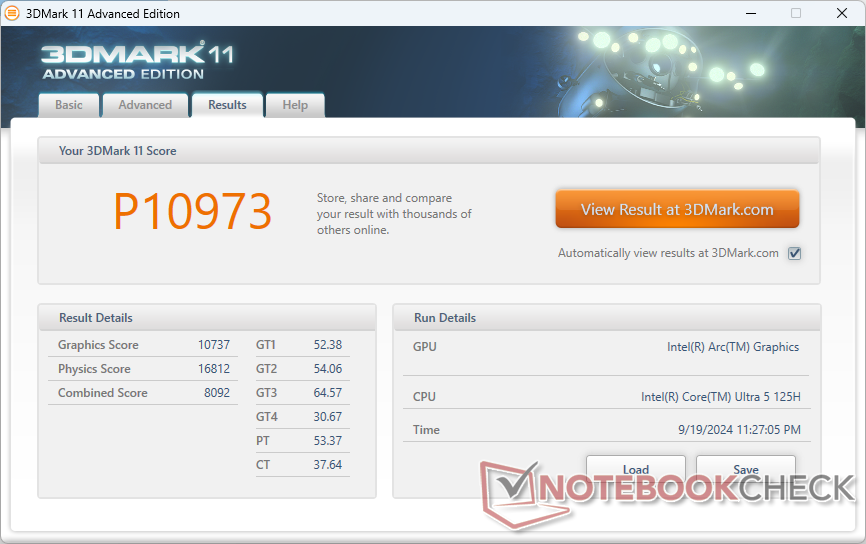
| 3DMark 11 Performance | 10973 poäng | |
| 3DMark Cloud Gate Standard Score | 28997 poäng | |
| 3DMark Fire Strike Score | 6716 poäng | |
| 3DMark Time Spy Score | 3200 poäng | |
| 3DMark Steel Nomad Score | 581 poäng | |
Hjälp | ||
* ... mindre är bättre
Prestanda för spel
Tyvärr är spelprestandan mycket långsammare jämfört med NucBox K6, även om 3DMark-resultaten ovan antyder något annat. De flesta testade titlar, inklusive GTA V, DOTA 2 Reborn, Final Fantasy XV, F1 22 och Baldur's Gate 3 , körs mellan 10 och 40 procent långsammare på vår Intel-drivna NucBox K9. Bildfrekvenser skulle också stamma när de gick på tomgång på Cyberpunk 2077, vilket visas i vårt diagram nedan.
| Performance rating - Percent | |
| BOSGAME M1 -1! | |
| Beelink SER8 -1! | |
| GMK NucBox K6 | |
| GMK NucBox K9 | |
| GMK NucBox M6 -1! | |
| Beelink SEi12 Core i5-1235U -1! | |
| GTA V - 1920x1080 Highest AA:4xMSAA + FX AF:16x | |
| GMK NucBox K6 | |
| GMK NucBox K9 | |
| Beelink SEi12 Core i5-1235U | |
| Final Fantasy XV Benchmark - 1920x1080 High Quality | |
| BOSGAME M1 | |
| Beelink SER8 | |
| GMK NucBox K6 | |
| GMK NucBox K9 | |
| GMK NucBox M6 | |
| Beelink SEi12 Core i5-1235U | |
| Strange Brigade - 1920x1080 ultra AA:ultra AF:16 | |
| BOSGAME M1 | |
| Beelink SER8 | |
| GMK NucBox K6 | |
| GMK NucBox K9 | |
| GMK NucBox M6 | |
| Beelink SEi12 Core i5-1235U | |
| Dota 2 Reborn - 1920x1080 ultra (3/3) best looking | |
| Beelink SER8 | |
| BOSGAME M1 | |
| GMK NucBox K6 | |
| GMK NucBox K9 | |
| GMK NucBox M6 | |
| Beelink SEi12 Core i5-1235U | |
| X-Plane 11.11 - 1920x1080 high (fps_test=3) | |
| GMK NucBox K6 | |
| Beelink SER8 | |
| BOSGAME M1 | |
| GMK NucBox K9 | |
| GMK NucBox M6 | |
| Beelink SEi12 Core i5-1235U | |
| Far Cry 5 - 1920x1080 Ultra Preset AA:T | |
| BOSGAME M1 | |
| Beelink SER8 | |
| GMK NucBox K6 | |
| GMK NucBox K9 | |
| GMK NucBox M6 | |
| F1 22 | |
| 1280x720 Ultra Low Preset AA:T AF:16x | |
| GMK NucBox K6 | |
| Beelink SER8 | |
| GMK NucBox K9 | |
| Genomsnitt Intel Arc 7-Core iGPU (n=1) | |
| Framework Laptop 13.5 Core Ultra 7 155H | |
| GMK NucBox M6 | |
| 1920x1080 Low Preset AA:T AF:16x | |
| GMK NucBox K6 | |
| Beelink SER8 | |
| GMK NucBox K9 | |
| Genomsnitt Intel Arc 7-Core iGPU (n=1) | |
| Framework Laptop 13.5 Core Ultra 7 155H | |
| GMK NucBox M6 | |
| 1920x1080 Medium Preset AA:T AF:16x | |
| GMK NucBox K6 | |
| Beelink SER8 | |
| GMK NucBox K9 | |
| Genomsnitt Intel Arc 7-Core iGPU (n=1) | |
| Framework Laptop 13.5 Core Ultra 7 155H | |
| GMK NucBox M6 | |
| 1920x1080 High Preset AA:T AF:16x | |
| GMK NucBox K6 | |
| Beelink SER8 | |
| Framework Laptop 13.5 Core Ultra 7 155H | |
| GMK NucBox K9 | |
| Genomsnitt Intel Arc 7-Core iGPU (n=1) | |
| GMK NucBox M6 | |
Cyberpunk 2077 ultra FPS Chart
| låg | med. | hög | ultra | |
|---|---|---|---|---|
| GTA V (2015) | 143.6 | 125.5 | 33.6 | 12.7 |
| Dota 2 Reborn (2015) | 97.7 | 83.1 | 75.6 | 73.3 |
| Final Fantasy XV Benchmark (2018) | 59.6 | 33.3 | 22.3 | |
| X-Plane 11.11 (2018) | 57 | 44.8 | 37.3 | |
| Far Cry 5 (2018) | 71 | 40 | 37 | 35 |
| Strange Brigade (2018) | 148.6 | 63.9 | 53.5 | 43.5 |
| Tiny Tina's Wonderlands (2022) | 50.7 | 39.4 | 26.8 | 22.4 |
| F1 22 (2022) | 79.4 | 71.9 | 52.9 | |
| Baldur's Gate 3 (2023) | 33.7 | 27.9 | 24.2 | 23.1 |
| Cyberpunk 2077 (2023) | 30.9 | 25.2 | 21.3 | 18.8 |
Utsläpp - Fläktarna är alltid på
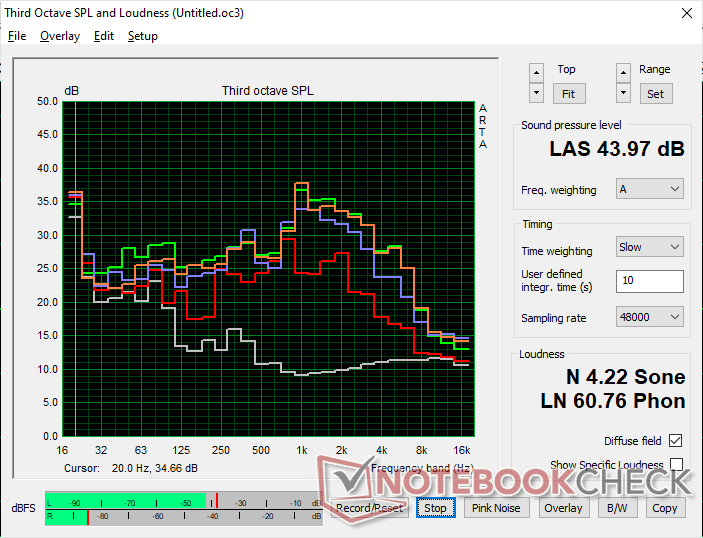
Systembuller
Fläktljudet är alltid närvarande på enheten oavsett belastningen på skärmen, ungefär som det vi registrerade på NucBox K6. Enbart tomgångskörning på skrivbordet är redan 30 till 36 dB(A) mot en tyst bakgrund på 23 dB(A), även när den är inställd på energisparläge. Fläktljudet när du spelar eller kör andra krävande belastningar verkar dock vara tystare på NucBox K9 med cirka 44 dB(A) jämfört med nästan 48 dB(A) på NucBox K6.
Ljudnivå
| Låg belastning |
| 29.8 / 35.7 / 35.7 dB(A) |
| Hög belastning |
| 41.9 / 44 dB(A) |
 | ||
30 dB tyst 40 dB(A) hörbar 50 dB(A) högt ljud |
||
min: | ||
| GMK NucBox K9 Arc 7-Core, Ultra 5 125H, MasonSemi 1TB MC7000 | GMK NucBox K6 Radeon 780M, R7 7840HS, MasonSemi 1TB MC7000 | GMK NucBox M6 Radeon 660M, R5 6600H, AirDisk APF 10-512G | Beelink SER8 Radeon 780M, R7 8845HS, Crucial P3 Plus CT1000P3PSSD8 | Beelink SEi12 Core i5-1235U Iris Xe G7 80EUs, i5-1235U, Kingston NV1 SNVS/500GCN | BOSGAME M1 Radeon 780M, R7 7840HS, Kingston OM8PGP41024N-A0 | |
|---|---|---|---|---|---|---|
| Noise | -2% | -4% | 14% | 14% | 4% | |
| av / miljö * (dB) | 23 | 23.2 -1% | 24.2 -5% | 23.6 -3% | 23.3 -1% | 23.2 -1% |
| Idle Minimum * (dB) | 29.8 | 31.3 -5% | 31.9 -7% | 28.8 3% | 27.8 7% | 32 -7% |
| Idle Average * (dB) | 35.7 | 31.3 12% | 32 10% | 28.8 19% | 27.8 22% | 32 10% |
| Idle Maximum * (dB) | 35.7 | 33.4 6% | 33.8 5% | 30.5 15% | 27.8 22% | 32 10% |
| Load Average * (dB) | 41.9 | 47.5 -13% | 48.5 -16% | 34.6 17% | 32 24% | 38.7 8% |
| Cyberpunk 2077 ultra * (dB) | 43.8 | 34.1 22% | ||||
| Load Maximum * (dB) | 44 | 47.7 -8% | 48.5 -10% | 34.5 22% | 39.2 11% | 42 5% |
| Witcher 3 ultra * (dB) | 43.6 | 48.5 | 34.1 | 41.7 |
* ... mindre är bättre
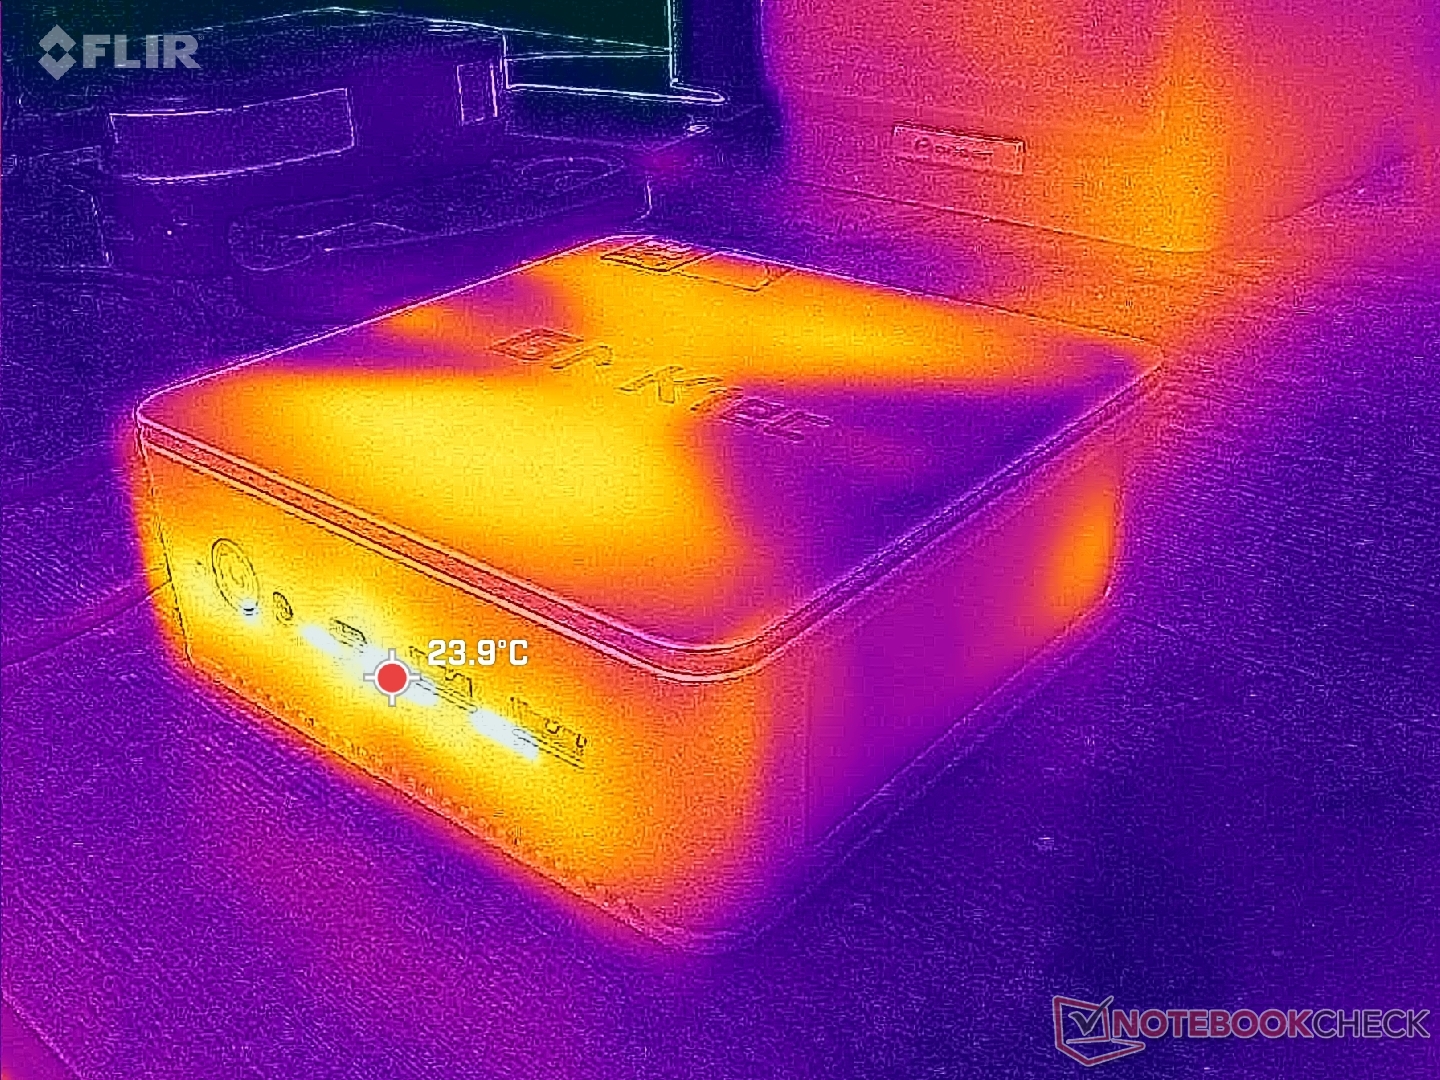
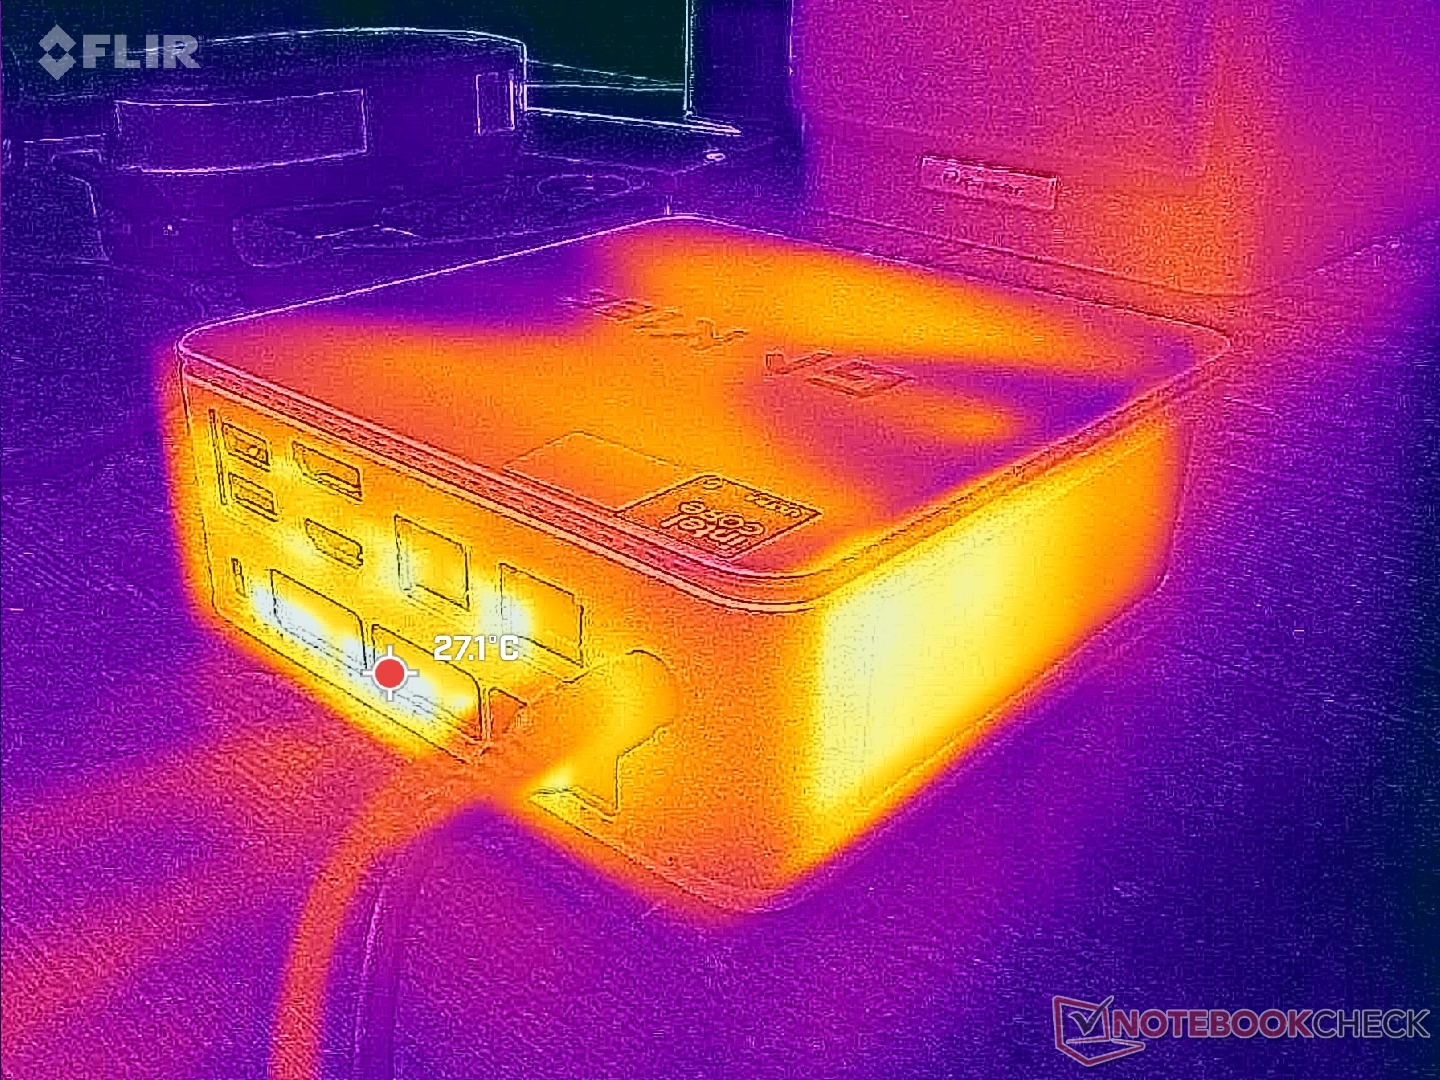
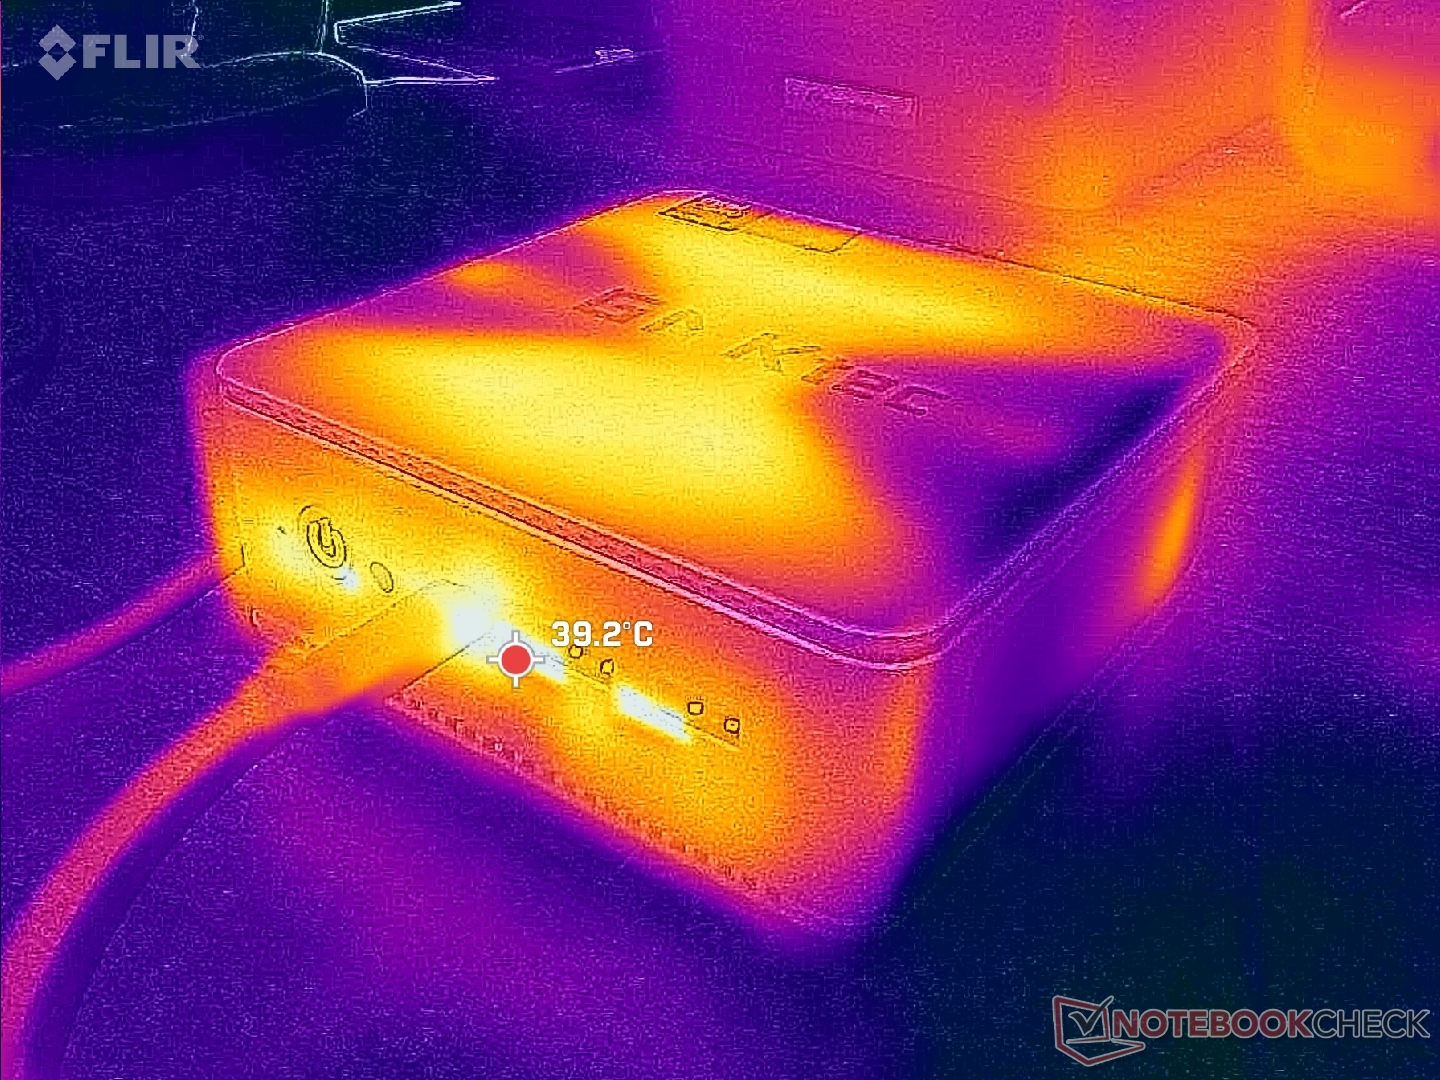
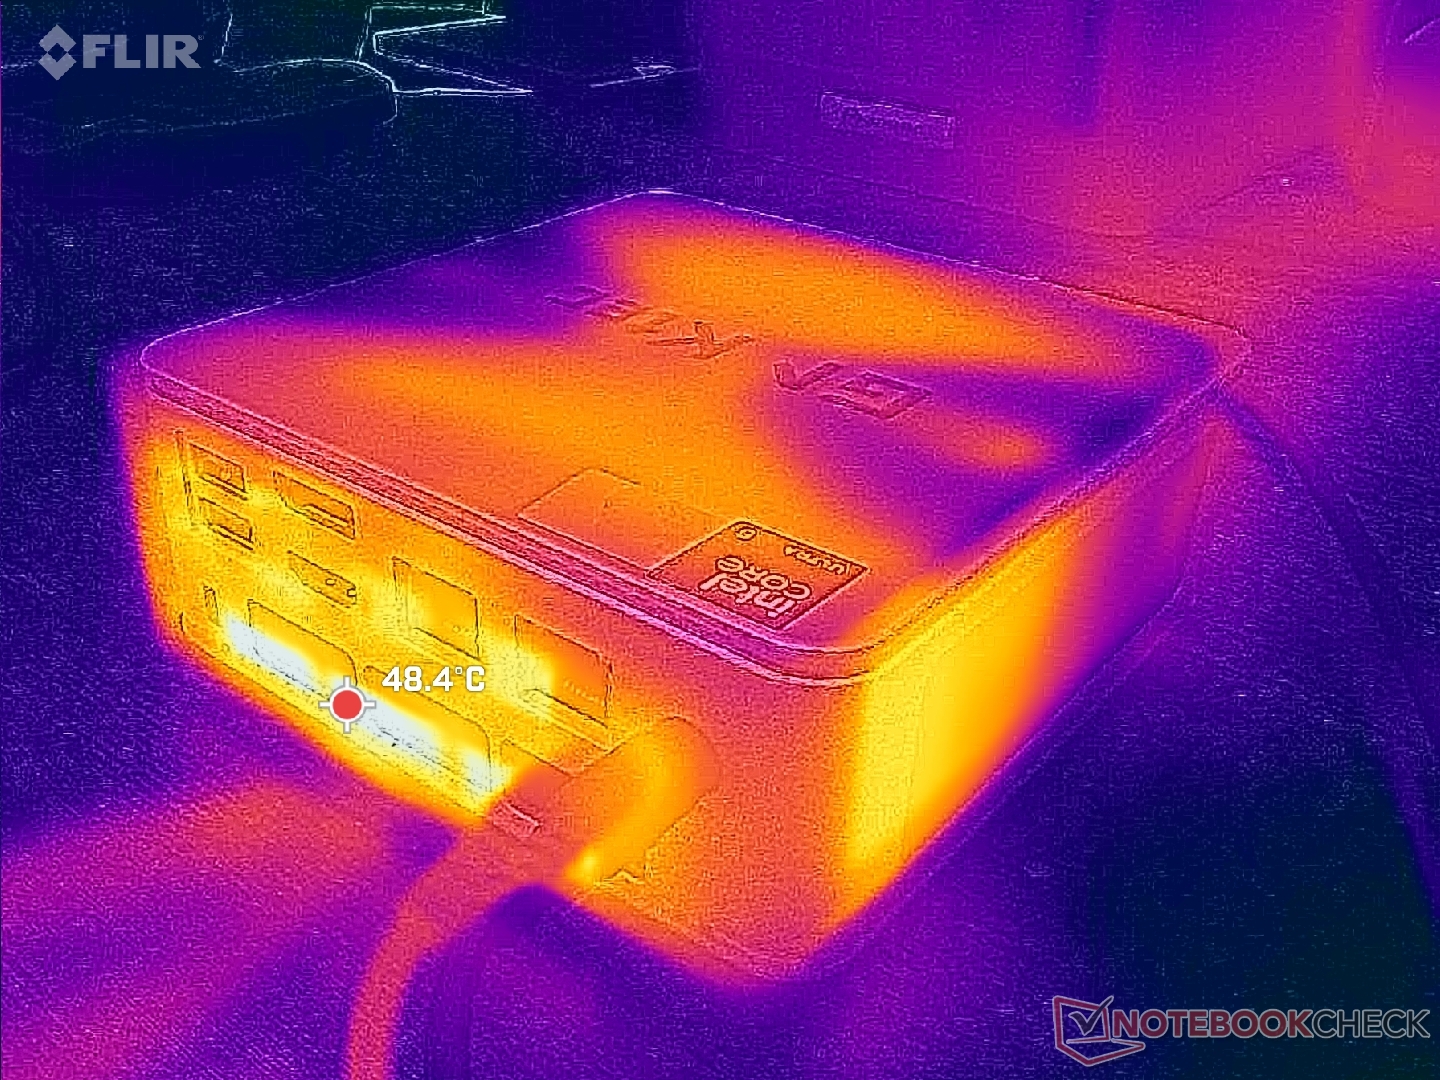
Temperatur
Ytans temperatur är inget problem. ventilationsgaller finns på varje sida av enheten utom på ovansidan, vilket innebär att det är säkert att placera bärbara datorer och andra små föremål ovanpå utan att hindra luftflödet.
Energiförvaltning
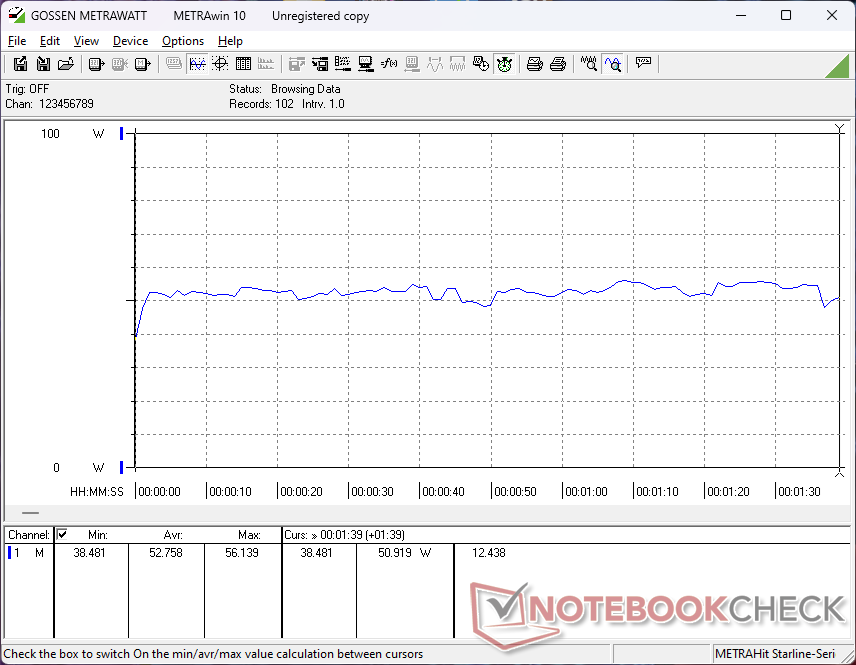
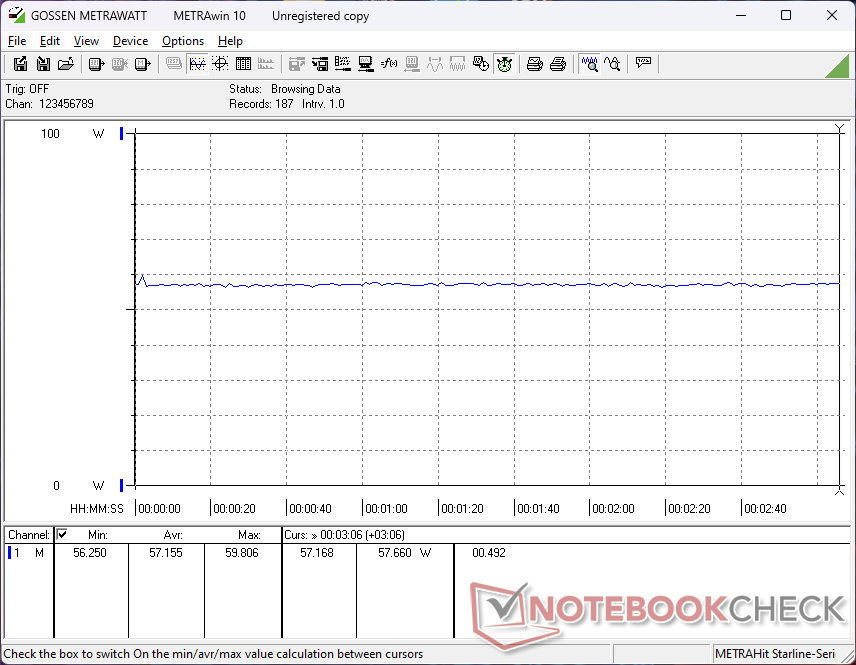
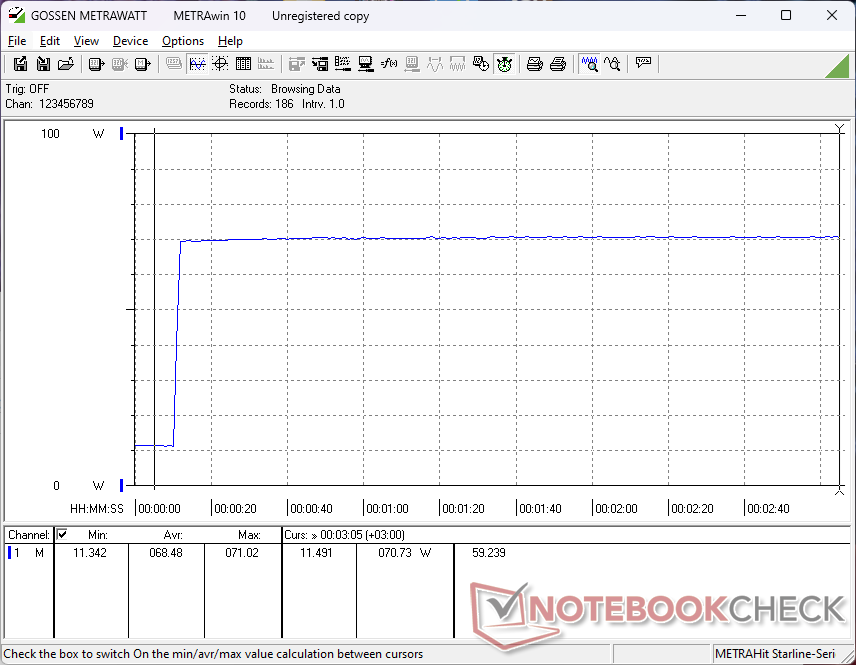
Strömförbrukning
Förbrukningen vid tomgångskörning på skrivbordet är högre än väntat, cirka 11 W även i energisparläge jämfört med 6 till 8 W på andra modeller som NucBox M6 eller Beelink SER8. När vi kör mer krävande belastningar som 3DMark 06 eller Cyberpunk 2077 är förbrukningen dock märkbart lägre än på den snabbare NucBox K6.
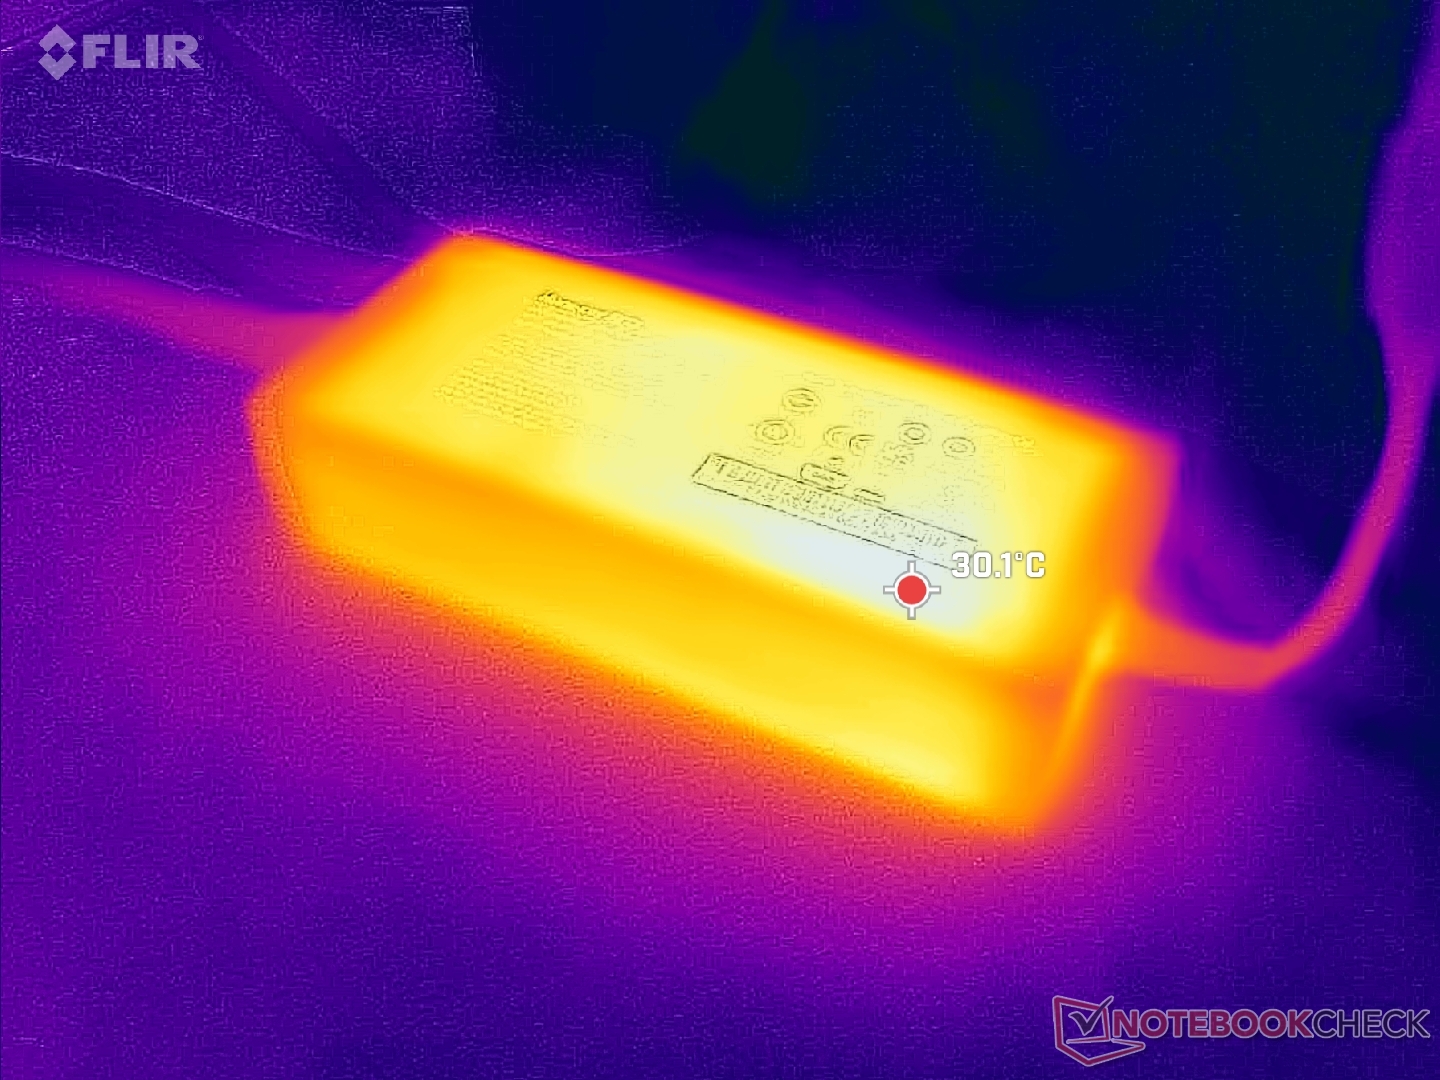
Vi kan registrera ett maximalt uttag på 73 W från den lilla-medium (~14,5 x 6,4 x 3 cm) 120 W AC-adapter. Det stora uttaget kan tillskrivas Thunderbolt 4-porten i händelse av att anslutna bildskärmar eller tillbehör kräver extra ström.
| Av/Standby | |
| Låg belastning | |
| Hög belastning |
|
Förklaring:
min: | |
| GMK NucBox K9 Ultra 5 125H, Arc 7-Core, MasonSemi 1TB MC7000, , x, | GMK NucBox K6 R7 7840HS, Radeon 780M, MasonSemi 1TB MC7000, , x, | GMK NucBox M6 R5 6600H, Radeon 660M, AirDisk APF 10-512G, , x, | Beelink SER8 R7 8845HS, Radeon 780M, Crucial P3 Plus CT1000P3PSSD8, , x, | Beelink SEi12 Core i5-1235U i5-1235U, Iris Xe G7 80EUs, Kingston NV1 SNVS/500GCN, , x, | BOSGAME M1 R7 7840HS, Radeon 780M, Kingston OM8PGP41024N-A0, , x, | |
|---|---|---|---|---|---|---|
| Power Consumption | 10% | 10% | 9% | -43% | 4% | |
| Idle Minimum * (Watt) | 10.9 | 6.7 39% | 7.9 28% | 7.3 33% | 15.8 -45% | 7.3 33% |
| Idle Average * (Watt) | 11 | 7 36% | 8 27% | 7.3 34% | 16.8 -53% | 7.3 34% |
| Idle Maximum * (Watt) | 11.4 | 7.6 33% | 8.3 27% | 8.4 26% | 17 -49% | 8.4 26% |
| Load Average * (Watt) | 52.8 | 74.3 -41% | 61.5 -16% | 68.2 -29% | 54.4 -3% | 72.7 -38% |
| Cyberpunk 2077 ultra external monitor * (Watt) | 57.1 | |||||
| Load Maximum * (Watt) | 72.2 | 85.7 -19% | 84.6 -17% | 84.3 -17% | 119.1 -65% | 99.1 -37% |
| Witcher 3 ultra * (Watt) | 75 | 47.3 | 75.1 | 50.7 | 80.5 |
* ... mindre är bättre
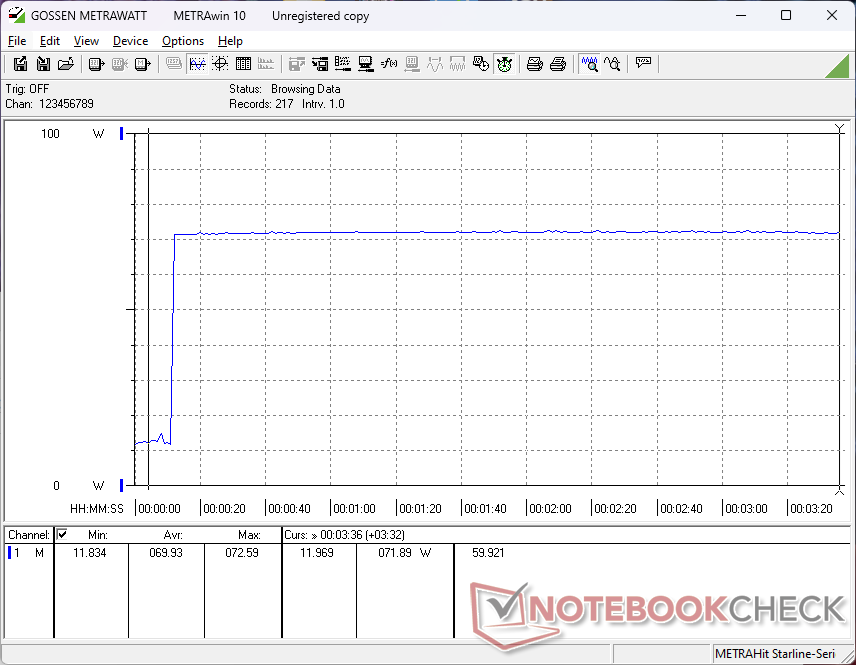
Power Consumption Prime95+FurMark Stress Test
Power Consumption external Monitor
För
Emot
Utlåtande - Nyare men inte snabbare
För 570 $ till försäljning med 32 GB RAM och 1 TB lagringsutrymme representerar NucBox K9 ett bra värde jämfört med Beelink SER8 som för närvarande är dyrare på $ 630 på Amazon. Den största fienden till GMK är förmodligen GMK själv eftersom modeller som NucBox K6 är både billigare och snabbare än NucBox K9 i vad som i huvudsak är samma chassidesign med samma fysiska funktioner. I det här scenariot finns det nästan ingen anledning att köpa NucBox K9 över K6 om du inte prioriterar den integrerade NPU över rå CPU- och GPU-kraft. Även den konkurrerande Bosgame M1 är för närvarande billigare och snabbare till $ 500. Det är sant att NucBox K9 körs lite tystare, men det beror bara på att modellen också är lite långsammare till att börja med.
NucBox K9 är inte en dålig mini-dator på något sätt, men dess högre pris och långsammare prestanda än den äldre NucBox K6 kommer säkert att förvirra många köpare, särskilt för dem som inte är intresserade av AI-acceleration.
Utöver pris- och prestandaskillnaderna mellan NucBox K6- och K9-modellerna börjar designen av serien visa sin ålder. Konkurrenter som Bosgame har starkare chassidesigner i metall medan Beelink nyligen omdesignade sin SER-serie för att vara mycket mer professionell och till och med lyxig. GMK NucBox, som mestadels består av plast, fungerar tillräckligt bra, men det kan vara dags för en översyn med material av högre kvalitet eller potentiellt verktygslös service.
Pris och tillgänglighet
GMKtec NucBox K9 levereras nu som konfigurerad i denna recension på Amazon för $ 720 (efter kupong) eller direkt från tillverkaren för $570. En barebones SKU finns också tillgänglig för $ 400.
Obs: Vi har nyligen uppdaterat vårt betygssystem och resultaten från version 8 är inte jämförbara med resultaten från version 7. Mer information finns tillgänglig här .
GMK NucBox K9
- 10/30/2024 v8
Allen Ngo
 Total Sustainability Score:
 Genomskinlighet
Valet av enheter som ska granskas görs av vår redaktion. Testprovet gavs till författaren som ett lån av tillverkaren eller återförsäljaren för denna recension. Långivaren hade inget inflytande på denna recension och inte heller fick tillverkaren en kopia av denna recension innan publiceringen. Det fanns ingen skyldighet att publicera denna recension. Som ett oberoende medieföretag är Notebookcheck inte föremål för auktoritet från tillverkare, återförsäljare eller förlag.
This is how Notebookcheck is testingEvery year, Notebookcheck independently reviews hundreds of laptops and smartphones using standardized procedures to ensure that all results are comparable. We have continuously developed our test methods for around 20 years and set industry standards in the process. In our test labs, high-quality measuring equipment is utilized by experienced technicians and editors. These tests involve a multi-stage validation process. Our complex rating system is based on hundreds of well-founded measurements and benchmarks, which maintains objectivity.
Price comparison

