

Lenovo Yoga Pro 9 16IMH9 recension av bärbar dator: 75 W GeForce RTX 4050 överpresterar

Yoga Pro 9-serien är hem till Lenovos flaggskeppssortiment av bärbara multimediadatorer över det övre mellanklassområdet Yoga 7 16-serien och det lägre prissegmentet IdeaPad Pro 5 16-serien. Vi gick nyligen imponerade av den mest avancerade Yoga Pro 9-konfigurationen utrustad med mini-LED och GeForce RTX 4070-grafik. Den här gången kollar vi in en billigare SKU med standard IPS och GeForce RTX 4050-grafik istället.
Vår konfiguration i recensionen kan hittas online för cirka $1700. Alternativen inkluderar andra 16-tums multimedia- eller studiocentrerade bärbara datorer som MSI Stealth 16,HP Envy x360 2-i-1 16, Dell XPS 16 9640eller Samsung Galaxy Book4 Ultra.
Fler Lenovo recensioner:
Potentiella konkurrenter i jämförelse
Gradering | Datum | Modell | Vikt | Höjd | Storlek | Upplösning | Pris |
|---|---|---|---|---|---|---|---|
| 91.7 % v7 (old) | 06/2024 | Lenovo Yoga Pro 9 16IMH9 RTX 4050 Ultra 9 185H, NVIDIA GeForce RTX 4050 Laptop GPU | 2.1 kg | 18.3 mm | 16.00" | 3200x2000 | |
| 88.7 % v7 (old) | 04/2024 | Lenovo Yoga Pro 9 16IMH9 Ultra 9 185H, NVIDIA GeForce RTX 4070 Laptop GPU | 2.1 kg | 18.3 mm | 16.00" | 3200x2000 | |
| 87.2 % v7 (old) | 05/2024 | HP Envy x360 2-in-1 16-ad0097nr R7 8840HS, Radeon 780M | 1.8 kg | 18.3 mm | 16.00" | 2880x1800 | |
| 88.6 % v7 (old) | 04/2024 | Dell XPS 16 9640 Ultra 7 155H, NVIDIA GeForce RTX 4070 Laptop GPU | 2.3 kg | 18.7 mm | 16.30" | 3840x2400 | |
| 90.4 % v7 (old) | 03/2024 | Samsung Galaxy Book4 Ultra Ultra 7 155H, NVIDIA GeForce RTX 4050 Laptop GPU | 1.8 kg | 17 mm | 16.00" | 2880x1800 | |
| 87.6 % v7 (old) | 11/2023 | Asus VivoBook Pro 16 K6602VU i9-13900H, NVIDIA GeForce RTX 4050 Laptop GPU | 1.9 kg | 19 mm | 16.00" | 3200x2000 |
Fallet


Anslutningsmöjligheter


SD-kortläsare
| SD Card Reader | |
| average JPG Copy Test (av. of 3 runs) | |
| Asus VivoBook Pro 16 K6602VU (Angelbird AV Pro V60) | |
| Dell XPS 16 9640 (Angelbird AV Pro V60) | |
| Lenovo Yoga Pro 9 16IMH9 RTX 4050 (Angelbird AV Pro V60) | |
| Samsung Galaxy Book4 Ultra (Angelbird AV Pro V60) | |
| Lenovo Yoga Pro 9 16IMH9 (Angelbird AV Pro V60) | |
| maximum AS SSD Seq Read Test (1GB) | |
| Asus VivoBook Pro 16 K6602VU (Angelbird AV Pro V60) | |
| Dell XPS 16 9640 (Angelbird AV Pro V60) | |
| Lenovo Yoga Pro 9 16IMH9 RTX 4050 (Angelbird AV Pro V60) | |
| Lenovo Yoga Pro 9 16IMH9 (Angelbird AV Pro V60) | |
| Samsung Galaxy Book4 Ultra (Angelbird AV Pro V60) | |
Kommunikation
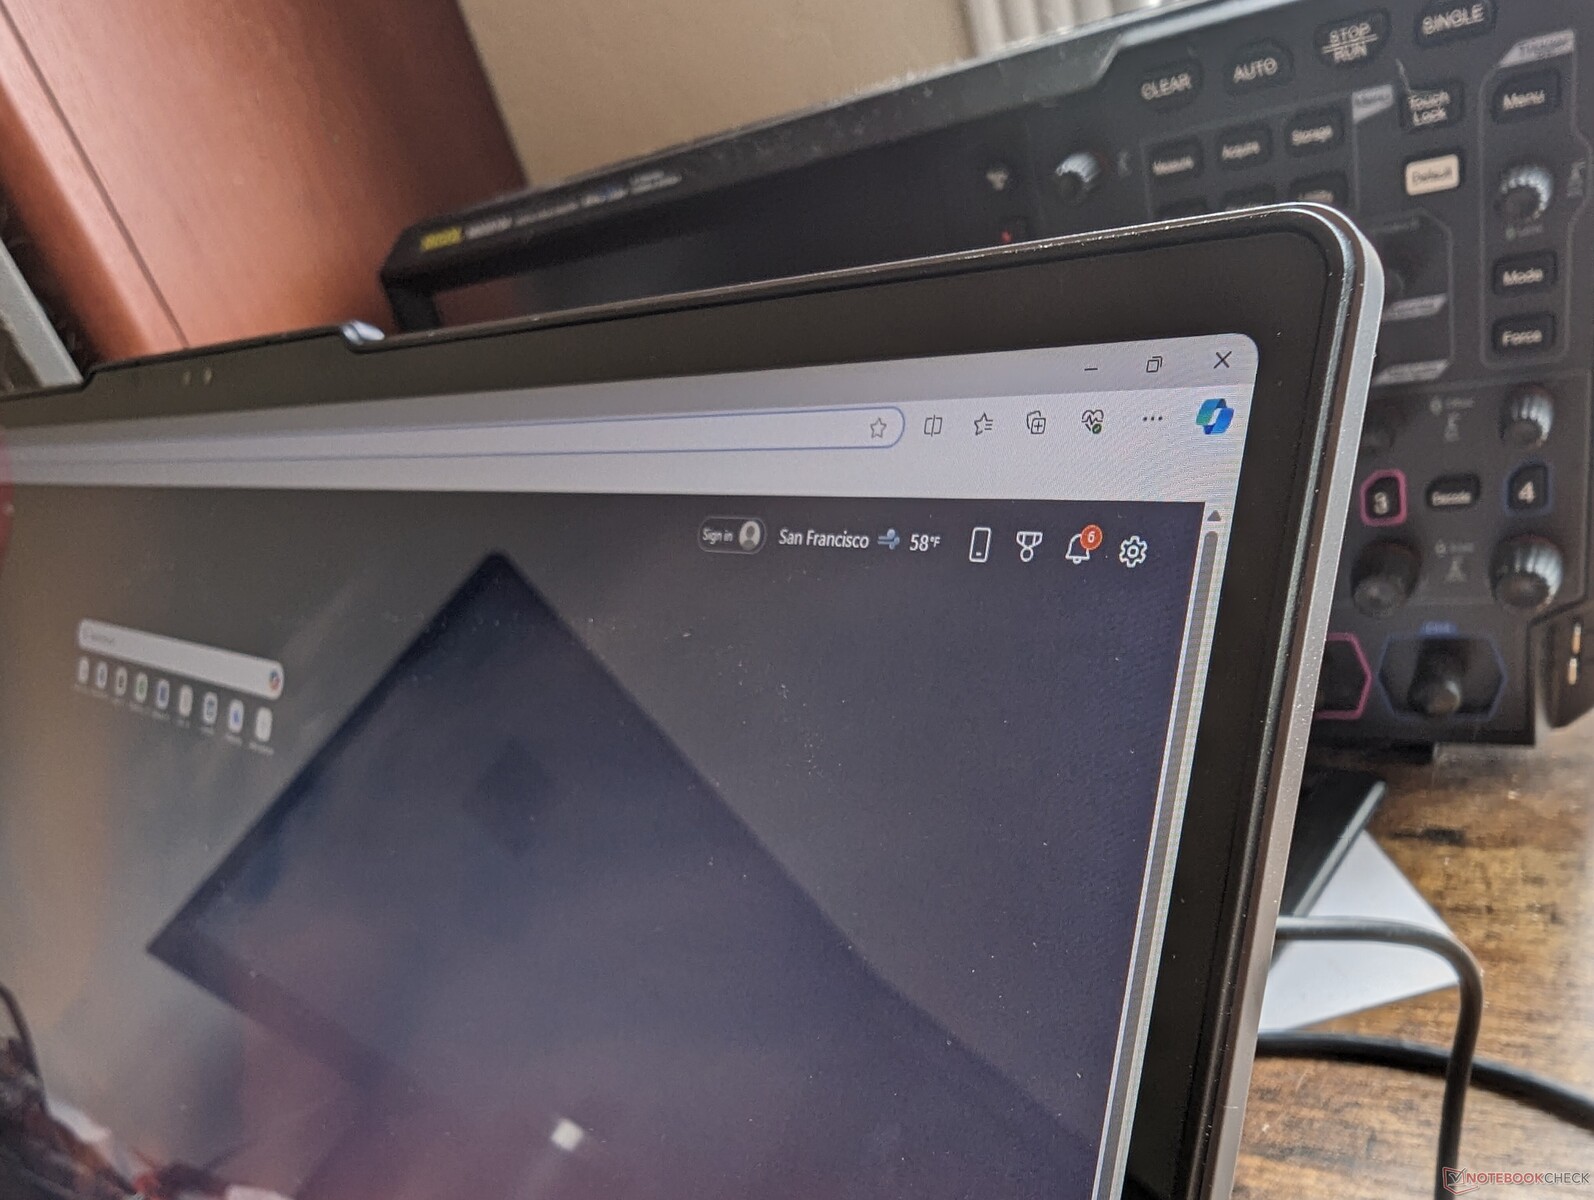
Webbkamera


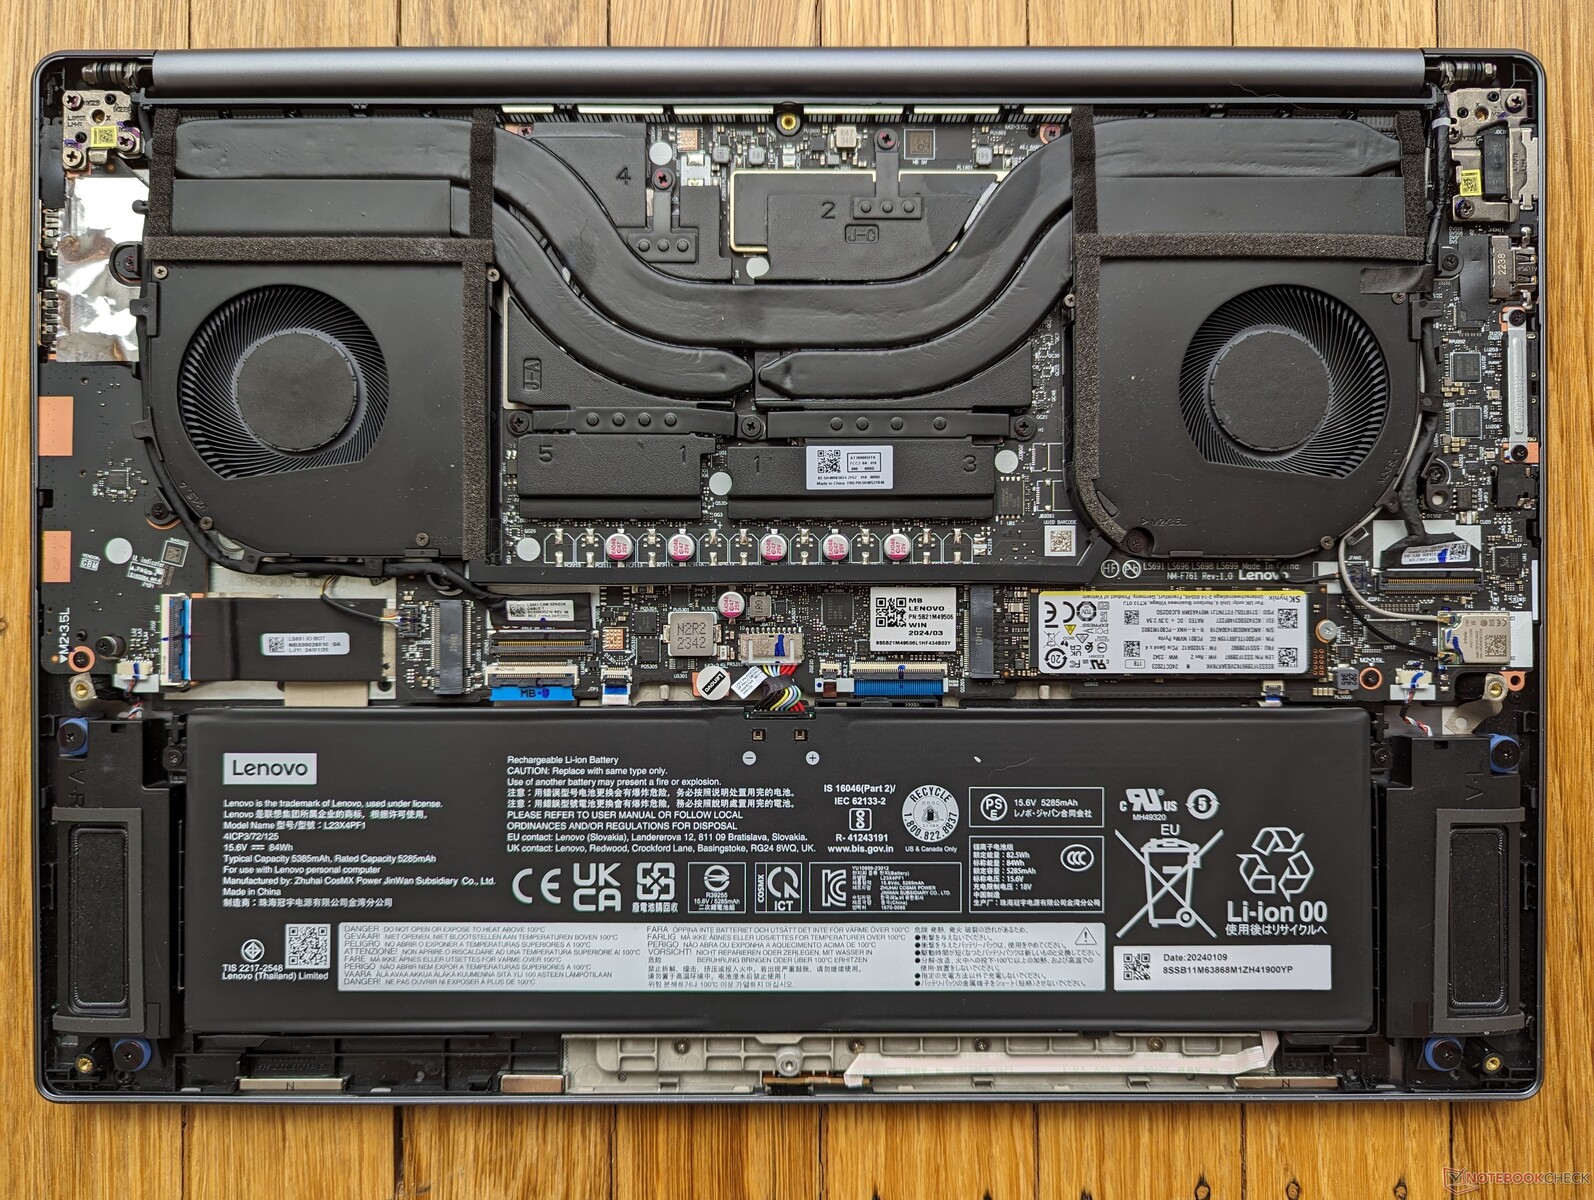
Underhåll

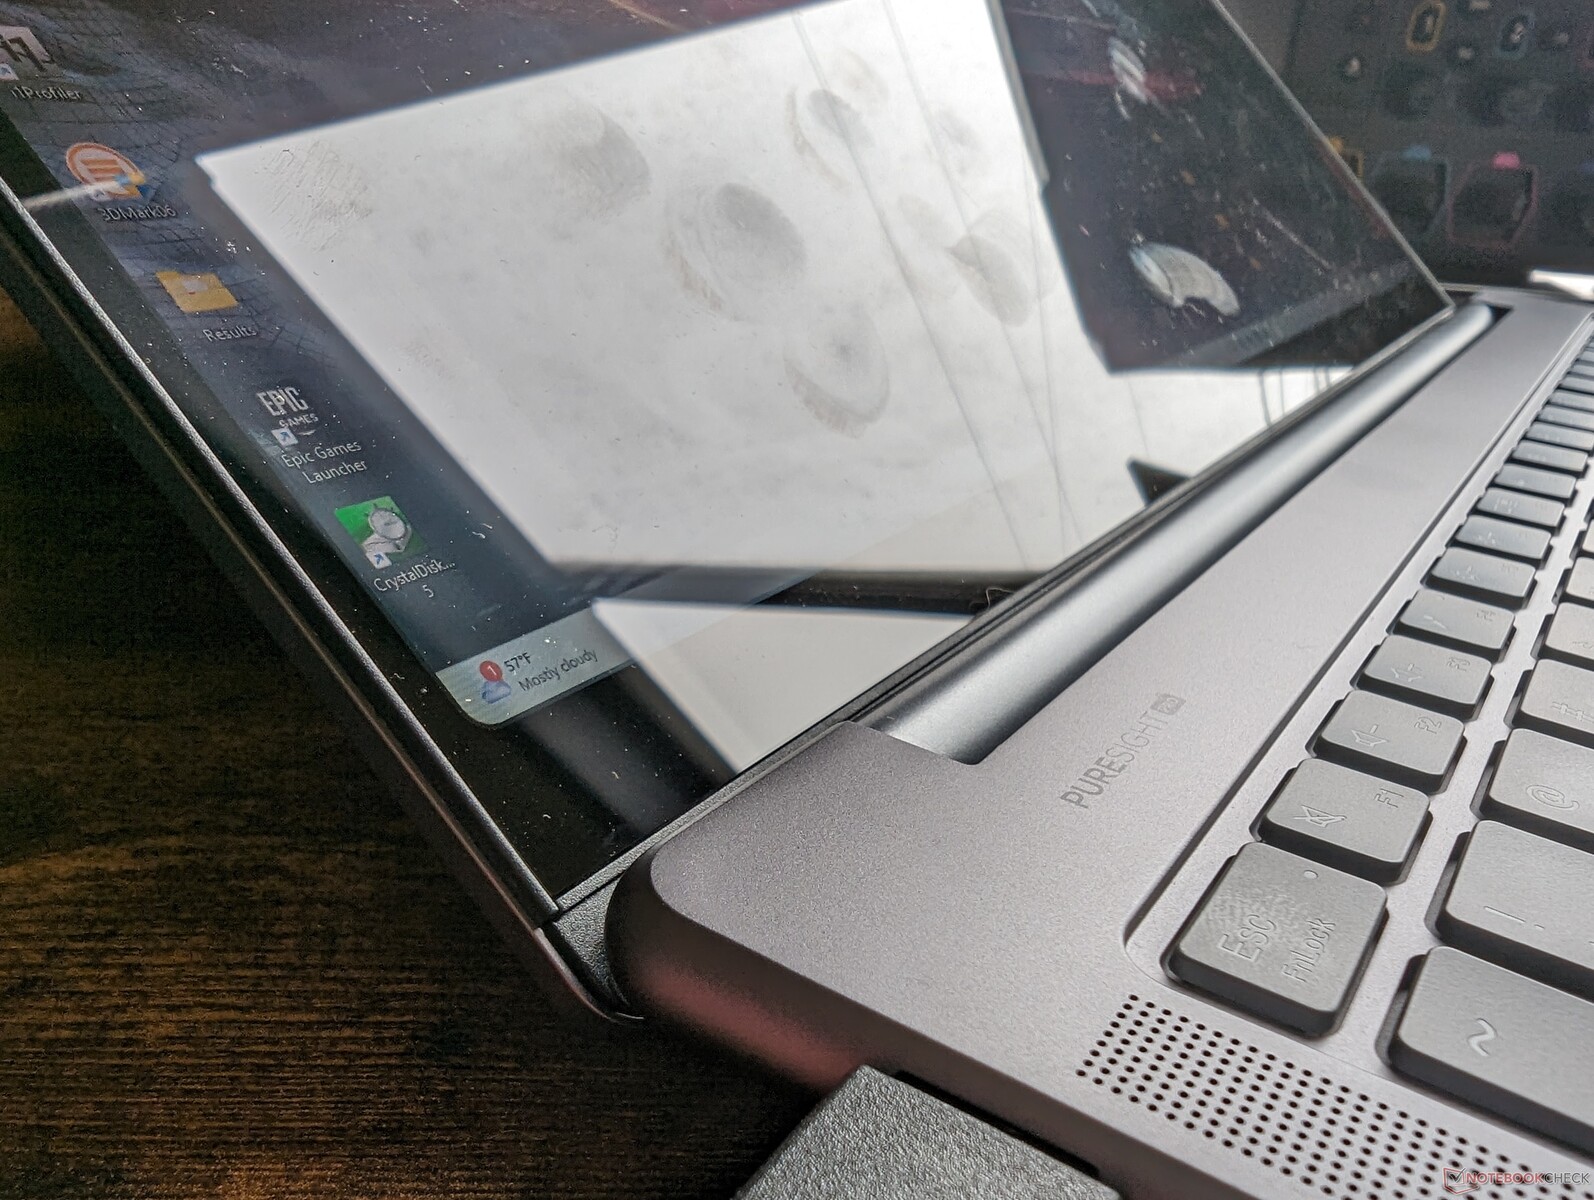
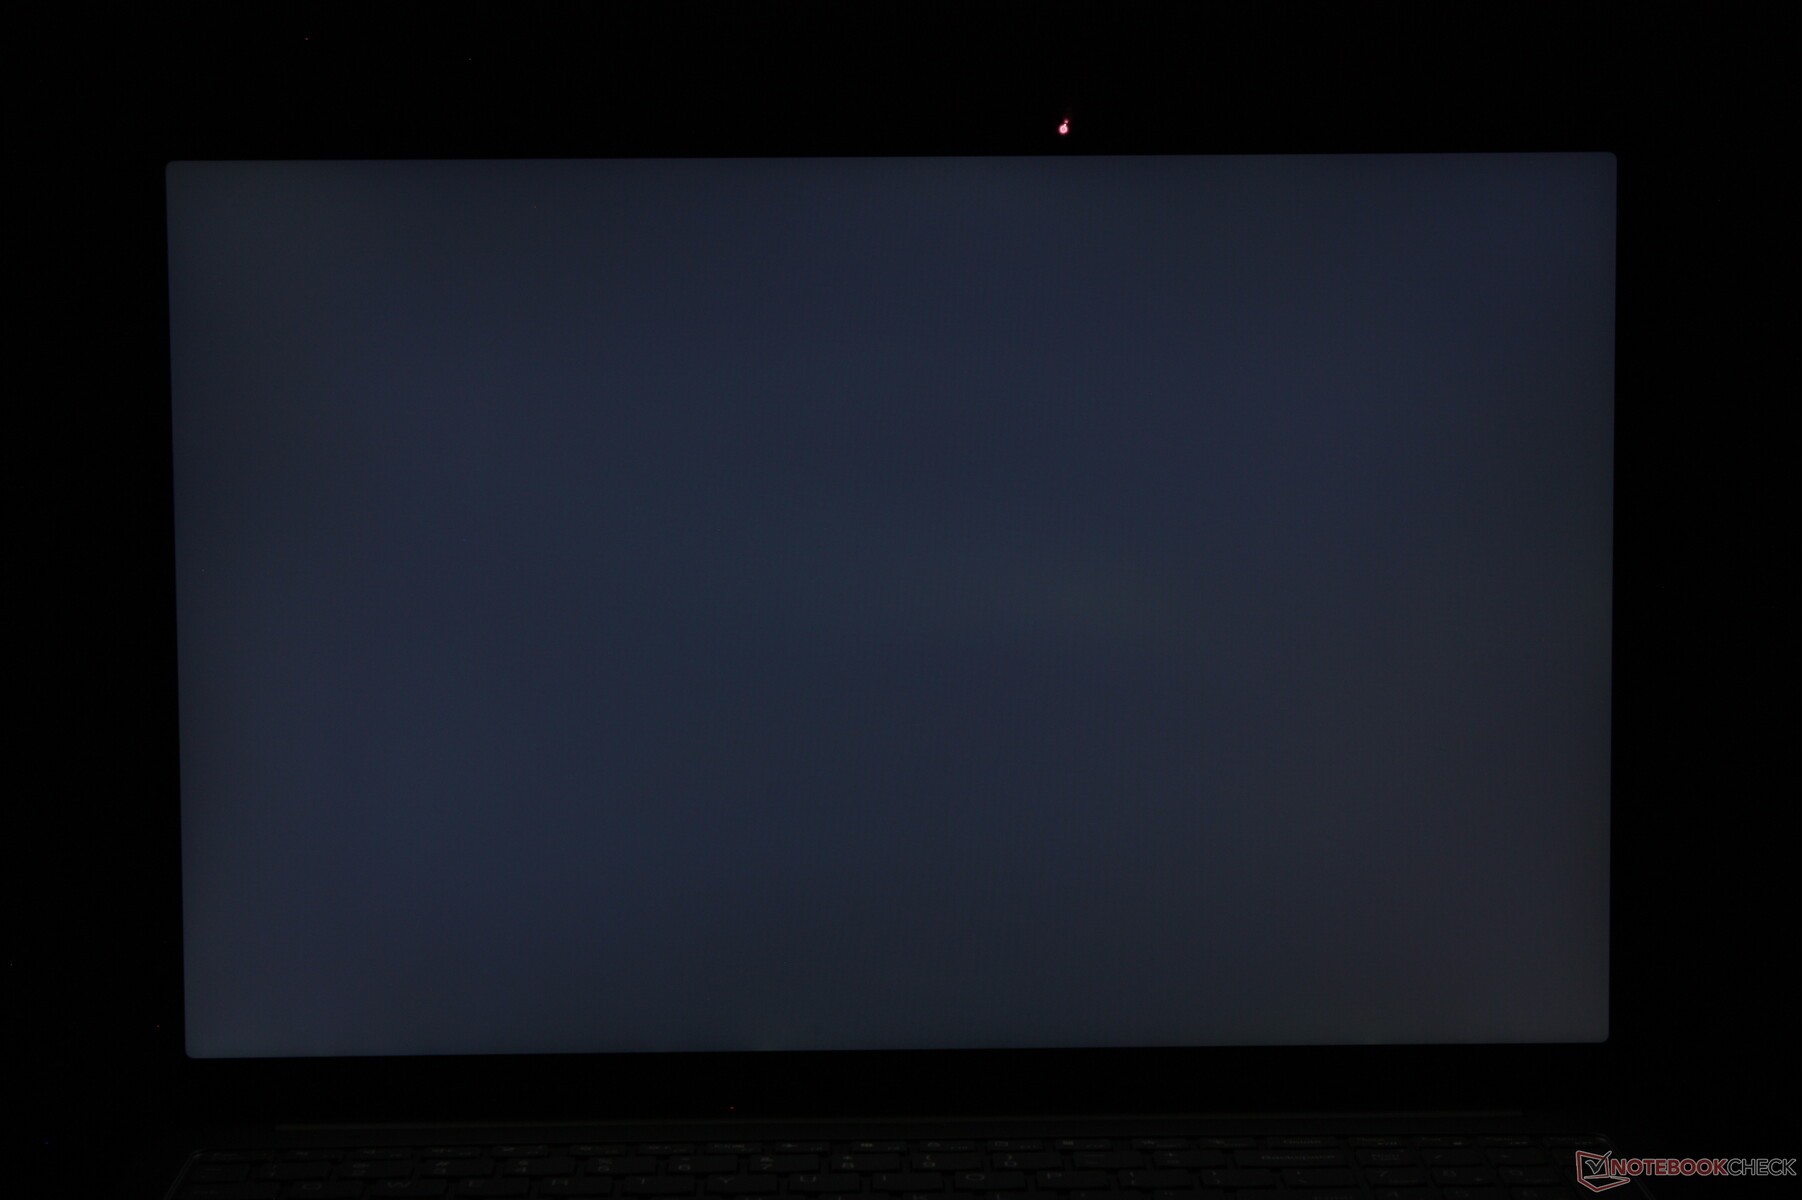
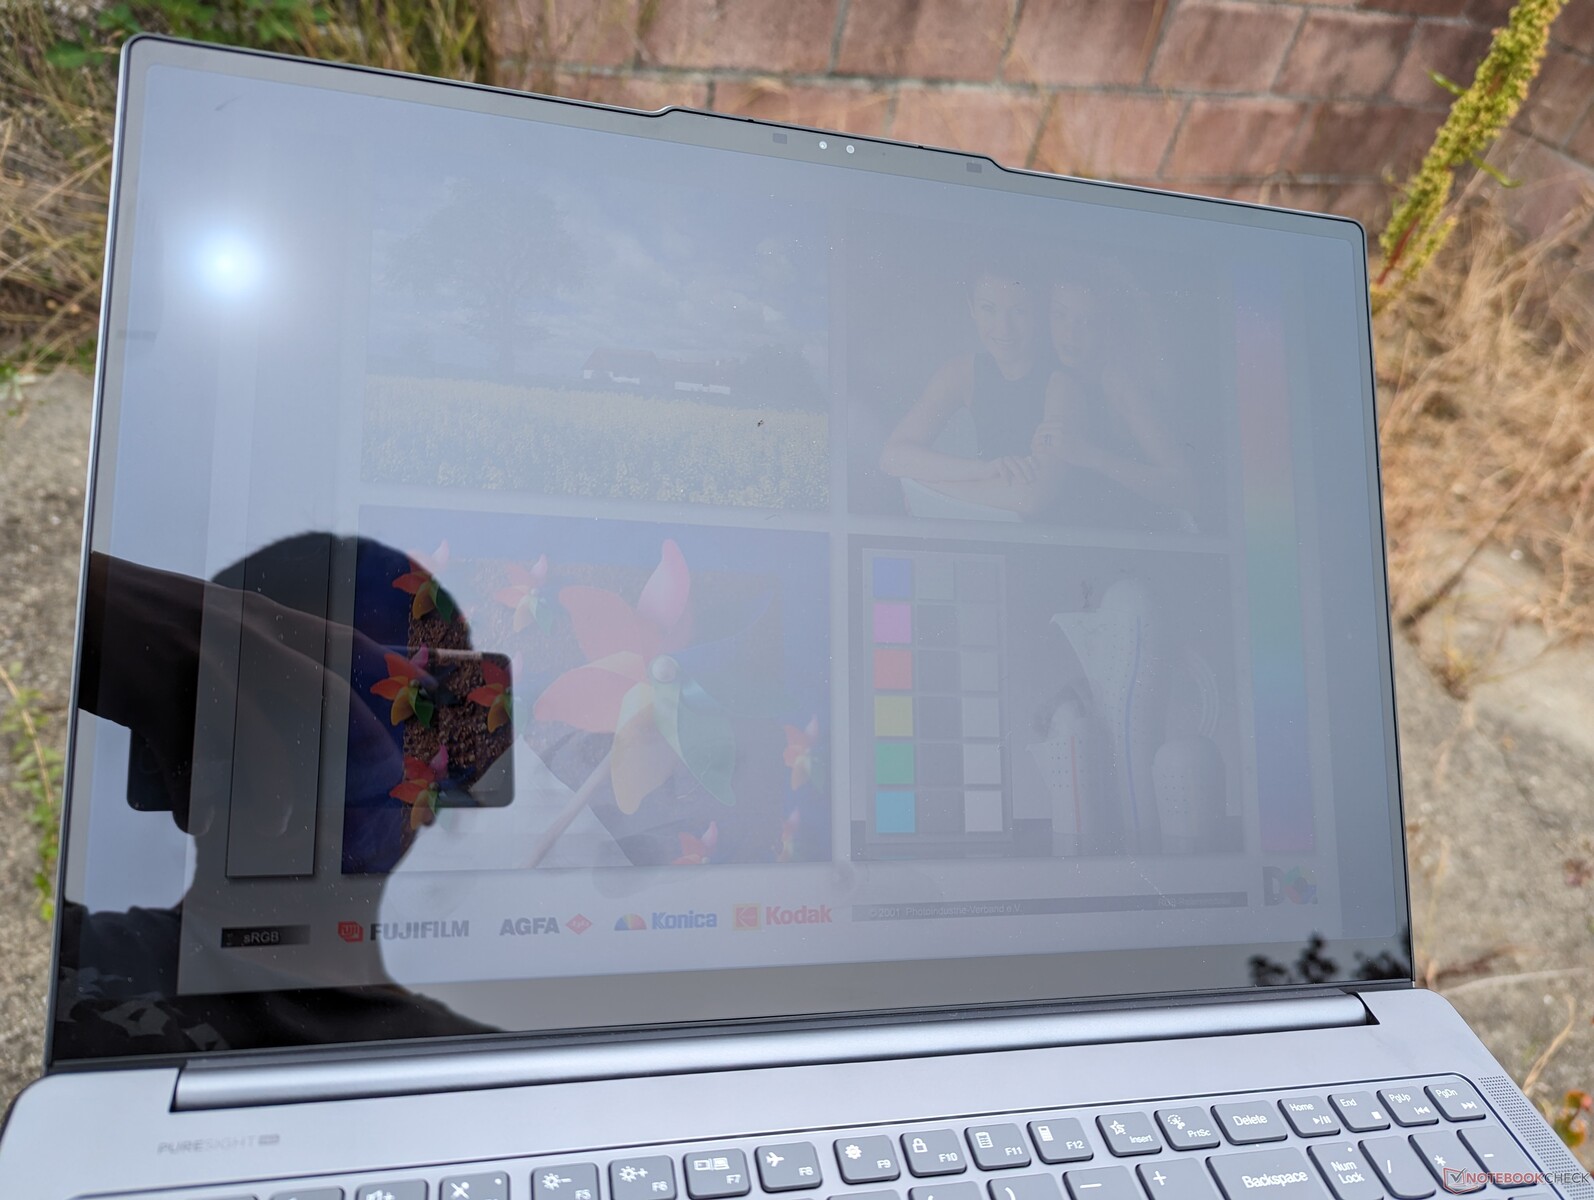
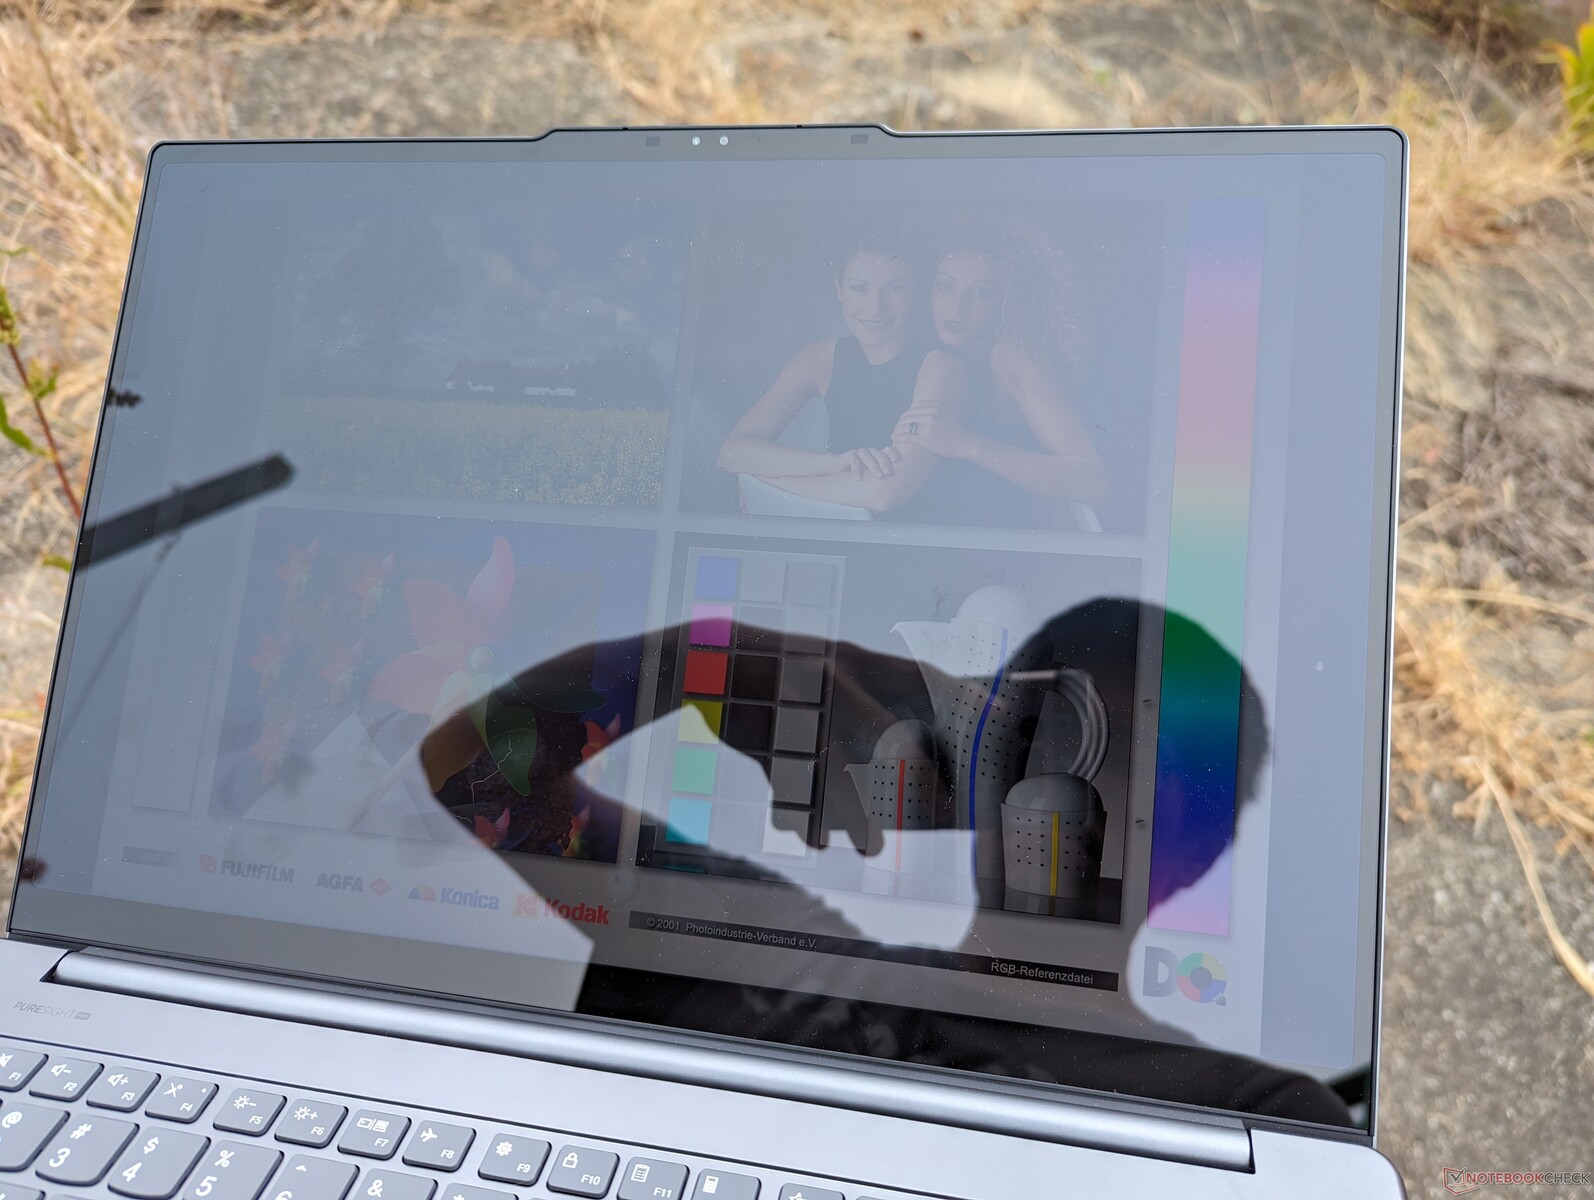
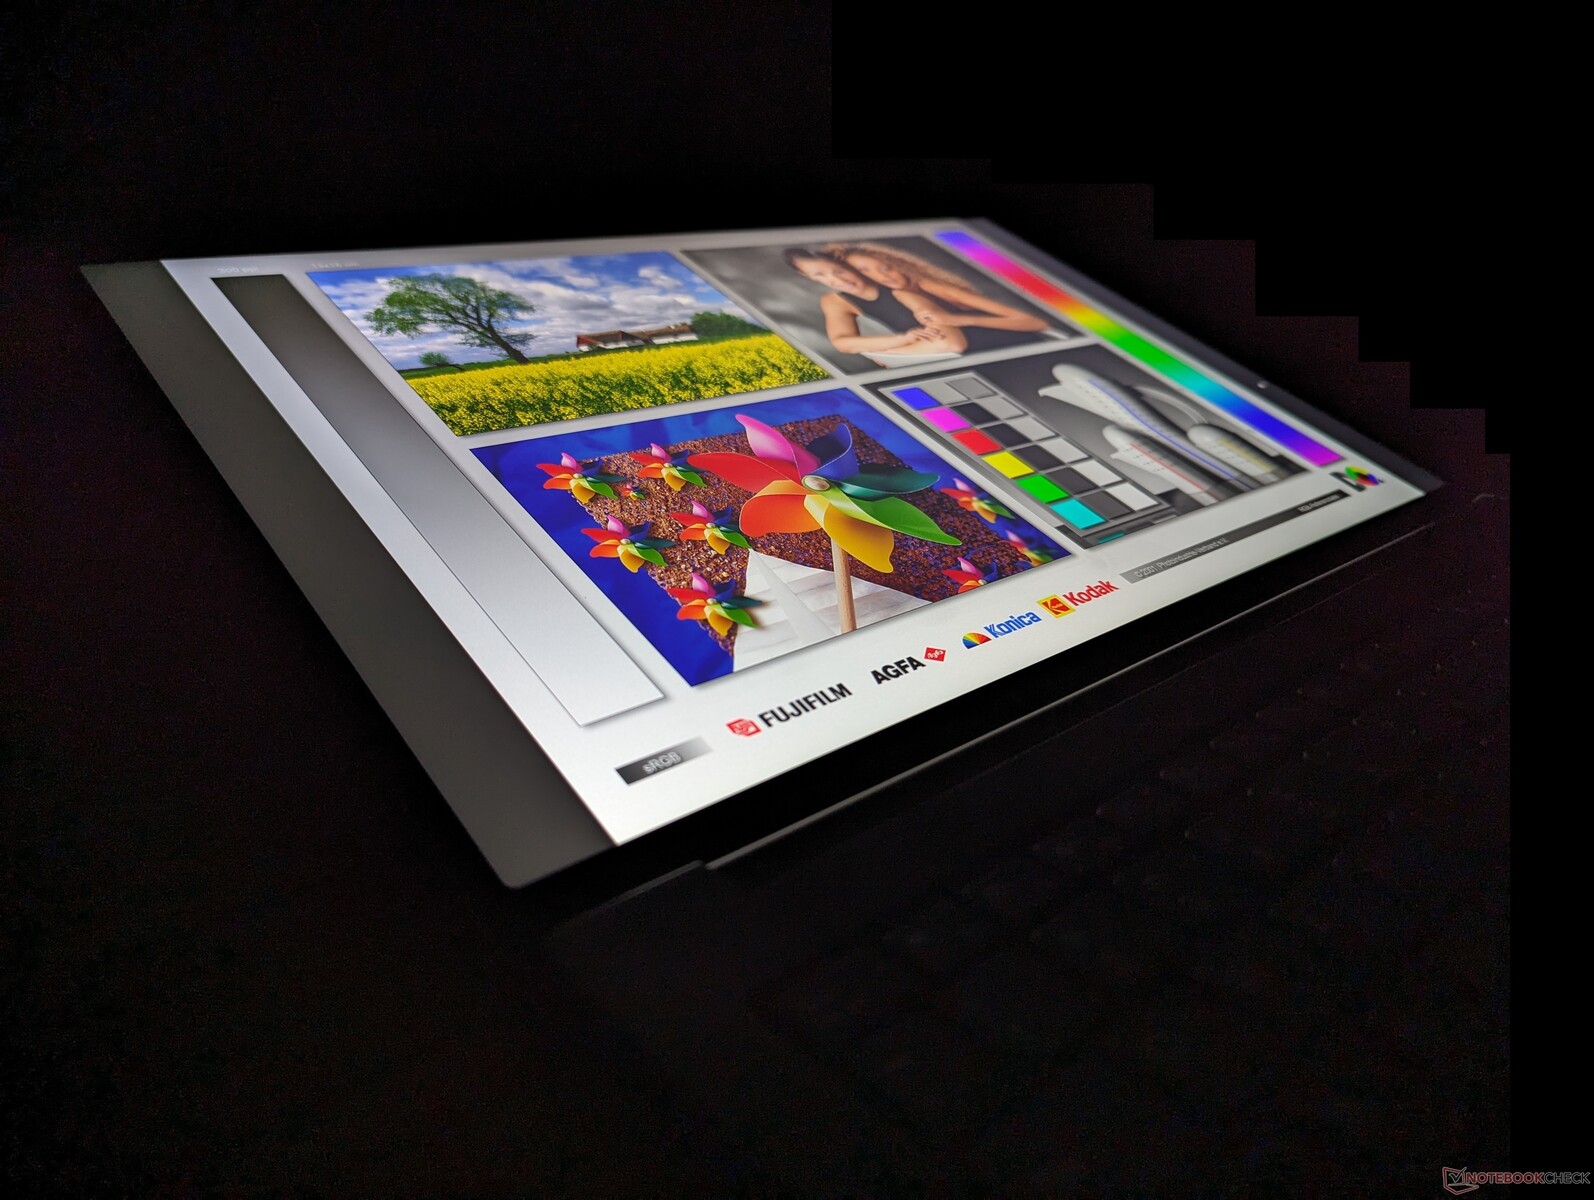
Skärm - 3,2K IPS och Mini-LED-alternativ
Lenovo erbjuder tre skärmalternativ enligt följande. Alla paneler har samma inbyggda upplösning på 3200 x 2000 och uppdateringsfrekvens med Advanced Optimus-stöd men ingen G-Sync. Vår testenhet har det fetmarkerade alternativet nedan medan den avancerade RTX 4070-konfigurationen har mini-LED-alternativet.
- 3.2K, 165 Hz, IPS, 400 nits, 100% P3, matt, beröringsfri
- 3.2K, 165 Hz, IPS, 400 nits, 100% P3, glansig, touch
- 3.2K, 165 Hz, Mini-LED, 1200 nits, 100% P3, glansig, touch
Den visuella upplevelsen mellan IPS- och mini-LED-alternativen är förvånansvärt likartad eftersom deras färgomfång och uppdateringsfrekvenser är i stort sett desamma. IPS har dock både snabbare svartvita svarstider och inga större problem med haloeffekt jämfört med mini-LED. Deras skillnader förstärks istället när man kör HDR-aktiverat innehåll och det är där mini-LED verkligen lyser med sina överlägsna kontrast- och ljusstyrkenivåer. Användare som tittar på eller spelar mycket HDR-media kanske därför föredrar mini-LED medan de som vill spara pengar eller inte har något emot att avstå från HDR kan få en mer traditionell upplevelse med IPS.

| |||||||||||||||||||||||||
Distribution av ljusstyrkan: 91 %
Mitt på batteriet: 404.9 cd/m²
Kontrast: 1012:1 (Svärta: 0.4 cd/m²)
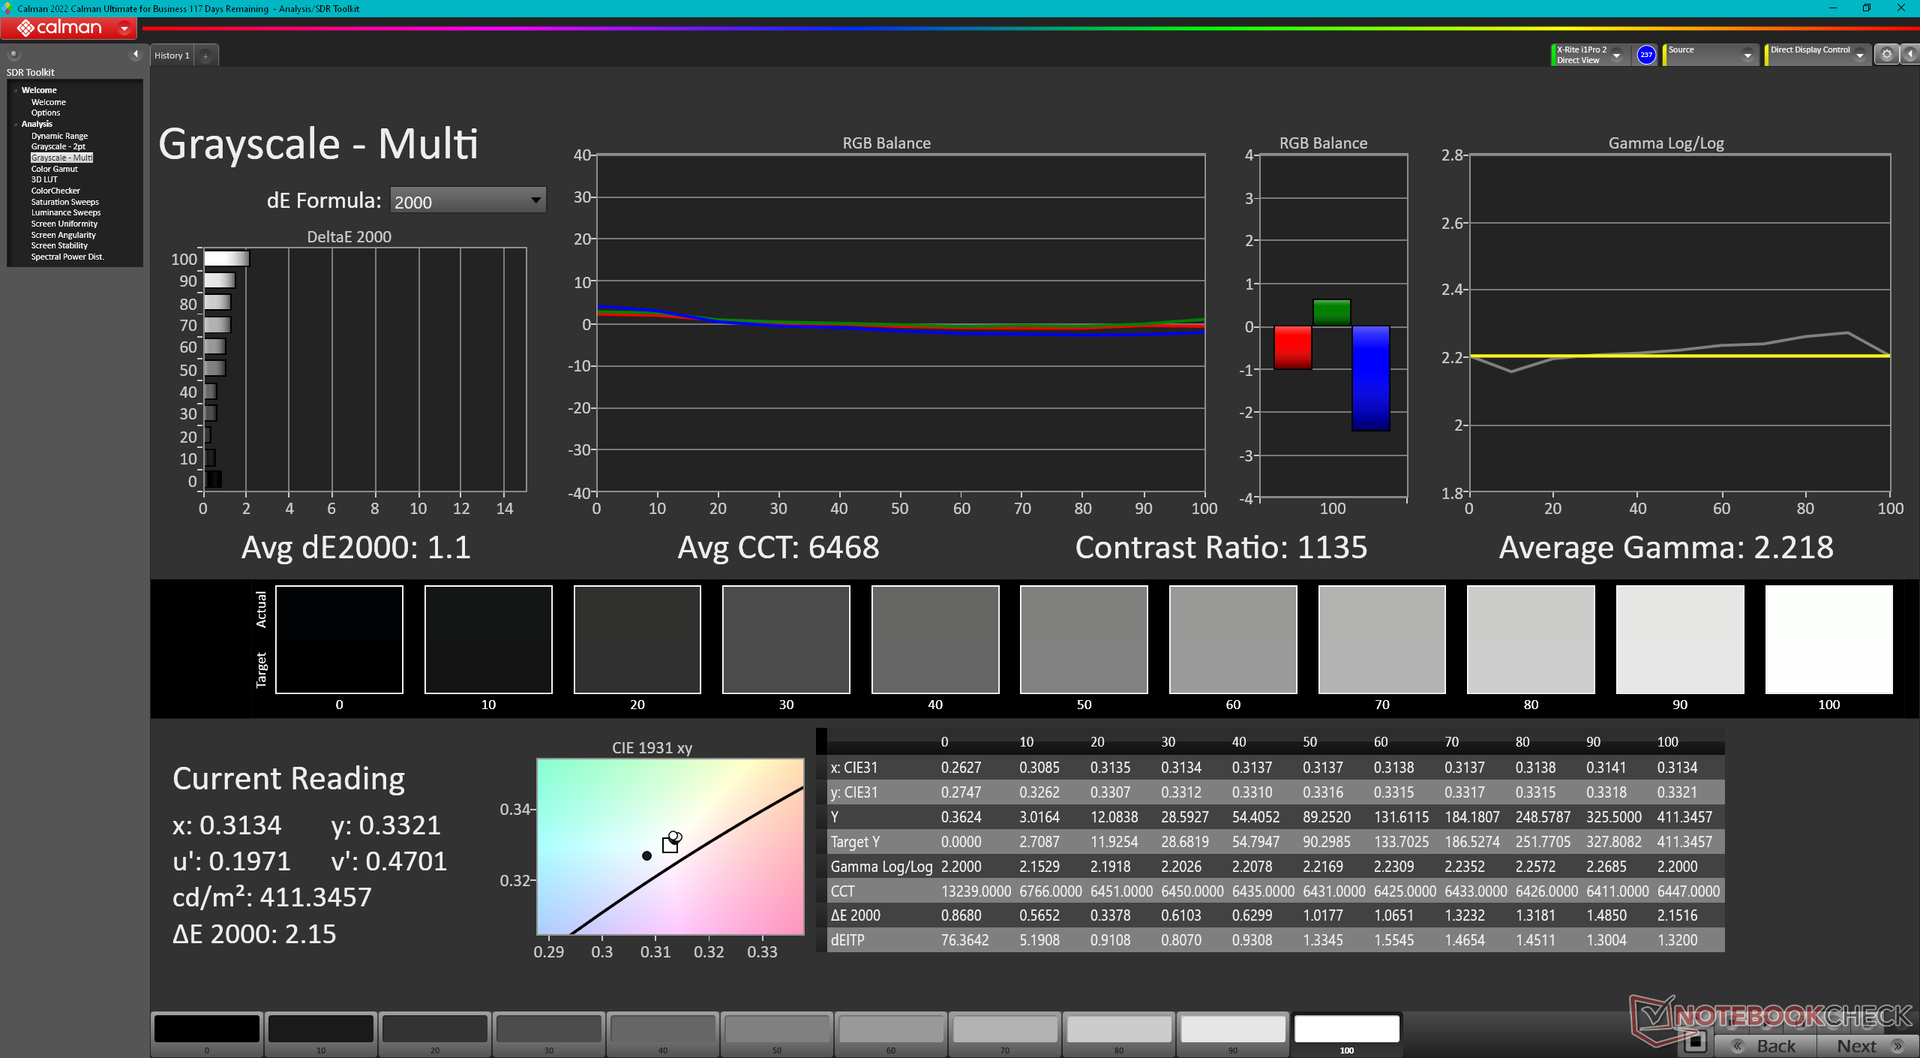
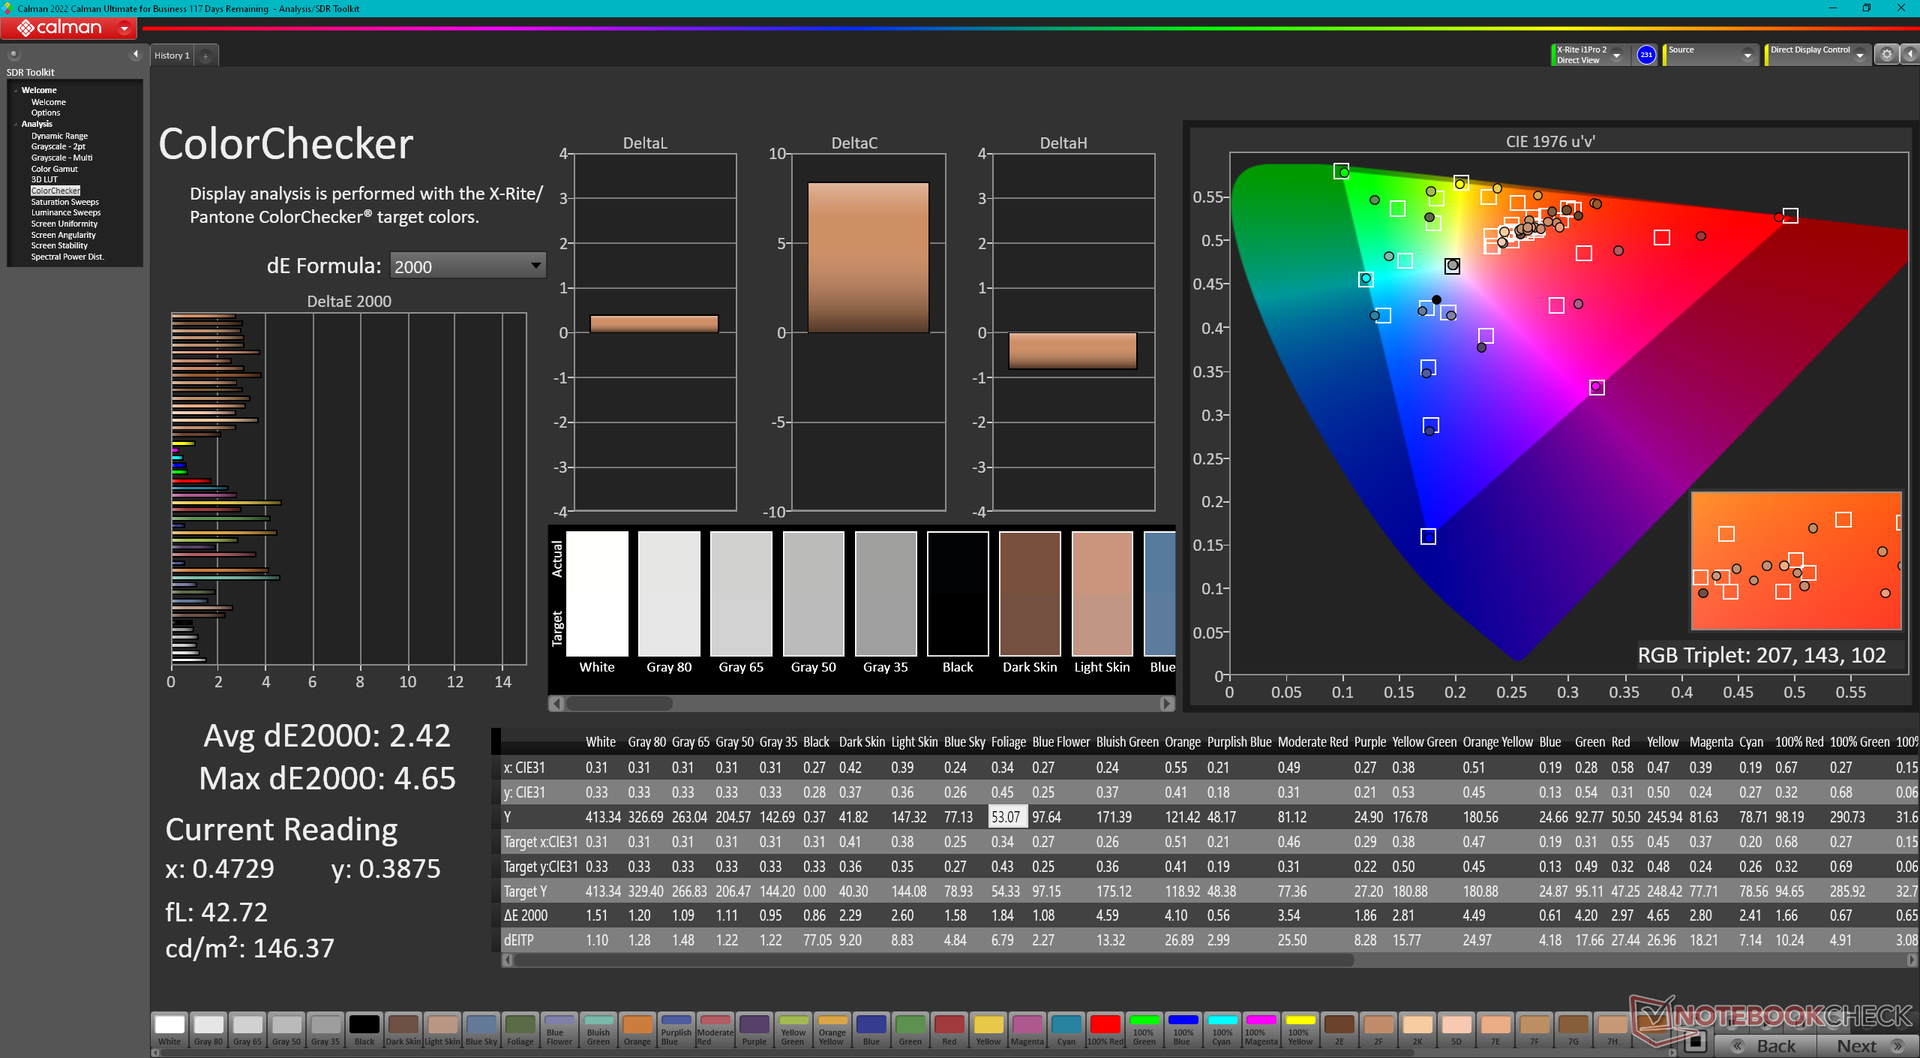
ΔE Color 2.42 | 0.5-29.43 Ø4.87, calibrated: 0.93
ΔE Greyscale 1.1 | 0.5-98 Ø5.1
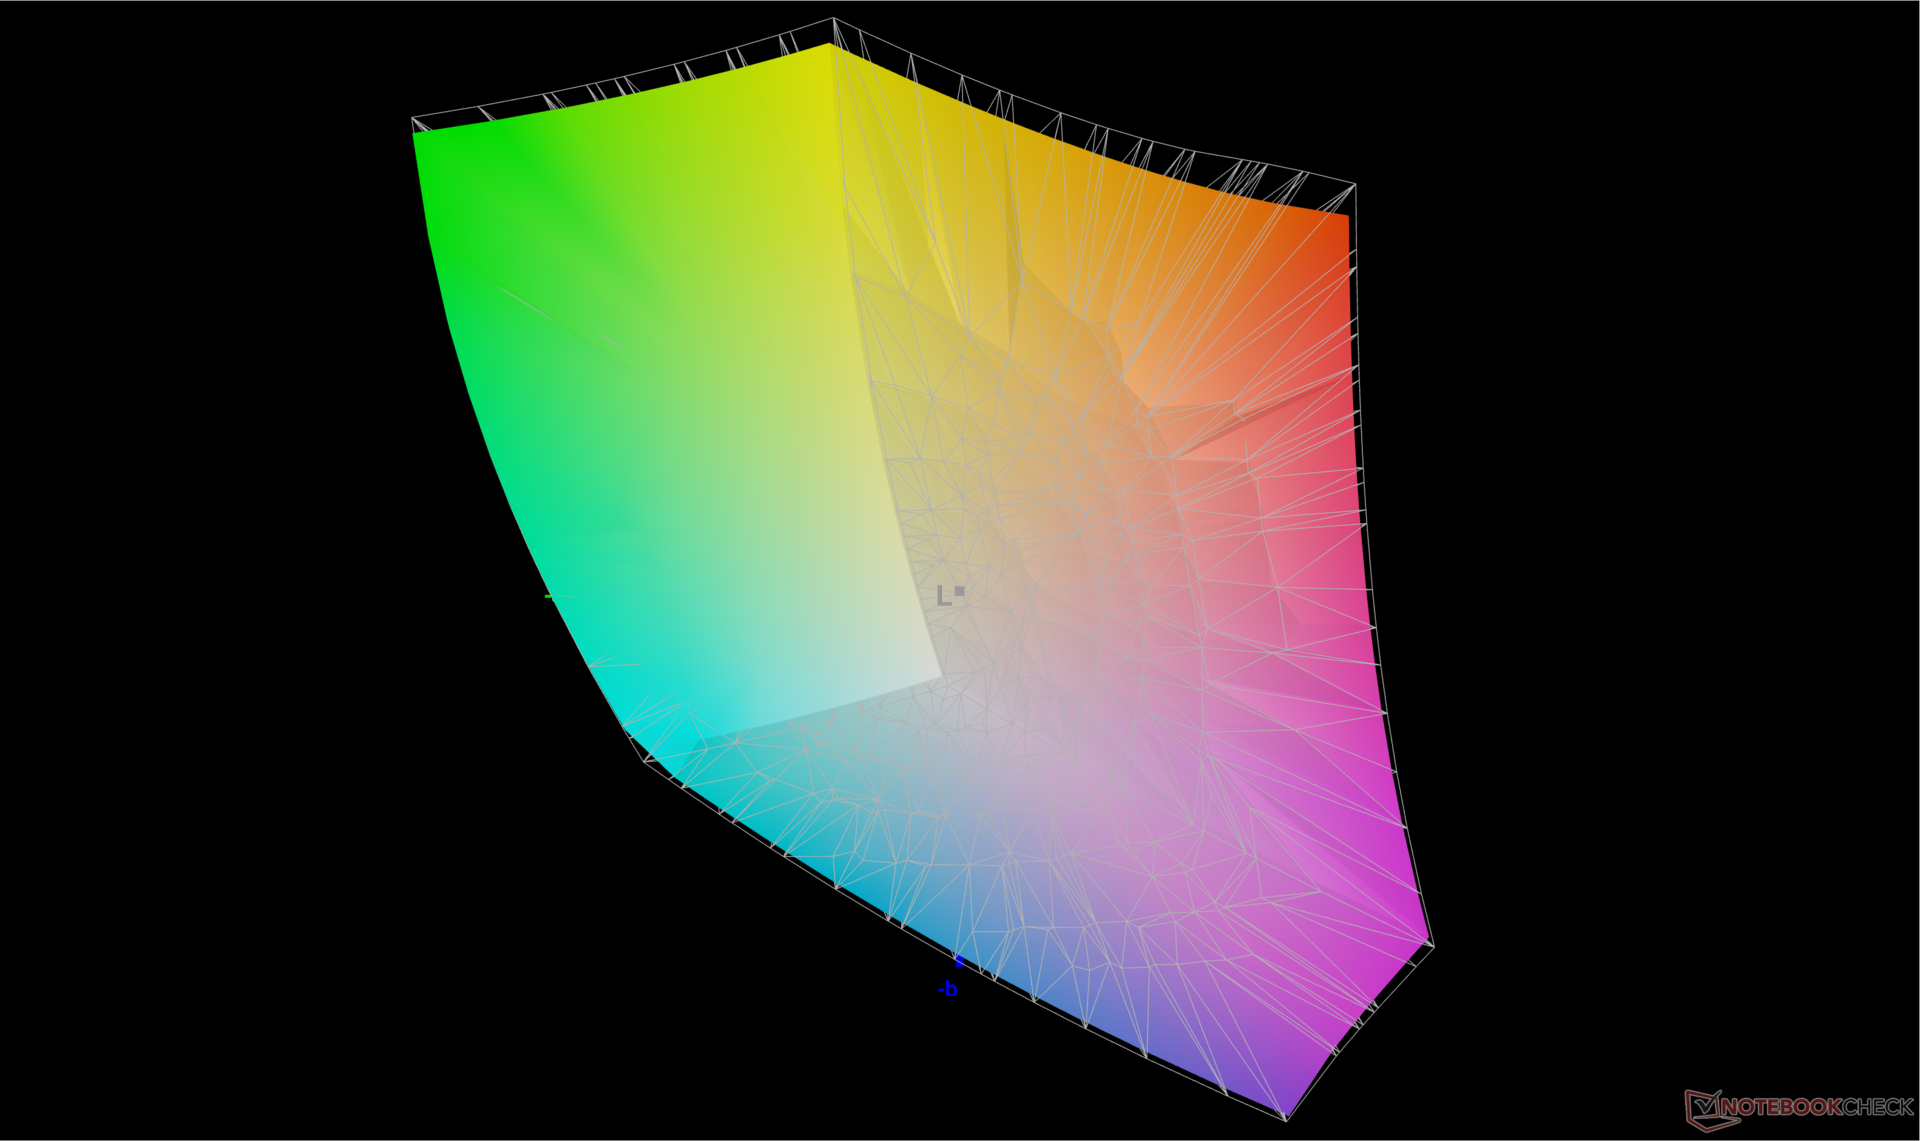
86.5% AdobeRGB 1998 (Argyll 2.2.0 3D)
99.9% sRGB (Argyll 2.2.0 3D)
95.6% Display P3 (Argyll 2.2.0 3D)
Gamma: 2.22
| Lenovo Yoga Pro 9 16IMH9 RTX 4050 LEN160-3.2K, IPS, 3200x2000, 16" | Lenovo Yoga Pro 9 16IMH9 LEN160-3.2K, Mini-LED, 3200x2000, 16" | HP Envy x360 2-in-1 16-ad0097nr Samsung SDC41A6, OLED, 2880x1800, 16" | Dell XPS 16 9640 SDC4196, OLED, 3840x2400, 16.3" | Samsung Galaxy Book4 Ultra ATNA60CL07-0, OLED, 2880x1800, 16" | Asus VivoBook Pro 16 K6602VU Samsung ATNA60BX01-1, OLED, 3200x2000, 16" | |
|---|---|---|---|---|---|---|
| Display | 0% | 5% | 2% | 2% | 5% | |
| Display P3 Coverage | 95.6 | 97 1% | 99.6 4% | 98.3 3% | 98.6 3% | 98.7 3% |
| sRGB Coverage | 99.9 | 99.9 0% | 100 0% | 100 0% | 99.9 0% | 99.7 0% |
| AdobeRGB 1998 Coverage | 86.5 | 86.6 0% | 96.5 12% | 87.8 2% | 88.5 2% | 96.5 12% |
| Response Times | -85% | 92% | 92% | 94% | 24% | |
| Response Time Grey 50% / Grey 80% * | 12.4 ? | 22.2 ? -79% | 0.8 ? 94% | 0.82 ? 93% | 0.54 ? 96% | 0.68 ? 95% |
| Response Time Black / White * | 8.9 ? | 17 ? -91% | 0.89 ? 90% | 0.85 ? 90% | 0.69 ? 92% | 13.2 ? -48% |
| PWM Frequency | 4840 ? | 491.8 ? | 360 ? | 240 ? | 240 ? | |
| Screen | 30% | -16% | -7% | -0% | -61% | |
| Brightness middle | 404.9 | 651 61% | 399.4 -1% | 366 -10% | 390 -4% | 353 -13% |
| Brightness | 390 | 673 73% | 405 4% | 367 -6% | 393 1% | 354 -9% |
| Brightness Distribution | 91 | 93 2% | 98 8% | 96 5% | 98 8% | 98 8% |
| Black Level * | 0.4 | 0.22 45% | ||||
| Contrast | 1012 | 2959 192% | ||||
| Colorchecker dE 2000 * | 2.42 | 1.9 21% | 4.05 -67% | 1.3 46% | 1.4 42% | 4.23 -75% |
| Colorchecker dE 2000 max. * | 4.65 | 4.2 10% | 6.69 -44% | 3.6 23% | 2.7 42% | 7.13 -53% |
| Colorchecker dE 2000 calibrated * | 0.93 | 0.6 35% | 1.02 -10% | 1 -8% | 2.42 -160% | |
| Greyscale dE 2000 * | 1.1 | 3 -173% | 1.1 -0% | 2.2 -100% | 2.1 -91% | 2.5 -127% |
| Gamma | 2.22 99% | 2.18 101% | 2.27 97% | 2.14 103% | 2.27 97% | 2.4 92% |
| CCT | 6468 100% | 6738 96% | 6419 101% | 6680 97% | 6431 101% | 6642 98% |
| Totalt genomsnitt (program/inställningar) | -18% /
7% | 27% /
8% | 29% /
12% | 32% /
17% | -11% /
-31% |
* ... mindre är bättre

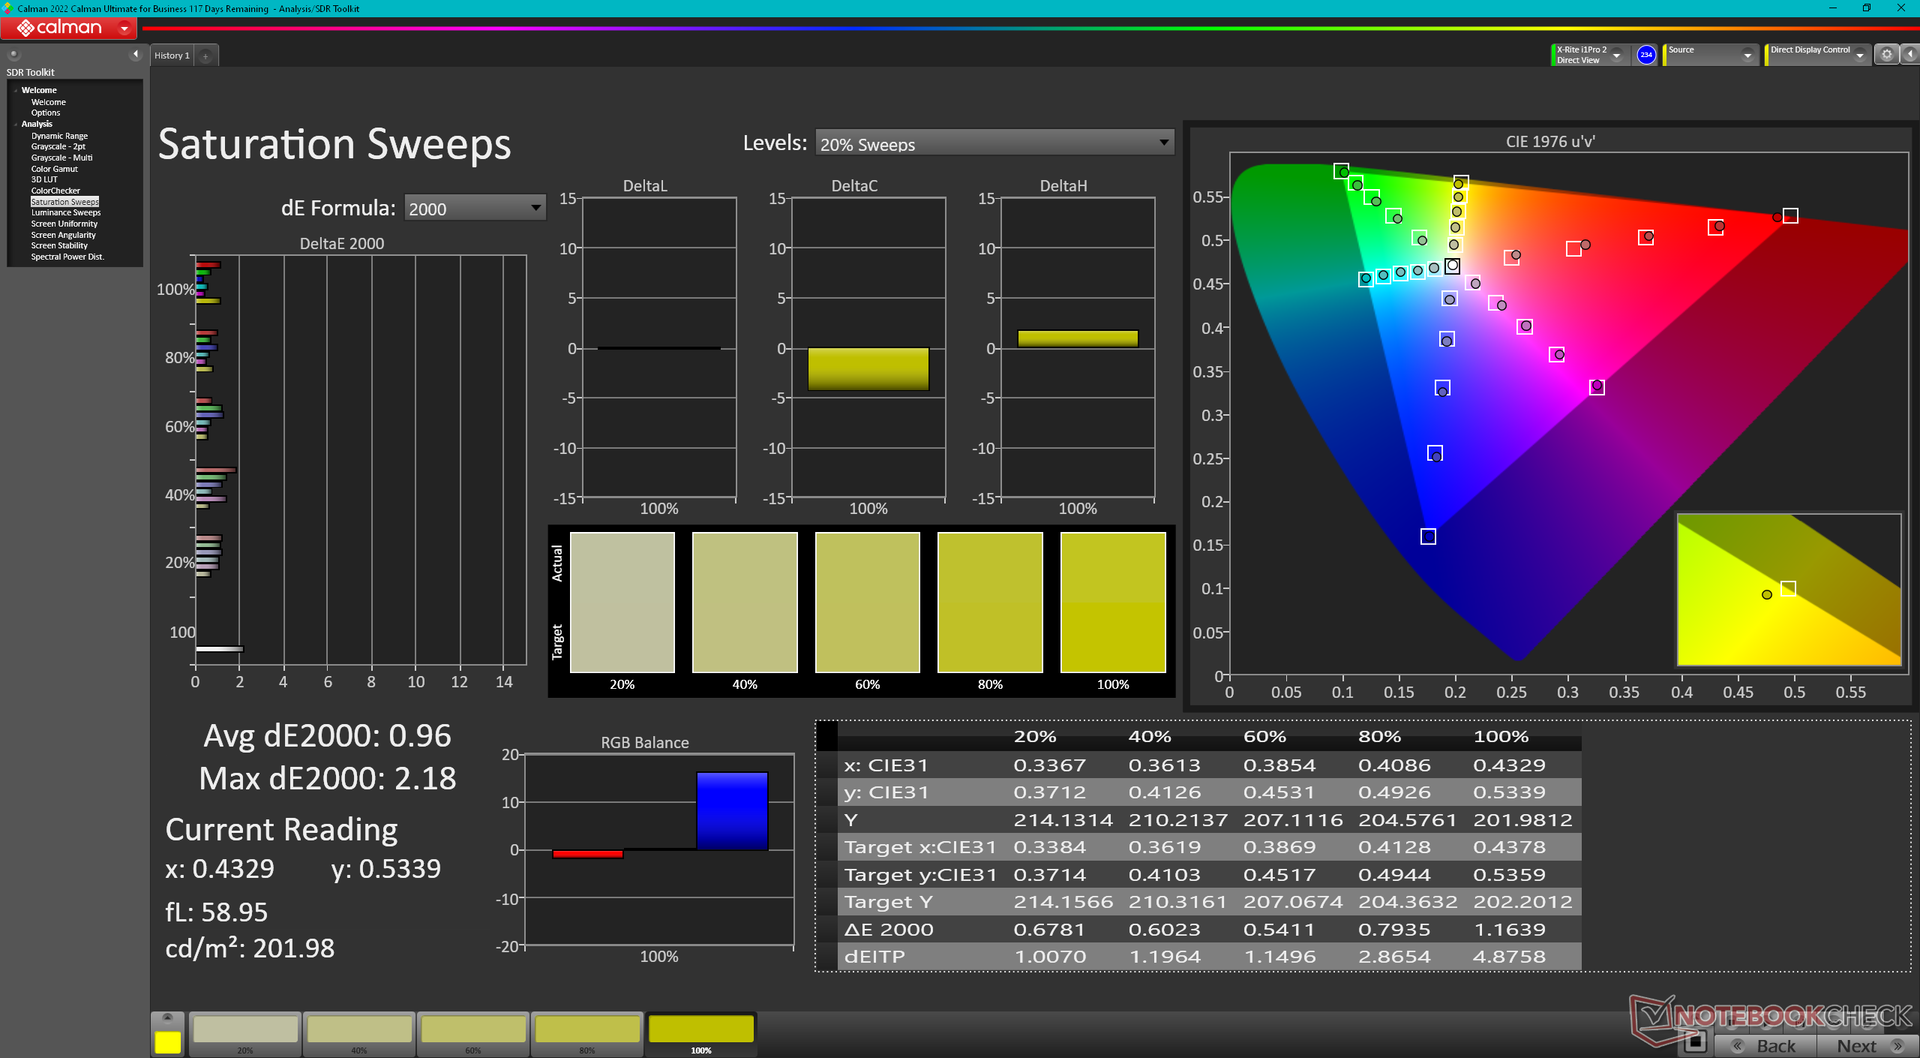
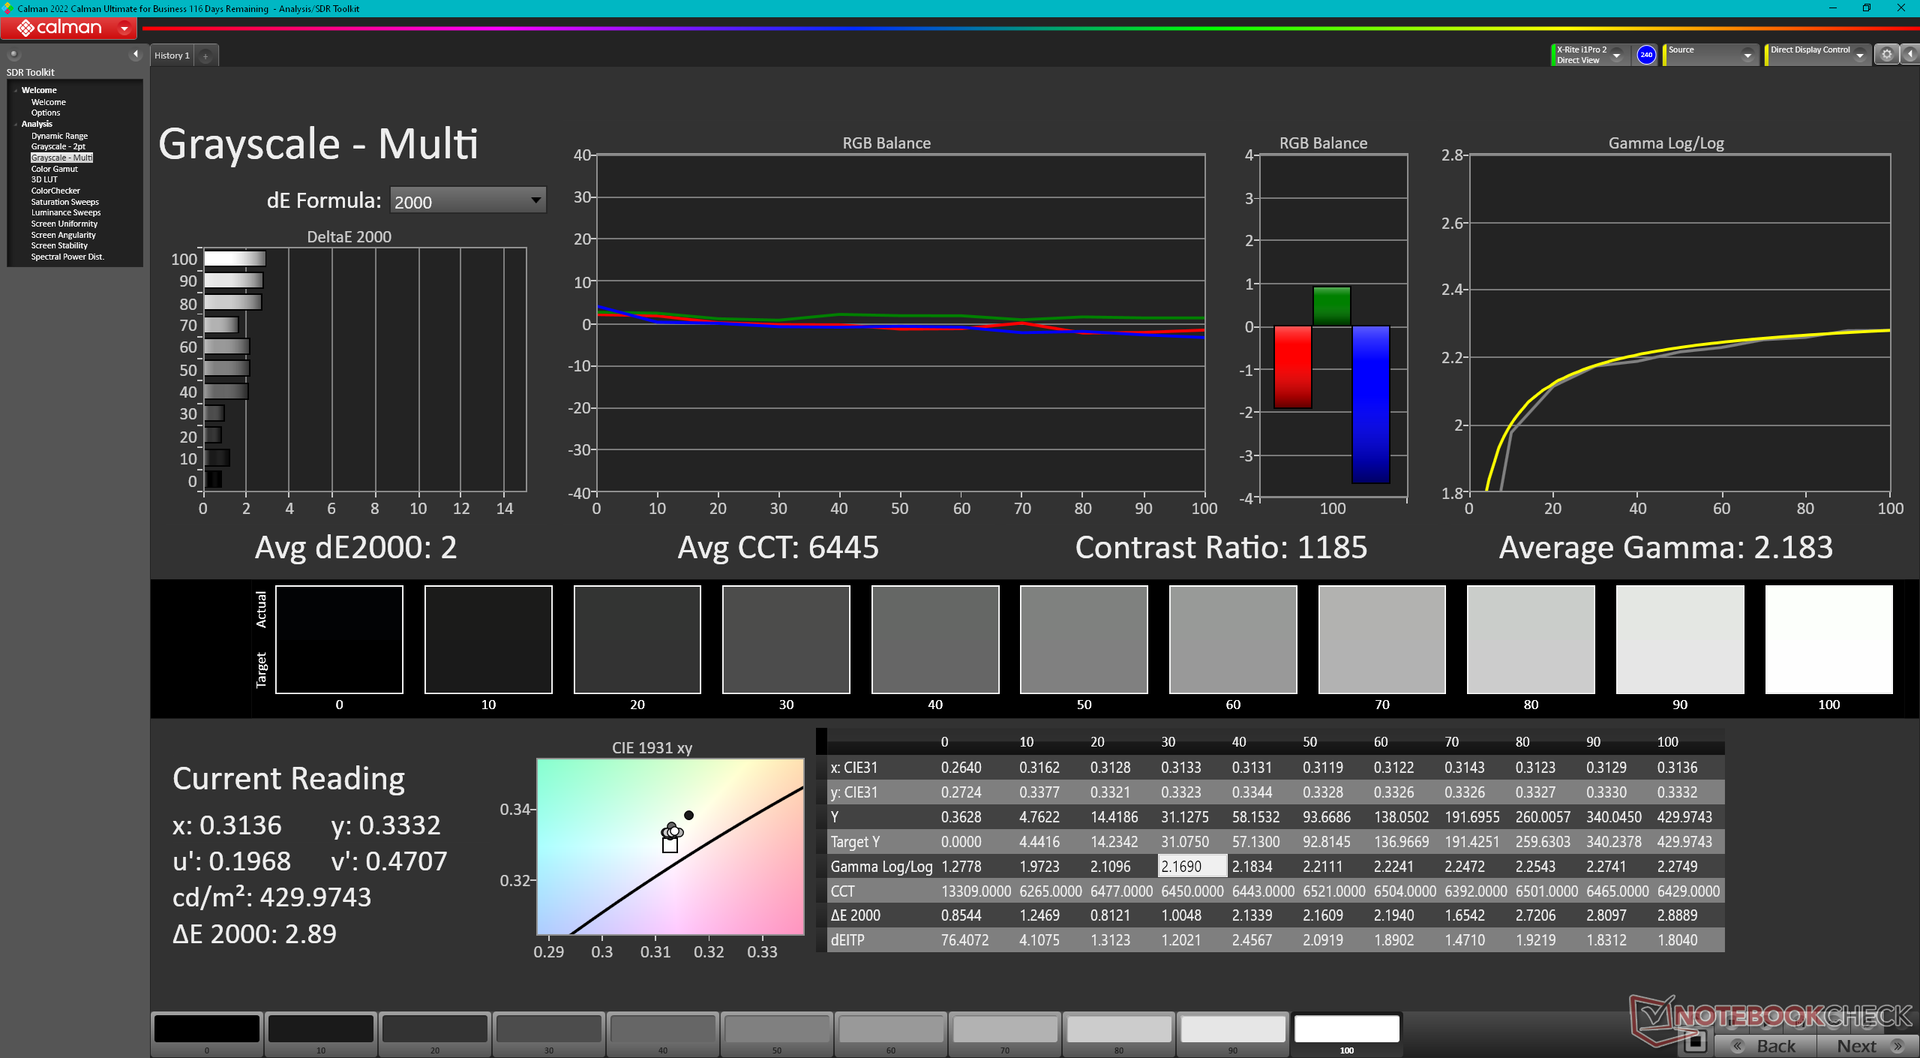
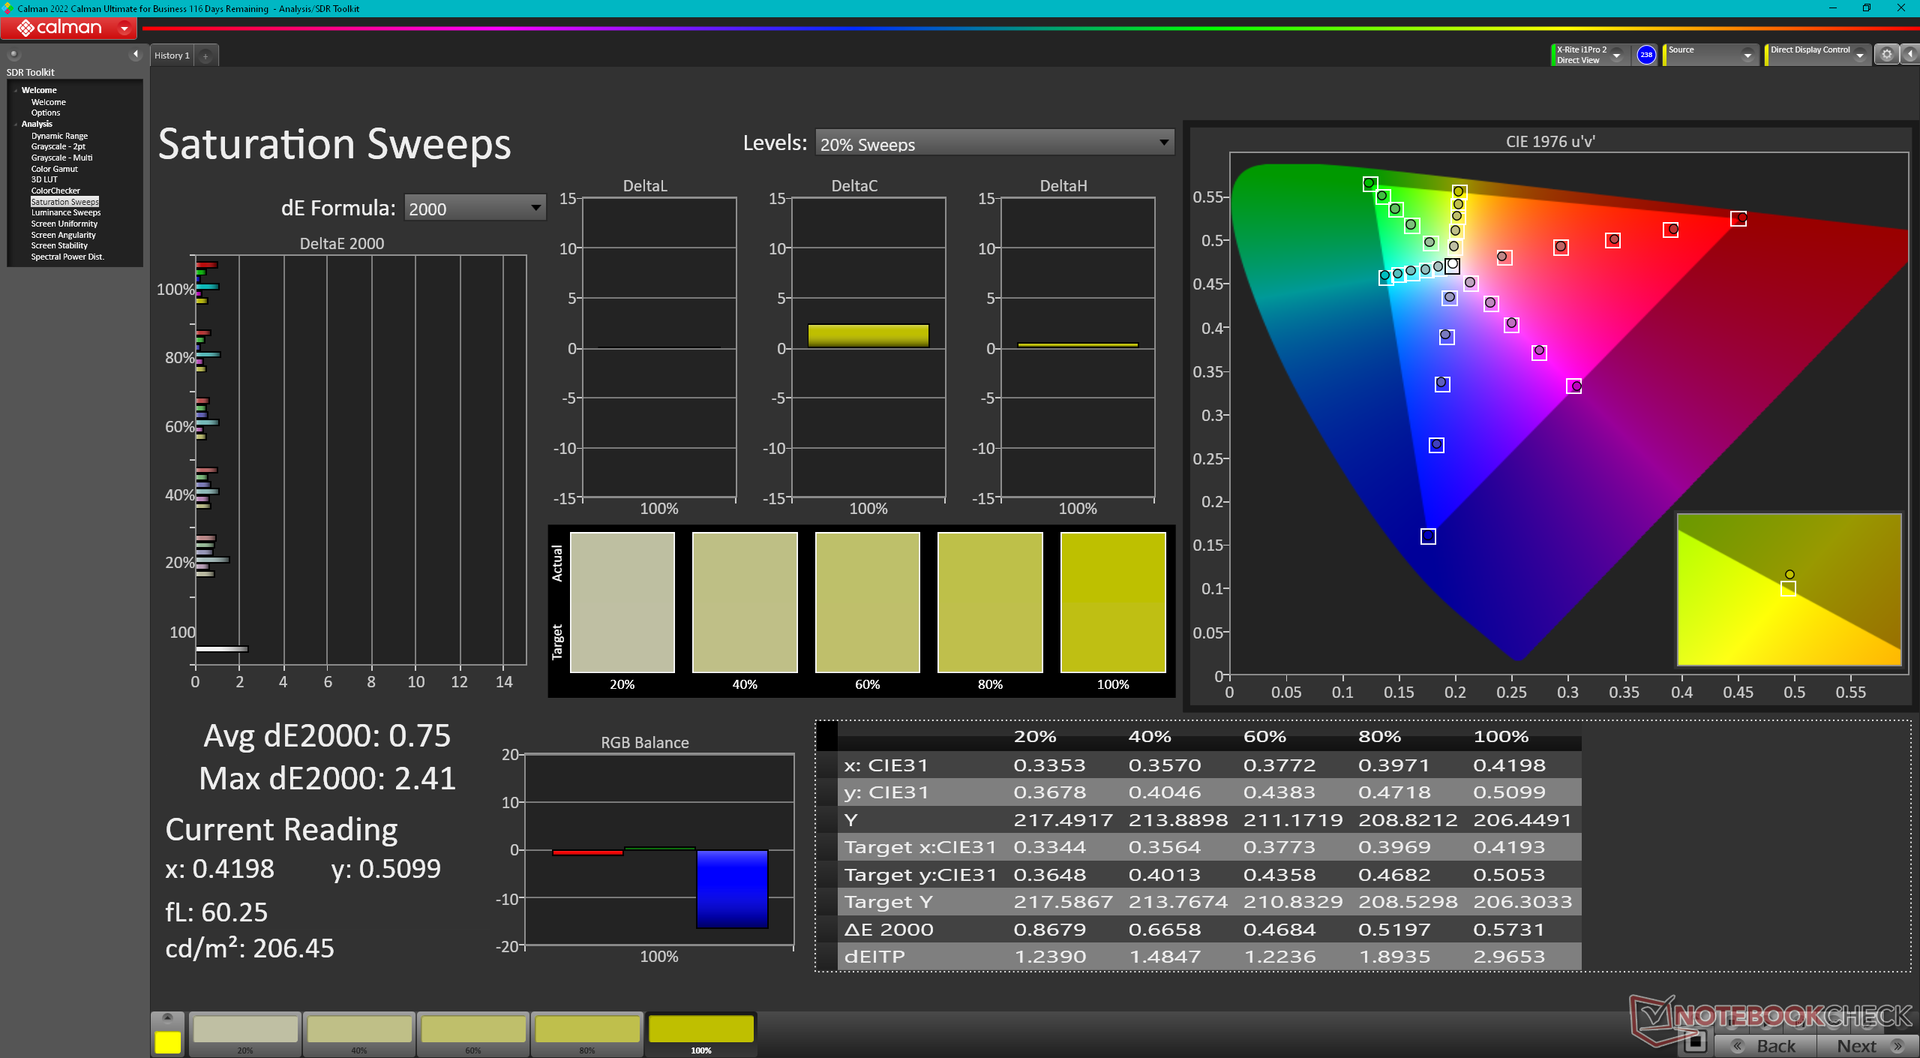
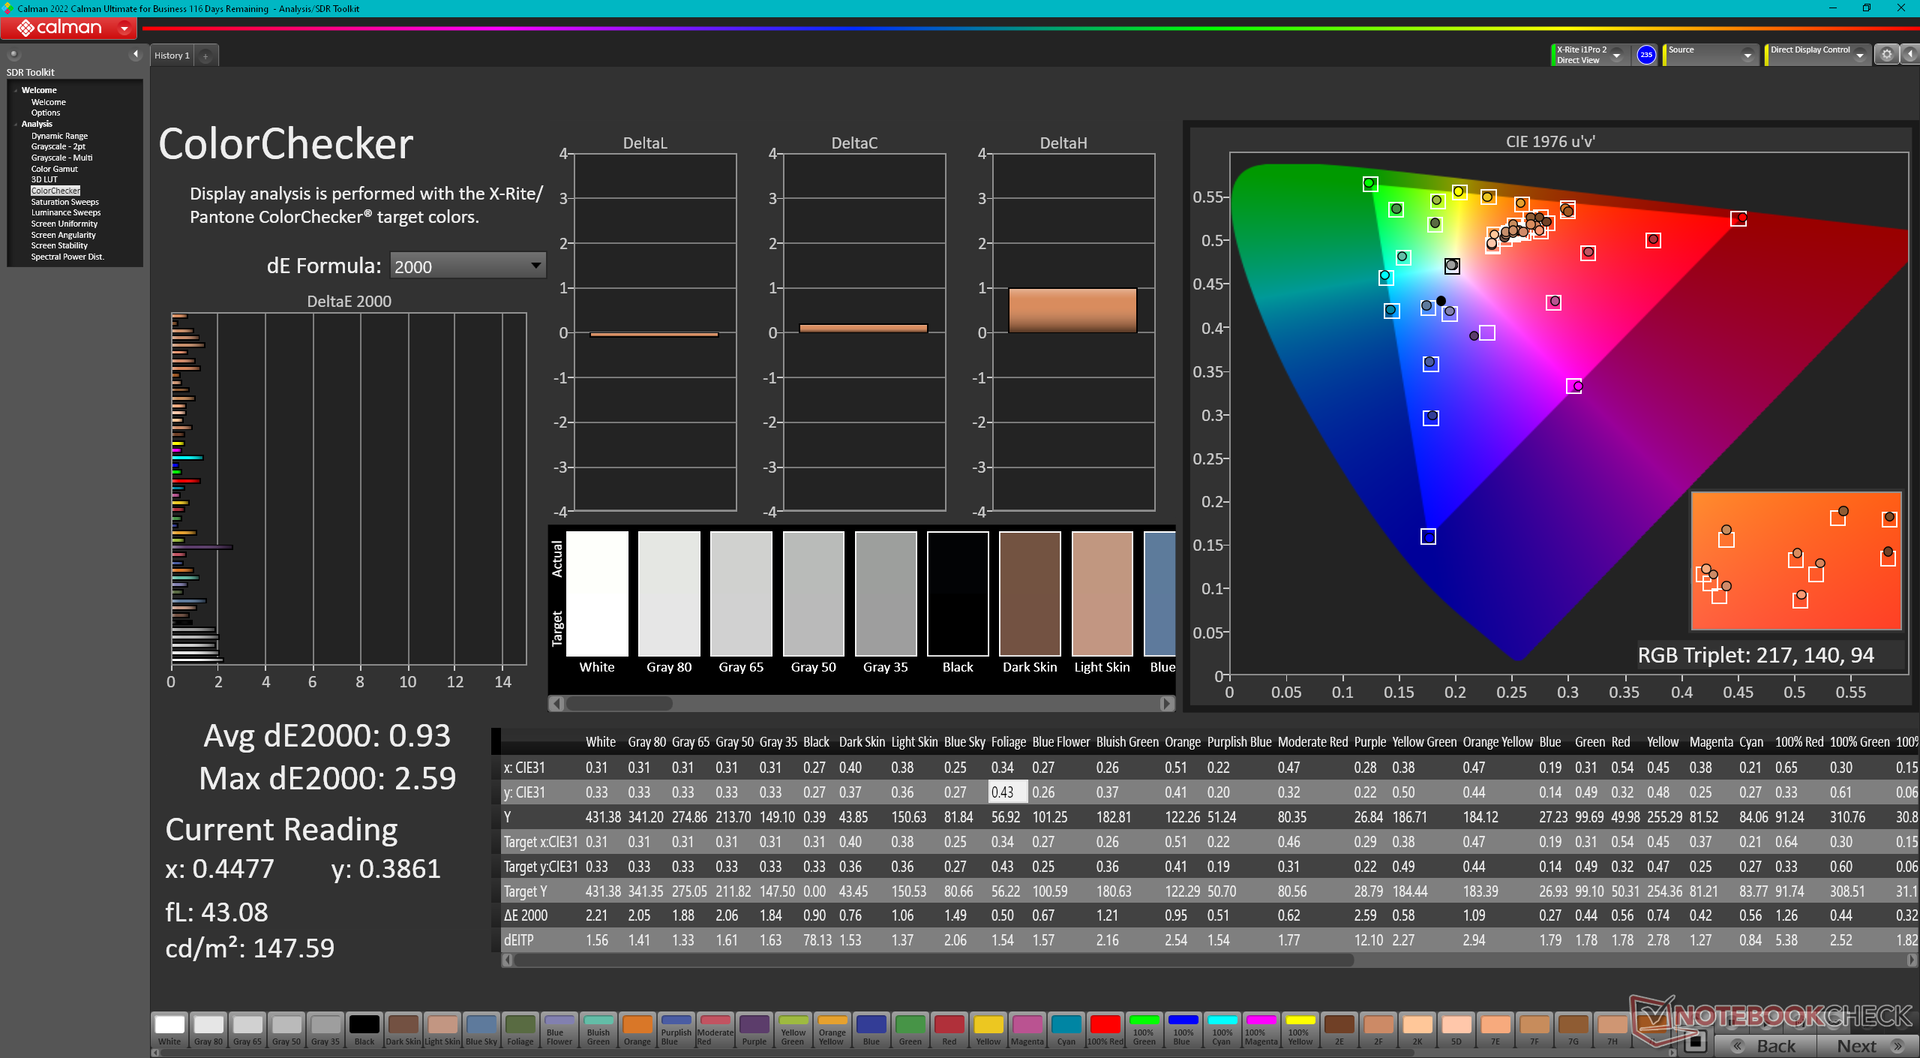
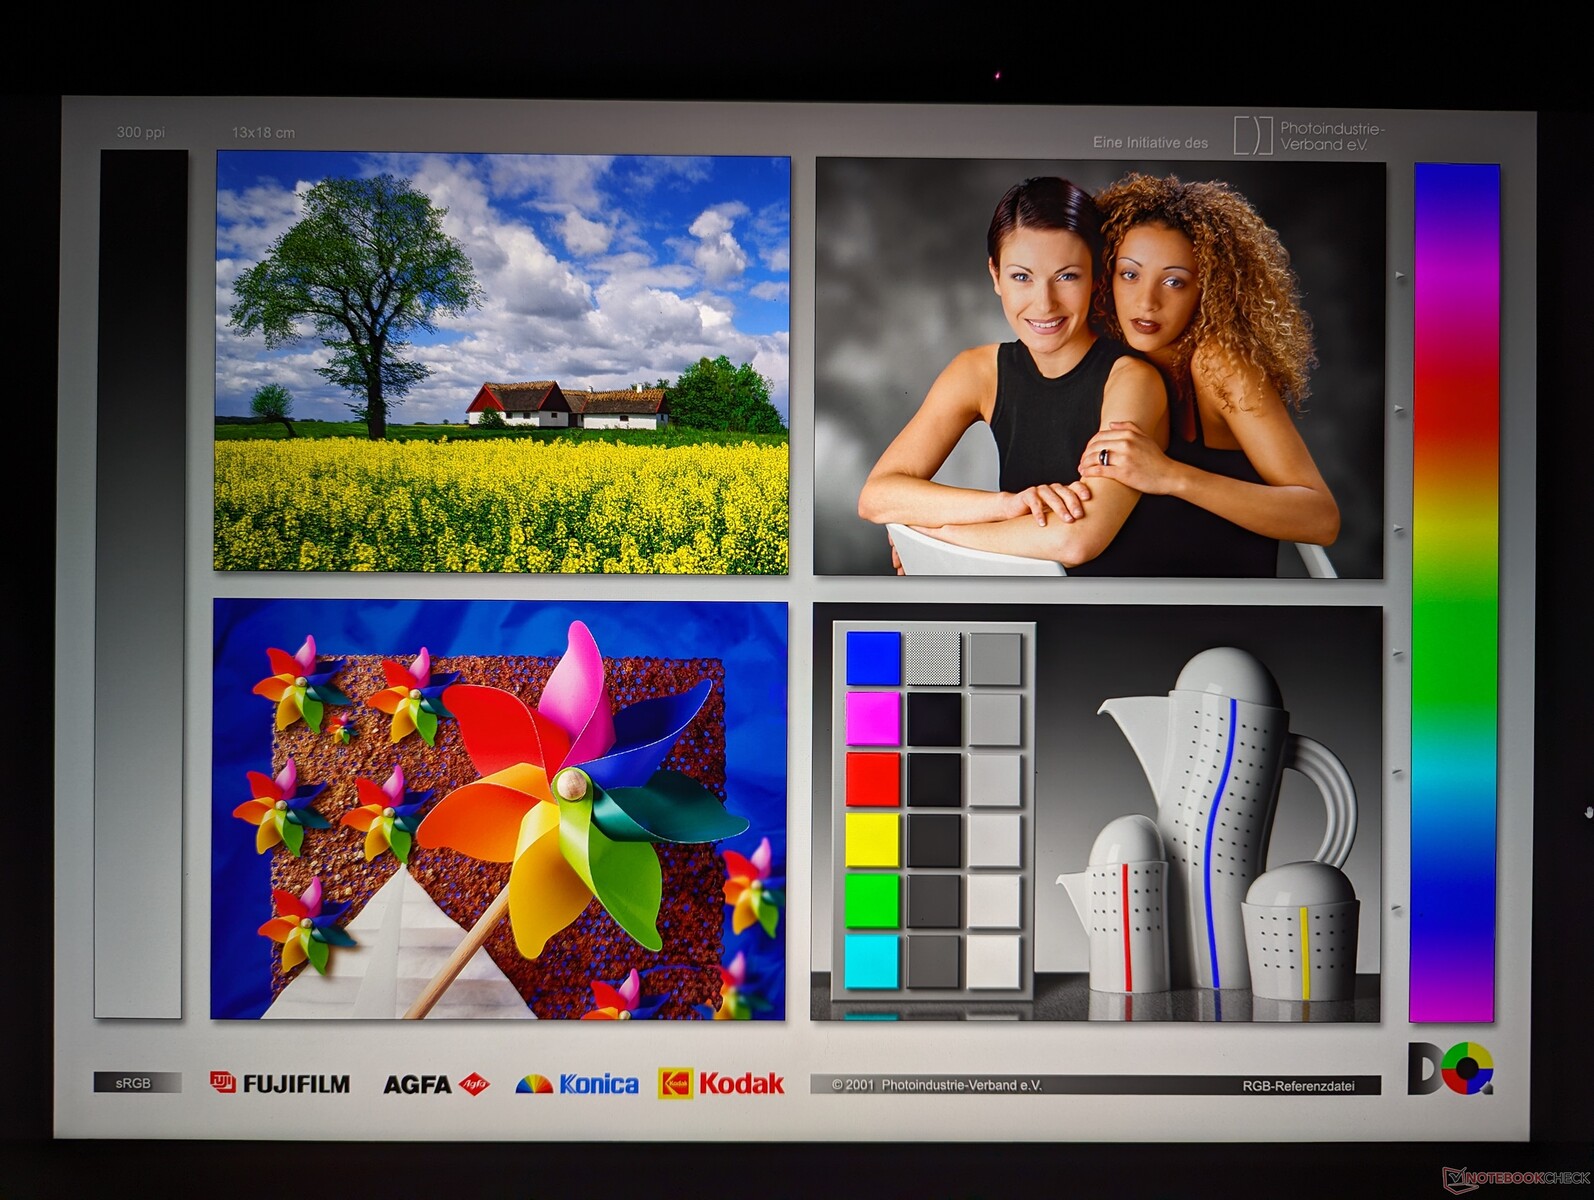
Skärmen levereras färdigkalibrerad mot P3-standarden med genomsnittliga deltaE-värden för gråskala och färg på endast 1,1 respektive 2,42. En slutanvändarkalibrering är därför inte nödvändig för majoriteten av användarna.
Visa svarstider
| ↔ Svarstid svart till vitt | ||
|---|---|---|
| 8.9 ms ... stiga ↗ och falla ↘ kombinerat | ↗ 4.8 ms stiga | 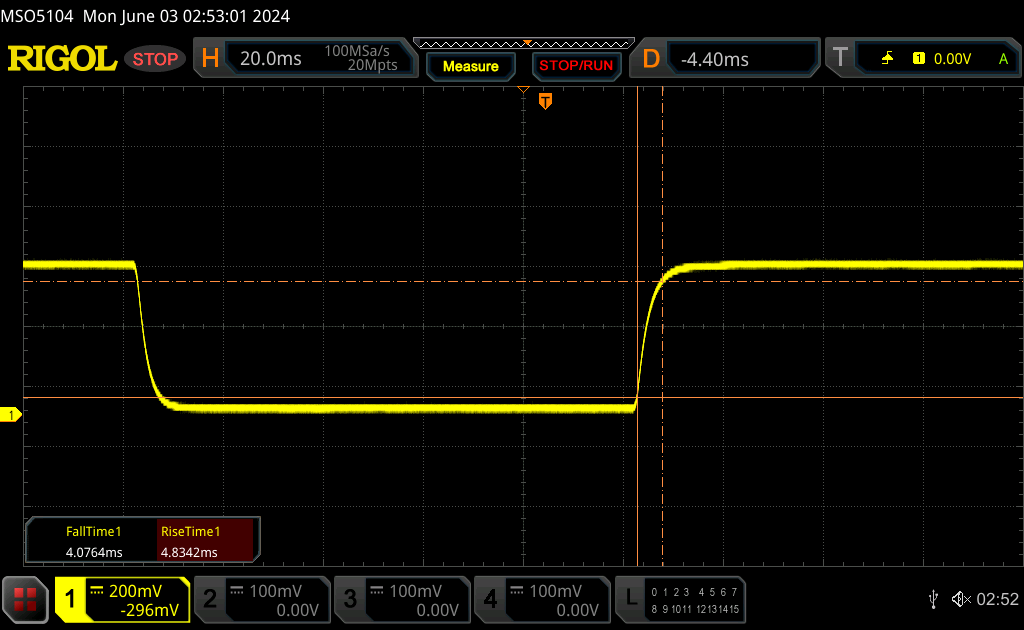 |
| ↘ 4.1 ms hösten | ||
| Skärmen visar snabba svarsfrekvenser i våra tester och bör passa för spel. I jämförelse sträcker sig alla testade enheter från 0.1 (minst) till 240 (maximalt) ms. » 22 % av alla enheter är bättre. Det betyder att den uppmätta svarstiden är bättre än genomsnittet av alla testade enheter (20.8 ms). | ||
| ↔ Svarstid 50 % grått till 80 % grått | ||
| 12.4 ms ... stiga ↗ och falla ↘ kombinerat | ↗ 6.3 ms stiga | 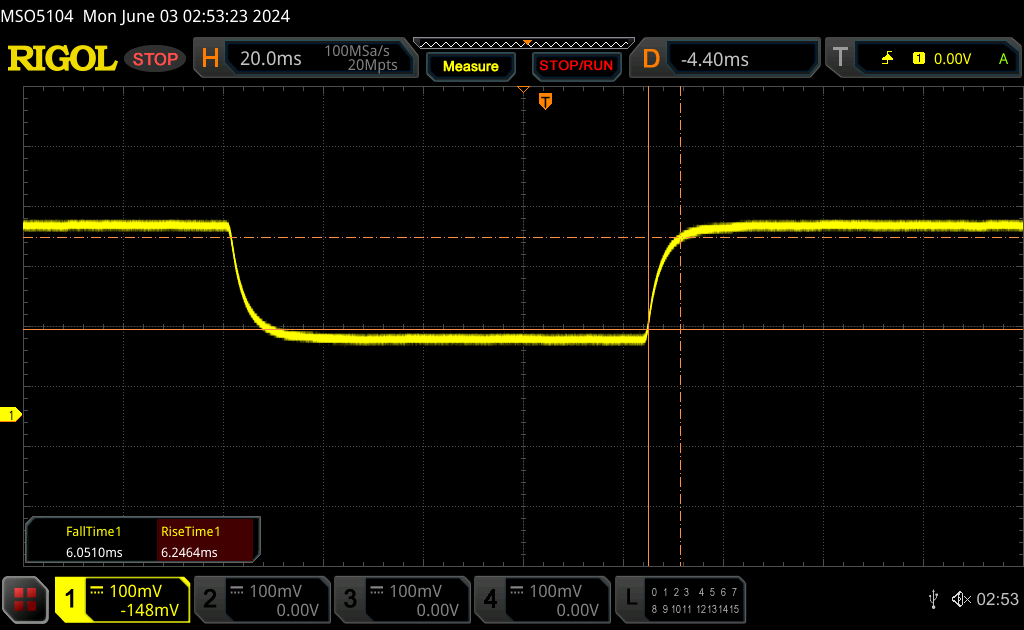 |
| ↘ 6.1 ms hösten | ||
| Skärmen visar bra svarsfrekvens i våra tester, men kan vara för långsam för konkurrenskraftiga spelare. I jämförelse sträcker sig alla testade enheter från 0.165 (minst) till 636 (maximalt) ms. » 23 % av alla enheter är bättre. Det betyder att den uppmätta svarstiden är bättre än genomsnittet av alla testade enheter (32.5 ms). | ||
Skärmflimmer / PWM (Puls-Width Modulation)
| Skärmflimmer / PWM upptäcktes inte | 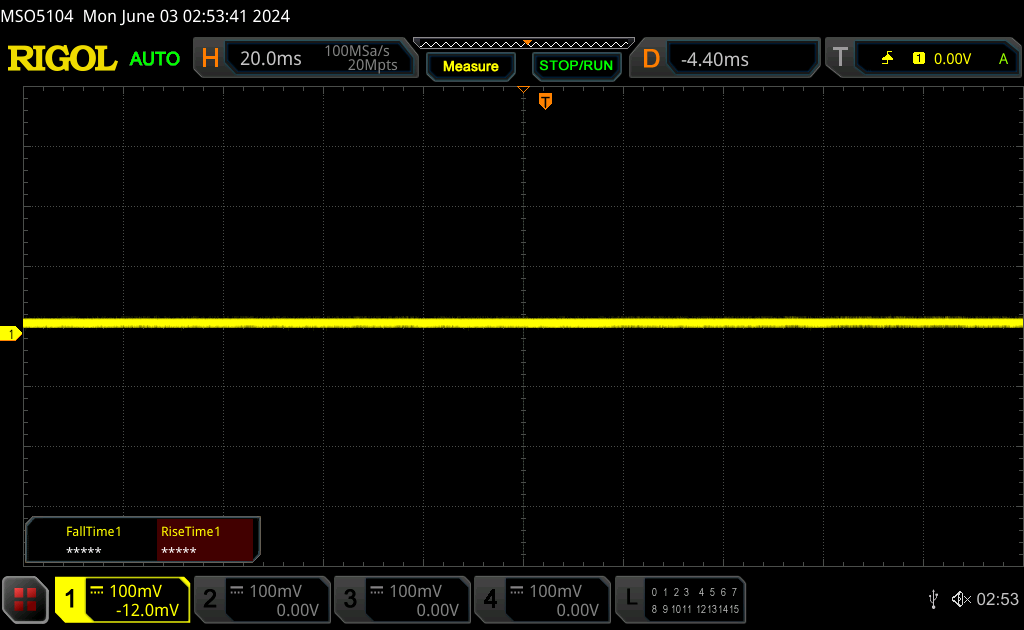 | ||
Som jämförelse: 53 % av alla testade enheter använder inte PWM för att dämpa skärmen. Om PWM upptäcktes mättes ett medelvärde av 8516 (minst: 5 - maximum: 343500) Hz. | |||


Performance - Allround multimediamaskin för spel
Testförhållanden
Vi ställde in Lenovo Vantage i prestandaläge och Nvidia i dGPU-läge innan vi körde nedanstående riktmärken.
Observera att även om GPU:n kan ställas in på endast diskret läge finns det inget "endast iGPU"-läge på Nvidias kontrollpanel.
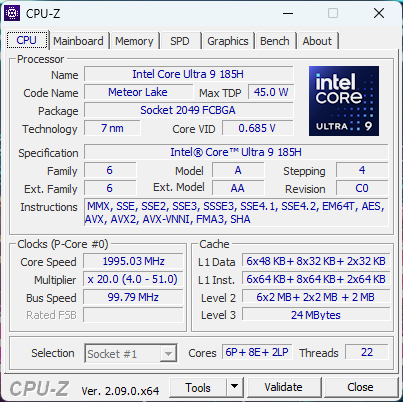
Processor
Core Ultra Core Ultra 9 185H i vår RTX 4050-konfiguration presterar inom 3 procentenheter från samma CPU i den mer avancerade RTX 4070-konfigurationen. Den erbjuder snabbare prestanda än den utgående Core i7-13900H samtidigt som den också integrerar en NPU för AI-accelererade uppgifter. Nedgradering till Core Ultra 7 155H förväntas endast påverka prestandan med 5 till 10 procent baserat på vår tid med Dell XPS 16 9640.
Cinebench R15 Multi Loop
Cinebench R23: Multi Core | Single Core
Cinebench R20: CPU (Multi Core) | CPU (Single Core)
Cinebench R15: CPU Multi 64Bit | CPU Single 64Bit
Blender: v2.79 BMW27 CPU
7-Zip 18.03: 7z b 4 | 7z b 4 -mmt1
Geekbench 6.4: Multi-Core | Single-Core
Geekbench 5.5: Multi-Core | Single-Core
HWBOT x265 Benchmark v2.2: 4k Preset
LibreOffice : 20 Documents To PDF
R Benchmark 2.5: Overall mean
* ... mindre är bättre
AIDA64: FP32 Ray-Trace | FPU Julia | CPU SHA3 | CPU Queen | FPU SinJulia | FPU Mandel | CPU AES | CPU ZLib | FP64 Ray-Trace | CPU PhotoWorxx
| Performance Rating | |
| Lenovo Yoga Pro 9 16IMH9 | |
| Lenovo Yoga Pro 9 16IMH9 RTX 4050 | |
| Dell XPS 16 9640 | |
| HP Envy x360 2-in-1 16-ad0097nr | |
| Genomsnitt Intel Core Ultra 9 185H | |
| Asus VivoBook Pro 16 K6602VU | |
| Samsung Galaxy Book4 Ultra | |
| AIDA64 / FP32 Ray-Trace | |
| HP Envy x360 2-in-1 16-ad0097nr | |
| Lenovo Yoga Pro 9 16IMH9 RTX 4050 | |
| Lenovo Yoga Pro 9 16IMH9 | |
| Dell XPS 16 9640 | |
| Genomsnitt Intel Core Ultra 9 185H (9220 - 18676, n=19) | |
| Asus VivoBook Pro 16 K6602VU | |
| Samsung Galaxy Book4 Ultra | |
| AIDA64 / FPU Julia | |
| Lenovo Yoga Pro 9 16IMH9 | |
| Lenovo Yoga Pro 9 16IMH9 RTX 4050 | |
| Dell XPS 16 9640 | |
| Genomsnitt Intel Core Ultra 9 185H (48865 - 96463, n=19) | |
| HP Envy x360 2-in-1 16-ad0097nr | |
| Asus VivoBook Pro 16 K6602VU | |
| Samsung Galaxy Book4 Ultra | |
| AIDA64 / CPU SHA3 | |
| Lenovo Yoga Pro 9 16IMH9 RTX 4050 | |
| Lenovo Yoga Pro 9 16IMH9 | |
| Dell XPS 16 9640 | |
| Genomsnitt Intel Core Ultra 9 185H (2394 - 4534, n=19) | |
| HP Envy x360 2-in-1 16-ad0097nr | |
| Asus VivoBook Pro 16 K6602VU | |
| Samsung Galaxy Book4 Ultra | |
| AIDA64 / CPU Queen | |
| HP Envy x360 2-in-1 16-ad0097nr | |
| Lenovo Yoga Pro 9 16IMH9 RTX 4050 | |
| Asus VivoBook Pro 16 K6602VU | |
| Lenovo Yoga Pro 9 16IMH9 | |
| Dell XPS 16 9640 | |
| Genomsnitt Intel Core Ultra 9 185H (66785 - 95241, n=19) | |
| Samsung Galaxy Book4 Ultra | |
| AIDA64 / FPU SinJulia | |
| HP Envy x360 2-in-1 16-ad0097nr | |
| Lenovo Yoga Pro 9 16IMH9 | |
| Lenovo Yoga Pro 9 16IMH9 RTX 4050 | |
| Dell XPS 16 9640 | |
| Genomsnitt Intel Core Ultra 9 185H (7255 - 11392, n=19) | |
| Samsung Galaxy Book4 Ultra | |
| Asus VivoBook Pro 16 K6602VU | |
| AIDA64 / FPU Mandel | |
| Lenovo Yoga Pro 9 16IMH9 | |
| Lenovo Yoga Pro 9 16IMH9 RTX 4050 | |
| HP Envy x360 2-in-1 16-ad0097nr | |
| Dell XPS 16 9640 | |
| Genomsnitt Intel Core Ultra 9 185H (24004 - 48020, n=19) | |
| Samsung Galaxy Book4 Ultra | |
| Asus VivoBook Pro 16 K6602VU | |
| AIDA64 / CPU AES | |
| Asus VivoBook Pro 16 K6602VU | |
| Lenovo Yoga Pro 9 16IMH9 | |
| Lenovo Yoga Pro 9 16IMH9 RTX 4050 | |
| Genomsnitt Intel Core Ultra 9 185H (53116 - 154066, n=19) | |
| Dell XPS 16 9640 | |
| HP Envy x360 2-in-1 16-ad0097nr | |
| Samsung Galaxy Book4 Ultra | |
| AIDA64 / CPU ZLib | |
| Lenovo Yoga Pro 9 16IMH9 | |
| Lenovo Yoga Pro 9 16IMH9 RTX 4050 | |
| Dell XPS 16 9640 | |
| Genomsnitt Intel Core Ultra 9 185H (678 - 1341, n=19) | |
| Samsung Galaxy Book4 Ultra | |
| Asus VivoBook Pro 16 K6602VU | |
| HP Envy x360 2-in-1 16-ad0097nr | |
| AIDA64 / FP64 Ray-Trace | |
| HP Envy x360 2-in-1 16-ad0097nr | |
| Lenovo Yoga Pro 9 16IMH9 | |
| Lenovo Yoga Pro 9 16IMH9 RTX 4050 | |
| Dell XPS 16 9640 | |
| Genomsnitt Intel Core Ultra 9 185H (4428 - 10078, n=19) | |
| Asus VivoBook Pro 16 K6602VU | |
| Samsung Galaxy Book4 Ultra | |
| AIDA64 / CPU PhotoWorxx | |
| Lenovo Yoga Pro 9 16IMH9 | |
| Lenovo Yoga Pro 9 16IMH9 RTX 4050 | |
| Dell XPS 16 9640 | |
| Samsung Galaxy Book4 Ultra | |
| Genomsnitt Intel Core Ultra 9 185H (44547 - 53918, n=19) | |
| Asus VivoBook Pro 16 K6602VU | |
| HP Envy x360 2-in-1 16-ad0097nr | |
Stresstest
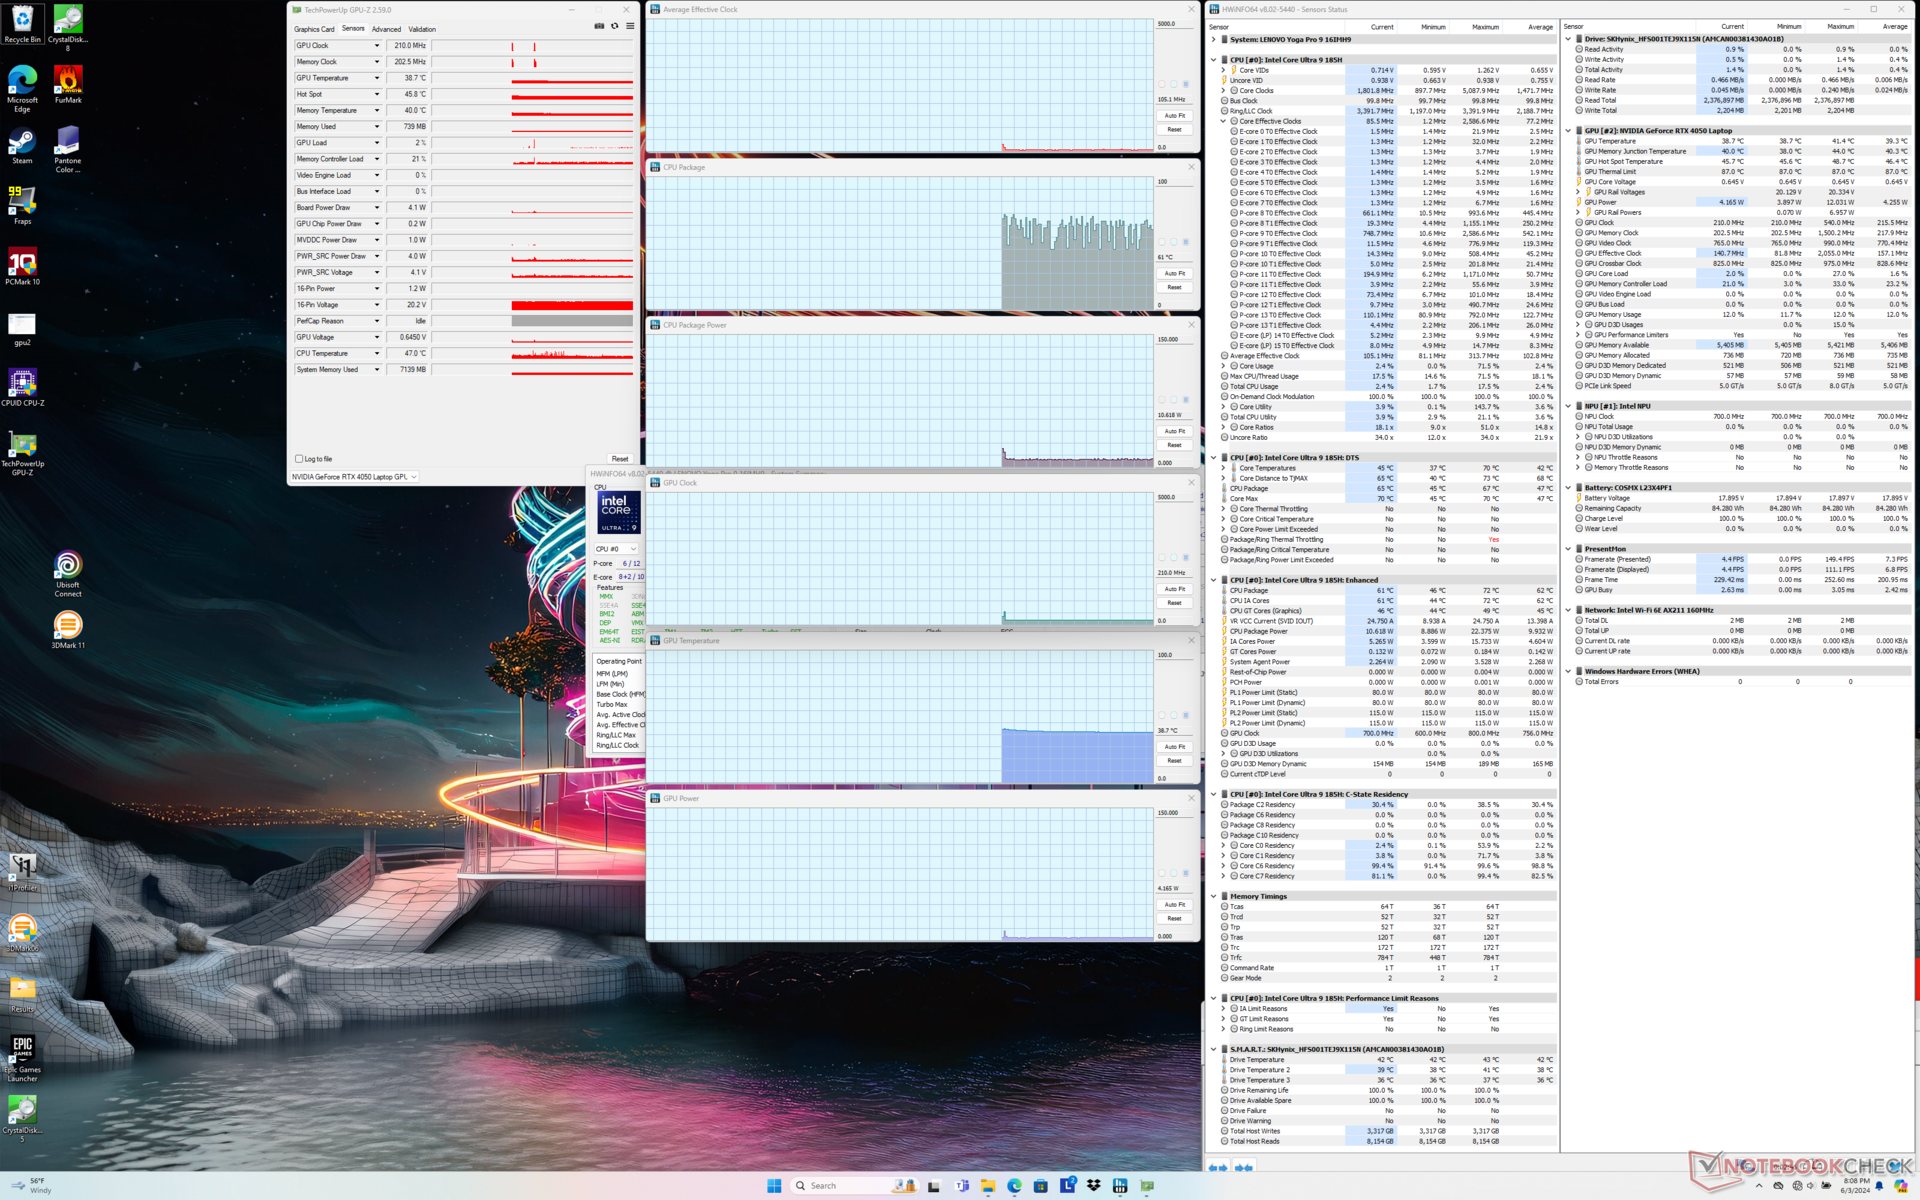
Processorn ökade till 3,6 GHz, 100 C och 120 W efter att Prime95-stressen startats, innan den sjönk och stabiliserades på 3,1 GHz, 90 C och 83 W cirka 70 sekunder senare.
Grafikprestanda påverkas om man kör i balanserat läge istället för prestandaläge, vilket kompletterar våra GPU-prestandaresultat nedan. Nvidias GPU skulle bibehålla 2855 MHz och 78 W när den kördes i Witcher 3 prestandaläge jämfört med 2385 MHz och 63 W i balanserat läge. GPU-temperaturen skulle också vara varmare i prestandaläget.
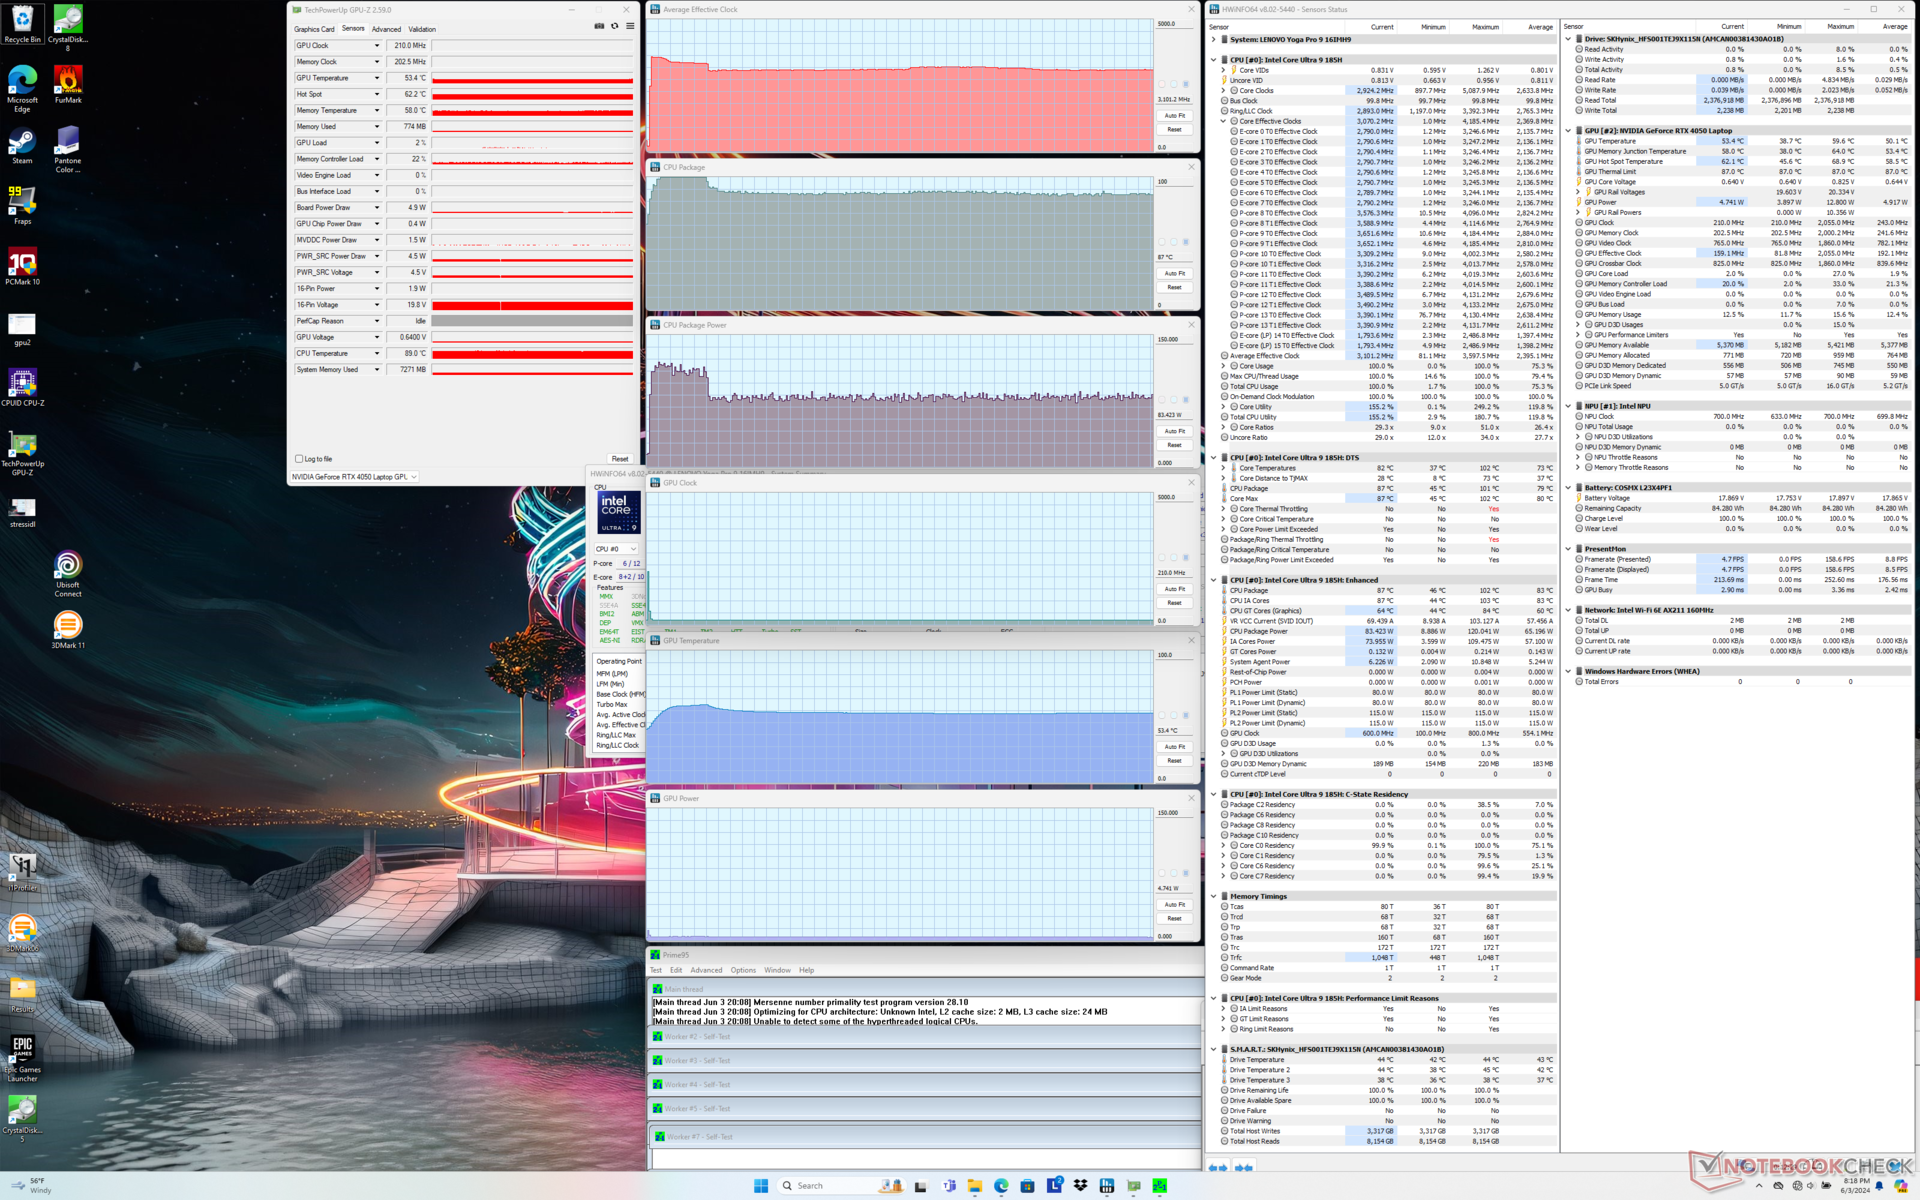
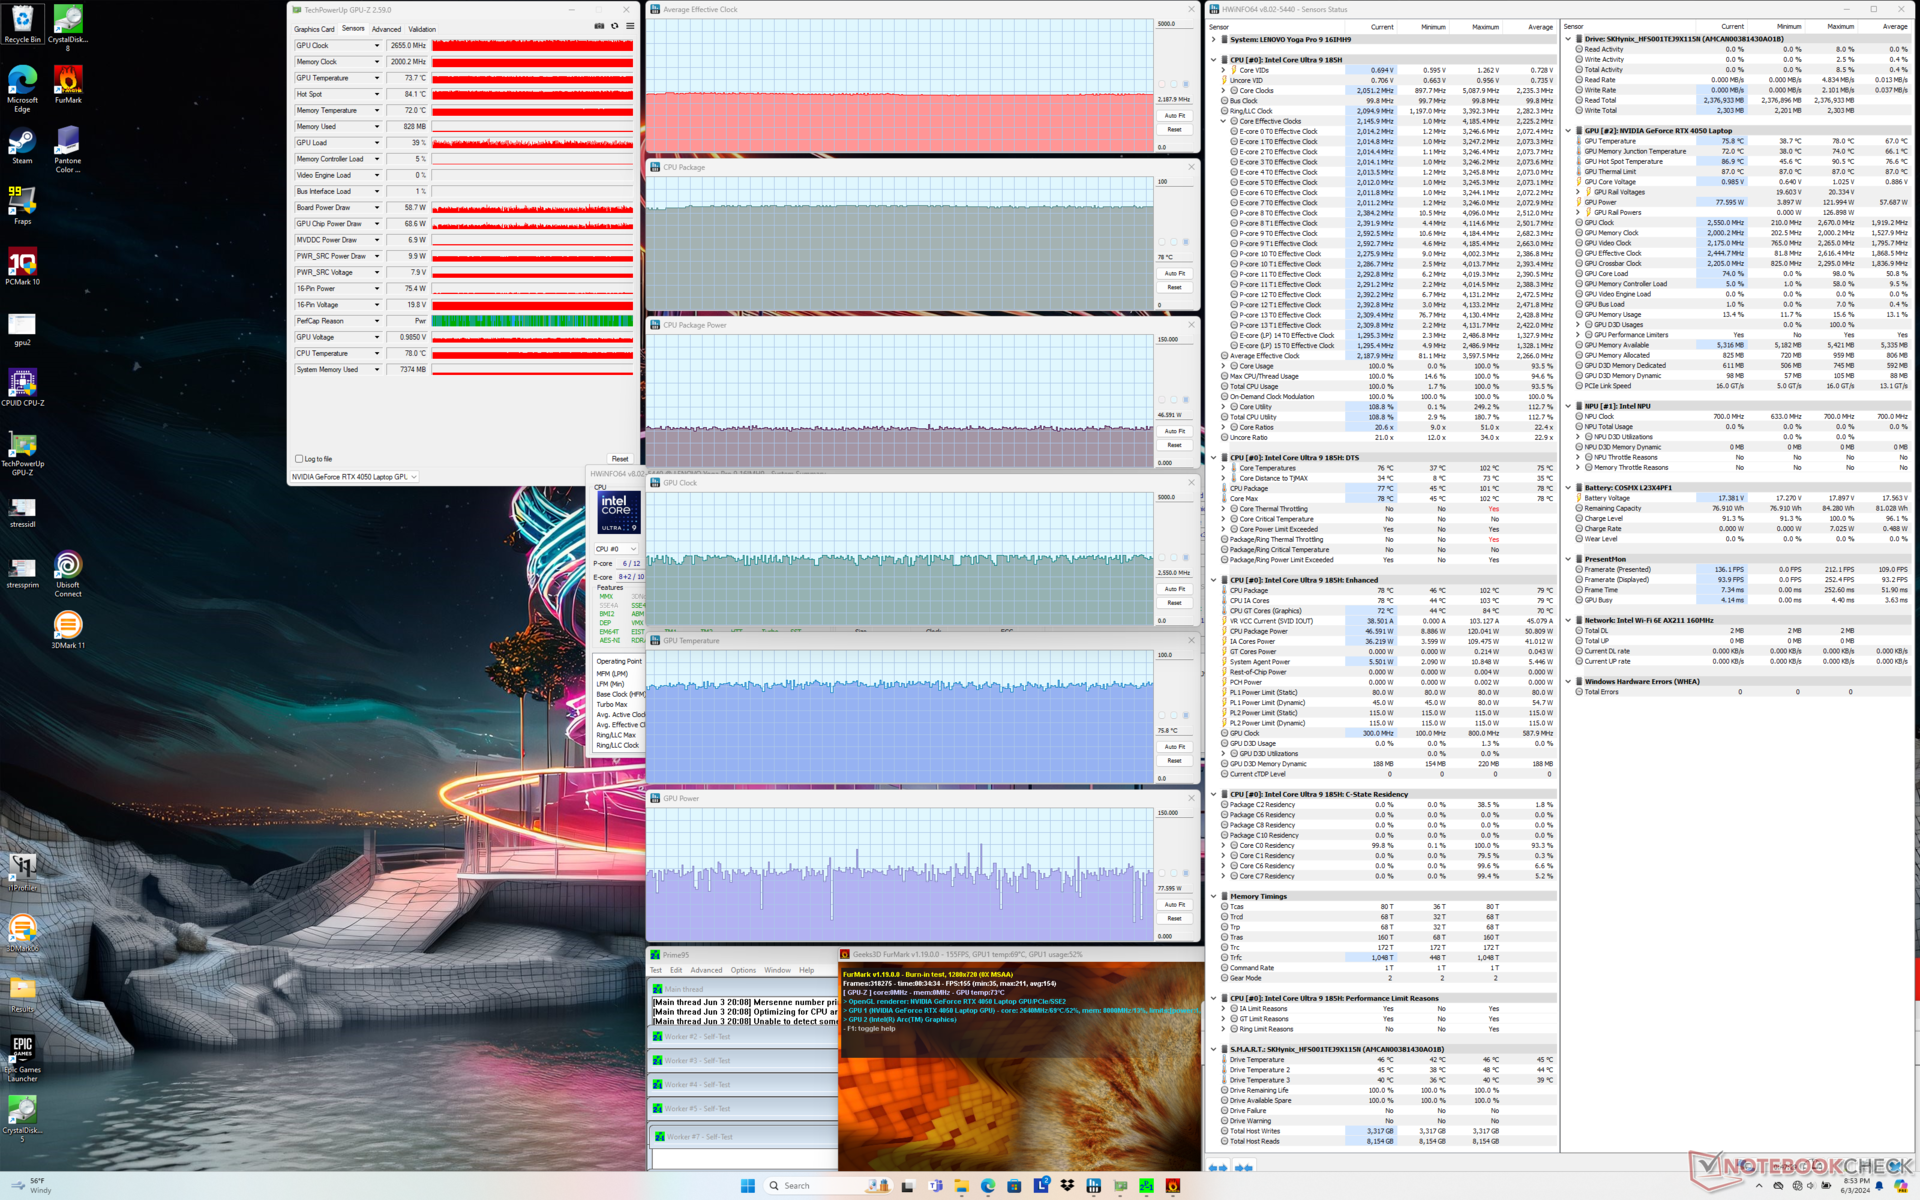
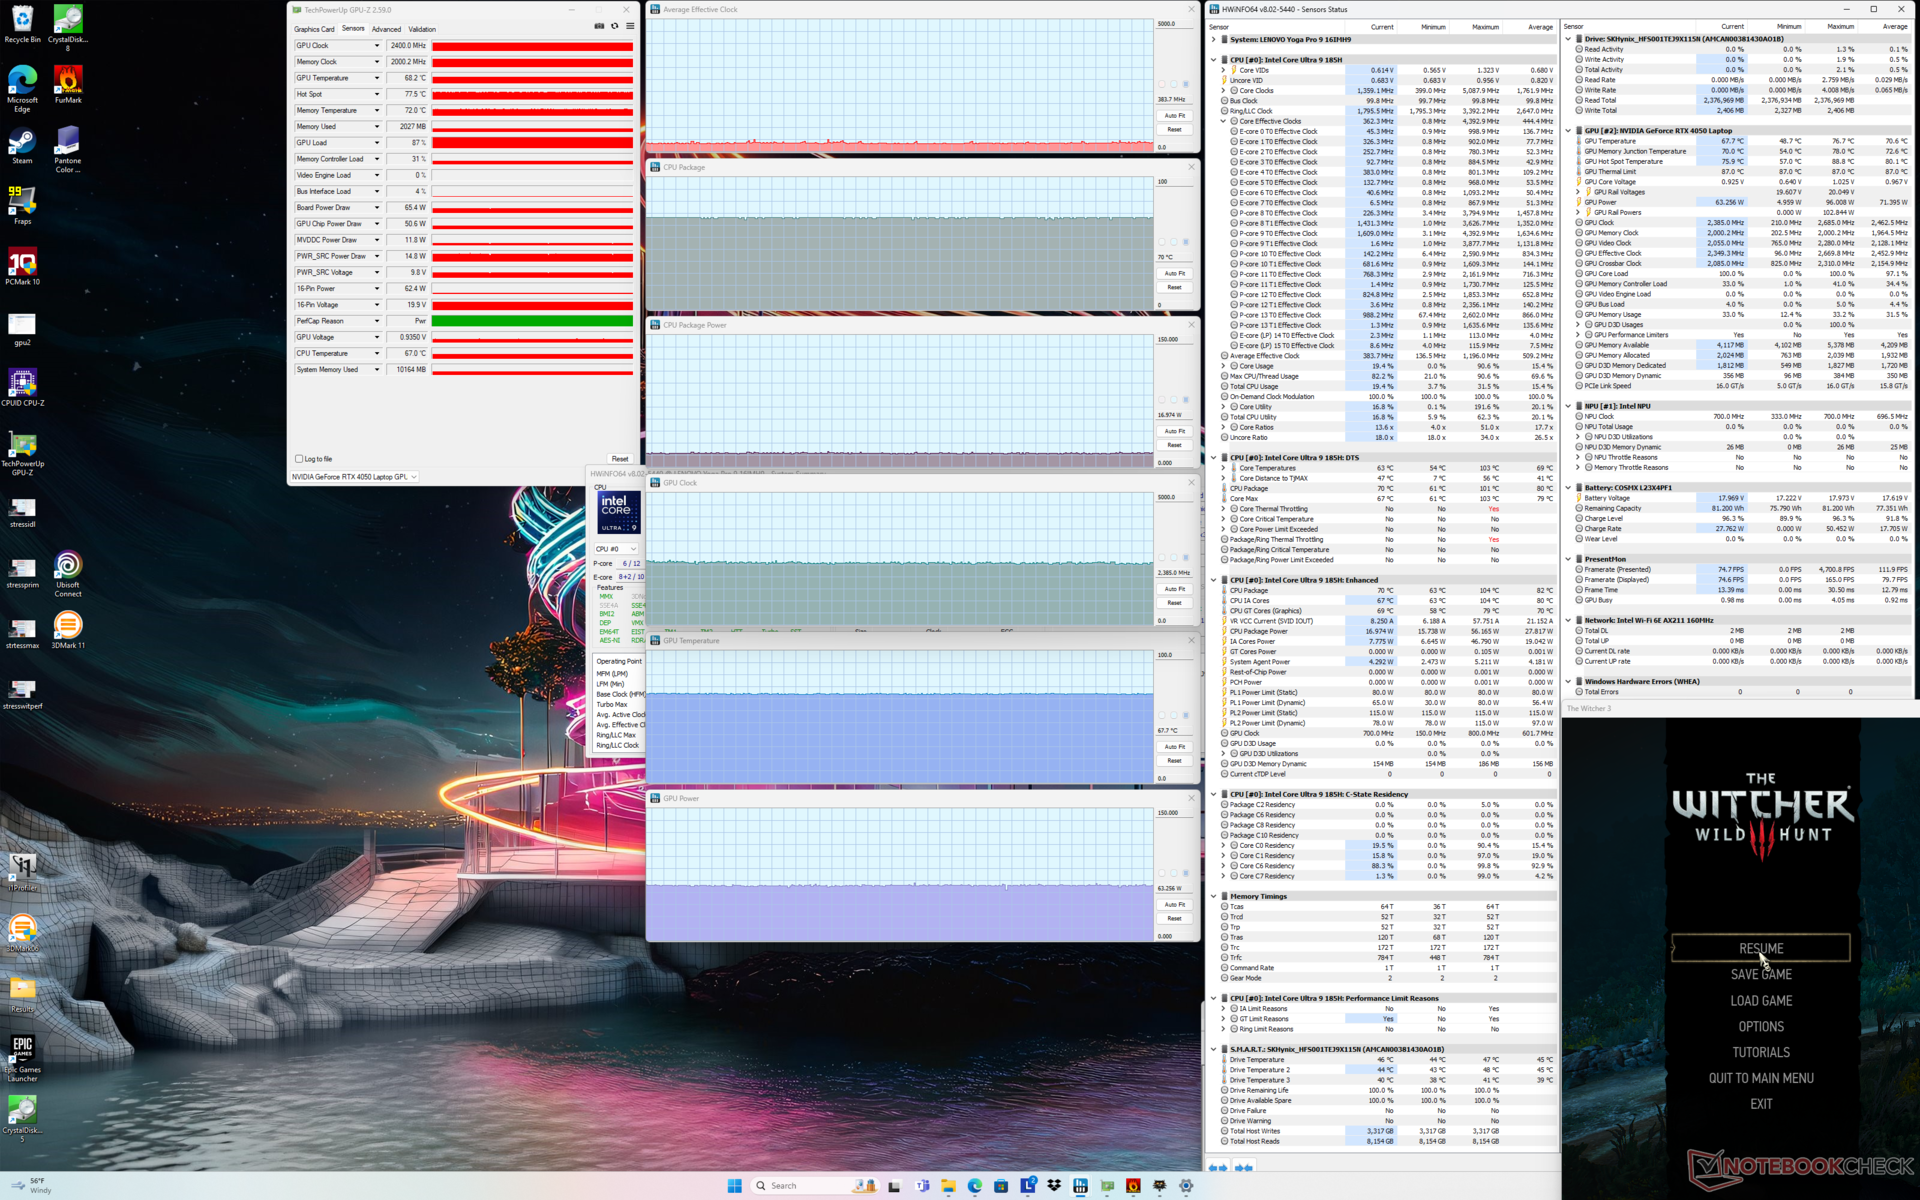

| Genomsnittlig CPU-klocka (GHz) | GPU-klocka (MHz) | Genomsnittlig CPU-temperatur (°C) | Genomsnittlig GPU-temperatur (°C) | |
| System i viloläge | -- | -- | 61 | 39 |
| Prime95 Stress | 3.1 | -- | 87 | 53 |
| Prime95 + FurMark Stress | 2.2 | 2550 | 78 | 76 |
| Witcher 3 Stress (Balanced mode) | 0,4 | 2385 | 70 | 68 |
| Witcher 3 Stress (Performance mode) | 0,7 | 2655 | 99 | 76 |
Systemets prestanda
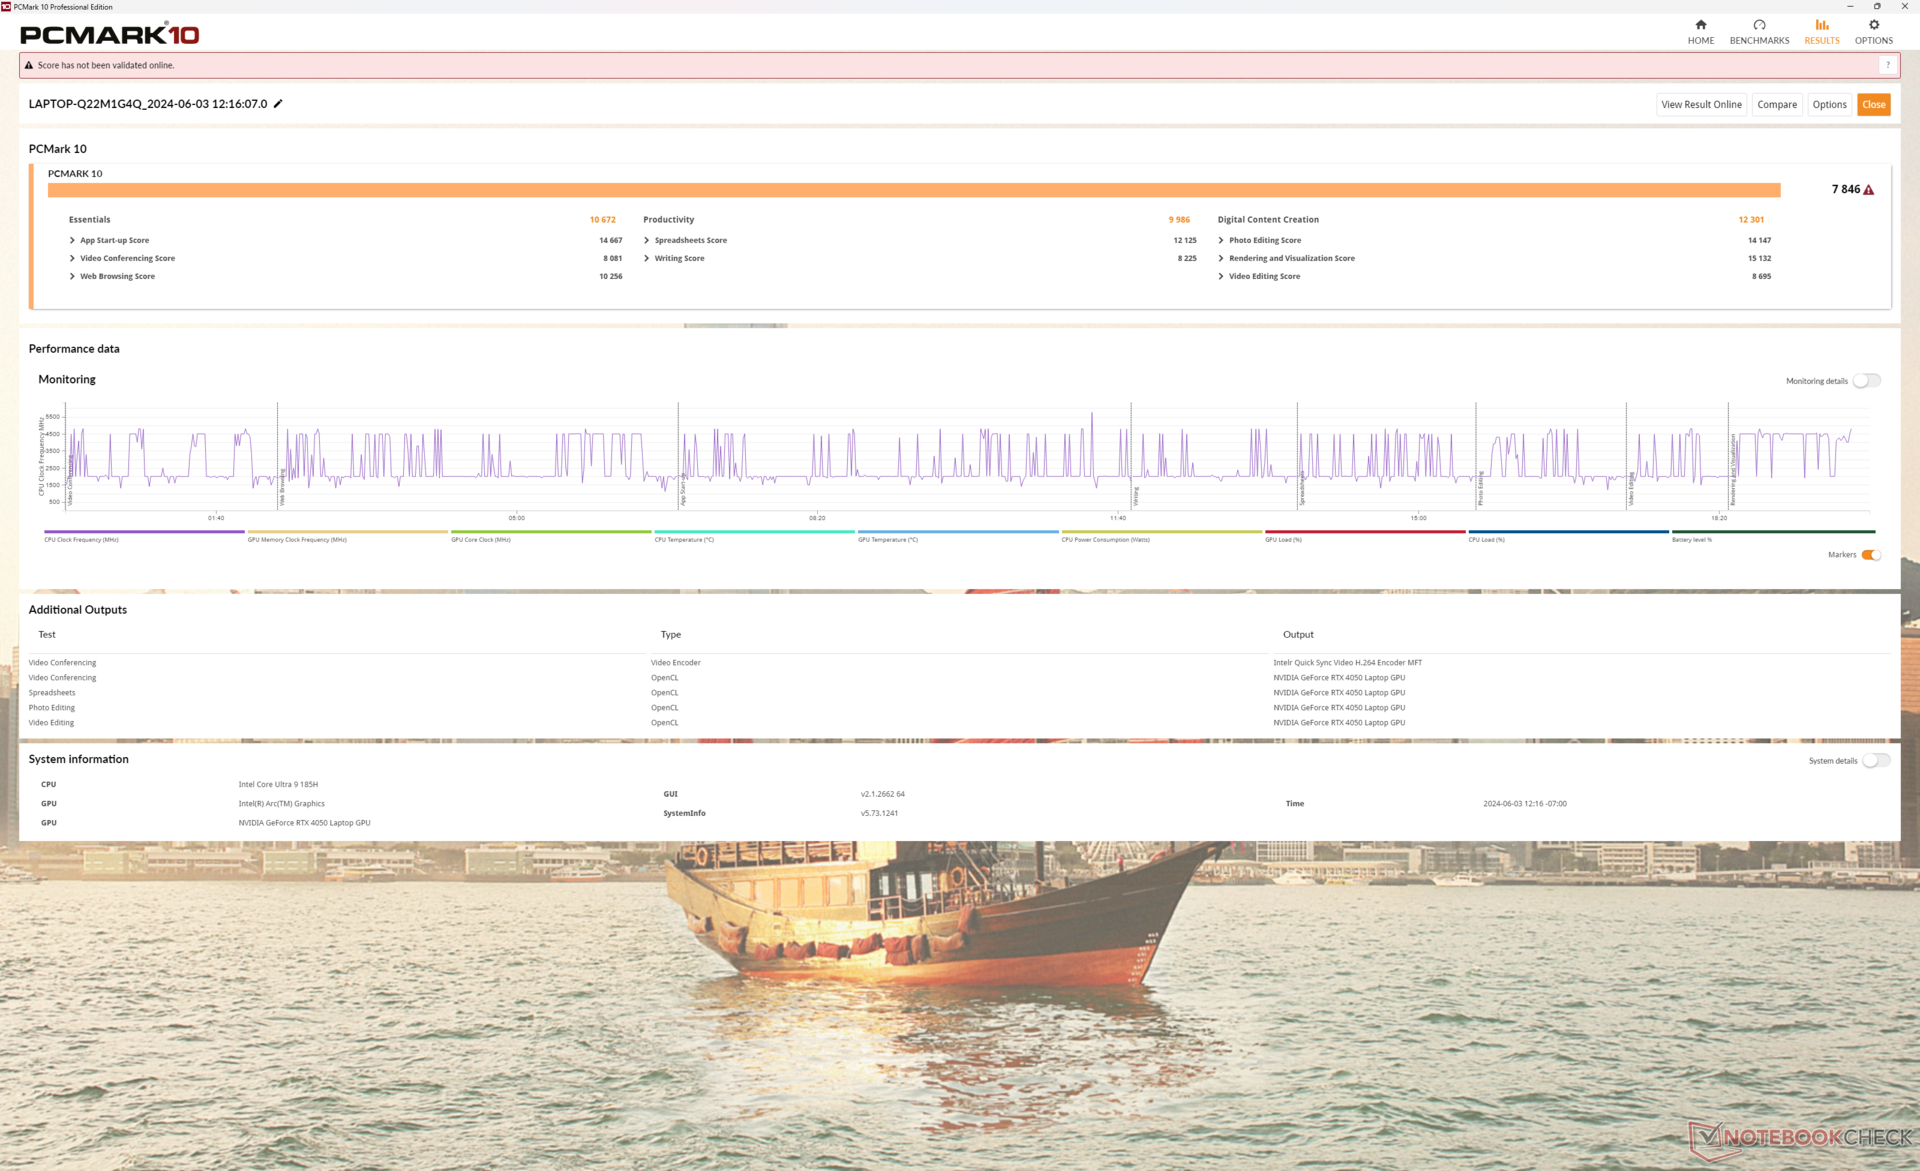
PCMark-resultaten är jämförbara med de flesta andra bärbara multimediadatorer, vilket tyder på att Lenovo inte är avsevärt långsammare i de flesta dagliga arbetsbelastningar eller redigeringsuppgifter, trots vår lägre RTX 4050-konfiguration.
CrossMark: Overall | Productivity | Creativity | Responsiveness
WebXPRT 3: Overall
WebXPRT 4: Overall
Mozilla Kraken 1.1: Total
| PCMark 10 / Score | |
| Lenovo Yoga Pro 9 16IMH9 RTX 4050 | |
| Genomsnitt Intel Core Ultra 9 185H, NVIDIA GeForce RTX 4050 Laptop GPU (7431 - 7846, n=2) | |
| Lenovo Yoga Pro 9 16IMH9 | |
| Dell XPS 16 9640 | |
| Asus VivoBook Pro 16 K6602VU | |
| Samsung Galaxy Book4 Ultra | |
| HP Envy x360 2-in-1 16-ad0097nr | |
| PCMark 10 / Essentials | |
| Lenovo Yoga Pro 9 16IMH9 | |
| Genomsnitt Intel Core Ultra 9 185H, NVIDIA GeForce RTX 4050 Laptop GPU (10672 - 10807, n=2) | |
| Lenovo Yoga Pro 9 16IMH9 RTX 4050 | |
| HP Envy x360 2-in-1 16-ad0097nr | |
| Samsung Galaxy Book4 Ultra | |
| Dell XPS 16 9640 | |
| Asus VivoBook Pro 16 K6602VU | |
| PCMark 10 / Productivity | |
| Lenovo Yoga Pro 9 16IMH9 RTX 4050 | |
| HP Envy x360 2-in-1 16-ad0097nr | |
| Genomsnitt Intel Core Ultra 9 185H, NVIDIA GeForce RTX 4050 Laptop GPU (9717 - 9986, n=2) | |
| Dell XPS 16 9640 | |
| Samsung Galaxy Book4 Ultra | |
| Lenovo Yoga Pro 9 16IMH9 | |
| Asus VivoBook Pro 16 K6602VU | |
| PCMark 10 / Digital Content Creation | |
| Lenovo Yoga Pro 9 16IMH9 RTX 4050 | |
| Lenovo Yoga Pro 9 16IMH9 | |
| Genomsnitt Intel Core Ultra 9 185H, NVIDIA GeForce RTX 4050 Laptop GPU (10607 - 12301, n=2) | |
| Asus VivoBook Pro 16 K6602VU | |
| Dell XPS 16 9640 | |
| Samsung Galaxy Book4 Ultra | |
| HP Envy x360 2-in-1 16-ad0097nr | |
| CrossMark / Overall | |
| Dell XPS 16 9640 | |
| Lenovo Yoga Pro 9 16IMH9 RTX 4050 | |
| Genomsnitt Intel Core Ultra 9 185H, NVIDIA GeForce RTX 4050 Laptop GPU (1790 - 1811, n=2) | |
| Samsung Galaxy Book4 Ultra | |
| Asus VivoBook Pro 16 K6602VU | |
| Lenovo Yoga Pro 9 16IMH9 | |
| HP Envy x360 2-in-1 16-ad0097nr | |
| CrossMark / Productivity | |
| Dell XPS 16 9640 | |
| Lenovo Yoga Pro 9 16IMH9 RTX 4050 | |
| Genomsnitt Intel Core Ultra 9 185H, NVIDIA GeForce RTX 4050 Laptop GPU (1700 - 1717, n=2) | |
| Asus VivoBook Pro 16 K6602VU | |
| Samsung Galaxy Book4 Ultra | |
| Lenovo Yoga Pro 9 16IMH9 | |
| HP Envy x360 2-in-1 16-ad0097nr | |
| CrossMark / Creativity | |
| Genomsnitt Intel Core Ultra 9 185H, NVIDIA GeForce RTX 4050 Laptop GPU (2037 - 2038, n=2) | |
| Lenovo Yoga Pro 9 16IMH9 RTX 4050 | |
| Dell XPS 16 9640 | |
| Lenovo Yoga Pro 9 16IMH9 | |
| Samsung Galaxy Book4 Ultra | |
| Asus VivoBook Pro 16 K6602VU | |
| HP Envy x360 2-in-1 16-ad0097nr | |
| CrossMark / Responsiveness | |
| Dell XPS 16 9640 | |
| Asus VivoBook Pro 16 K6602VU | |
| Lenovo Yoga Pro 9 16IMH9 RTX 4050 | |
| Samsung Galaxy Book4 Ultra | |
| Genomsnitt Intel Core Ultra 9 185H, NVIDIA GeForce RTX 4050 Laptop GPU (1419 - 1493, n=2) | |
| HP Envy x360 2-in-1 16-ad0097nr | |
| Lenovo Yoga Pro 9 16IMH9 | |
| WebXPRT 3 / Overall | |
| HP Envy x360 2-in-1 16-ad0097nr | |
| Genomsnitt Intel Core Ultra 9 185H, NVIDIA GeForce RTX 4050 Laptop GPU (293 - 301, n=2) | |
| Lenovo Yoga Pro 9 16IMH9 | |
| Lenovo Yoga Pro 9 16IMH9 RTX 4050 | |
| Dell XPS 16 9640 | |
| Samsung Galaxy Book4 Ultra | |
| WebXPRT 4 / Overall | |
| Genomsnitt Intel Core Ultra 9 185H, NVIDIA GeForce RTX 4050 Laptop GPU (268 - 271, n=2) | |
| Lenovo Yoga Pro 9 16IMH9 | |
| Lenovo Yoga Pro 9 16IMH9 RTX 4050 | |
| Samsung Galaxy Book4 Ultra | |
| Dell XPS 16 9640 | |
| HP Envy x360 2-in-1 16-ad0097nr | |
| Asus VivoBook Pro 16 K6602VU | |
| Mozilla Kraken 1.1 / Total | |
| Asus VivoBook Pro 16 K6602VU | |
| HP Envy x360 2-in-1 16-ad0097nr | |
| Lenovo Yoga Pro 9 16IMH9 RTX 4050 | |
| Genomsnitt Intel Core Ultra 9 185H, NVIDIA GeForce RTX 4050 Laptop GPU (498 - 512, n=2) | |
| Lenovo Yoga Pro 9 16IMH9 | |
| Samsung Galaxy Book4 Ultra | |
* ... mindre är bättre
| PCMark 10 Score | 7846 poäng | |
Hjälp | ||
| AIDA64 / Memory Copy | |
| Lenovo Yoga Pro 9 16IMH9 | |
| Lenovo Yoga Pro 9 16IMH9 RTX 4050 | |
| Dell XPS 16 9640 | |
| Samsung Galaxy Book4 Ultra | |
| Genomsnitt Intel Core Ultra 9 185H (69929 - 95718, n=19) | |
| HP Envy x360 2-in-1 16-ad0097nr | |
| Asus VivoBook Pro 16 K6602VU | |
| AIDA64 / Memory Read | |
| Samsung Galaxy Book4 Ultra | |
| Lenovo Yoga Pro 9 16IMH9 | |
| Lenovo Yoga Pro 9 16IMH9 RTX 4050 | |
| Dell XPS 16 9640 | |
| Genomsnitt Intel Core Ultra 9 185H (64619 - 87768, n=19) | |
| Asus VivoBook Pro 16 K6602VU | |
| HP Envy x360 2-in-1 16-ad0097nr | |
| AIDA64 / Memory Write | |
| HP Envy x360 2-in-1 16-ad0097nr | |
| Samsung Galaxy Book4 Ultra | |
| Lenovo Yoga Pro 9 16IMH9 | |
| Lenovo Yoga Pro 9 16IMH9 RTX 4050 | |
| Dell XPS 16 9640 | |
| Genomsnitt Intel Core Ultra 9 185H (51114 - 93871, n=19) | |
| Asus VivoBook Pro 16 K6602VU | |
| AIDA64 / Memory Latency | |
| Genomsnitt Intel Core Ultra 9 185H (121.4 - 259, n=19) | |
| Samsung Galaxy Book4 Ultra | |
| Dell XPS 16 9640 | |
| Lenovo Yoga Pro 9 16IMH9 RTX 4050 | |
| Lenovo Yoga Pro 9 16IMH9 | |
| HP Envy x360 2-in-1 16-ad0097nr | |
| Asus VivoBook Pro 16 K6602VU | |
* ... mindre är bättre
DPC-fördröjning
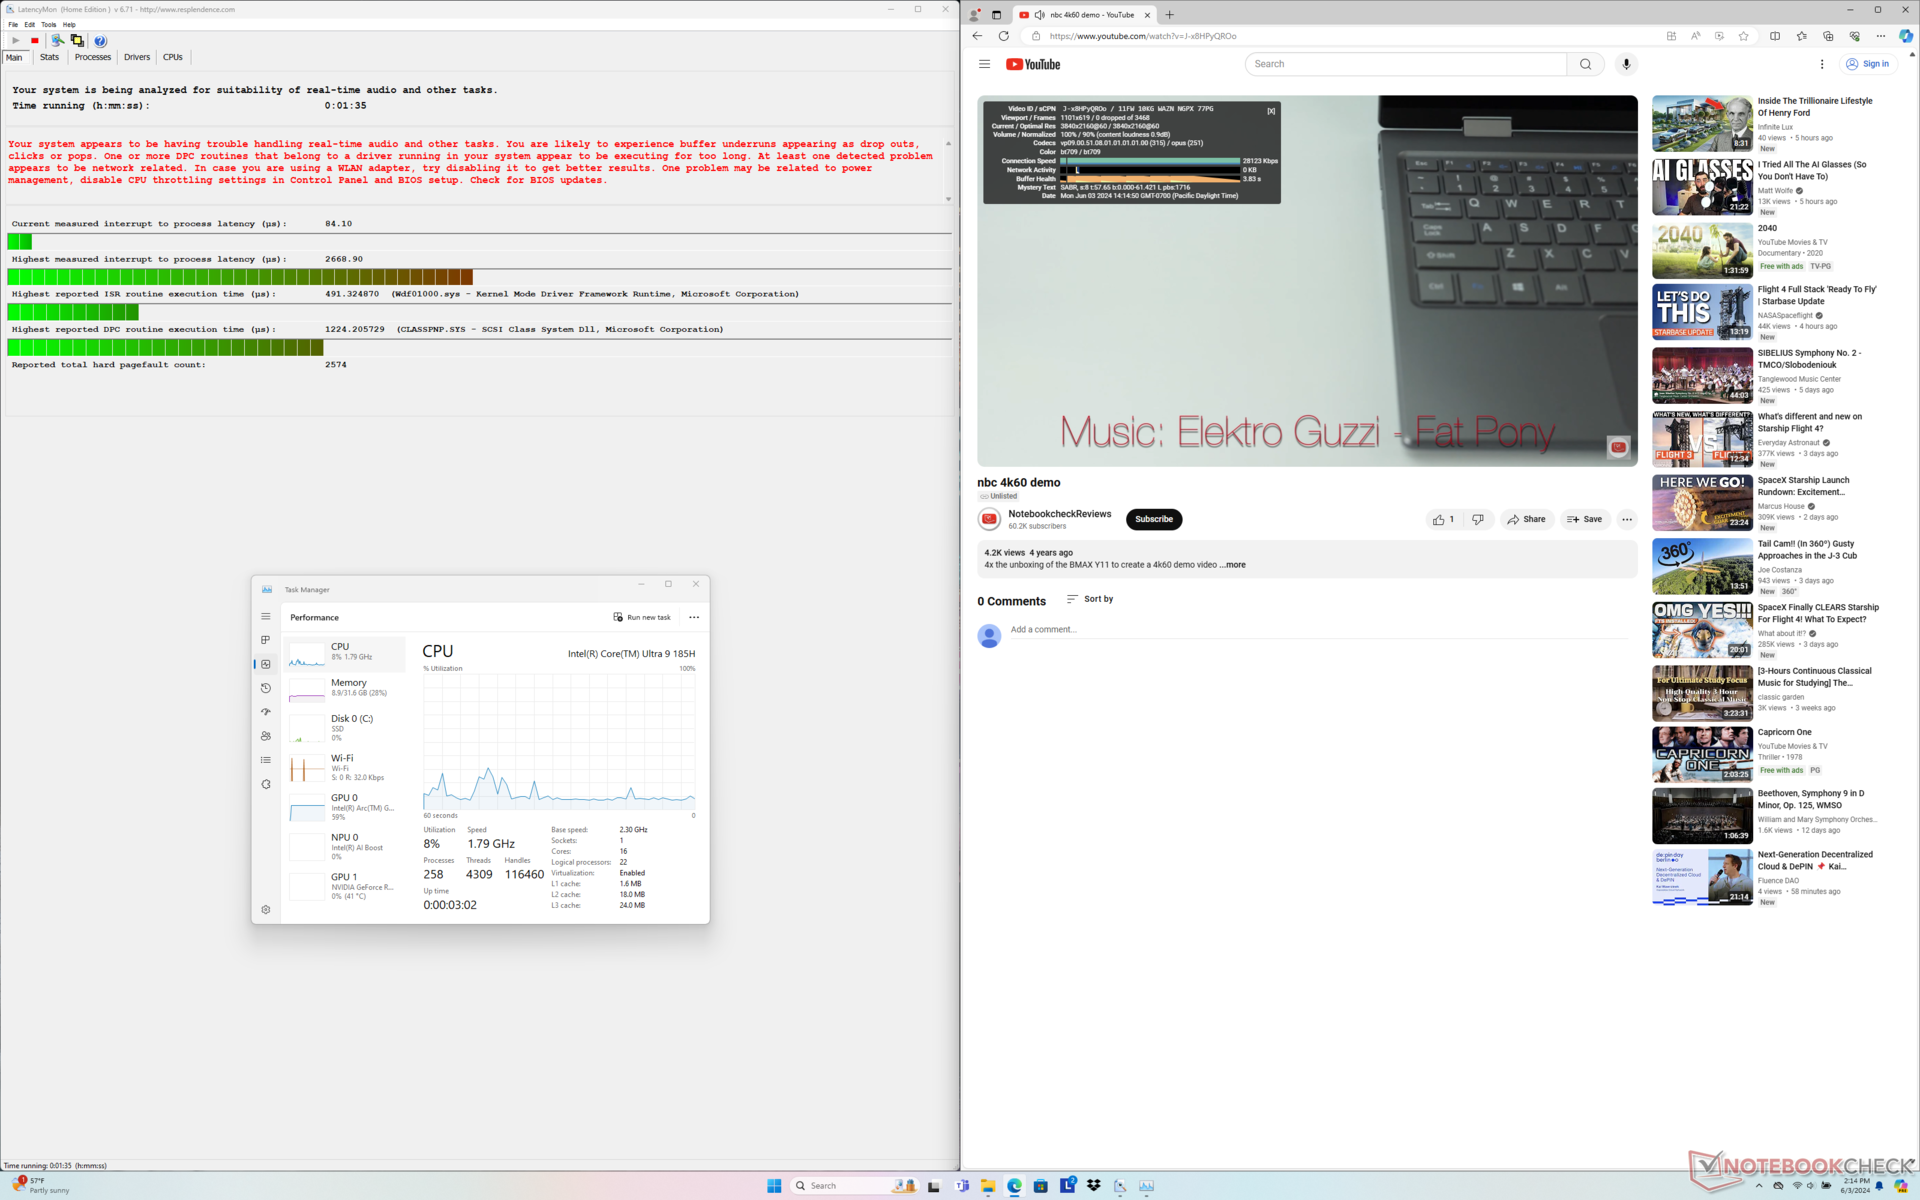
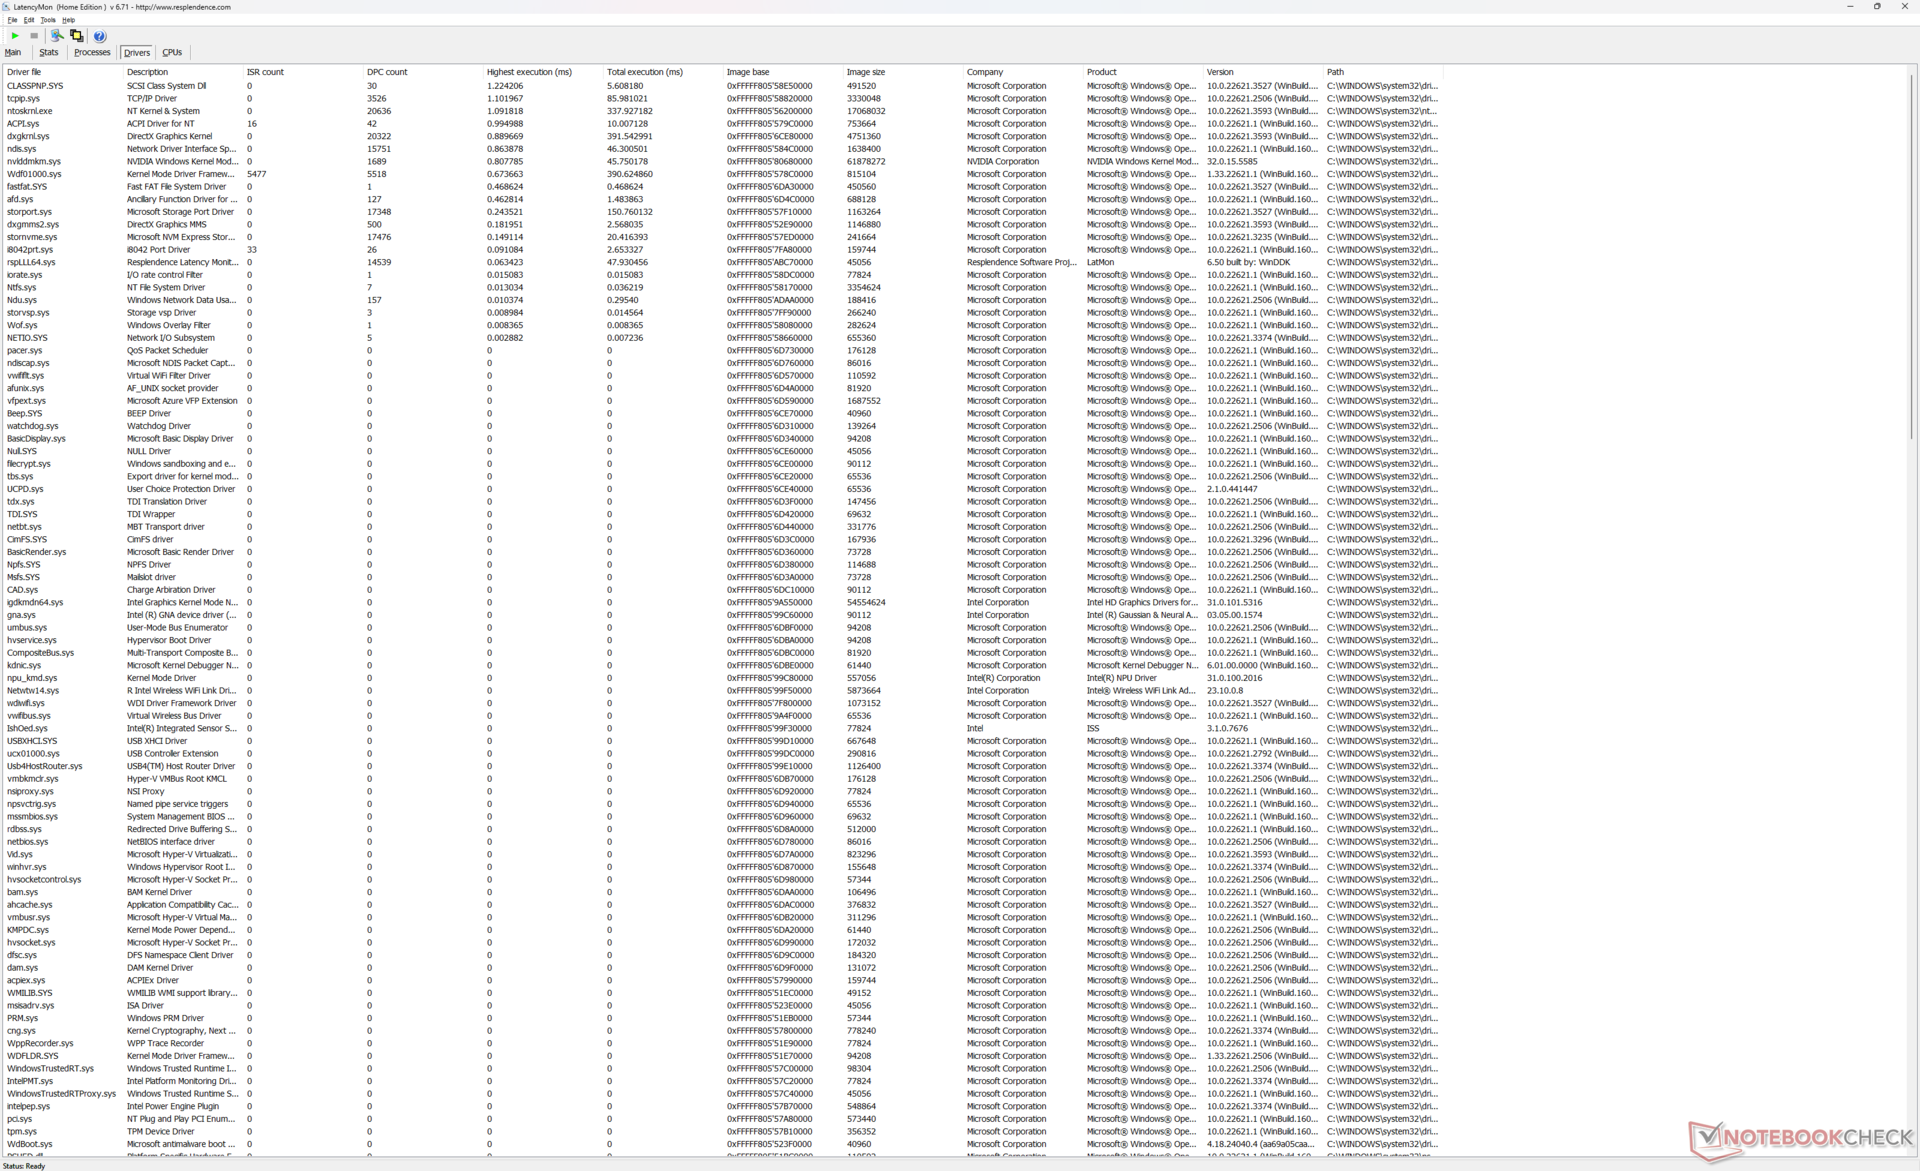
LatencyMon avslöjar fler DPC-problem än RTX 4070-konfigurationen när du öppnar flera webbläsarflikar på vår hemsida. 4K-videouppspelning vid 60 FPS är annars perfekt utan några tappade bildrutor registrerade.
| DPC Latencies / LatencyMon - interrupt to process latency (max), Web, Youtube, Prime95 | |
| Lenovo Yoga Pro 9 16IMH9 RTX 4050 | |
| Asus VivoBook Pro 16 K6602VU | |
| HP Envy x360 2-in-1 16-ad0097nr | |
| Dell XPS 16 9640 | |
| Samsung Galaxy Book4 Ultra | |
| Lenovo Yoga Pro 9 16IMH9 | |
* ... mindre är bättre
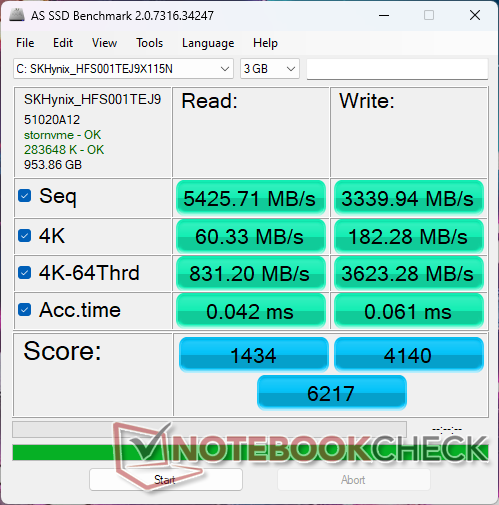
Lagringsenheter
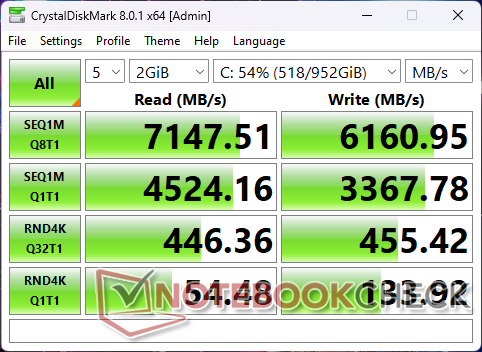
Lenovo levererar samma SK Hynix HFS001TEJ9X115N PCIe4 NVMe SSD mellan de lägsta RTX 4050- och de högsta RTX 4070-konfigurationerna.

| Drive Performance Rating - Percent | |
| Dell XPS 16 9640 | |
| Samsung Galaxy Book4 Ultra | |
| Lenovo Yoga Pro 9 16IMH9 RTX 4050 | |
| Lenovo Yoga Pro 9 16IMH9 | |
| Asus VivoBook Pro 16 K6602VU | |
| HP Envy x360 2-in-1 16-ad0097nr | |
* ... mindre är bättre
Disk Throttling: DiskSpd Read Loop, Queue Depth 8
GPU-prestanda
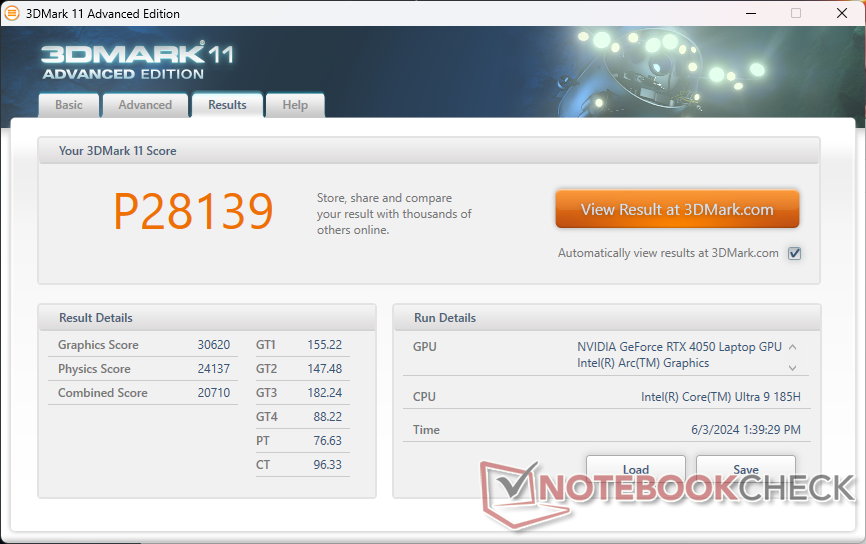
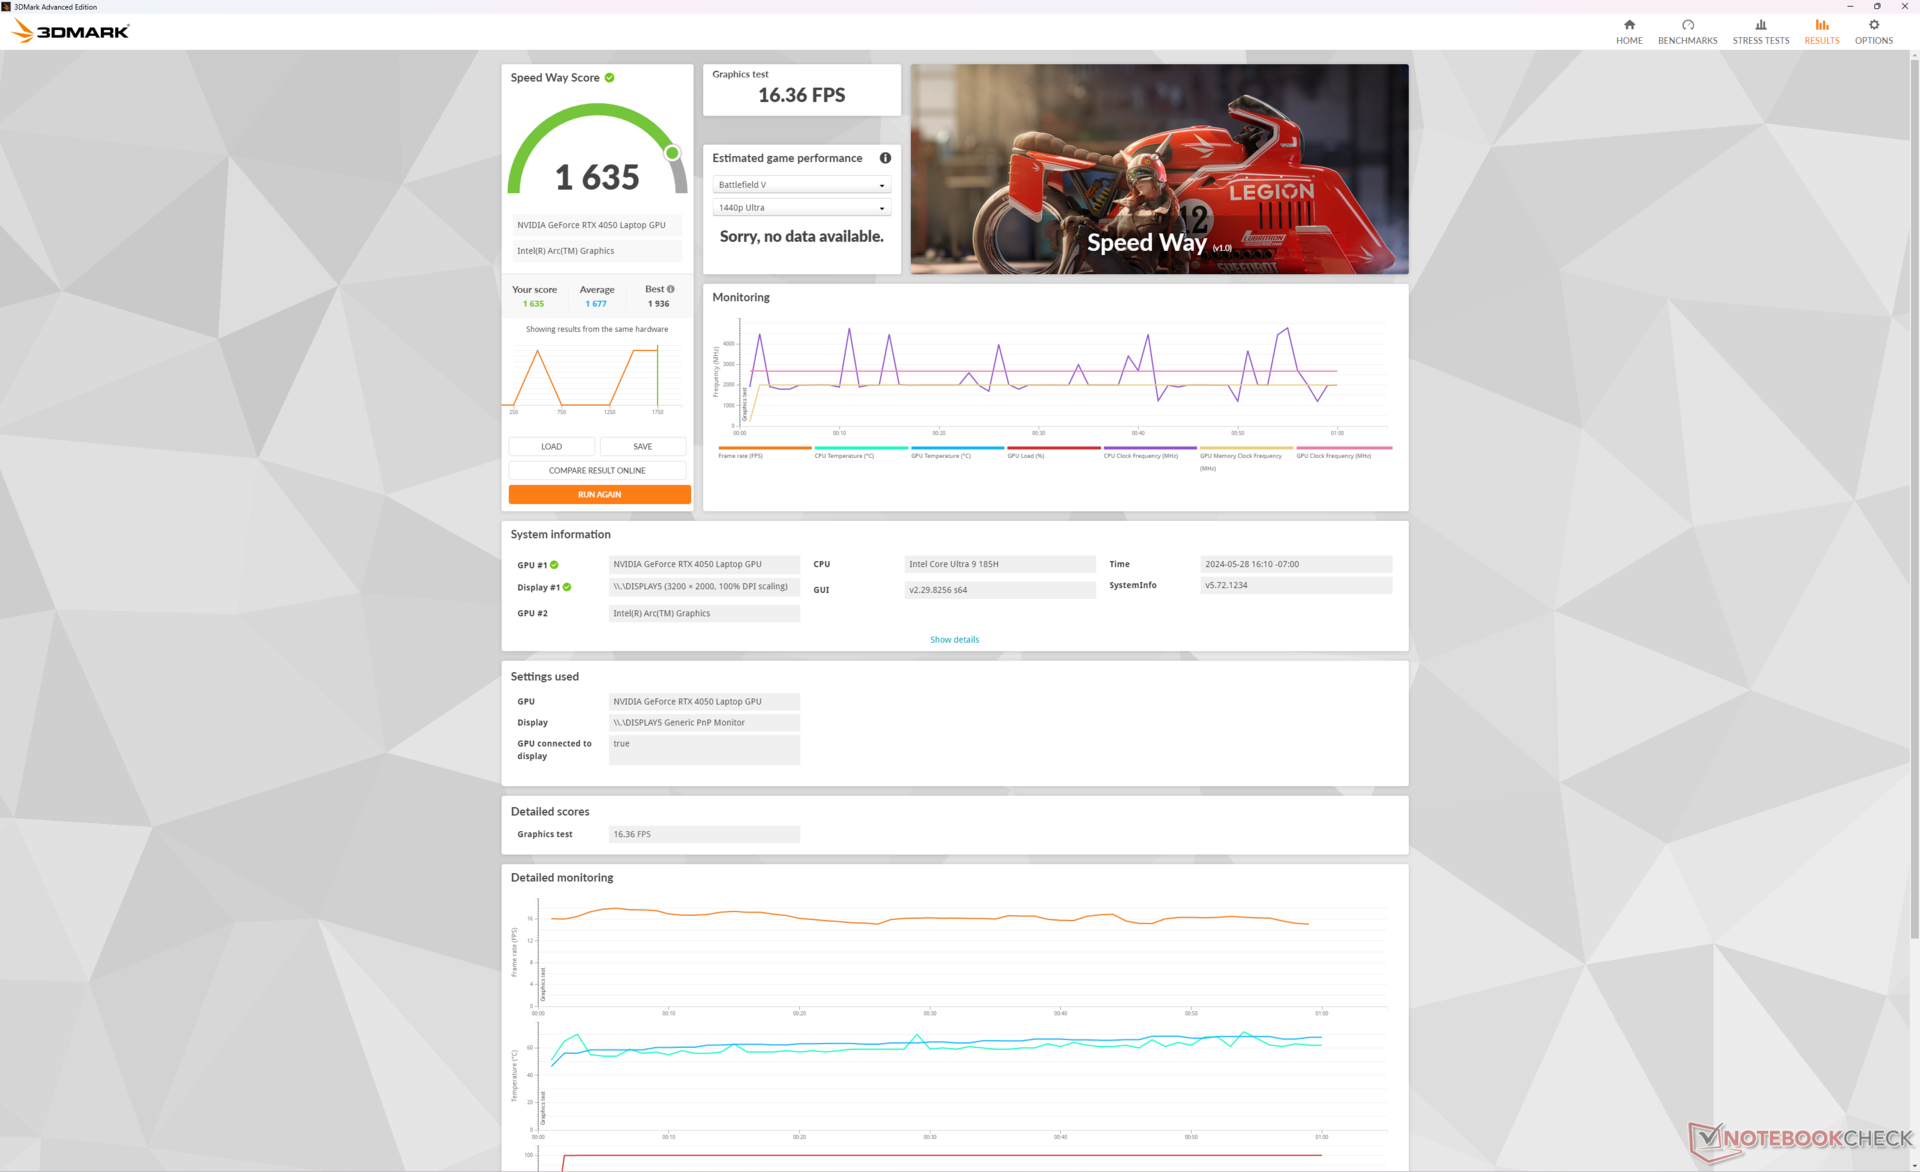
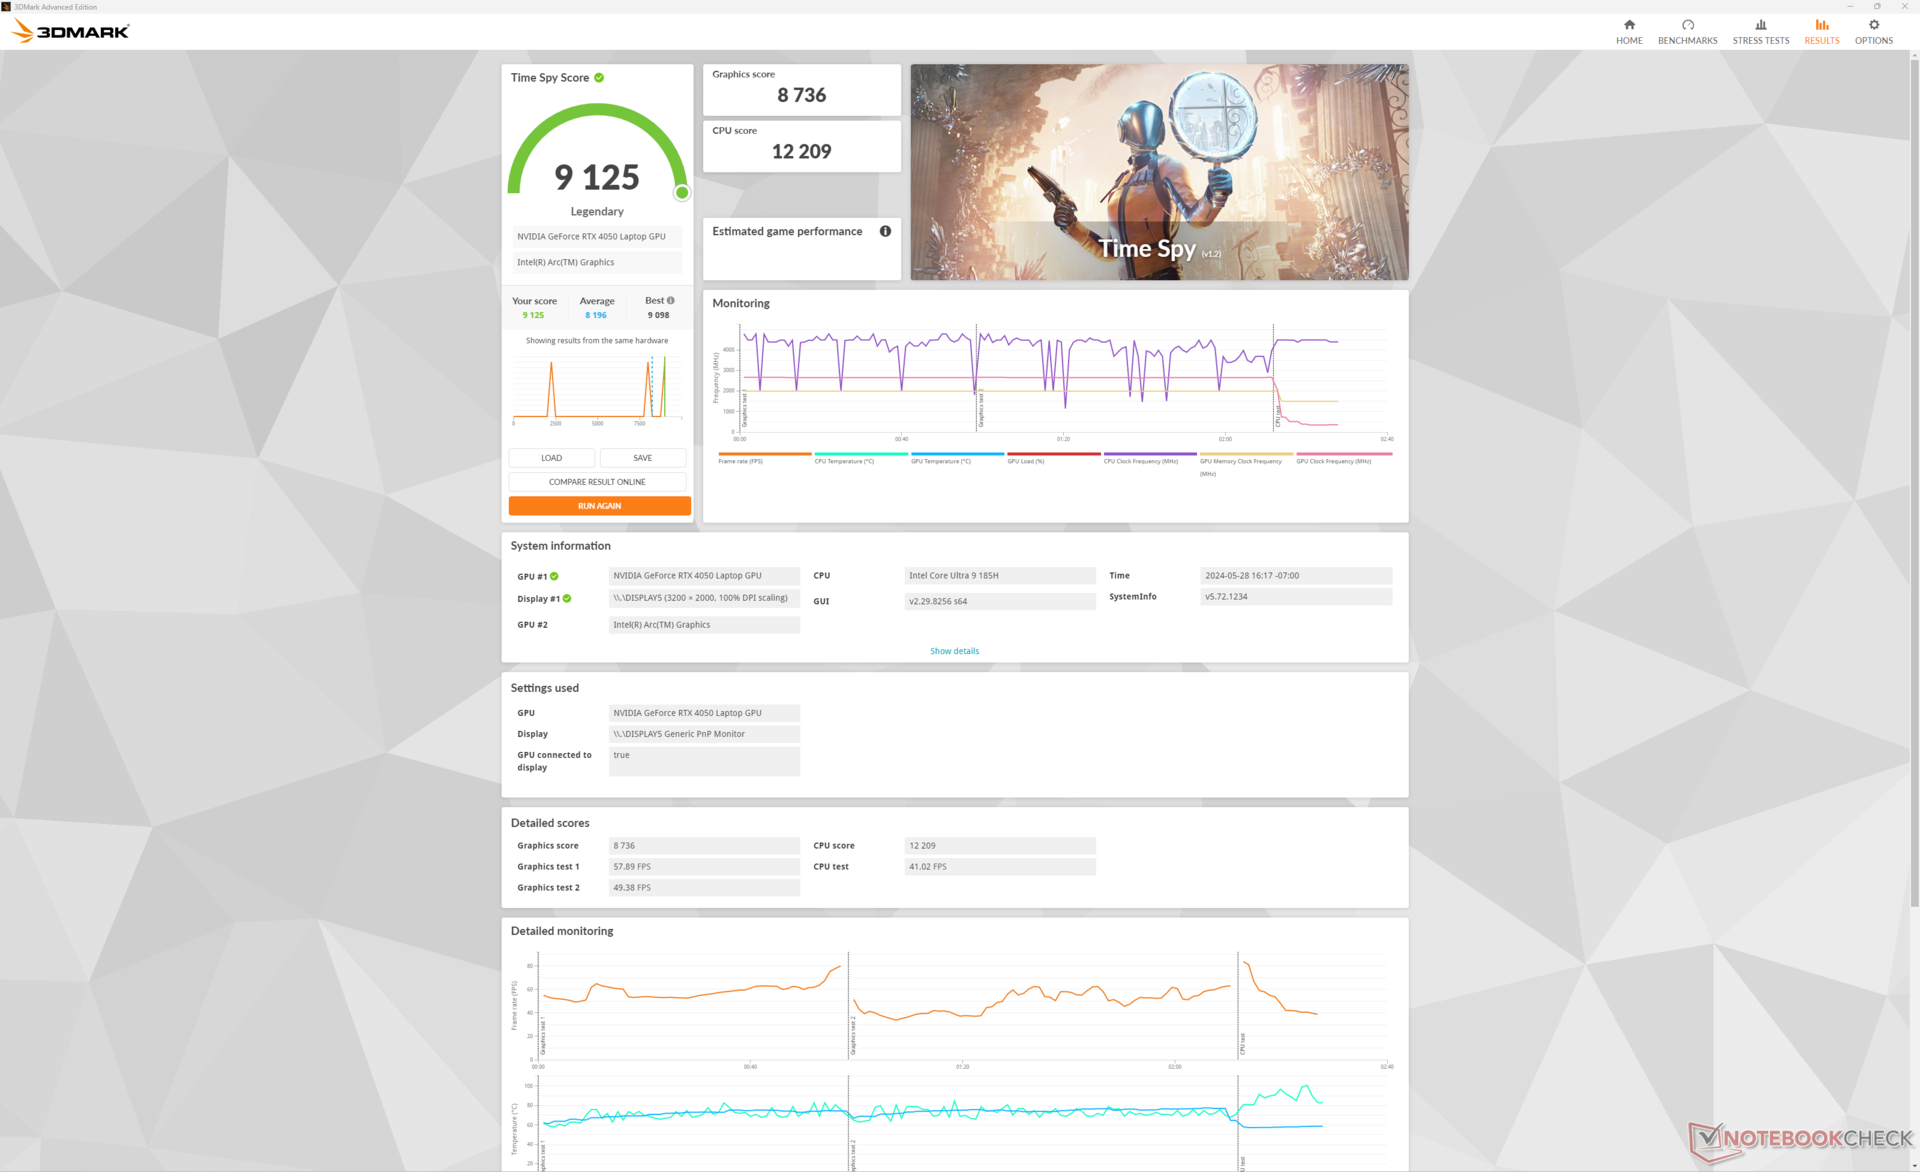
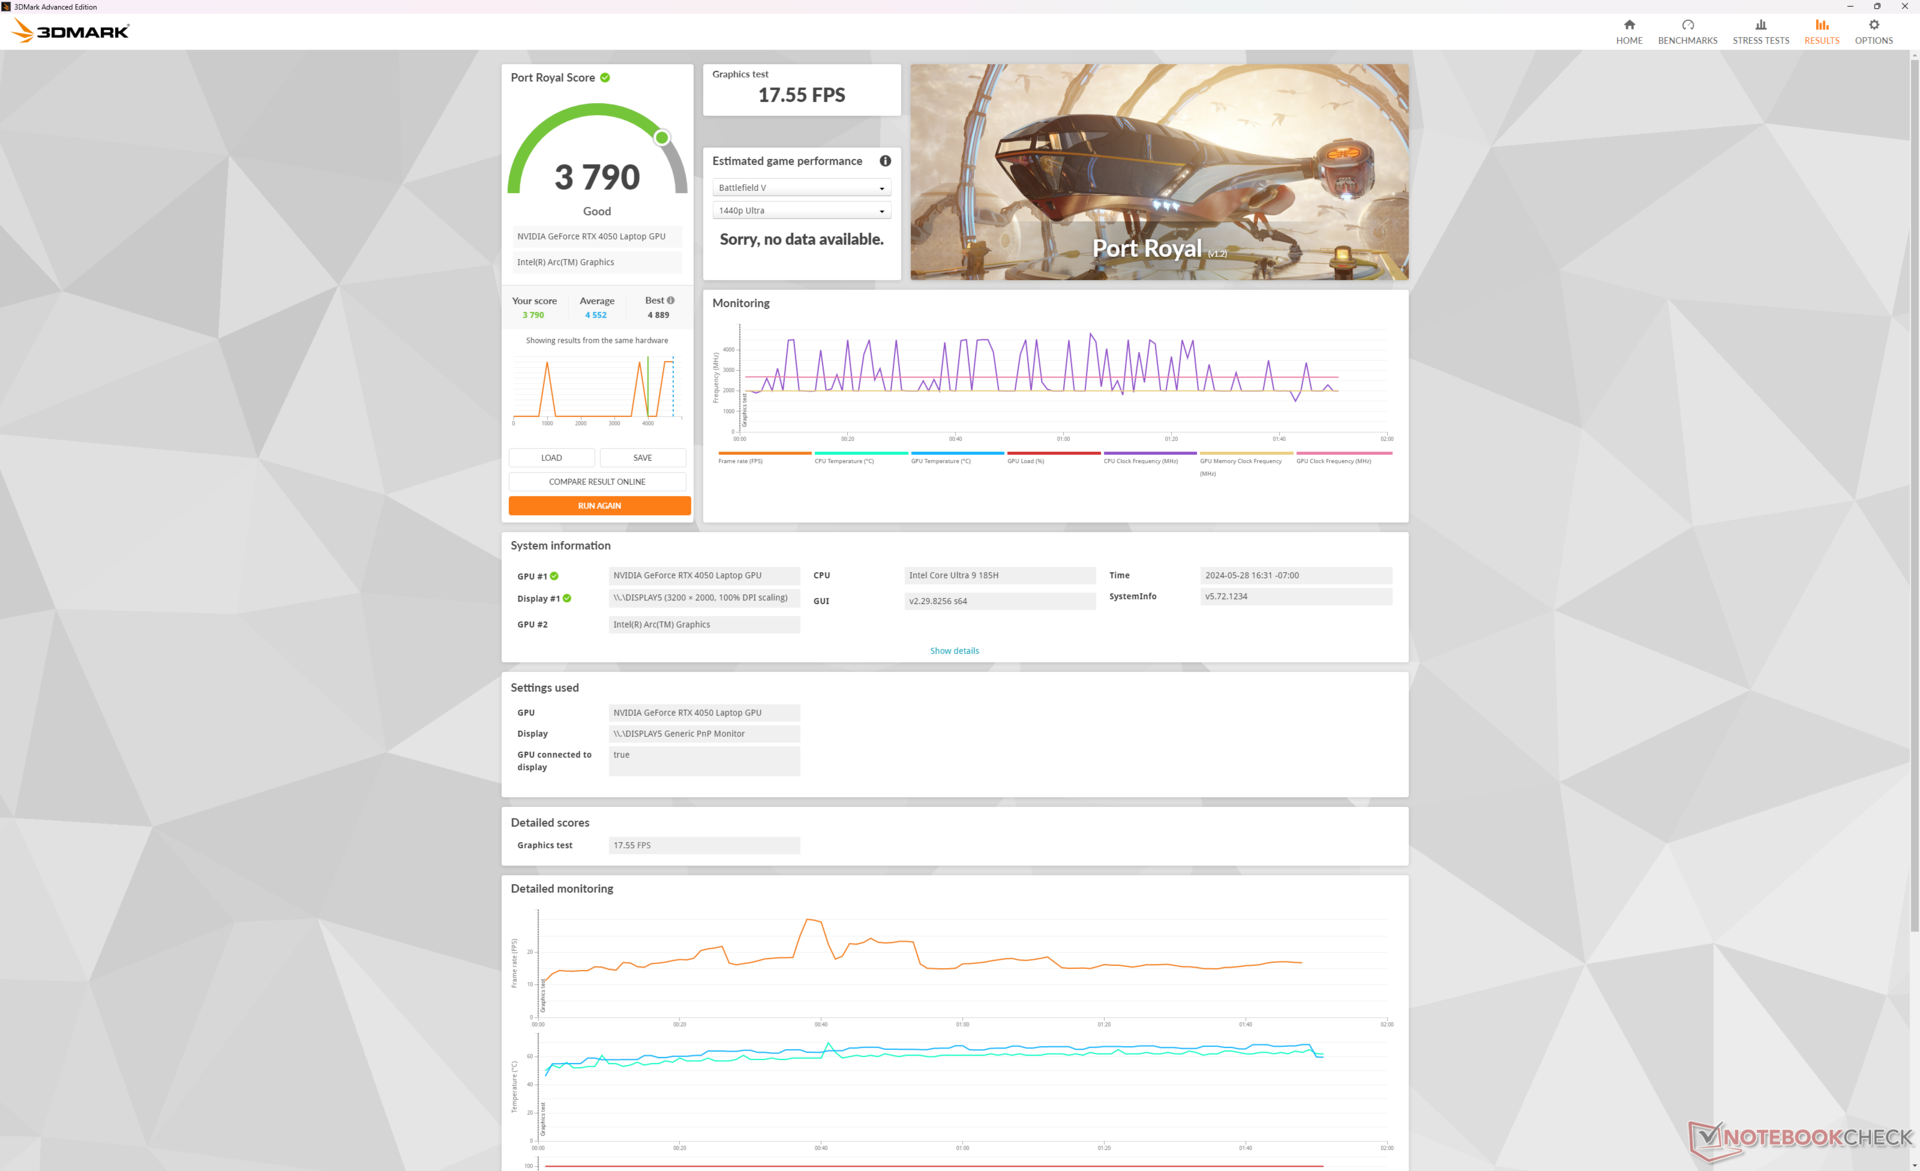
Grafikprestandan är bättre än väntat med 3DMark-resultat som är cirka 10 procent snabbare än den genomsnittliga bärbara datorn i vår databas med samma GeForce RTX 4050 GPU. Denna fördel kan till stor del tillskrivas det höga TGP-målet på 75 W till 100 W i Lenovo eftersom de flesta andra bärbara datorer med samma GPU har lägre TGP-tak. Medan Nvidia-kontrollpanelen hävdar en total grafikeffekt på 100 W för RTX 4050, skulle den vanligtvis stabiliseras på cirka 75 W till 85 W istället när du kör spel som exemplifieras i vårt stresstestavsnitt ovan.
Den totala prestandan är cirka 25 till 30 procent långsammare än RTX 4070 konfigurationen som kan nå högre effektområden mellan 90 W och 100 W. Detta är viktigt att notera för avsnittet om strömförbrukning nedan för prestanda-per-watt-analyser.
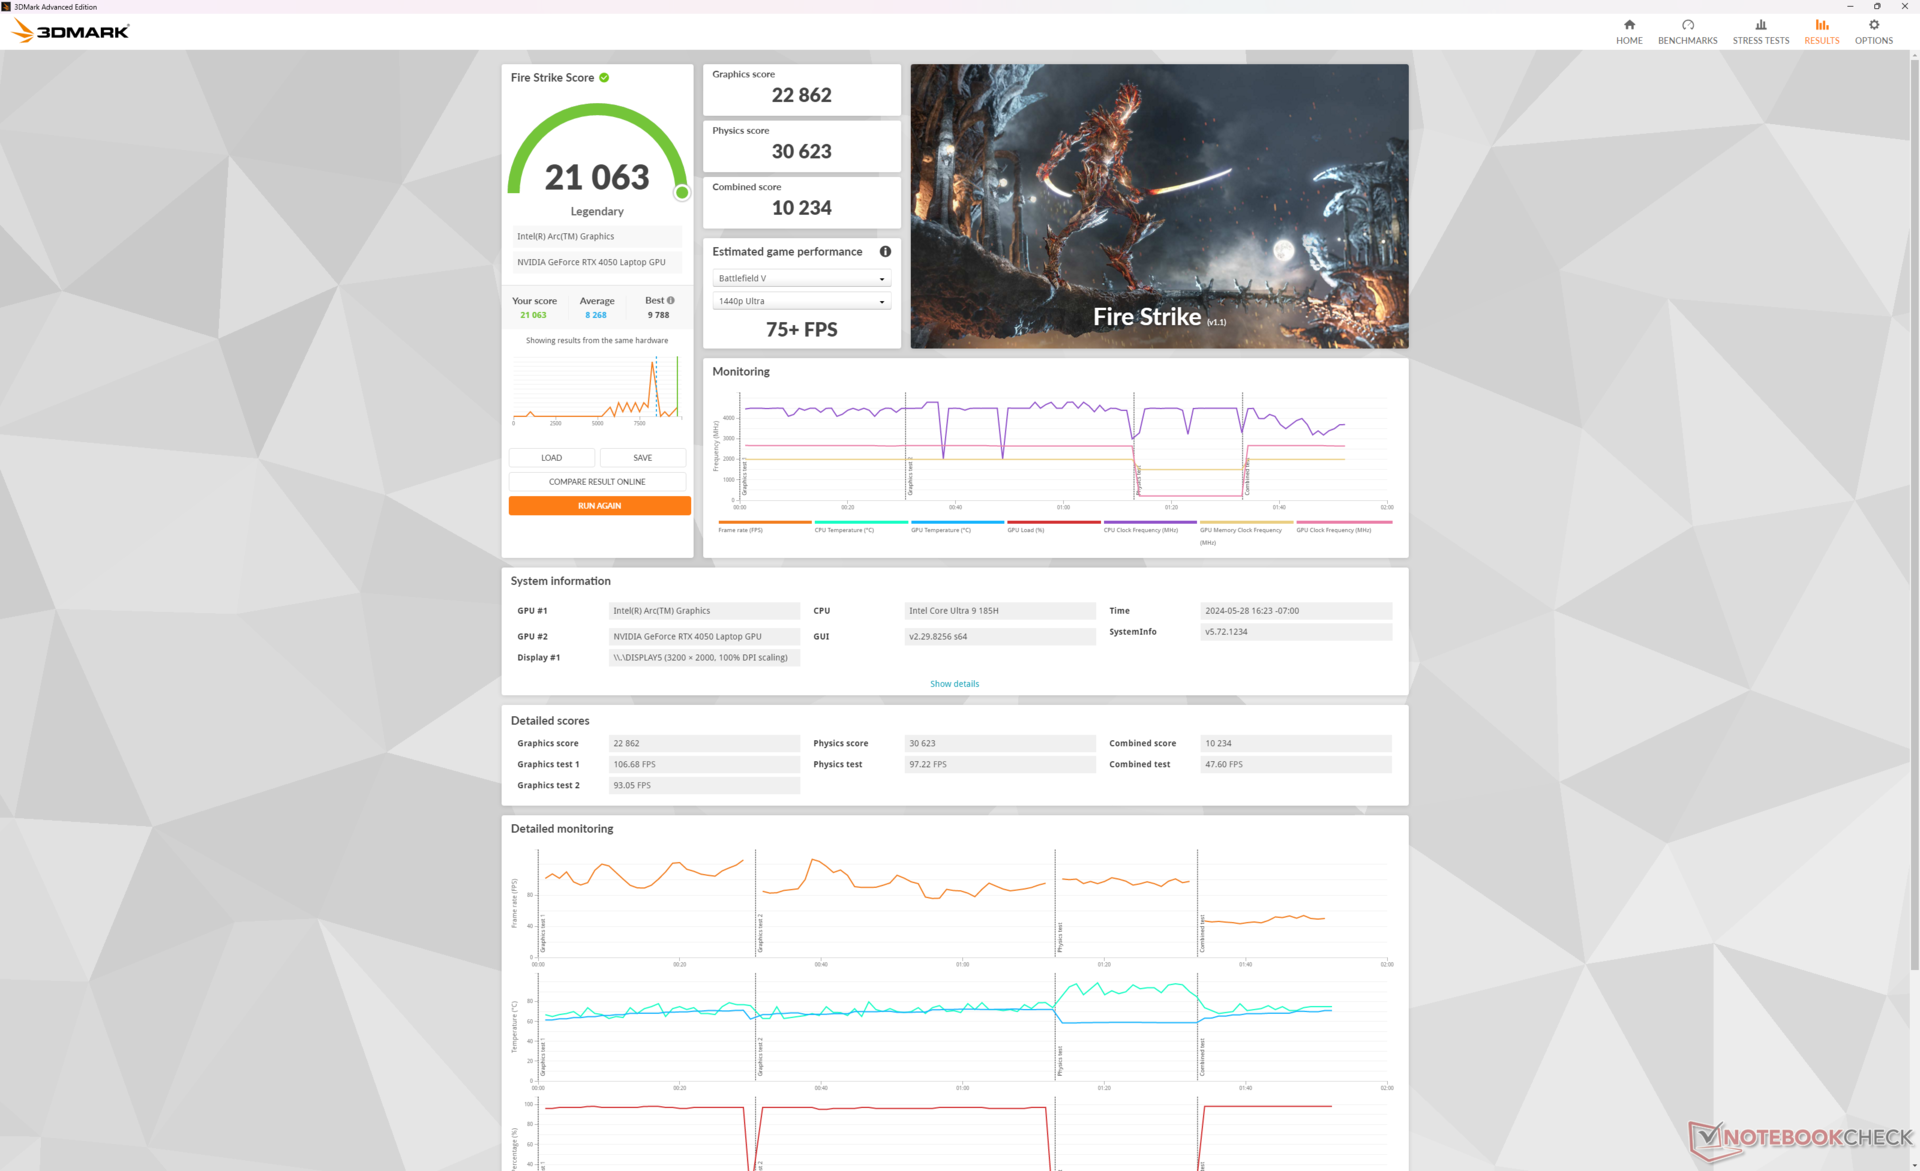
| Effektprofil | Grafikpoäng | Fysikpoäng | Kombinerad poäng |
| Prestanda-läge | 22862 | 30623 | 10234 |
| Balanserat läge | 21008 (-8%) | 29772 (-3%) | 8401 (-18%) |
| Batteridrift | 20095 (-12%) | 30278 (-1%) | 7999 (-22%) |
Att köra i balanserat läge påverkar GPU-prestanda mer än CPU-prestanda, vilket framgår av vår resultattabell Fire Strike.
| 3DMark Performance Rating - Percent | |
| Lenovo Legion 9 16IRX9, RTX 4090 -2! | |
| Alienware m16 R1 AMD -1! | |
| Lenovo Yoga Pro 9 16IMH9 -2! | |
| Lenovo Yoga Pro 9 16IMH9 RTX 4050 | |
| HP Victus 16 (2024) -2! | |
| Genomsnitt NVIDIA GeForce RTX 4050 Laptop GPU | |
| Dell XPS 16 9640 -2! | |
| Framework Laptop 16 -1! | |
| Asus ZenBook Pro 16X OLED UX7602ZM-ME115W -2! | |
| Asus VivoBook Pro 16 K6602VU -1! | |
| Samsung Galaxy Book4 Ultra -2! | |
| MSI Stealth 15M A11SEK -2! | |
| HP Pavilion Plus 16-ab0456tx -3! | |
| HP Envy x360 2-in-1 16-ad0097nr -1! | |
| Lenovo Yoga 7 2-in-1 16IML9 -2! | |
| 3DMark 11 Performance | 28139 poäng | |
| 3DMark Fire Strike Score | 21063 poäng | |
| 3DMark Time Spy Score | 9125 poäng | |
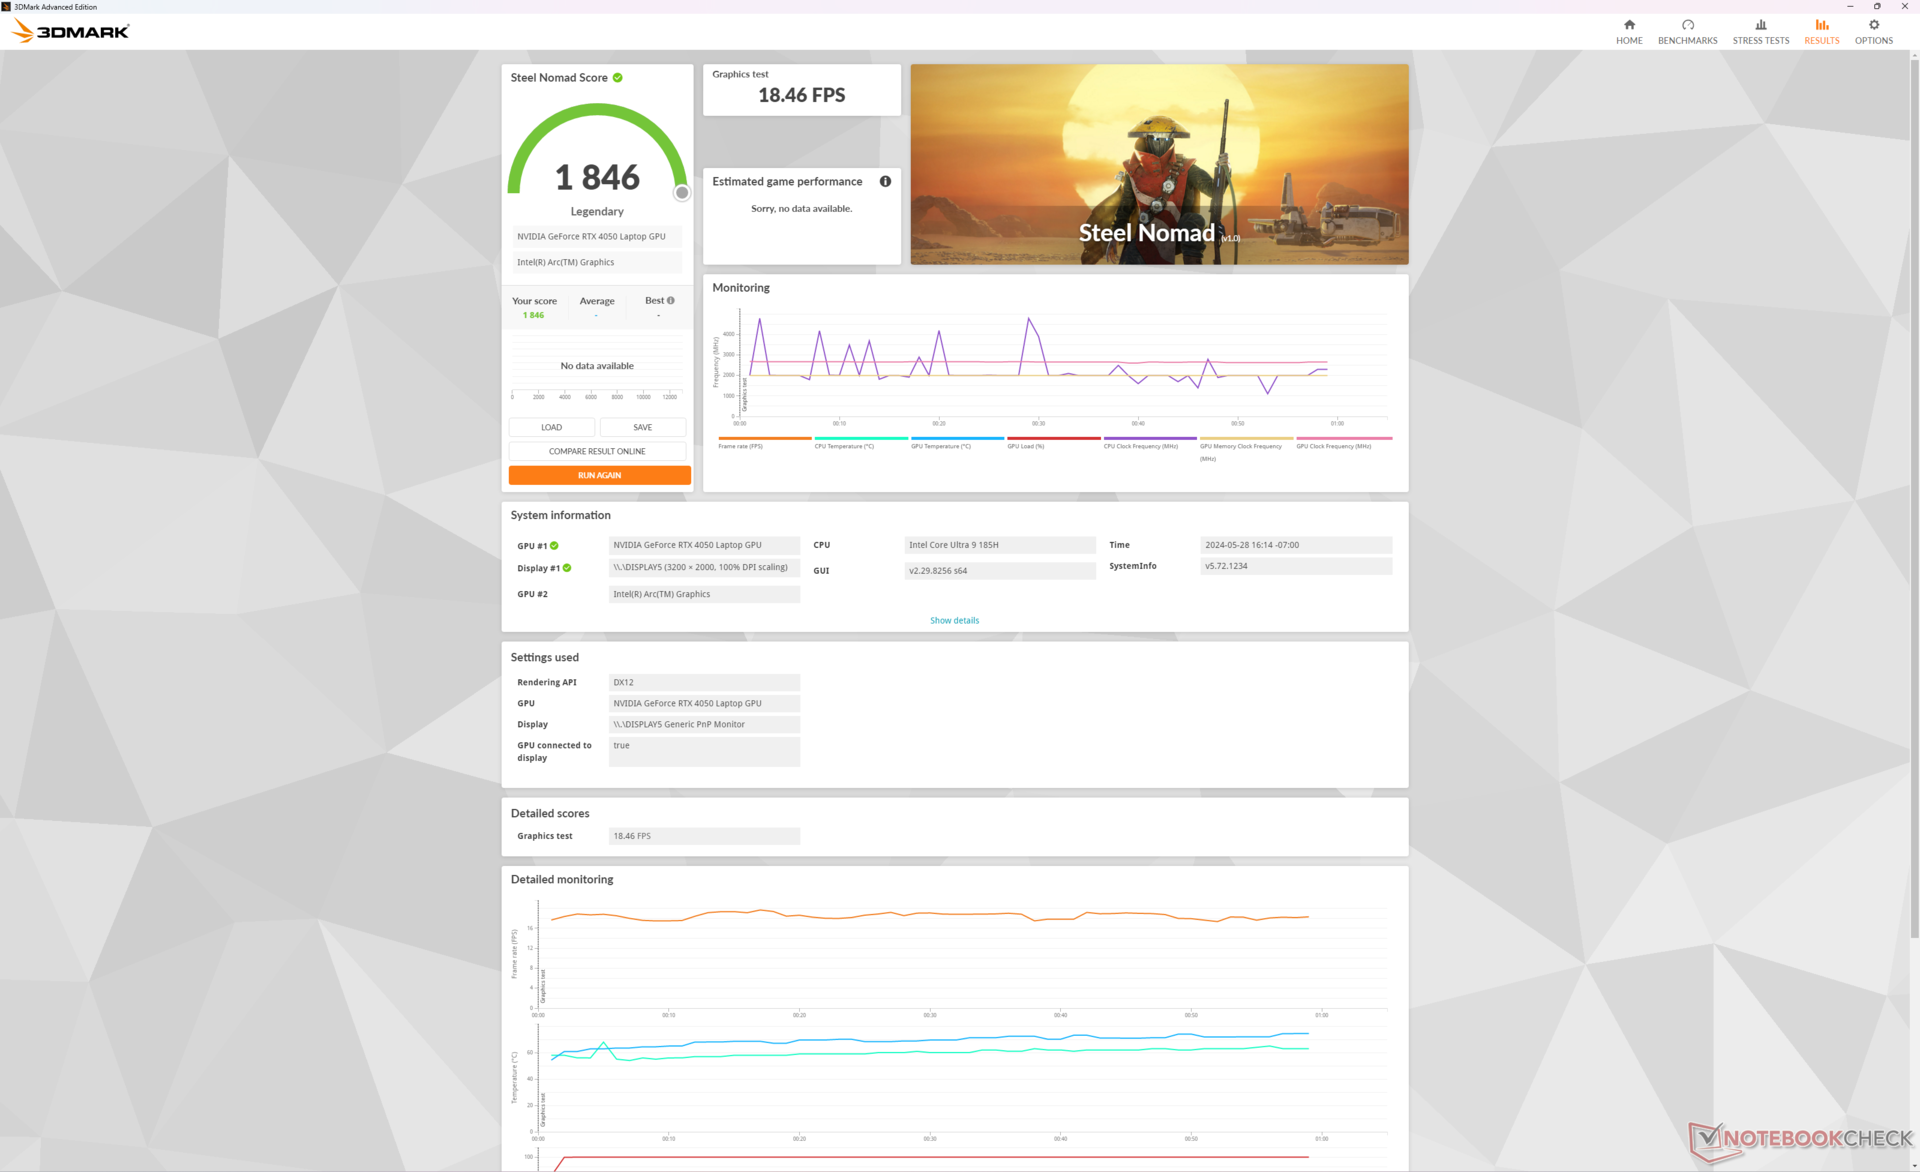
| 3DMark Steel Nomad Score | 1846 poäng | |
Hjälp | ||
* ... mindre är bättre
Prestanda för spel
Systemet är tillräckligt kraftfullt för att köra krävande spel som Cyberpunk 2077 i den inbyggda upplösningen 3200 x 2000 med medelhöga eller lägre inställningar. För bästa resultat rekommenderas dock att aktivera DLSS när det är möjligt för att öka bildhastigheterna till närmare 60+ FPS.
| Performance Rating - Percent | |
| Lenovo Yoga Pro 9 16IMH9 | |
| Lenovo Yoga Pro 9 16IMH9 RTX 4050 | |
| Asus VivoBook Pro 16 K6602VU | |
| Dell XPS 16 9640 | |
| Samsung Galaxy Book4 Ultra | |
| HP Envy x360 2-in-1 16-ad0097nr | |
| The Witcher 3 - 1920x1080 Ultra Graphics & Postprocessing (HBAO+) | |
| Lenovo Yoga Pro 9 16IMH9 | |
| Dell XPS 16 9640 | |
| Lenovo Yoga Pro 9 16IMH9 RTX 4050 | |
| Asus VivoBook Pro 16 K6602VU | |
| Samsung Galaxy Book4 Ultra | |
| HP Envy x360 2-in-1 16-ad0097nr | |
| Final Fantasy XV Benchmark - 1920x1080 High Quality | |
| Lenovo Yoga Pro 9 16IMH9 | |
| Dell XPS 16 9640 | |
| Lenovo Yoga Pro 9 16IMH9 RTX 4050 | |
| Asus VivoBook Pro 16 K6602VU | |
| Samsung Galaxy Book4 Ultra | |
| HP Envy x360 2-in-1 16-ad0097nr | |
| Strange Brigade - 1920x1080 ultra AA:ultra AF:16 | |
| Lenovo Yoga Pro 9 16IMH9 | |
| Dell XPS 16 9640 | |
| Lenovo Yoga Pro 9 16IMH9 RTX 4050 | |
| Asus VivoBook Pro 16 K6602VU | |
| Samsung Galaxy Book4 Ultra | |
| HP Envy x360 2-in-1 16-ad0097nr | |
| Dota 2 Reborn - 1920x1080 ultra (3/3) best looking | |
| Lenovo Yoga Pro 9 16IMH9 | |
| Lenovo Yoga Pro 9 16IMH9 RTX 4050 | |
| Samsung Galaxy Book4 Ultra | |
| Asus VivoBook Pro 16 K6602VU | |
| Dell XPS 16 9640 | |
| HP Envy x360 2-in-1 16-ad0097nr | |
| X-Plane 11.11 - 1920x1080 high (fps_test=3) | |
| Asus VivoBook Pro 16 K6602VU | |
| Lenovo Yoga Pro 9 16IMH9 | |
| Lenovo Yoga Pro 9 16IMH9 RTX 4050 | |
| Dell XPS 16 9640 | |
| Dell XPS 16 9640 | |
| Samsung Galaxy Book4 Ultra | |
| HP Envy x360 2-in-1 16-ad0097nr | |
Witcher 3 FPS Chart
| låg | med. | hög | ultra | QHD | |
|---|---|---|---|---|---|
| The Witcher 3 (2015) | 395.6 | 290.5 | 164 | 83.7 | 61 |
| Dota 2 Reborn (2015) | 174.6 | 148.7 | 145.1 | 138.5 | |
| Final Fantasy XV Benchmark (2018) | 182.4 | 121.5 | 84.2 | 61.6 | |
| X-Plane 11.11 (2018) | 134.8 | 117.7 | 89.4 | ||
| Far Cry 5 (2018) | 151 | 129 | 121 | 113 | 86 |
| Strange Brigade (2018) | 432 | 213 | 170.9 | 150 | 99.7 |
| Tiny Tina's Wonderlands (2022) | 181.1 | 141.8 | 93.3 | 72.3 | 49.5 |
| F1 22 (2022) | 221 | 219 | 171.5 | 53.4 | 34 |
| Baldur's Gate 3 (2023) | 112.3 | 91.9 | 83.5 | 81.3 | 55 |
| Cyberpunk 2077 2.2 Phantom Liberty (2023) | 101.9 | 79.6 | 67.8 | 58.3 | 36.4 |
Utsläpp
Systembuller
Fläktljudet är nästan identiskt med det vi registrerade på den högre RTX 4070-konfigurationen, vilket tyder på att den svagare RTX 4050-konfigurationen inte är tystare trots sin långsammare GPU.
Ljudnivå
| Låg belastning |
| 23.6 / 25.4 / 25.4 dB(A) |
| Hög belastning |
| 44.2 / 52.6 dB(A) |
 | ||
30 dB tyst 40 dB(A) hörbar 50 dB(A) högt ljud |
||
min: | ||
| Lenovo Yoga Pro 9 16IMH9 RTX 4050 NVIDIA GeForce RTX 4050 Laptop GPU, Ultra 9 185H, SK Hynix HFS001TEJ9X115N | Lenovo Yoga Pro 9 16IMH9 NVIDIA GeForce RTX 4070 Laptop GPU, Ultra 9 185H, SK Hynix HFS001TEJ9X115N | HP Envy x360 2-in-1 16-ad0097nr Radeon 780M, R7 8840HS, KIOXIA BG5 KBG50ZNV1T02 | Dell XPS 16 9640 NVIDIA GeForce RTX 4070 Laptop GPU, Ultra 7 155H, Kioxia XG8 KXG80ZNV1T02 | Samsung Galaxy Book4 Ultra NVIDIA GeForce RTX 4050 Laptop GPU, Ultra 7 155H, Samsung PM9A1 MZVL2512HCJQ | Asus VivoBook Pro 16 K6602VU NVIDIA GeForce RTX 4050 Laptop GPU, i9-13900H, Micron 2400 MTFDKBA1T0QFM | |
|---|---|---|---|---|---|---|
| Noise | -2% | 14% | 0% | 8% | -2% | |
| av / miljö * | 23.6 | 24.3 -3% | 22.9 3% | 24.5 -4% | 24.2 -3% | 20.96 11% |
| Idle Minimum * | 23.6 | 24.3 -3% | 23 3% | 24.5 -4% | 24.2 -3% | 25.28 -7% |
| Idle Average * | 25.4 | 24.3 4% | 23 9% | 24.5 4% | 24.2 5% | 25.28 -0% |
| Idle Maximum * | 25.4 | 25.8 -2% | 23 9% | 27.5 -8% | 24.2 5% | 25.28 -0% |
| Load Average * | 44.2 | 48.1 -9% | 23.8 46% | 39.6 10% | 37.9 14% | 51.88 -17% |
| Witcher 3 ultra * | 48.9 | 49.7 -2% | 43.8 10% | 49.7 -2% | 41.7 15% | 49 -0% |
| Load Maximum * | 52.6 | 53.9 -2% | 43.8 17% | 49.7 6% | 41.7 21% | 51.8 2% |
* ... mindre är bättre
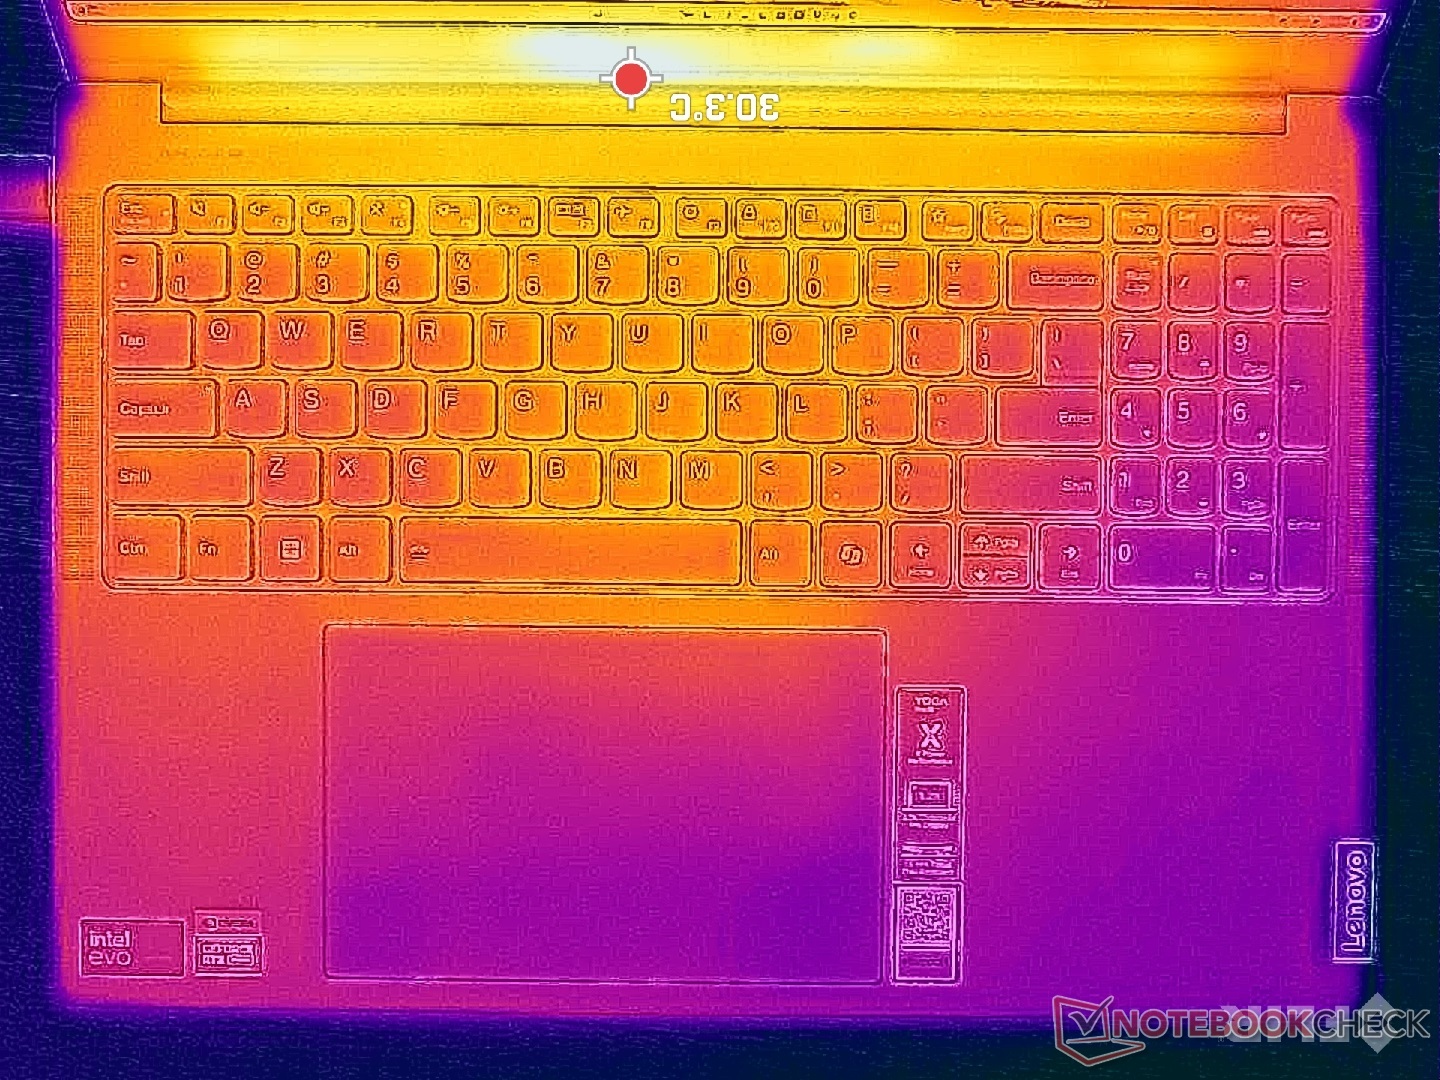
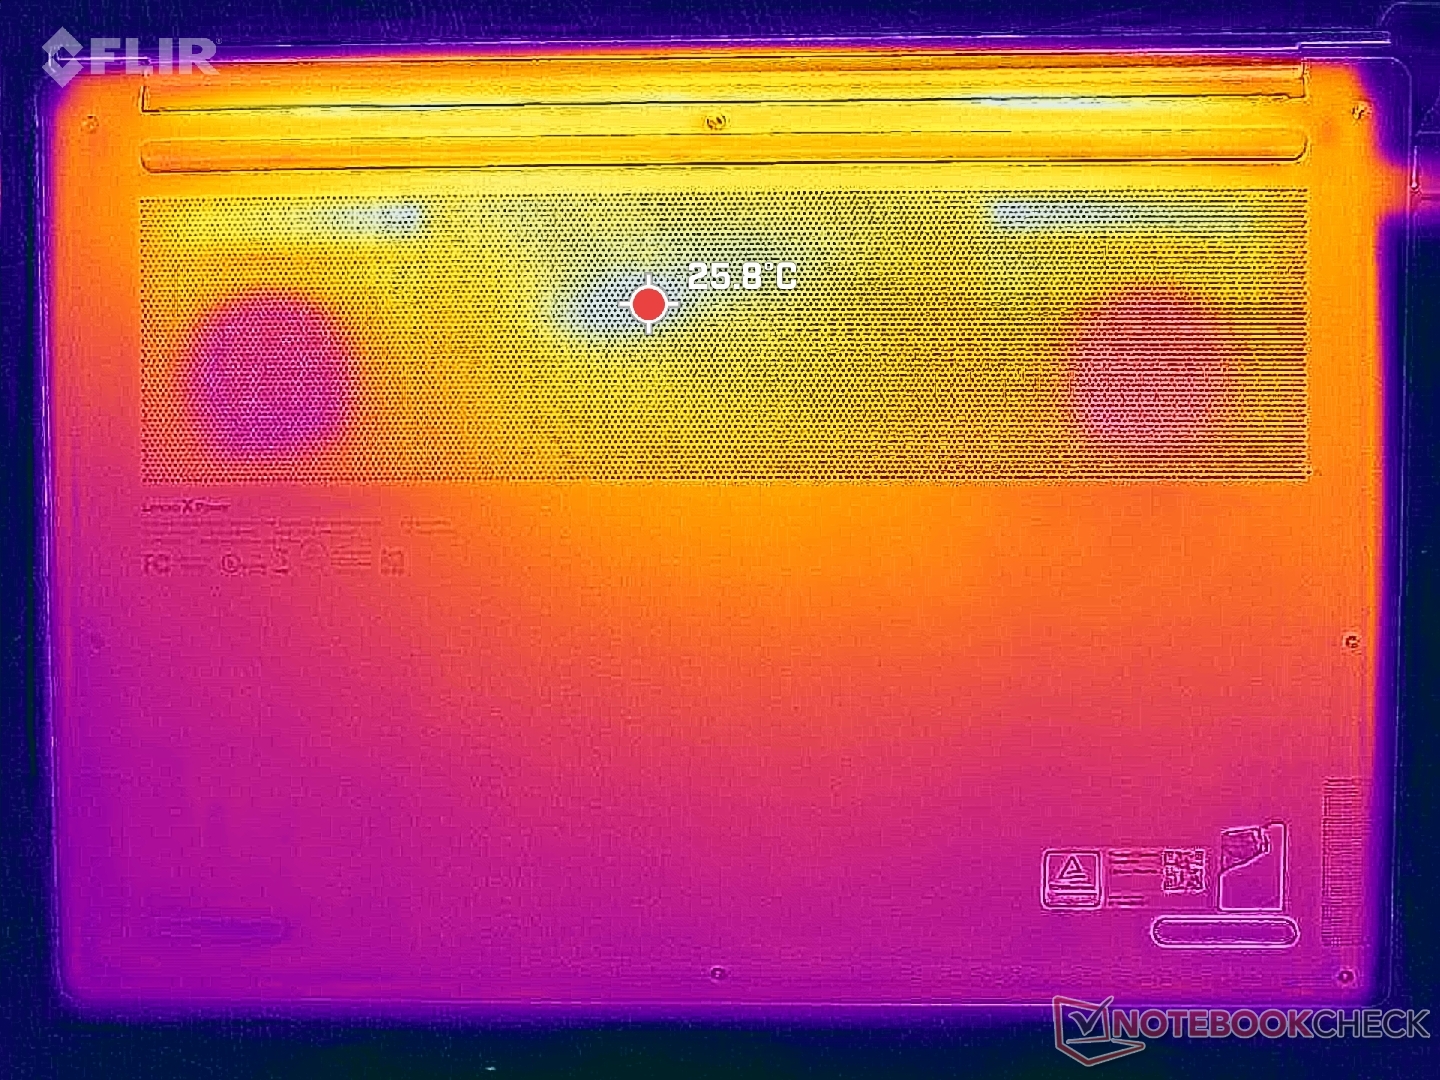
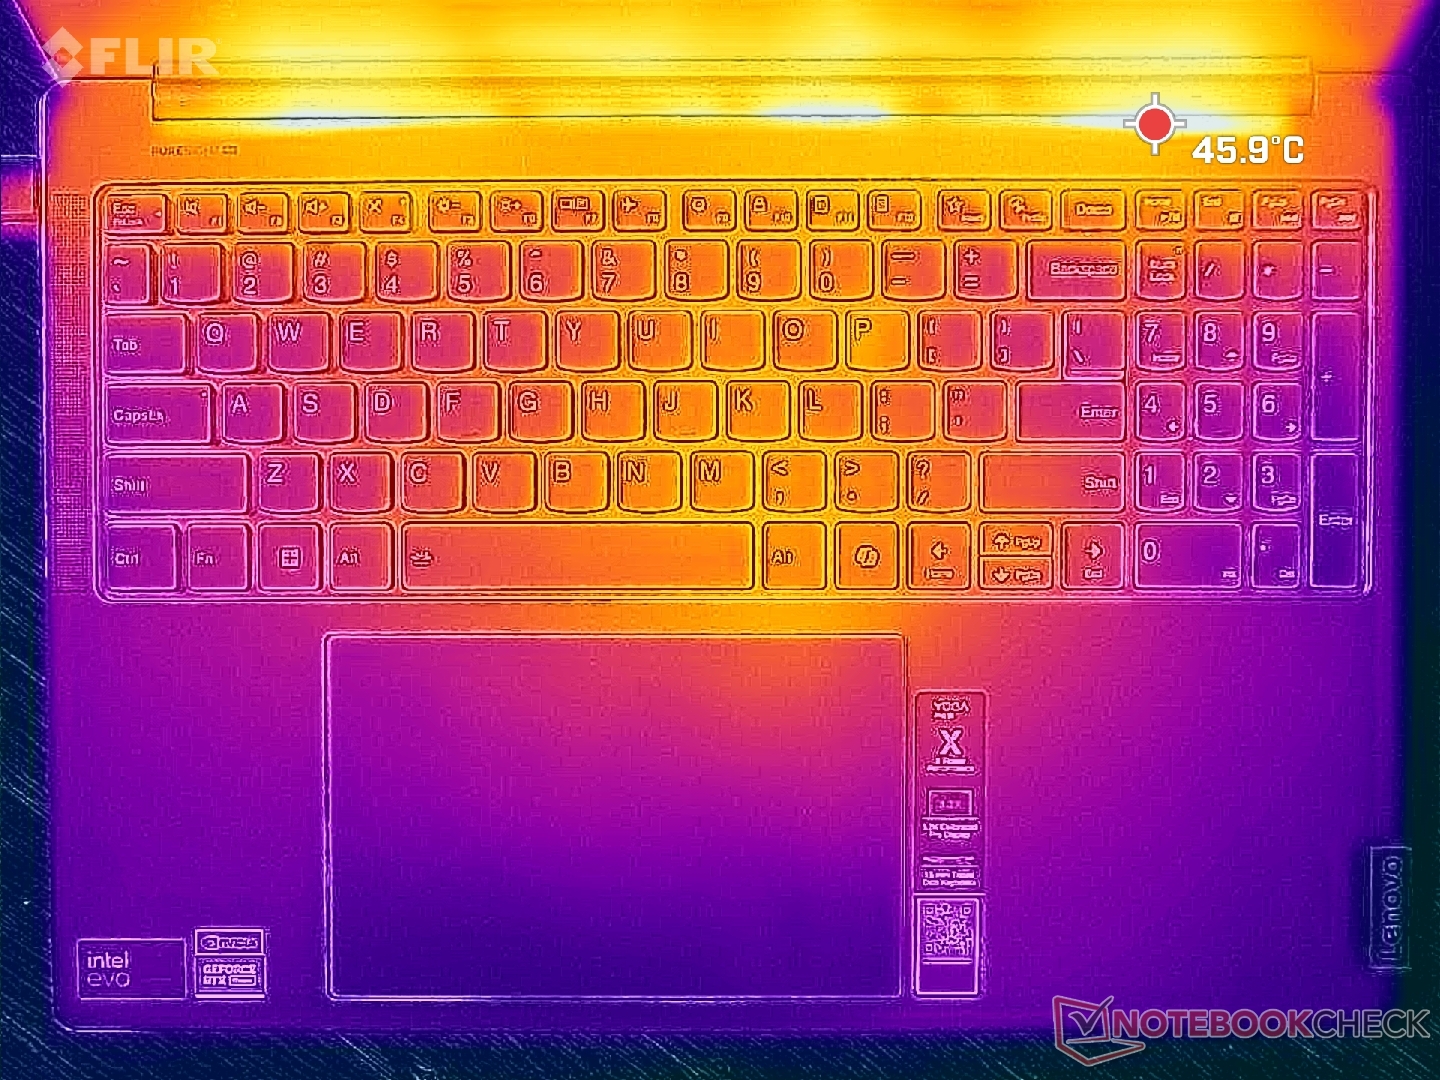
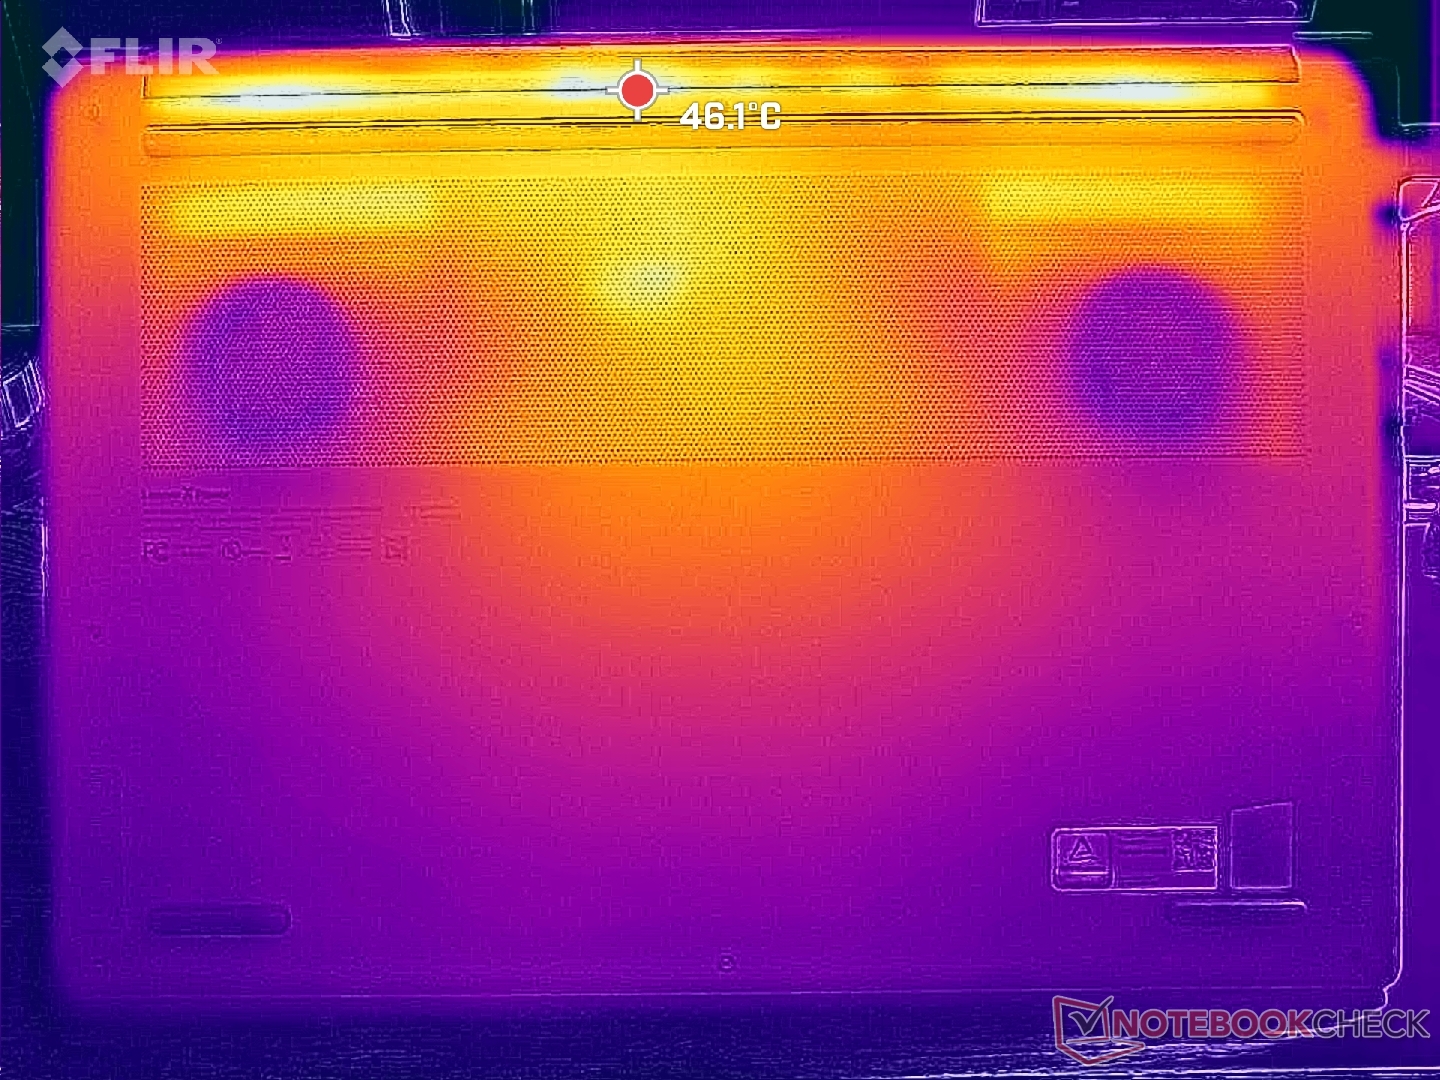
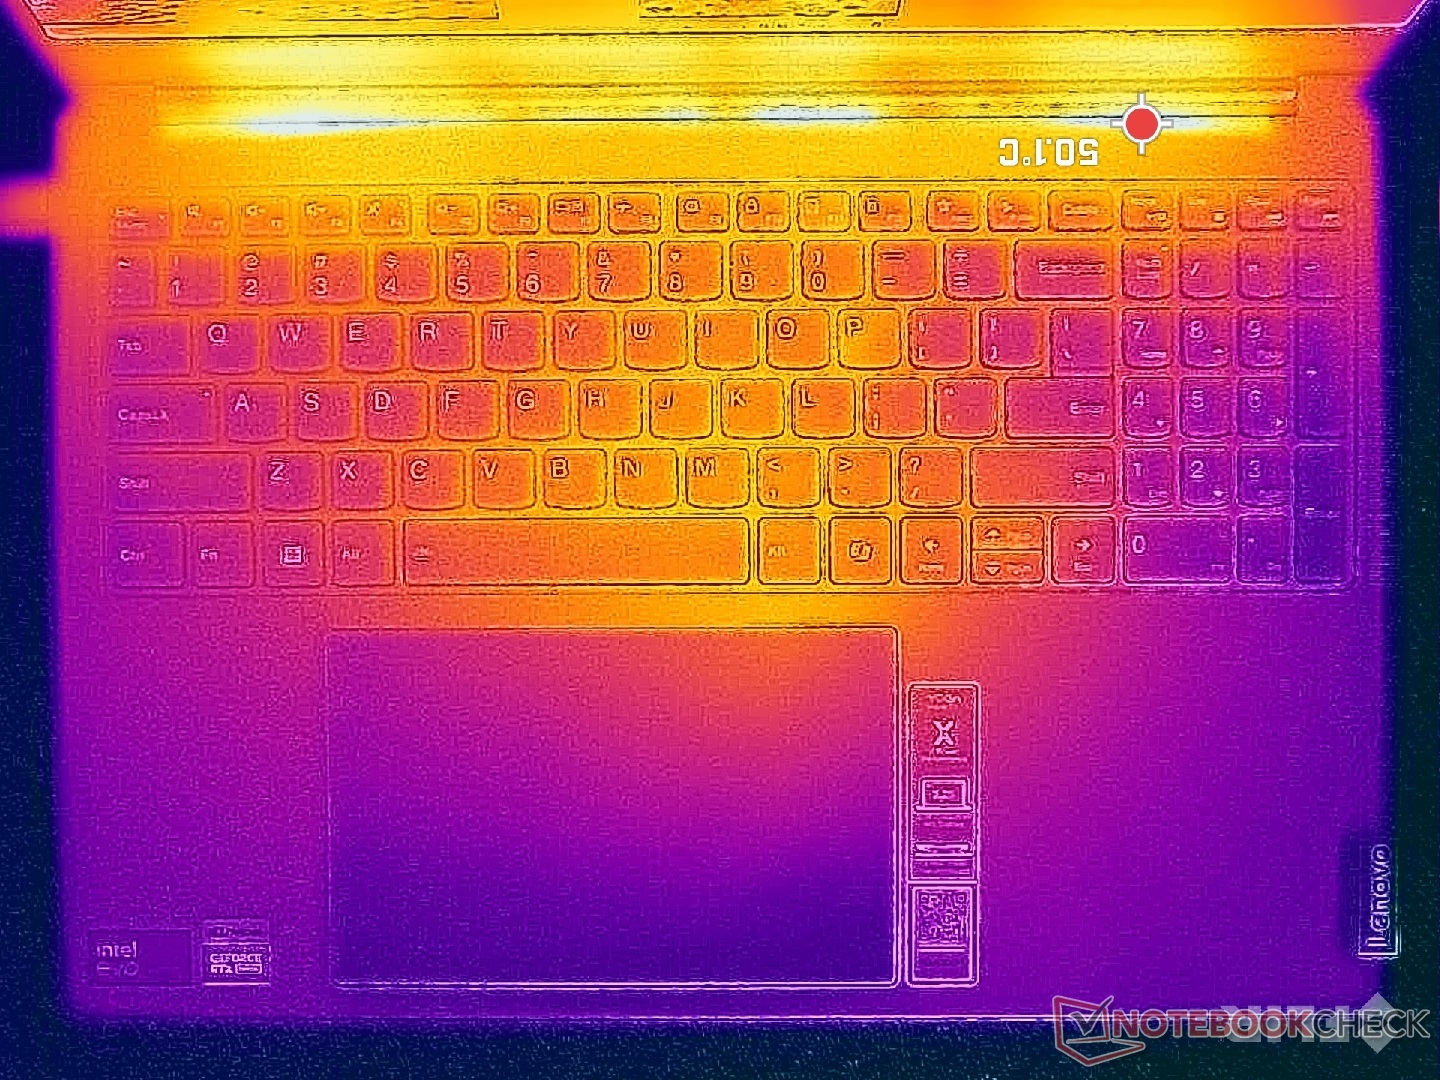
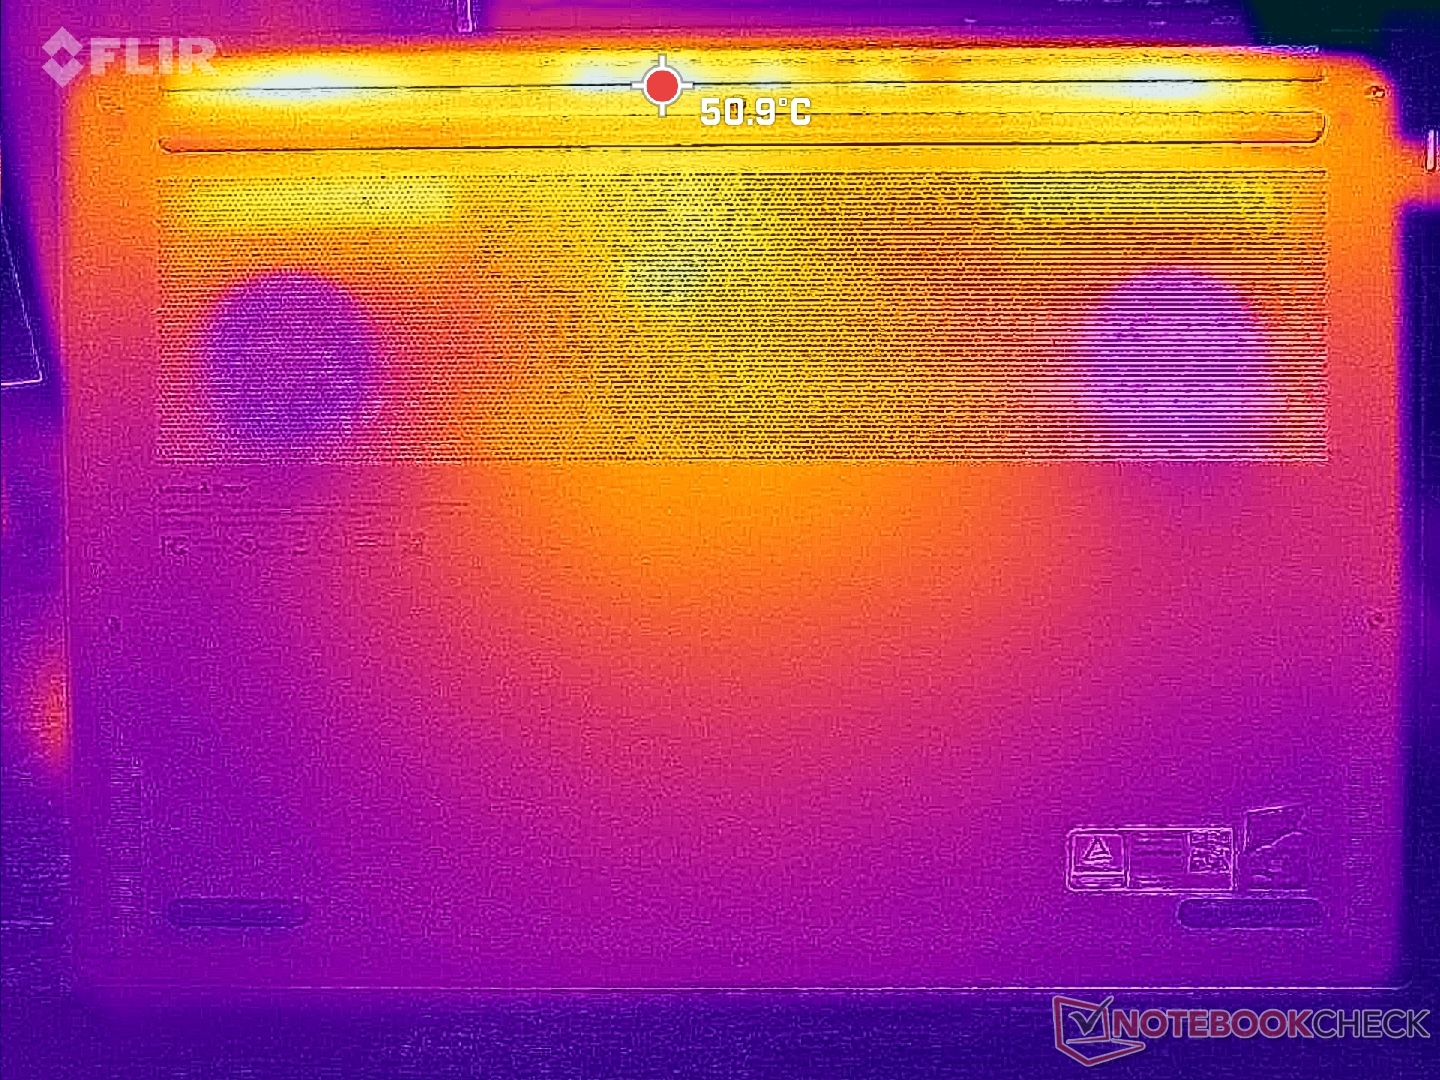
Temperatur
Hot spots kan nå över 41 C när man kör krävande belastningar, vilket är flera grader svalare än vad vi registrerade på Asus VivoBook Pro 16 med samma RTX 4050 GPU.
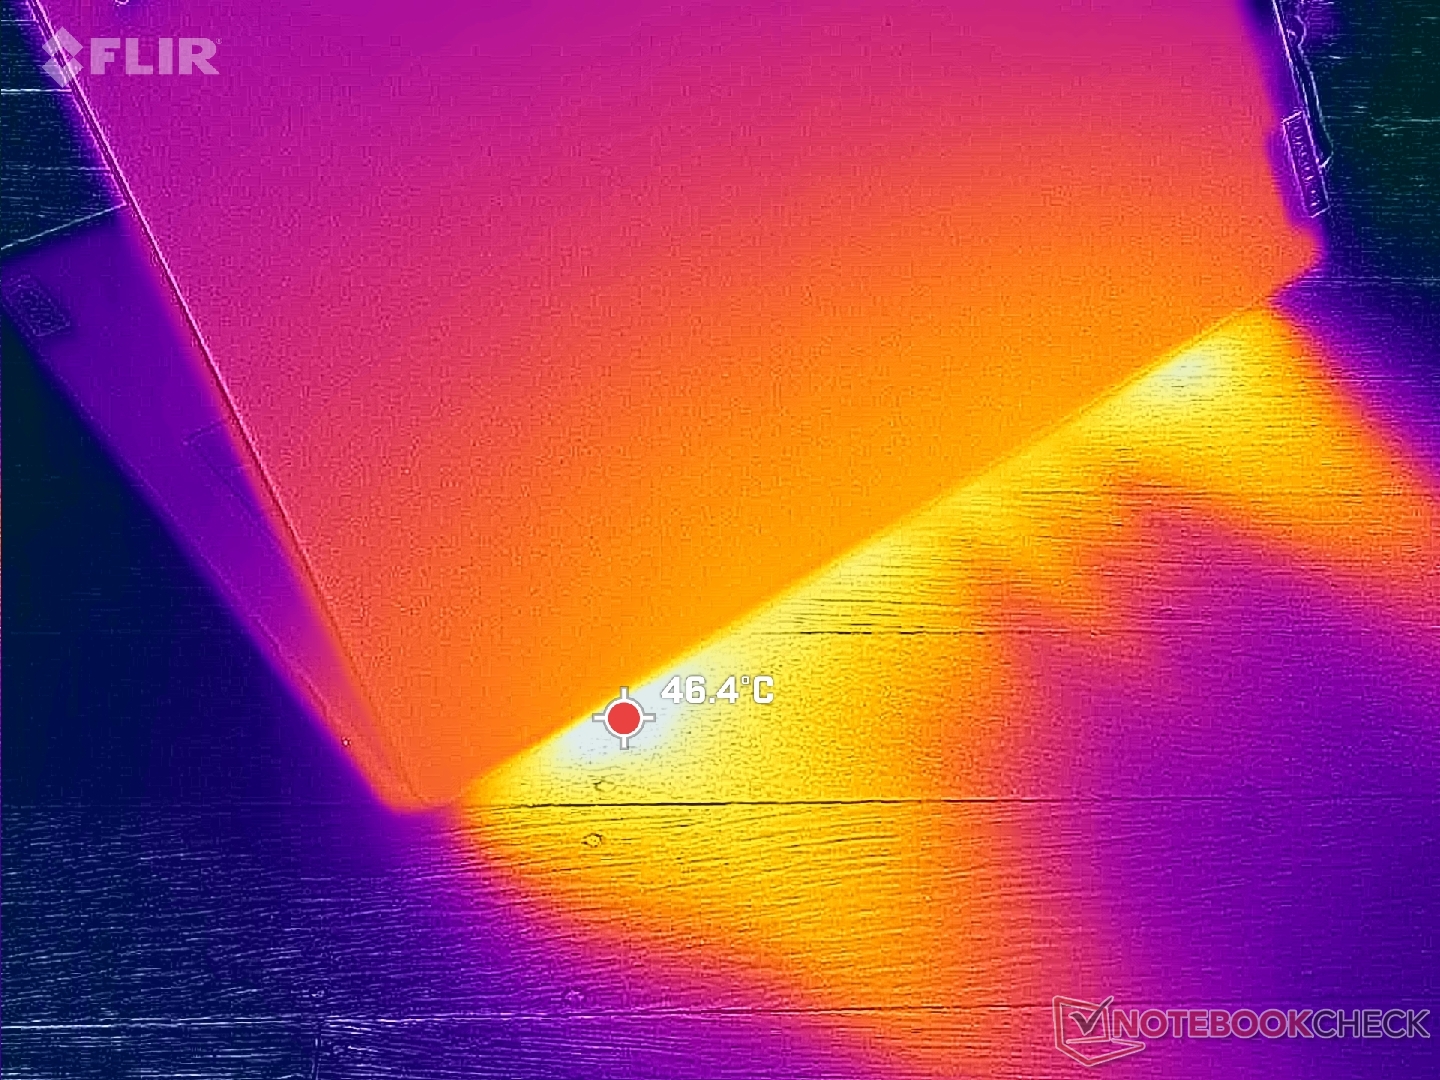
(±) Den maximala temperaturen på ovansidan är 41 °C / 106 F, jämfört med genomsnittet av 40.4 °C / 105 F , allt från 21.2 till 68.8 °C för klassen Gaming.
(±) Botten värms upp till maximalt 40.6 °C / 105 F, jämfört med genomsnittet av 43.2 °C / 110 F
(+) Vid tomgångsbruk är medeltemperaturen för ovansidan 27.8 °C / 82 F, jämfört med enhetsgenomsnittet på 33.9 °C / ### class_avg_f### F.
(±) När du spelar The Witcher 3 är medeltemperaturen för ovansidan 33 °C / 91 F, jämfört med enhetsgenomsnittet på 33.9 °C / ## #class_avg_f### F.
(+) Handledsstöden och pekplattan är kallare än hudtemperaturen med maximalt 29.6 °C / 85.3 F och är därför svala att ta på.
(±) Medeltemperaturen för handledsstödsområdet på liknande enheter var 28.9 °C / 84 F (-0.7 °C / -1.3 F).
| Lenovo Yoga Pro 9 16IMH9 RTX 4050 Intel Core Ultra 9 185H, NVIDIA GeForce RTX 4050 Laptop GPU | Lenovo Yoga Pro 9 16IMH9 Intel Core Ultra 9 185H, NVIDIA GeForce RTX 4070 Laptop GPU | HP Envy x360 2-in-1 16-ad0097nr AMD Ryzen 7 8840HS, AMD Radeon 780M | Dell XPS 16 9640 Intel Core Ultra 7 155H, NVIDIA GeForce RTX 4070 Laptop GPU | Samsung Galaxy Book4 Ultra Intel Core Ultra 7 155H, NVIDIA GeForce RTX 4050 Laptop GPU | Asus VivoBook Pro 16 K6602VU Intel Core i9-13900H, NVIDIA GeForce RTX 4050 Laptop GPU | |
|---|---|---|---|---|---|---|
| Heat | 3% | -1% | 8% | 13% | -20% | |
| Maximum Upper Side * | 41 | 41.7 -2% | 42.6 -4% | 39.4 4% | 38.5 6% | 42.6 -4% |
| Maximum Bottom * | 40.6 | 46.3 -14% | 47.8 -18% | 36.9 9% | 41.2 -1% | 48.4 -19% |
| Idle Upper Side * | 30.2 | 26.2 13% | 27.4 9% | 28.2 7% | 23.5 22% | 39.4 -30% |
| Idle Bottom * | 31.4 | 27.2 13% | 27.8 11% | 27.4 13% | 24.1 23% | 39.8 -27% |
* ... mindre är bättre
Högtalare
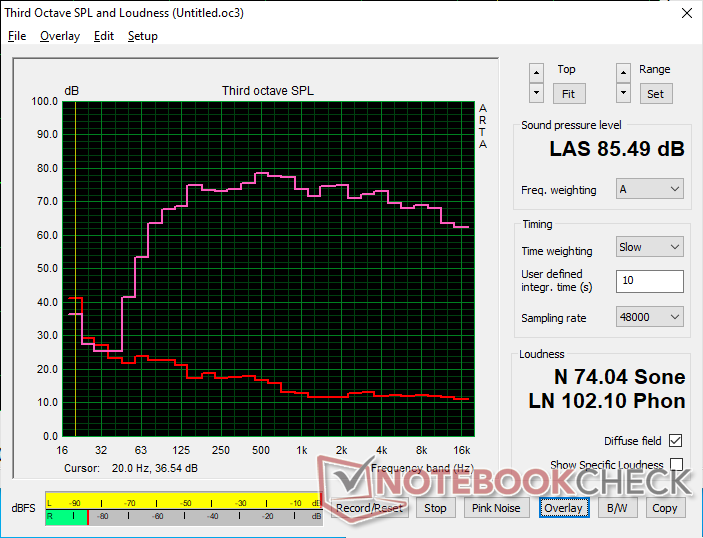
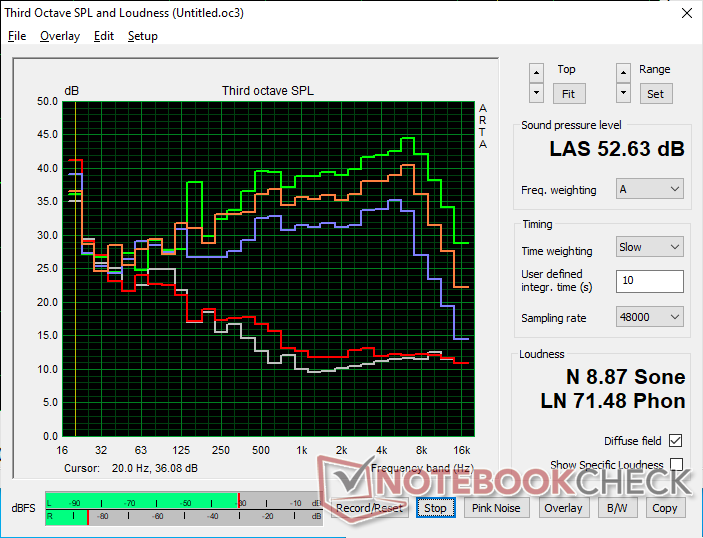
Lenovo Yoga Pro 9 16IMH9 RTX 4050 ljudanalys
(+) | högtalare kan spela relativt högt (85.5 dB)
Bas 100 - 315 Hz
(+) | bra bas - bara 2.1% från medianen
(+) | basen är linjär (3.8% delta till föregående frekvens)
Mellan 400 - 2000 Hz
(+) | balanserad mellan - endast 2.6% från medianen
(+) | mids är linjära (3.1% delta till föregående frekvens)
Högsta 2 - 16 kHz
(+) | balanserade toppar - endast 3.1% från medianen
(+) | toppar är linjära (3% delta till föregående frekvens)
Totalt 100 - 16 000 Hz
(+) | det totala ljudet är linjärt (5.8% skillnad mot median)
Jämfört med samma klass
» 0% av alla testade enheter i den här klassen var bättre, 0% liknande, 100% sämre
» Den bästa hade ett delta på 6%, genomsnittet var 18%, sämst var 132%
Jämfört med alla testade enheter
» 0% av alla testade enheter var bättre, 0% liknande, 100% sämre
» Den bästa hade ett delta på 4%, genomsnittet var 24%, sämst var 134%
Apple MacBook Pro 16 2021 M1 Pro ljudanalys
(+) | högtalare kan spela relativt högt (84.7 dB)
Bas 100 - 315 Hz
(+) | bra bas - bara 3.8% från medianen
(+) | basen är linjär (5.2% delta till föregående frekvens)
Mellan 400 - 2000 Hz
(+) | balanserad mellan - endast 1.3% från medianen
(+) | mids är linjära (2.1% delta till föregående frekvens)
Högsta 2 - 16 kHz
(+) | balanserade toppar - endast 1.9% från medianen
(+) | toppar är linjära (2.7% delta till föregående frekvens)
Totalt 100 - 16 000 Hz
(+) | det totala ljudet är linjärt (4.6% skillnad mot median)
Jämfört med samma klass
» 0% av alla testade enheter i den här klassen var bättre, 0% liknande, 100% sämre
» Den bästa hade ett delta på 5%, genomsnittet var 18%, sämst var 45%
Jämfört med alla testade enheter
» 0% av alla testade enheter var bättre, 0% liknande, 100% sämre
» Den bästa hade ett delta på 4%, genomsnittet var 24%, sämst var 134%
Energiförvaltning
Strömförbrukning
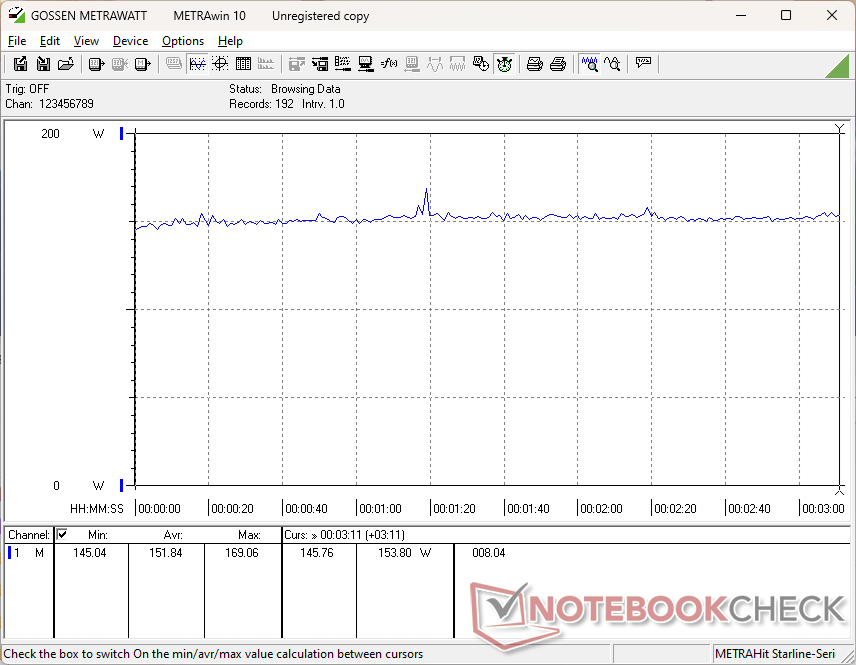
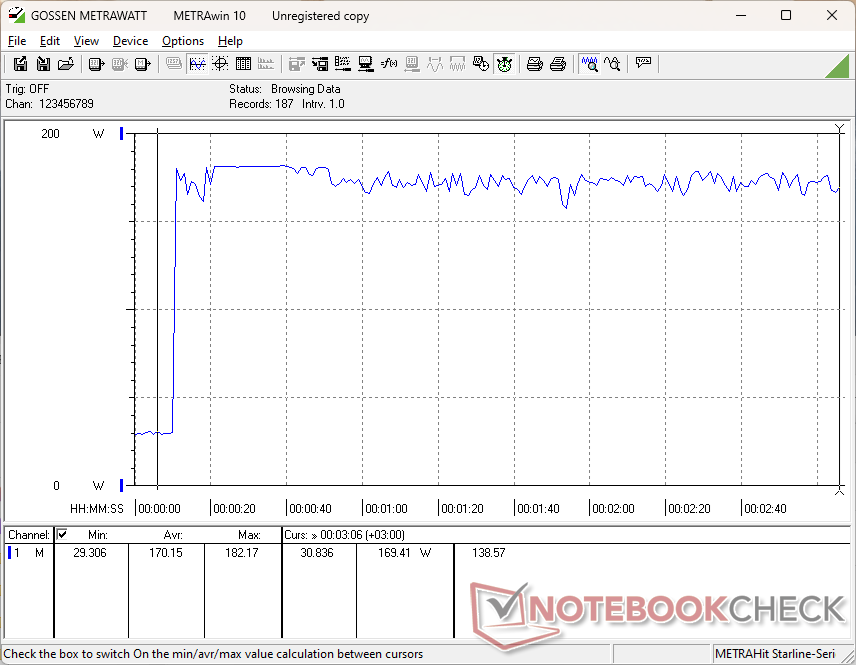
De totala förbrukningsnivåerna ligger mycket nära vad vi registrerade på den avancerade Mini-LED RTX 4070-konfigurationen. När vi kör Witcher 3skulle vår lägre konfiguration till exempel bara förbruka 5 procent mindre i genomsnitt, trots att den innebär ett grafikprestandaunderskott på 25 till 30 procent jämfört med RTX 4070. Prestanda per watt gynnar därför RTX 4070 ganska kraftigt.
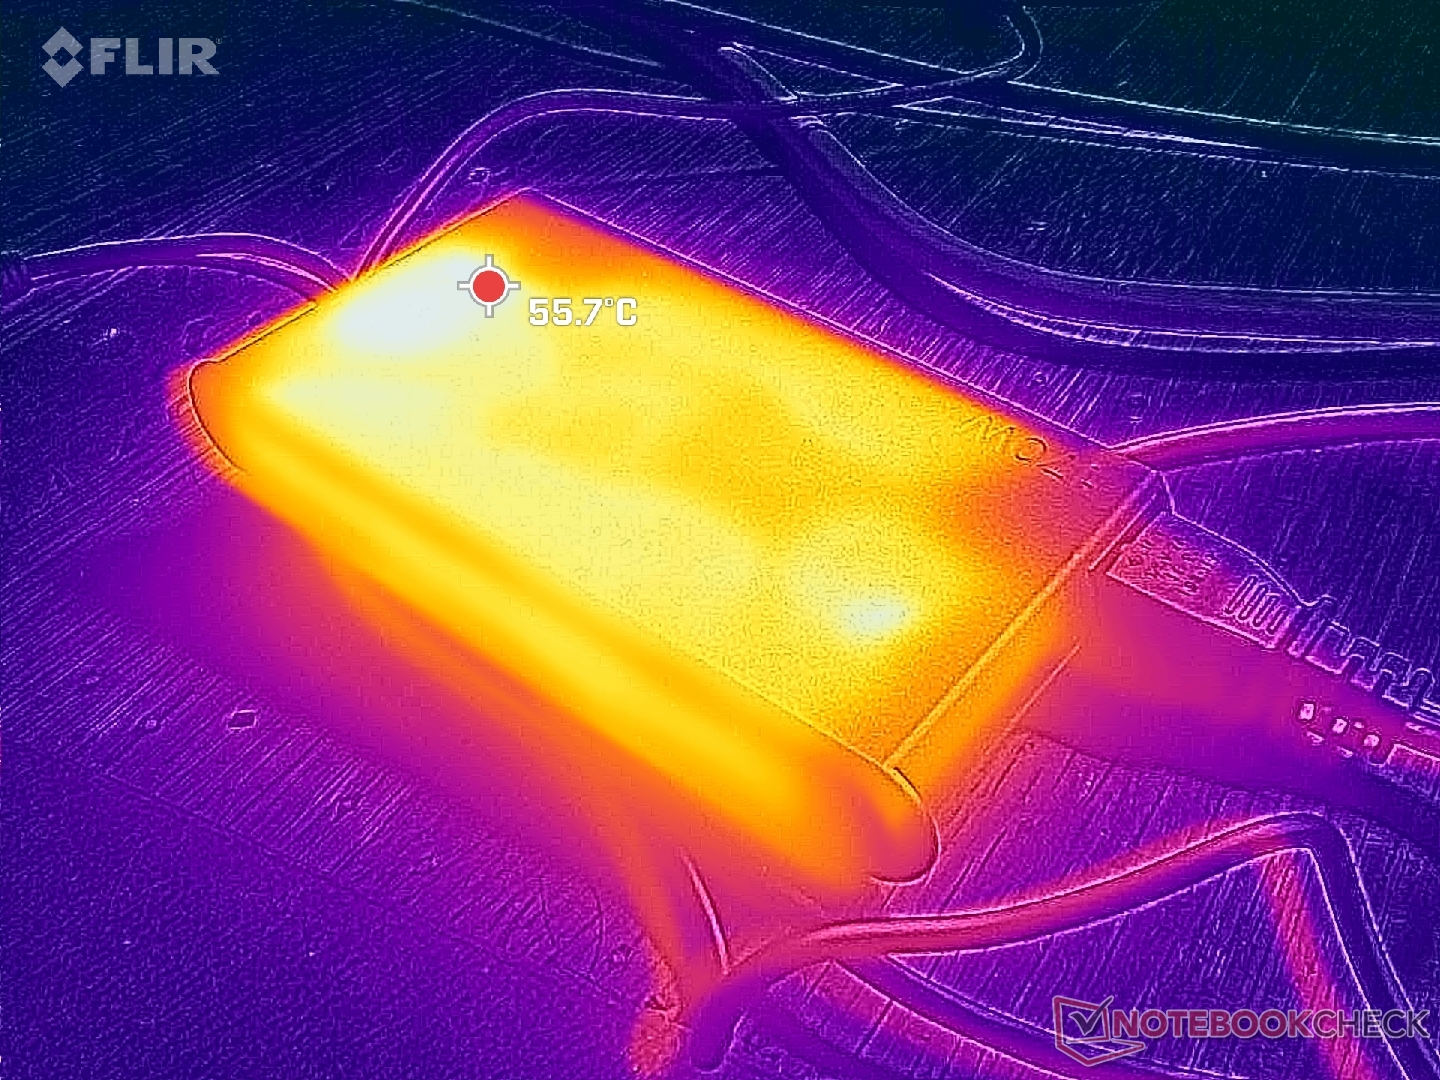
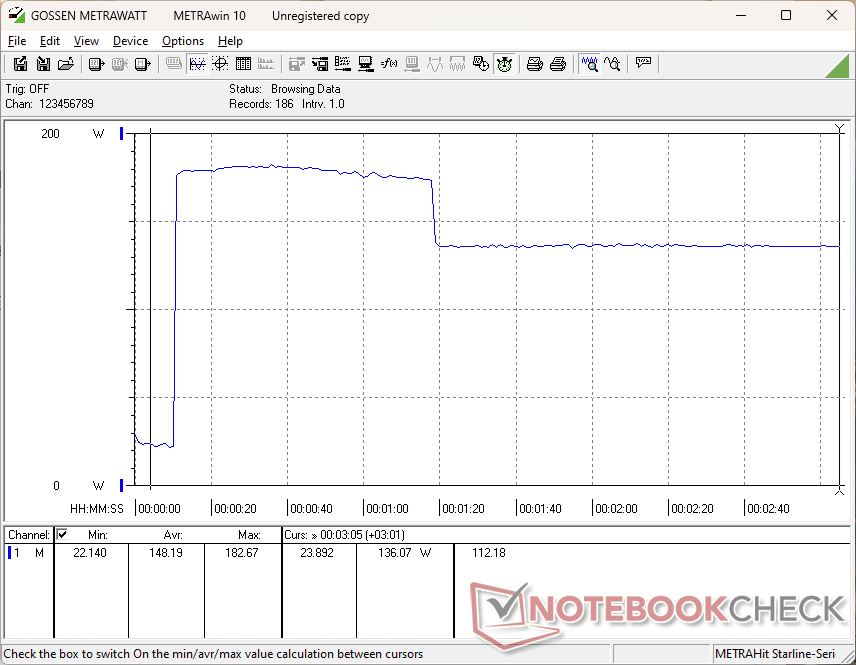
Användare bör komma ihåg att nätadaptern är klassad för endast 170 W. Eftersom spel redan kräver mellan 150 W och 160 W, kommer försök att ladda den bärbara datorn medan du spelar att resultera i en mycket långsam laddningshastighet.
| Av/Standby | |
| Låg belastning | |
| Hög belastning |
|
Förklaring:
min: | |
| Lenovo Yoga Pro 9 16IMH9 RTX 4050 Ultra 9 185H, NVIDIA GeForce RTX 4050 Laptop GPU, SK Hynix HFS001TEJ9X115N, IPS, 3200x2000, 16" | Lenovo Yoga Pro 9 16IMH9 Ultra 9 185H, NVIDIA GeForce RTX 4070 Laptop GPU, SK Hynix HFS001TEJ9X115N, Mini-LED, 3200x2000, 16" | HP Envy x360 2-in-1 16-ad0097nr R7 8840HS, Radeon 780M, KIOXIA BG5 KBG50ZNV1T02, OLED, 2880x1800, 16" | Dell XPS 16 9640 Ultra 7 155H, NVIDIA GeForce RTX 4070 Laptop GPU, Kioxia XG8 KXG80ZNV1T02, OLED, 3840x2400, 16.3" | Samsung Galaxy Book4 Ultra Ultra 7 155H, NVIDIA GeForce RTX 4050 Laptop GPU, Samsung PM9A1 MZVL2512HCJQ, OLED, 2880x1800, 16" | Asus VivoBook Pro 16 K6602VU i9-13900H, NVIDIA GeForce RTX 4050 Laptop GPU, Micron 2400 MTFDKBA1T0QFM, OLED, 3200x2000, 16" | |
|---|---|---|---|---|---|---|
| Power Consumption | -2% | 57% | 32% | 47% | -8% | |
| Idle Minimum * | 9.9 | 10.3 -4% | 5 49% | 7.7 22% | 4.8 52% | 21.06 -113% |
| Idle Average * | 16.6 | 21.9 -32% | 6.2 63% | 10.3 38% | 7.5 55% | 24.27 -46% |
| Idle Maximum * | 29.2 | 22.4 23% | 14.7 50% | 10.6 64% | 7.9 73% | 25.12 14% |
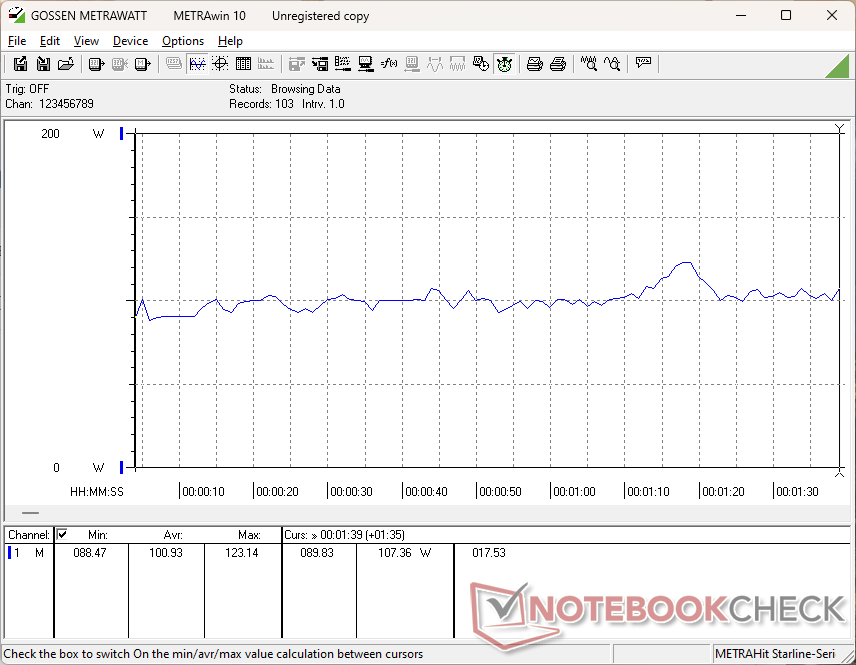
| Load Average * | 100.9 | 96.9 4% | 49.9 51% | 76.5 24% | 79.3 21% | 52.4 48% |
| Witcher 3 ultra * | 151.8 | 159.6 -5% | 54.5 64% | 126.4 17% | 79.2 48% | 110.2 27% |
| Load Maximum * | 182.2 | 173.8 5% | 65 64% | 138.5 24% | 125 31% | 146 20% |
* ... mindre är bättre
Power Consumption Witcher 3 / Stresstest
Power Consumption external Monitor
Batteritid
WLAN-körtiden i lägena Balanserad och Optimus med skärmen inställd på 150 nits skulle vara ungefär lika lång som den dyrare RTX 4070 Mini-LED-konfigurationen. Resultaten är lite överraskande på ytan eftersom mini-LED och RTX 4070 GPU kan vara mer strömkrävande än IPS och RTX 4050, men uppgifterna är logiska när man tar hänsyn till Optimus-läget och de liknande ljusstyrkeinställningarna under testningen. Surftiden på 9 timmar är fortfarande mycket bra för en 16-tums bärbar multimediadator med diskret grafik, även om den är lite kortare än konkurrenter som Dell XPS 16 eller Samsung Galaxy Book4 Ultra.
| Lenovo Yoga Pro 9 16IMH9 RTX 4050 Ultra 9 185H, NVIDIA GeForce RTX 4050 Laptop GPU, 84 Wh | Lenovo Yoga Pro 9 16IMH9 Ultra 9 185H, NVIDIA GeForce RTX 4070 Laptop GPU, 84 Wh | HP Envy x360 2-in-1 16-ad0097nr R7 8840HS, Radeon 780M, 68 Wh | Dell XPS 16 9640 Ultra 7 155H, NVIDIA GeForce RTX 4070 Laptop GPU, 99.5 Wh | Samsung Galaxy Book4 Ultra Ultra 7 155H, NVIDIA GeForce RTX 4050 Laptop GPU, 76 Wh | Asus VivoBook Pro 16 K6602VU i9-13900H, NVIDIA GeForce RTX 4050 Laptop GPU, 96 Wh | |
|---|---|---|---|---|---|---|
| Batteridrifttid | -3% | -15% | 16% | 21% | 12% | |
| WiFi v1.3 | 540 | 526 -3% | 459 -15% | 629 16% | 656 21% | 606 12% |
| H.264 | 692 | 988 | 1076 | 585 | ||
| Load | 73 | 116 | 87 | 78 | ||
| Reader / Idle | 935 |
För
Emot
Bedömning - En av Lenovos bästa om du är villig att betala
Yoga Pro 9 16IMH9 är den mest imponerande modellen i serien hittills, även i den lägre konfigurationen utan RTX 4070-grafik eller den snygga mini-LED-skärmen för att vara ett verkligt alternativ till XPS 16 eller MacBook Pro 16. Dess IPS-skärm, prestanda och storlek är konkurrenskraftiga jämfört med Dell eller Apple samtidigt som de är enklare att serva och har ett bättre tangentbord än XPS. Vi kan verkligen uppskatta dess bredare utbud av portar också, medan de två konkurrerande modellerna endast har USB-C.
Andra faktorer som batteritid och fläktljud är inte märkbart längre respektive tystare än den avancerade RTX 4070-konfigurationen.
Den AI-förberedda Lenovo Yoga Pro 9 16IMH9 är inte bara ett bra alternativ till Dell XPS 16 eller MacBook Pro 16, utan den gör också några saker bättre än båda.
Detaljhandelspriset på $ 1700 för RTX 4050-konfigurationen är lite högt eftersom bärbara speldatorer med samma GPU som MSI tunn GF63 eller Acer Nitro V kan hittas för under $ 1000 vardera. Jämfört med konkurrerande XPS 16 eller MacBook Pro 15 är Lenovo dock flera hundra dollar billigare för att vara en attraktiv lösning för dem som vill spara lite pengar samtidigt som de behåller premiumanvändarupplevelsen.
Pris och tillgänglighet
Best Buy levererar för närvarande Lenovo Yoga Pro 9 16-konfigurationen som granskats för $ 1700.
Lenovo Yoga Pro 9 16IMH9 RTX 4050
- 06/06/2024 v7 (old)
Allen Ngo
Genomskinlighet
Valet av enheter som ska granskas görs av vår redaktion. Testprovet gavs till författaren som ett lån av tillverkaren eller återförsäljaren för denna recension. Långivaren hade inget inflytande på denna recension och inte heller fick tillverkaren en kopia av denna recension innan publiceringen. Det fanns ingen skyldighet att publicera denna recension. Vi accepterar aldrig ersättning eller betalning i utbyte mot våra recensioner. Som ett oberoende medieföretag är Notebookcheck inte föremål för auktoritet från tillverkare, återförsäljare eller förlag.
This is how Notebookcheck is testingEvery year, Notebookcheck independently reviews hundreds of laptops and smartphones using standardized procedures to ensure that all results are comparable. We have continuously developed our test methods for around 20 years and set industry standards in the process. In our test labs, high-quality measuring equipment is utilized by experienced technicians and editors. These tests involve a multi-stage validation process. Our complex rating system is based on hundreds of well-founded measurements and benchmarks, which maintains objectivity.
Price comparison

