Microsoft Surface Laptop 7 13.8 Copilot+ recension - Tack vare Snapdragon X Elite äntligen en seriös konkurrent till MacBook Air?
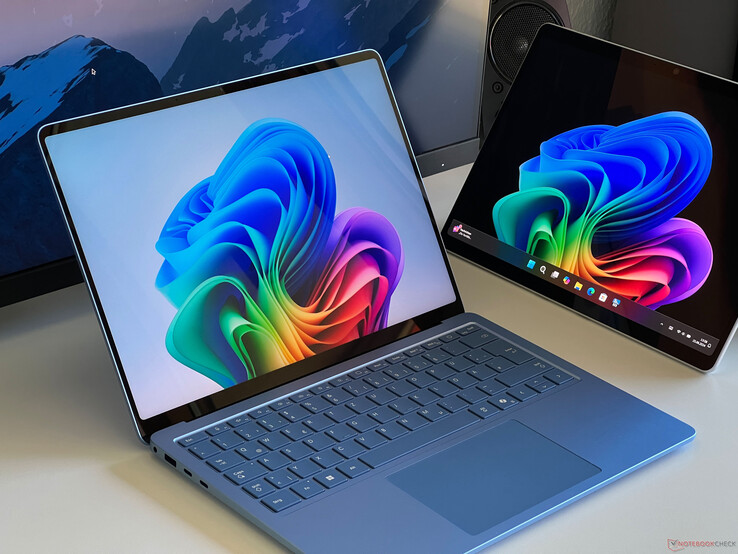
Förutom Surface Pro utrustar Microsoft nu även Surface Laptop med Qualcomms nya Snapdragon-processorer. Nu i sin 7:e generation finns två storlekar (13,8 & 15 tum) tillgängliga igen, men det är 13,8-tumsmodellen vi först ska titta på. Baspriset med Snapdragon X Plus (10 kärnor, 16 GB RAM och en 256 GB SSD) ligger på 1 069 USD; vår recensionskonfiguration med Snapdragon X Elite (12 kärnor), 16 GB RAM och en 512 GB SSD kostar 1 669 USD.
Potentiella konkurrenter i jämförelse
Gradering | Version | Datum | Modell | Vikt | Höjd | Storlek | Upplösning | Pris |
|---|---|---|---|---|---|---|---|---|
| 86.2 % | v8 | 07/2024 | Microsoft Surface Laptop 7 13.8 Copilot+ SD X Elite X1E-80-100, Adreno X1-85 3.8 TFLOPS | 1.3 kg | 17.5 mm | 13.80" | 2304x1536 | |
| 90.1 % v7 (old) | v7 (old) | 05/2024 | Lenovo ThinkBook 13x G4 21KR0008GE Ultra 5 125H, Arc 7-Core | 1.2 kg | 12.9 mm | 13.50" | 2880x1920 | |
| 86.5 % v7 (old) | v7 (old) | 05/2024 | Dell XPS 13 9340 Core Ultra 7 Ultra 7 155H, Arc 8-Core | 1.2 kg | 15.3 mm | 13.40" | 1920x1200 | |
| 92.4 % v7 (old) | v7 (old) | 03/2024 | Apple MacBook Air 13 M3 10C GPU M3, M3 10-Core GPU | 1.2 kg | 11.3 mm | 13.60" | 2560x1664 | |
| 87.5 % v7 (old) | v7 (old) | 10/2023 | Framework Laptop 13.5 Ryzen 7 7840U R7 7840U, Radeon 780M | 1.3 kg | 15.85 mm | 13.50" | 2256x1504 | |
| 91.9 % v7 (old) | v7 (old) | 07/2023 | HP Dragonfly G4 i7-1365U, Iris Xe G7 96EUs | 1.1 kg | 16.3 mm | 13.50" | 1920x1280 |
Topp 10...
» Topp 10: Bästa bärbara allround/multimediadatorerna
» Topp 10: Bästa bärbara speldatorerna
» Topp 10: Bärbara budget/kontorsdatorer
» Topp 10: Bästa bärbara kontors/premiumdatorerna
» Topp 10: Bärbara arbetsstationer
» Topp 10: De bästa små/kompakta bärbara datorerna
» Topp 10: Bästa ultrabooks
» Topp 10: Bästa hybriddatorerna
» Topp 10: Bästa surfplattorna
» Topp 10: Marknadens bästa smartphones
Obs: Vi har nyligen uppdaterat vårt betygssystem och resultaten från version 8 är inte jämförbara med resultaten från version 7. Mer information finns tillgänglig här .
Fodral - Ett metallfodral med underhållsmöjligheter
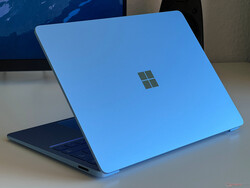
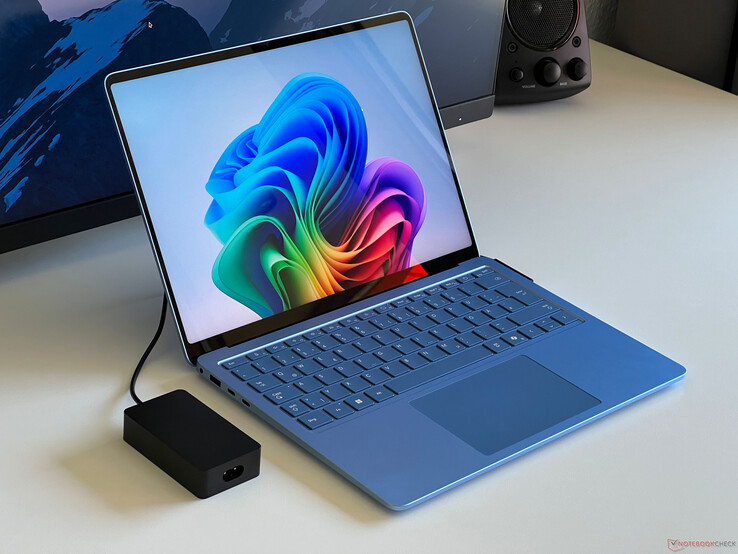
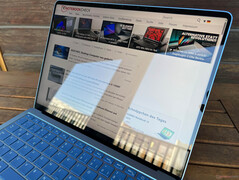
Ingenting har förändrats när det gäller designen av 7:e generationens Surface Laptop och på utsidan går det inte att se om det är en ny Snapdragon-modell. Det blir bara uppenbart med den nya Copilot-knappen. Metallhöljet är fortfarande underbart konstruerat och Microsoft erbjuder den bärbara datorn i färgerna svart, platina, gråbeige eller safirblå som är färgen på vår granskningsenhet. Beroende på hur ljuset faller är den safirblå modellen mycket slående och vi gillar den. Utöver detta finns det inga problem med fingeravtryck att tala om.
Stabiliteten är mycket bra med ett minimum av flex som kräver mycket tryck. Vi kunde dock inte provocera fram några knarrande ljud. Gångjärnen är i princip välkalibrerade, men det går inte att undvika en lätt vobblande rörelse när man justerar öppningsvinkeln (max 135 grader). Det uppstår inga problem när marken skakar (t.ex. under en tågresa). En nyhet i den 7:e generationens enheter är att det finns möjlighet till underhåll eftersom locket inte längre är limmat (mer om det strax).
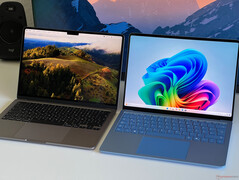
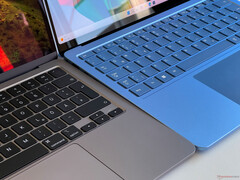
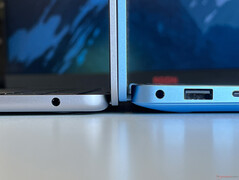
Surface Laptop 13.8 är inte en särskilt tunn eller lätt enhet. Med en vikt på drygt 1,3 kg och en tjocklek på 17,5 mm på baksidan har vi att göra med den tjockaste bärbara datorn i denna jämförelse. Ändå är den bärbara datorn i allmänhet mycket kompakt och kan enkelt förvaras i en ryggsäck. I en direkt jämförelse med MacBook Air 13 M3 (se följande bilder) märker man hur tjock Surface Laptop är och att den har ett något större fotavtryck. Den medföljande 39-watts PSU:n väger 213 gram.
Funktioner - USB 4 och Wi-Fi 7
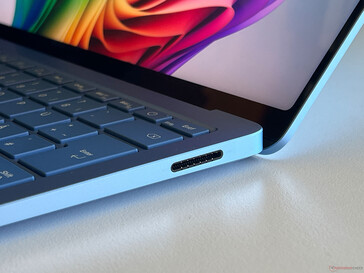
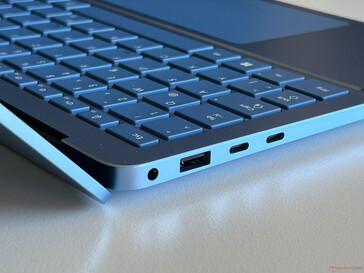
Microsoft fortsätter att välja sin Surface Connect-port via vilken enheten också kan laddas som standard (laddning via USB-C är också möjlig). Dessutom finns två USB 4.0-gränssnitt och en vanlig USB-A-port. Du måste dock klara dig utan en kortläsare.
Kommunikation
Snapdragon-processorn är utrustad med FastConnect 7800 Wi-Fi-modulen som också stöder den nya Wi-Fi 7-standarden samt Bluetooth 5.4. I vår recension med Asus referensrouter var överföringshastigheterna höga och stabila, men sändningsprestandan är inte riktigt lika hög som MacBook Air eller ThinkBook 13x.
| Networking | |
| Microsoft Surface Laptop 7 13.8 Copilot+ | |
| iperf3 transmit AXE11000 | |
| iperf3 receive AXE11000 | |
| iperf3 transmit AXE11000 6GHz | |
| iperf3 receive AXE11000 6GHz | |
| Lenovo ThinkBook 13x G4 21KR0008GE | |
| iperf3 transmit AXE11000 | |
| iperf3 receive AXE11000 | |
| Dell XPS 13 9340 Core Ultra 7 | |
| iperf3 transmit AXE11000 | |
| iperf3 receive AXE11000 | |
| Apple MacBook Air 13 M3 10C GPU | |
| iperf3 transmit AXE11000 | |
| iperf3 receive AXE11000 | |
| Framework Laptop 13.5 Ryzen 7 7840U | |
| iperf3 transmit AXE11000 | |
| iperf3 receive AXE11000 | |
| iperf3 transmit AXE11000 6GHz | |
| iperf3 receive AXE11000 6GHz | |
| HP Dragonfly G4 | |
| iperf3 transmit AXE11000 | |
| iperf3 receive AXE11000 | |
| iperf3 transmit AXE11000 6GHz | |
| iperf3 receive AXE11000 6GHz | |
Webbkamera
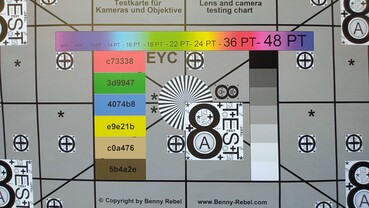
Microsoft har valt en 1080p-webbkamera som naturligtvis också har stöd för de nuvarande Studio Effects. Kvalitetsmässigt är resultaten hyfsade men inte jämförbara med de mycket bra kamerorna som finns i Surface Pro 2-i-1-datorer. En mekanisk/elektronisk slutare finns inte ombord men det finns en IR-sensor för ansiktsigenkänning via Windows Hello.

Underhåll
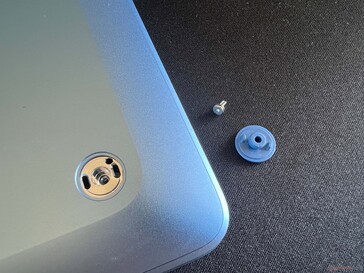
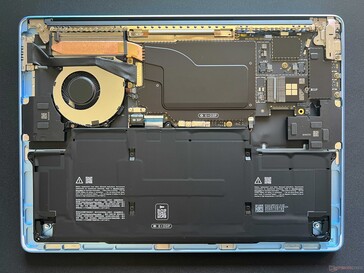
I det här avsnittet finns det en betydande förbättring jämfört med de gamla modellerna eftersom basen på Surface Laptop 7 nu är skruvad snarare än limmad. De fyra skruvarna (Torx T5) är dolda men lättåtkomliga under gummifötterna. Internt är fläkten, batteriet och den kompakta M.2 2230 SSD-enheten också lättåtkomliga. RAM-minnet och Wi-Fi är dock lödda.
Garanti
Tillverkaren erbjuder 12 månaders garanti. I Tyskland finns det naturligtvis också den extra lagstadgade tvååriga täckningen. Under namnet Microsoft Complete erbjuder tillverkaren en utökad garanti i två, tre eller fyra år (+ $ 149, $ 219 eller $ 249). Naturligtvis täcker detta också oavsiktliga skador. Någon service på plats ingår inte, vilket innebär att enheten måste skickas in för reparation.
Inmatningsenheter - En pekskärm och haptisk pekplatta
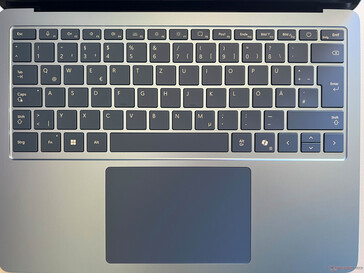
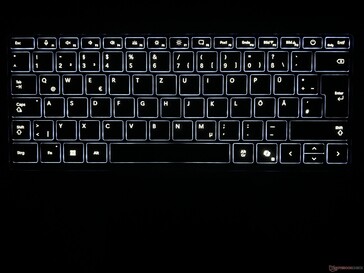
Tangentbordet på Surface Laptop 7 ger en bekväm skrivupplevelse. Med de tidigare modellerna verkade tangenterna lite skakiga, men det är inte längre fallet här. Tangenternas rörelse är tillräcklig och tryckpunkten är behaglig, vilket innebär att även längre texter kan skrivas bekvämt. Även om layouten med den nya Copilot-knappen inte bjuder på några överraskningar är piltangenterna mycket små. Den vita bakgrundsbelysningen har tre intensitetsnivåer, men kan inte aktiveras automatiskt via Sensor.
Den nya Surface Laptop har den haptiska pekplattan som finns i Surface Studio 2. Den har inga rörliga delar och klickfeedbacken skapas via vibrationsmotorerna. Det innebär att var man än klickar på plattan kommer man att få samma återkoppling (som är behagligt tyst). I praktiken fungerar det fantastiskt bra tillsammans med den släta ytan (12 x 8 cm). Dessutom finns det också en kapacitiv pekskärm som fungerar felfritt.
Skärm - En IPS-panel nu med 600 cd/m²
Microsoft har lämnat de grundläggande skärmegenskaperna oförändrade (leverantör: Sharp) eftersom vi återigen har att göra med en 3:2, IPS-pekskärm med en upplösning på 2 304 x 1 536 pixlar. Med ett diagonalmått på 13,8 tum är skärmen tillräckligt skarp och den subjektiva bildkvaliteten är god eftersom panelen stöder en frekvens på 120 Hz. Surface Laptops skärmkvalitet når dock inte upp till de höjder som uppnås med OLED-paneler och OLED-alternativet som finns i Surface Pro skulle verkligen ha varit intressant. Ändå, jämfört med MacBook Airär den höga frekvensen en fördel.
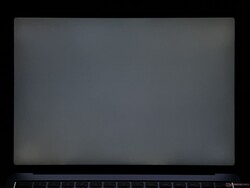
Ljusstyrkan har ökat och ligger nu på ett genomsnitt på nästan 600 cd/m². Detta innebär att svartvärdet blir lidande och med 0,43 cd/m² är det något för högt. Det maximala kontrastförhållandet ligger fortfarande runt ~1.400:1. HDR-innehåll stöds men den maximala ljusstyrkan förblir oförändrad. PWM-flimmer syns inte till och svarstiderna är omärkbara. Dessutom utgör ljusblödning inga problem trots den höga ljusstyrkan. Både ljusstyrkan och färgtemperaturen kan anpassas till omgivningsljuset via Sensor.
| |||||||||||||||||||||||||
Distribution av ljusstyrkan: 94 %
Mitt på batteriet: 603 cd/m²
Kontrast: 1409:1 (Svärta: 0.43 cd/m²)
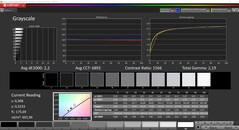
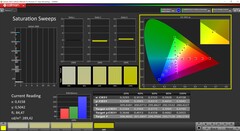
ΔE Color 1.3 | 0.5-29.43 Ø4.87
ΔE Greyscale 2.1 | 0.5-98 Ø5.1
87.3% AdobeRGB 1998 (Argyll 2.2.0 3D)
98.2% sRGB (Argyll 2.2.0 3D)
97.8% Display P3 (Argyll 2.2.0 3D)
Gamma: 2.16
| Microsoft Surface Laptop 7 13.8 Copilot+ LQ138P1JX61, IPS, 2304x1536, 13.8" | Lenovo ThinkBook 13x G4 21KR0008GE LEN135WQ+, IPS, 2880x1920, 13.5" | Dell XPS 13 9340 Core Ultra 7 SHP1593, IPS, 1920x1200, 13.4" | Apple MacBook Air 13 M3 10C GPU IPS, 2560x1664, 13.6" | Framework Laptop 13.5 Ryzen 7 7840U BOE CQ NE135FBM-N41, IPS, 2256x1504, 13.5" | HP Dragonfly G4 Chi Mei CMN13C0, IPS, 1920x1280, 13.5" | |
|---|---|---|---|---|---|---|
| Display | -19% | -16% | 1% | -16% | -16% | |
| Display P3 Coverage | 97.8 | 65.5 -33% | 69.4 -29% | 98.4 1% | 69 -29% | 68.4 -30% |
| sRGB Coverage | 98.2 | 97.3 -1% | 97.8 0% | 99.9 2% | 99.1 1% | 98.3 0% |
| AdobeRGB 1998 Coverage | 87.3 | 67.7 -22% | 71.7 -18% | 87.9 1% | 71.1 -19% | 70.4 -19% |
| Response Times | 28% | -35% | -23% | -56% | -53% | |
| Response Time Grey 50% / Grey 80% * | 38.9 ? | 27.3 ? 30% | 43.2 ? -11% | 34.5 ? 11% | 50.4 ? -30% | 48.8 ? -25% |
| Response Time Black / White * | 17.4 ? | 12.8 ? 26% | 27.6 ? -59% | 27.2 ? -56% | 31.5 ? -81% | 31.3 ? -80% |
| PWM Frequency | ||||||
| Screen | -12% | -53% | -9% | -33% | -25% | |
| Brightness middle | 606 | 539 -11% | 429 -29% | 525 -13% | 436 -28% | 408.8 -33% |
| Brightness | 592 | 513 -13% | 407 -31% | 506 -15% | 416 -30% | 399 -33% |
| Brightness Distribution | 94 | 89 -5% | 90 -4% | 92 -2% | 89 -5% | 90 -4% |
| Black Level * | 0.43 | 0.38 12% | 0.28 35% | 0.42 2% | 0.36 16% | 0.32 26% |
| Contrast | 1409 | 1418 1% | 1532 9% | 1250 -11% | 1211 -14% | 1278 -9% |
| Colorchecker dE 2000 * | 1.3 | 1.4 -8% | 2.6 -100% | 1.4 -8% | 1.81 -39% | 2.02 -55% |
| Colorchecker dE 2000 max. * | 2.1 | 3.5 -67% | 6.6 -214% | 2.8 -33% | 4.73 -125% | 3.84 -83% |
| Greyscale dE 2000 * | 2.1 | 2.2 -5% | 4 -90% | 2 5% | 2.9 -38% | 2.3 -10% |
| Gamma | 2.16 102% | 2.19 100% | 2.23 99% | 2.2 100% | 2.27 97% | 2.2 100% |
| CCT | 6842 95% | 6710 97% | 7332 89% | 6876 95% | 6784 96% | 6203 105% |
| Colorchecker dE 2000 calibrated * | 0.7 | 1.4 | 0.45 | 0.61 | ||
| Totalt genomsnitt (program/inställningar) | -1% /
-7% | -35% /
-42% | -10% /
-9% | -35% /
-32% | -31% /
-27% |
* ... mindre är bättre
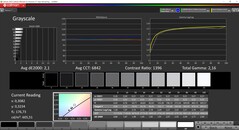
Vi mätte panelen med hjälp av den professionella programvaran CalMAN och Microsoft har tillhandahållit två profiler: Vivid och sRGB. Som standard är Vivid-profilen aktiv och täcker den större P3-färgrymden. Båda profilerna är mycket exakta och det är lika bra att en kalibrering inte är nödvändig eftersom vi för närvarande inte kan utföra en sådan. Vår programvara i1Profiler är för närvarande inkompatibel med ARM-systemet. Tack vare den kompletta täckningen av P3- och sRGB-färgrymderna fungerar redigeringen av både bilder och videor utan problem.
Visa svarstider
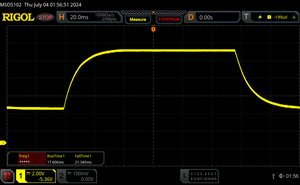
| ↔ Svarstid svart till vitt | ||
|---|---|---|
| 17.4 ms ... stiga ↗ och falla ↘ kombinerat | ↗ 5.7 ms stiga | |
| ↘ 11.7 ms hösten | ||
| Skärmen visar bra svarsfrekvens i våra tester, men kan vara för långsam för konkurrenskraftiga spelare. I jämförelse sträcker sig alla testade enheter från 0.1 (minst) till 240 (maximalt) ms. » 36 % av alla enheter är bättre. Det betyder att den uppmätta svarstiden är bättre än genomsnittet av alla testade enheter (20.8 ms). | ||
| ↔ Svarstid 50 % grått till 80 % grått | ||
| 38.9 ms ... stiga ↗ och falla ↘ kombinerat | ↗ 17.6 ms stiga | |
| ↘ 21.3 ms hösten | ||
| Skärmen visar långsamma svarsfrekvenser i våra tester och kommer att vara otillfredsställande för spelare. I jämförelse sträcker sig alla testade enheter från 0.165 (minst) till 636 (maximalt) ms. » 56 % av alla enheter är bättre. Detta innebär att den uppmätta svarstiden är sämre än genomsnittet av alla testade enheter (32.5 ms). | ||
Skärmflimmer / PWM (Puls-Width Modulation)
| Skärmflimmer / PWM upptäcktes inte | |||
Som jämförelse: 53 % av alla testade enheter använder inte PWM för att dämpa skärmen. Om PWM upptäcktes mättes ett medelvärde av 8516 (minst: 5 - maximum: 343500) Hz. | |||
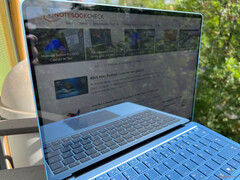
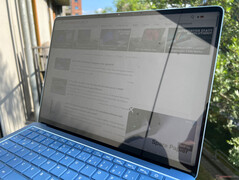
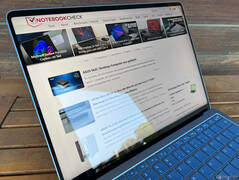
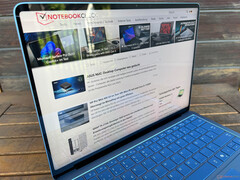
Pekskärmen är mycket reflekterande och utomhus kommer du att stöta på problem med reflektioner. Den höga ljusstyrkan kan kompensera lite för detta, men i det här avseendet skulle en mindre reflekterande skärm, som den som finns i pekskärmen på den nuvarande Huawei Matebook X Pro är en fördel. Det finns inga begränsningar när det gäller stabiliteten i betraktningsvinkeln.
Prestanda - Snapdragon X Elite med dubbelkärnig turbo
Den nya Surface Laptop 7 13.8 är antingen tillgänglig med Snapdragon X Plus (X1P-64-100) eller Snapdragon X Elite (X1E-80-100). Som standard är 16 GB RAM (LPDDR5x-8448) installerat och det finns för närvarande också en konfiguration med 32 GB RAM för 1 999 USD. Dessutom är tilläggsavgifterna för mer SSD-lagring mycket höga.
Vi körde igenom vår normala testbana, men inte alla program är kompatibla och många tester har inte heller en inbyggd ARM-app. Eftersom du kommer att konfronteras med emulering i vardagen kommer vi att visa dessa resultat också.
Testförhållanden
Microsoft förser inte sina enheter med egna energiprofiler, utan erbjuder istället Windows prestandalägen. Dessa har alltid haft olika namn på Surface-enheter: Rekommenderad (representerar bästa energibesparing), Bättre prestanda (representerar balanserad) samt Bästa prestanda. Vi utförde följande benchmarks och mätningar med, som standard, läget Bästa prestanda.
Processor - Snapdragon X1E-80-100
A Snapdragon X Elite X1E-80-100 används i den dyrare av de nya Surface Laptop-modellerna. Den har en klockfrekvens på upp till 3,4 GHz på alla 12 kärnor och stöder även en dubbelkärnig turbo på upp till 4,0 GHz. Ytterligare tekniska detaljer finns i vår analysartikel. Som var fallet med Surface Pro antar vi en TDP mellan 23-30 watt och resultaten från båda Microsoft-enheterna är jämförbara. I CPU-riktmärkena är både Cinebench 2024 och Geekbench 6 native-tester särskilt intressanta. Detta är ett område där Snapdragon-processorn också får bättre resultat än den direkta konkurrenten utrustad med AMD- och Intel-processorer. Apple passivt kylda M3-chip är långsammare i flerkärnstesterna men har en fördel i enkärnstesterna. I batteriläge förblev prestandan konsekvent. I Snapdragon X Plus i Surface Pro (och därmed jämförbar med Surface Laptop) är bara 7-13 % långsammare i båda de inbyggda testerna.
Geekbench 6.4: Multi-Core | Single-Core
Cinebench R23: Multi Core | Single Core
Cinebench R20: CPU (Multi Core) | CPU (Single Core)
Cinebench R15: CPU Multi 64Bit | CPU Single 64Bit
Blender: v2.79 BMW27 CPU
7-Zip 18.03: 7z b 4 | 7z b 4 -mmt1
Geekbench 5.5: Multi-Core | Single-Core
HWBOT x265 Benchmark v2.2: 4k Preset
LibreOffice : 20 Documents To PDF
R Benchmark 2.5: Overall mean
| Cinebench 2024 / CPU Multi Core | |
| Microsoft Surface Laptop 7 13.8 Copilot+ | |
| Microsoft Surface Pro OLED Copilot+ | |
| Genomsnitt Qualcomm Snapdragon X Elite X1E-80-100 (621 - 927, n=7) | |
| Microsoft Surface Pro Copilot+ | |
| Genomsnitt av klass Subnotebook (148 - 1162, n=60, senaste 2 åren) | |
| Dell XPS 13 9340 Core Ultra 7 | |
| Apple MacBook Air 13 M3 10C GPU | |
| Lenovo ThinkBook 13x G4 21KR0008GE | |
| Cinebench 2024 / CPU Single Core | |
| Apple MacBook Air 13 M3 10C GPU | |
| Microsoft Surface Pro OLED Copilot+ | |
| Microsoft Surface Laptop 7 13.8 Copilot+ | |
| Genomsnitt Qualcomm Snapdragon X Elite X1E-80-100 (122 - 123, n=7) | |
| Genomsnitt av klass Subnotebook (35 - 173, n=43, senaste 2 åren) | |
| Microsoft Surface Pro Copilot+ | |
| Dell XPS 13 9340 Core Ultra 7 | |
| Lenovo ThinkBook 13x G4 21KR0008GE | |
| Geekbench 6.4 / Multi-Core | |
| Microsoft Surface Pro OLED Copilot+ | |
| Microsoft Surface Laptop 7 13.8 Copilot+ | |
| Microsoft Surface Pro Copilot+ | |
| Genomsnitt Qualcomm Snapdragon X Elite X1E-80-100 (7596 - 14998, n=9) | |
| Apple MacBook Air 13 M3 10C GPU | |
| Dell XPS 13 9340 Core Ultra 7 | |
| Genomsnitt av klass Subnotebook (2244 - 17489, n=72, senaste 2 åren) | |
| Framework Laptop 13.5 Ryzen 7 7840U | |
| Lenovo ThinkBook 13x G4 21KR0008GE | |
| Geekbench 6.4 / Single-Core | |
| Apple MacBook Air 13 M3 10C GPU | |
| Microsoft Surface Pro OLED Copilot+ | |
| Microsoft Surface Laptop 7 13.8 Copilot+ | |
| Genomsnitt Qualcomm Snapdragon X Elite X1E-80-100 (1896 - 2845, n=9) | |
| Genomsnitt av klass Subnotebook (960 - 3655, n=67, senaste 2 åren) | |
| Framework Laptop 13.5 Ryzen 7 7840U | |
| Microsoft Surface Pro Copilot+ | |
| Dell XPS 13 9340 Core Ultra 7 | |
| Lenovo ThinkBook 13x G4 21KR0008GE | |
| Cinebench R23 / Multi Core | |
| Framework Laptop 13.5 Ryzen 7 7840U | |
| Dell XPS 13 9340 Core Ultra 7 | |
| Genomsnitt av klass Subnotebook (1555 - 21812, n=75, senaste 2 åren) | |
| Apple MacBook Air 13 M3 10C GPU | |
| Microsoft Surface Laptop 7 13.8 Copilot+ | |
| Microsoft Surface Pro OLED Copilot+ | |
| Genomsnitt Qualcomm Snapdragon X Elite X1E-80-100 (6772 - 10792, n=7) | |
| Lenovo ThinkBook 13x G4 21KR0008GE | |
| Microsoft Surface Pro Copilot+ | |
| HP Dragonfly G4 | |
| Cinebench R23 / Single Core | |
| Apple MacBook Air 13 M3 10C GPU | |
| HP Dragonfly G4 | |
| Dell XPS 13 9340 Core Ultra 7 | |
| Genomsnitt av klass Subnotebook (358 - 2165, n=75, senaste 2 åren) | |
| Framework Laptop 13.5 Ryzen 7 7840U | |
| Lenovo ThinkBook 13x G4 21KR0008GE | |
| Microsoft Surface Pro OLED Copilot+ | |
| Microsoft Surface Laptop 7 13.8 Copilot+ | |
| Genomsnitt Qualcomm Snapdragon X Elite X1E-80-100 (1273 - 1321, n=7) | |
| Microsoft Surface Pro Copilot+ | |
| Cinebench R20 / CPU (Multi Core) | |
| Framework Laptop 13.5 Ryzen 7 7840U | |
| Dell XPS 13 9340 Core Ultra 7 | |
| Genomsnitt av klass Subnotebook (579 - 8541, n=70, senaste 2 åren) | |
| Microsoft Surface Laptop 7 13.8 Copilot+ | |
| Lenovo ThinkBook 13x G4 21KR0008GE | |
| Microsoft Surface Pro OLED Copilot+ | |
| Genomsnitt Qualcomm Snapdragon X Elite X1E-80-100 (2539 - 4107, n=7) | |
| Microsoft Surface Pro Copilot+ | |
| HP Dragonfly G4 | |
| Cinebench R20 / CPU (Single Core) | |
| HP Dragonfly G4 | |
| Dell XPS 13 9340 Core Ultra 7 | |
| Lenovo ThinkBook 13x G4 21KR0008GE | |
| Framework Laptop 13.5 Ryzen 7 7840U | |
| Genomsnitt av klass Subnotebook (128 - 826, n=70, senaste 2 åren) | |
| Microsoft Surface Laptop 7 13.8 Copilot+ | |
| Microsoft Surface Pro OLED Copilot+ | |
| Genomsnitt Qualcomm Snapdragon X Elite X1E-80-100 (470 - 495, n=7) | |
| Microsoft Surface Pro Copilot+ | |
| Cinebench R15 / CPU Multi 64Bit | |
| Microsoft Surface Pro OLED Copilot+ | |
| Dell XPS 13 9340 Core Ultra 7 | |
| Framework Laptop 13.5 Ryzen 7 7840U | |
| Microsoft Surface Laptop 7 13.8 Copilot+ | |
| Microsoft Surface Pro Copilot+ | |
| Genomsnitt av klass Subnotebook (327 - 3345, n=75, senaste 2 åren) | |
| Genomsnitt Qualcomm Snapdragon X Elite X1E-80-100 (1476 - 2249, n=7) | |
| Lenovo ThinkBook 13x G4 21KR0008GE | |
| HP Dragonfly G4 | |
| Cinebench R15 / CPU Single 64Bit | |
| HP Dragonfly G4 | |
| Dell XPS 13 9340 Core Ultra 7 | |
| Genomsnitt av klass Subnotebook (72.4 - 322, n=71, senaste 2 åren) | |
| Framework Laptop 13.5 Ryzen 7 7840U | |
| Microsoft Surface Pro OLED Copilot+ | |
| Lenovo ThinkBook 13x G4 21KR0008GE | |
| Microsoft Surface Laptop 7 13.8 Copilot+ | |
| Genomsnitt Qualcomm Snapdragon X Elite X1E-80-100 (230 - 248, n=7) | |
| Microsoft Surface Pro Copilot+ | |
| Blender / v2.79 BMW27 CPU | |
| Apple MacBook Air 13 M3 10C GPU | |
| HP Dragonfly G4 | |
| Microsoft Surface Pro Copilot+ | |
| Genomsnitt av klass Subnotebook (159 - 2271, n=74, senaste 2 åren) | |
| Genomsnitt Qualcomm Snapdragon X Elite X1E-80-100 (331 - 510, n=7) | |
| Lenovo ThinkBook 13x G4 21KR0008GE | |
| Microsoft Surface Pro OLED Copilot+ | |
| Microsoft Surface Laptop 7 13.8 Copilot+ | |
| Dell XPS 13 9340 Core Ultra 7 | |
| Framework Laptop 13.5 Ryzen 7 7840U | |
| 7-Zip 18.03 / 7z b 4 | |
| Framework Laptop 13.5 Ryzen 7 7840U | |
| Dell XPS 13 9340 Core Ultra 7 | |
| Genomsnitt av klass Subnotebook (11668 - 77867, n=66, senaste 2 åren) | |
| Microsoft Surface Laptop 7 13.8 Copilot+ | |
| Microsoft Surface Pro OLED Copilot+ | |
| Genomsnitt Qualcomm Snapdragon X Elite X1E-80-100 (34299 - 46146, n=7) | |
| Microsoft Surface Pro Copilot+ | |
| HP Dragonfly G4 | |
| 7-Zip 18.03 / 7z b 4 -mmt1 | |
| Framework Laptop 13.5 Ryzen 7 7840U | |
| HP Dragonfly G4 | |
| Genomsnitt av klass Subnotebook (2643 - 6442, n=68, senaste 2 åren) | |
| Dell XPS 13 9340 Core Ultra 7 | |
| Microsoft Surface Pro OLED Copilot+ | |
| Microsoft Surface Laptop 7 13.8 Copilot+ | |
| Genomsnitt Qualcomm Snapdragon X Elite X1E-80-100 (5242 - 5359, n=7) | |
| Lenovo ThinkBook 13x G4 21KR0008GE | |
| Microsoft Surface Pro Copilot+ | |
| Geekbench 5.5 / Multi-Core | |
| Dell XPS 13 9340 Core Ultra 7 | |
| Apple MacBook Air 13 M3 10C GPU | |
| Framework Laptop 13.5 Ryzen 7 7840U | |
| Lenovo ThinkBook 13x G4 21KR0008GE | |
| Genomsnitt av klass Subnotebook (2557 - 17218, n=67, senaste 2 åren) | |
| HP Dragonfly G4 | |
| Geekbench 5.5 / Single-Core | |
| Apple MacBook Air 13 M3 10C GPU | |
| Framework Laptop 13.5 Ryzen 7 7840U | |
| HP Dragonfly G4 | |
| Genomsnitt av klass Subnotebook (726 - 2350, n=67, senaste 2 åren) | |
| Dell XPS 13 9340 Core Ultra 7 | |
| Lenovo ThinkBook 13x G4 21KR0008GE | |
| HWBOT x265 Benchmark v2.2 / 4k Preset | |
| Framework Laptop 13.5 Ryzen 7 7840U | |
| Dell XPS 13 9340 Core Ultra 7 | |
| Genomsnitt av klass Subnotebook (0.97 - 25.1, n=69, senaste 2 åren) | |
| Lenovo ThinkBook 13x G4 21KR0008GE | |
| HP Dragonfly G4 | |
| Microsoft Surface Laptop 7 13.8 Copilot+ | |
| Microsoft Surface Pro OLED Copilot+ | |
| Genomsnitt Qualcomm Snapdragon X Elite X1E-80-100 (4.74 - 7.53, n=7) | |
| Microsoft Surface Pro Copilot+ | |
| LibreOffice / 20 Documents To PDF | |
| Microsoft Surface Laptop 7 13.8 Copilot+ | |
| Genomsnitt Qualcomm Snapdragon X Elite X1E-80-100 (50.9 - 98.5, n=7) | |
| Microsoft Surface Pro Copilot+ | |
| Genomsnitt av klass Subnotebook (38.5 - 220, n=67, senaste 2 åren) | |
| Microsoft Surface Pro OLED Copilot+ | |
| Lenovo ThinkBook 13x G4 21KR0008GE | |
| Dell XPS 13 9340 Core Ultra 7 | |
| HP Dragonfly G4 | |
| Framework Laptop 13.5 Ryzen 7 7840U | |
| R Benchmark 2.5 / Overall mean | |
| Microsoft Surface Pro Copilot+ | |
| Genomsnitt Qualcomm Snapdragon X Elite X1E-80-100 (0.63 - 0.67, n=7) | |
| Microsoft Surface Pro OLED Copilot+ | |
| Microsoft Surface Laptop 7 13.8 Copilot+ | |
| Genomsnitt av klass Subnotebook (0.403 - 1.456, n=69, senaste 2 åren) | |
| Lenovo ThinkBook 13x G4 21KR0008GE | |
| Dell XPS 13 9340 Core Ultra 7 | |
| HP Dragonfly G4 | |
| Framework Laptop 13.5 Ryzen 7 7840U | |
* ... mindre är bättre
AIDA64: FP32 Ray-Trace | FPU Julia | CPU SHA3 | CPU Queen | FPU SinJulia | FPU Mandel | CPU AES | CPU ZLib | FP64 Ray-Trace | CPU PhotoWorxx
| Performance Rating | |
| Framework Laptop 13.5 Ryzen 7 7840U | |
| Dell XPS 13 9340 Core Ultra 7 | |
| Genomsnitt av klass Subnotebook | |
| Lenovo ThinkBook 13x G4 21KR0008GE | |
| Microsoft Surface Laptop 7 13.8 Copilot+ | |
| Genomsnitt Qualcomm Snapdragon X Elite X1E-80-100 | |
| Microsoft Surface Pro OLED Copilot+ | |
| HP Dragonfly G4 | |
| AIDA64 / FP32 Ray-Trace | |
| Framework Laptop 13.5 Ryzen 7 7840U | |
| Genomsnitt av klass Subnotebook (1135 - 32888, n=69, senaste 2 åren) | |
| Dell XPS 13 9340 Core Ultra 7 | |
| Lenovo ThinkBook 13x G4 21KR0008GE | |
| Microsoft Surface Laptop 7 13.8 Copilot+ | |
| HP Dragonfly G4 | |
| Genomsnitt Qualcomm Snapdragon X Elite X1E-80-100 (2184 - 7469, n=7) | |
| Microsoft Surface Pro OLED Copilot+ | |
| AIDA64 / FPU Julia | |
| Framework Laptop 13.5 Ryzen 7 7840U | |
| Dell XPS 13 9340 Core Ultra 7 | |
| Genomsnitt av klass Subnotebook (5218 - 123315, n=69, senaste 2 åren) | |
| Lenovo ThinkBook 13x G4 21KR0008GE | |
| HP Dragonfly G4 | |
| Microsoft Surface Laptop 7 13.8 Copilot+ | |
| Genomsnitt Qualcomm Snapdragon X Elite X1E-80-100 (5687 - 26391, n=7) | |
| Microsoft Surface Pro OLED Copilot+ | |
| AIDA64 / CPU SHA3 | |
| Framework Laptop 13.5 Ryzen 7 7840U | |
| Microsoft Surface Laptop 7 13.8 Copilot+ | |
| Dell XPS 13 9340 Core Ultra 7 | |
| Genomsnitt av klass Subnotebook (444 - 5287, n=69, senaste 2 åren) | |
| Genomsnitt Qualcomm Snapdragon X Elite X1E-80-100 (2607 - 3122, n=7) | |
| Microsoft Surface Pro OLED Copilot+ | |
| Lenovo ThinkBook 13x G4 21KR0008GE | |
| HP Dragonfly G4 | |
| AIDA64 / CPU Queen | |
| Framework Laptop 13.5 Ryzen 7 7840U | |
| Lenovo ThinkBook 13x G4 21KR0008GE | |
| Dell XPS 13 9340 Core Ultra 7 | |
| Genomsnitt av klass Subnotebook (10579 - 115682, n=69, senaste 2 åren) | |
| HP Dragonfly G4 | |
| Microsoft Surface Pro OLED Copilot+ | |
| Microsoft Surface Laptop 7 13.8 Copilot+ | |
| Genomsnitt Qualcomm Snapdragon X Elite X1E-80-100 (67219 - 69762, n=7) | |
| AIDA64 / FPU SinJulia | |
| Framework Laptop 13.5 Ryzen 7 7840U | |
| Dell XPS 13 9340 Core Ultra 7 | |
| Genomsnitt av klass Subnotebook (744 - 18418, n=69, senaste 2 åren) | |
| Lenovo ThinkBook 13x G4 21KR0008GE | |
| HP Dragonfly G4 | |
| Microsoft Surface Pro OLED Copilot+ | |
| Microsoft Surface Laptop 7 13.8 Copilot+ | |
| Genomsnitt Qualcomm Snapdragon X Elite X1E-80-100 (1521 - 2357, n=7) | |
| AIDA64 / FPU Mandel | |
| Framework Laptop 13.5 Ryzen 7 7840U | |
| Dell XPS 13 9340 Core Ultra 7 | |
| Genomsnitt av klass Subnotebook (3341 - 65433, n=69, senaste 2 åren) | |
| Lenovo ThinkBook 13x G4 21KR0008GE | |
| HP Dragonfly G4 | |
| Microsoft Surface Pro OLED Copilot+ | |
| Microsoft Surface Laptop 7 13.8 Copilot+ | |
| Genomsnitt Qualcomm Snapdragon X Elite X1E-80-100 (10117 - 15669, n=7) | |
| AIDA64 / CPU AES | |
| Framework Laptop 13.5 Ryzen 7 7840U | |
| Microsoft Surface Pro OLED Copilot+ | |
| Dell XPS 13 9340 Core Ultra 7 | |
| Microsoft Surface Laptop 7 13.8 Copilot+ | |
| Genomsnitt Qualcomm Snapdragon X Elite X1E-80-100 (39956 - 71089, n=7) | |
| Genomsnitt av klass Subnotebook (638 - 161430, n=69, senaste 2 åren) | |
| Lenovo ThinkBook 13x G4 21KR0008GE | |
| HP Dragonfly G4 | |
| AIDA64 / CPU ZLib | |
| Framework Laptop 13.5 Ryzen 7 7840U | |
| Dell XPS 13 9340 Core Ultra 7 | |
| Microsoft Surface Pro OLED Copilot+ | |
| Genomsnitt av klass Subnotebook (164.9 - 1379, n=69, senaste 2 åren) | |
| Microsoft Surface Laptop 7 13.8 Copilot+ | |
| Genomsnitt Qualcomm Snapdragon X Elite X1E-80-100 (398 - 802, n=7) | |
| Lenovo ThinkBook 13x G4 21KR0008GE | |
| HP Dragonfly G4 | |
| AIDA64 / FP64 Ray-Trace | |
| Framework Laptop 13.5 Ryzen 7 7840U | |
| Genomsnitt av klass Subnotebook (610 - 17495, n=69, senaste 2 åren) | |
| Dell XPS 13 9340 Core Ultra 7 | |
| Lenovo ThinkBook 13x G4 21KR0008GE | |
| Microsoft Surface Laptop 7 13.8 Copilot+ | |
| Genomsnitt Qualcomm Snapdragon X Elite X1E-80-100 (2581 - 4044, n=7) | |
| HP Dragonfly G4 | |
| Microsoft Surface Pro OLED Copilot+ | |
| AIDA64 / CPU PhotoWorxx | |
| Dell XPS 13 9340 Core Ultra 7 | |
| Lenovo ThinkBook 13x G4 21KR0008GE | |
| Genomsnitt av klass Subnotebook (6569 - 64588, n=69, senaste 2 åren) | |
| Microsoft Surface Pro OLED Copilot+ | |
| Microsoft Surface Laptop 7 13.8 Copilot+ | |
| HP Dragonfly G4 | |
| Genomsnitt Qualcomm Snapdragon X Elite X1E-80-100 (28474 - 38707, n=7) | |
| Framework Laptop 13.5 Ryzen 7 7840U | |
Systemets prestanda
I vardagliga situationer är Surface Laptop mycket responsiv och det är här du inte märker någon skillnad mot konkurrenterna. Det är dock viktigt att notera att ARM-versioner inte är tillgängliga för alla applikationer eller drivrutiner. Jämfört med bärbara datorer med AMD/Intel är du begränsad, särskilt när det gäller äldre kringutrustning som kräver en egen drivrutin (t.ex. skrivare, skannrar, externa ljudkort etc.).
WebXPRT 3: Overall
WebXPRT 4: Overall
Mozilla Kraken 1.1: Total
| CrossMark / Overall | |
| Apple MacBook Air 13 M3 10C GPU | |
| Framework Laptop 13.5 Ryzen 7 7840U | |
| Dell XPS 13 9340 Core Ultra 7 | |
| HP Dragonfly G4 | |
| Genomsnitt av klass Subnotebook (365 - 2018, n=67, senaste 2 åren) | |
| Lenovo ThinkBook 13x G4 21KR0008GE | |
| Microsoft Surface Pro OLED Copilot+ | |
| Microsoft Surface Laptop 7 13.8 Copilot+ | |
| Genomsnitt Qualcomm Snapdragon X Elite X1E-80-100, Qualcomm SD X Adreno X1-85 3.8 TFLOPS (1356 - 1443, n=7) | |
| CrossMark / Productivity | |
| Apple MacBook Air 13 M3 10C GPU | |
| Framework Laptop 13.5 Ryzen 7 7840U | |
| HP Dragonfly G4 | |
| Dell XPS 13 9340 Core Ultra 7 | |
| Genomsnitt av klass Subnotebook (364 - 1875, n=67, senaste 2 åren) | |
| Lenovo ThinkBook 13x G4 21KR0008GE | |
| Microsoft Surface Pro OLED Copilot+ | |
| Microsoft Surface Laptop 7 13.8 Copilot+ | |
| Genomsnitt Qualcomm Snapdragon X Elite X1E-80-100, Qualcomm SD X Adreno X1-85 3.8 TFLOPS (1271 - 1375, n=7) | |
| CrossMark / Creativity | |
| Apple MacBook Air 13 M3 10C GPU | |
| Dell XPS 13 9340 Core Ultra 7 | |
| Framework Laptop 13.5 Ryzen 7 7840U | |
| Genomsnitt av klass Subnotebook (372 - 2396, n=67, senaste 2 åren) | |
| HP Dragonfly G4 | |
| Lenovo ThinkBook 13x G4 21KR0008GE | |
| Microsoft Surface Pro OLED Copilot+ | |
| Microsoft Surface Laptop 7 13.8 Copilot+ | |
| Genomsnitt Qualcomm Snapdragon X Elite X1E-80-100, Qualcomm SD X Adreno X1-85 3.8 TFLOPS (1402 - 1537, n=7) | |
| CrossMark / Responsiveness | |
| Framework Laptop 13.5 Ryzen 7 7840U | |
| Microsoft Surface Pro OLED Copilot+ | |
| Dell XPS 13 9340 Core Ultra 7 | |
| HP Dragonfly G4 | |
| Apple MacBook Air 13 M3 10C GPU | |
| Genomsnitt av klass Subnotebook (312 - 1899, n=67, senaste 2 åren) | |
| Microsoft Surface Laptop 7 13.8 Copilot+ | |
| Genomsnitt Qualcomm Snapdragon X Elite X1E-80-100, Qualcomm SD X Adreno X1-85 3.8 TFLOPS (1237 - 1401, n=7) | |
| Lenovo ThinkBook 13x G4 21KR0008GE | |
| WebXPRT 3 / Overall | |
| Apple MacBook Air 13 M3 10C GPU | |
| Genomsnitt Qualcomm Snapdragon X Elite X1E-80-100, Qualcomm SD X Adreno X1-85 3.8 TFLOPS (430 - 455, n=7) | |
| Microsoft Surface Pro OLED Copilot+ | |
| Microsoft Surface Laptop 7 13.8 Copilot+ | |
| Framework Laptop 13.5 Ryzen 7 7840U | |
| Genomsnitt av klass Subnotebook (156 - 479, n=66, senaste 2 åren) | |
| HP Dragonfly G4 | |
| Dell XPS 13 9340 Core Ultra 7 | |
| Lenovo ThinkBook 13x G4 21KR0008GE | |
| WebXPRT 4 / Overall | |
| Apple MacBook Air 13 M3 10C GPU | |
| Genomsnitt Qualcomm Snapdragon X Elite X1E-80-100, Qualcomm SD X Adreno X1-85 3.8 TFLOPS (295 - 324, n=7) | |
| Microsoft Surface Laptop 7 13.8 Copilot+ | |
| Microsoft Surface Pro OLED Copilot+ | |
| HP Dragonfly G4 | |
| Genomsnitt av klass Subnotebook (132 - 348, n=67, senaste 2 åren) | |
| Dell XPS 13 9340 Core Ultra 7 | |
| Framework Laptop 13.5 Ryzen 7 7840U | |
| Lenovo ThinkBook 13x G4 21KR0008GE | |
| Mozilla Kraken 1.1 / Total | |
| Lenovo ThinkBook 13x G4 21KR0008GE | |
| Dell XPS 13 9340 Core Ultra 7 | |
| Genomsnitt av klass Subnotebook (278 - 1104, n=75, senaste 2 åren) | |
| Framework Laptop 13.5 Ryzen 7 7840U | |
| HP Dragonfly G4 | |
| Genomsnitt Qualcomm Snapdragon X Elite X1E-80-100, Qualcomm SD X Adreno X1-85 3.8 TFLOPS (391 - 422, n=7) | |
| Microsoft Surface Pro OLED Copilot+ | |
| Microsoft Surface Laptop 7 13.8 Copilot+ | |
| Apple MacBook Air 13 M3 10C GPU | |
* ... mindre är bättre
| AIDA64 / Memory Copy | |
| Dell XPS 13 9340 Core Ultra 7 | |
| Lenovo ThinkBook 13x G4 21KR0008GE | |
| Genomsnitt av klass Subnotebook (14554 - 109035, n=69, senaste 2 åren) | |
| Microsoft Surface Pro OLED Copilot+ | |
| Framework Laptop 13.5 Ryzen 7 7840U | |
| Microsoft Surface Laptop 7 13.8 Copilot+ | |
| Genomsnitt Qualcomm Snapdragon X Elite X1E-80-100 (44795 - 63495, n=7) | |
| HP Dragonfly G4 | |
| AIDA64 / Memory Read | |
| Microsoft Surface Pro OLED Copilot+ | |
| Microsoft Surface Laptop 7 13.8 Copilot+ | |
| Genomsnitt Qualcomm Snapdragon X Elite X1E-80-100 (58855 - 125604, n=7) | |
| Dell XPS 13 9340 Core Ultra 7 | |
| Lenovo ThinkBook 13x G4 21KR0008GE | |
| Genomsnitt av klass Subnotebook (15948 - 122210, n=69, senaste 2 åren) | |
| Framework Laptop 13.5 Ryzen 7 7840U | |
| HP Dragonfly G4 | |
| AIDA64 / Memory Write | |
| Genomsnitt av klass Subnotebook (15709 - 117898, n=69, senaste 2 åren) | |
| Framework Laptop 13.5 Ryzen 7 7840U | |
| Dell XPS 13 9340 Core Ultra 7 | |
| HP Dragonfly G4 | |
| Lenovo ThinkBook 13x G4 21KR0008GE | |
| Microsoft Surface Pro OLED Copilot+ | |
| Microsoft Surface Laptop 7 13.8 Copilot+ | |
| Genomsnitt Qualcomm Snapdragon X Elite X1E-80-100 (37270 - 45265, n=7) | |
| AIDA64 / Memory Latency | |
| Lenovo ThinkBook 13x G4 21KR0008GE | |
| Dell XPS 13 9340 Core Ultra 7 | |
| Genomsnitt av klass Subnotebook (7.2 - 187.8, n=68, senaste 2 åren) | |
| HP Dragonfly G4 | |
| Framework Laptop 13.5 Ryzen 7 7840U | |
| Genomsnitt Qualcomm Snapdragon X Elite X1E-80-100 (7.4 - 8.8, n=5) | |
| Microsoft Surface Laptop 7 13.8 Copilot+ | |
* ... mindre är bättre
DPC-latenstider
Vi kunde inte utföra vårt standardiserade latensprov eftersom LatencyMon-programmet inte startar på ARM-system. När vi spelade upp en 4K YouTube-video fanns det åtminstone inga problem med tappade bildrutor.
Masslagring
Microsoft har installerat en M.2 2230 SSD som enkelt kan bytas ut. Vår recensionenhet innehåller en 512 GB Samsung PM9B1-version, men du kommer bara att ha 416 GB till ditt förfogande efter den första installationen. Med upp till 3,6 GB/s är SSD-enhetens prestanda helt tillräcklig för daglig användning och dessutom är överföringshastigheterna stabila, även under perioder med ihållande belastning. Ytterligare SSD-benchmarks finns listade här.
* ... mindre är bättre
Continuous Performance Read: DiskSpd Read Loop, Queue Depth 8
Grafikkort - Adreno X1-85
För närvarande finns det två varianter av Adreno-X1-85-GPU och i kombination med X1E-80-100 används den långsammare versionen med klockfrekvensen 1,2 GHz (3,8 TFLOPS). I verkliga situationer är iGPU:n mer än tillräcklig och det finns inga problem att tala om, inte ens när man spelar upp högupplösta videor. När vi tittar på det inbyggda GPU-benchmarket, WildLife Extreme Unlimited, placerar sig Surface Laptop mellan Intel Arc Graphics med 8 kärnor såväl som AMD Radeon 780M.
Så långt så bra, men så snart du försöker spela spel blir saker och ting problematiska. Det finns väldigt få inbyggda ARM-spel och vi stötte ständigt på problem i våra tester. Ibland startade inte ens spelen (Far Cry 5, Prince of Persia The Lost Crown, Witcher 3, F1 23 & F1 24) och sedan uppstod det ibland grafiska fel/krascher vid högre inställningar (Shadow of the Tomb Raider, Total War Pharaoh) eller så kraschade spelet helt enkelt (Cyberpunk 2077). I framtiden bör situationen förbättras, men den som vill spela några spel ibland bör undvika bärbara Snapdragon-datorer.
GPU-prestandan förblev stabil både under perioder av ihållande belastning och i batteriläge. Ytterligare GPU-benchmarks finns tillgängliga här.
| 3DMark 11 Performance | 6855 poäng | |
| 3DMark Fire Strike Score | 5727 poäng | |
| 3DMark Time Spy Score | 1868 poäng | |
| 3DMark Steel Nomad Score | 476 poäng | |
| 3DMark Steel Nomad Light Score | 2005 poäng | |
| 3DMark Steel Nomad Light Unlimited Score | 1932 poäng | |
Hjälp | ||
| Blender / v3.3 Classroom METAL | |
| Genomsnitt av klass Subnotebook (103 - 237, n=4, senaste 2 åren) | |
| Apple MacBook Air 13 M3 10C GPU | |
| Blender / v3.3 Classroom CPU | |
| HP Dragonfly G4 | |
| Lenovo ThinkBook 13x G4 21KR0008GE | |
| Genomsnitt Qualcomm SD X Adreno X1-85 3.8 TFLOPS (545 - 899, n=12) | |
| Microsoft Surface Pro OLED Copilot+ | |
| Microsoft Surface Laptop 7 13.8 Copilot+ | |
| Genomsnitt av klass Subnotebook (241 - 1127, n=71, senaste 2 åren) | |
| Apple MacBook Air 13 M3 10C GPU | |
| Dell XPS 13 9340 Core Ultra 7 | |
| Framework Laptop 13.5 Ryzen 7 7840U | |
* ... mindre är bättre
| Cyberpunk 2077 2.2 Phantom Liberty - 1920x1080 Ultra Preset (FSR off) | |
| Genomsnitt av klass Subnotebook (8.48 - 31.4, n=47, senaste 2 åren) | |
| Lenovo ThinkBook 13x G4 21KR0008GE | |
| Microsoft Surface Laptop 7 13.8 Copilot+ | |
| Microsoft Surface Pro OLED Copilot+ | |
| GTA V - 1920x1080 Highest Settings possible AA:4xMSAA + FX AF:16x | |
| Microsoft Surface Laptop 7 13.8 Copilot+ | |
| Genomsnitt av klass Subnotebook (7.81 - 53, n=66, senaste 2 åren) | |
| Lenovo ThinkBook 13x G4 21KR0008GE | |
| Dell XPS 13 9340 Core Ultra 7 | |
| HP Dragonfly G4 | |
| Baldur's Gate 3 - 1920x1080 Ultra Preset | |
| Genomsnitt av klass Subnotebook (12.1 - 31.1, n=43, senaste 2 åren) | |
| Apple MacBook Air 13 M3 10C GPU | |
| Microsoft Surface Laptop 7 13.8 Copilot+ | |
| Microsoft Surface Pro OLED Copilot+ | |
Cyberpunk 2077 ultra FPS diagram
| låg | med. | hög | ultra | |
|---|---|---|---|---|
| GTA V (2015) | 100.6 | 96.3 | 50 | 21.5 |
| Dota 2 Reborn (2015) | 85.9 | 65.7 | 61.7 | 53.2 |
| Final Fantasy XV Benchmark (2018) | 57.3 | 24.9 | 15.8 | |
| X-Plane 11.11 (2018) | 37.8 | |||
| Strange Brigade (2018) | 137 | 51 | 43 | 36 |
| Shadow of the Tomb Raider (2018) | 60 | 25 | 23 | |
| F1 22 (2022) | 57 | 50.1 | 38 | |
| Baldur's Gate 3 (2023) | 24.7 | 20.3 | 17.5 | 17 |
| Cyberpunk 2077 2.2 Phantom Liberty (2023) | 22.7 | 18.9 | 16.4 | 14.3 |
| Total War Pharaoh (2023) | 87.6 | 55.2 |
Utsläpp - Mycket tyst i vardagliga situationer
Bullerutsläpp
Fläkten på Surface Laptop 13.8 är i allmänhet ohörbar vid daglig användning. Den förblir avaktiverad under långa perioder och med 26 dB(A) under lite belastning är den också mycket tyst. När vi spelade lyckades vi få ut maximalt 31,5 dB(A) från enheten. Fläkten lyckades bara snabbt nå sin högsta nivå på cirka 40 dB(A) under full CPU-belastning och under stresstestet. Vi kunde inte upptäcka några andra elektroniska ljud.
Ljudnivå
| Låg belastning |
| 23.8 / 23.8 / 23.8 dB(A) |
| Hög belastning |
| 26 / 40.3 dB(A) |
 | ||
30 dB tyst 40 dB(A) hörbar 50 dB(A) högt ljud |
||
min: | ||
| Microsoft Surface Laptop 7 13.8 Copilot+ Adreno X1-85 3.8 TFLOPS, SD X Elite X1E-80-100, Samsung MZ9L4512HBLU-00BMV | Lenovo ThinkBook 13x G4 21KR0008GE Arc 7-Core, Ultra 5 125H, Samsung PM9C1a MZAL8512HDLU | Dell XPS 13 9340 Core Ultra 7 Arc 8-Core, Ultra 7 155H, Micron 2550 512GB | Apple MacBook Air 13 M3 10C GPU M3 10-Core GPU, M3, Apple SSD AP0512Z | Framework Laptop 13.5 Ryzen 7 7840U Radeon 780M, R7 7840U, WD PC SN740 512GB SDDPNQD-512G | HP Dragonfly G4 Iris Xe G7 96EUs, i7-1365U, Micron 3400 MTFDKBA512TFH 512GB | |
|---|---|---|---|---|---|---|
| Noise | -9% | -12% | -8% | -0% | ||
| av / miljö * | 23.8 | 24.5 -3% | 25.1 -5% | 22.6 5% | 23.3 2% | |
| Idle Minimum * | 23.8 | 24.5 -3% | 25.1 -5% | 22.6 5% | 23.5 1% | |
| Idle Average * | 23.8 | 24.5 -3% | 25.1 -5% | 22.6 5% | 23.5 1% | |
| Idle Maximum * | 23.8 | 27.1 -14% | 25.1 -5% | 24.2 -2% | 26.8 -13% | |
| Load Average * | 26 | 33.3 -28% | 37.4 -44% | 35.8 -38% | 27.2 -5% | |
| Cyberpunk 2077 ultra * | 31.5 | |||||
| Load Maximum * | 40.3 | 40.7 -1% | 42.5 -5% | 48.9 -21% | 35 13% | |
| Witcher 3 ultra * | 36.8 | 42.5 | 46.5 | 32.7 |
* ... mindre är bättre
Temperatur
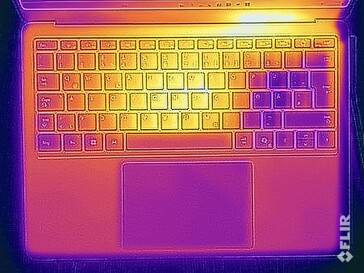
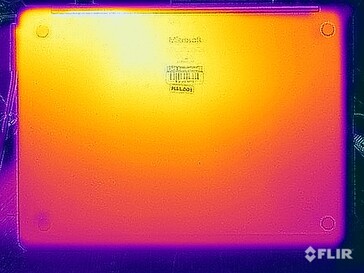
Vid tomgångskörning och under krävande uppgifter i verkliga livet värms metallhöljet knappt upp. När du spelar och i synnerhet under hög CPU-belastning ändras det snabbt och vi uppmätte upp till 47 °C på enhetens bas. Detta är redan obehagligt på grund av metallhöljet och i den här typen av situationer bör du undvika att placera den bärbara datorn i knät. På samma sätt blir tangentbordet obehagligt varmt och det kan leda till begränsningar när du skriver.
(-) Den maximala temperaturen på ovansidan är 47.1 °C / 117 F, jämfört med genomsnittet av 35.9 °C / 97 F , allt från 21.4 till 59 °C för klassen Subnotebook.
(±) Botten värms upp till maximalt 44.6 °C / 112 F, jämfört med genomsnittet av 39.3 °C / 103 F
(+) Vid tomgångsbruk är medeltemperaturen för ovansidan 24.3 °C / 76 F, jämfört med enhetsgenomsnittet på 30.8 °C / ### class_avg_f### F.
(-) 3: The average temperature for the upper side is 40.9 °C / 106 F, compared to the average of 30.8 °C / 87 F for the class Subnotebook.
(+) Handledsstöden och pekplattan når maximal hudtemperatur (35.8 °C / 96.4 F) och är därför inte varma.
(-) Medeltemperaturen för handledsstödsområdet på liknande enheter var 28.2 °C / 82.8 F (-7.6 °C / -13.6 F).
| Microsoft Surface Laptop 7 13.8 Copilot+ Qualcomm Snapdragon X Elite X1E-80-100, Qualcomm SD X Adreno X1-85 3.8 TFLOPS | Lenovo ThinkBook 13x G4 21KR0008GE Intel Core Ultra 5 125H, Intel Arc 7-Core iGPU | Dell XPS 13 9340 Core Ultra 7 Intel Core Ultra 7 155H, Intel Arc 8-Core iGPU | Apple MacBook Air 13 M3 10C GPU Apple M3, Apple M3 10-Core GPU | Framework Laptop 13.5 Ryzen 7 7840U AMD Ryzen 7 7840U, AMD Radeon 780M | HP Dragonfly G4 Intel Core i7-1365U, Intel Iris Xe Graphics G7 96EUs | |
|---|---|---|---|---|---|---|
| Heat | -2% | 2% | 7% | -8% | -1% | |
| Maximum Upper Side * | 47.1 | 43.1 8% | 41 13% | 44.3 6% | 42 11% | 38.6 18% |
| Maximum Bottom * | 44.6 | 39.2 12% | 43.5 2% | 43.4 3% | 47.4 -6% | 40.4 9% |
| Idle Upper Side * | 24.7 | 28.3 -15% | 25.3 -2% | 22.3 10% | 28.8 -17% | 28.2 -14% |
| Idle Bottom * | 24.5 | 28 -14% | 25.5 -4% | 22.1 10% | 29.6 -21% | 29 -18% |
* ... mindre är bättre
Högtalare
Stereohögtalarna gör sitt jobb bra och överlag är kvaliteten liknande den hos Dell XPS 13 9340 men en aning sämre än MacBook Air 13 M3 och särskilt ThinkBook 13x G4. Även om du bara märker detta i en direkt jämförelse.
Microsoft Surface Laptop 7 13.8 Copilot+ ljudanalys
(±) | högtalarljudstyrkan är genomsnittlig men bra (81.8 dB)
Bas 100 - 315 Hz
(±) | reducerad bas - i genomsnitt 12.7% lägre än medianen
(±) | linjäriteten för basen är genomsnittlig (9.8% delta till föregående frekvens)
Mellan 400 - 2000 Hz
(+) | balanserad mellan - endast 4.1% från medianen
(+) | mids är linjära (2.4% delta till föregående frekvens)
Högsta 2 - 16 kHz
(+) | balanserade toppar - endast 2.1% från medianen
(+) | toppar är linjära (2.5% delta till föregående frekvens)
Totalt 100 - 16 000 Hz
(+) | det totala ljudet är linjärt (12.1% skillnad mot median)
Jämfört med samma klass
» 13% av alla testade enheter i den här klassen var bättre, 4% liknande, 83% sämre
» Den bästa hade ett delta på 5%, genomsnittet var 19%, sämst var 53%
Jämfört med alla testade enheter
» 8% av alla testade enheter var bättre, 2% liknande, 90% sämre
» Den bästa hade ett delta på 4%, genomsnittet var 24%, sämst var 134%
Lenovo ThinkBook 13x G4 21KR0008GE ljudanalys
(+) | högtalare kan spela relativt högt (83.8 dB)
Bas 100 - 315 Hz
(±) | reducerad bas - i genomsnitt 9% lägre än medianen
(±) | linjäriteten för basen är genomsnittlig (8% delta till föregående frekvens)
Mellan 400 - 2000 Hz
(+) | balanserad mellan - endast 2.4% från medianen
(+) | mids är linjära (2.9% delta till föregående frekvens)
Högsta 2 - 16 kHz
(+) | balanserade toppar - endast 3.2% från medianen
(+) | toppar är linjära (3.4% delta till föregående frekvens)
Totalt 100 - 16 000 Hz
(+) | det totala ljudet är linjärt (8.6% skillnad mot median)
Jämfört med samma klass
» 3% av alla testade enheter i den här klassen var bättre, 1% liknande, 97% sämre
» Den bästa hade ett delta på 5%, genomsnittet var 19%, sämst var 53%
Jämfört med alla testade enheter
» 2% av alla testade enheter var bättre, 1% liknande, 97% sämre
» Den bästa hade ett delta på 4%, genomsnittet var 24%, sämst var 134%
Dell XPS 13 9340 Core Ultra 7 ljudanalys
(+) | högtalare kan spela relativt högt (83.2 dB)
Bas 100 - 315 Hz
(-) | nästan ingen bas - i genomsnitt 17% lägre än medianen
(±) | linjäriteten för basen är genomsnittlig (9.3% delta till föregående frekvens)
Mellan 400 - 2000 Hz
(+) | balanserad mellan - endast 2.1% från medianen
(+) | mids är linjära (4.7% delta till föregående frekvens)
Högsta 2 - 16 kHz
(+) | balanserade toppar - endast 2.5% från medianen
(+) | toppar är linjära (4.6% delta till föregående frekvens)
Totalt 100 - 16 000 Hz
(+) | det totala ljudet är linjärt (11.6% skillnad mot median)
Jämfört med samma klass
» 12% av alla testade enheter i den här klassen var bättre, 3% liknande, 85% sämre
» Den bästa hade ett delta på 5%, genomsnittet var 19%, sämst var 53%
Jämfört med alla testade enheter
» 7% av alla testade enheter var bättre, 2% liknande, 91% sämre
» Den bästa hade ett delta på 4%, genomsnittet var 24%, sämst var 134%
Apple MacBook Air 13 M3 10C GPU ljudanalys
(+) | högtalare kan spela relativt högt (83.2 dB)
Bas 100 - 315 Hz
(±) | reducerad bas - i genomsnitt 13.3% lägre än medianen
(±) | linjäriteten för basen är genomsnittlig (11.3% delta till föregående frekvens)
Mellan 400 - 2000 Hz
(+) | balanserad mellan - endast 0.4% från medianen
(+) | mids är linjära (1.6% delta till föregående frekvens)
Högsta 2 - 16 kHz
(+) | balanserade toppar - endast 4.5% från medianen
(+) | toppar är linjära (1.9% delta till föregående frekvens)
Totalt 100 - 16 000 Hz
(+) | det totala ljudet är linjärt (10.7% skillnad mot median)
Jämfört med samma klass
» 8% av alla testade enheter i den här klassen var bättre, 3% liknande, 89% sämre
» Den bästa hade ett delta på 5%, genomsnittet var 19%, sämst var 53%
Jämfört med alla testade enheter
» 5% av alla testade enheter var bättre, 1% liknande, 94% sämre
» Den bästa hade ett delta på 4%, genomsnittet var 24%, sämst var 134%
Energihantering - Förbättrad effektivitet
Strömförbrukning
Den nya Surface Laptop är särskilt effektiv vid tomgångskörning med minimal ljusstyrka på skärmen, men vid hög ljusstyrka gör sig naturligtvis de 600 cd/m² påminda. Under belastning ligger förbrukningen på maximalt 41 watt och vid gaming är siffran strax under 39 watt. Det medföljande nätaggregatet på 39 watt är tillräckligt för att klara effektkraven, men i det här användningsfallet saknar det kapacitet för att kunna ladda batteriet samtidigt. Microsoft borde åtminstone ha levererat Snapdragon X Elite-versionerna med en kraftfullare PSU.
| Av/Standby | |
| Låg belastning | |
| Hög belastning |
|
Förklaring:
min: | |
| Microsoft Surface Laptop 7 13.8 Copilot+ SD X Elite X1E-80-100, Adreno X1-85 3.8 TFLOPS, Samsung MZ9L4512HBLU-00BMV, IPS, 2304x1536, 13.8" | Lenovo ThinkBook 13x G4 21KR0008GE Ultra 5 125H, Arc 7-Core, Samsung PM9C1a MZAL8512HDLU, IPS, 2880x1920, 13.5" | Dell XPS 13 9340 Core Ultra 7 Ultra 7 155H, Arc 8-Core, Micron 2550 512GB, IPS, 1920x1200, 13.4" | Apple MacBook Air 13 M3 10C GPU M3, M3 10-Core GPU, Apple SSD AP0512Z, IPS, 2560x1664, 13.6" | Framework Laptop 13.5 Ryzen 7 7840U R7 7840U, Radeon 780M, WD PC SN740 512GB SDDPNQD-512G, IPS, 2256x1504, 13.5" | HP Dragonfly G4 i7-1365U, Iris Xe G7 96EUs, Micron 3400 MTFDKBA512TFH 512GB, IPS, 1920x1280, 13.5" | Genomsnitt Qualcomm SD X Adreno X1-85 3.8 TFLOPS | Genomsnitt av klass Subnotebook | |
|---|---|---|---|---|---|---|---|---|
| Power Consumption | -96% | -66% | -22% | -58% | -63% | -47% | -76% | |
| Idle Minimum * | 1.4 | 5.4 -286% | 3.8 -171% | 1.95 -39% | 4 -186% | 4.1 -193% | 3.61 ? -158% | 4.31 ? -208% |
| Idle Average * | 6.3 | 7.8 -24% | 7 -11% | 8.7 -38% | 6.5 -3% | 7.5 -19% | 6.9 ? -10% | 7.33 ? -16% |
| Idle Maximum * | 7.6 | 8.9 -17% | 7.3 4% | 8.9 -17% | 6.8 11% | 8.2 -8% | 7.87 ? -4% | 9.09 ? -20% |
| Load Average * | 26.9 | 49.4 -84% | 52.6 -96% | 34.3 -28% | 48 -78% | 35.5 -32% | 30.2 ? -12% | 44.9 ? -67% |
| Cyberpunk 2077 ultra * | 38.5 | |||||||
| Load Maximum * | 40.7 | 68.8 -69% | 62.7 -54% | 35.4 13% | 55.2 -36% | 66.5 -63% | 61 ? -50% | 68.7 ? -69% |
| Witcher 3 ultra * | 44.4 | 38.3 | 28.6 | 52.3 | 37.5 |
* ... mindre är bättre
Power consumption Cyberpunk 2077 / stress test
Power consumption with an external monitor
Batteriets livslängd
Drifttiderna med 55 Wh-batteriet är samtidigt mycket bra men inte enastående. I Wi-Fi-testet, vid 150 d/m² (vilket motsvarar 57 % av recensionenhetens maximala ljusstyrka), klarade vi lite mer än 14 timmar vid 60 Hz och 13 timmar vid 120 Hz. Vid full ljusstyrka förkortas dessa siffror till 7 timmar och 47 minuter (60 Hz) och 7 timmar och 27 minuter (120 Hz). Detta innebär att Surface Laptop ligger efter både MacBook Air och HP Dragonfly G4.
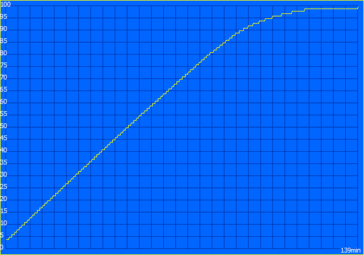
Med 19 timmar och 41 minuter i videotestet presterade Microsofts bärbara dator mycket bra, men slås i detta scenario av till exempel ThinkBook 13x G4. Under belastning slocknar däremot lamporna efter 80 minuter. Med enheten påslagen tar en komplett laddningscykel med 39-watts nätaggregat 139 minuter (80 % efter 82 minuter) och med 65-watts nätaggregat 111 minuter (80 % efter 58 minuter).
| Microsoft Surface Laptop 7 13.8 Copilot+ SD X Elite X1E-80-100, Adreno X1-85 3.8 TFLOPS, 54 Wh | Lenovo ThinkBook 13x G4 21KR0008GE Ultra 5 125H, Arc 7-Core, 74 Wh | Dell XPS 13 9340 Core Ultra 7 Ultra 7 155H, Arc 8-Core, 55 Wh | Apple MacBook Air 13 M3 10C GPU M3, M3 10-Core GPU, 52.6 Wh | Framework Laptop 13.5 Ryzen 7 7840U R7 7840U, Radeon 780M, 61 Wh | HP Dragonfly G4 i7-1365U, Iris Xe G7 96EUs, 68 Wh | Genomsnitt av klass Subnotebook | |
|---|---|---|---|---|---|---|---|
| Batteridrifttid | 10% | 14% | 36% | -15% | 76% | 8% | |
| H.264 | 1181 | 1229 4% | 1053 -11% | 1044 -12% | 963 ? -18% | ||
| WiFi v1.3 | 852 | 684 -20% | 769 -10% | 914 7% | 726 -15% | 954 12% | 757 ? -11% |
| Load | 80 | 116 45% | 131 64% | 171 114% | 192 140% | 122 ? 53% |
För
Emot
Bedömning - En bra bärbar dator med kompatibilitetsproblem
Den nya Surface Laptop Copilot+ är i grunden en bra bärbar dator men det finns begränsningar som kunder bör känna till. I huvudsak erbjuder den nya Snapdragon-processorn bra prestanda och ARM-versionen av Windows körs också mycket bra. Det är därför du inte bör märka någon skillnad mellan ARM-enheten och AMD- eller Intel-baserade processorer när det gäller vardaglig användning. Det finns dock kompatibilitetsbegränsningar eftersom inte alla applikationer fungerar och i synnerhet finns det problem med äldre programvaruversioner eller program som kräver speciella drivrutiner. Det gäller också spel, där det finns många problem. Dessutom märker du under full belastning att det lilla kylsystemet med den bärbara datorn blir betydligt bullrigt och varmt.
När det gäller själva hårdvaran har vi bara skäl till en liten mängd kritik eftersom metallhöljet är premium och lätt kan öppnas. Inmatningsenheterna är mycket bra, IPS imponerar bortsett från de starka reflektionerna och batteritiden är också mycket bra med tanke på batterikapaciteten. Som vanligt beror det dock på hur du använder den, för om du pressar enheten hårt kommer batteriet att ta slut efter mindre än 1,5 timmar. Några av konkurrenterna klarar också längre drifttider.
Den nya Surface Laptop 13.8 Copilot+ är en mycket bra dator för vardagliga användare som använder aktuella programvaruversioner och inte vill spela spel. Den billigare basversionen med Snapdragon X Plus är dock mycket mer meningsfull för detta scenario.
Om du kan hantera begränsningarna skulle vi fortfarande rekommendera basvarianten med Snapdragon X Plus. Specifikationerna är mer eller mindre identiska och, i vår analysobserverade vi redan att Snapdragon X Plus inte körs påtagligt långsammare i vardagliga situationer. 256 GG SSD kan enkelt bytas ut vilket innebär att du kan undvika Microsofts höga tilläggsavgifter ($ 250 för uppgraderingen från 256 till 512 GB).
Jämfört med Apple MacBook Air 13erbjuder Surface Laptop vissa fördelar, till exempel SSD-expansionen, den något ljusare pekskärmen med 120 Hz eller USB-A-porten som fortfarande är relevant i vardagen. När det gäller batteritiden är det jämnt, men MacBook Air är betydligt smalare och har fortfarande den stora fördelen att den är passivt kyld.
En jämförelse med andra aktuella bärbara Windows-datorer är inte heller fördelaktig för Surface Laptop eftersom priset på recensionsenheten är högt och, bortsett från de något tystare fläktarna i vardagliga situationer samt den extra Copilot+ AI-funktionen (som dock är tidsbegränsad och snart kommer att finnas tillgänglig på de kommande Zen5- och Lunar Lake-datorerna), finns det inga riktiga argument för en bärbar Windows-dator med en ARM-processor. Med ett standard 5G-modem hade man kunnat få en fördel, men Microsoft har valt att inte implementera detta i sin Surface Laptop.
Pris och tillgänglighet
Den nya Surface Laptop 13 Copilot+ med Snapdragon X Elite kan beställas på Amazon för 1 669 USD. Basmodellen med Snapdragon X Plus och en 256 GB SSD kostar 1 069 dollar.
Obs: Vi har nyligen uppdaterat vårt betygssystem och resultaten från version 8 är inte jämförbara med resultaten från version 7. Mer information finns tillgänglig här .
Microsoft Surface Laptop 7 13.8 Copilot+
- 07/04/2024 v8
Andreas Osthoff
Genomskinlighet
Valet av enheter som ska granskas görs av vår redaktion. Testprovet gavs till författaren som ett lån av tillverkaren eller återförsäljaren för denna recension. Långivaren hade inget inflytande på denna recension och inte heller fick tillverkaren en kopia av denna recension innan publiceringen. Det fanns ingen skyldighet att publicera denna recension. Vi accepterar aldrig ersättning eller betalning i utbyte mot våra recensioner. Som ett oberoende medieföretag är Notebookcheck inte föremål för auktoritet från tillverkare, återförsäljare eller förlag.
This is how Notebookcheck is testingEvery year, Notebookcheck independently reviews hundreds of laptops and smartphones using standardized procedures to ensure that all results are comparable. We have continuously developed our test methods for around 20 years and set industry standards in the process. In our test labs, high-quality measuring equipment is utilized by experienced technicians and editors. These tests involve a multi-stage validation process. Our complex rating system is based on hundreds of well-founded measurements and benchmarks, which maintains objectivity.













 Total Sustainability Score:


