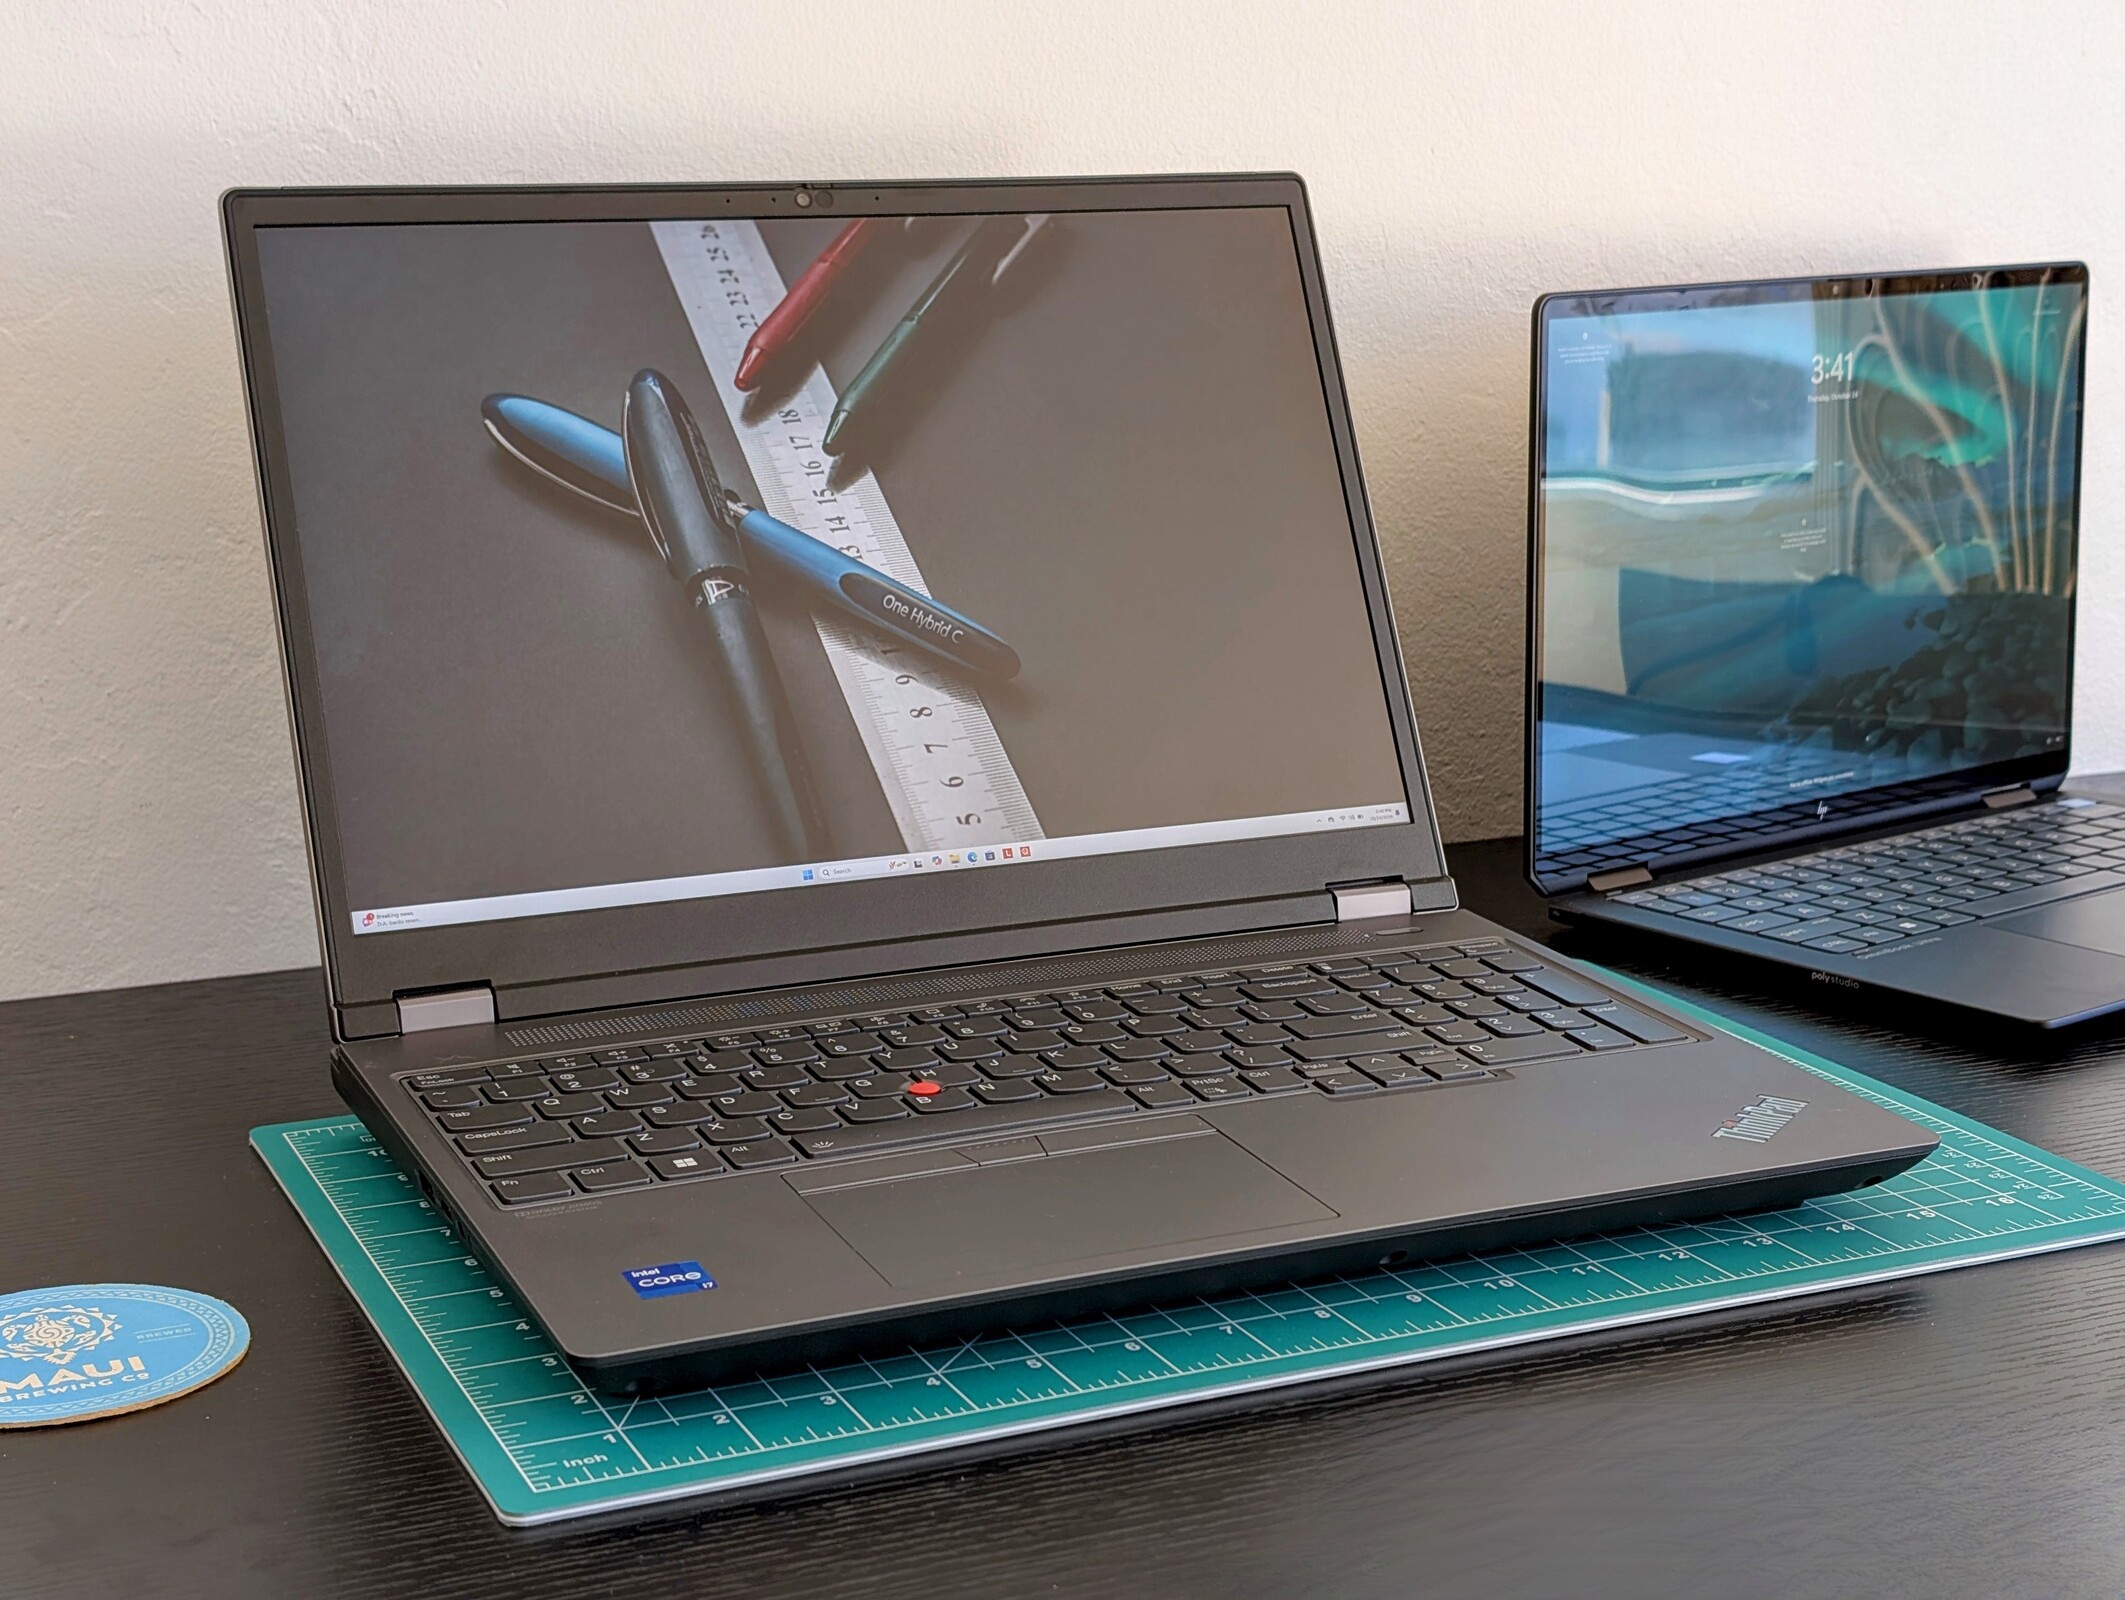
Test av Lenovo ThinkPad P16 Gen 2 arbetsstation: Tung med superladdad grafik
Nvidia RTX 4000 Ada debuterar med imponerande siffror.
Med 130 W TGP-grafikalternativet är detta en av de snabbaste 16-tums arbetsstationerna i Lenovos portfölj. Aspekter som temperatur och fläktljud är dock varmare respektive mer högljudda än genomsnittet, till följd av den krävande GPU:n.Allen Ngo (översatt av DeepL / Ninh Duy) Publicerad 🇺🇸 🇫🇷 ...
Domslut - Makt har ett pris
ThinkPad P16 Gen 2 prioriterar prestanda även om det innebär ett större, tyngre, mer högljutt och varmare system. Om du kan hantera nackdelarna kommer du att tycka att dess 130 W RTX 4000 Ada är ett monster till mobil arbetsstation.
ThinkPad P16 Gen 2 klarar krävande arbetsbelastningar med sin krävande 130 W TGP-grafik och skiljer sig därmed från de flesta andra 16-tums arbetsstationer.
Den kanske mest anmärkningsvärda nackdelen är att GPU:n kan strypas med cirka 10 procent efter några minuters belastning, vilket tyder på att kylningslösningen inte klarar GPU:ns fulla krav på obestämd tid. Batteritiden är också mycket kort, bara några timmar som mest. Trots detta är ThinkPad P16 Gen 2 fortfarande en av de snabbaste arbetsstationerna i sin 16-tums storleksklass.
För
Emot
Pris och tillgänglighet
Lenovo levererar nu ThinkPad P16 Gen 2 direkt från sin onlinebutik från $1850 eller $3770 USD om den är konfigurerad med RTX 4000. Ett litet antal SKU:er finns också tillgängliga via Amazon.
Price comparison
Potentiella konkurrenter i jämförelse
Bild | Modell / recensioner | Geizhals | Vikt | Höjd | Skärm |
|---|---|---|---|---|---|
1. 85.9%  | Lenovo ThinkPad P16 Gen 2 Intel Core i7-14700HX ⎘ NVIDIA RTX 4000 Ada Generation Laptop ⎘ 32 GB Minne, 1024 GB SSD | Listenpreis 3500 USD Geizhals Suche | 3.1 kg | 30.23 mm | 16.00" 2560x1600 189 PPI IPS |
2. 90.2% v7 (old)  | Lenovo ThinkPad P16 G2 21FA000FGE Intel Core i7-13700HX ⎘ NVIDIA RTX 2000 Ada Generation Laptop ⎘ 32 GB Minne, 1024 GB SSD | 3 kg | 30.23 mm | 16.00" 2560x1600 189 PPI IPS LED | |
3. 88.6% v7 (old)  | Lenovo ThinkPad P16s G2 21K9000CGE AMD Ryzen 7 PRO 7840U ⎘ AMD Radeon 780M ⎘ 32 GB Minne, 1024 GB SSD | 1.8 kg | 24.4 mm | 16.00" 3840x2400 283 PPI OLED | |
4. 91% v7 (old)  | Lenovo ThinkPad P16 G1 RTX A5500 Intel Core i9-12950HX ⎘ NVIDIA RTX A5500 Laptop GPU ⎘ 64 GB Minne, 2048 GB SSD | Listenpreis 9000 USD | 3 kg | 30.23 mm | 16.00" 3840x2400 283 PPI IPS |
5. 85.4%  | HP ZBook Power 16 G11 A AMD Ryzen 7 8845HS ⎘ NVIDIA RTX 2000 Ada Generation Laptop ⎘ 64 GB Minne, 2048 GB SSD | 2.2 kg | 22.9 mm | 16.00" 2560x1600 189 PPI IPS | |
6. 88.3% v7 (old)  | Dell Precision 5690 Intel Core Ultra 9 185H ⎘ NVIDIA RTX 5000 Ada Generation Laptop ⎘ 32 GB Minne, 2048 GB SSD | 2.3 kg | 22.17 mm | 16.00" 3840x2400 283 PPI OLED |
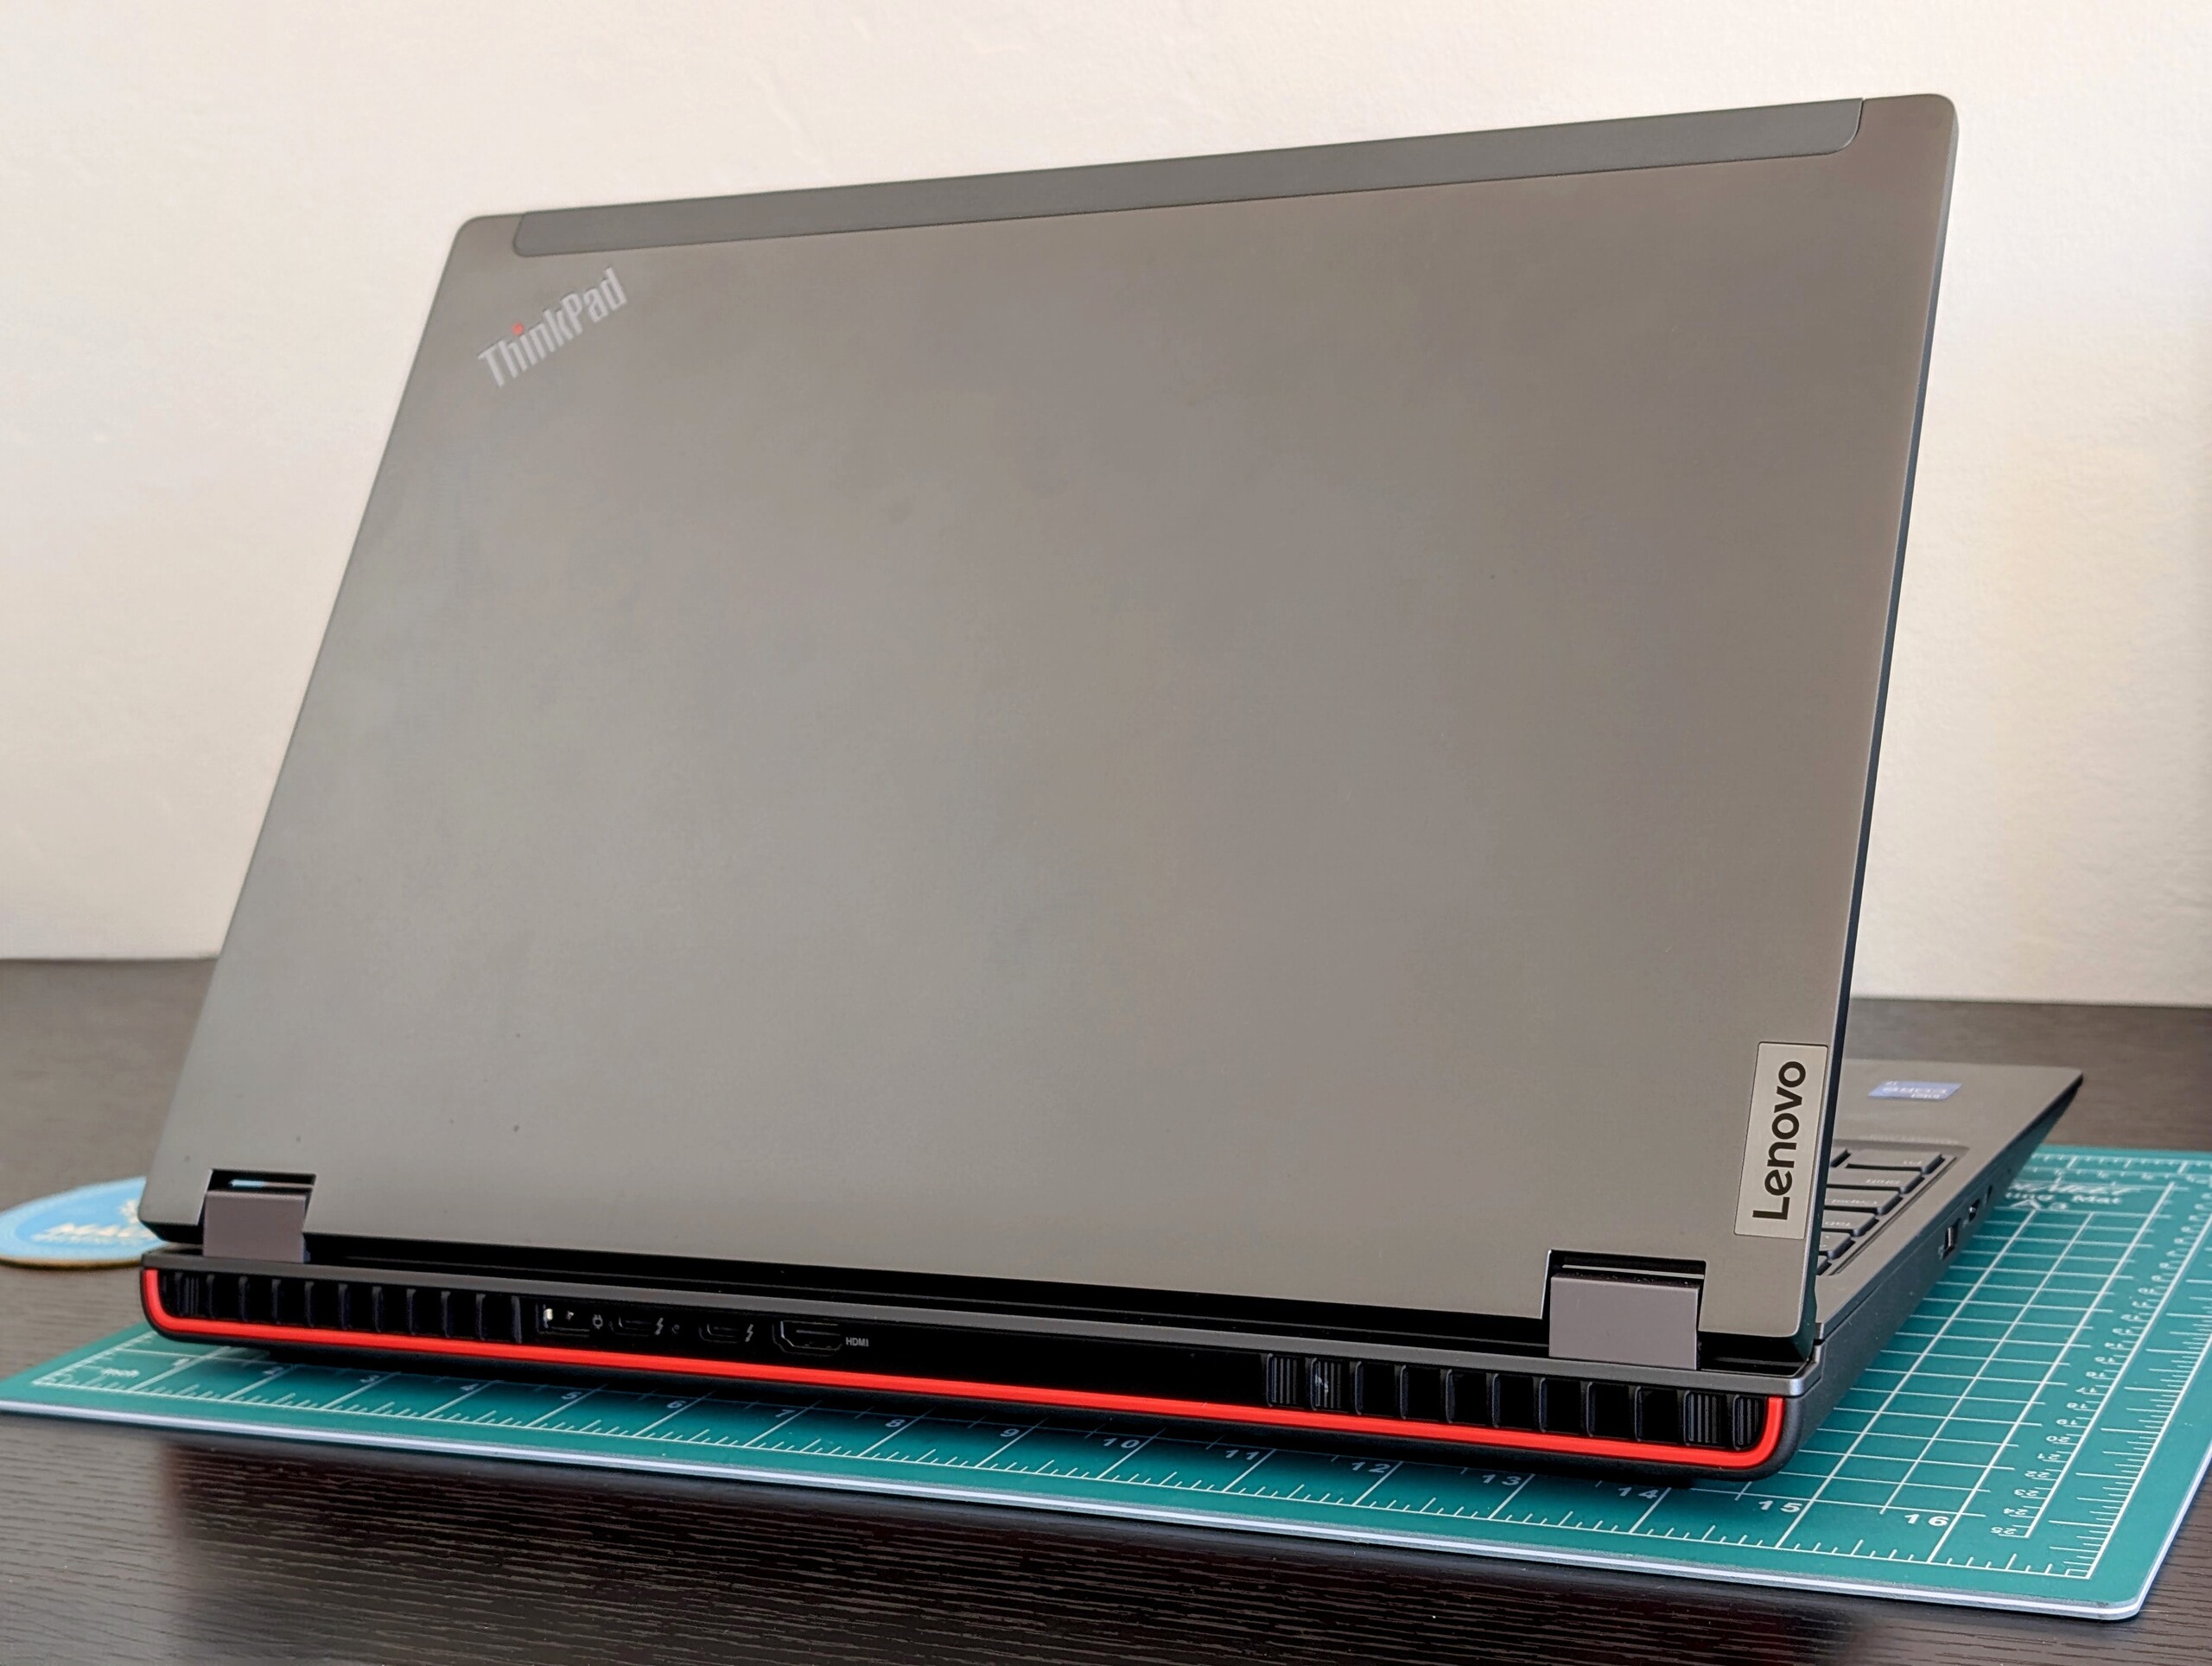
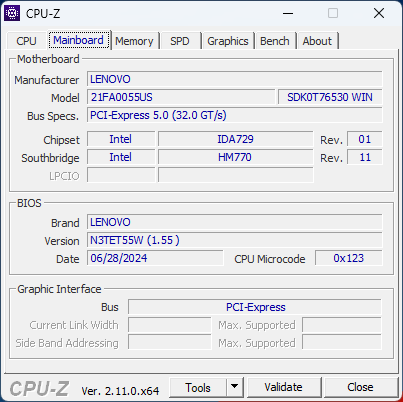
Lenovo uppdaterar sin premiumserie ThinkPad P16 Gen 2 med nyare Raptor Lake-HX Refresh-processorer för Q4 2024 för att ersätta de ursprungliga Raptor Lake-HX-alternativen som släpptes tidigare i år. Chassidesignen förblir annars oförändrad och så alla våra intryck på ursprungliga ThinkPad P16 Gen 2 recensionen gäller här också inklusive portarna.
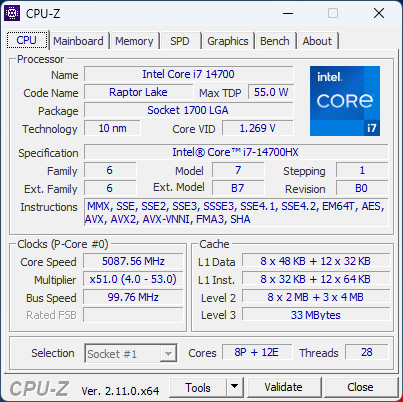
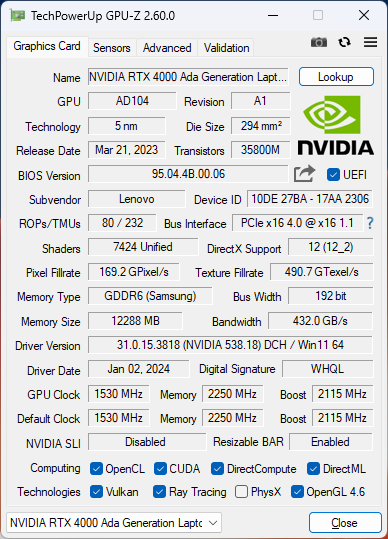
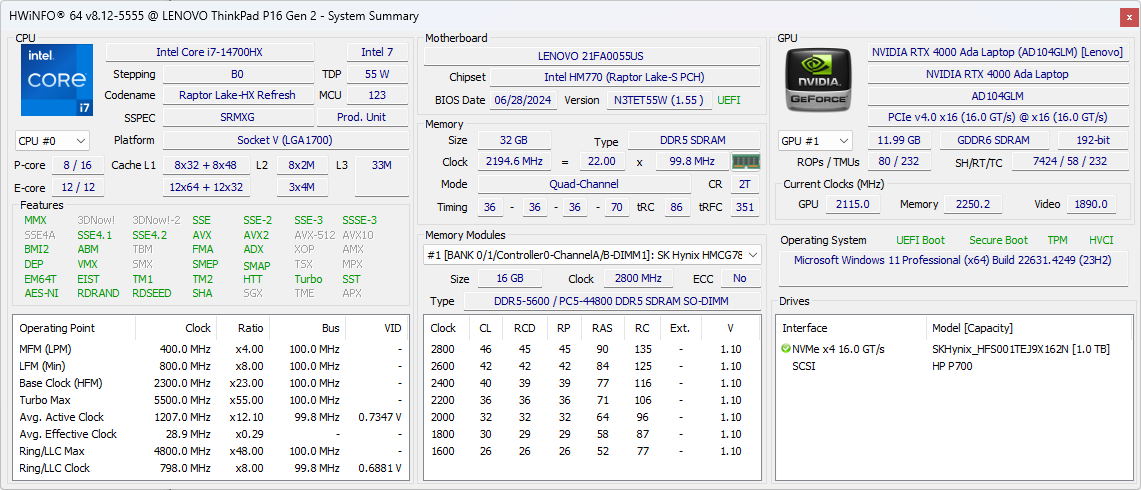
Vår testenhet är utrustad med Core i7-14700HX-processor och 130 W Nvidia RTX 4000 Ada GPU jämfört med Core i7-13700HX och 80 W RTX 2000 i vår första ThinkPad P16 Gen 2-recension. Prestandaökningen är betydande, vilket våra data nedan kommer att visa.
Konkurrenterna till ThinkPad P16 Gen 2 inkluderar andra högpresterande 16-tums mobila arbetsstationer som HP ZBook Power 16 G11 A eller Dell Precision 5690.
Fler recensioner från Lenovo:
Specifikationer
Fallet
SD-kortläsare
| SD Card Reader | |
| average JPG Copy Test (av. of 3 runs) | |
| HP ZBook Power 16 G11 A (Toshiba Exceria Pro SDXC 64 GB UHS-II) | |
| Lenovo ThinkPad P16 Gen 2 (Toshiba Exceria Pro SDXC 64 GB UHS-II) | |
| Lenovo ThinkPad P16 G1 RTX A5500 (Toshiba Exceria Pro SDXC 64 GB UHS-II) | |
| Lenovo ThinkPad P16 G2 21FA000FGE | |
| maximum AS SSD Seq Read Test (1GB) | |
| HP ZBook Power 16 G11 A (Toshiba Exceria Pro SDXC 64 GB UHS-II) | |
| Lenovo ThinkPad P16 Gen 2 (Toshiba Exceria Pro SDXC 64 GB UHS-II) | |
| Lenovo ThinkPad P16 G2 21FA000FGE | |
| Lenovo ThinkPad P16 G1 RTX A5500 (Toshiba Exceria Pro SDXC 64 GB UHS-II) | |
Kommunikation
Webbkamera


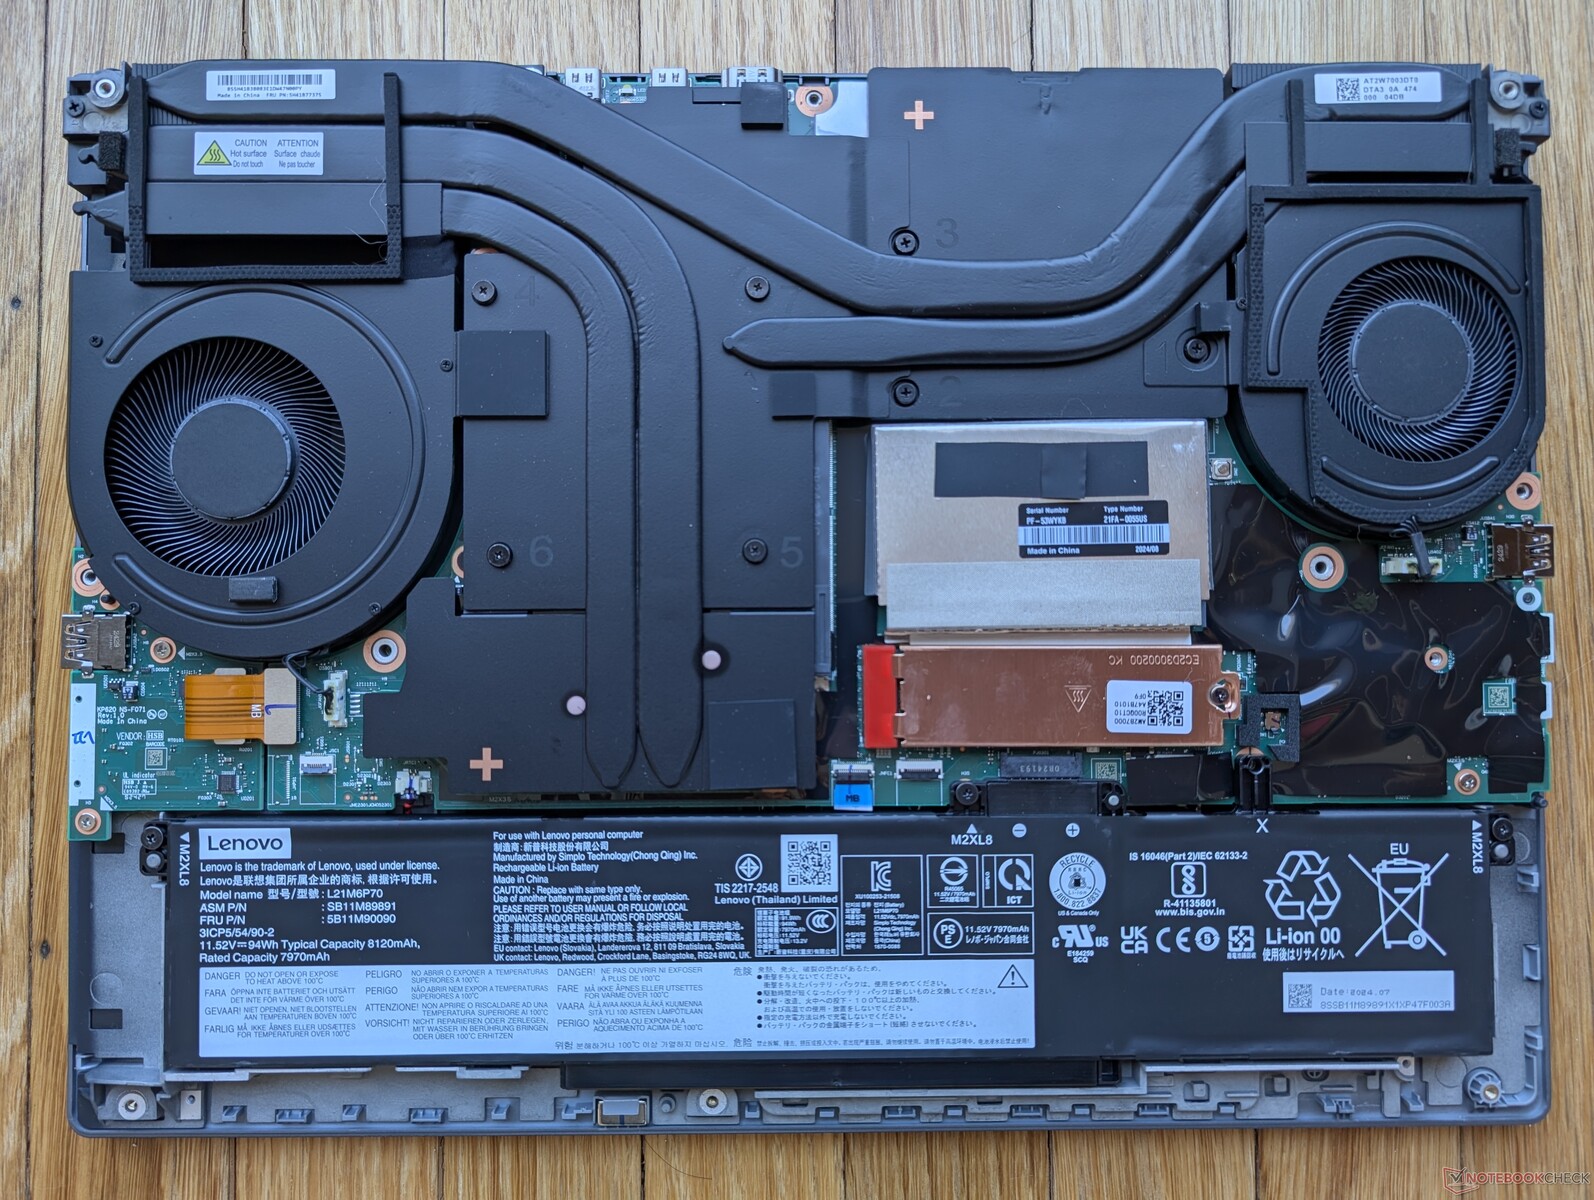
Underhåll
Hållbarhet
Lenovo använder en betydande mängd återvunnet material under tillverkningen, bland annat 50 procent återvunnet aluminium för ytterlocket (A cover), 90 procent magnesium för tangentbordet (C cover) och >85 procent plast från konsumentledet för tangentkåpor, batteripaket och högtalare.
Förpackningen är plastfri och helt återvinningsbar.
Tillbehör och garanti
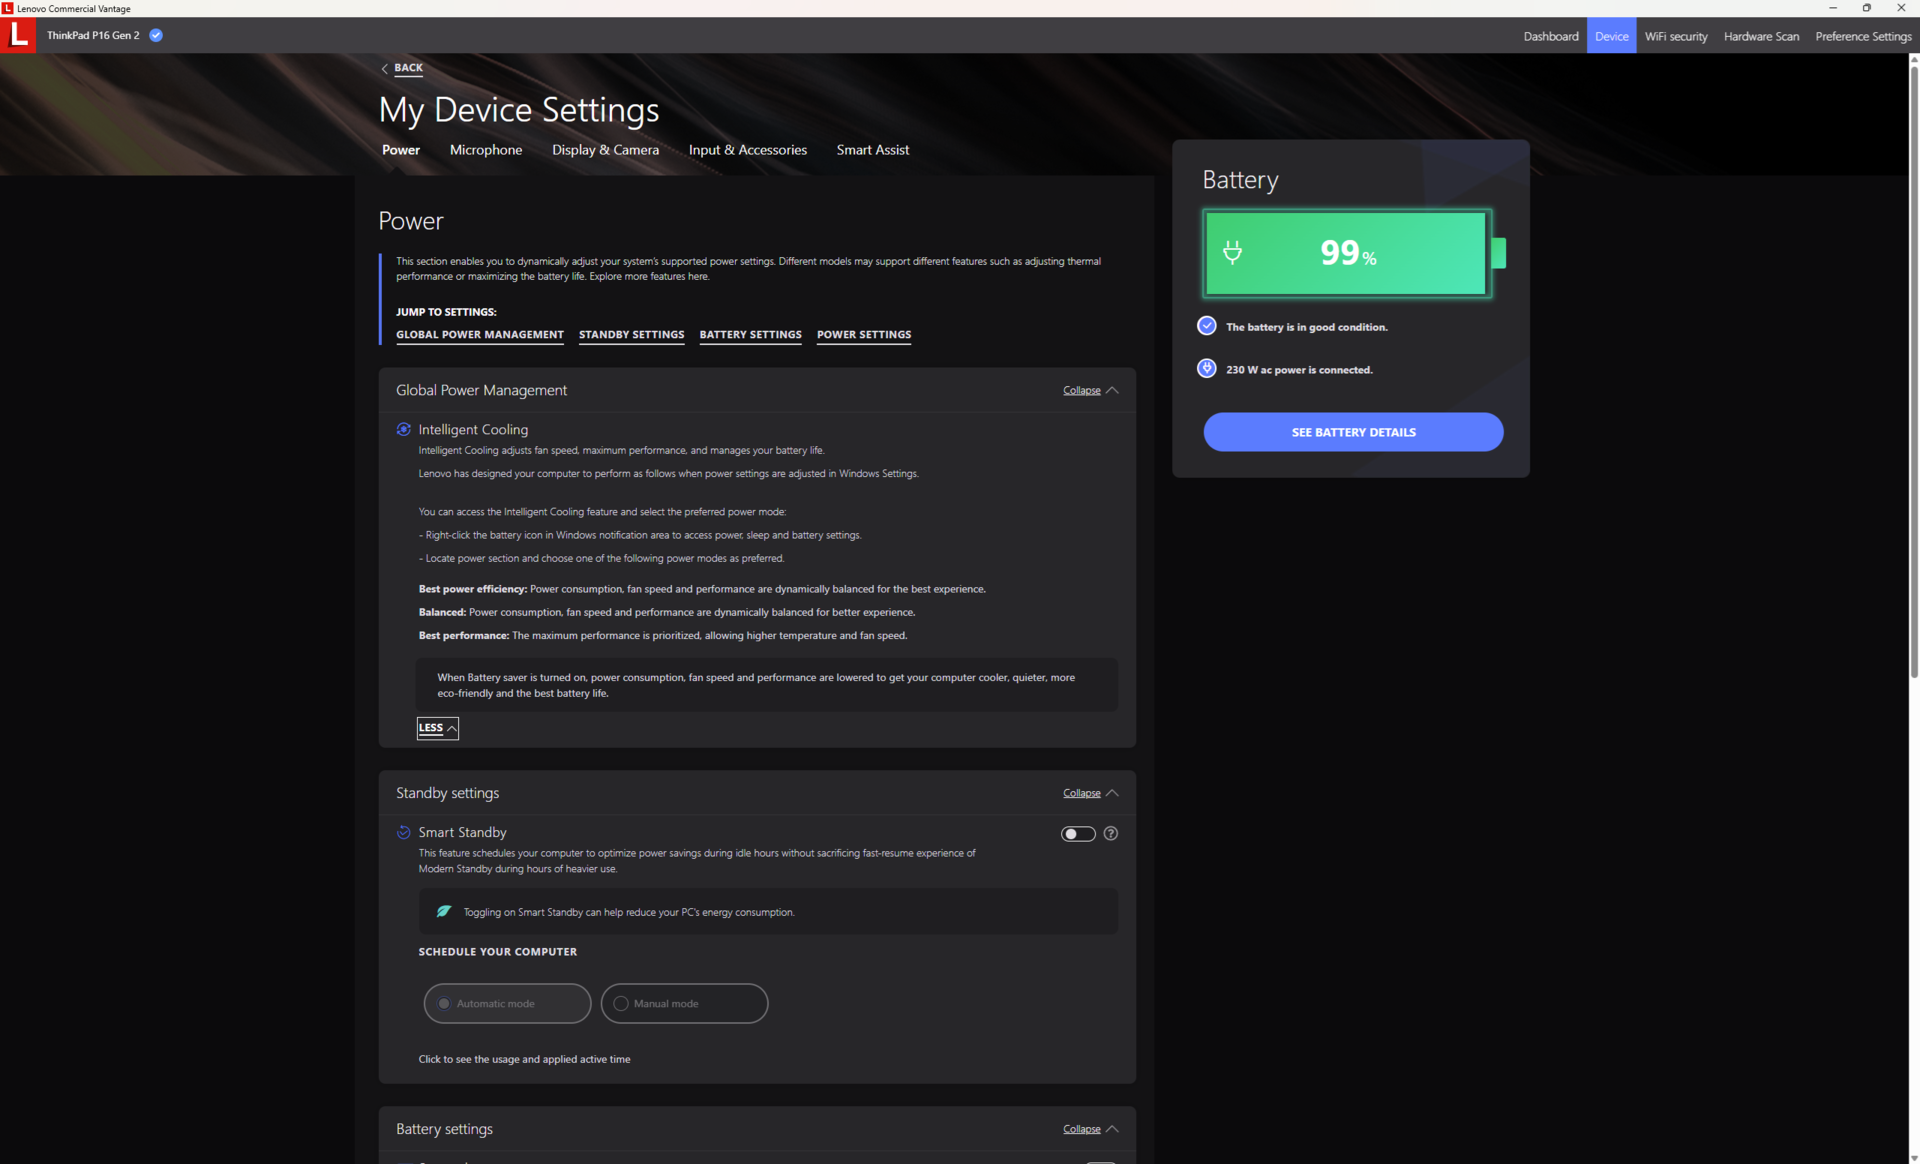
Det finns inga extra tillbehör i lådan förutom nätadaptern och pappersarbetet. Det bör dock noteras att vår enhet levereras med en större 230 W AC-adapter istället för 170 W-adaptern på vår första ThinkPad P16 Gen 2 på grund av vår mer krävande RTX 4000 Ada GPU.
En treårig tillverkargaranti gäller som standard.
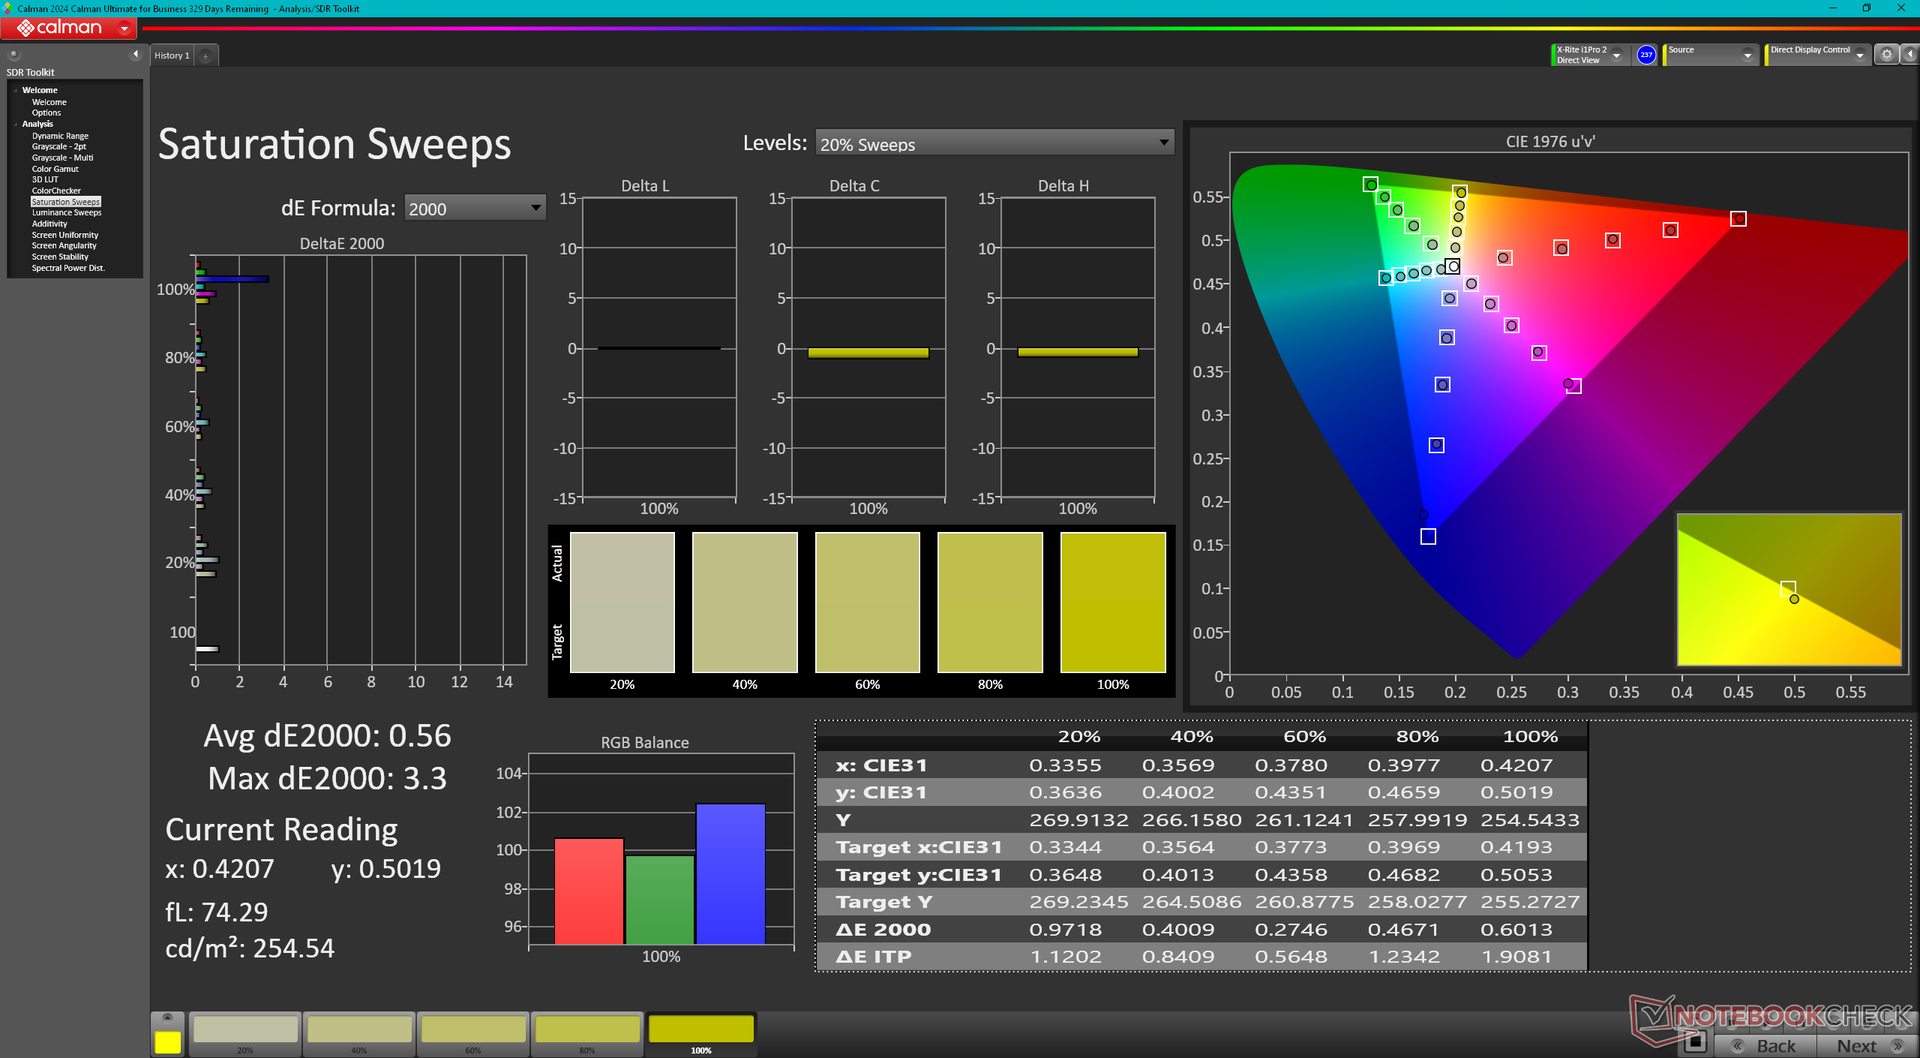
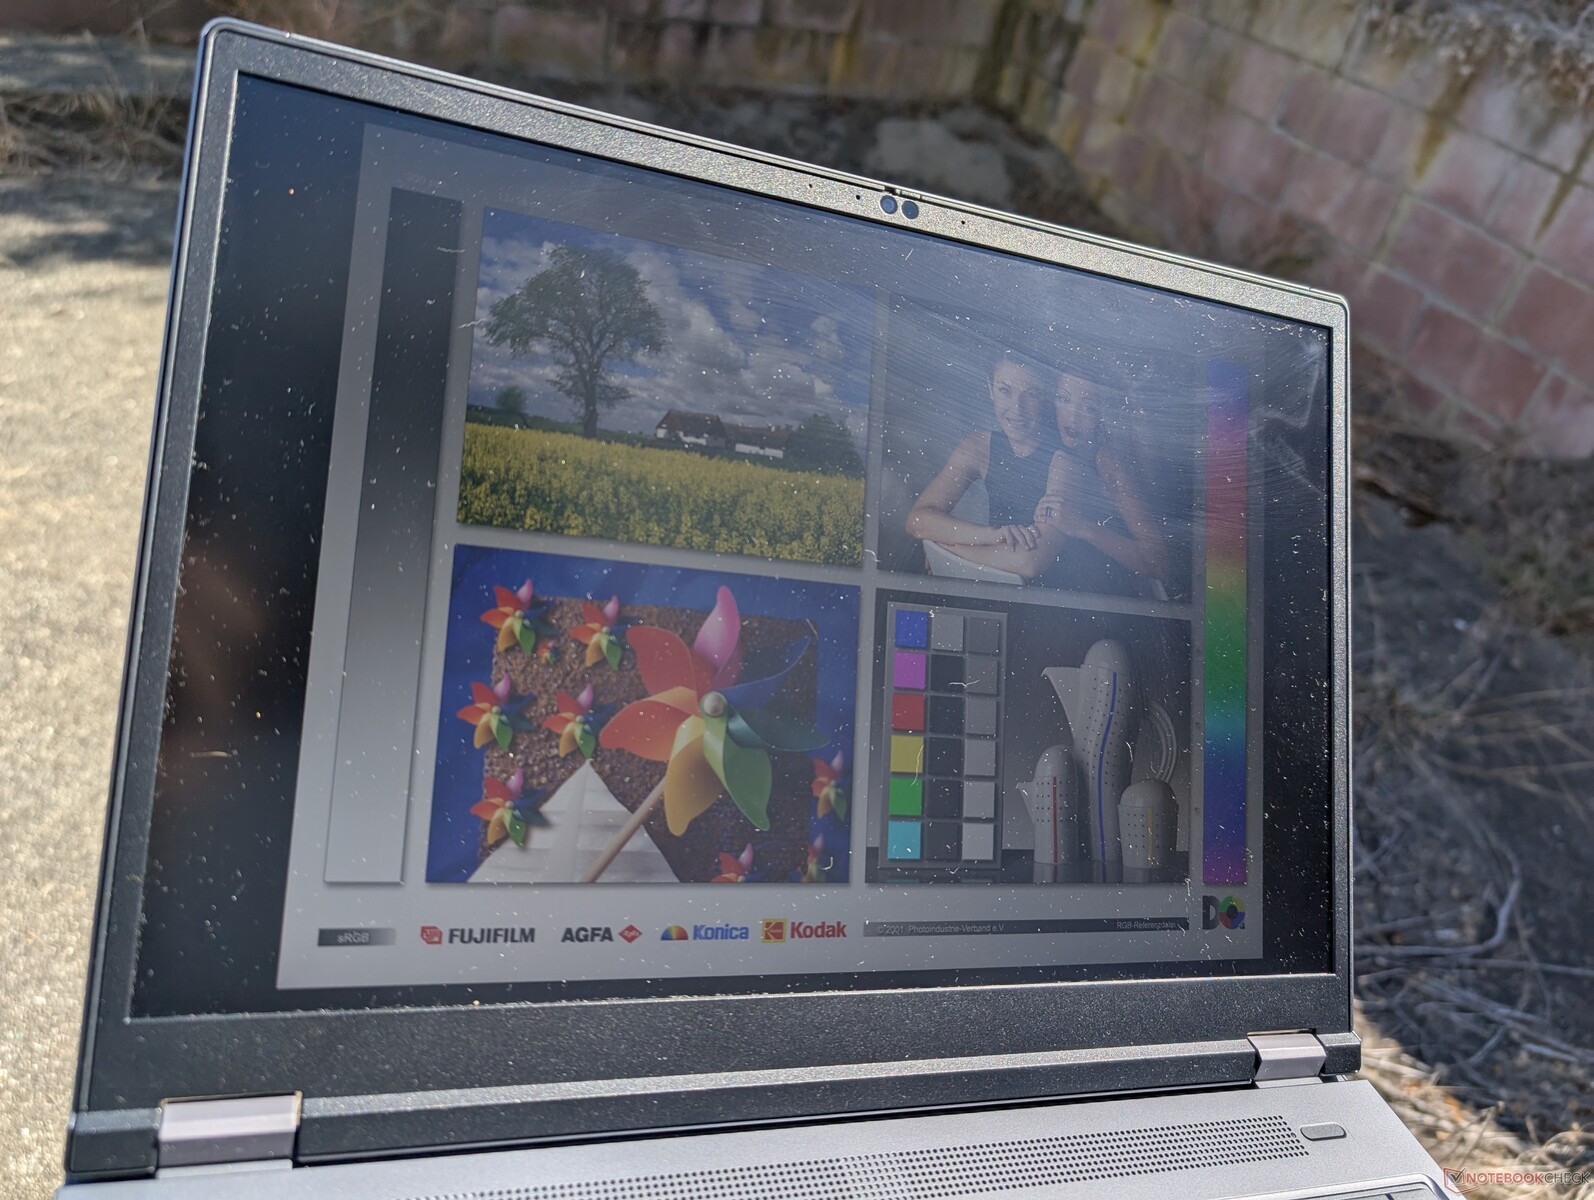
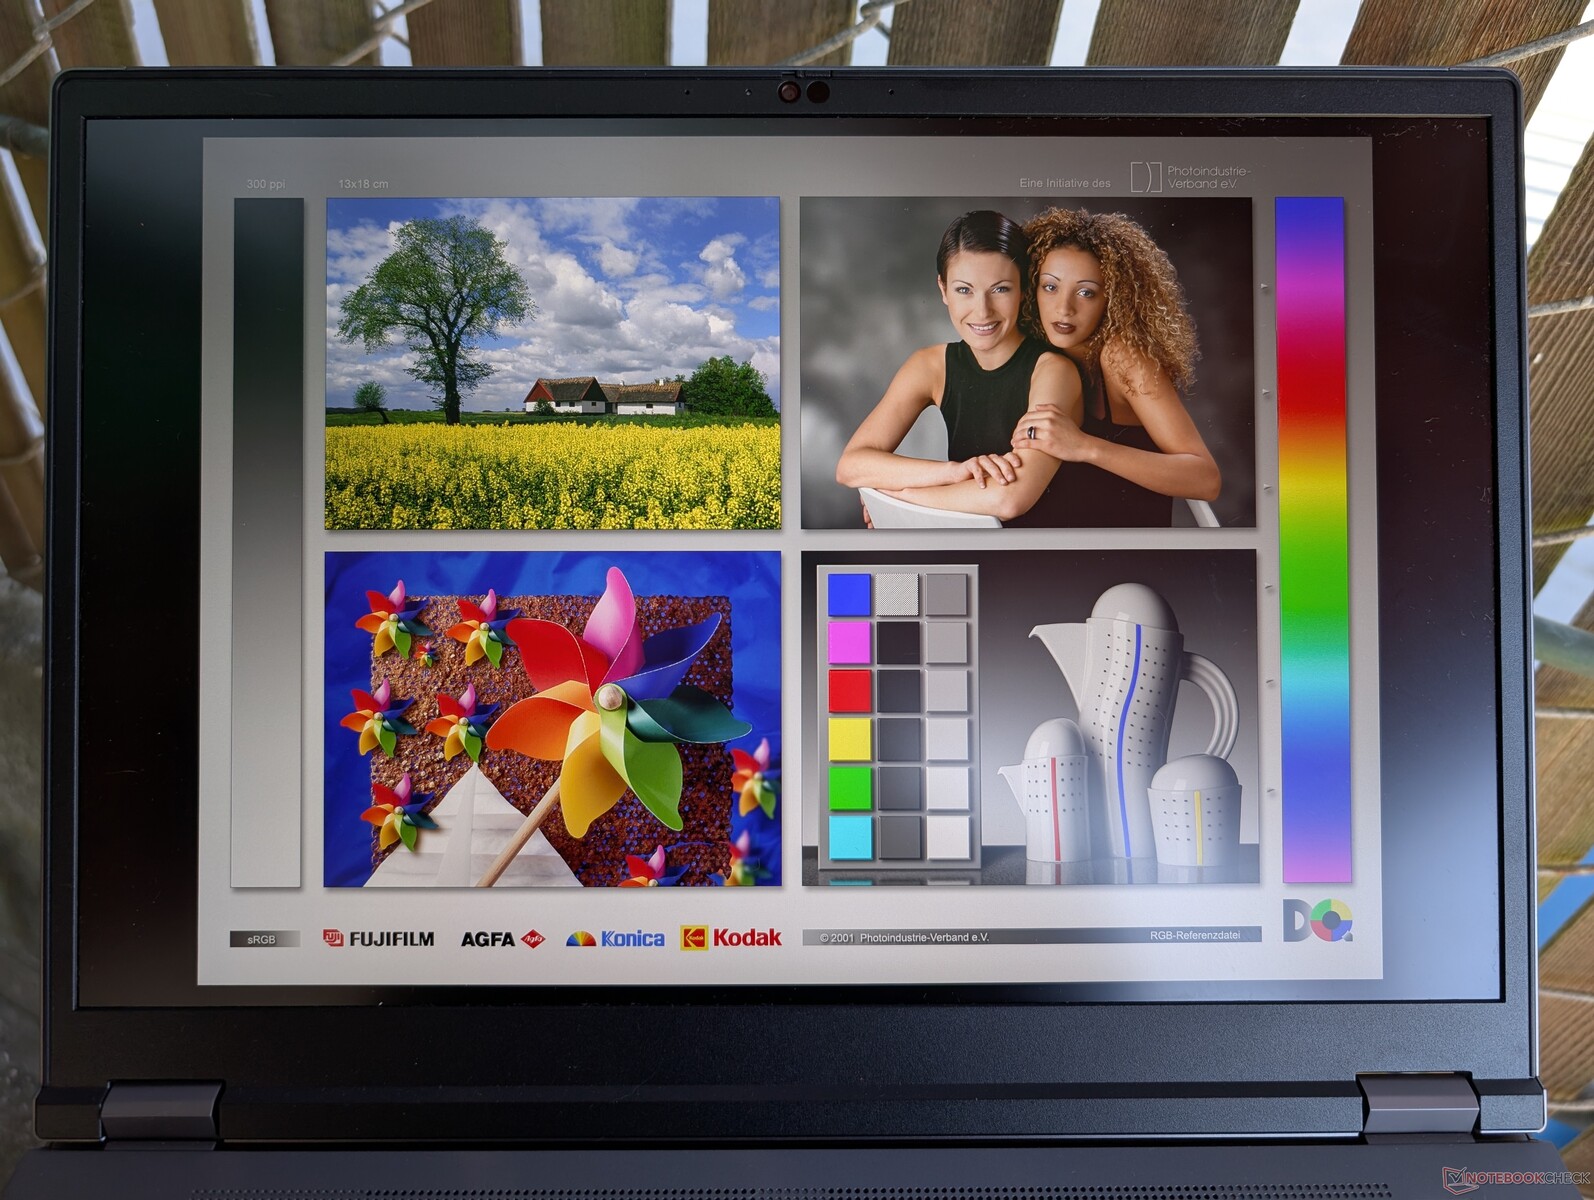
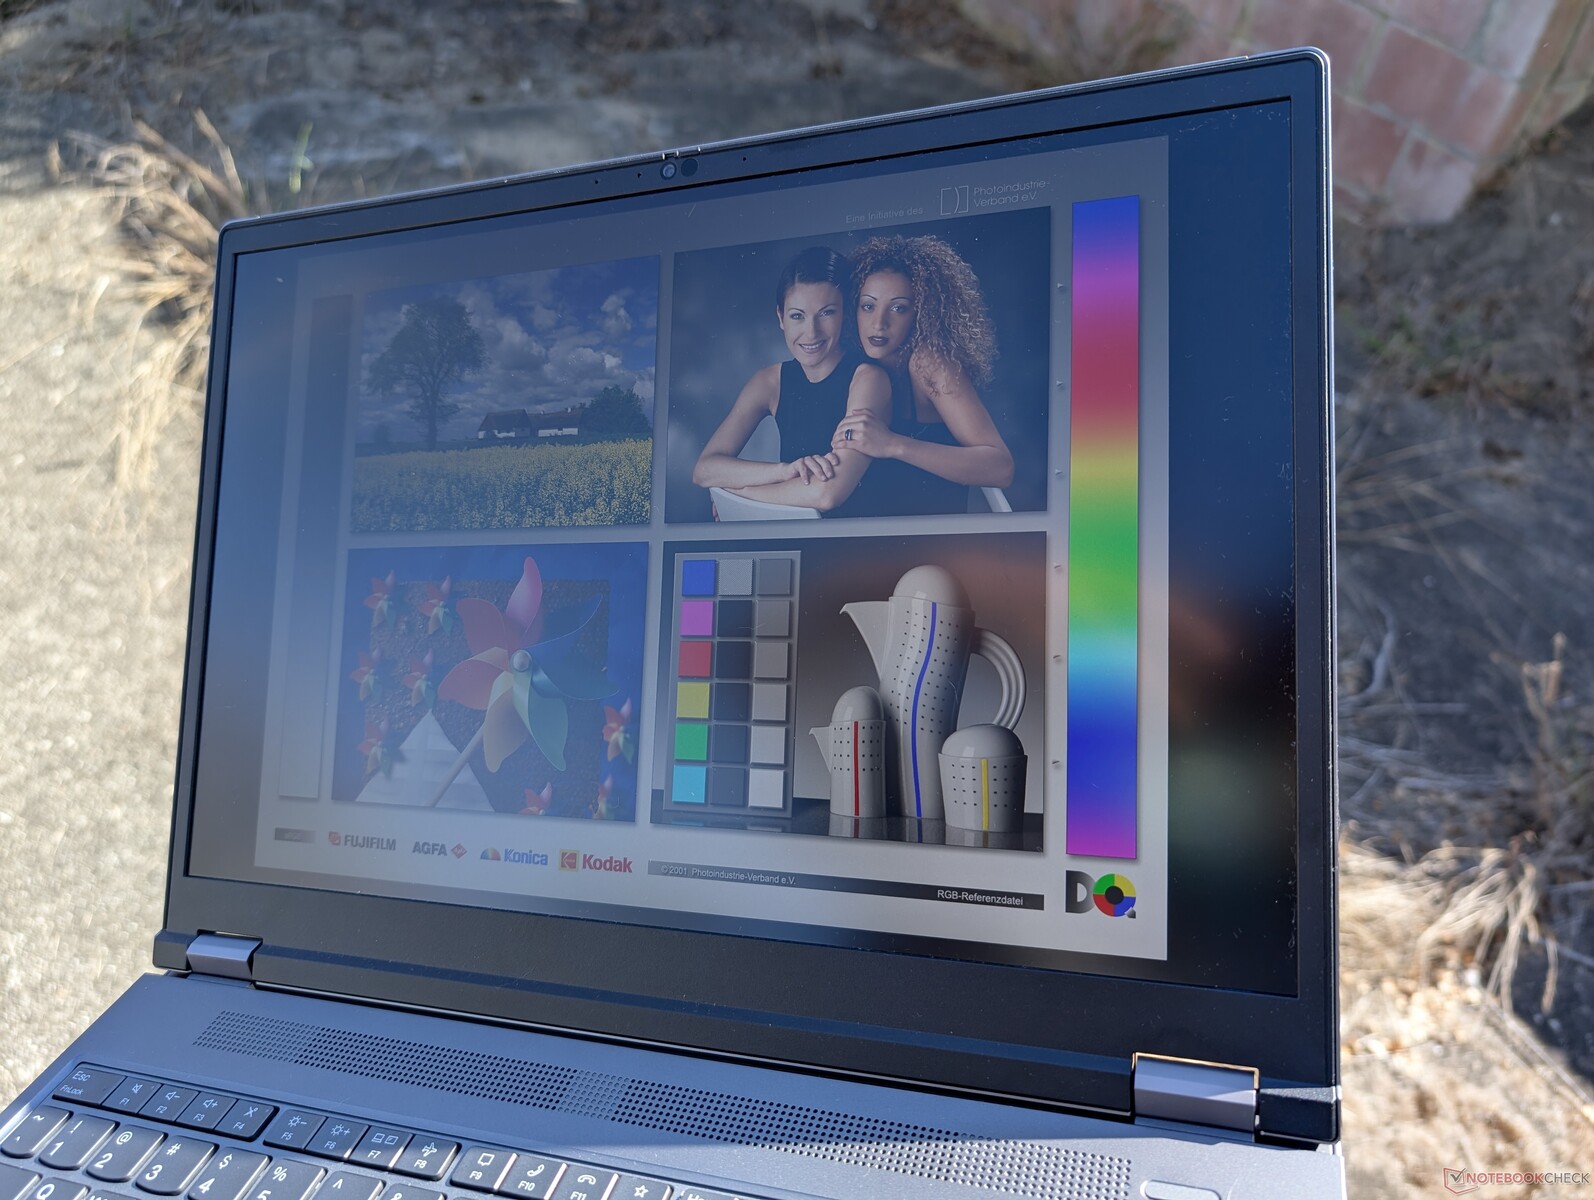
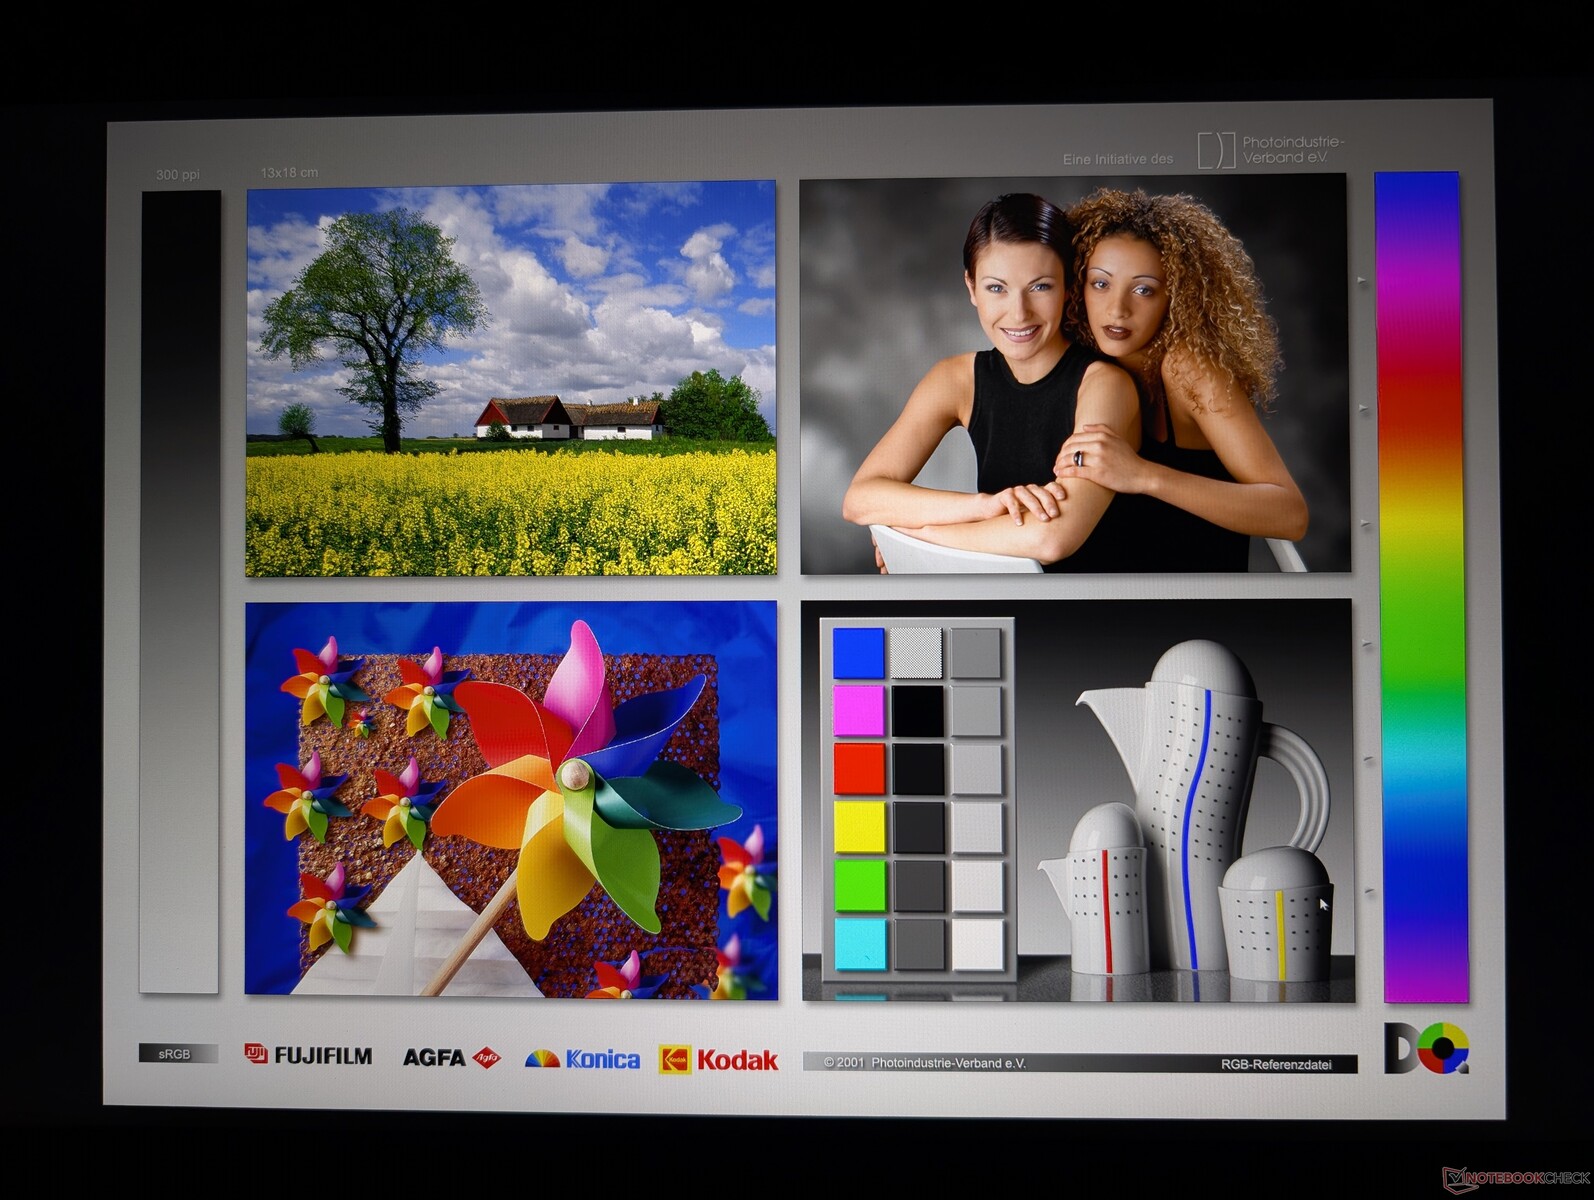
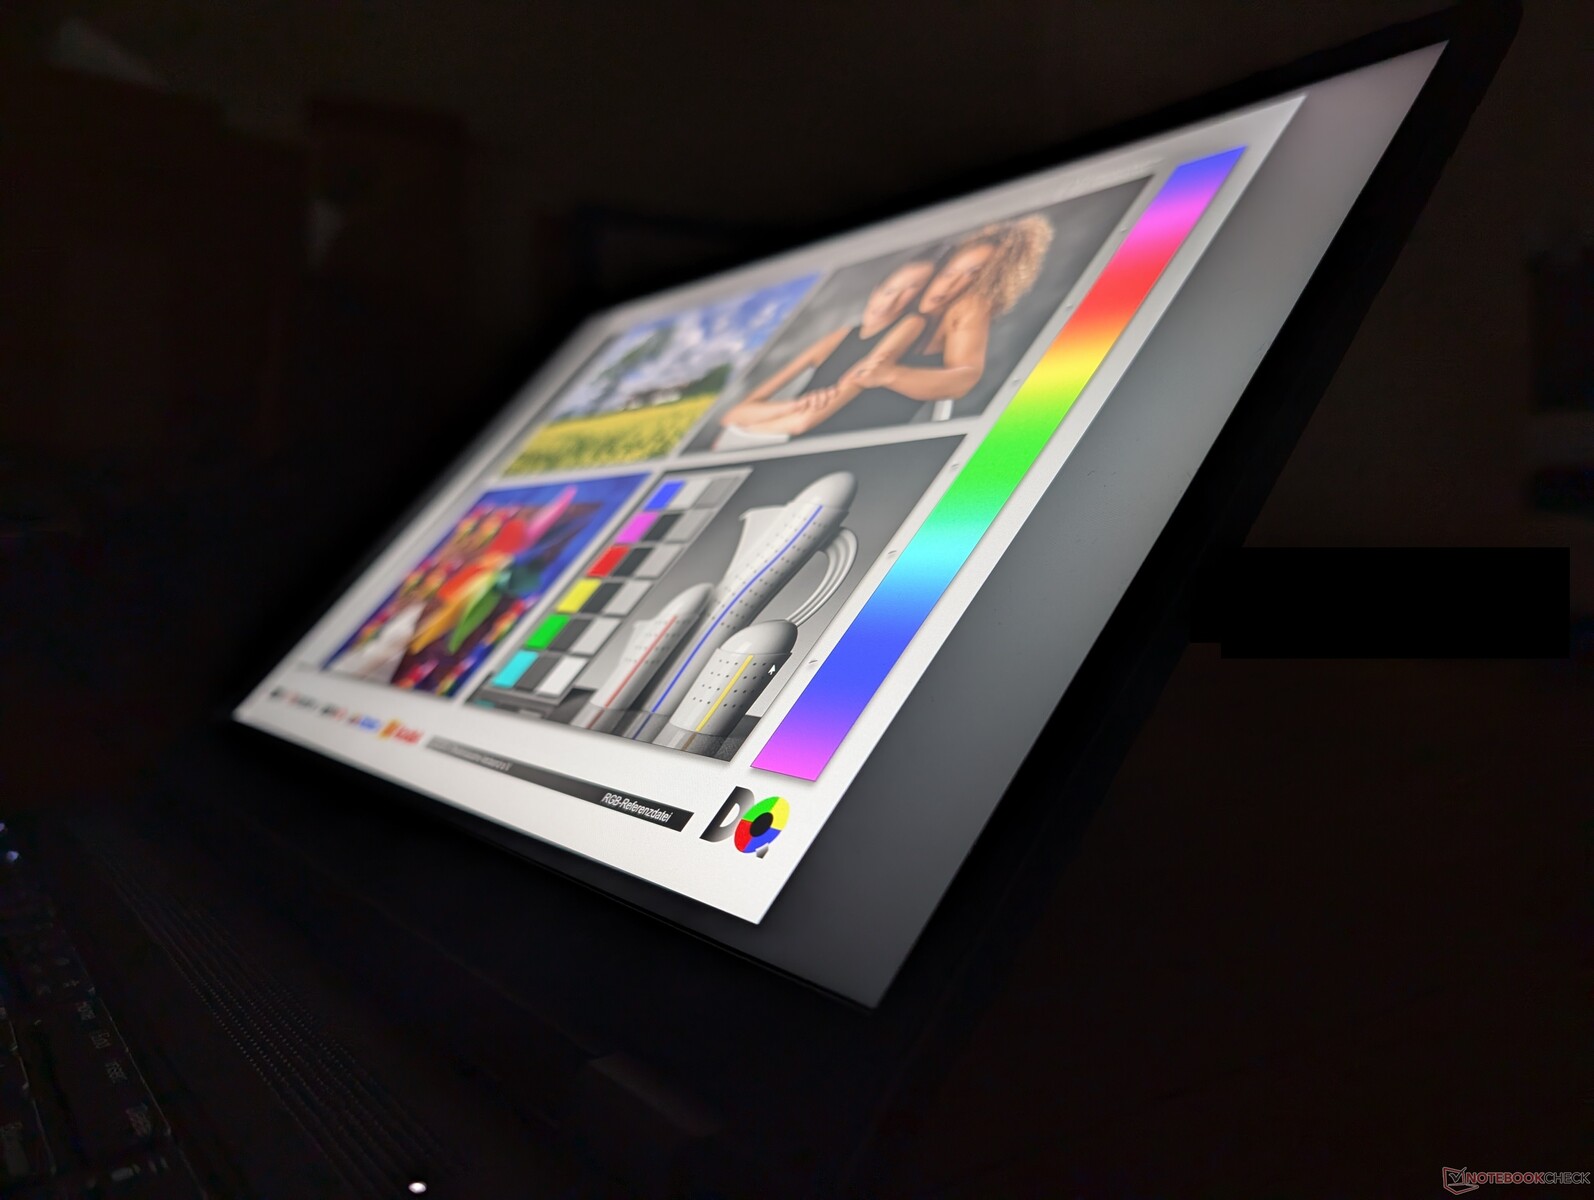
Display
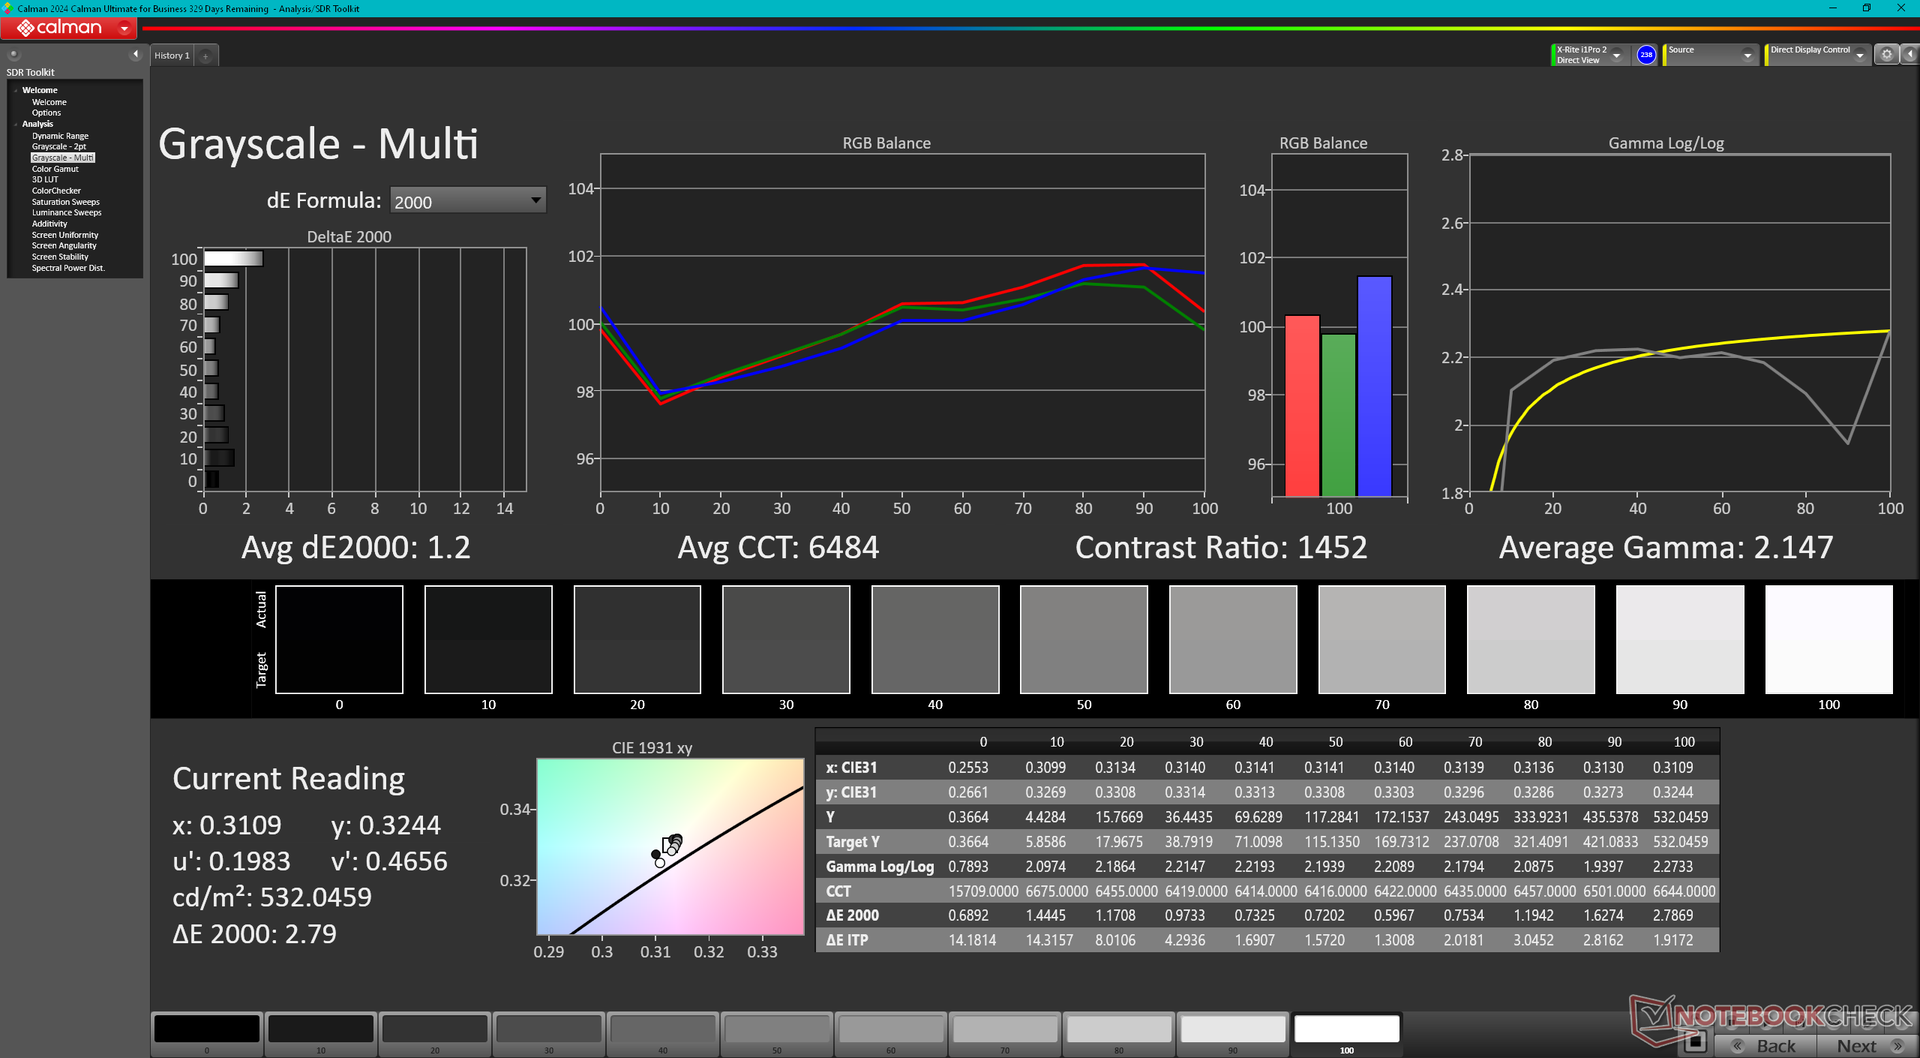
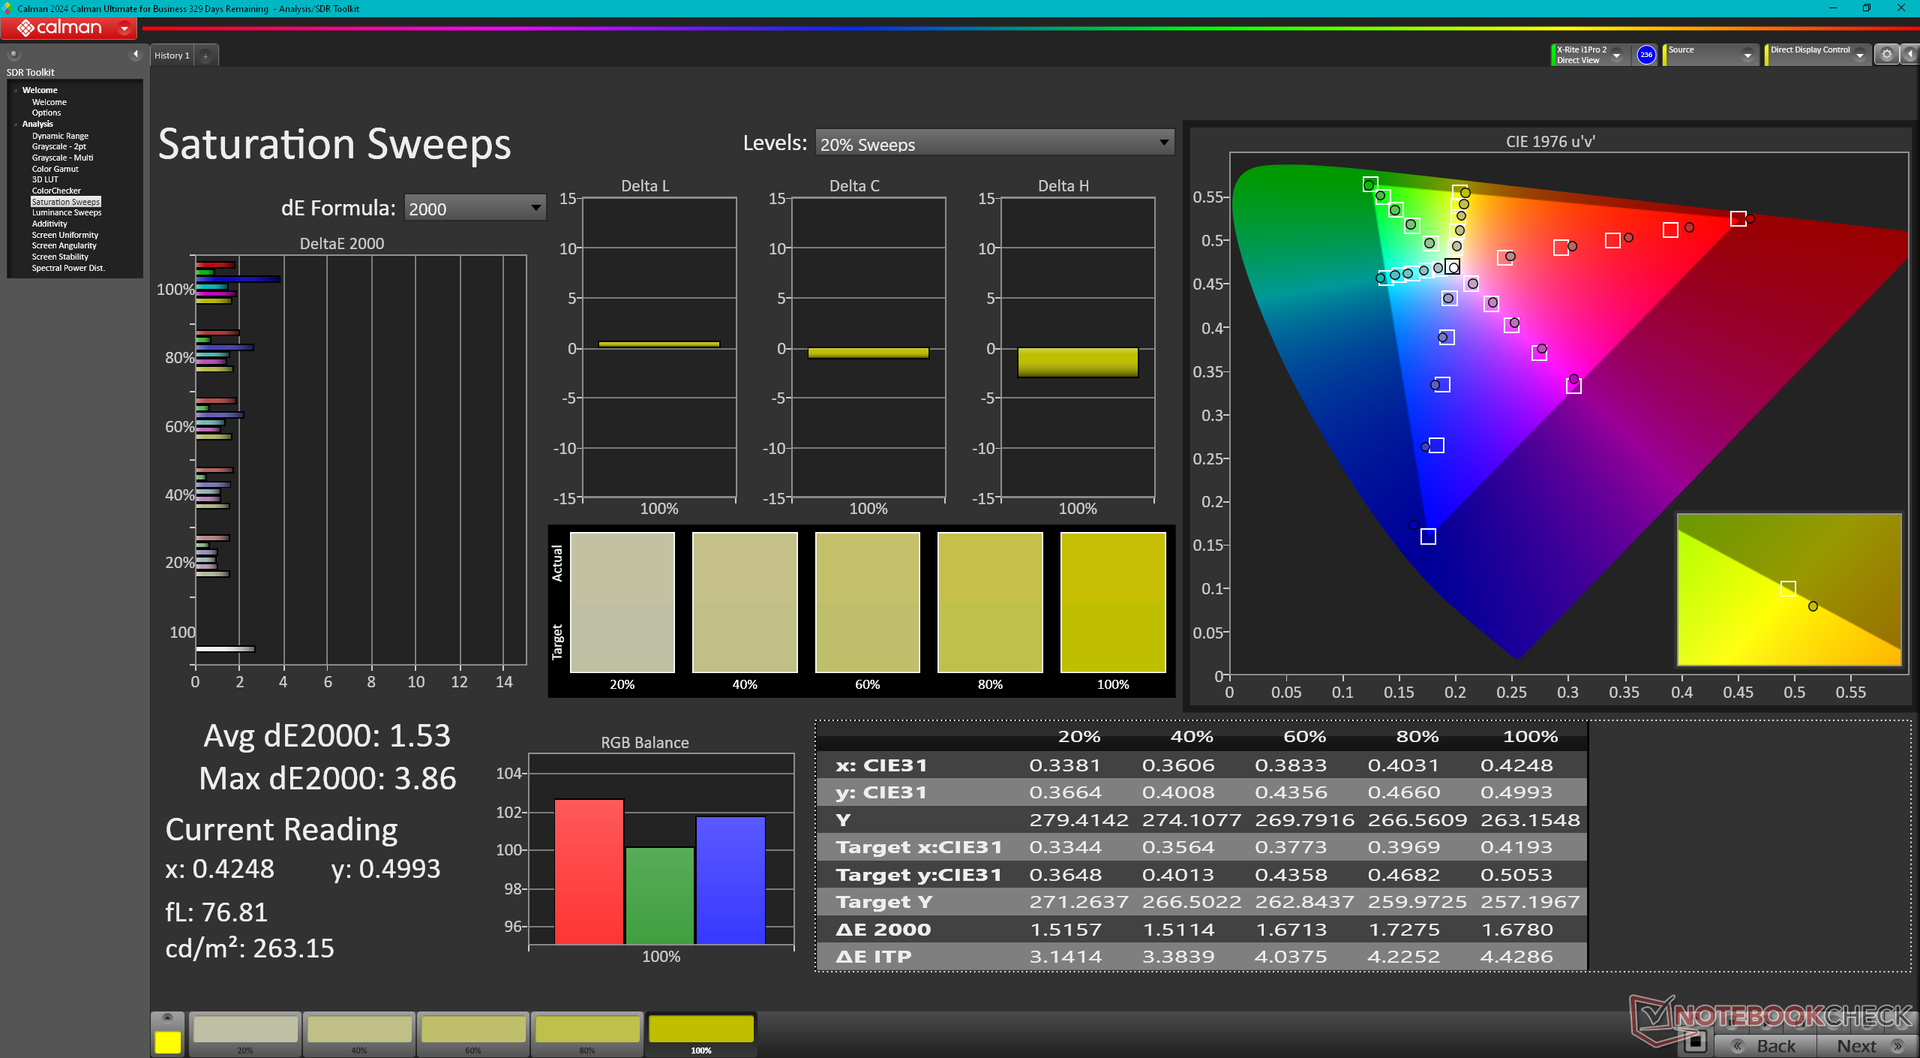
Det är intressant att vår 1600p165 IPS-panel är från en annan tillverkare jämfört med 1600p165 IPS-panelen på vår första ThinkPad P16 Gen 2-enhet (NE160QDM-NY1 vs. MNG007DA1-9). Kärnattribut och ljusstyrka är annars nästan identiska mellan dem. Andra skärmalternativ finns tillgängliga, inklusive 2400p OLED och 1200p IPS.


| |||||||||||||||||||||||||
Distribution av ljusstyrkan: 89 %
Mitt på batteriet: 531.5 cd/m²
Kontrast: 1399:1 (Svärta: 0.38 cd/m²)
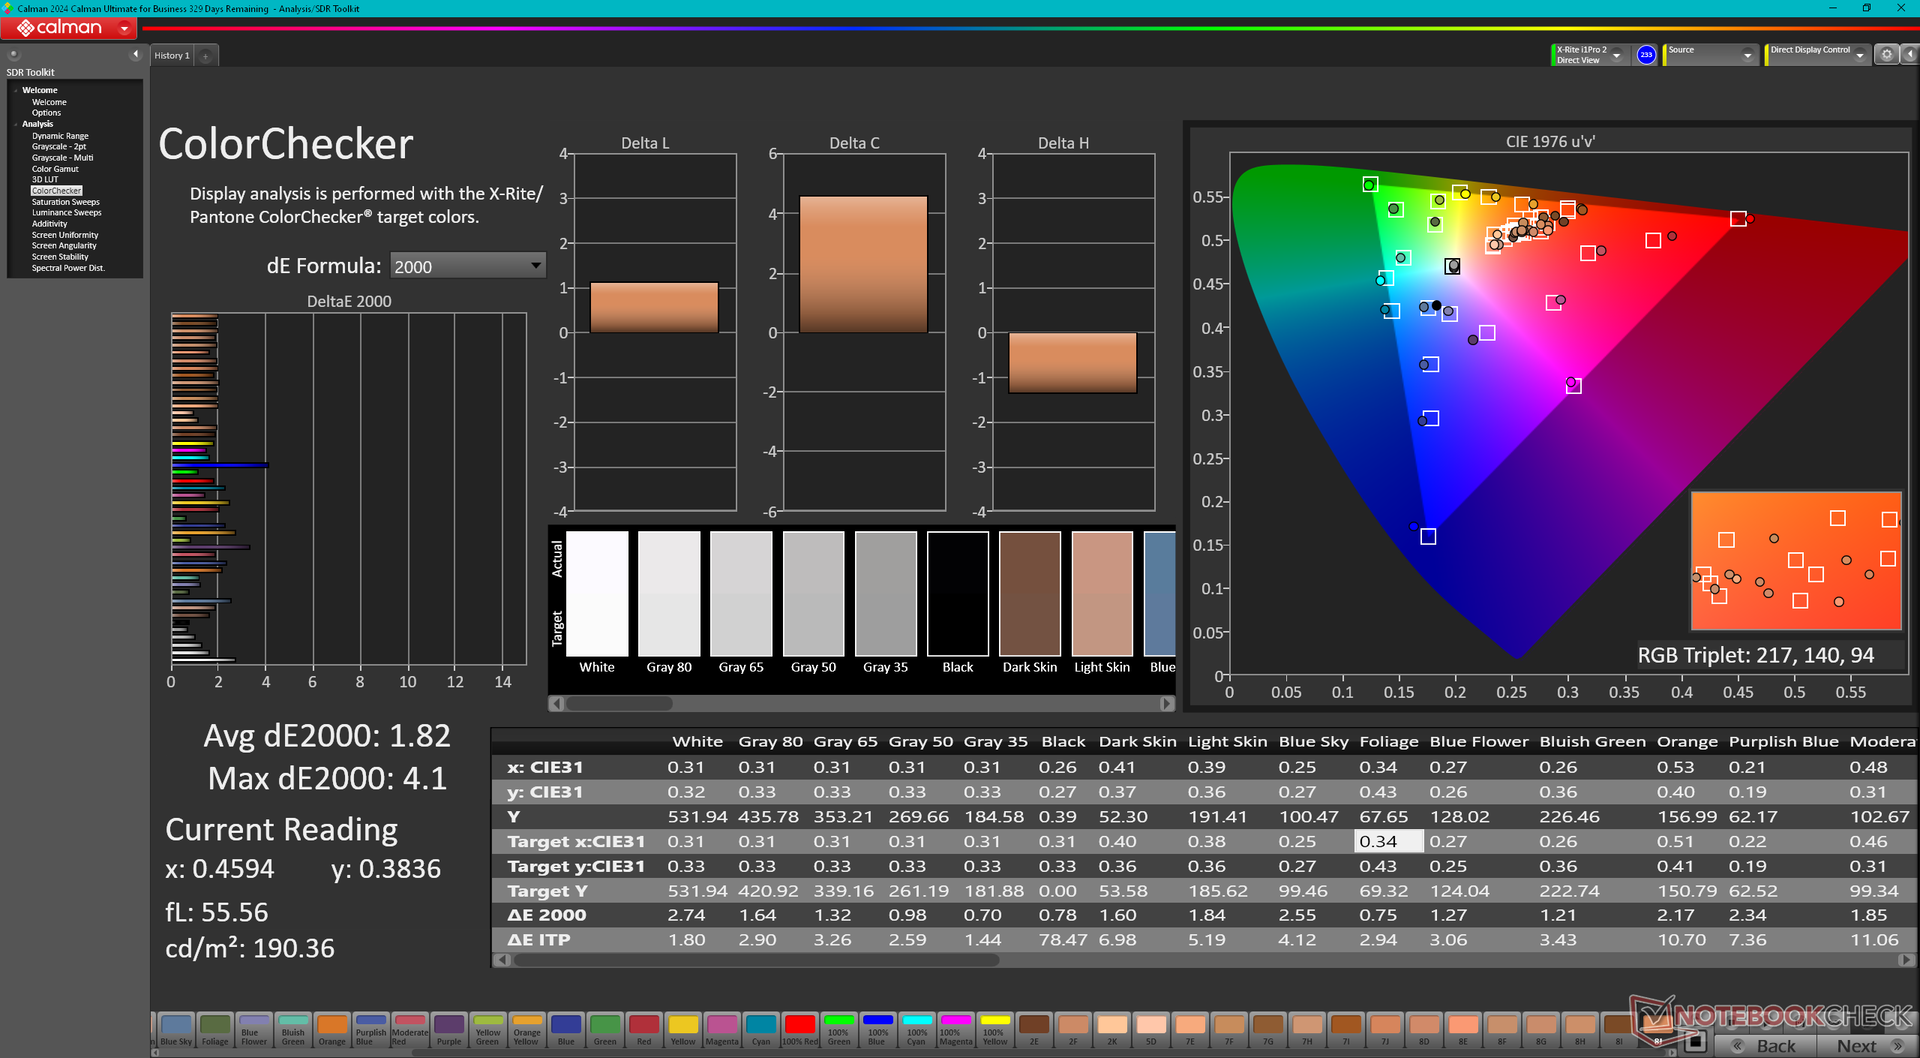
ΔE ColorChecker Calman: 1.82 | ∀{0.5-29.43 Ø4.72}
calibrated: 0.63
ΔE Greyscale Calman: 1.2 | ∀{0.09-98 Ø4.97}
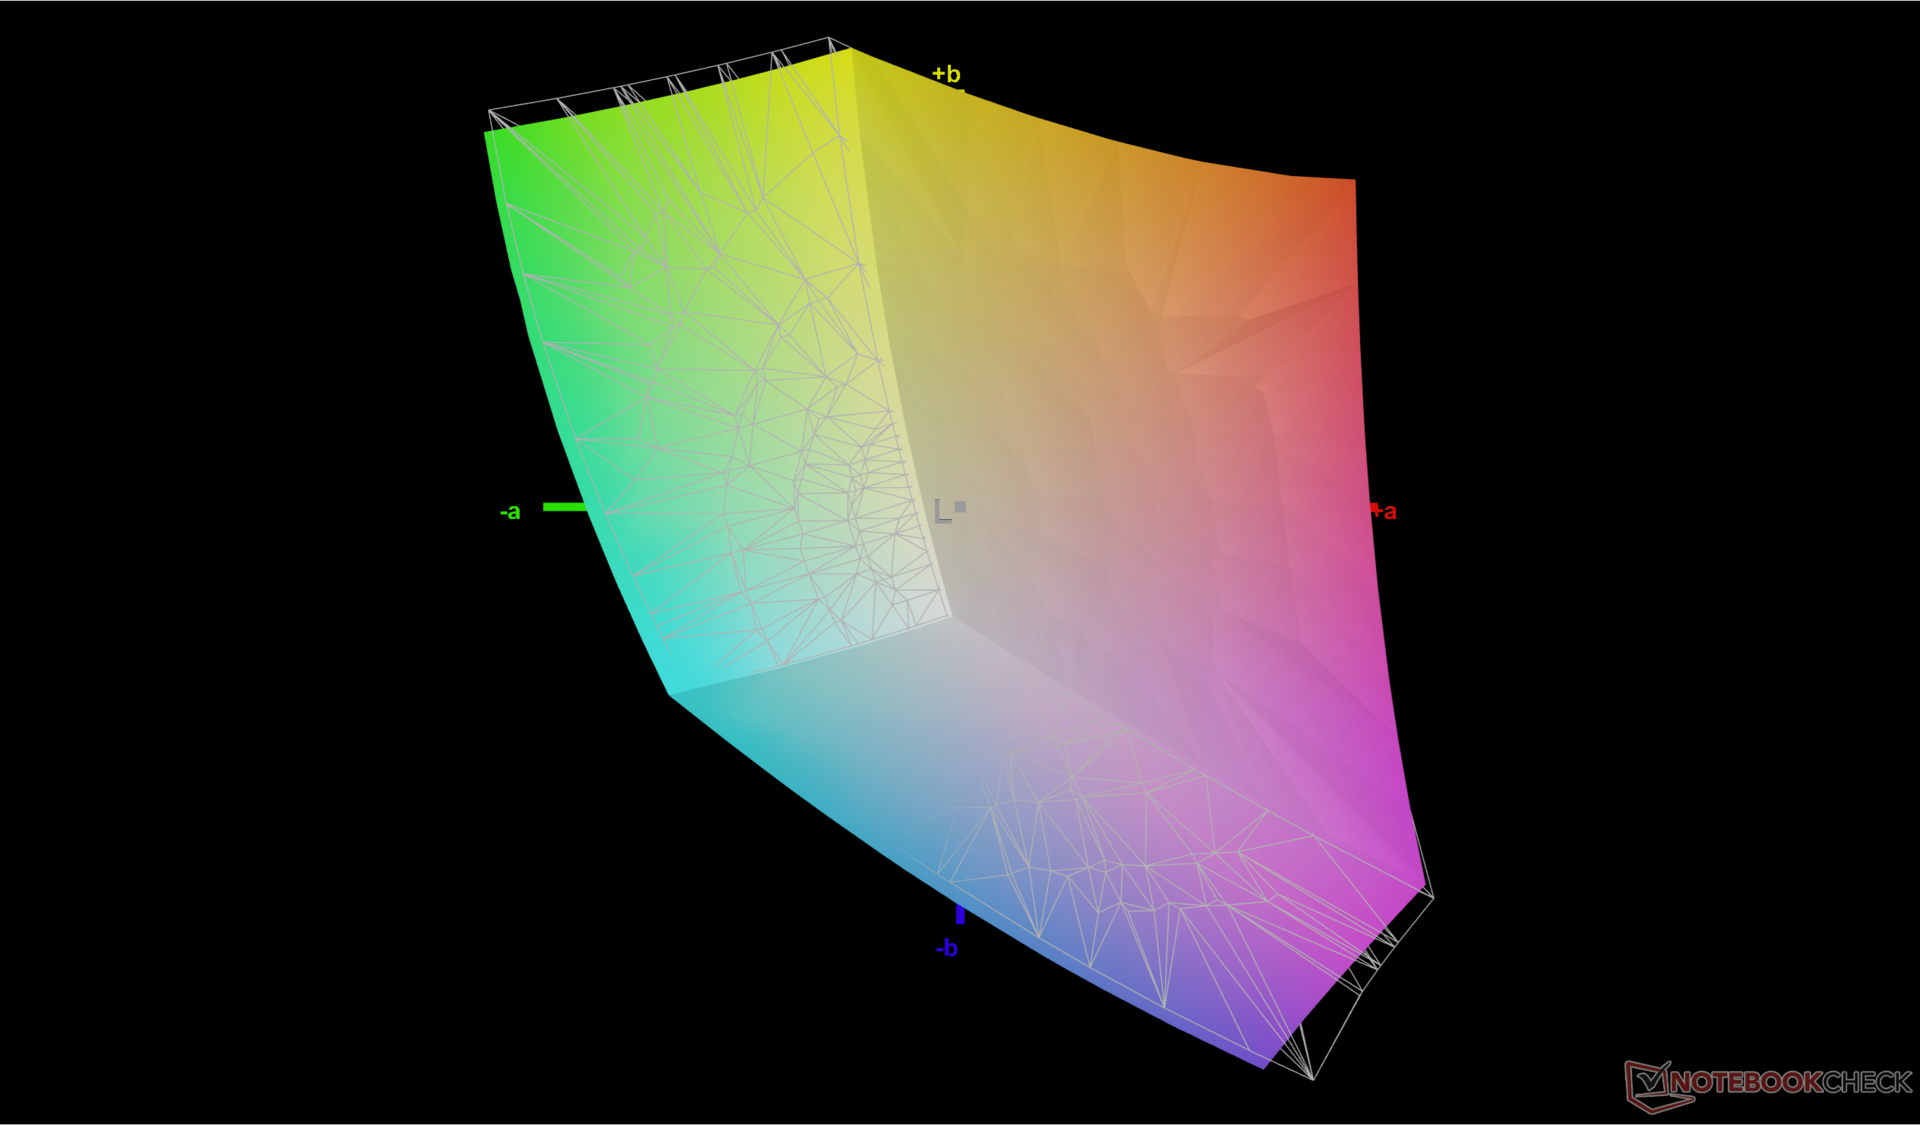
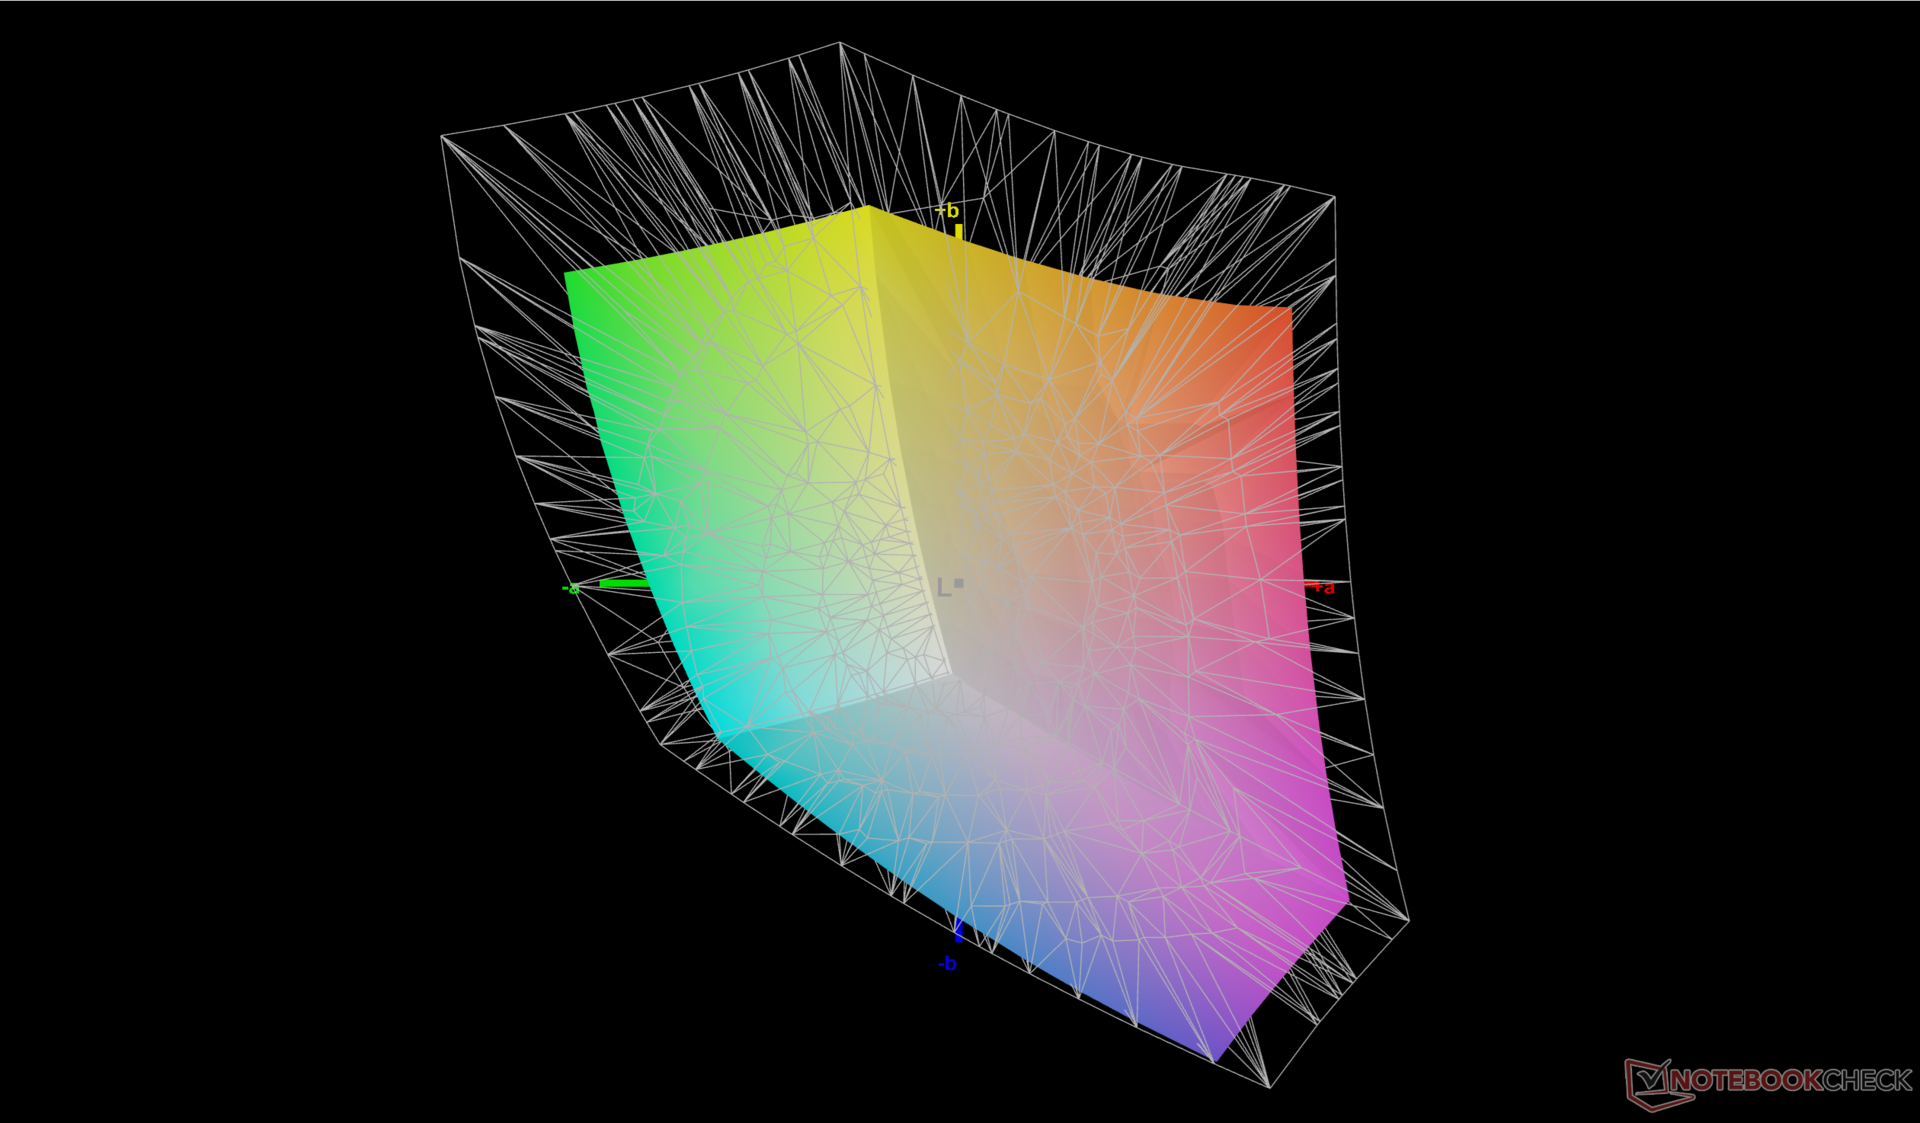
70.6% AdobeRGB 1998 (Argyll 3D)
96.9% sRGB (Argyll 3D)
68.4% Display P3 (Argyll 3D)
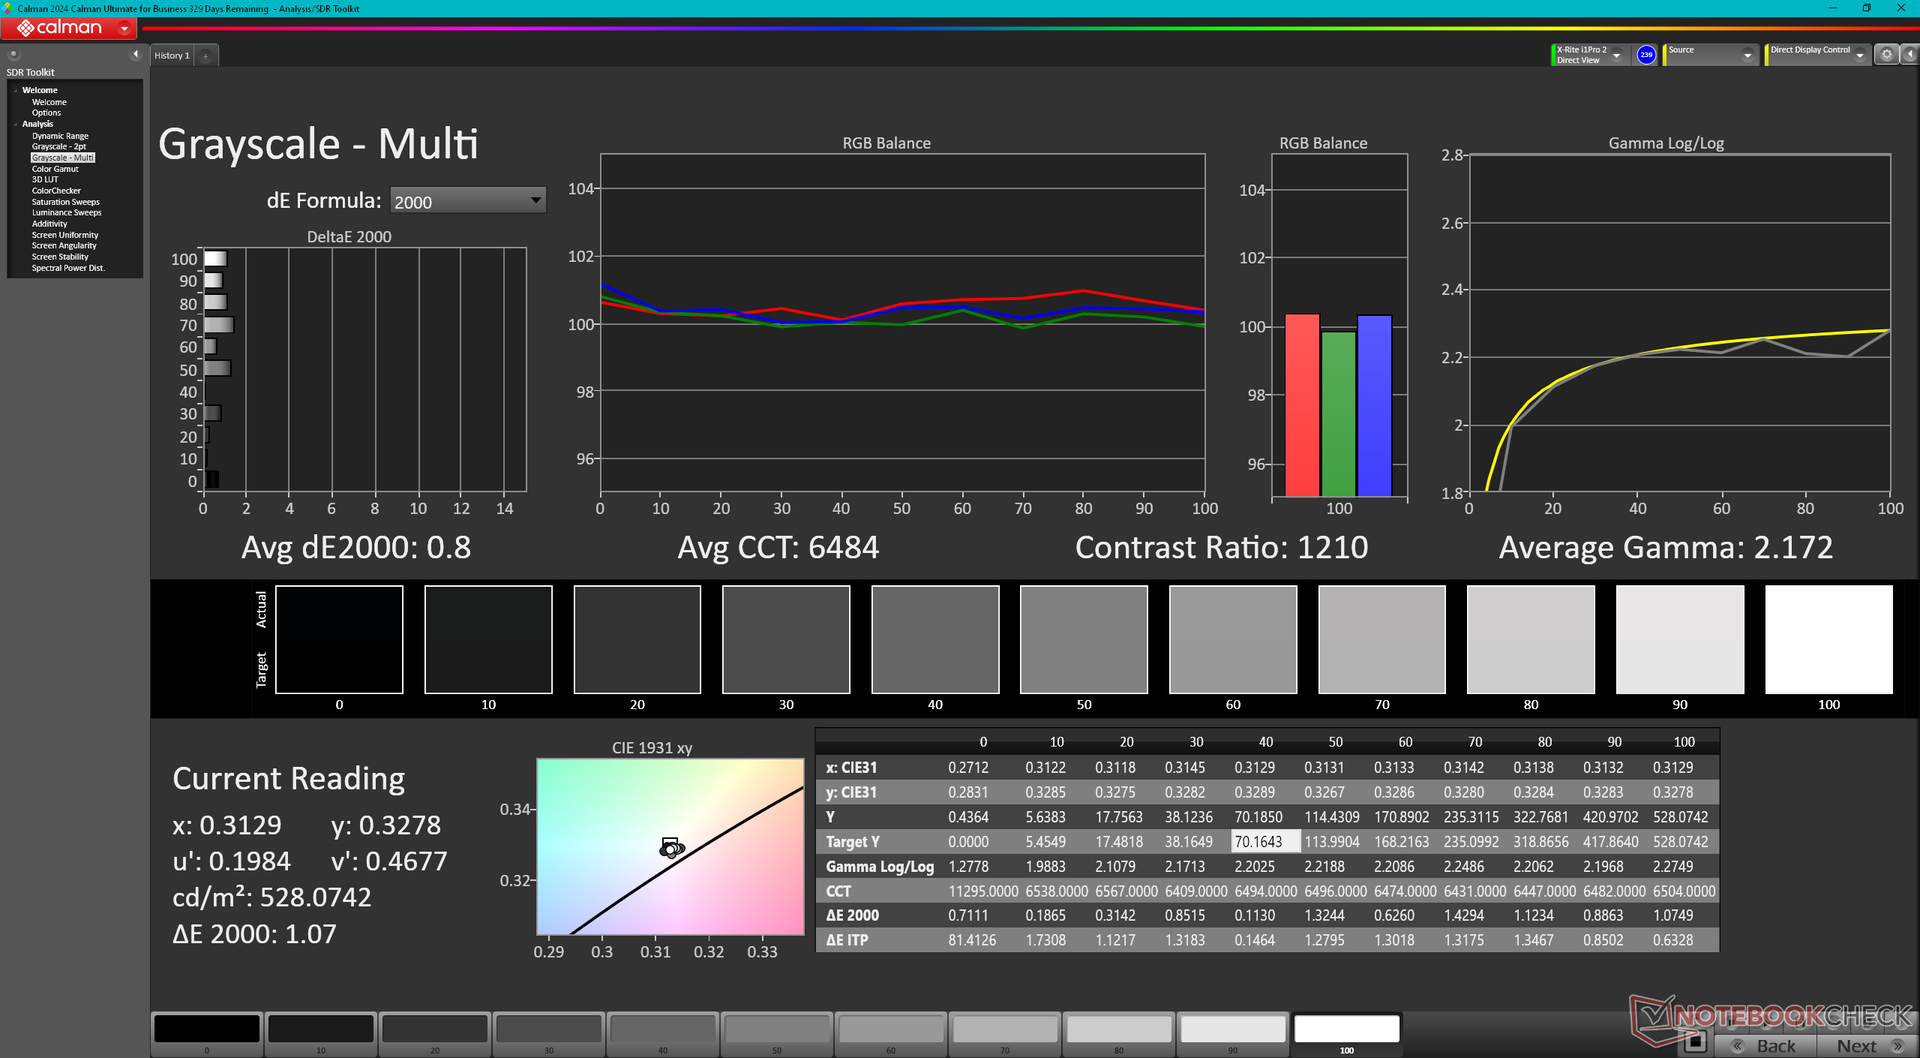
Gamma: 2.15
CCT: 6484 K
| Lenovo ThinkPad P16 Gen 2 NE160QDM-NY1, IPS, 2560x1600, 16", 165 Hz | Lenovo ThinkPad P16 G2 21FA000FGE MNG007DA1-9, IPS LED, 2560x1600, 16", 165 Hz | Lenovo ThinkPad P16s G2 21K9000CGE ATNA60YV04-0, OLED, 3840x2400, 16", 60 Hz | Lenovo ThinkPad P16 G1 RTX A5500 LP160UQ1-SPB1, IPS, 3840x2400, 16", 60 Hz | HP ZBook Power 16 G11 A AUOA0A9, IPS, 2560x1600, 16", 120 Hz | Dell Precision 5690 Samsung 160YV03, OLED, 3840x2400, 16", 60 Hz | |
|---|---|---|---|---|---|---|
| Display | 3% | 29% | 20% | 1% | 29% | |
| Display P3 Coverage (%) | 68.4 | 71 4% | 99.9 46% | 82.9 21% | 69.1 1% | 99.8 46% |
| sRGB Coverage (%) | 96.9 | 99.2 2% | 100 3% | 98.9 2% | 97.7 1% | 100 3% |
| AdobeRGB 1998 Coverage (%) | 70.6 | 73.2 4% | 96.9 37% | 95.9 36% | 71 1% | 96.6 37% |
| Response Times | 4% | 88% | -248% | 10% | 86% | |
| Response Time Grey 50% / Grey 80% * (ms) | 14.1 ? | 12.8 ? 9% | 1.5 ? 89% | 45.6 ? -223% | 13.6 ? 4% | 1.7 ? 88% |
| Response Time Black / White * (ms) | 9.9 ? | 10.1 ? -2% | 1.3 ? 87% | 36.8 ? -272% | 8.4 ? 15% | 1.7 ? 83% |
| PWM Frequency (Hz) | 60 | 60 ? | ||||
| Screen | -59% | -54% | -22% | -52% | -49% | |
| Brightness middle (cd/m²) | 531.5 | 510 -4% | 416 -22% | 601.9 13% | 470.7 -11% | 348.1 -35% |
| Brightness (cd/m²) | 499 | 517 4% | 421 -16% | 569 14% | 431 -14% | 351 -30% |
| Brightness Distribution (%) | 89 | 89 0% | 98 10% | 77 -13% | 88 -1% | 97 9% |
| Black Level * (cd/m²) | 0.38 | 0.37 3% | 0.47 -24% | 0.57 -50% | ||
| Contrast (:1) | 1399 | 1378 -2% | 1281 -8% | 826 -41% | ||
| Colorchecker dE 2000 * | 1.82 | 2.6 -43% | 1.3 29% | 2.45 -35% | 2.16 -19% | 4.18 -130% |
| Colorchecker dE 2000 max. * | 4.1 | 5.2 -27% | 2.8 32% | 4.46 -9% | 4.39 -7% | 6.68 -63% |
| Colorchecker dE 2000 calibrated * | 0.63 | 2.3 -265% | 2.9 -360% | 1.37 -117% | 0.97 -54% | |
| Greyscale dE 2000 * | 1.2 | 3.6 -200% | 1.8 -50% | 2.6 -117% | 3.7 -208% | 1.7 -42% |
| Gamma | 2.15 102% | 2.26 97% | 2.25 98% | 2.3 96% | 2.38 92% | 2.2 100% |
| CCT | 6484 100% | 5969 109% | 6574 99% | 6805 96% | 6765 96% | 6198 105% |
| Totalt genomsnitt (program/inställningar) | -17% /
-37% | 21% /
-10% | -83% /
-47% | -14% /
-32% | 22% /
-7% |
* ... mindre är bättre
Skärmen levereras förkalibrerad mot sRGB-standarden med genomsnittliga deltaE-värden för gråskala på endast 1,2 respektive 1,82. En kalibrering av slutanvändaren är därför inte nödvändig för de flesta.

Visa svarstider
| ↔ Svarstid svart till vitt | ||
|---|---|---|
| 9.9 ms ... stiga ↗ och falla ↘ kombinerat | ↗ 5 ms stiga | 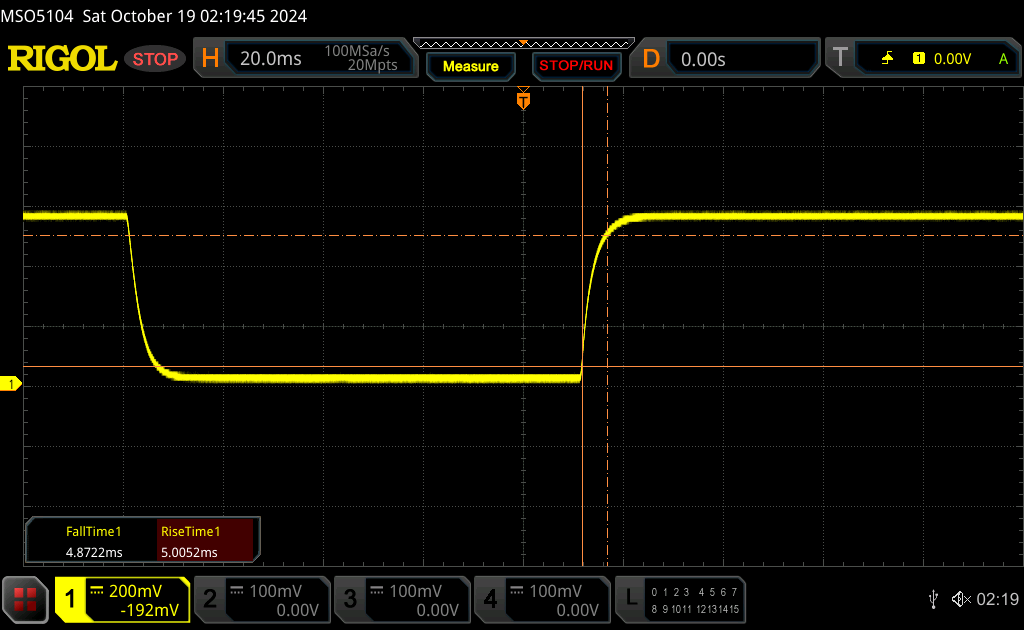 |
| ↘ 4.9 ms hösten | ||
| Skärmen visar snabba svarsfrekvenser i våra tester och bör passa för spel. I jämförelse sträcker sig alla testade enheter från 0.1 (minst) till 240 (maximalt) ms. » 27 % av alla enheter är bättre. Det betyder att den uppmätta svarstiden är bättre än genomsnittet av alla testade enheter (19.8 ms). | ||
| ↔ Svarstid 50 % grått till 80 % grått | ||
| 14.1 ms ... stiga ↗ och falla ↘ kombinerat | ↗ 6.7 ms stiga | 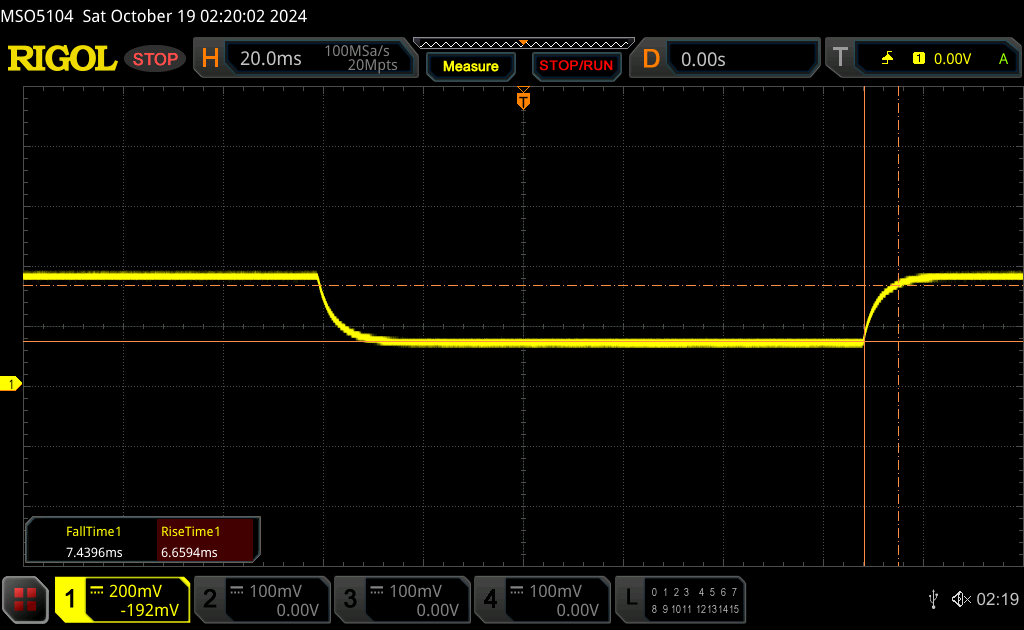 |
| ↘ 7.4 ms hösten | ||
| Skärmen visar bra svarsfrekvens i våra tester, men kan vara för långsam för konkurrenskraftiga spelare. I jämförelse sträcker sig alla testade enheter från 0.165 (minst) till 636 (maximalt) ms. » 28 % av alla enheter är bättre. Det betyder att den uppmätta svarstiden är bättre än genomsnittet av alla testade enheter (31 ms). | ||
Skärmflimmer / PWM (Puls-Width Modulation)
| Skärmflimmer / PWM upptäcktes inte | 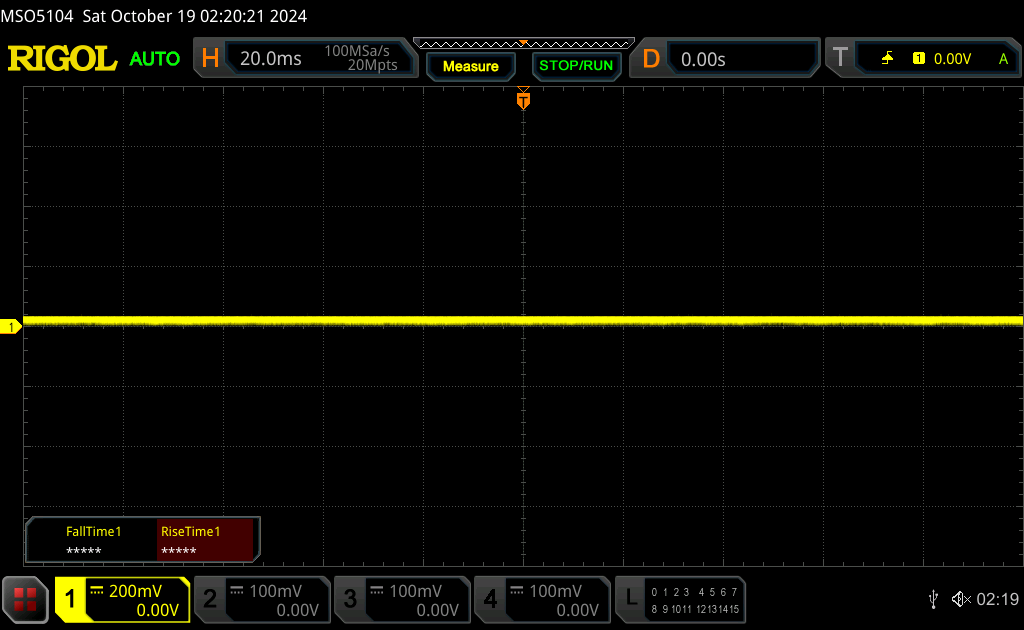 | ||
Som jämförelse: 52 % av alla testade enheter använder inte PWM för att dämpa skärmen. Om PWM upptäcktes mättes ett medelvärde av 7769 (minst: 5 - maximum: 343500) Hz. | |||

Prestanda
Testförhållanden
Vi ställde in Windows på prestandaläge och GPU:n på diskret läge innan vi körde nedanstående benchmarks. Systemet stöder inte Advanced Optimus enligt Nvidias kontrollpanel.
Processor
Core Core i7-14700HX är ett rejält lyft jämfört med Core i7-13700HX med en 20 till 25-procentig ökning av flertrådsprestanda. SKU:er med Core i9-13980HX finns fortfarande tillgängliga, vilket kan ge ännu snabbare prestanda än vår Core I7-14700HX trots att det är en äldre processor.
Hållbarheten i prestanda är bra men kan bli bättre. När vi till exempel körde CineBench R15 xT i en loop sjönk vår ursprungliga poäng på 3930 poäng med 10 procent efter bara några loopar.
Cinebench R15 Multi Loop
Cinebench R23: Multi Core | Single Core
Cinebench R20: CPU (Multi Core) | CPU (Single Core)
Cinebench R15: CPU Multi 64Bit | CPU Single 64Bit
Blender: v2.79 BMW27 CPU
7-Zip 18.03: 7z b 4 | 7z b 4 -mmt1
Geekbench 6.7: Multi-Core | Single-Core
Geekbench 5.5: Multi-Core | Single-Core
HWBOT x265 Benchmark v2.2: 4k Preset
LibreOffice : 20 Documents To PDF
R Benchmark 2.5: Overall mean
| CPU Performance rating | |
| HP ZBook Fury 16 G11 | |
| Lenovo ThinkPad P16 Gen 2 | |
| Genomsnitt av klass Workstation | |
| Genomsnitt Intel Core i7-14700HX | |
| Lenovo ThinkPad P16 G1 RTX A5500 -2! | |
| Lenovo ThinkPad P1 G6 21FV001KUS | |
| Lenovo ThinkPad P16 G2 21FA000FGE -2! | |
| Dell Precision 5690 | |
| Lenovo ThinkPad P1 G6-21FV000DGE | |
| Lenovo ThinkPad P1 Gen 7 21KV001SGE | |
| HP ZBook Fury 16 G9 -2! | |
| HP ZBook Power 16 G11 A | |
| MSI CreatorPro Z16P B12UKST -2! | |
| Lenovo ThinkPad P16v G1 AMD | |
| Lenovo ThinkPad P16s G2 21K9000CGE | |
| HP ZBook Firefly 16 G9-6B897EA -2! | |
| Geekbench 6.7 / Multi-Core | |
| Lenovo ThinkPad P16 Gen 2 | |
| Genomsnitt av klass Workstation (12721 - 20887, n=24, senaste 2 åren) | |
| Genomsnitt Intel Core i7-14700HX (14163 - 17562, n=9) | |
| HP ZBook Fury 16 G11 | |
| Dell Precision 5690 | |
| Lenovo ThinkPad P1 Gen 7 21KV001SGE | |
| Lenovo ThinkPad P1 G6 21FV001KUS | |
| HP ZBook Power 16 G11 A | |
| Lenovo ThinkPad P1 G6-21FV000DGE | |
| Lenovo ThinkPad P16s G2 21K9000CGE | |
| Lenovo ThinkPad P16v G1 AMD | |
| Geekbench 6.7 / Single-Core | |
| HP ZBook Fury 16 G11 | |
| Lenovo ThinkPad P16 Gen 2 | |
| Genomsnitt av klass Workstation (2389 - 3065, n=24, senaste 2 åren) | |
| Genomsnitt Intel Core i7-14700HX (2378 - 2975, n=9) | |
| Lenovo ThinkPad P1 G6 21FV001KUS | |
| Lenovo ThinkPad P1 G6-21FV000DGE | |
| HP ZBook Power 16 G11 A | |
| Lenovo ThinkPad P16v G1 AMD | |
| Dell Precision 5690 | |
| Lenovo ThinkPad P16s G2 21K9000CGE | |
| Lenovo ThinkPad P1 Gen 7 21KV001SGE | |
Cinebench R23: Multi Core | Single Core
Cinebench R20: CPU (Multi Core) | CPU (Single Core)
Cinebench R15: CPU Multi 64Bit | CPU Single 64Bit
Blender: v2.79 BMW27 CPU
7-Zip 18.03: 7z b 4 | 7z b 4 -mmt1
Geekbench 6.7: Multi-Core | Single-Core
Geekbench 5.5: Multi-Core | Single-Core
HWBOT x265 Benchmark v2.2: 4k Preset
LibreOffice : 20 Documents To PDF
R Benchmark 2.5: Overall mean
* ... mindre är bättre
AIDA64: FP32 Ray-Trace | FPU Julia | CPU SHA3 | CPU Queen | FPU SinJulia | FPU Mandel | CPU AES | CPU ZLib | FP64 Ray-Trace | CPU PhotoWorxx
| Performance rating | |
| Lenovo ThinkPad P16 Gen 2 | |
| HP ZBook Power 16 G11 A | |
| Genomsnitt Intel Core i7-14700HX | |
| Lenovo ThinkPad P16s G2 21K9000CGE | |
| Dell Precision 5690 | |
| Lenovo ThinkPad P16 G1 RTX A5500 | |
| Lenovo ThinkPad P16 G2 21FA000FGE | |
| AIDA64 / FP32 Ray-Trace | |
| HP ZBook Power 16 G11 A | |
| Lenovo ThinkPad P16s G2 21K9000CGE | |
| Lenovo ThinkPad P16 Gen 2 | |
| Genomsnitt Intel Core i7-14700HX (14147 - 23676, n=9) | |
| Dell Precision 5690 | |
| Lenovo ThinkPad P16 G2 21FA000FGE | |
| Lenovo ThinkPad P16 G1 RTX A5500 | |
| AIDA64 / FPU Julia | |
| HP ZBook Power 16 G11 A | |
| Lenovo ThinkPad P16 Gen 2 | |
| Genomsnitt Intel Core i7-14700HX (71875 - 116556, n=9) | |
| Lenovo ThinkPad P16s G2 21K9000CGE | |
| Dell Precision 5690 | |
| Lenovo ThinkPad P16 G2 21FA000FGE | |
| Lenovo ThinkPad P16 G1 RTX A5500 | |
| AIDA64 / CPU SHA3 | |
| Lenovo ThinkPad P16 Gen 2 | |
| Genomsnitt Intel Core i7-14700HX (3388 - 5567, n=9) | |
| HP ZBook Power 16 G11 A | |
| Lenovo ThinkPad P16s G2 21K9000CGE | |
| Dell Precision 5690 | |
| Lenovo ThinkPad P16 G2 21FA000FGE | |
| Lenovo ThinkPad P16 G1 RTX A5500 | |
| AIDA64 / CPU Queen | |
| Lenovo ThinkPad P16 Gen 2 | |
| Genomsnitt Intel Core i7-14700HX (129134 - 152200, n=9) | |
| HP ZBook Power 16 G11 A | |
| Lenovo ThinkPad P16 G2 21FA000FGE | |
| Lenovo ThinkPad P16 G1 RTX A5500 | |
| Lenovo ThinkPad P16s G2 21K9000CGE | |
| Dell Precision 5690 | |
| AIDA64 / FPU SinJulia | |
| HP ZBook Power 16 G11 A | |
| Lenovo ThinkPad P16s G2 21K9000CGE | |
| Lenovo ThinkPad P16 Gen 2 | |
| Genomsnitt Intel Core i7-14700HX (10266 - 14434, n=9) | |
| Lenovo ThinkPad P16 G1 RTX A5500 | |
| Lenovo ThinkPad P16 G2 21FA000FGE | |
| Dell Precision 5690 | |
| AIDA64 / FPU Mandel | |
| HP ZBook Power 16 G11 A | |
| Lenovo ThinkPad P16s G2 21K9000CGE | |
| Lenovo ThinkPad P16 Gen 2 | |
| Genomsnitt Intel Core i7-14700HX (35155 - 58380, n=9) | |
| Dell Precision 5690 | |
| Lenovo ThinkPad P16 G1 RTX A5500 | |
| Lenovo ThinkPad P16 G2 21FA000FGE | |
| AIDA64 / CPU AES | |
| Lenovo ThinkPad P16 Gen 2 | |
| Genomsnitt Intel Core i7-14700HX (68616 - 113157, n=9) | |
| Dell Precision 5690 | |
| Lenovo ThinkPad P16 G2 21FA000FGE | |
| Lenovo ThinkPad P16 G1 RTX A5500 | |
| HP ZBook Power 16 G11 A | |
| Lenovo ThinkPad P16s G2 21K9000CGE | |
| AIDA64 / CPU ZLib | |
| Lenovo ThinkPad P16 Gen 2 | |
| Genomsnitt Intel Core i7-14700HX (1003 - 1682, n=9) | |
| Dell Precision 5690 | |
| Lenovo ThinkPad P16 G1 RTX A5500 | |
| Lenovo ThinkPad P16 G2 21FA000FGE | |
| HP ZBook Power 16 G11 A | |
| Lenovo ThinkPad P16s G2 21K9000CGE | |
| AIDA64 / FP64 Ray-Trace | |
| HP ZBook Power 16 G11 A | |
| Lenovo ThinkPad P16s G2 21K9000CGE | |
| Lenovo ThinkPad P16 Gen 2 | |
| Genomsnitt Intel Core i7-14700HX (7585 - 12928, n=9) | |
| Lenovo ThinkPad P16 G1 RTX A5500 | |
| Lenovo ThinkPad P16 G2 21FA000FGE | |
| Dell Precision 5690 | |
| AIDA64 / CPU PhotoWorxx | |
| Dell Precision 5690 | |
| Genomsnitt Intel Core i7-14700HX (24276 - 49671, n=9) | |
| Lenovo ThinkPad P16 G1 RTX A5500 | |
| HP ZBook Power 16 G11 A | |
| Lenovo ThinkPad P16 Gen 2 | |
| Lenovo ThinkPad P16s G2 21K9000CGE | |
| Lenovo ThinkPad P16 G2 21FA000FGE | |
Stresstest
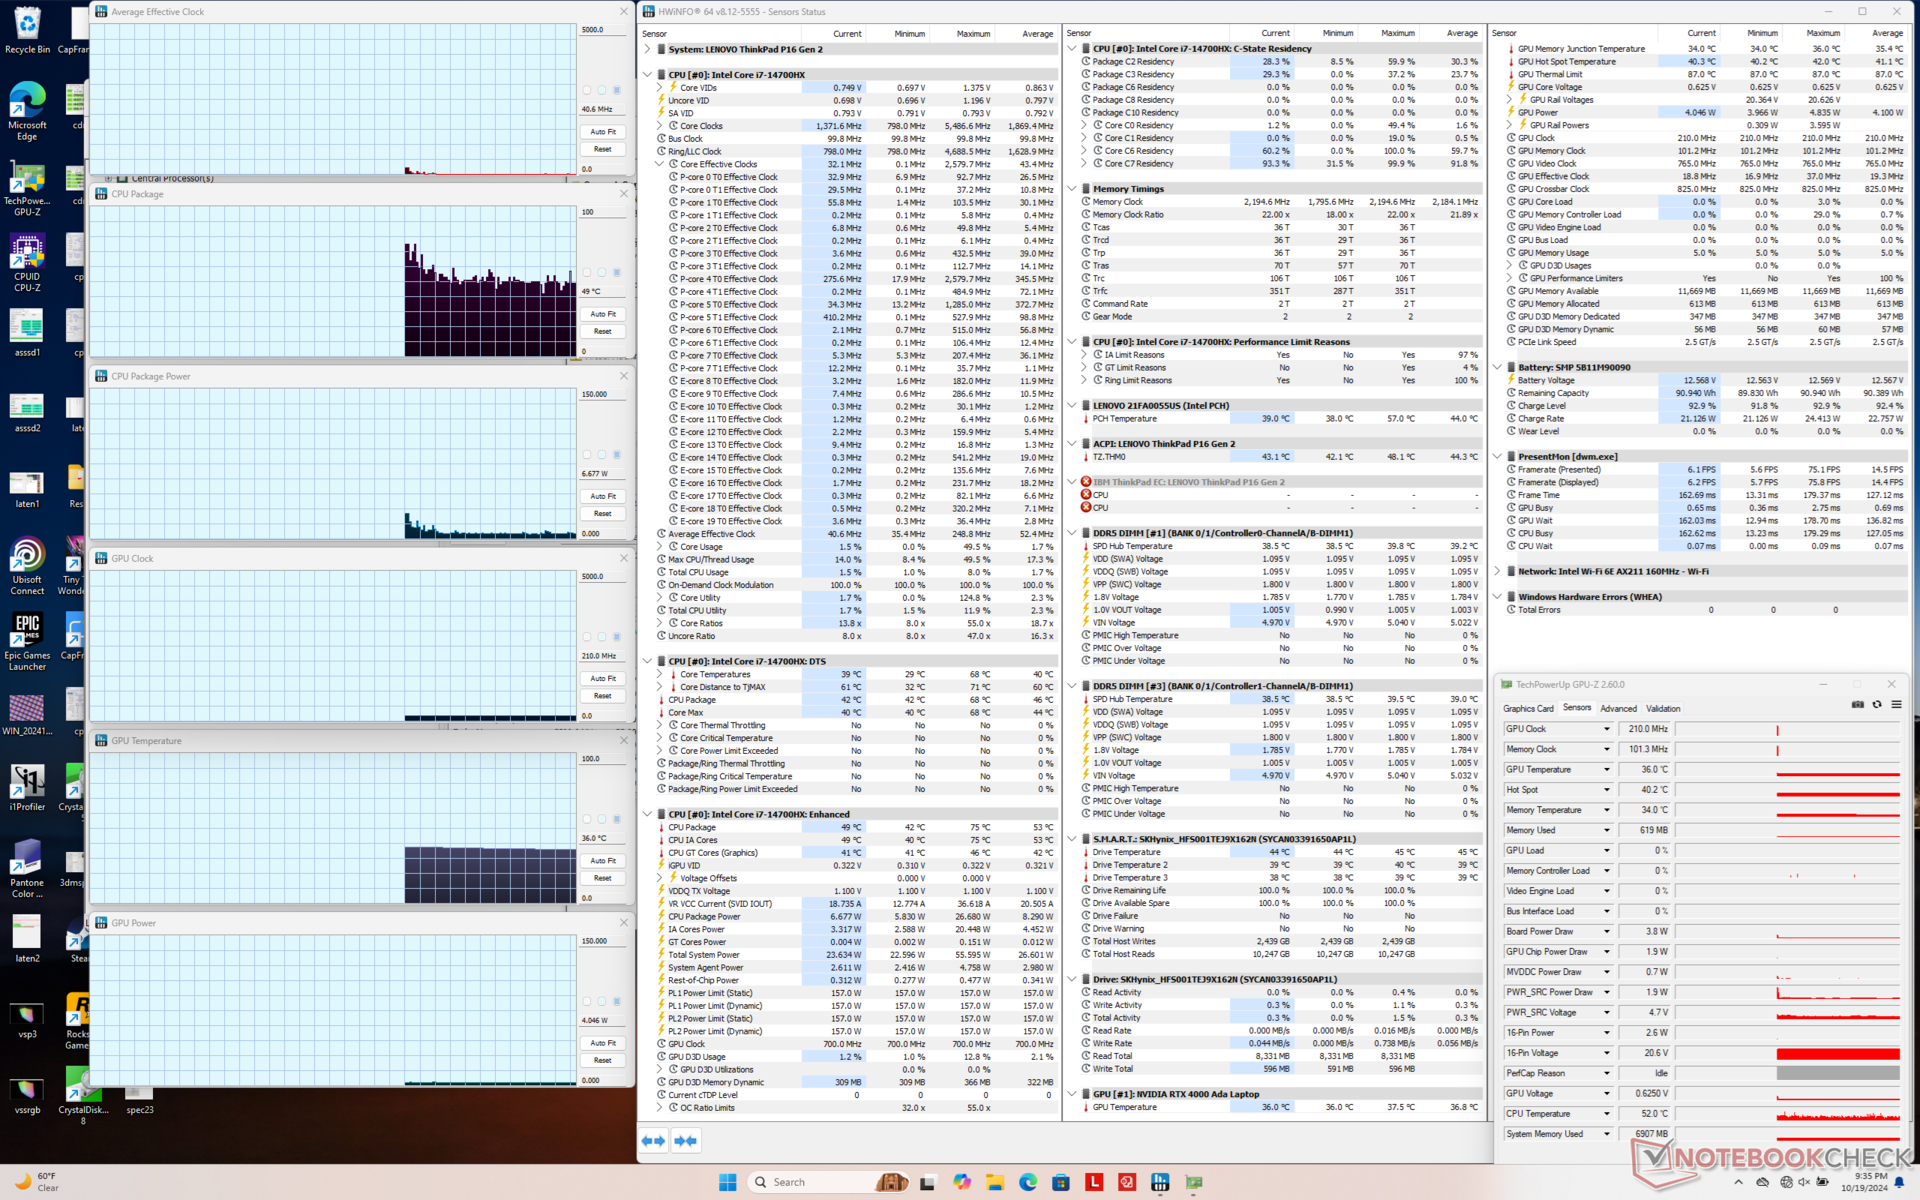
Kärntemperaturerna är ganska höga när systemet är stressat, vilket leder till mycket varma yttemperaturer, vilket framgår av avsnittet Temperatur nedan. När man till exempel kör Prime95 eller Cyberpunk 2077 når processorn långt över 80 C och ibland till och med 100 C. Paketets strömförbrukning och därmed klockfrekvensen varierar mellan 66 W och 90 W för att hålla temperaturerna i schack, vilket visas av våra skärmdumpar nedan.
GPU-kortets effektuttag kan nå hela 130 W som annonserat när Cyberpunk 2077 körs i prestandaläge. GPU-temperaturen skulle dock vara relativt hög på över 85 C och så bildhastigheter kommer så småningom att sjunka som svar som nämns i vårt GPU-prestandaavsnitt. Kärnklockan, minnesklockan och kortets strömförbrukning sjunker ännu mer om du spelar i läget Balanserad istället.
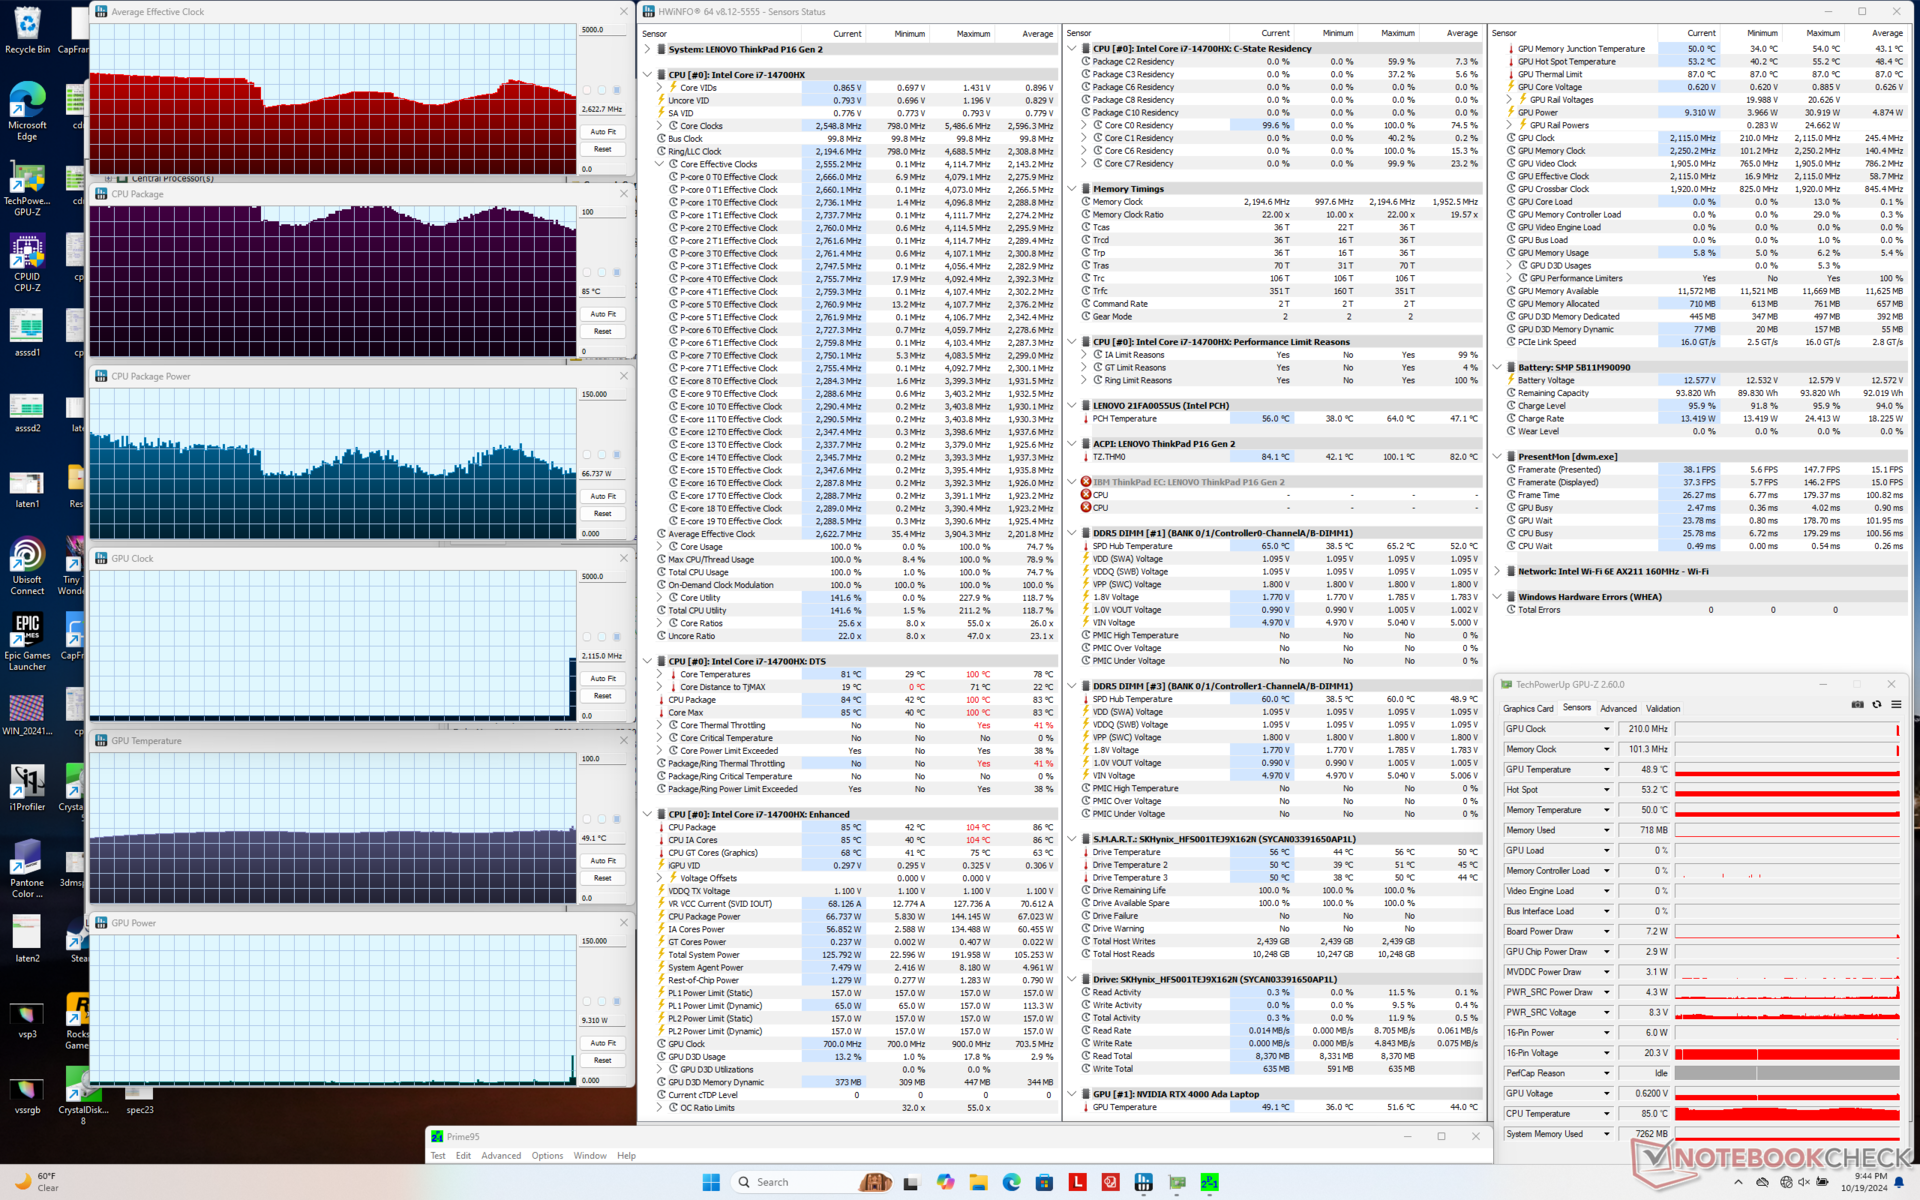
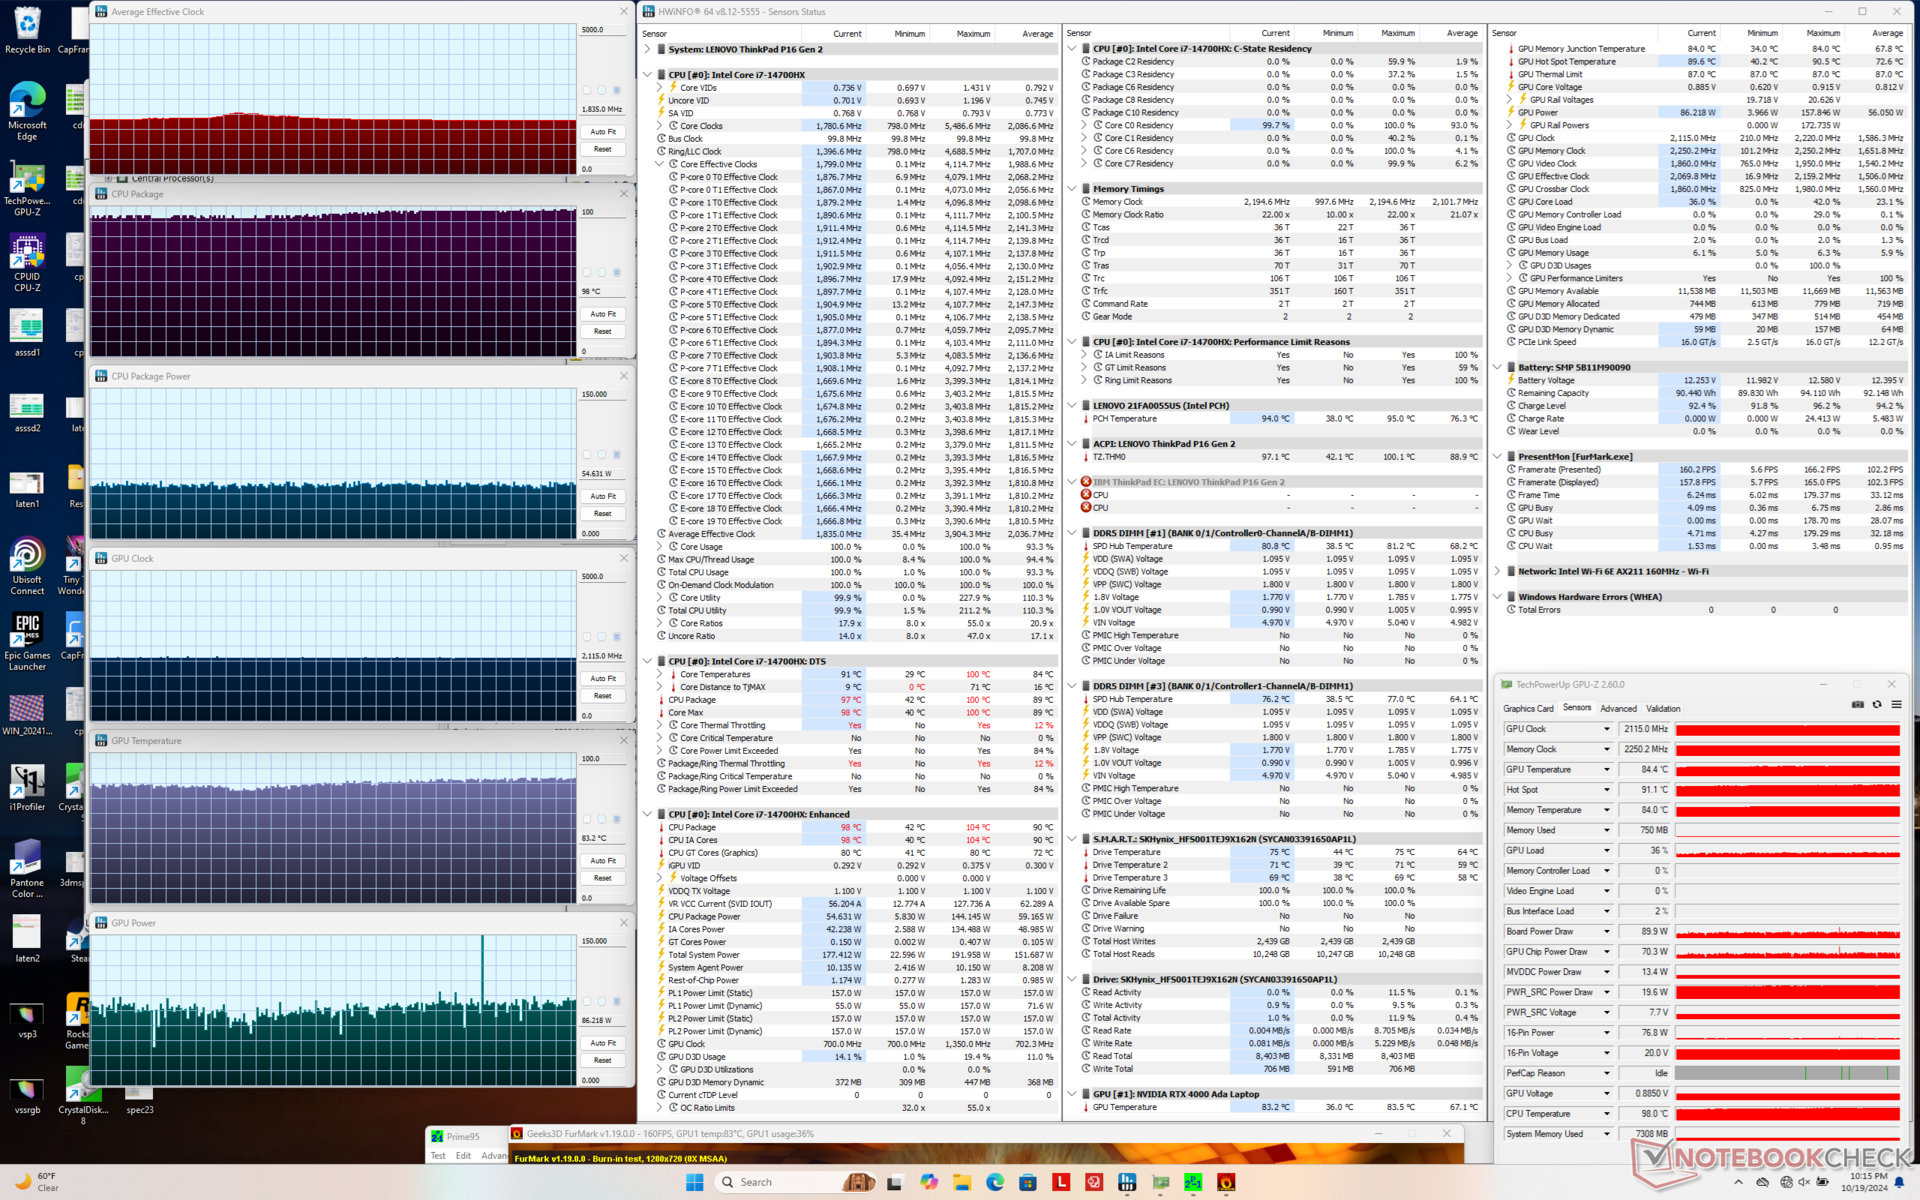
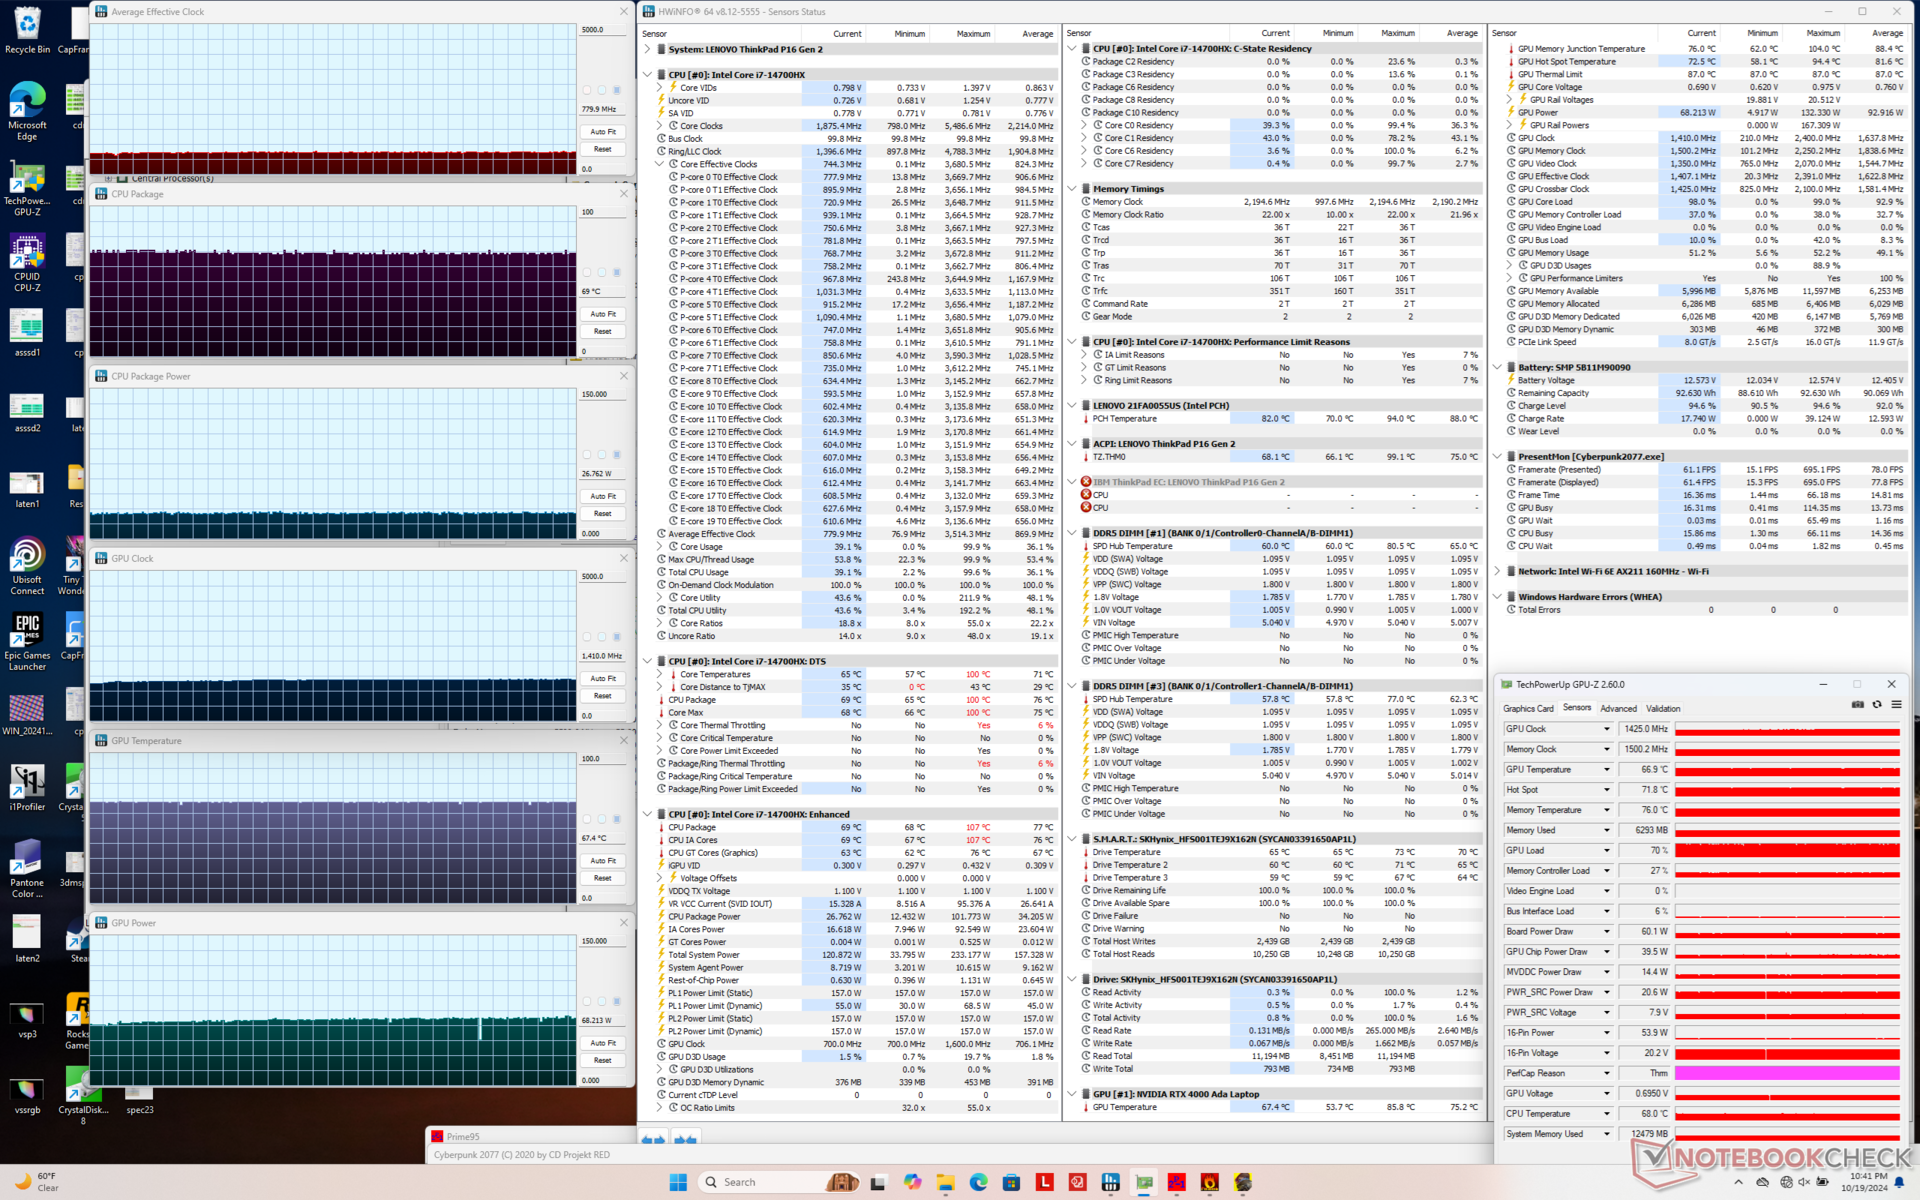
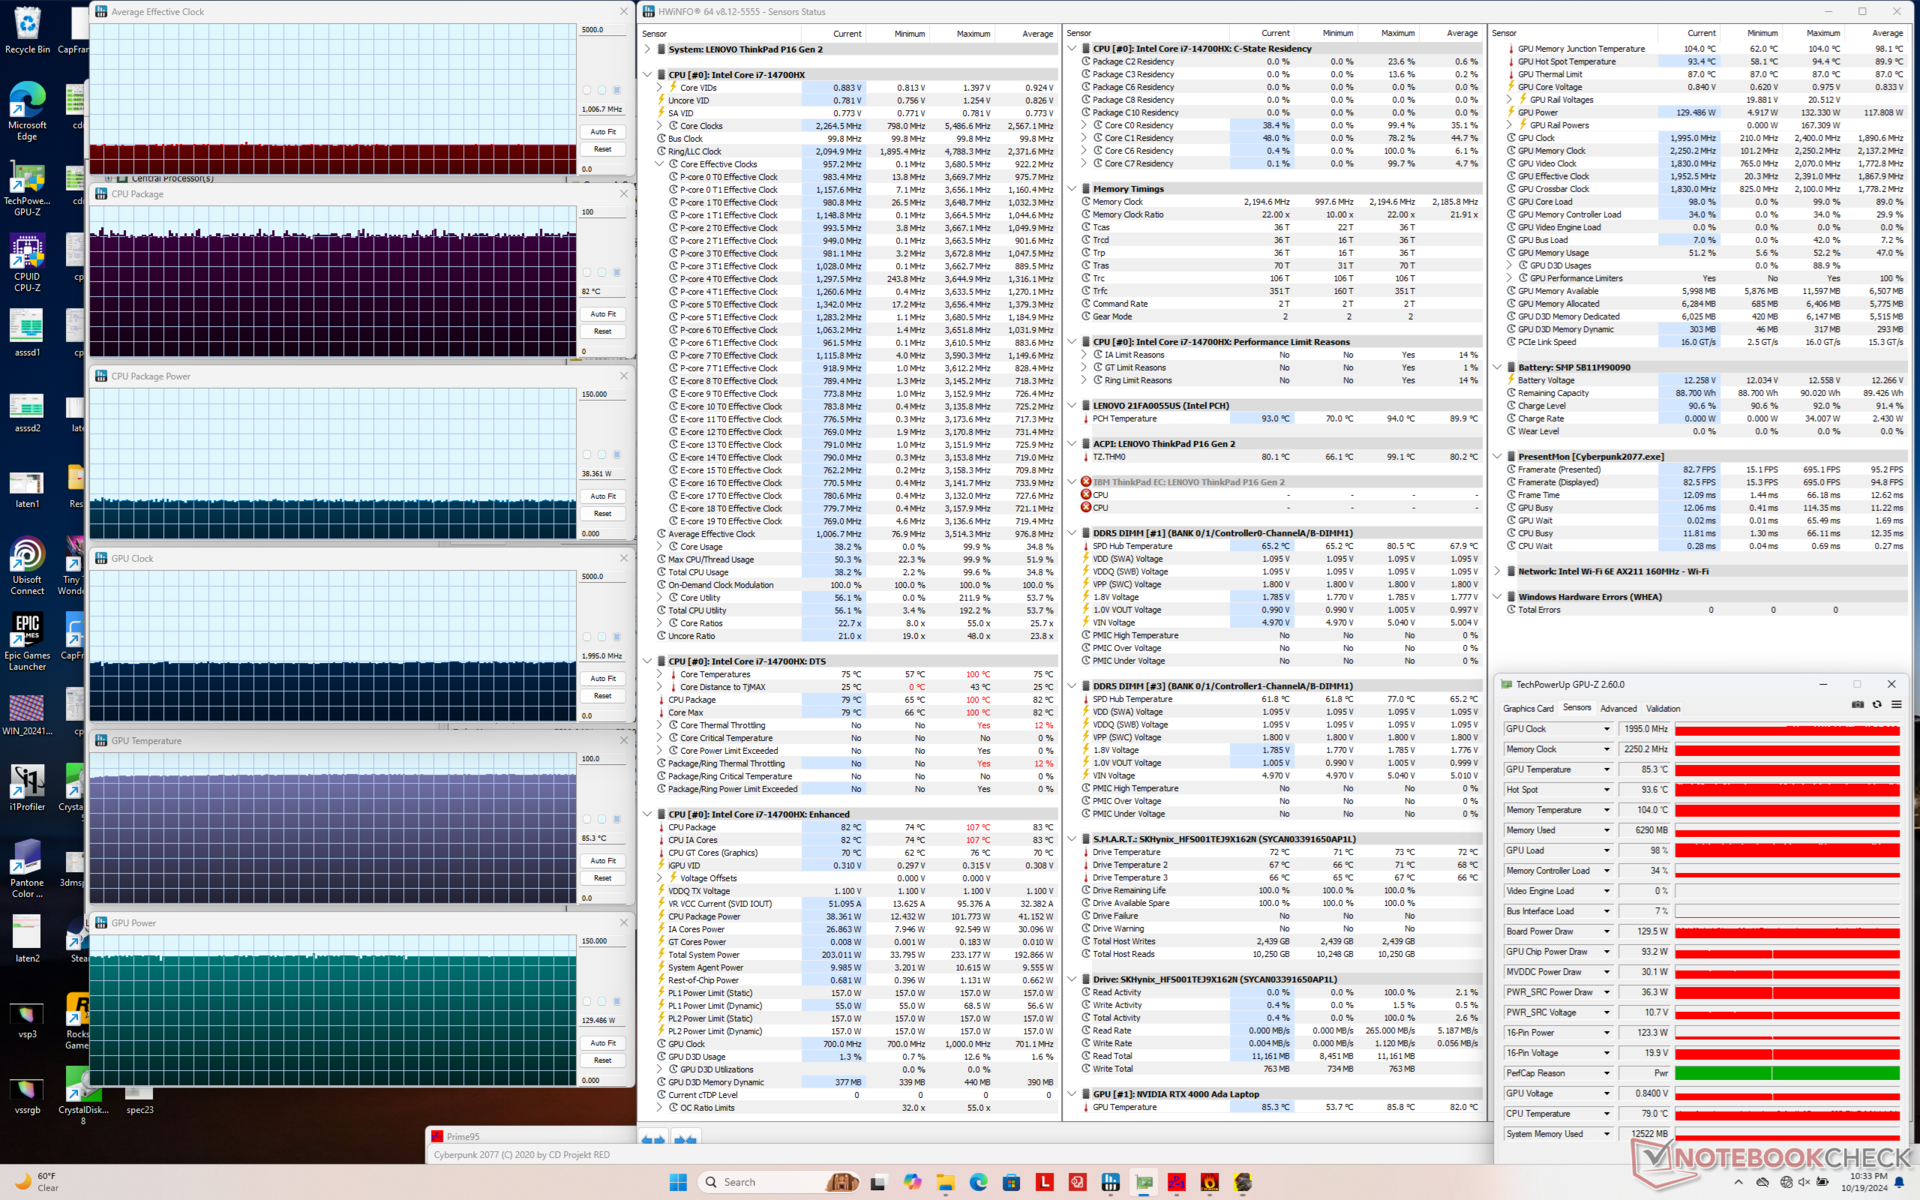
| CPU-klocka (GHz) | GPU-klocka (MHz) | Genomsnittlig CPU-temperatur (°C) | Genomsnittlig GPU-temperatur (°C) | |
| System i viloläge | -- | -- | 49 | 36 |
| Prime95 Stress | 2,6 - 3,1 | -- | 85 - 100 | 49 |
| Prime95 + FurMark Stress | 1,8 | 2115 | 98 | 83 |
| Cyberpunk 2077 Stress (Balanserat läge) | 0,8 | 1425 | 69 | 67 |
| Cyberpunk 2077 Stress (Performance-läge) | 1.0 | 1995 | 82 | 85 |
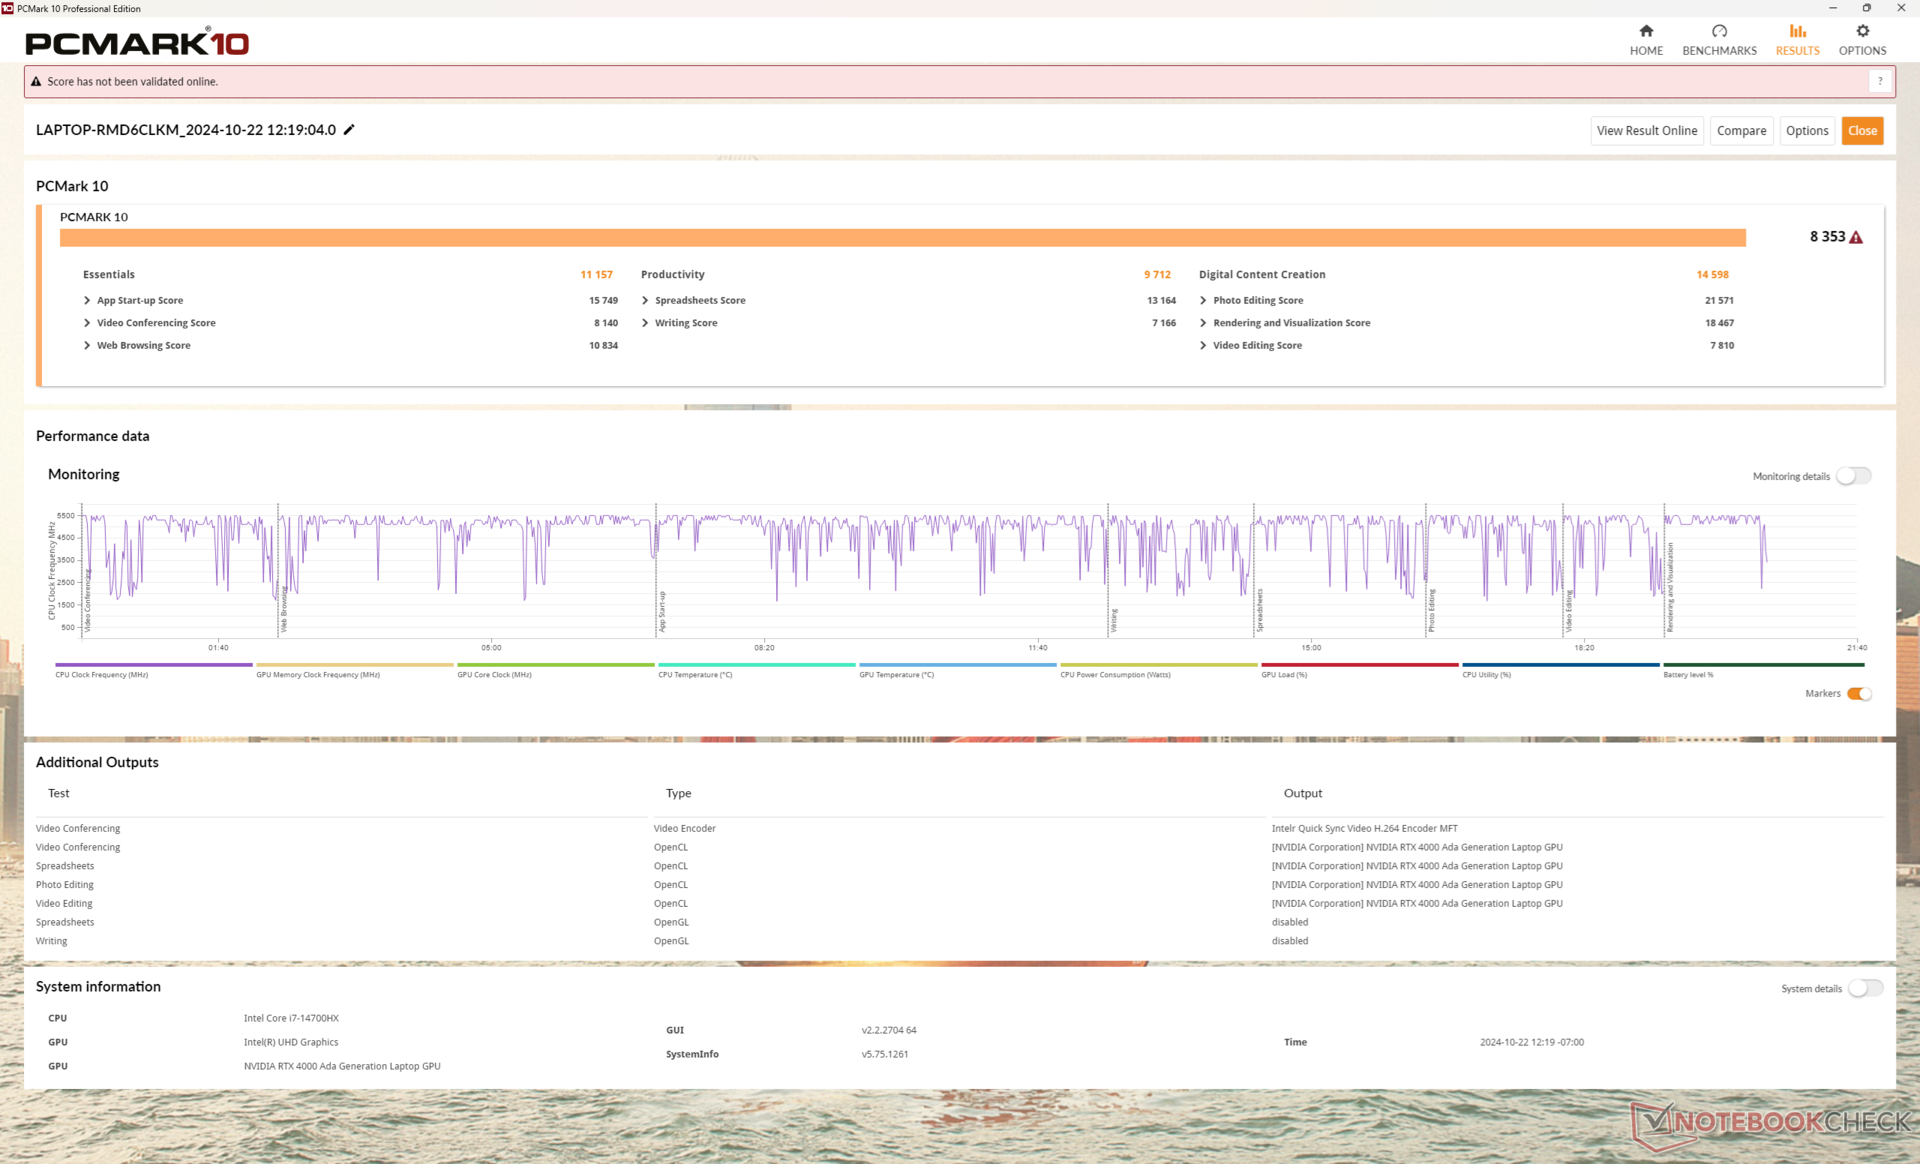
Systemets prestanda
CrossMark: Overall | Productivity | Creativity | Responsiveness
WebXPRT 3: Overall
WebXPRT 4: Overall
Mozilla Kraken 1.1: Total
| PCMark 10 / Score | |
| Lenovo ThinkPad P16 Gen 2 | |
| Genomsnitt Intel Core i7-14700HX, NVIDIA RTX 4000 Ada Generation Laptop (n=1) | |
| Dell Precision 5690 | |
| HP ZBook Power 16 G11 A | |
| Lenovo ThinkPad P16 G1 RTX A5500 | |
| Lenovo ThinkPad P16 G2 21FA000FGE | |
| Lenovo ThinkPad P16s G2 21K9000CGE | |
| PCMark 10 / Essentials | |
| Lenovo ThinkPad P16 Gen 2 | |
| Genomsnitt Intel Core i7-14700HX, NVIDIA RTX 4000 Ada Generation Laptop (n=1) | |
| Dell Precision 5690 | |
| Lenovo ThinkPad P16 G2 21FA000FGE | |
| Lenovo ThinkPad P16 G1 RTX A5500 | |
| HP ZBook Power 16 G11 A | |
| Lenovo ThinkPad P16s G2 21K9000CGE | |
| PCMark 10 / Productivity | |
| Dell Precision 5690 | |
| Lenovo ThinkPad P16 Gen 2 | |
| Genomsnitt Intel Core i7-14700HX, NVIDIA RTX 4000 Ada Generation Laptop (n=1) | |
| HP ZBook Power 16 G11 A | |
| Lenovo ThinkPad P16 G1 RTX A5500 | |
| Lenovo ThinkPad P16 G2 21FA000FGE | |
| Lenovo ThinkPad P16s G2 21K9000CGE | |
| PCMark 10 / Digital Content Creation | |
| Lenovo ThinkPad P16 Gen 2 | |
| Genomsnitt Intel Core i7-14700HX, NVIDIA RTX 4000 Ada Generation Laptop (n=1) | |
| Dell Precision 5690 | |
| HP ZBook Power 16 G11 A | |
| Lenovo ThinkPad P16 G1 RTX A5500 | |
| Lenovo ThinkPad P16 G2 21FA000FGE | |
| Lenovo ThinkPad P16s G2 21K9000CGE | |
| CrossMark / Overall | |
| Lenovo ThinkPad P16 Gen 2 | |
| Genomsnitt Intel Core i7-14700HX, NVIDIA RTX 4000 Ada Generation Laptop (n=1) | |
| Lenovo ThinkPad P16 G1 RTX A5500 | |
| Lenovo ThinkPad P16 G2 21FA000FGE | |
| Dell Precision 5690 | |
| HP ZBook Power 16 G11 A | |
| Lenovo ThinkPad P16s G2 21K9000CGE | |
| CrossMark / Productivity | |
| Lenovo ThinkPad P16 Gen 2 | |
| Genomsnitt Intel Core i7-14700HX, NVIDIA RTX 4000 Ada Generation Laptop (n=1) | |
| Lenovo ThinkPad P16 G1 RTX A5500 | |
| Dell Precision 5690 | |
| Lenovo ThinkPad P16 G2 21FA000FGE | |
| HP ZBook Power 16 G11 A | |
| Lenovo ThinkPad P16s G2 21K9000CGE | |
| CrossMark / Creativity | |
| Lenovo ThinkPad P16 Gen 2 | |
| Genomsnitt Intel Core i7-14700HX, NVIDIA RTX 4000 Ada Generation Laptop (n=1) | |
| Lenovo ThinkPad P16 G1 RTX A5500 | |
| Lenovo ThinkPad P16 G2 21FA000FGE | |
| HP ZBook Power 16 G11 A | |
| Dell Precision 5690 | |
| Lenovo ThinkPad P16s G2 21K9000CGE | |
| CrossMark / Responsiveness | |
| Lenovo ThinkPad P16 Gen 2 | |
| Genomsnitt Intel Core i7-14700HX, NVIDIA RTX 4000 Ada Generation Laptop (n=1) | |
| Dell Precision 5690 | |
| Lenovo ThinkPad P16 G1 RTX A5500 | |
| Lenovo ThinkPad P16 G2 21FA000FGE | |
| HP ZBook Power 16 G11 A | |
| Lenovo ThinkPad P16s G2 21K9000CGE | |
| WebXPRT 3 / Overall | |
| Lenovo ThinkPad P16 Gen 2 | |
| Genomsnitt Intel Core i7-14700HX, NVIDIA RTX 4000 Ada Generation Laptop (n=1) | |
| Lenovo ThinkPad P16 G2 21FA000FGE | |
| Lenovo ThinkPad P16 G1 RTX A5500 | |
| HP ZBook Power 16 G11 A | |
| Dell Precision 5690 | |
| Lenovo ThinkPad P16s G2 21K9000CGE | |
| WebXPRT 4 / Overall | |
| Lenovo ThinkPad P16 Gen 2 | |
| Genomsnitt Intel Core i7-14700HX, NVIDIA RTX 4000 Ada Generation Laptop (n=1) | |
| Lenovo ThinkPad P16 G1 RTX A5500 | |
| Dell Precision 5690 | |
| HP ZBook Power 16 G11 A | |
| Mozilla Kraken 1.1 / Total | |
| Lenovo ThinkPad P16s G2 21K9000CGE | |
| HP ZBook Power 16 G11 A | |
| Dell Precision 5690 | |
| Lenovo ThinkPad P16 G1 RTX A5500 | |
| Lenovo ThinkPad P16 G2 21FA000FGE | |
| Lenovo ThinkPad P16 Gen 2 | |
| Genomsnitt Intel Core i7-14700HX, NVIDIA RTX 4000 Ada Generation Laptop (n=1) | |
* ... mindre är bättre
| PCMark 10 Score | 8353 poäng | |
Hjälp | ||
| AIDA64 / Memory Copy | |
| Dell Precision 5690 | |
| Genomsnitt Intel Core i7-14700HX (41617 - 78742, n=9) | |
| Lenovo ThinkPad P16s G2 21K9000CGE | |
| Lenovo ThinkPad P16 Gen 2 | |
| Lenovo ThinkPad P16 G1 RTX A5500 | |
| HP ZBook Power 16 G11 A | |
| Lenovo ThinkPad P16 G2 21FA000FGE | |
| AIDA64 / Memory Read | |
| Dell Precision 5690 | |
| Genomsnitt Intel Core i7-14700HX (46627 - 86175, n=9) | |
| Lenovo ThinkPad P16 Gen 2 | |
| Lenovo ThinkPad P16 G1 RTX A5500 | |
| HP ZBook Power 16 G11 A | |
| Lenovo ThinkPad P16 G2 21FA000FGE | |
| Lenovo ThinkPad P16s G2 21K9000CGE | |
| AIDA64 / Memory Write | |
| Lenovo ThinkPad P16s G2 21K9000CGE | |
| HP ZBook Power 16 G11 A | |
| Dell Precision 5690 | |
| Genomsnitt Intel Core i7-14700HX (39155 - 76976, n=9) | |
| Lenovo ThinkPad P16 Gen 2 | |
| Lenovo ThinkPad P16 G1 RTX A5500 | |
| Lenovo ThinkPad P16 G2 21FA000FGE | |
| AIDA64 / Memory Latency | |
| Dell Precision 5690 | |
| Lenovo ThinkPad P16s G2 21K9000CGE | |
| Lenovo ThinkPad P16 G2 21FA000FGE | |
| HP ZBook Power 16 G11 A | |
| Lenovo ThinkPad P16 Gen 2 | |
| Lenovo ThinkPad P16 G1 RTX A5500 | |
| Genomsnitt Intel Core i7-14700HX (82.7 - 96.4, n=9) | |
* ... mindre är bättre
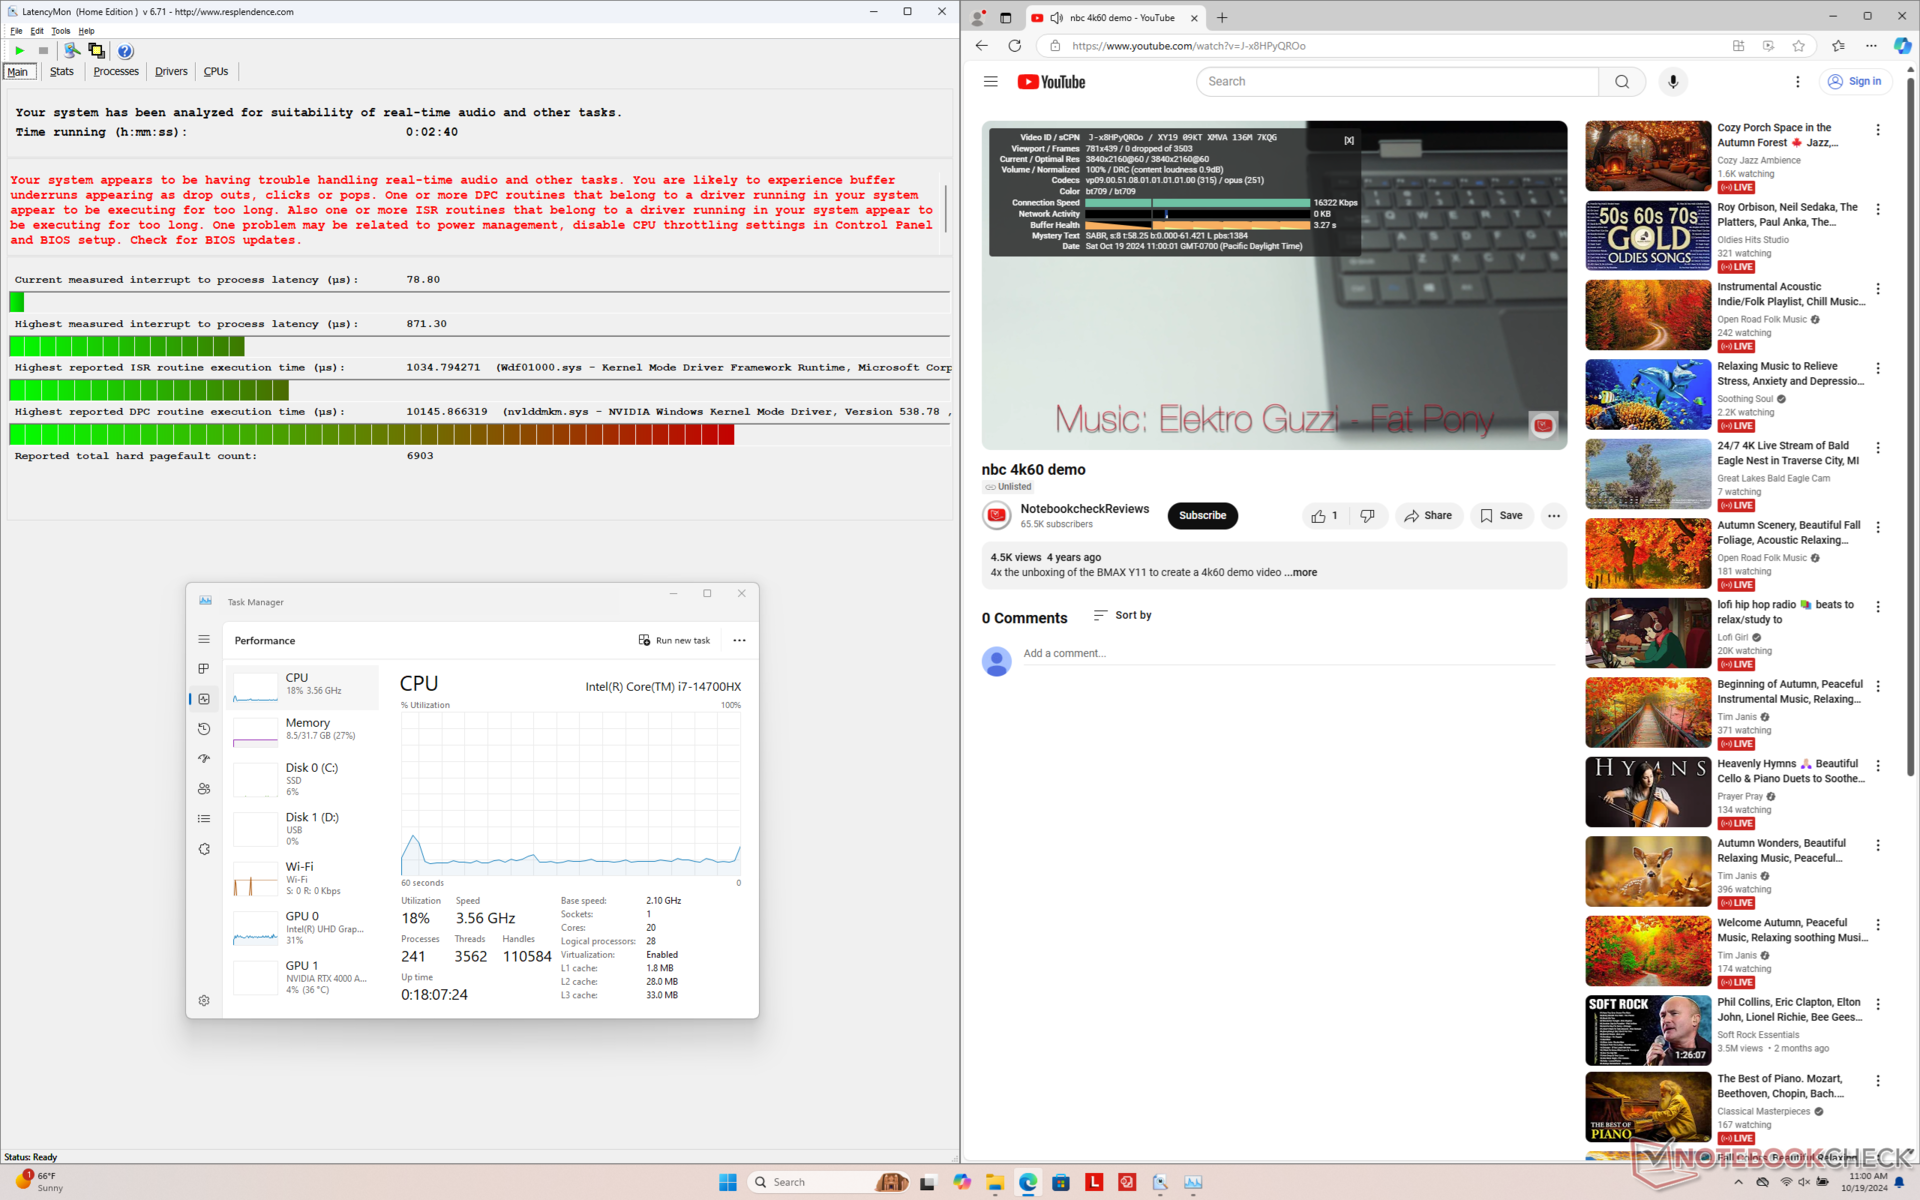
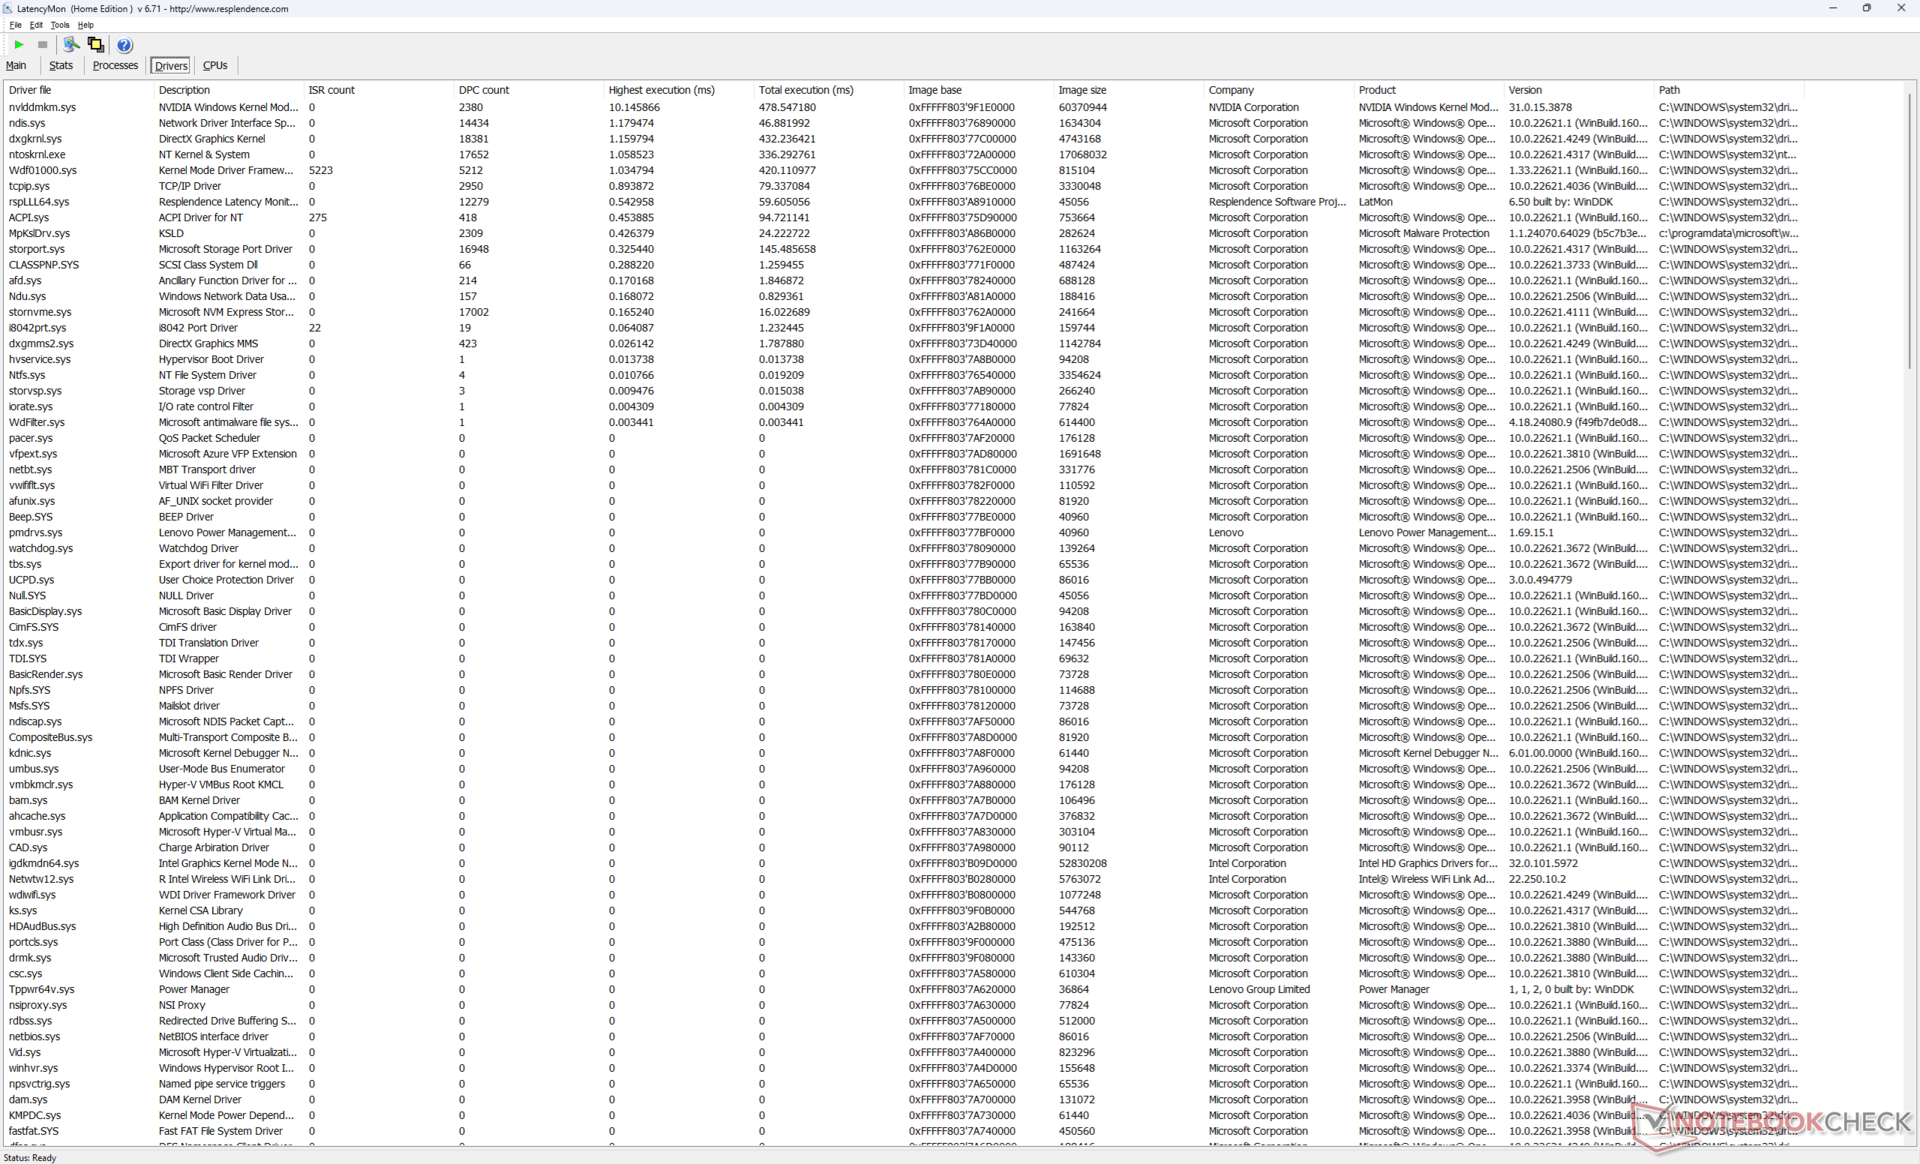
DPC-fördröjning
LatencyMon avslöjar små DPC-problem när du kör öppning av flera webbläsarflikar på vår hemsida. uppspelning av 4K-video med 60 FPS är annars perfekt utan några tappade bildrutor.
| DPC Latencies / LatencyMon - interrupt to process latency (max), Web, Youtube, Prime95 | |
| HP ZBook Power 16 G11 A | |
| Lenovo ThinkPad P16 G1 RTX A5500 | |
| Lenovo ThinkPad P16s G2 21K9000CGE | |
| Lenovo ThinkPad P16 G2 21FA000FGE | |
| Lenovo ThinkPad P16 Gen 2 | |
| Dell Precision 5690 | |
* ... mindre är bättre
Lagringsenheter
Inga förändringar av lagringsalternativ eller SSD-prestanda har observerats mellan våra två ThinkPad P16 Gen 2-testenheter.
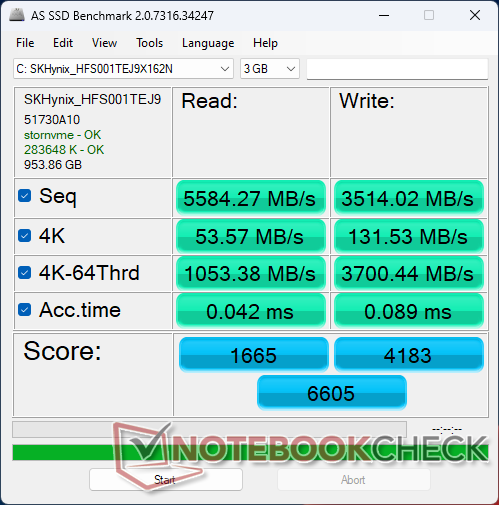
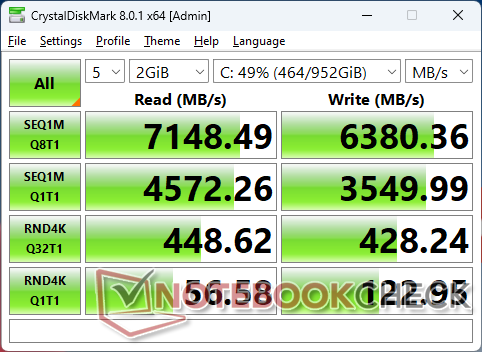

* ... mindre är bättre
Disk Throttling: DiskSpd Read Loop, Queue Depth 8
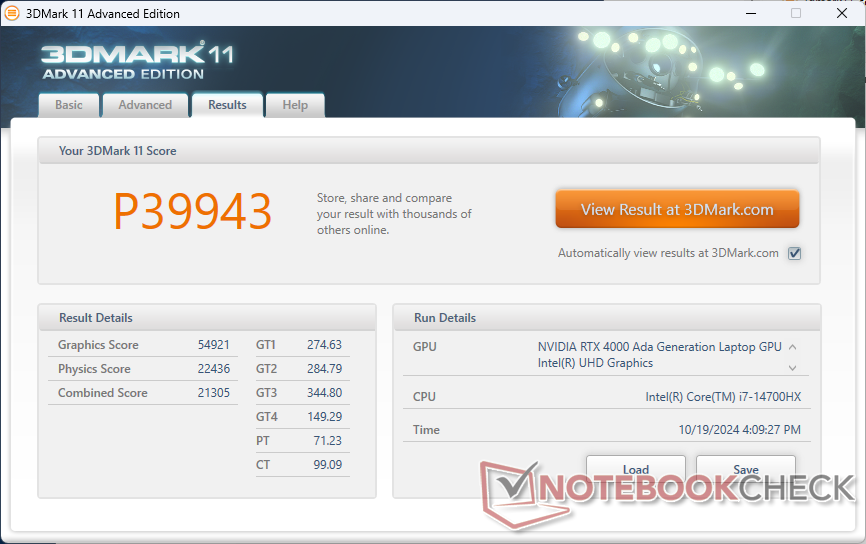
GPU-prestanda
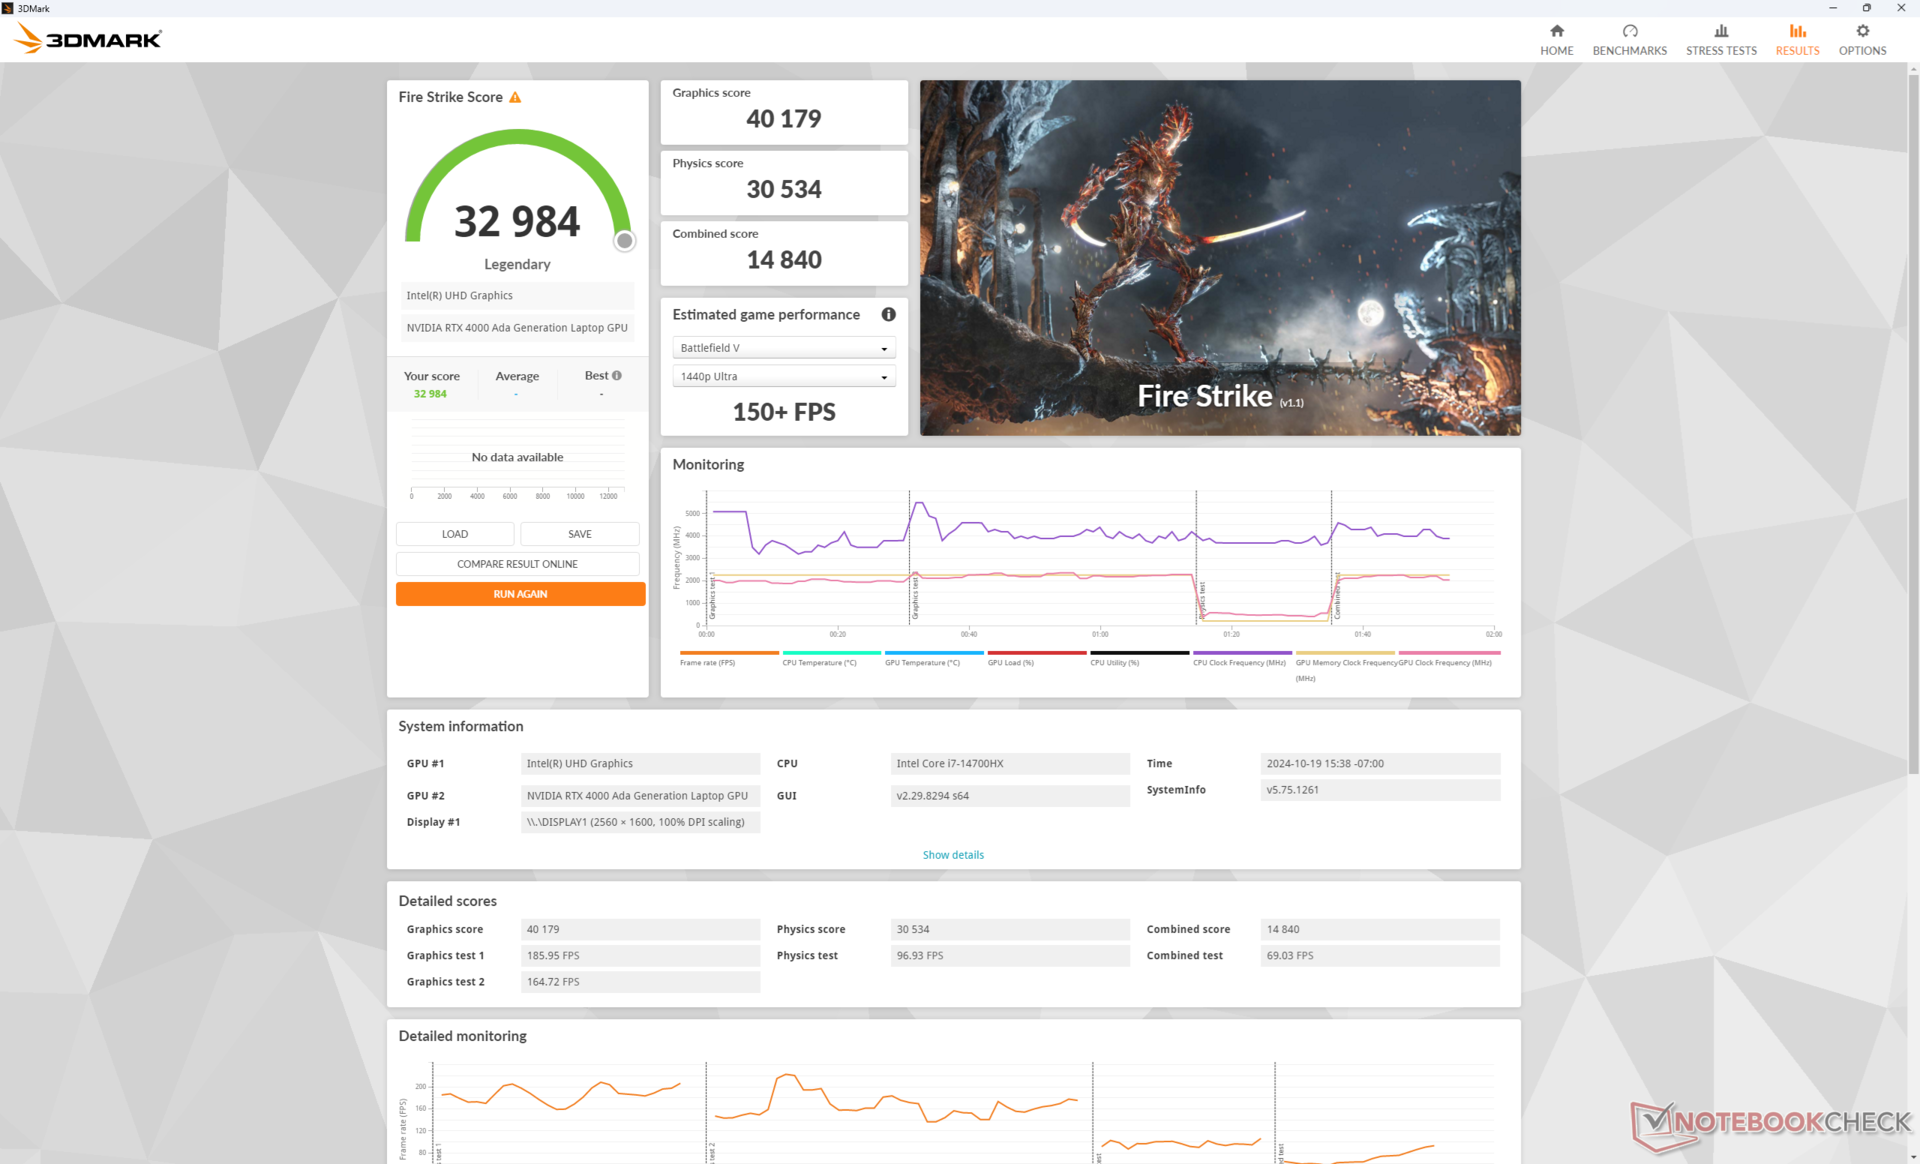
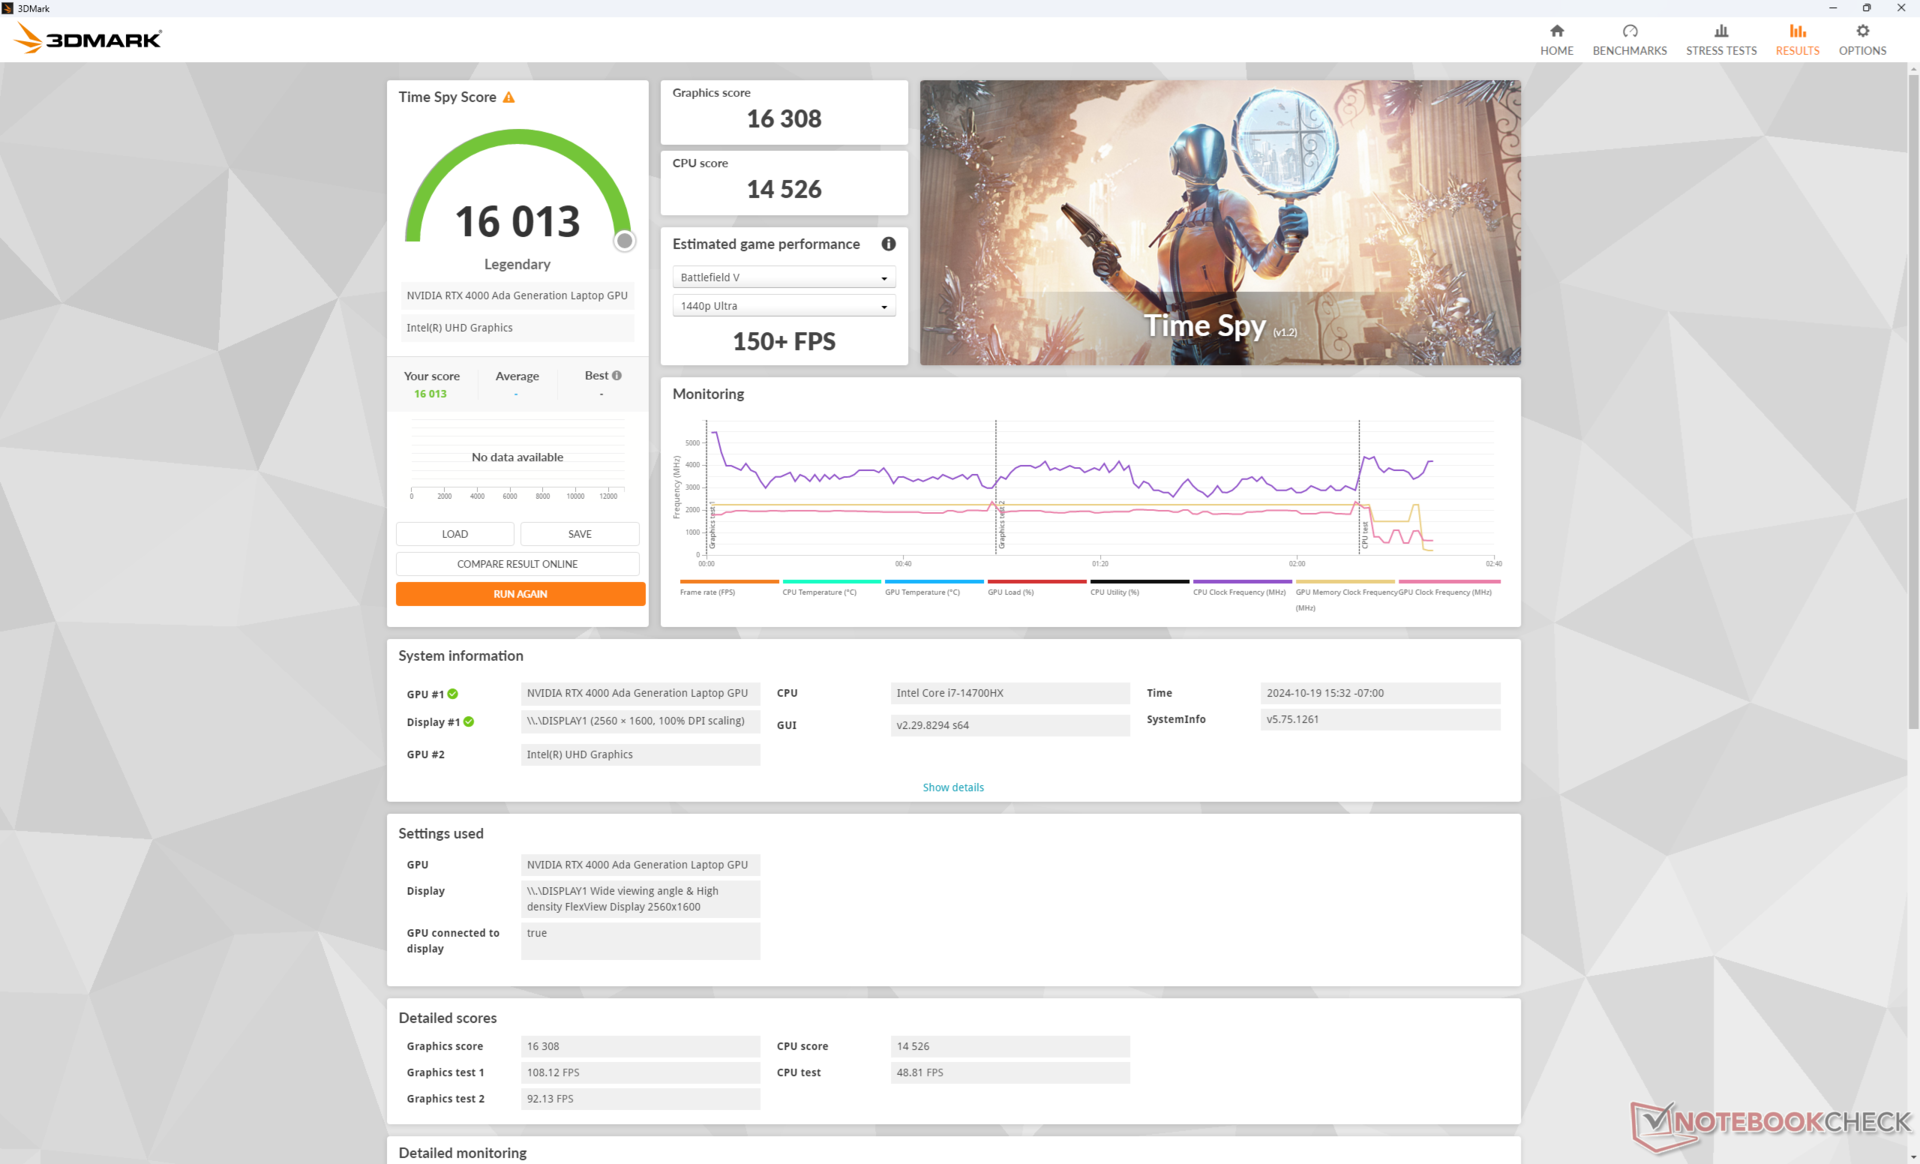
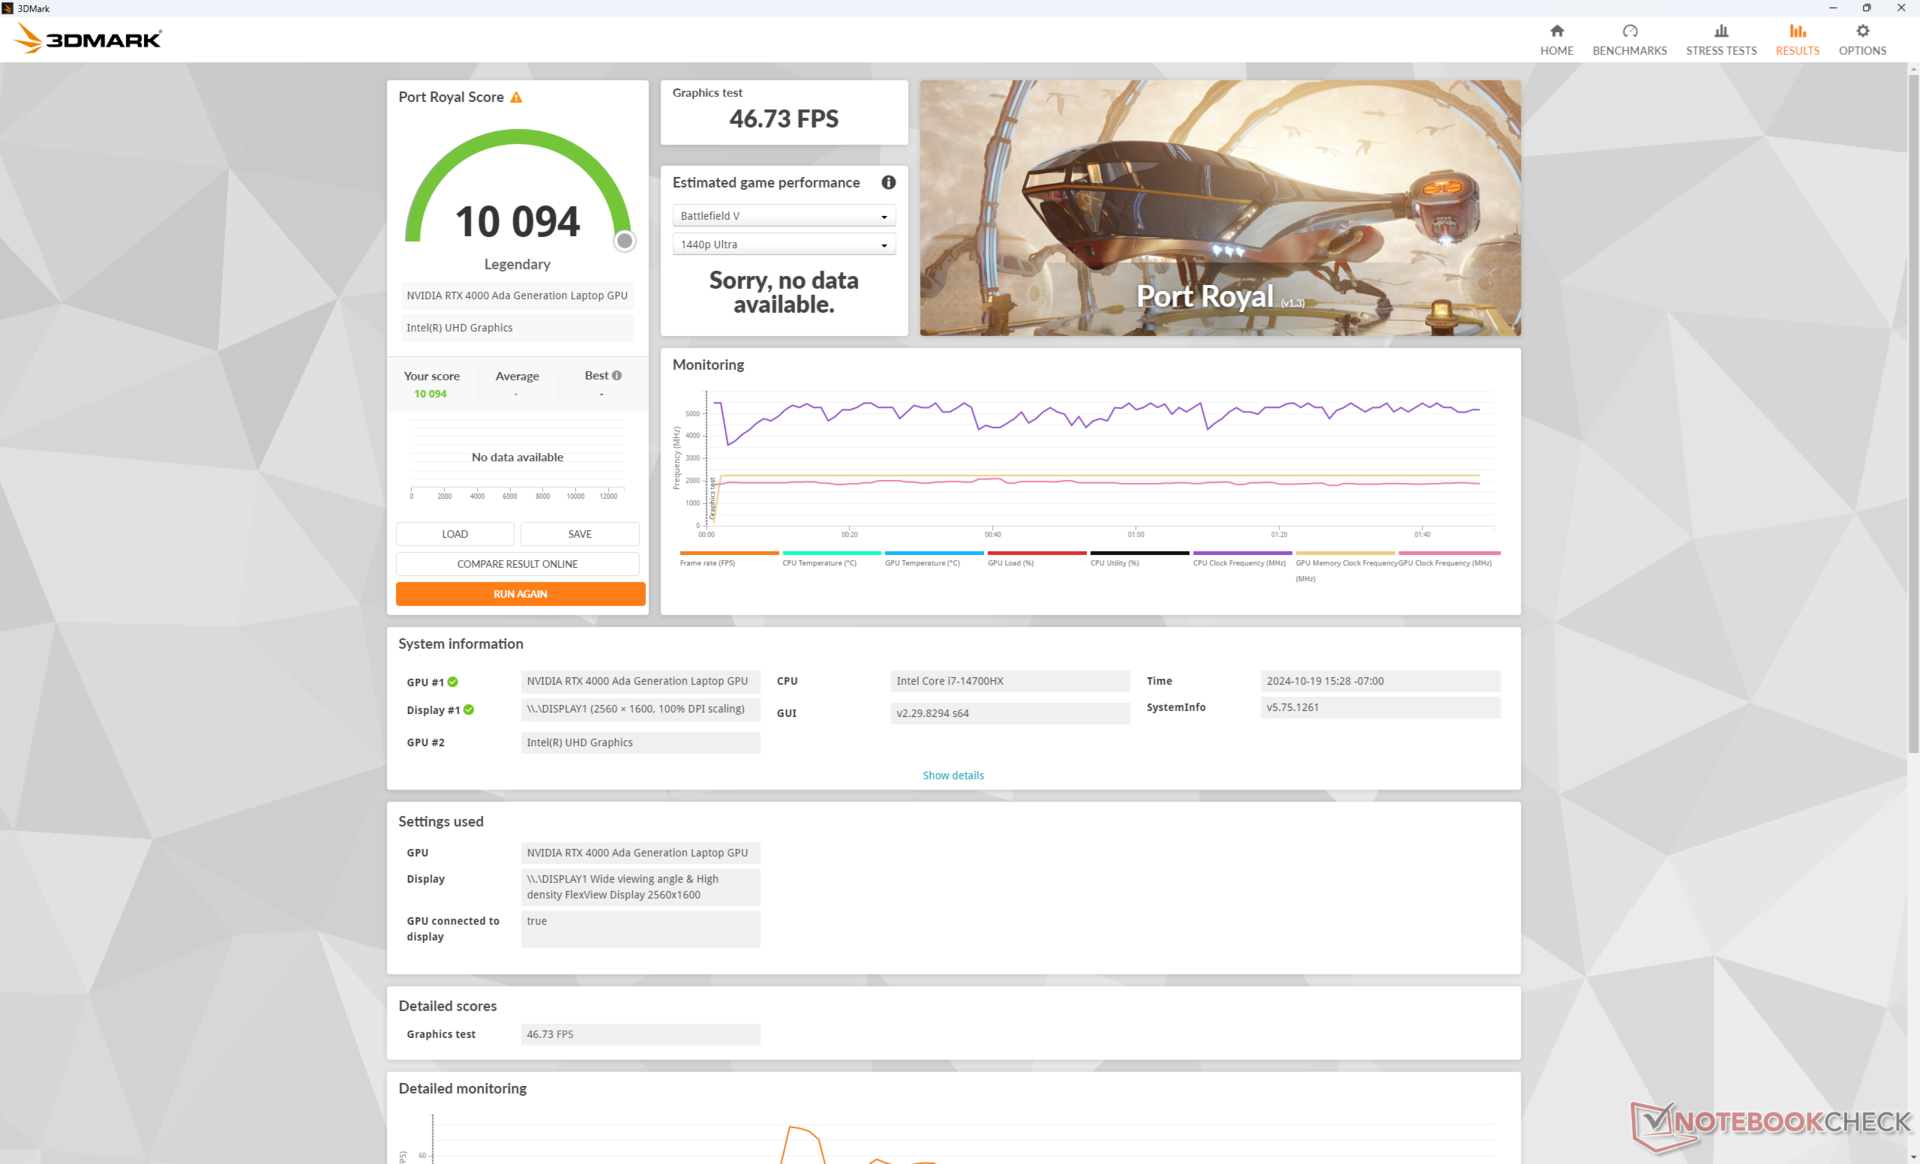
Den 130 W RTX 4000 Ada i vår Lenovo är mycket kraftfull för en mobil GPU och slår till och med 95 W RTX 5000 Ada i Precision 5690 med goda marginaler. 3DMark-resultaten är till exempel allt mellan 10 och 40 procent högre och liknande resultat kan uppnås när man kör SpecViewPerf.
| Kraftprofil | Grafikpoäng | Fysikpoäng | Kombinerad poäng |
| Prestanda-läge | 40179 | 30534 | 14840 |
| Balanserat läge | 32889 (-18%) | 29923 (-2%) | 13007 (-12%) |
| Batteriläge | 23401 (-42%) | 27793 (-9%) | 8510 (-42%) |
Att gå ner till balanserat läge från prestandaläget påverkar grafikprestandan något avsevärt, vilket framgår av vår Fire Strike resultattabell ovan.
| 3DMark Performance rating - Percent | |
| Lenovo ThinkPad P16 Gen 2 -3! | |
| Genomsnitt NVIDIA RTX 4000 Ada Generation Laptop -3! | |
| Dell Precision 5690 -3! | |
| HP ZBook Fury 16 G11 | |
| HP ZBook Fury 16 G9 -3! | |
| Dell Precision 5000 5490 -3! | |
| MSI CreatorPro Z16P B12UKST -19! | |
| HP ZBook Power 15 G10 -11! | |
| Asus ExpertBook B6 Flip B6602FC2 -19! | |
| Lenovo ThinkPad P16v G1 AMD -18! | |
| Lenovo ThinkPad P1 G4-20Y4Z9DVUS -19! | |
| Lenovo ThinkPad P16s G2 21K9000CGE -19! | |
| HP ZBook Firefly 16 G9-6B897EA -19! | |
| 3DMark 11 Performance | 39943 poäng | |
| 3DMark Cloud Gate Standard Score | 61459 poäng | |
| 3DMark Fire Strike Score | 32984 poäng | |
| 3DMark Time Spy Score | 16013 poäng | |
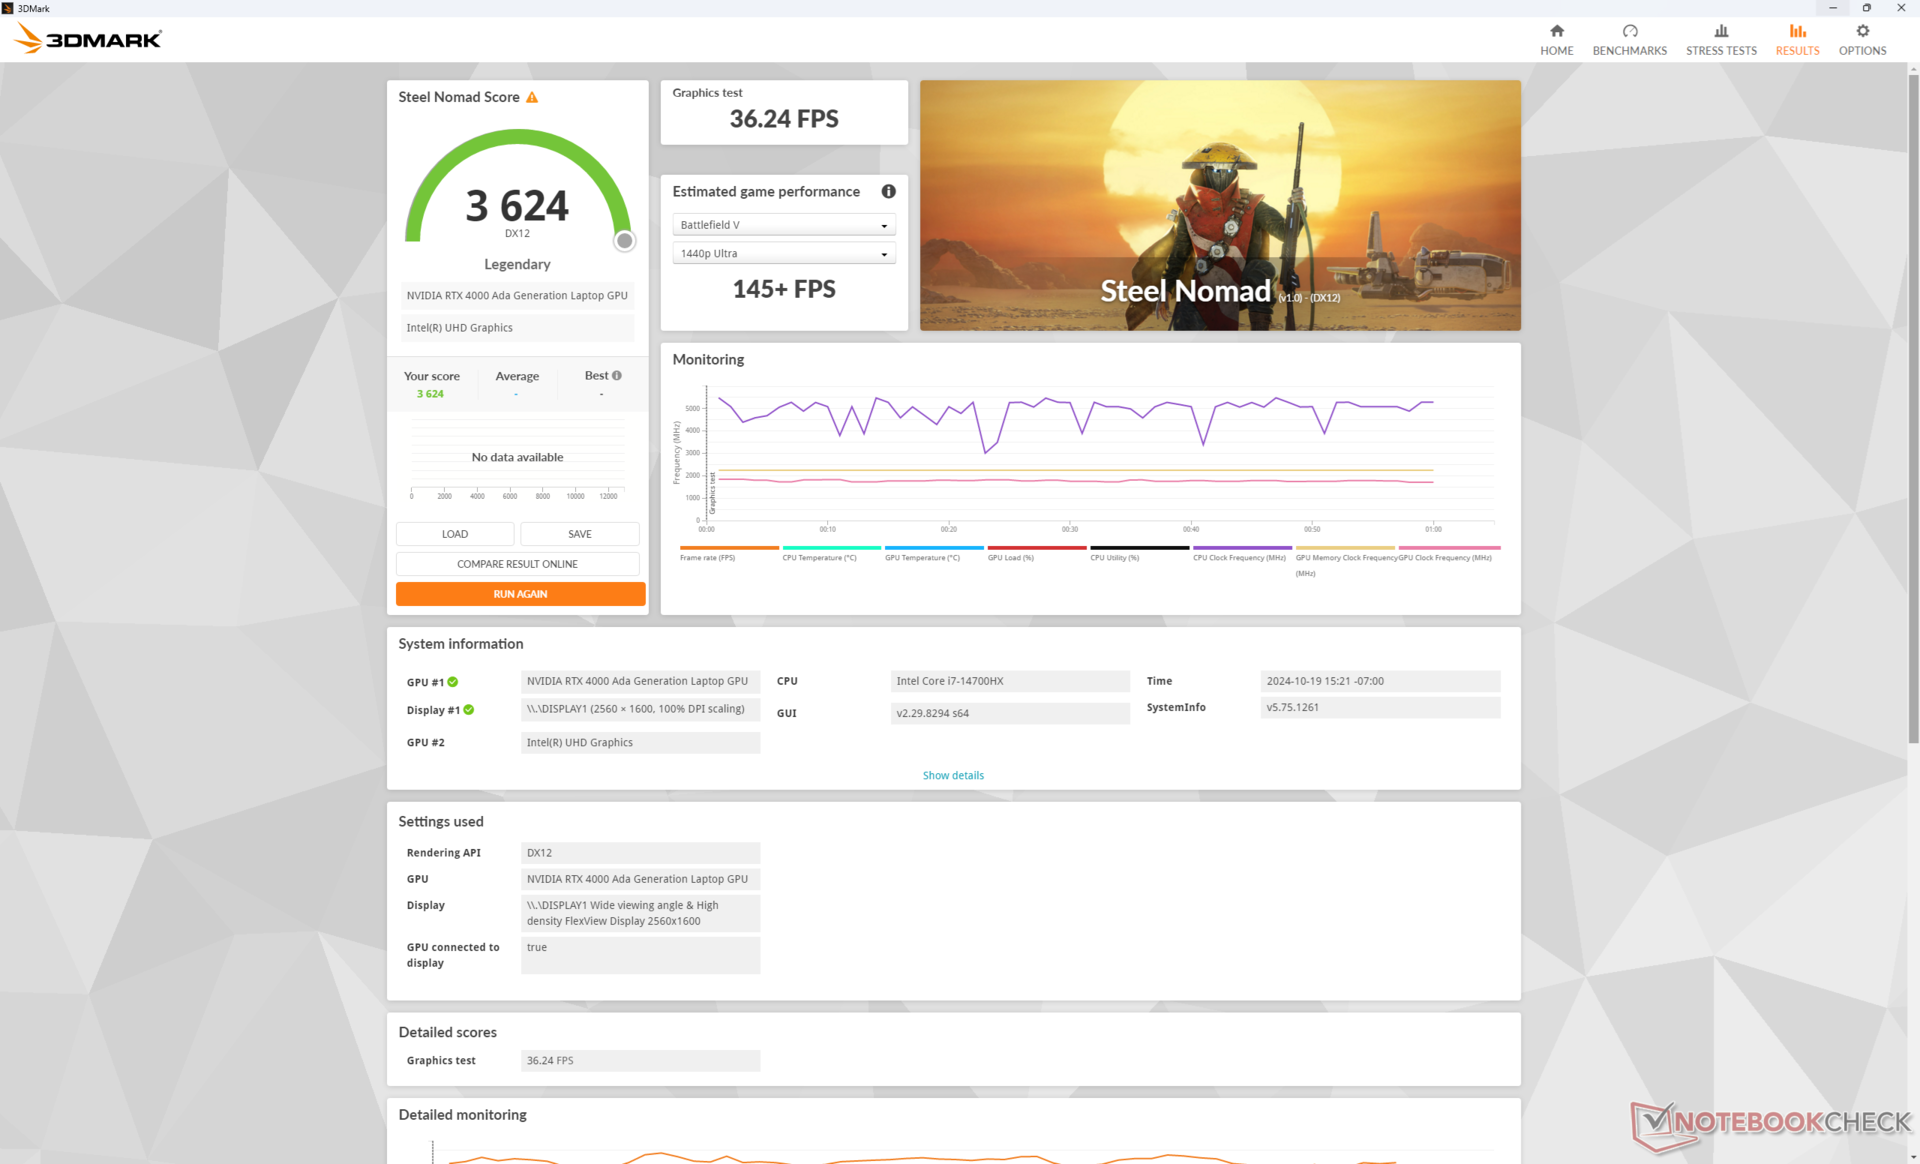
| 3DMark Steel Nomad Score | 3624 poäng | |
Hjälp | ||
* ... mindre är bättre
Prestanda för spel
Även om RTX 4000 Ada inte är optimerat för spel är det fortfarande ett kraftpaket, särskilt med tanke på dess 130 W TGP-tak. Spelprestandan är mest lik en bärbar dator för avancerade spel som körs på den mobila GeForce RTX 4080.
| Performance rating - Percent | |
| Lenovo ThinkPad P16 Gen 2 | |
| Dell Precision 5690 -1! | |
| Lenovo ThinkPad P16 G1 RTX A5500 -1! | |
| Lenovo ThinkPad P16 G2 21FA000FGE -1! | |
| HP ZBook Power 16 G11 A | |
| Lenovo ThinkPad P16s G2 21K9000CGE -1! | |
| Baldur's Gate 3 - 1920x1080 Ultra Preset AA:T | |
| Lenovo ThinkPad P16 Gen 2 | |
| Dell Precision 5690 | |
| HP ZBook Power 16 G11 A | |
| GTA V - 1920x1080 Highest AA:4xMSAA + FX AF:16x | |
| Lenovo ThinkPad P16 Gen 2 | |
| Lenovo ThinkPad P16 G1 RTX A5500 | |
| Lenovo ThinkPad P16 G2 21FA000FGE | |
| HP ZBook Power 16 G11 A | |
| Lenovo ThinkPad P16s G2 21K9000CGE | |
| Final Fantasy XV Benchmark - 1920x1080 High Quality | |
| Lenovo ThinkPad P16 Gen 2 | |
| Dell Precision 5690 | |
| Lenovo ThinkPad P16 G1 RTX A5500 | |
| Lenovo ThinkPad P16 G2 21FA000FGE | |
| HP ZBook Power 16 G11 A | |
| Lenovo ThinkPad P16s G2 21K9000CGE | |
| Strange Brigade - 1920x1080 ultra AA:ultra AF:16 | |
| Lenovo ThinkPad P16 Gen 2 | |
| Dell Precision 5690 | |
| Lenovo ThinkPad P16 G1 RTX A5500 | |
| Lenovo ThinkPad P16 G2 21FA000FGE | |
| HP ZBook Power 16 G11 A | |
| Lenovo ThinkPad P16s G2 21K9000CGE | |
| Dota 2 Reborn - 1920x1080 ultra (3/3) best looking | |
| Lenovo ThinkPad P16 Gen 2 | |
| Lenovo ThinkPad P16 G1 RTX A5500 | |
| Lenovo ThinkPad P16 G2 21FA000FGE | |
| Dell Precision 5690 | |
| HP ZBook Power 16 G11 A | |
| Lenovo ThinkPad P16s G2 21K9000CGE | |
| Baldur's Gate 3 | |
| 1920x1080 High Preset AA:T | |
| Lenovo ThinkPad P16 Gen 2 | |
| Genomsnitt NVIDIA RTX 4000 Ada Generation Laptop (n=1) | |
| Dell Precision 5690 | |
| HP ZBook Fury 16 G11 | |
| Dell Precision 5000 5490 | |
| 1920x1080 Ultra Preset AA:T | |
| Lenovo ThinkPad P16 Gen 2 | |
| Genomsnitt NVIDIA RTX 4000 Ada Generation Laptop (n=1) | |
| Dell Precision 5690 | |
| HP ZBook Fury 16 G11 | |
| Dell Precision 5000 5490 | |
| 2560x1440 Ultra Preset AA:T | |
| Dell Precision 5690 | |
| Lenovo ThinkPad P16 Gen 2 | |
| Genomsnitt NVIDIA RTX 4000 Ada Generation Laptop (n=1) | |
| HP ZBook Fury 16 G11 | |
Tyvärr finns det en liten prestandaförlust när du kör Cyberpunk 2077. Bildfrekvensen sjönk från ~103 till ~96 efter bara några minuters tomgångskörning i spelet och resultaten förbättrades inte efter upprepade tester. Detta tyder på att GPU:n potentiellt skulle ha kunnat dra nytta av en mer kapabel kyllösning.
Cyberpunk 2077 ultra FPS Chart
| låg | med. | hög | ultra | QHD | |
|---|---|---|---|---|---|
| GTA V (2015) | 185.8 | 183.9 | 179.4 | 125.6 | 118.7 |
| Dota 2 Reborn (2015) | 215.4 | 189.7 | 185.2 | 164.4 | |
| Final Fantasy XV Benchmark (2018) | 207 | 185.3 | 150 | 119.5 | |
| X-Plane 11.11 (2018) | 166.8 | 144 | 113.1 | ||
| Far Cry 5 (2018) | 168 | 148 | 138 | 128 | 125 |
| Strange Brigade (2018) | 452 | 372 | 323 | 292 | 210 |
| Tiny Tina's Wonderlands (2022) | 275.4 | 232.6 | 171.4 | 137.1 | 92 |
| F1 22 (2022) | 275 | 264 | 238 | 95.5 | 65.7 |
| Baldur's Gate 3 (2023) | 178.3 | 160.6 | 141.6 | 137 | 90.7 |
| Cyberpunk 2077 (2023) | 129.3 | 115.1 | 108.4 | 98.3 | 68.5 |
Utsläpp - Högljudda och ansvarsfulla
Systembuller
Fläktarna i vår enhet tenderar att öka i varvtal och ljudnivå snabbare jämfört med vår mindre RTX 2000 Ada-konfiguration. Ägare kan alltså förvänta sig mer fläktpulsering och förändringar i fläktljudet när de kör olika typer av belastningar. Krävande belastningar som spel skulle inducera ett fläktljud på 53 dB(A), vilket är en av de mest högljudda 16-tums arbetsstationer vi har testat.
Att köra Cyberpunk 2077 i balanserat läge istället för prestandaläge skulle minska fläktljudet märkbart från 52,8 dB(A) till 47,9 dB(A). Detta kommer dock på bekostnad av prestanda som noterats i vårt GPU-prestandaavsnitt ovan.
Ljudnivå
| Låg belastning |
| 29.1 / 29.1 / 29.1 dB(A) |
| Hög belastning |
| 41 / 52.9 dB(A) |
 | ||
30 dB tyst 40 dB(A) hörbar 50 dB(A) högt ljud |
||
min: | ||
| Lenovo ThinkPad P16 Gen 2 RTX 4000 Ada Generation Laptop, i7-14700HX, SK hynix PC801 HFS001TEJ9X162N | Lenovo ThinkPad P16 G2 21FA000FGE RTX 2000 Ada Generation Laptop, i7-13700HX, SK hynix PC801 HFS001TEJ9X162N | Lenovo ThinkPad P16s G2 21K9000CGE Radeon 780M, R7 PRO 7840U, SK hynix PC801 HFS001TEJ9X162N | Lenovo ThinkPad P16 G1 RTX A5500 RTX A5500 Laptop GPU, i9-12950HX, WDC PC SN810 2TB | HP ZBook Power 16 G11 A RTX 2000 Ada Generation Laptop, R7 8845HS, Samsung PM9A1 MZVL22T0HBLB | Dell Precision 5690 RTX 5000 Ada Generation Laptop, Ultra 9 185H, 2x Samsung PM9A1 1TB (RAID 0) | |
|---|---|---|---|---|---|---|
| Noise | 6% | 17% | 17% | 18% | 5% | |
| av / miljö * (dB) | 23.9 | 23.5 2% | 22.6 5% | 23.1 3% | 23.5 2% | 23.4 2% |
| Idle Minimum * (dB) | 29.1 | 23.5 19% | 22.6 22% | 23.1 21% | 23.8 18% | 23.6 19% |
| Idle Average * (dB) | 29.1 | 29.2 -0% | 22.6 22% | 23.1 21% | 24.2 17% | 24.9 14% |
| Idle Maximum * (dB) | 29.1 | 29.5 -1% | 22.6 22% | 23.1 21% | 24.2 17% | 30.9 -6% |
| Load Average * (dB) | 41 | 32.7 20% | 37.8 8% | 28.9 30% | 25.4 38% | 40.4 1% |
| Cyberpunk 2077 ultra * (dB) | 52.8 | 43 19% | ||||
| Load Maximum * (dB) | 52.9 | 56.6 -7% | 40.5 23% | 51.4 3% | 45 15% | 51.9 2% |
| Witcher 3 ultra * (dB) | 50.6 | 40.3 | 51.6 | 48.3 |
* ... mindre är bättre
Temperatur
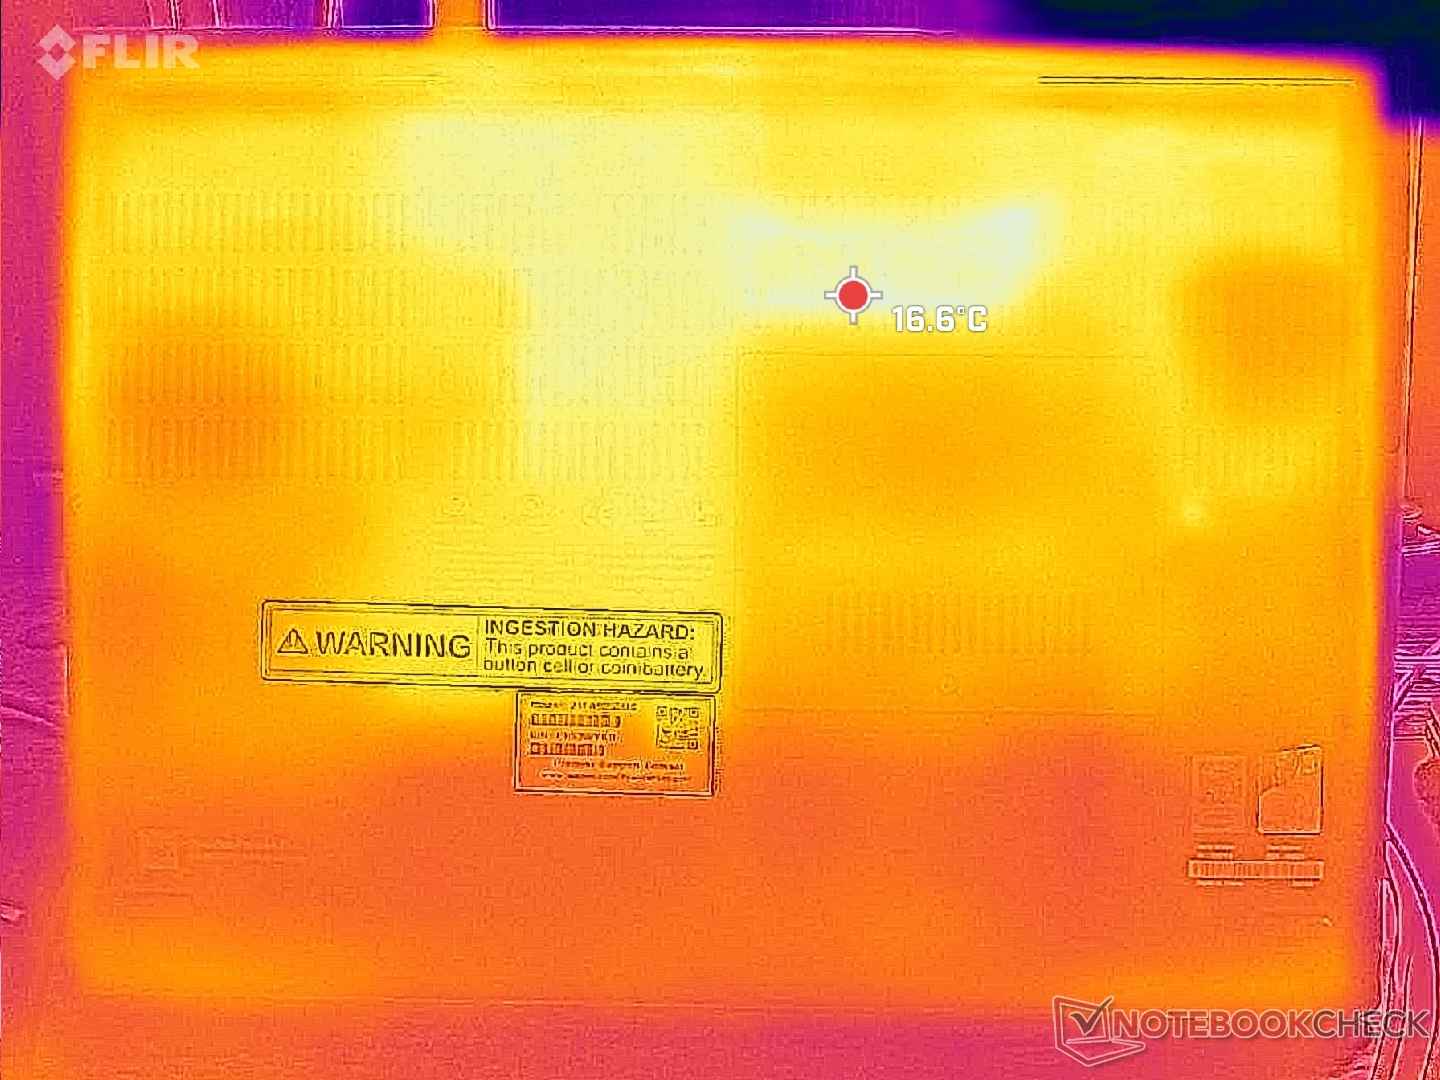
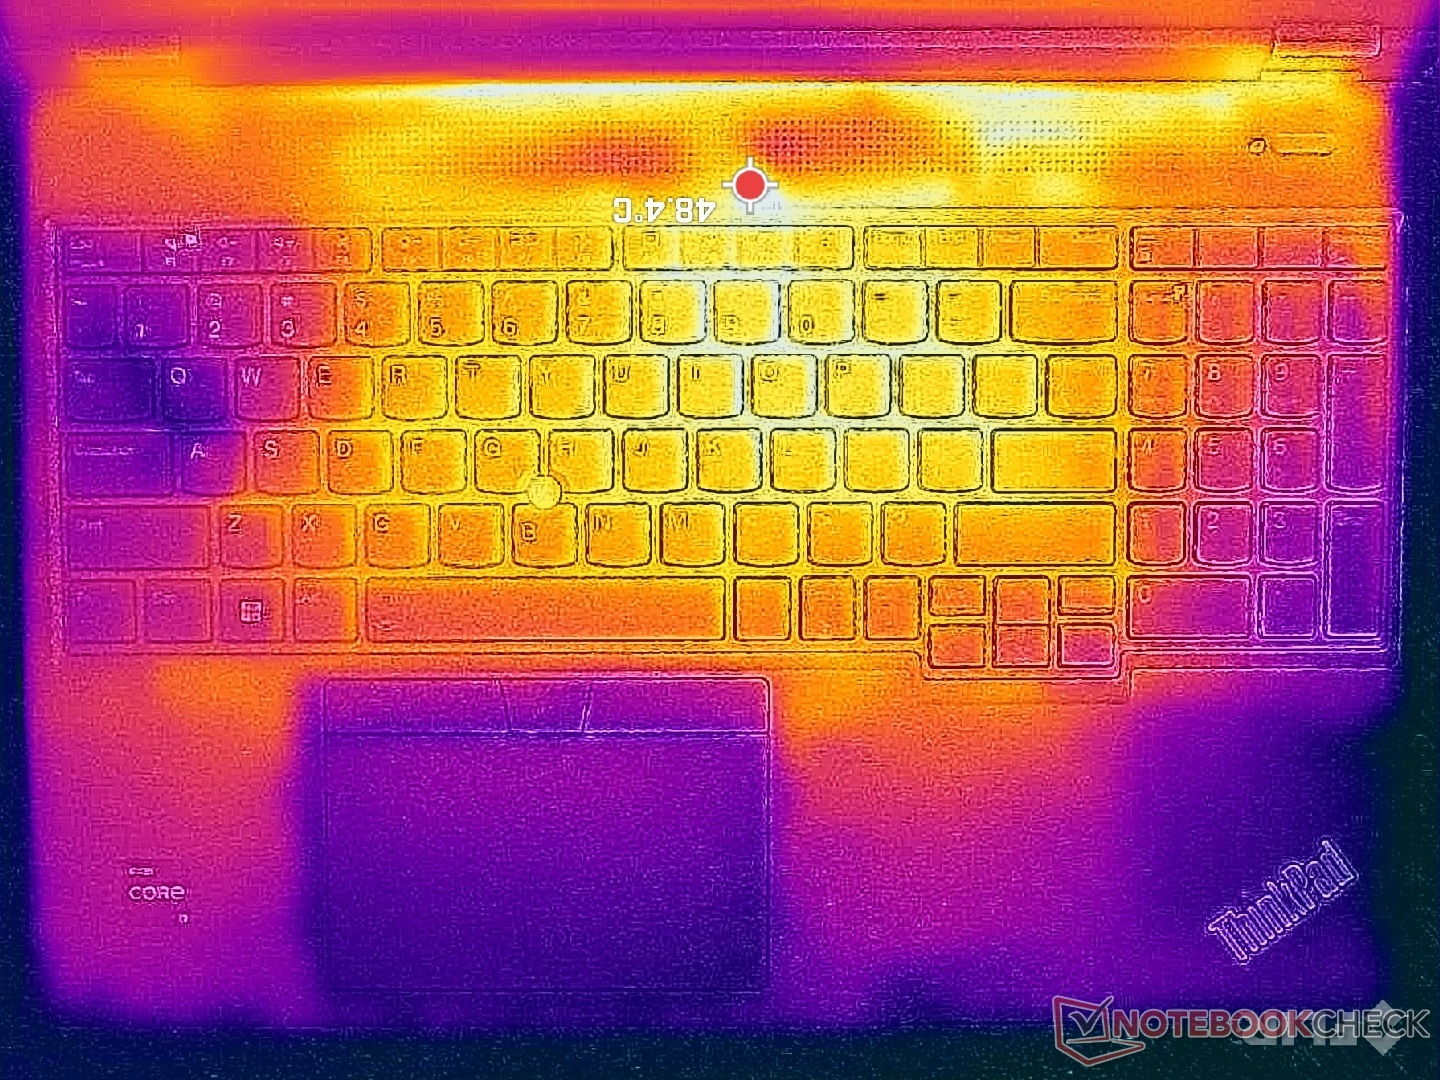
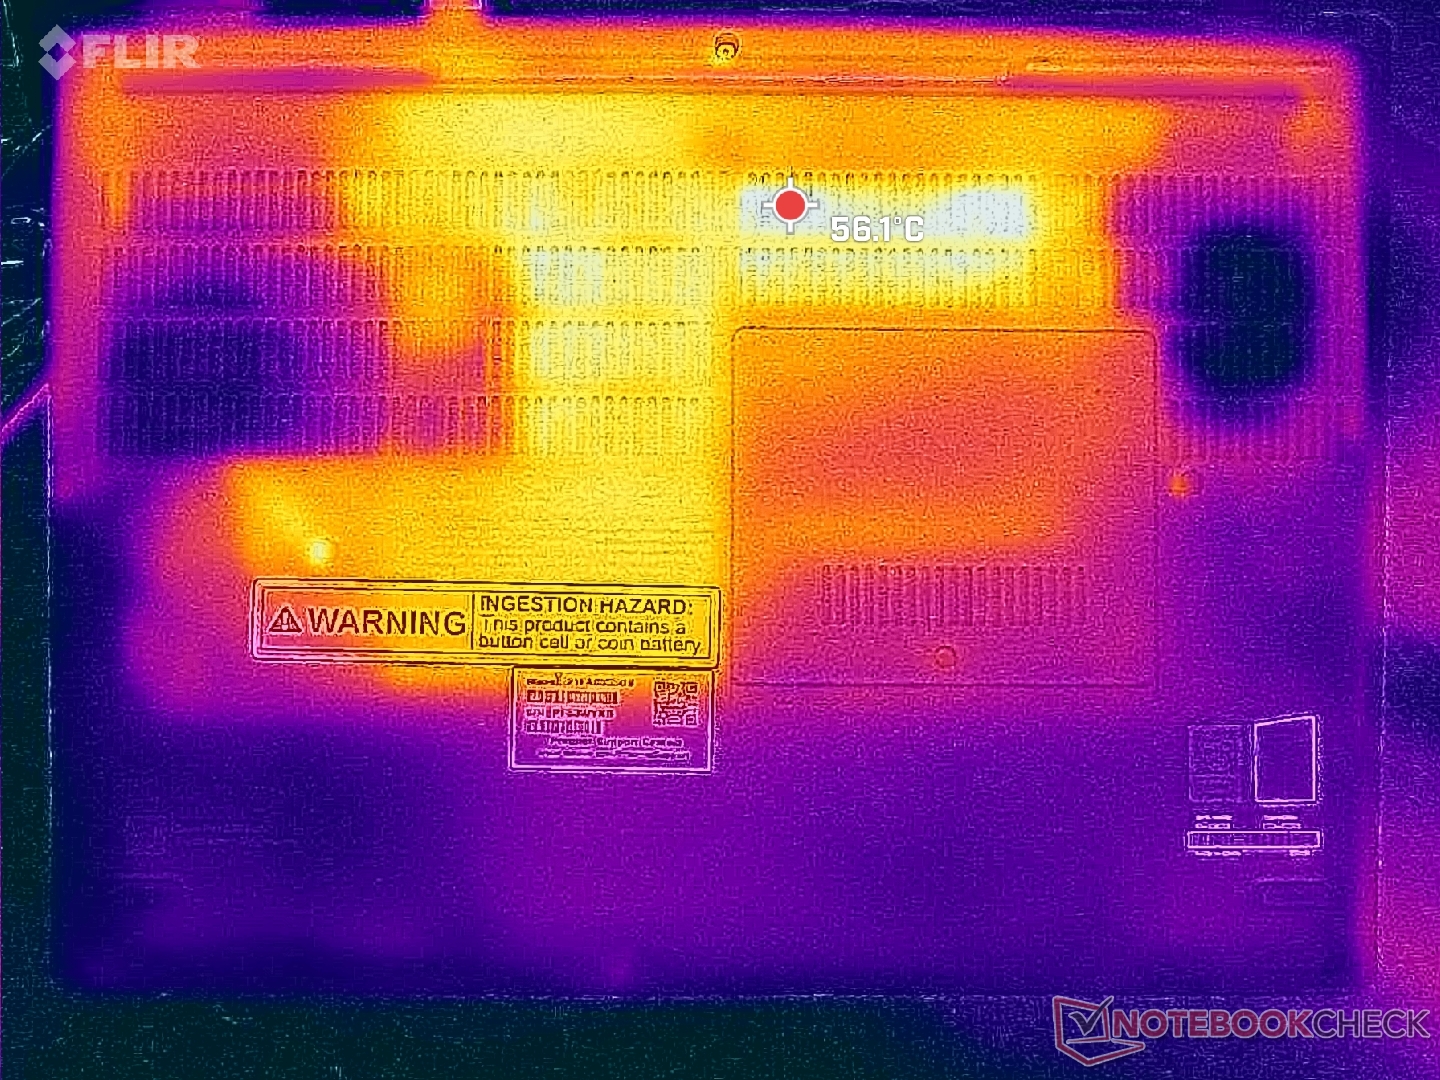
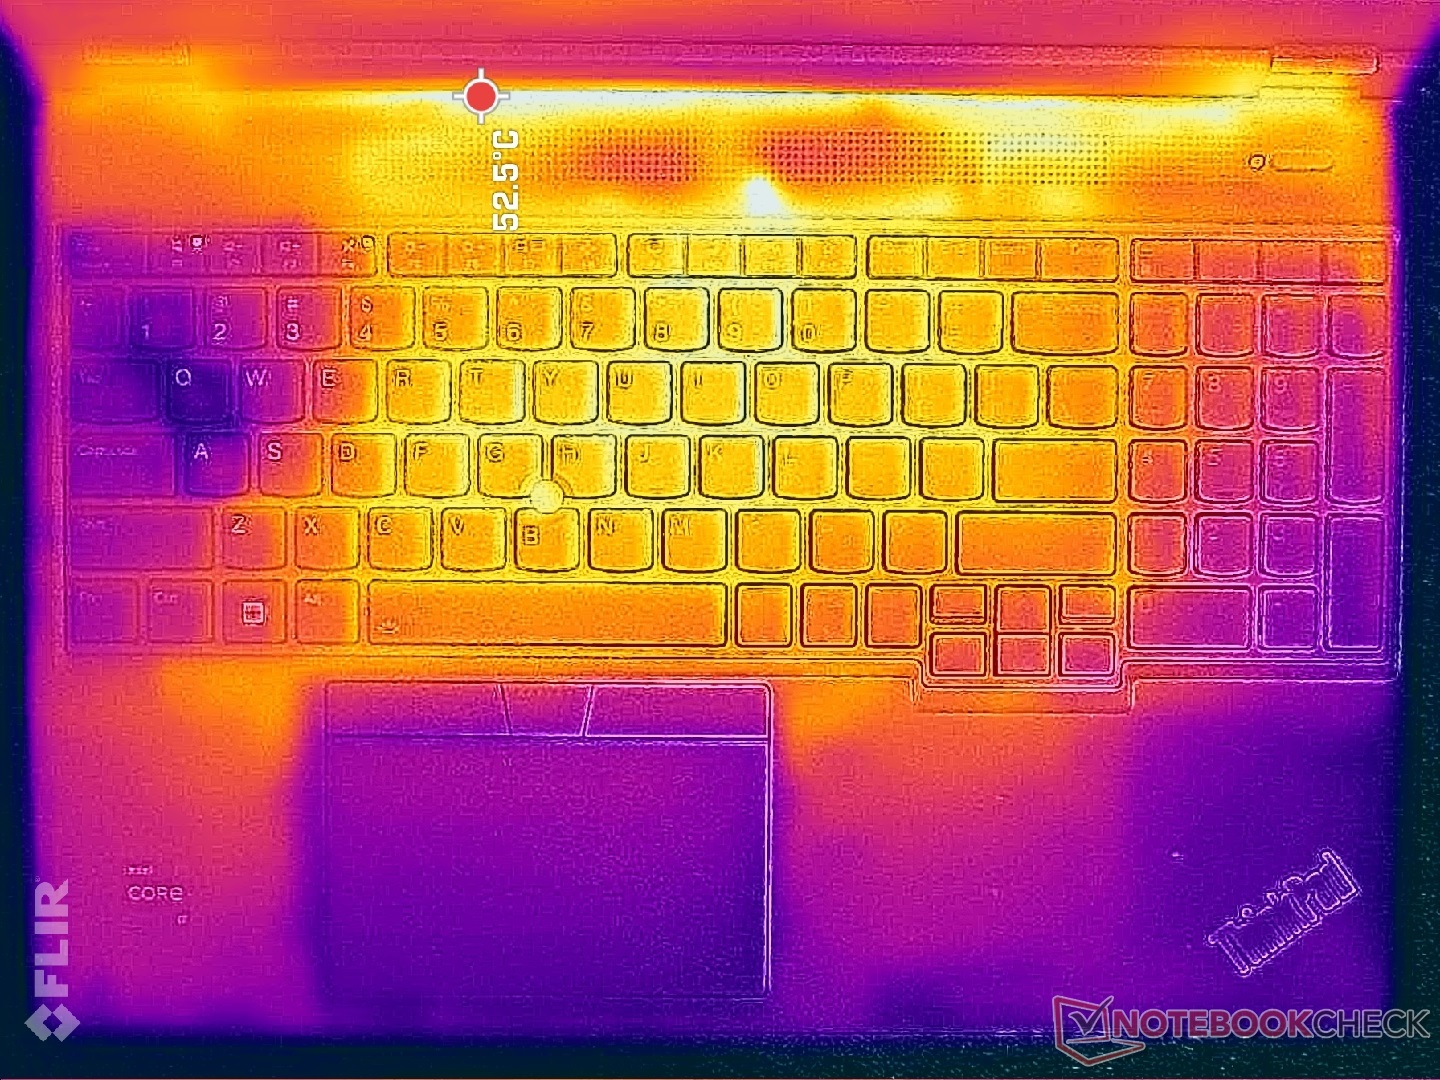
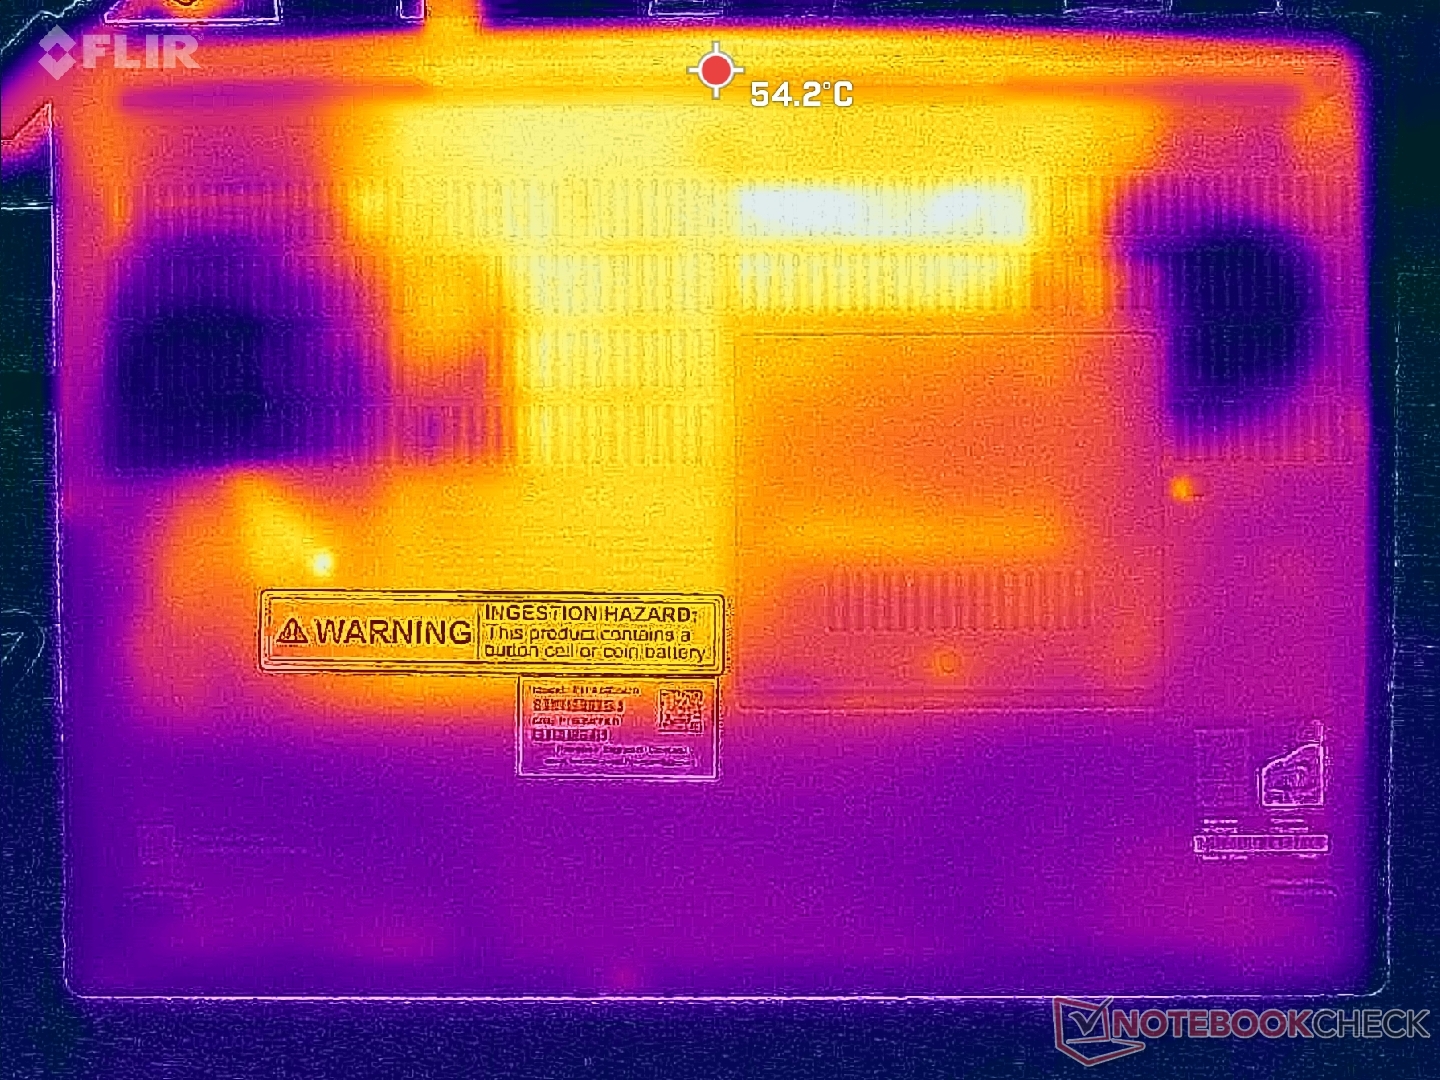
Yttemperaturerna är som väntat varmare än på vår första ThinkPad P16 Gen 2-testenhet på grund av vår mer krävande 130 W RTX 4000 Ada GPU, men skillnaden är större än väntat. Medeltemperaturen över C- och D-locken kan nå 43 C jämfört med endast 32 C på vår mindre utrustade konfiguration när vi kör krävande belastningar.
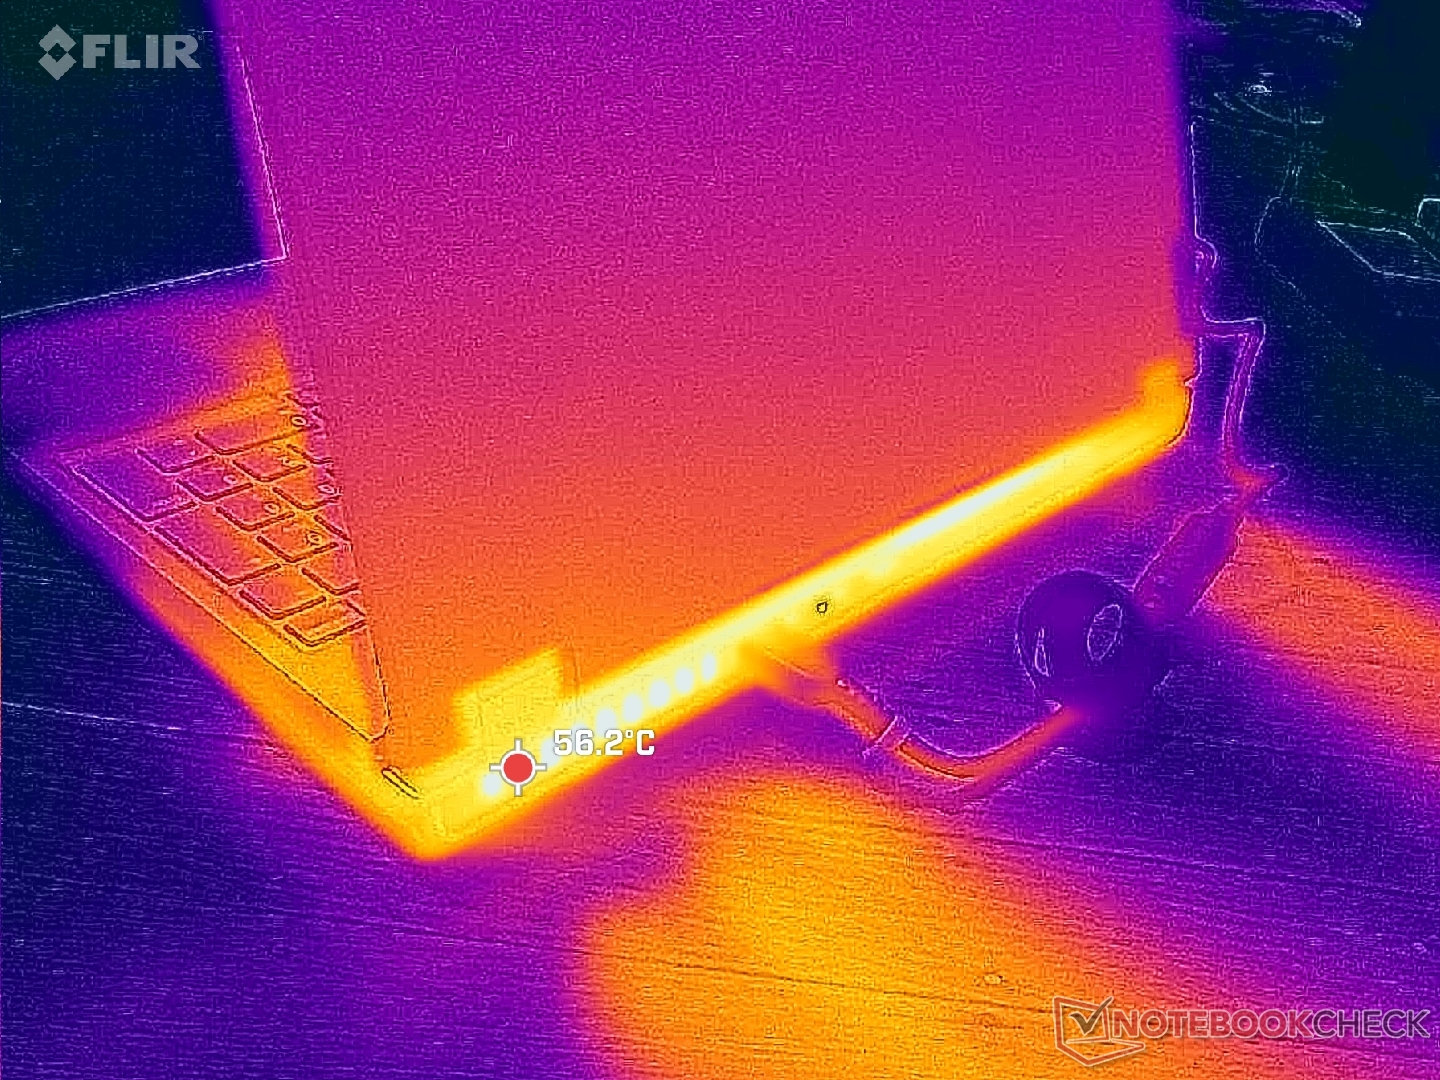
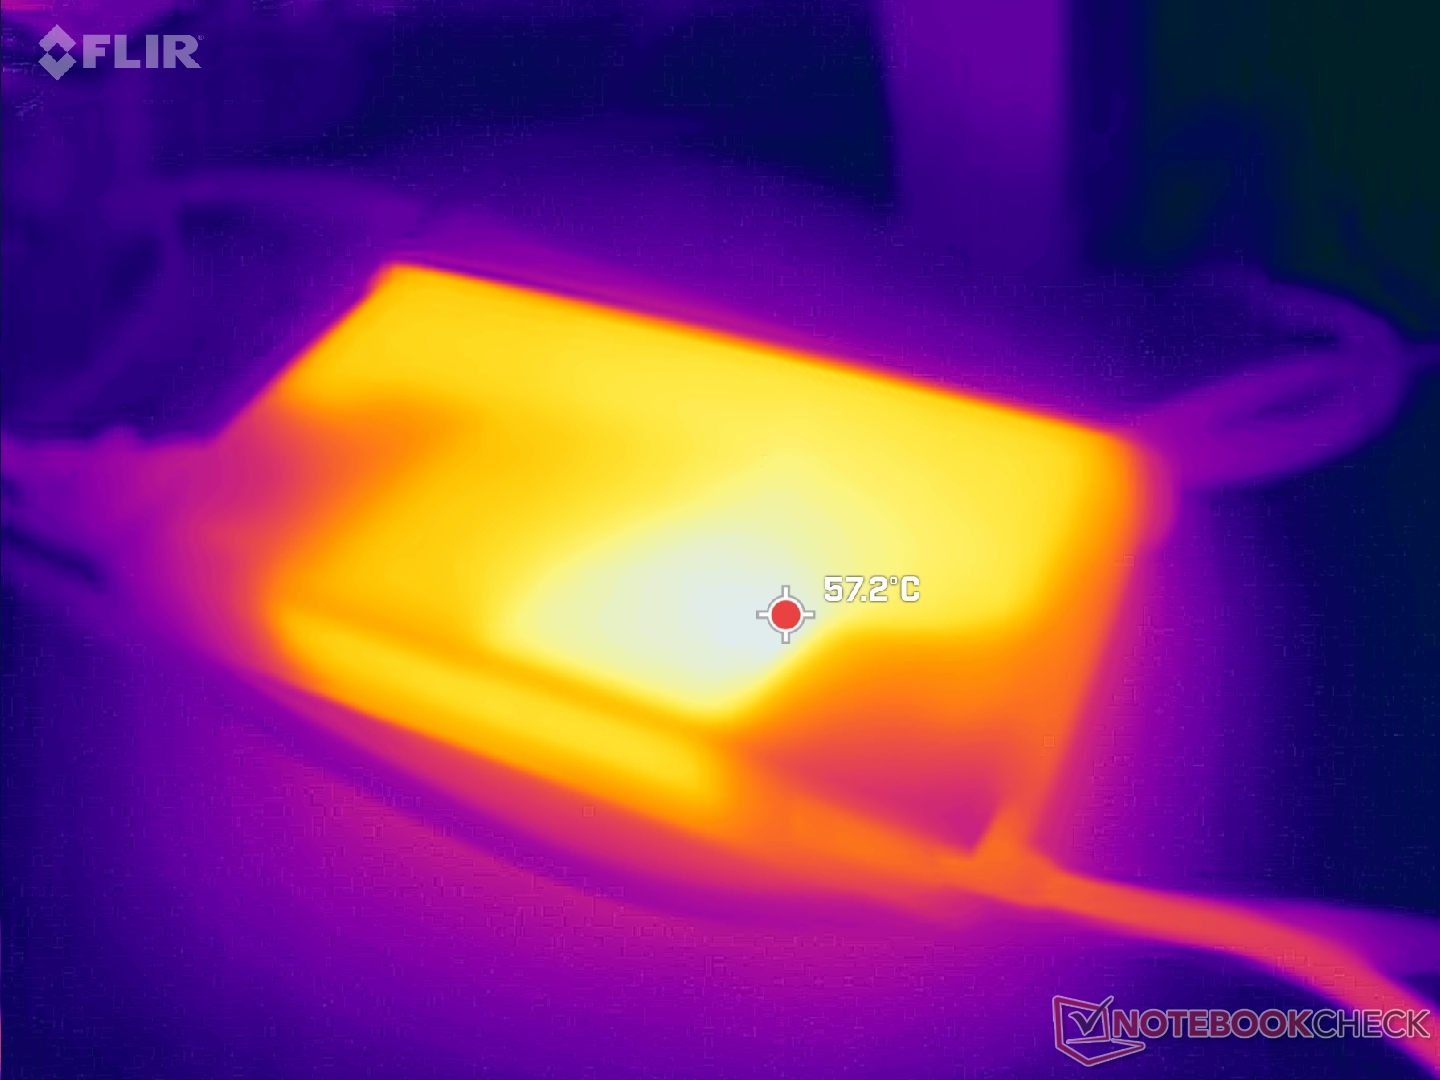
(-) Den maximala temperaturen på ovansidan är 46.6 °C / 116 F, jämfört med genomsnittet av 38.2 °C / 101 F , allt från 22.2 till 69.8 °C för klassen Workstation.
(-) Botten värms upp till maximalt 51 °C / 124 F, jämfört med genomsnittet av 41.1 °C / 106 F
(+) Vid tomgångsbruk är medeltemperaturen för ovansidan 23.9 °C / 75 F, jämfört med enhetsgenomsnittet på 32 °C / ### class_avg_f### F.
(-) 3: The average temperature for the upper side is 39.6 °C / 103 F, compared to the average of 32 °C / 90 F for the class Workstation.
(+) Handledsstöden och pekplattan når maximal hudtemperatur (35.6 °C / 96.1 F) och är därför inte varma.
(-) Medeltemperaturen för handledsstödsområdet på liknande enheter var 27.8 °C / 82 F (-7.8 °C / -14.1 F).
| Lenovo ThinkPad P16 Gen 2 Intel Core i7-14700HX, NVIDIA RTX 4000 Ada Generation Laptop | Lenovo ThinkPad P16 G2 21FA000FGE Intel Core i7-13700HX, NVIDIA RTX 2000 Ada Generation Laptop | Lenovo ThinkPad P16s G2 21K9000CGE AMD Ryzen 7 PRO 7840U, AMD Radeon 780M | Lenovo ThinkPad P16 G1 RTX A5500 Intel Core i9-12950HX, NVIDIA RTX A5500 Laptop GPU | HP ZBook Power 16 G11 A AMD Ryzen 7 8845HS, NVIDIA RTX 2000 Ada Generation Laptop | Dell Precision 5690 Intel Core Ultra 9 185H, NVIDIA RTX 5000 Ada Generation Laptop | |
|---|---|---|---|---|---|---|
| Heat | 3% | -2% | -17% | 6% | -3% | |
| Maximum Upper Side * (°C) | 46.6 | 47.2 -1% | 42.7 8% | 44.8 4% | 40.6 13% | 46.6 -0% |
| Maximum Bottom * (°C) | 51 | 39.5 23% | 47.2 7% | 49.8 2% | 40.6 20% | 33 35% |
| Idle Upper Side * (°C) | 24.8 | 28.1 -13% | 27.8 -12% | 30.6 -23% | 26 -5% | 32.4 -31% |
| Idle Bottom * (°C) | 25.6 | 25.3 1% | 28.4 -11% | 38.6 -51% | 26.6 -4% | 29.4 -15% |
* ... mindre är bättre
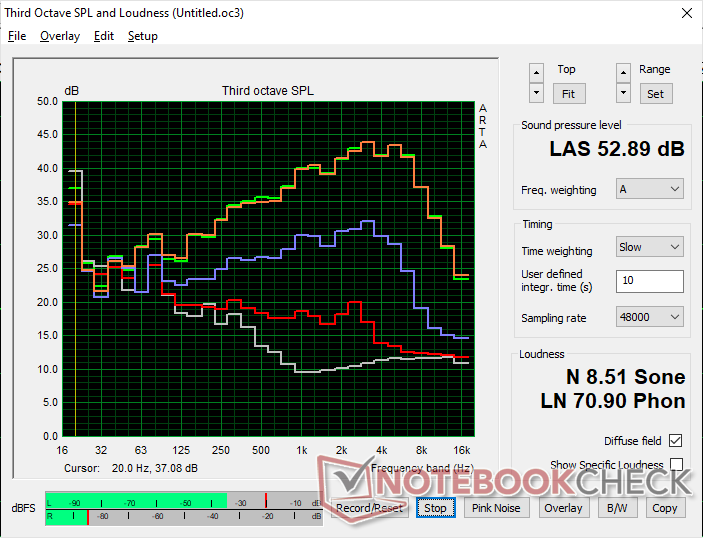
Högtalare
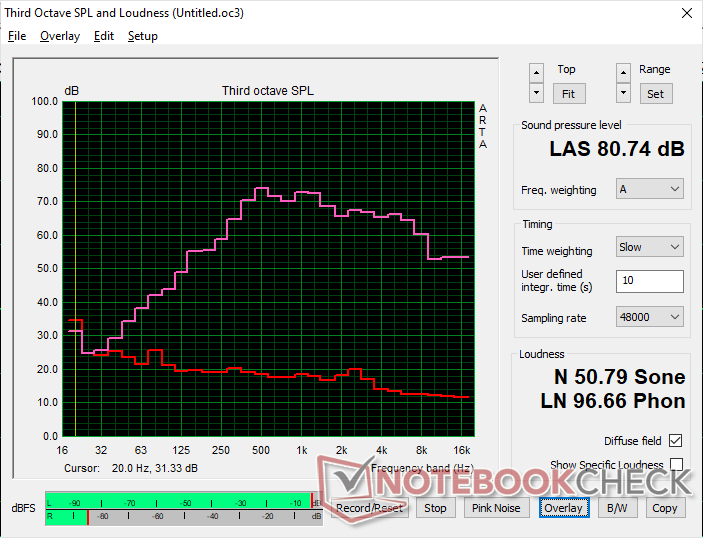
Lenovo ThinkPad P16 Gen 2 ljudanalys
(±) | högtalarljudstyrkan är genomsnittlig men bra (80.7 dB)
Bas 100 - 315 Hz
(±) | reducerad bas - i genomsnitt 10.8% lägre än medianen
(±) | linjäriteten för basen är genomsnittlig (8% delta till föregående frekvens)
Mellan 400 - 2000 Hz
(±) | högre mellan - i genomsnitt 5.4% högre än median
(+) | mids är linjära (6.2% delta till föregående frekvens)
Högsta 2 - 16 kHz
(+) | balanserade toppar - endast 3.3% från medianen
(+) | toppar är linjära (5.5% delta till föregående frekvens)
Totalt 100 - 16 000 Hz
(±) | linjäriteten för det totala ljudet är genomsnittlig (15.6% skillnad mot median)
Jämfört med samma klass
» 35% av alla testade enheter i den här klassen var bättre, 11% liknande, 54% sämre
» Den bästa hade ett delta på 7%, genomsnittet var 17%, sämst var 35%
Jämfört med alla testade enheter
» 23% av alla testade enheter var bättre, 5% liknande, 72% sämre
» Den bästa hade ett delta på 4%, genomsnittet var 24%, sämst var 134%
Apple MacBook Pro 16 2021 M1 Pro ljudanalys
(+) | högtalare kan spela relativt högt (84.7 dB)
Bas 100 - 315 Hz
(+) | bra bas - bara 3.8% från medianen
(+) | basen är linjär (5.2% delta till föregående frekvens)
Mellan 400 - 2000 Hz
(+) | balanserad mellan - endast 1.3% från medianen
(+) | mids är linjära (2.1% delta till föregående frekvens)
Högsta 2 - 16 kHz
(+) | balanserade toppar - endast 1.9% från medianen
(+) | toppar är linjära (2.7% delta till föregående frekvens)
Totalt 100 - 16 000 Hz
(+) | det totala ljudet är linjärt (4.6% skillnad mot median)
Jämfört med samma klass
» 0% av alla testade enheter i den här klassen var bättre, 0% liknande, 100% sämre
» Den bästa hade ett delta på 5%, genomsnittet var 17%, sämst var 45%
Jämfört med alla testade enheter
» 0% av alla testade enheter var bättre, 0% liknande, 100% sämre
» Den bästa hade ett delta på 4%, genomsnittet var 24%, sämst var 134%
Energiförvaltning
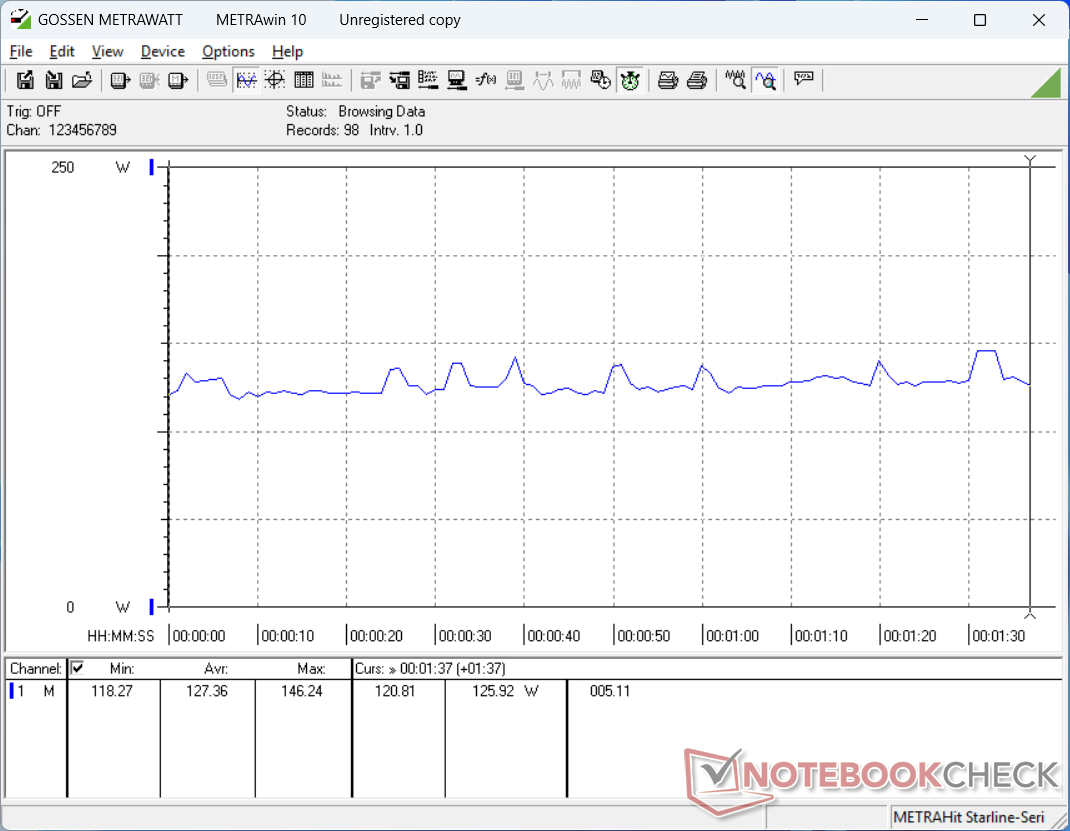
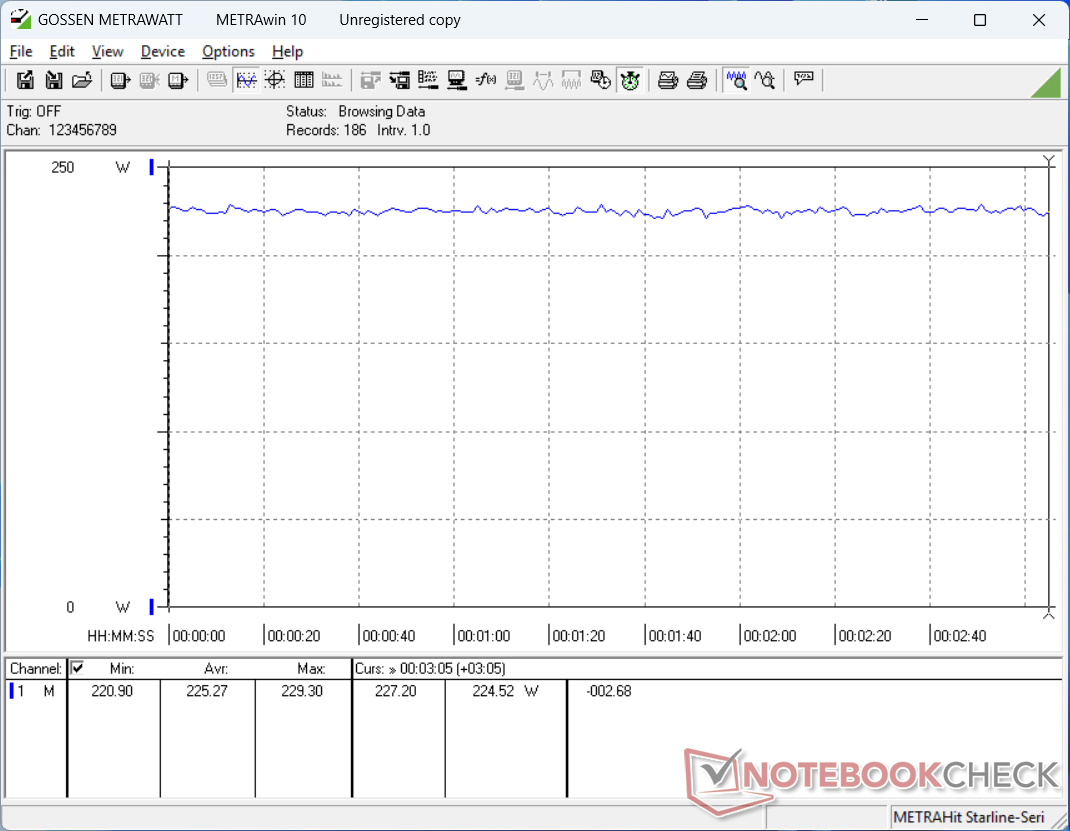
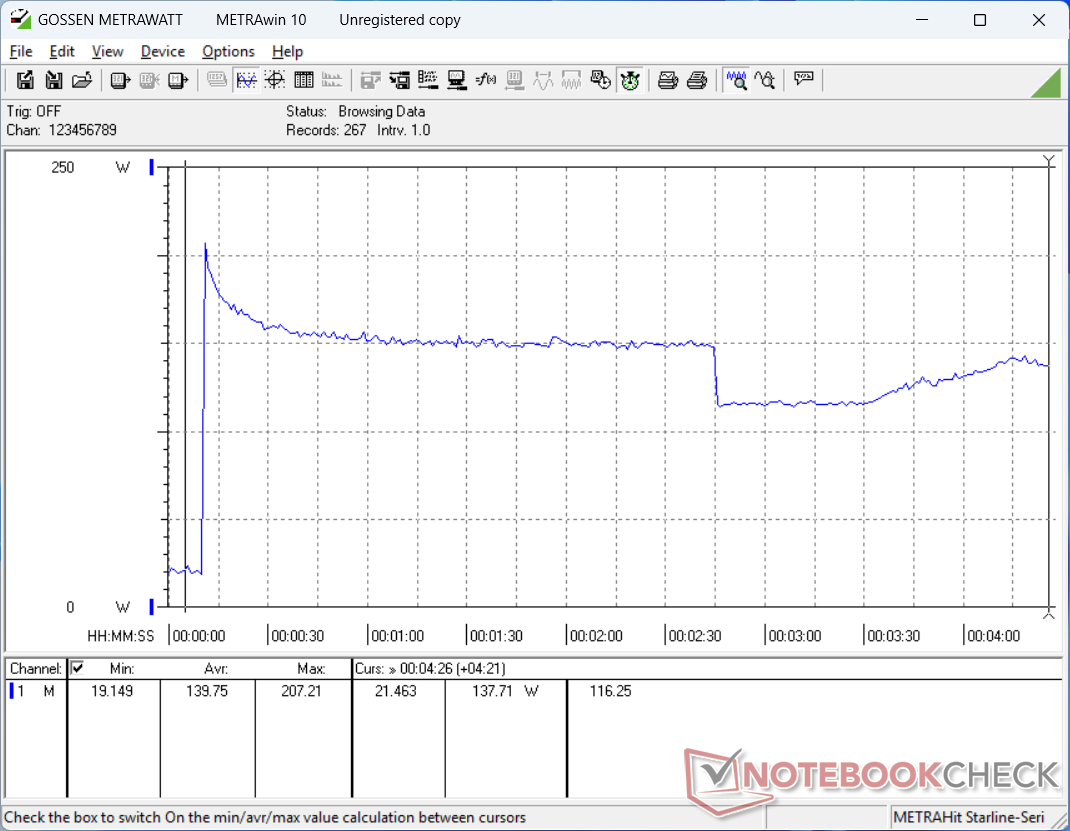
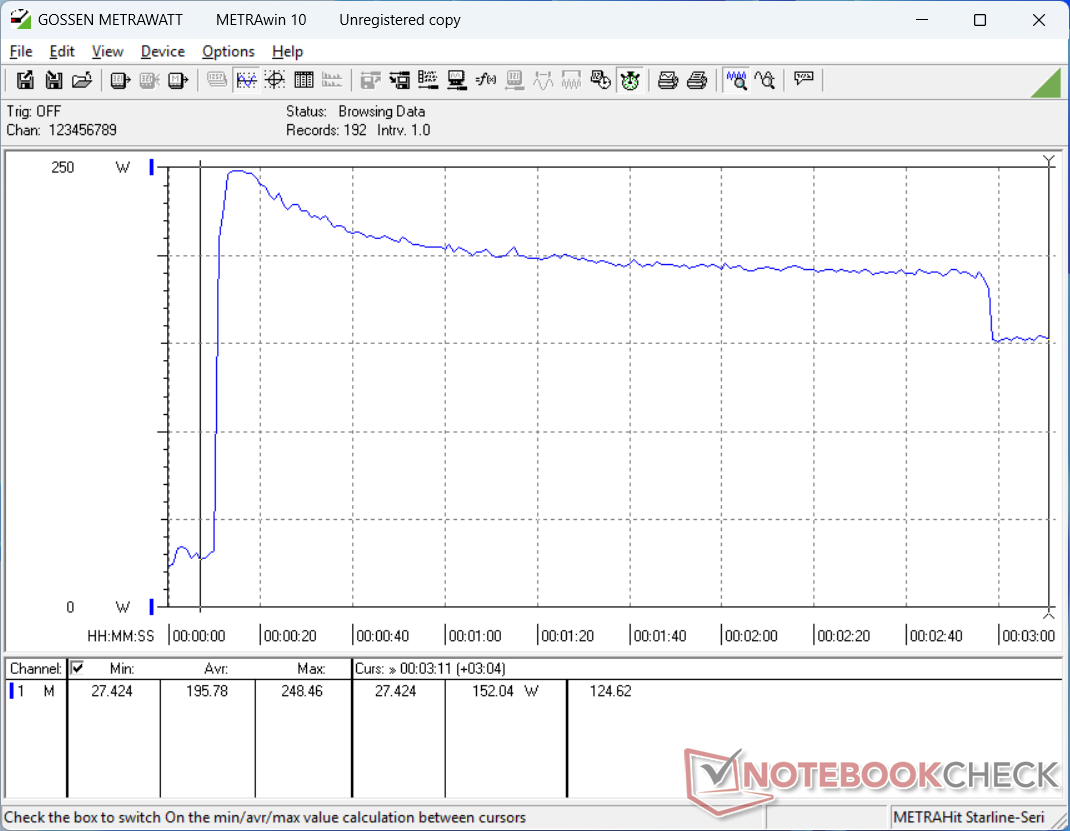
Strömförbrukning
Tomgångskörning på skrivbordet kan kräva så mycket som 25 W jämfört med endast 16 W på den mindre utrustade RTX 2000-konfigurationen. När du kör krävande belastningar som spel kan deltaet vara så stort som 80 W för en 55-procentig ökning av förbrukningen. Se till att du använder den mer kapabla 230 W AC-adaptern för att få ut mesta möjliga av RTX 4000-konfigurationen.
| Av/Standby | |
| Låg belastning | |
| Hög belastning |
|
Förklaring:
min: | |
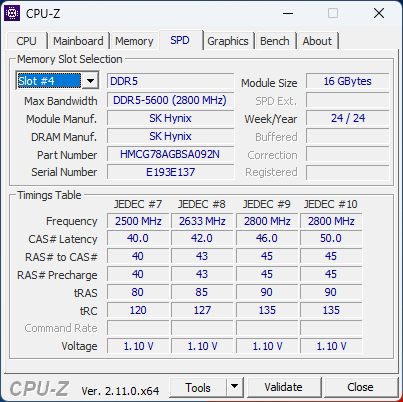
| Lenovo ThinkPad P16 Gen 2 i7-14700HX, RTX 4000 Ada Generation Laptop, SK hynix PC801 HFS001TEJ9X162N, IPS, 2560x1600, 16" | Lenovo ThinkPad P16 G2 21FA000FGE i7-13700HX, RTX 2000 Ada Generation Laptop, SK hynix PC801 HFS001TEJ9X162N, IPS LED, 2560x1600, 16" | Lenovo ThinkPad P16s G2 21K9000CGE R7 PRO 7840U, Radeon 780M, SK hynix PC801 HFS001TEJ9X162N, OLED, 3840x2400, 16" | Lenovo ThinkPad P16 G1 RTX A5500 i9-12950HX, RTX A5500 Laptop GPU, WDC PC SN810 2TB, IPS, 3840x2400, 16" | HP ZBook Power 16 G11 A R7 8845HS, RTX 2000 Ada Generation Laptop, Samsung PM9A1 MZVL22T0HBLB, IPS, 2560x1600, 16" | Dell Precision 5690 Ultra 9 185H, RTX 5000 Ada Generation Laptop, 2x Samsung PM9A1 1TB (RAID 0), OLED, 3840x2400, 16" | |
|---|---|---|---|---|---|---|
| Power Consumption | 7% | 55% | -27% | 47% | 8% | |
| Idle Minimum * (Watt) | 7.9 | 9.3 -18% | 6.1 23% | 7.5 5% | 4.6 42% | 7.9 -0% |
| Idle Average * (Watt) | 13.1 | 14.1 -8% | 6.5 50% | 20.1 -53% | 10 24% | 12 8% |
| Idle Maximum * (Watt) | 24.2 | 15.5 36% | 7 71% | 40 -65% | 10.6 56% | 28.6 -18% |
| Load Average * (Watt) | 127.4 | 133.6 -5% | 56.6 56% | 137 -8% | 60.9 52% | 98.8 22% |
| Cyberpunk 2077 ultra external monitor * (Watt) | 219 | 92.8 58% | ||||
| Cyberpunk 2077 ultra * (Watt) | 225 | 96.8 57% | ||||
| Load Maximum * (Watt) | 248.5 | 179.6 28% | 68.3 73% | 285.9 -15% | 154.8 38% | 174.8 30% |
| Witcher 3 ultra * (Watt) | 144.9 | 61.2 | 208 | 144.5 |
* ... mindre är bättre
Power Consumption Cyberpunk / Stress Test
Power Consumption external Monitor
Batteritid
Körtiderna är sämre än vad vi registrerade på den mindre ThinkPad P16 Gen 2-konfigurationen med mer än hälften, även när den var inställd på balanserat läge och 150 nit ljusstyrka. Skillnaden kan till största delen tillskrivas avsaknaden av Advanced Optimus-stöd på vår RTX 4000 Ada-enhet och därför är den diskreta GPU:n aldrig helt inaktiverad.
Laddning från tom till full kapacitet tar cirka 130 minuter även med Lenovo Quick Charge aktiverad.
| Lenovo ThinkPad P16 Gen 2 i7-14700HX, RTX 4000 Ada Generation Laptop, 94 Wh | Lenovo ThinkPad P16 G2 21FA000FGE i7-13700HX, RTX 2000 Ada Generation Laptop, 94 Wh | Lenovo ThinkPad P16s G2 21K9000CGE R7 PRO 7840U, Radeon 780M, 84 Wh | Lenovo ThinkPad P16 G1 RTX A5500 i9-12950HX, RTX A5500 Laptop GPU, 94 Wh | HP ZBook Power 16 G11 A R7 8845HS, RTX 2000 Ada Generation Laptop, 83 Wh | Dell Precision 5690 Ultra 9 185H, RTX 5000 Ada Generation Laptop, 98 Wh | |
|---|---|---|---|---|---|---|
| Batteridrifttid | 244% | 324% | 132% | 288% | 268% | |
| WiFi v1.3 (h) | 2.5 | 8.6 244% | 10.6 324% | 5.8 132% | 9.7 288% | 9.2 268% |
| H.264 (h) | 13.3 | |||||
| Load (h) | 1.5 | 1.7 | ||||
| Reader / Idle (h) | 26.1 |
Lenovo ThinkPad P16 Gen 2
- 10/25/2024 v8
Allen Ngo
 Total Sustainability Score:
 Genomskinlighet
Valet av enheter som ska granskas görs av vår redaktion. Testprovet gavs till författaren som ett lån av tillverkaren eller återförsäljaren för denna recension. Långivaren hade inget inflytande på denna recension och inte heller fick tillverkaren en kopia av denna recension innan publiceringen. Det fanns ingen skyldighet att publicera denna recension. Som ett oberoende medieföretag är Notebookcheck inte föremål för auktoritet från tillverkare, återförsäljare eller förlag.
This is how Notebookcheck is testingEvery year, Notebookcheck independently reviews hundreds of laptops and smartphones using standardized procedures to ensure that all results are comparable. We have continuously developed our test methods for around 20 years and set industry standards in the process. In our test labs, high-quality measuring equipment is utilized by experienced technicians and editors. These tests involve a multi-stage validation process. Our complex rating system is based on hundreds of well-founded measurements and benchmarks, which maintains objectivity.

