

HP ZBook Power 16 G11 A recension: Kraftfull arbetsstation med AMD Zen 4

ZBook Power 16 G11 efterträder den äldre ZBook Power 15 G10 med både nya interna processorer och nya externa förändringar. Som namnet antyder moderniserar ZBook Power 16 G11 serien genom att släppa den gamla 15,6-tums formfaktorn för en 16-tums design. Den ligger mellan den enklare ZBook Firefly och den mer avancerade ZBook Fury när det gäller prestanda. Användare kan konfigurera med antingen Meteor Lake Intel Core Ultra-processorer eller AMD Ryzen Zen 4-processorer och Nvidia RTX-grafik.
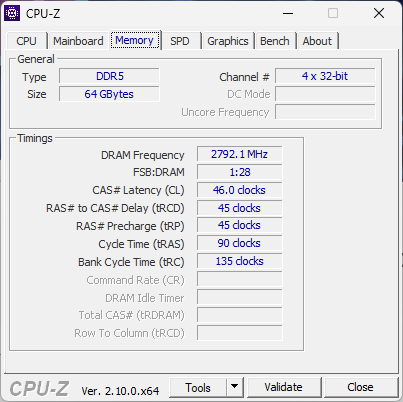
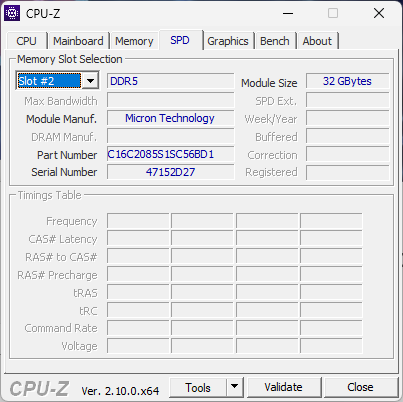
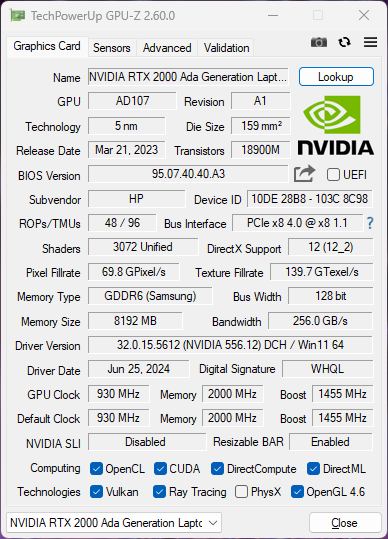
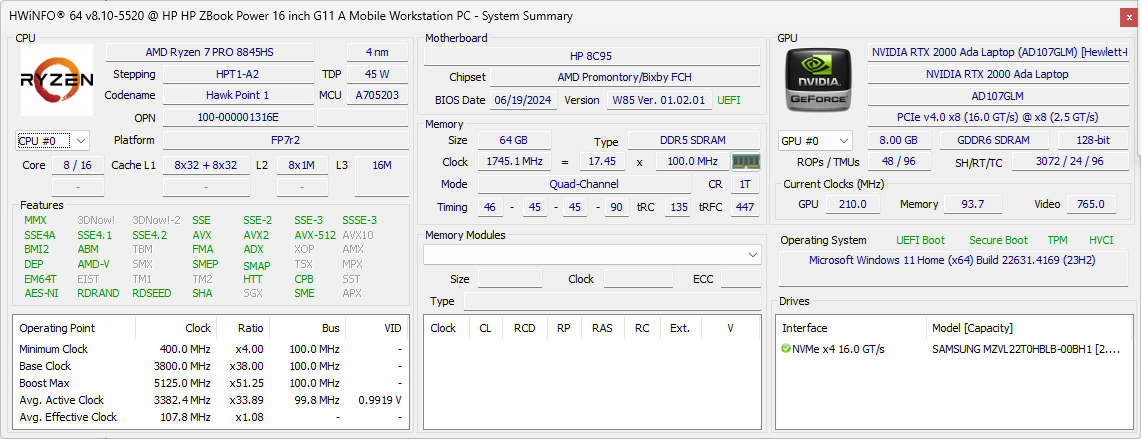
Vår enhet i recensionen är en avancerad AMD-konfiguration (ZBook Power 16 G11 A) med Ryzen 7 8845HS CPU, RTX 2000 Ada GPU och 120Hz 2560 x 1600p IPS-skärm för cirka $2100. Alternativen är mycket breda och sträcker sig från Ryzen 5 8645HS upp till Ryzen 9 8945HS med 1200p-skärm och RTX 1000-, RTX 2000- eller RTX 3000-grafik. Användare kan också välja att inte ha någon diskret grafik alls.
Konkurrenter i detta utrymme inkluderar andra 16-tums arbetsstationer som Dell Precision 5690, MSI CreatorPro Z16Peller Lenovo ThinkPad P16s G2.
Fler HP-recensioner:
Potentiella konkurrenter i jämförelse
Gradering | Version | Datum | Modell | Vikt | Höjd | Storlek | Upplösning | Pris |
|---|---|---|---|---|---|---|---|---|
| 85.4 % | v8 | 10/2024 | HP ZBook Power 16 G11 A R7 8845HS, NVIDIA RTX 2000 Ada Generation Laptop GPU | 2.2 kg | 22.9 mm | 16.00" | 2560x1600 | |
| 88.9 % v7 (old) | v7 (old) | 12/2023 | HP ZBook Power 15 G10 R7 PRO 7840HS, NVIDIA RTX 2000 Ada Generation Laptop GPU | 2 kg | 22.9 mm | 15.60" | 2560x1440 | |
| 85.9 % | v8 | 08/2024 | HP ZBook Fury 16 G11 i9-14900HX, NVIDIA RTX 3500 Ada Generation Laptop GPU | 2.6 kg | 28.5 mm | 16.00" | 3840x2400 | |
| 83.5 % | v8 | 10/2024 | Lenovo ThinkPad P1 Gen 7 21KV001SGE Ultra 7 155H, NVIDIA GeForce RTX 4060 Laptop GPU | 2 kg | 20.5 mm | 16.00" | 2560x1600 | |
| 88.6 % v7 (old) | v7 (old) | 01/2024 | Lenovo ThinkPad P16s G2 21K9000CGE R7 PRO 7840U, Radeon 780M | 1.8 kg | 24.4 mm | 16.00" | 3840x2400 | |
| 88.3 % v7 (old) | v7 (old) | 05/2024 | Dell Precision 5690 Ultra 9 185H, NVIDIA RTX 5000 Ada Generation Laptop GPU | 2.3 kg | 22.17 mm | 16.00" | 3840x2400 |
Obs: Vi har nyligen uppdaterat vårt betygssystem och resultaten från version 8 är inte jämförbara med resultaten från version 7. Mer information finns tillgänglig här .
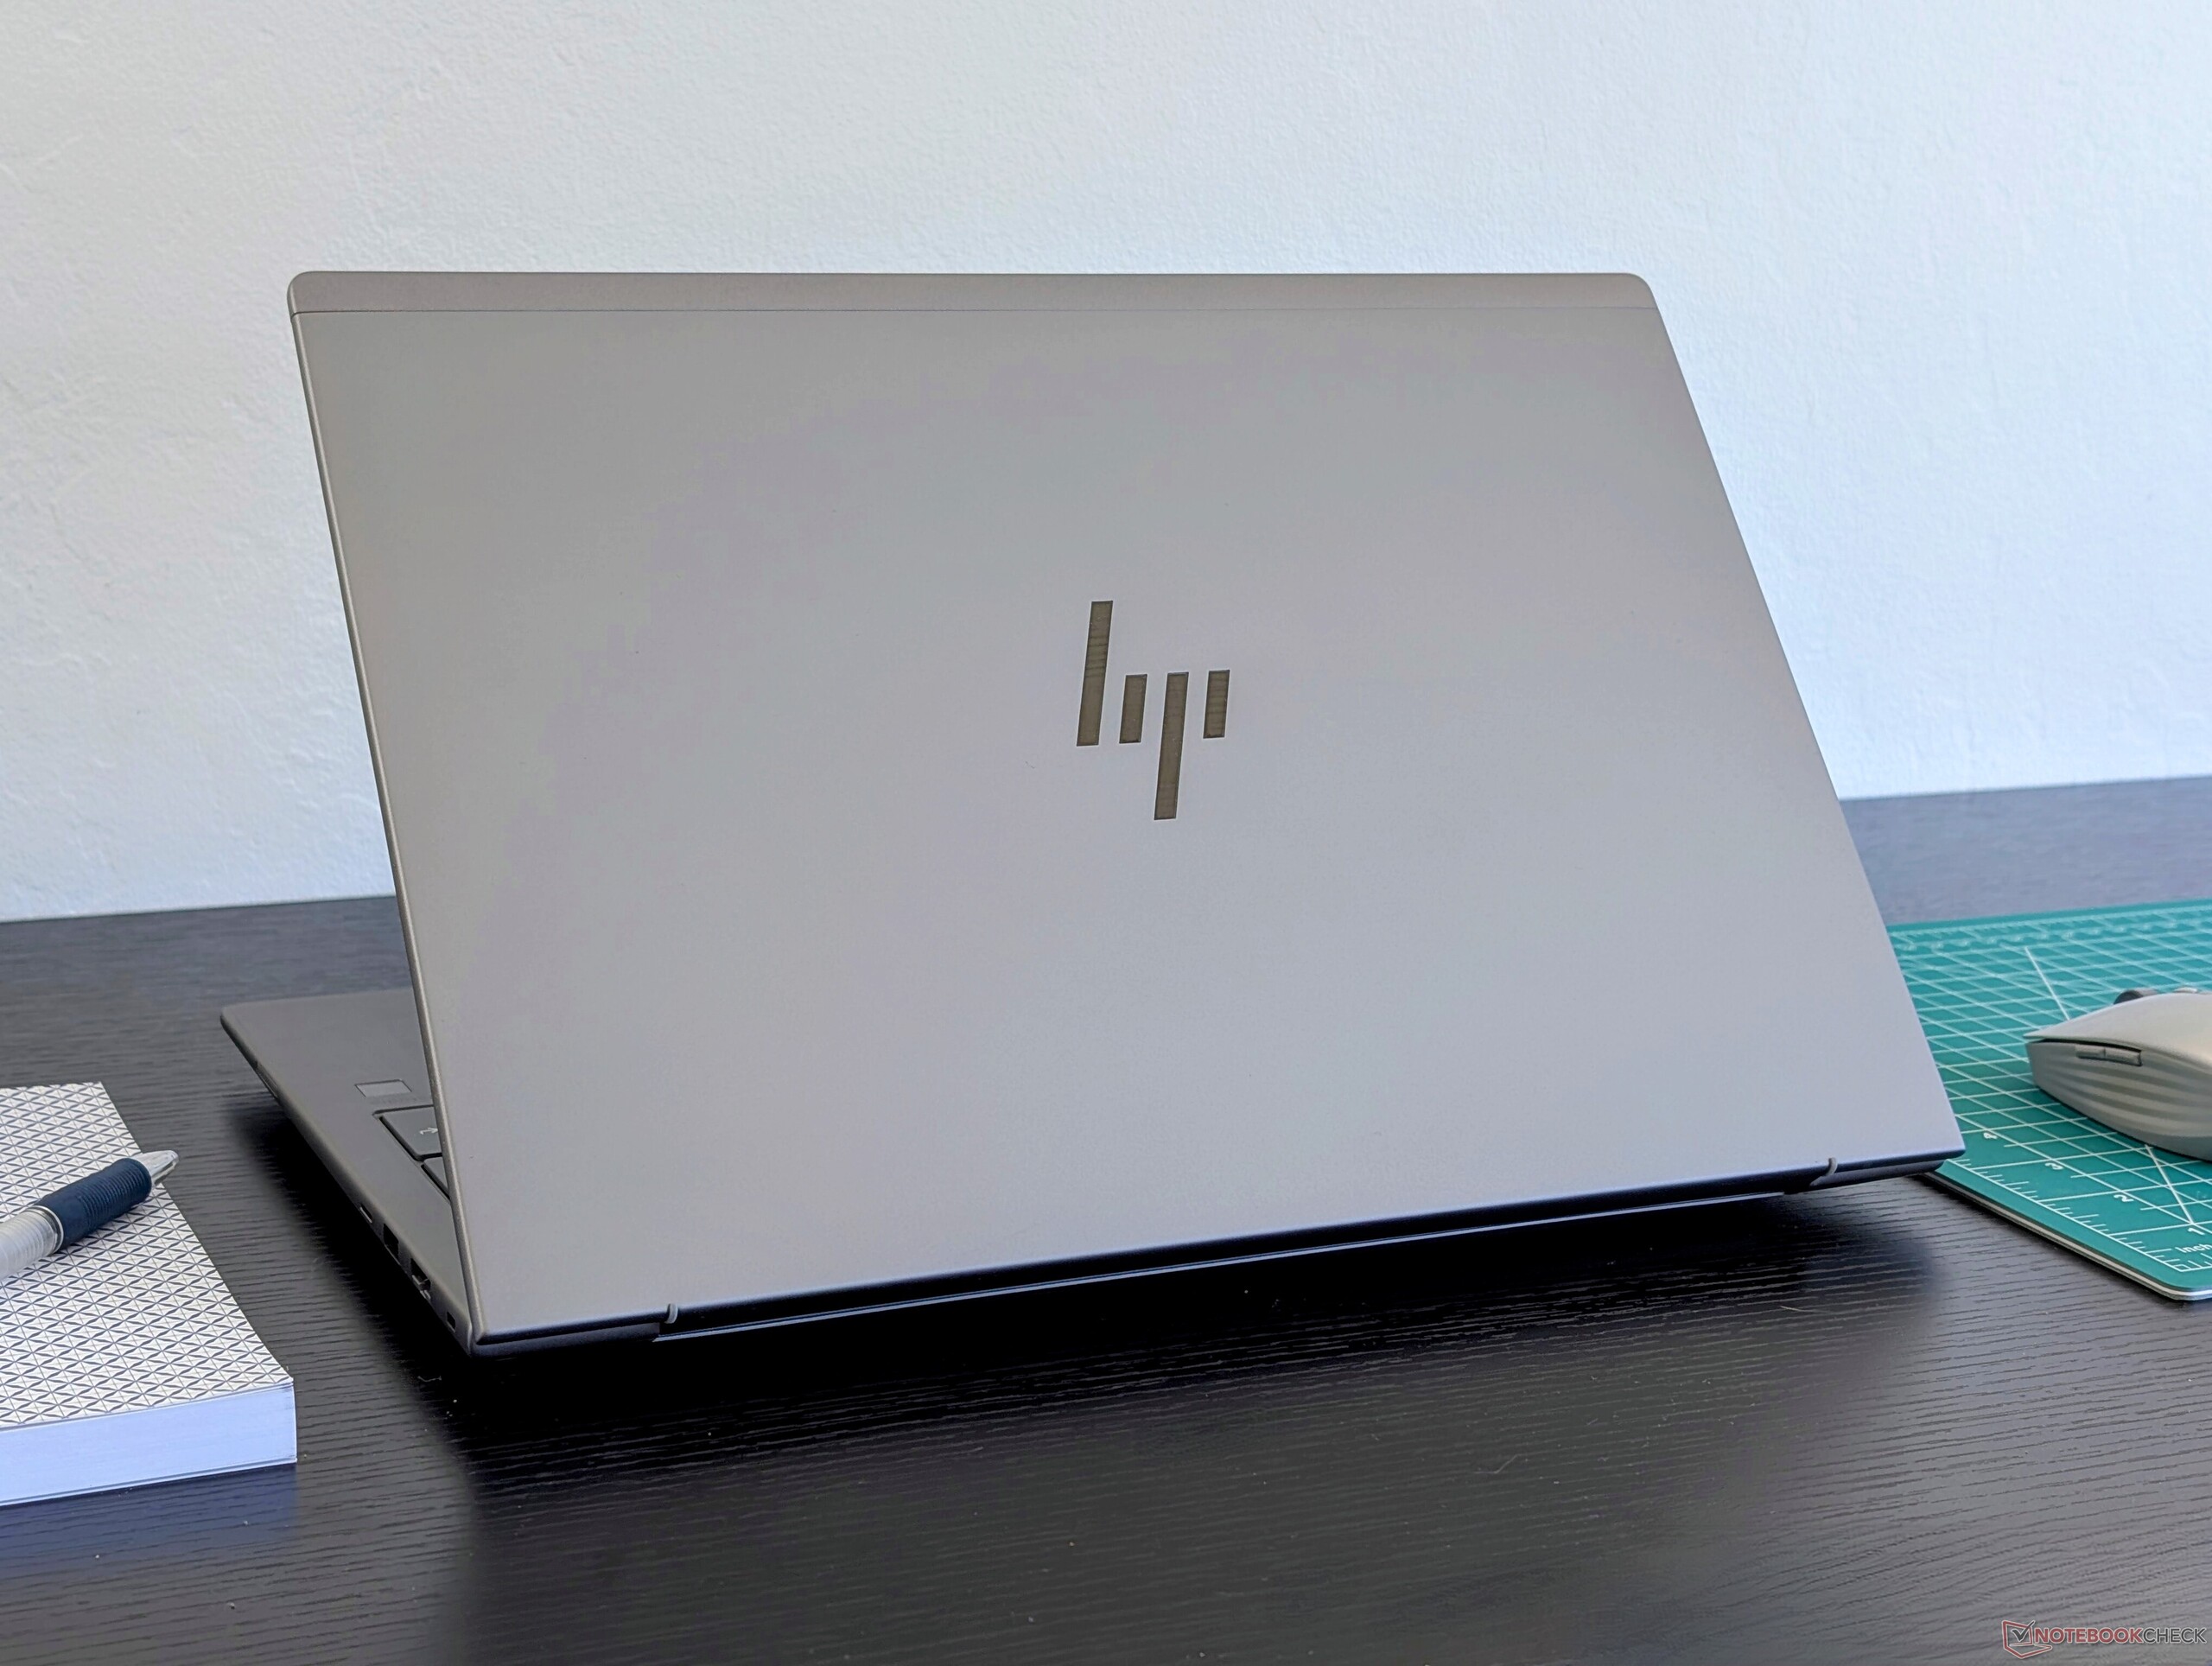
Fodral - MIL-STD 810-certifierat
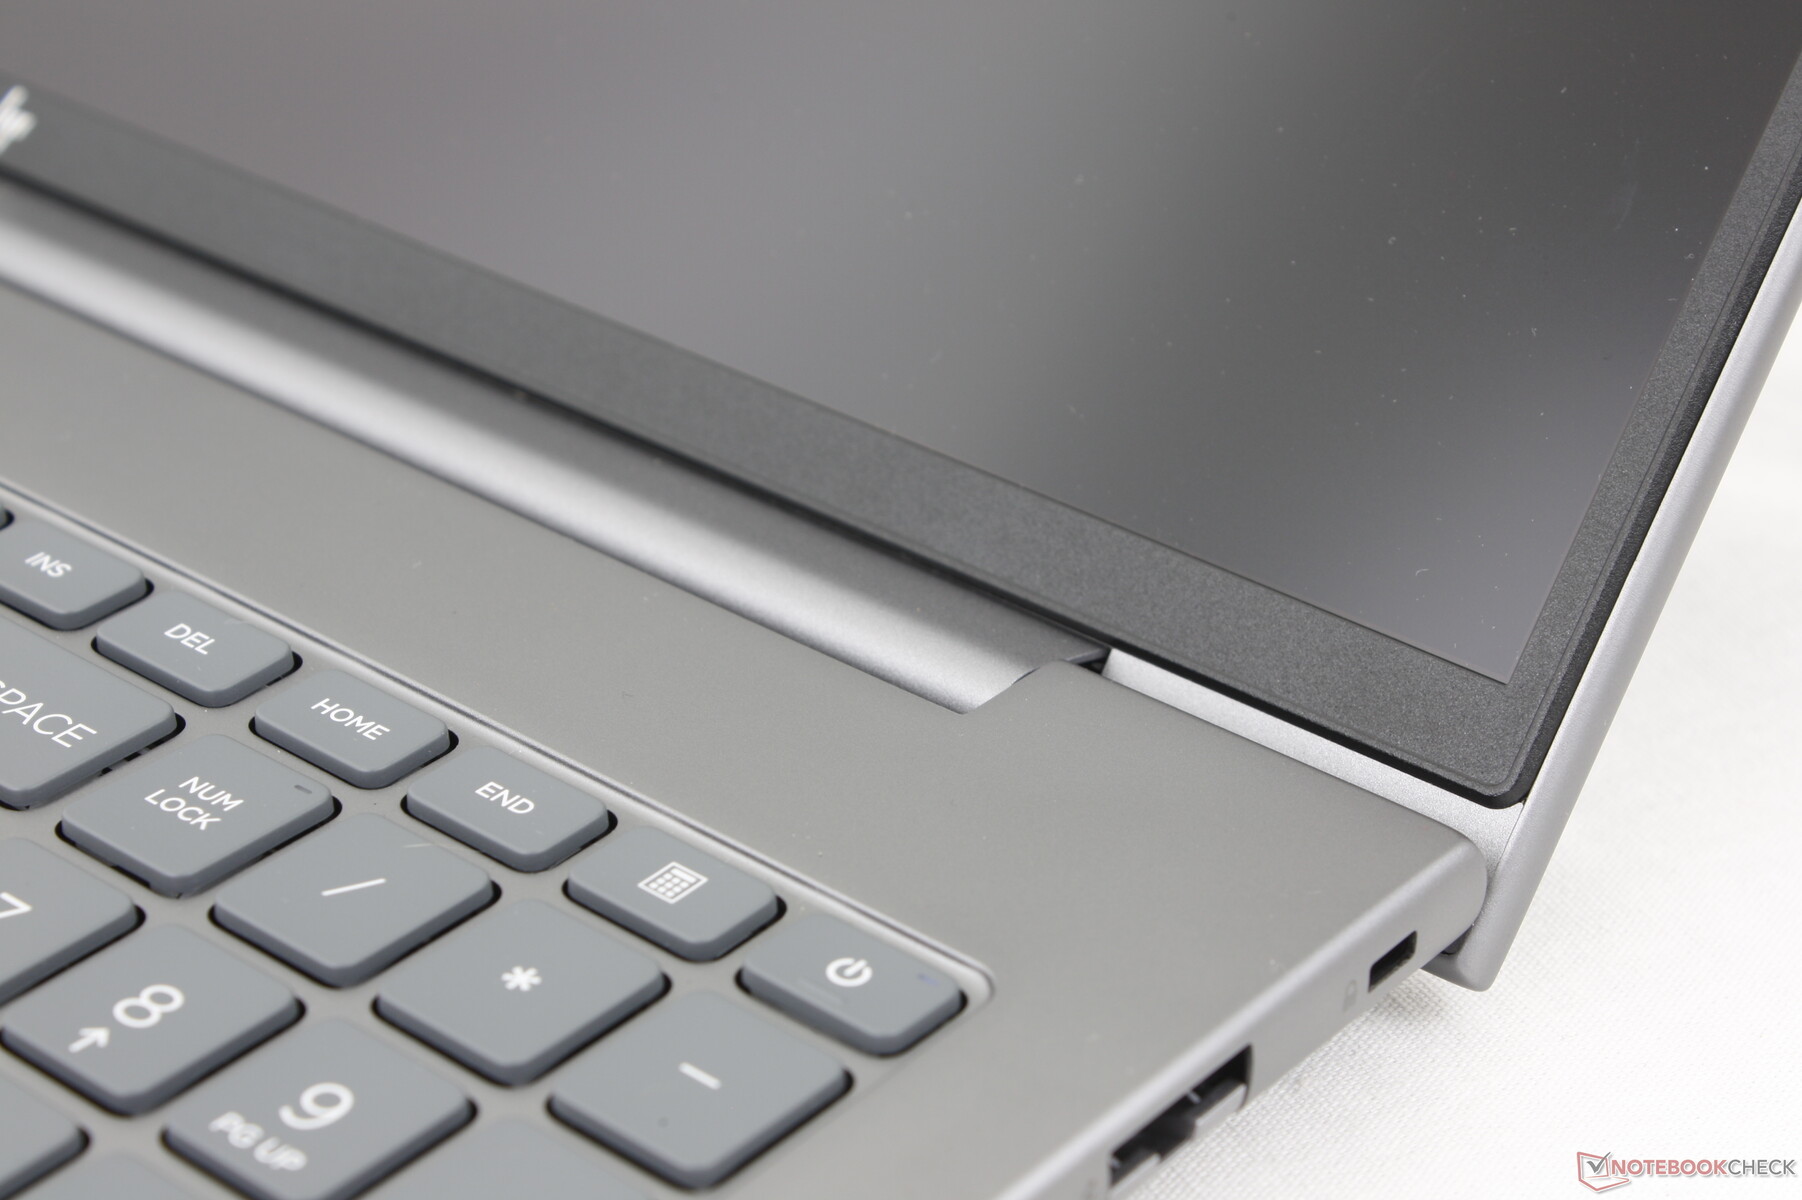
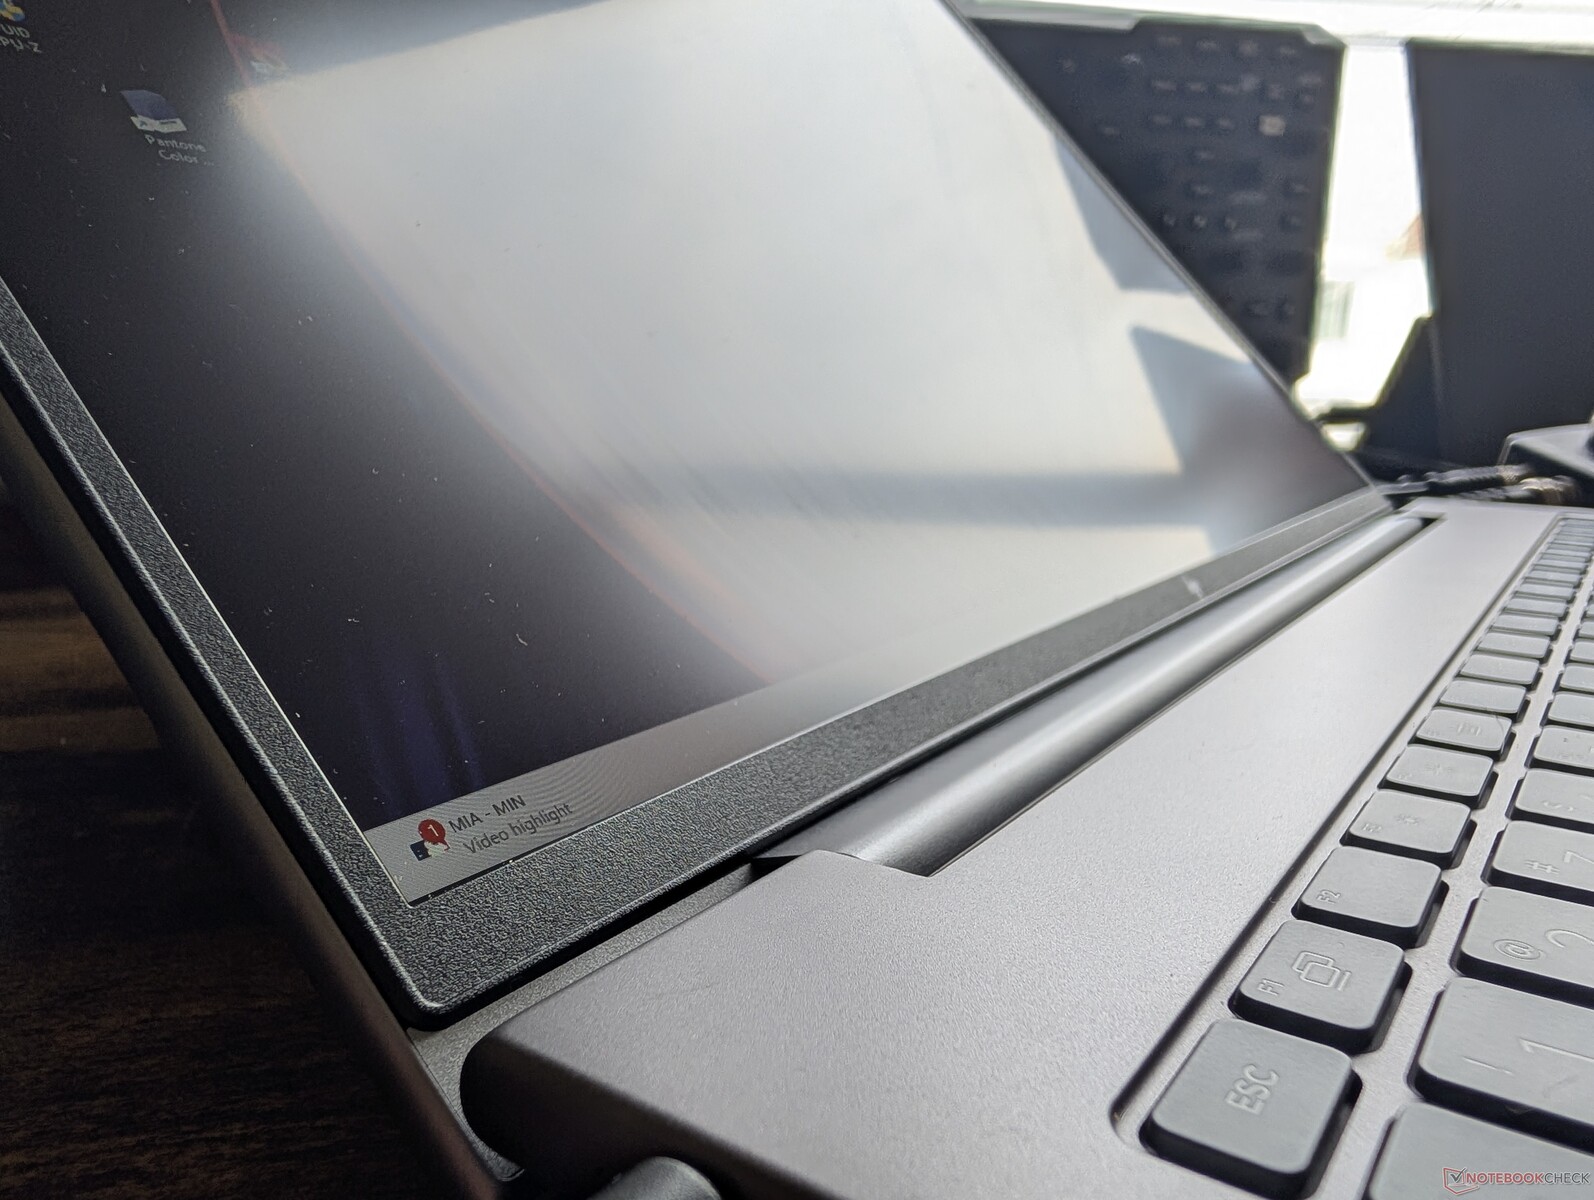
HP använder liknande grå aluminiumlegeringsmaterial för nästan alla sina ZBook-modeller för en känsla av konsistens över hela familjen. I det här fallet har ZBook Power 16 G11 samma släta, matta metallstruktur som ZBook Power 15 G10, men med ytliga förändringar av tangentbordets kanter, ytterlockets trim och bottenpanelen.
Chassits styvhet är utmärkt med minimala böjningar och fördjupningar när man försöker vrida basen. Gångjärnen och locket kunde dock ha varit styvare, särskilt eftersom locket kan öppnas nästan hela 180 grader till skillnad från på Precision 5690.
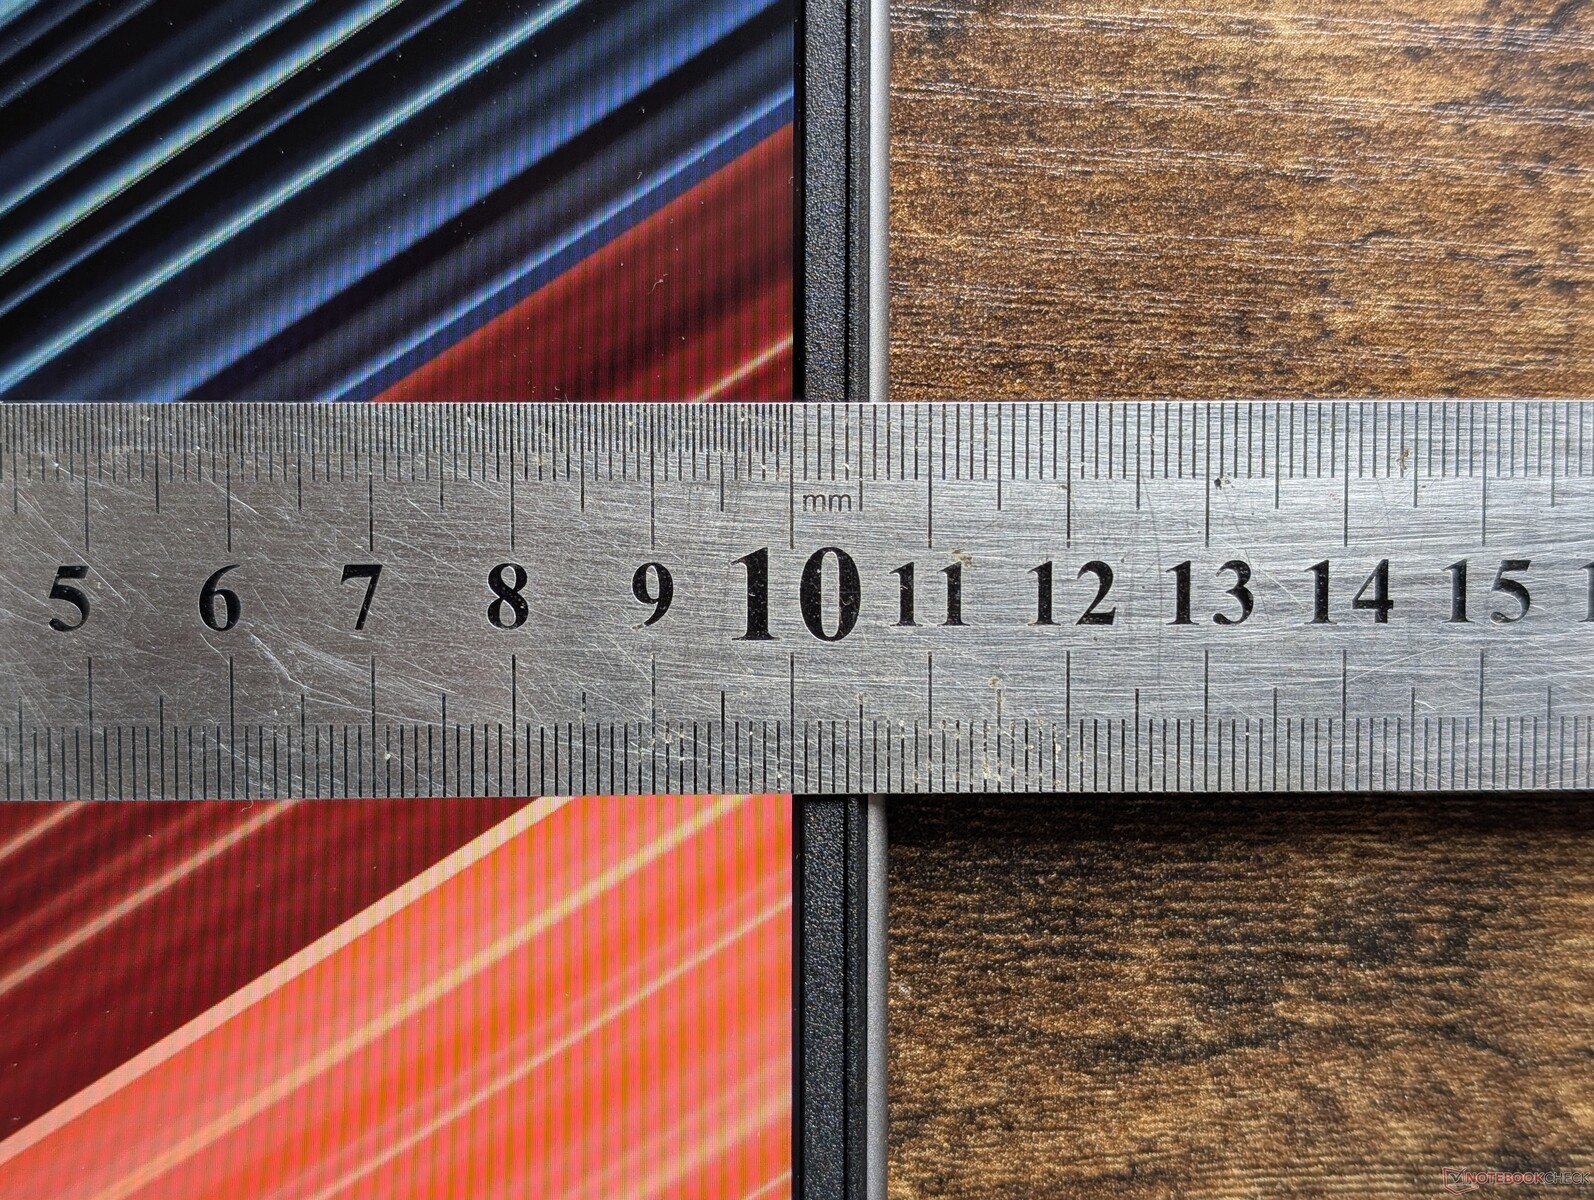
Den nya 16-tumsdesignen är cirka 10 procent tyngre och 7 procent större än den utgående 15-tumsmodellen. Den är inte heller tunnare, vilket är synd eftersom den redan är tjockare än vissa konkurrenter som ThinkPad P1 Gen 7. Den ZBook Fury 16 G11 är ännu tyngre och tjockare men med snabbare CPU- och GPU-alternativ för att kompensera. HP erbjuder den smalare ZBook Firefly 16 serien om användare vill ha ett mer bärbart alternativ.
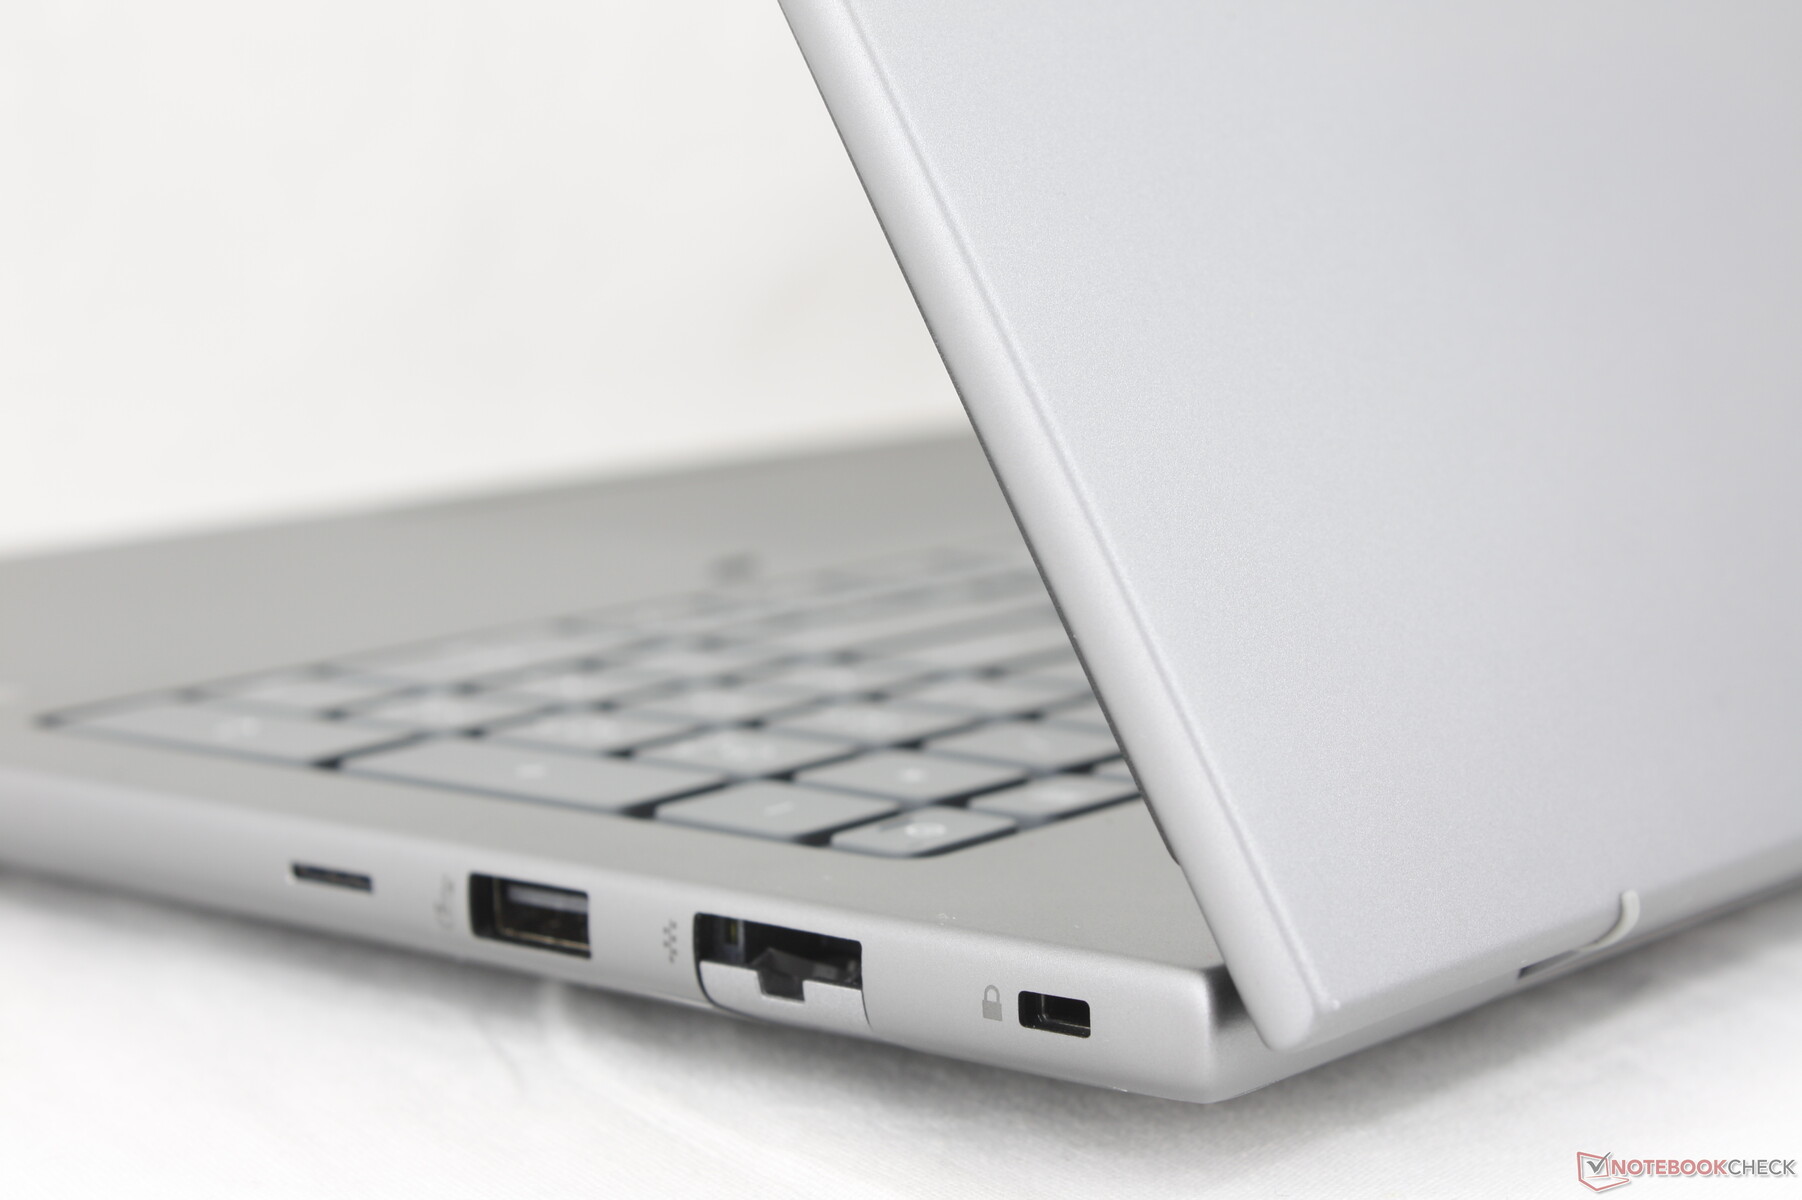
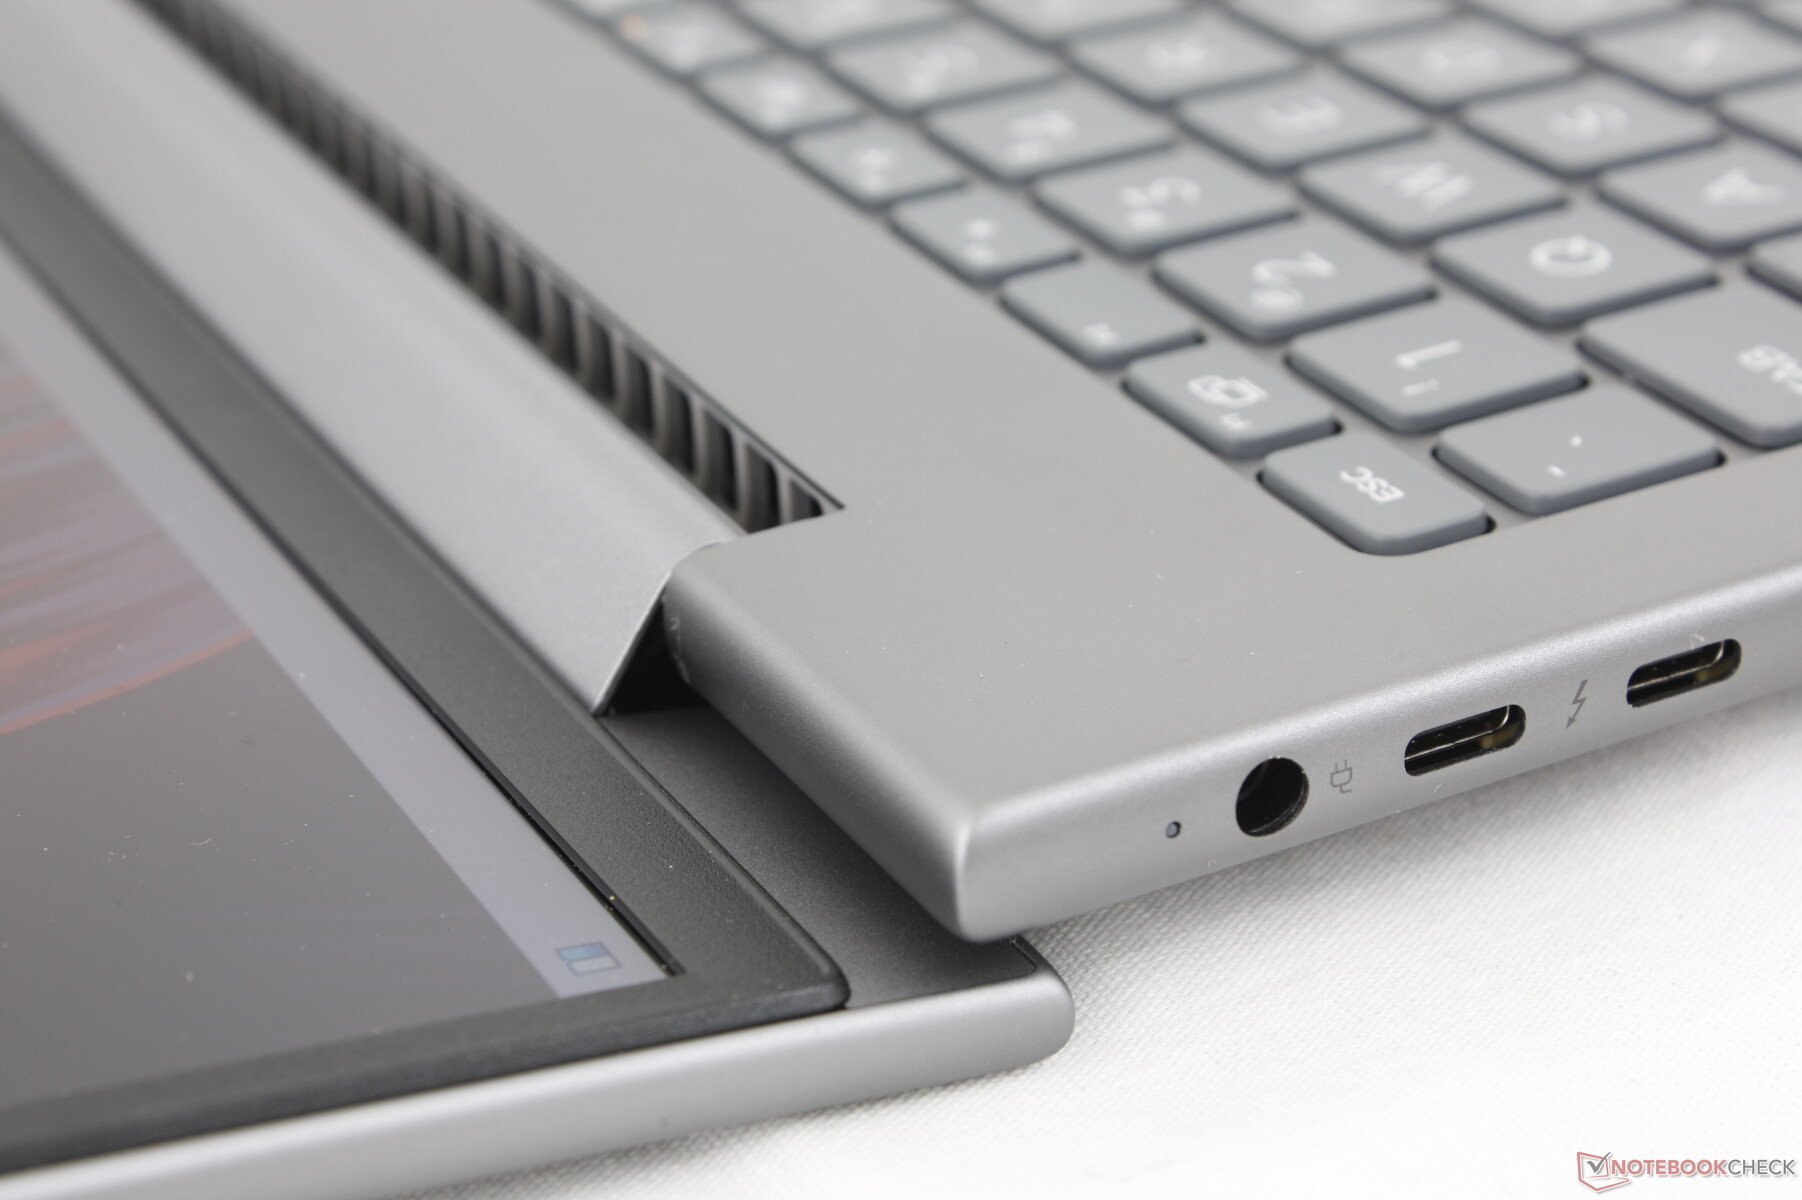
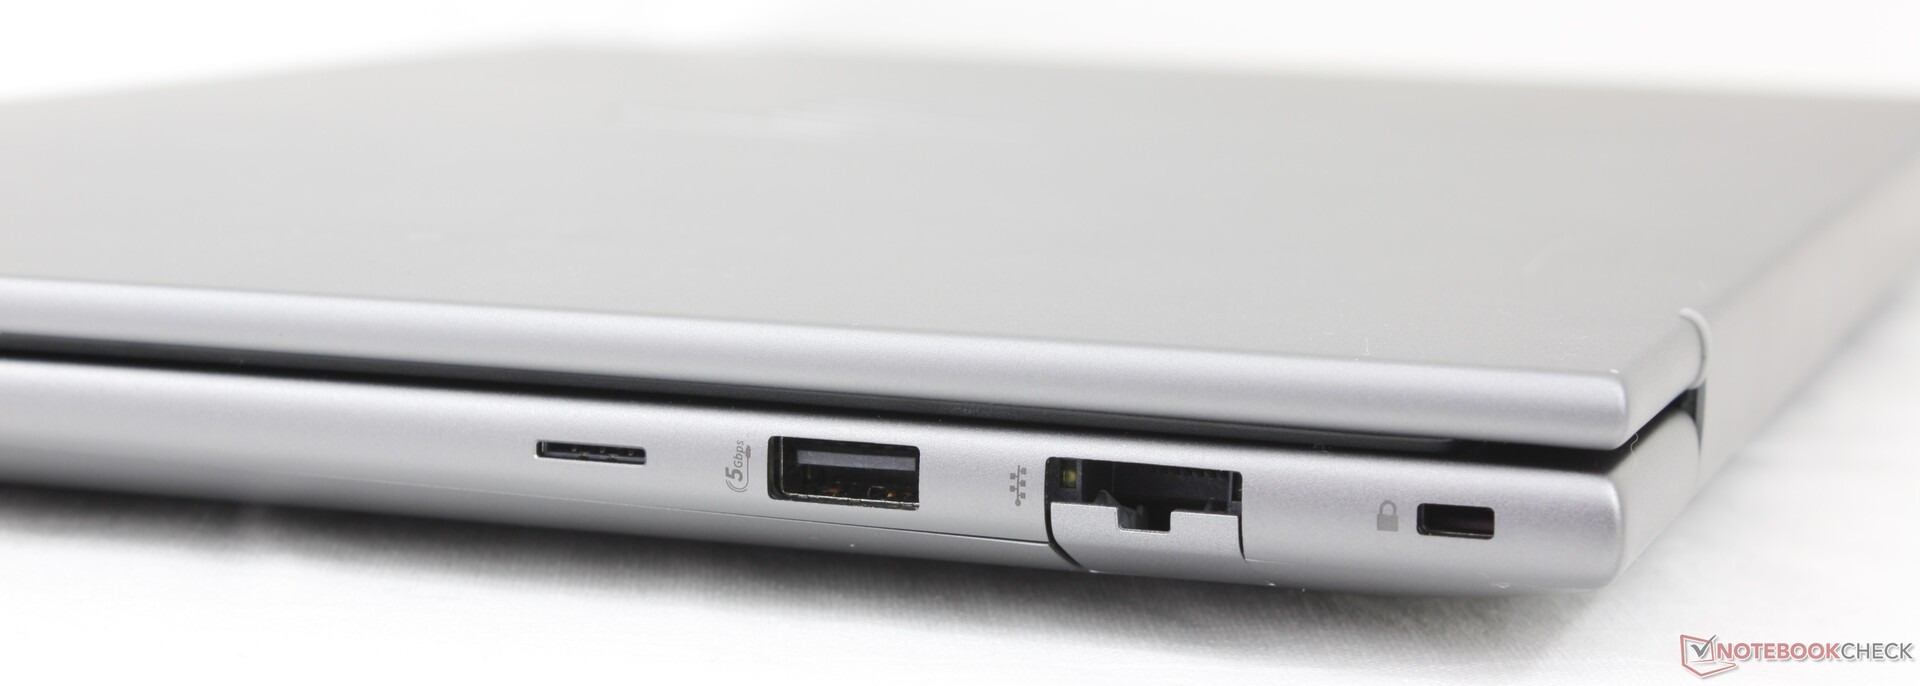
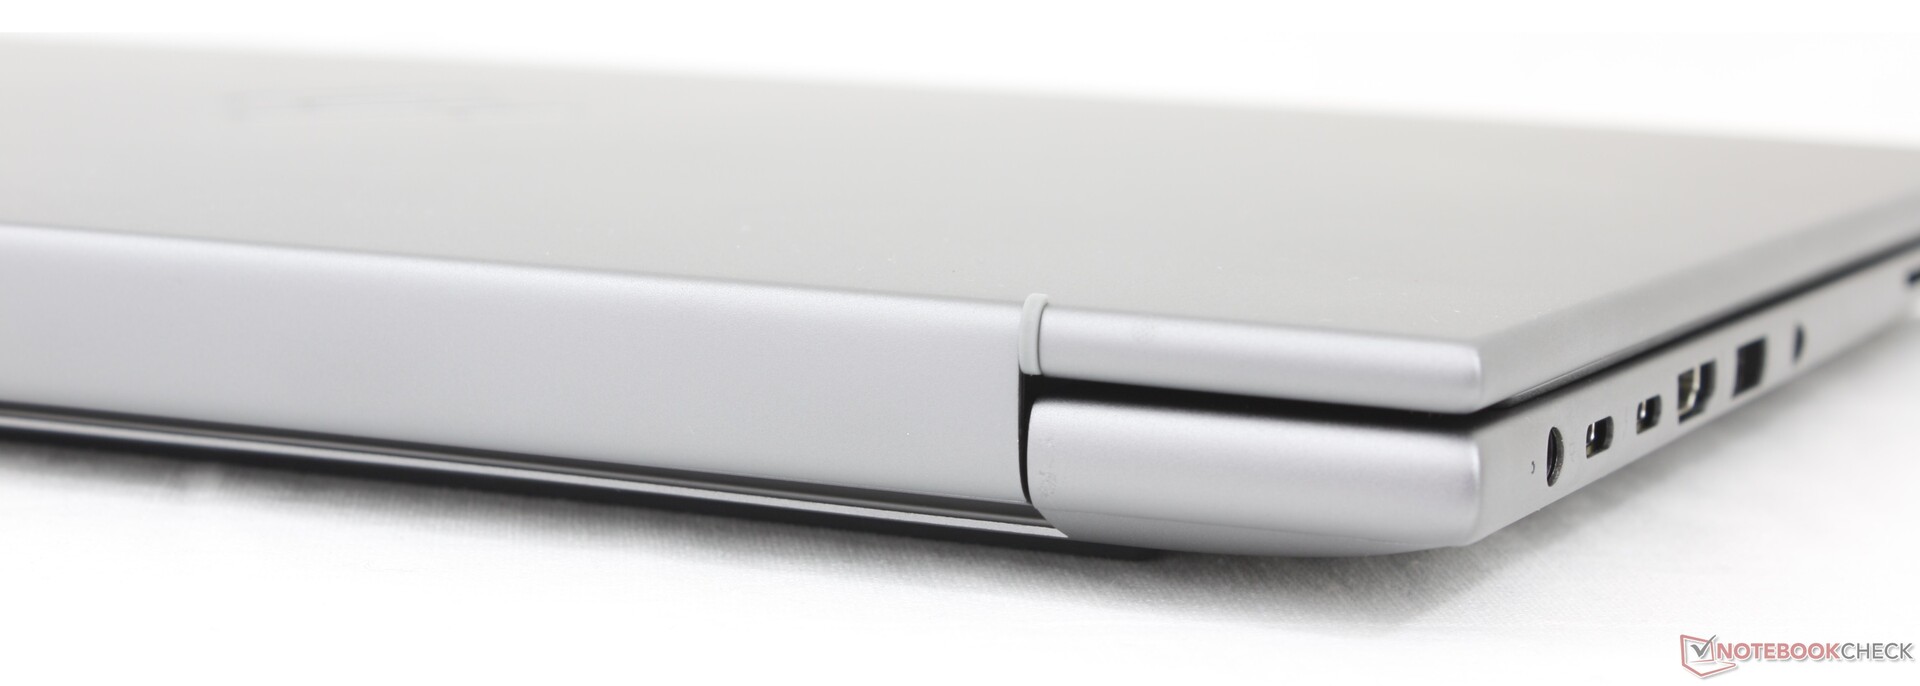
Anslutningsmöjligheter - Thunderbolt 4-portar
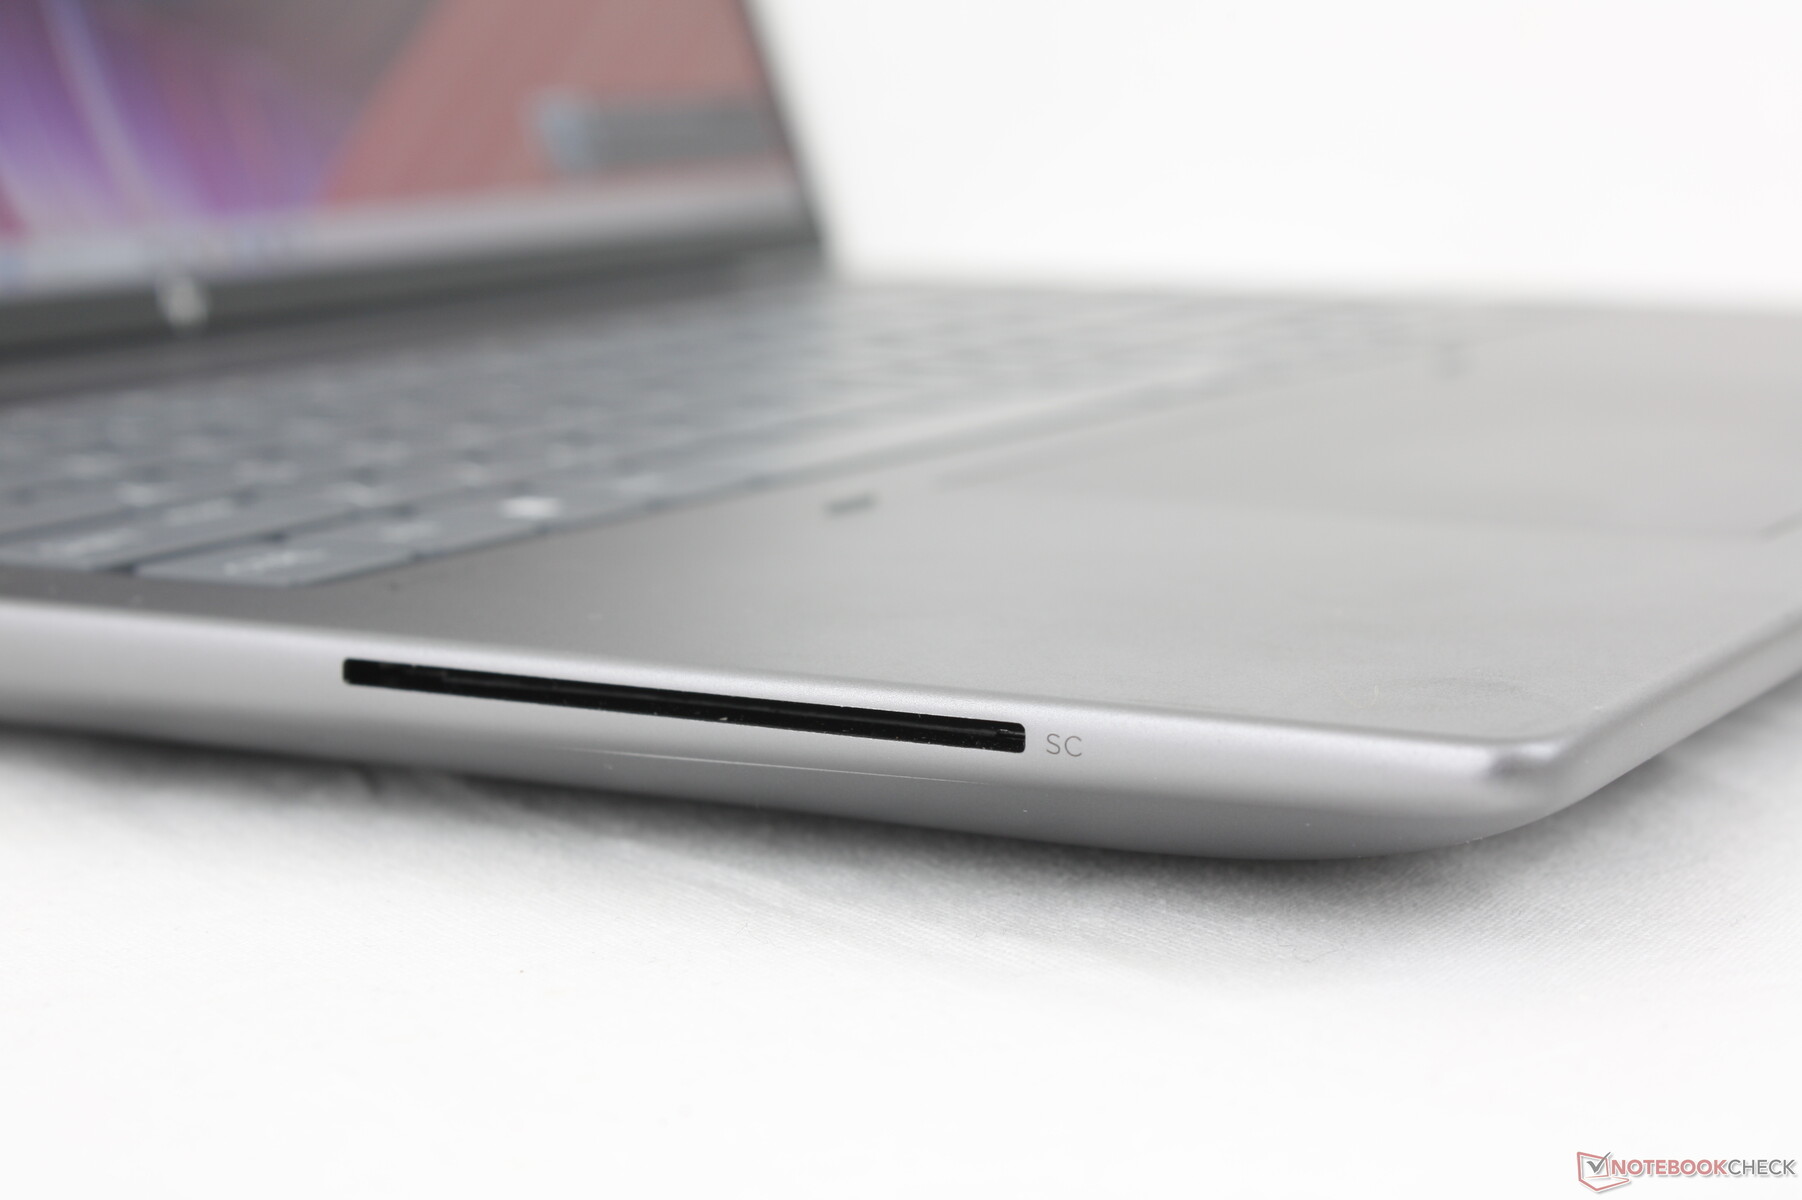
Modellen har färre USB-A-portar än förra årets ZBook Power 15 G10. Allt annat har återvänt, inklusive smartkortläsaren och dubbla USB-C Thunderbolt 4-portar, om än omplacerade. Portarna längs den vänstra kanten i synnerhet är alldeles för trånga och kunde ha spridits ut lite mer.
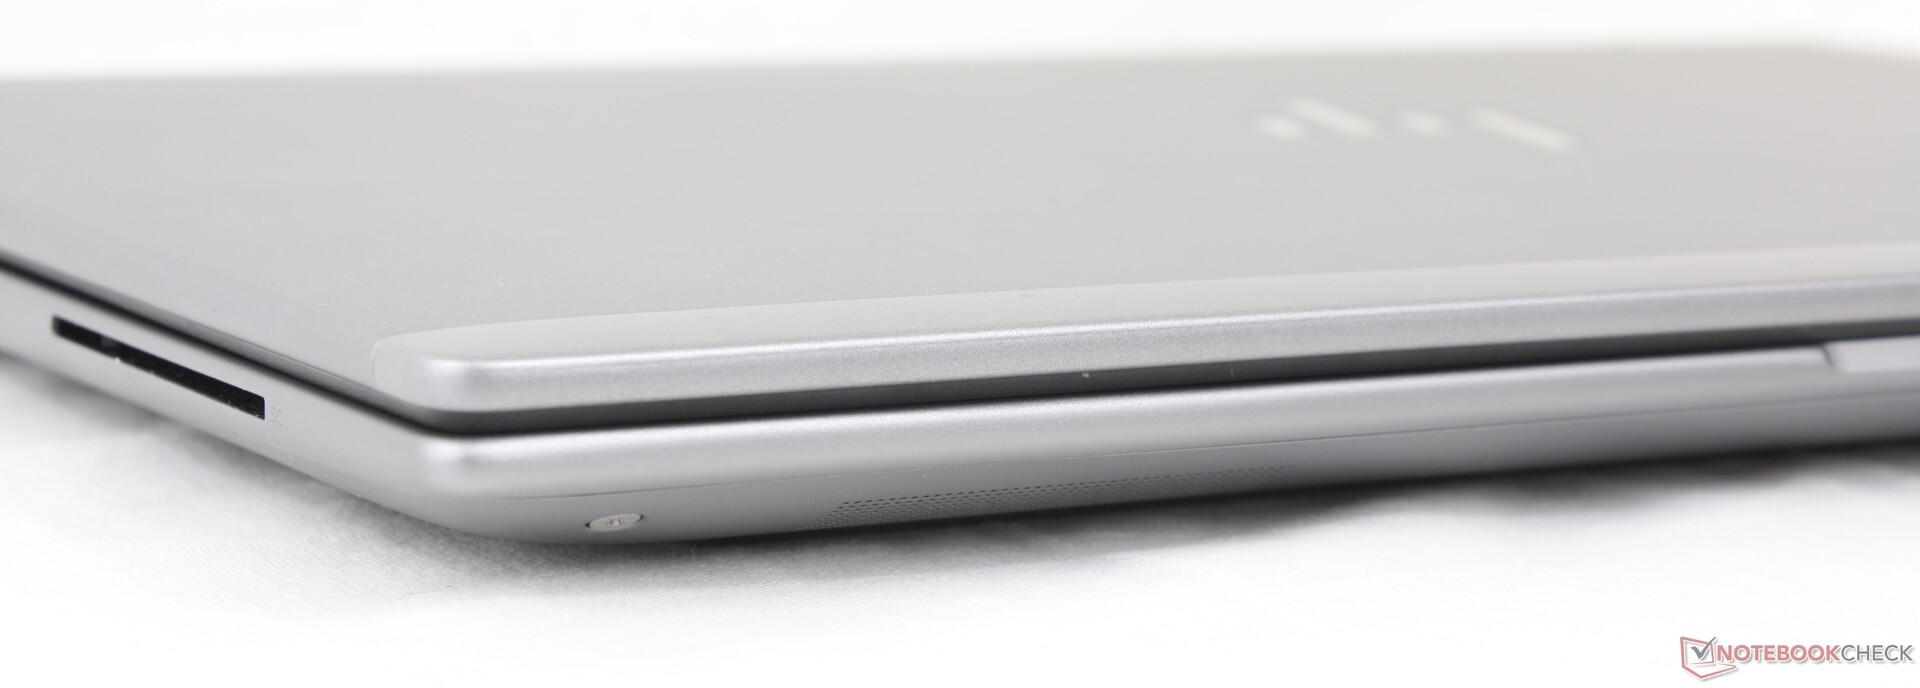

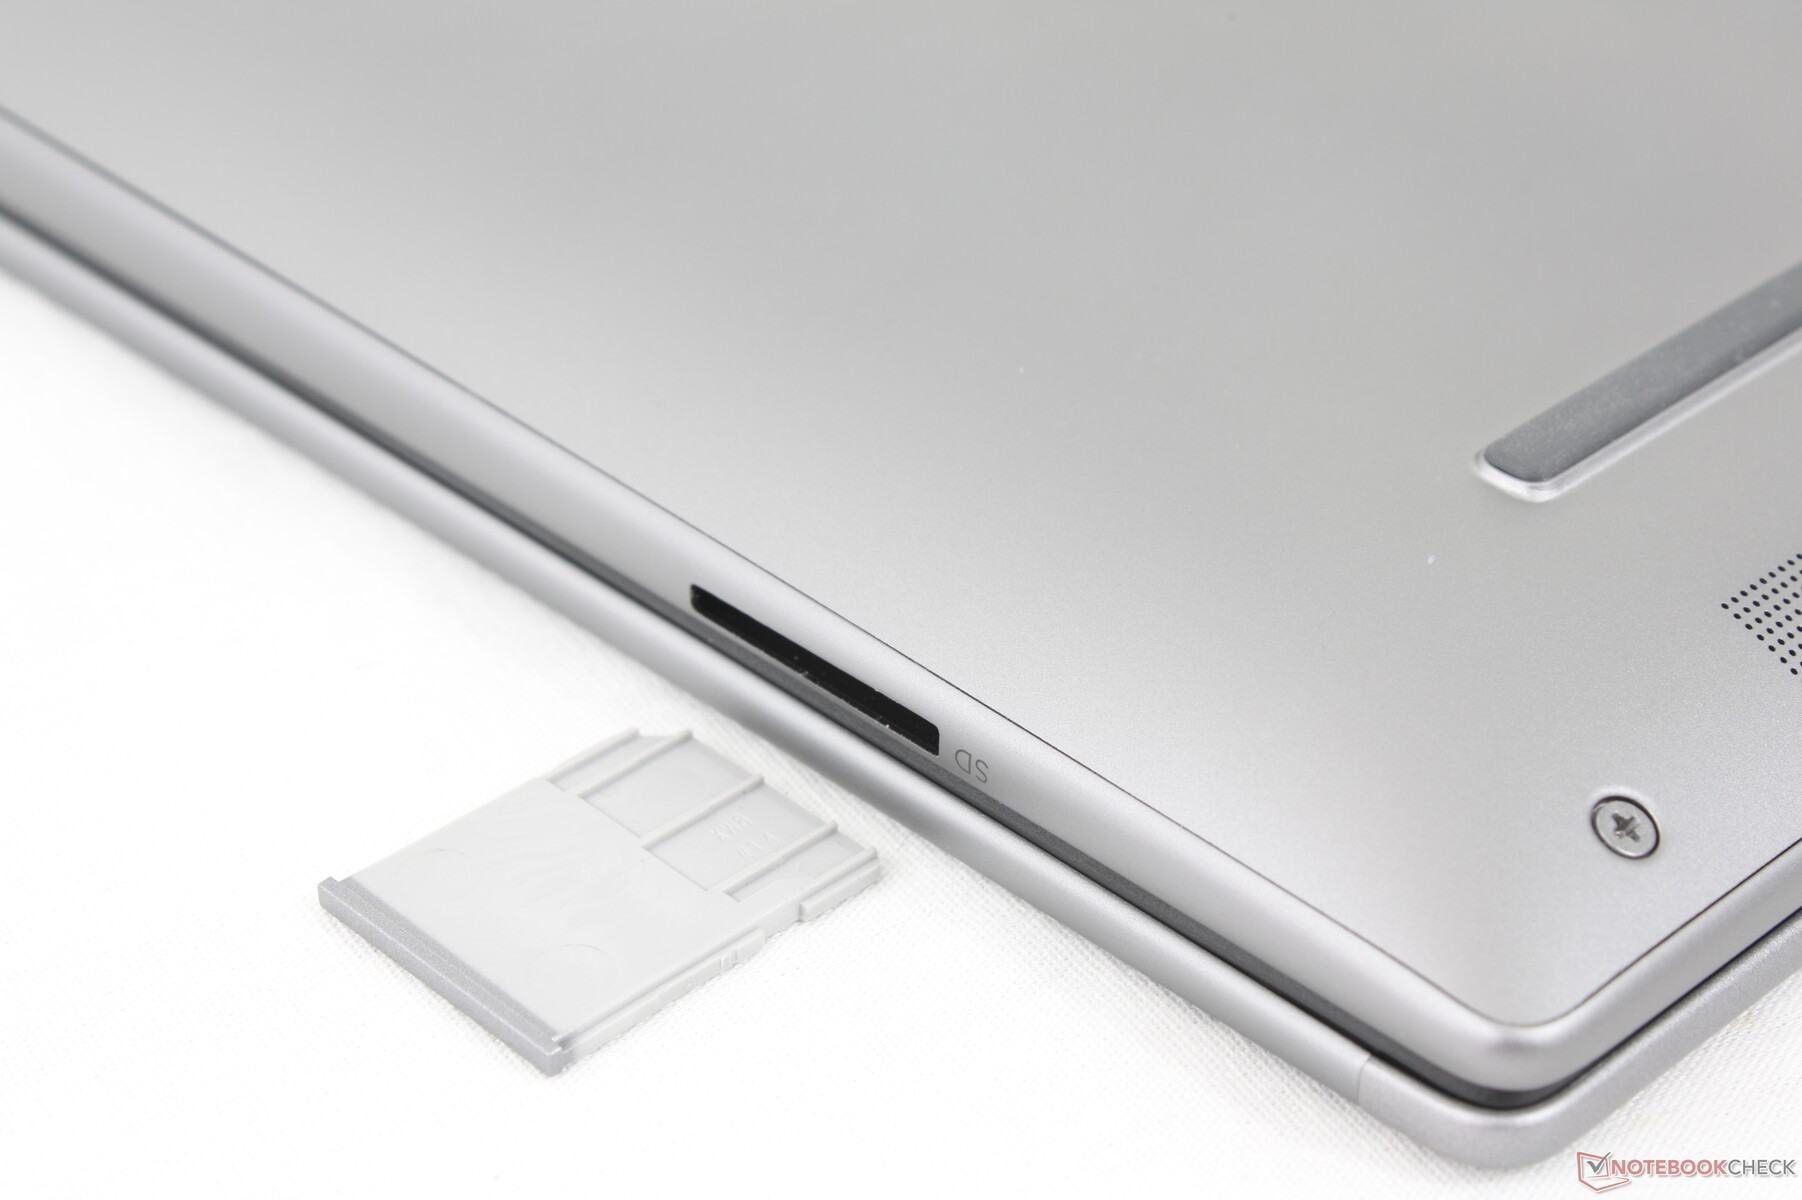
SD-kortläsare
Modellen har en inbyggd MicroSD-kortläsare, en funktion som saknades på ZBook Power 15 G10. Överföringshastigheterna är mycket snabba; att flytta 1 GB bilder från vårt UHS-II-testkort tar mindre än 6 sekunder jämfört med 12 sekunder på ZBook Fury 16 G11 eller ThinkPad P1 Gen 7.
| SD Card Reader | |
| average JPG Copy Test (av. of 3 runs) | |
| HP ZBook Power 16 G11 A (Toshiba Exceria Pro SDXC 64 GB UHS-II) | |
| HP ZBook Fury 16 G11 (Toshiba Exceria Pro SDXC 64 GB UHS-II) | |
| Lenovo ThinkPad P1 Gen 7 21KV001SGE (AV Pro V60) | |
| maximum AS SSD Seq Read Test (1GB) | |
| HP ZBook Power 16 G11 A (Toshiba Exceria Pro SDXC 64 GB UHS-II) | |
| HP ZBook Fury 16 G11 (Toshiba Exceria Pro SDXC 64 GB UHS-II) | |
| Lenovo ThinkPad P1 Gen 7 21KV001SGE (AV Pro V60) | |
Kommunikation
MediaTek MT7922 är standard för Wi-Fi 6E och Bluetooth 5.2-anslutning. Realtek-alternativ finns också tillgängliga, liksom HP 4000 eller Qualcomm 9205 för WAN-anslutning.
Webbkamera
En webbkamera på 5 MP ingår som standard tillsammans med IR och en fysisk avtryckare som liknar den på ThinkPad P16s G2. Den Precision 5690 levereras med en mycket lägre upplösning 2 MP webbkamera.


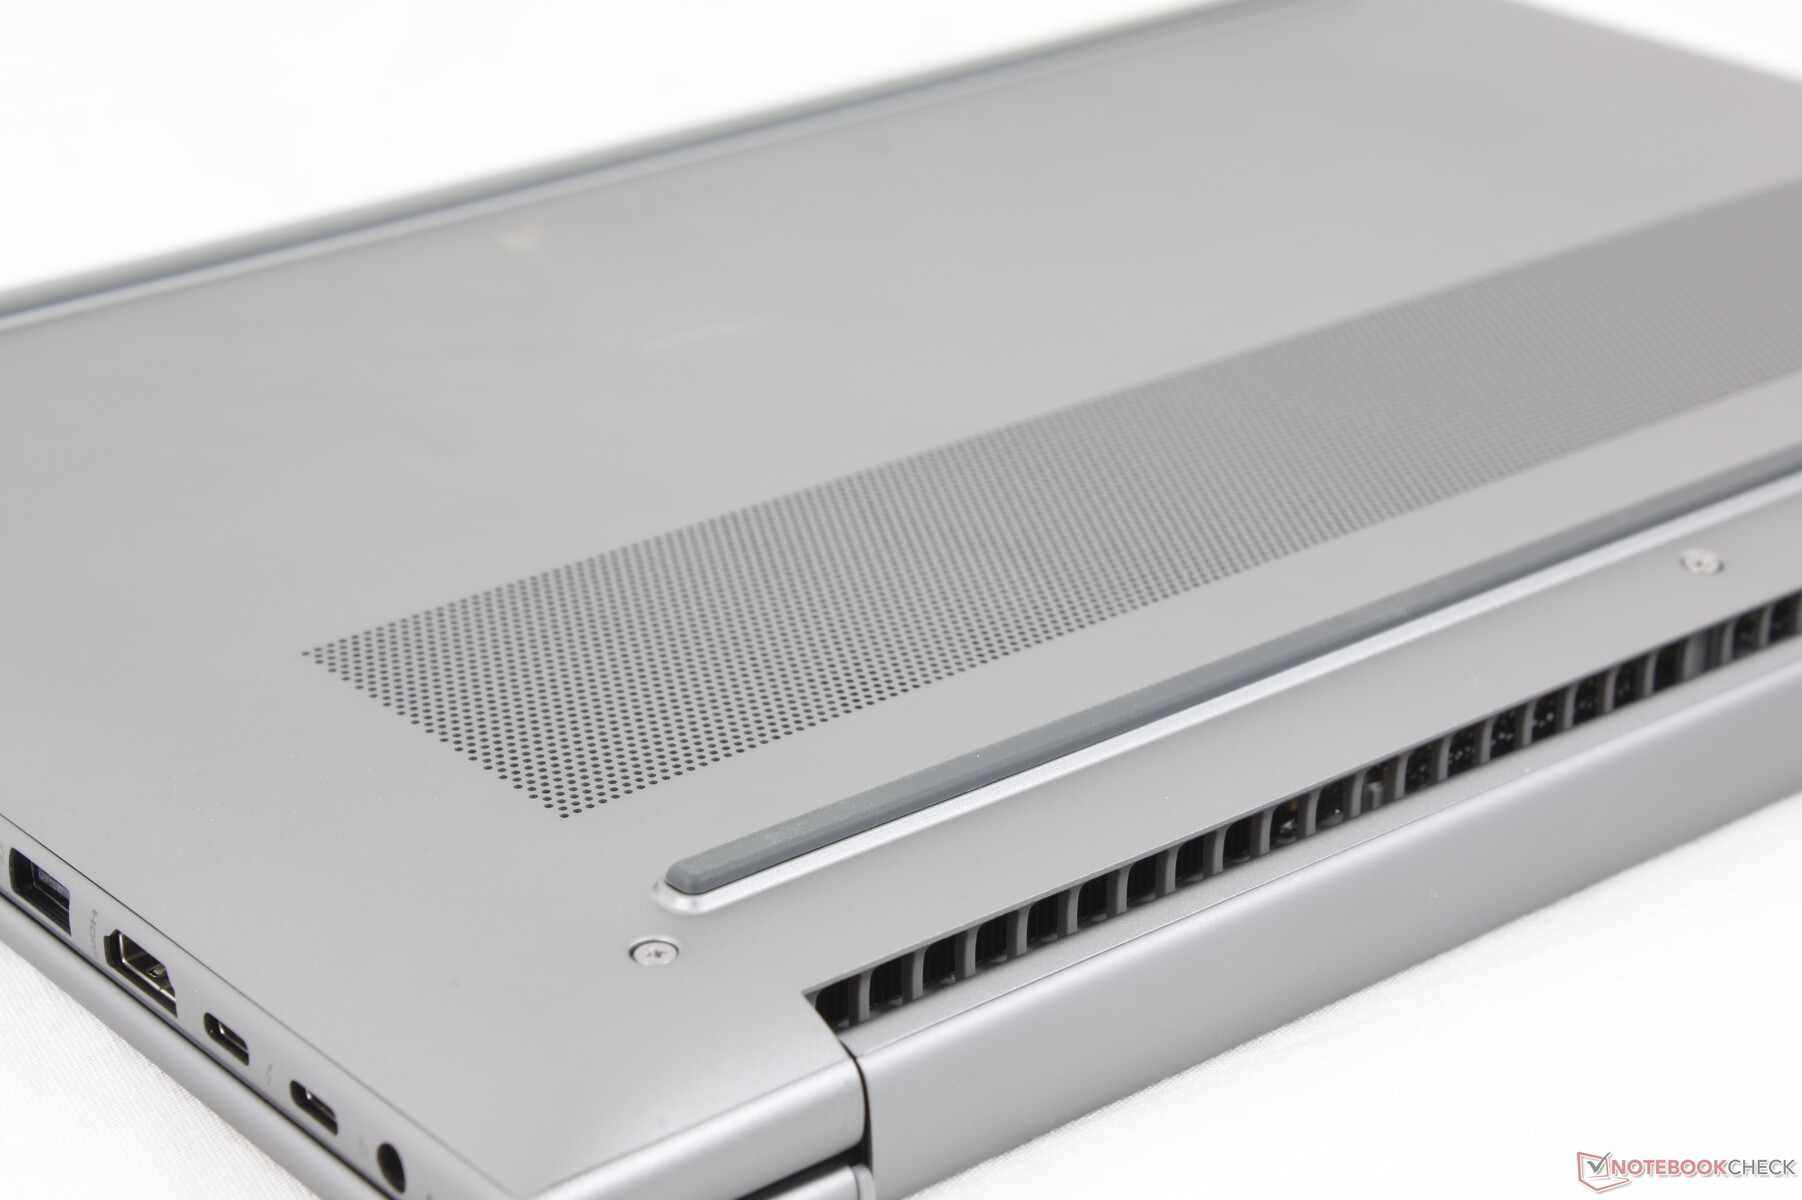
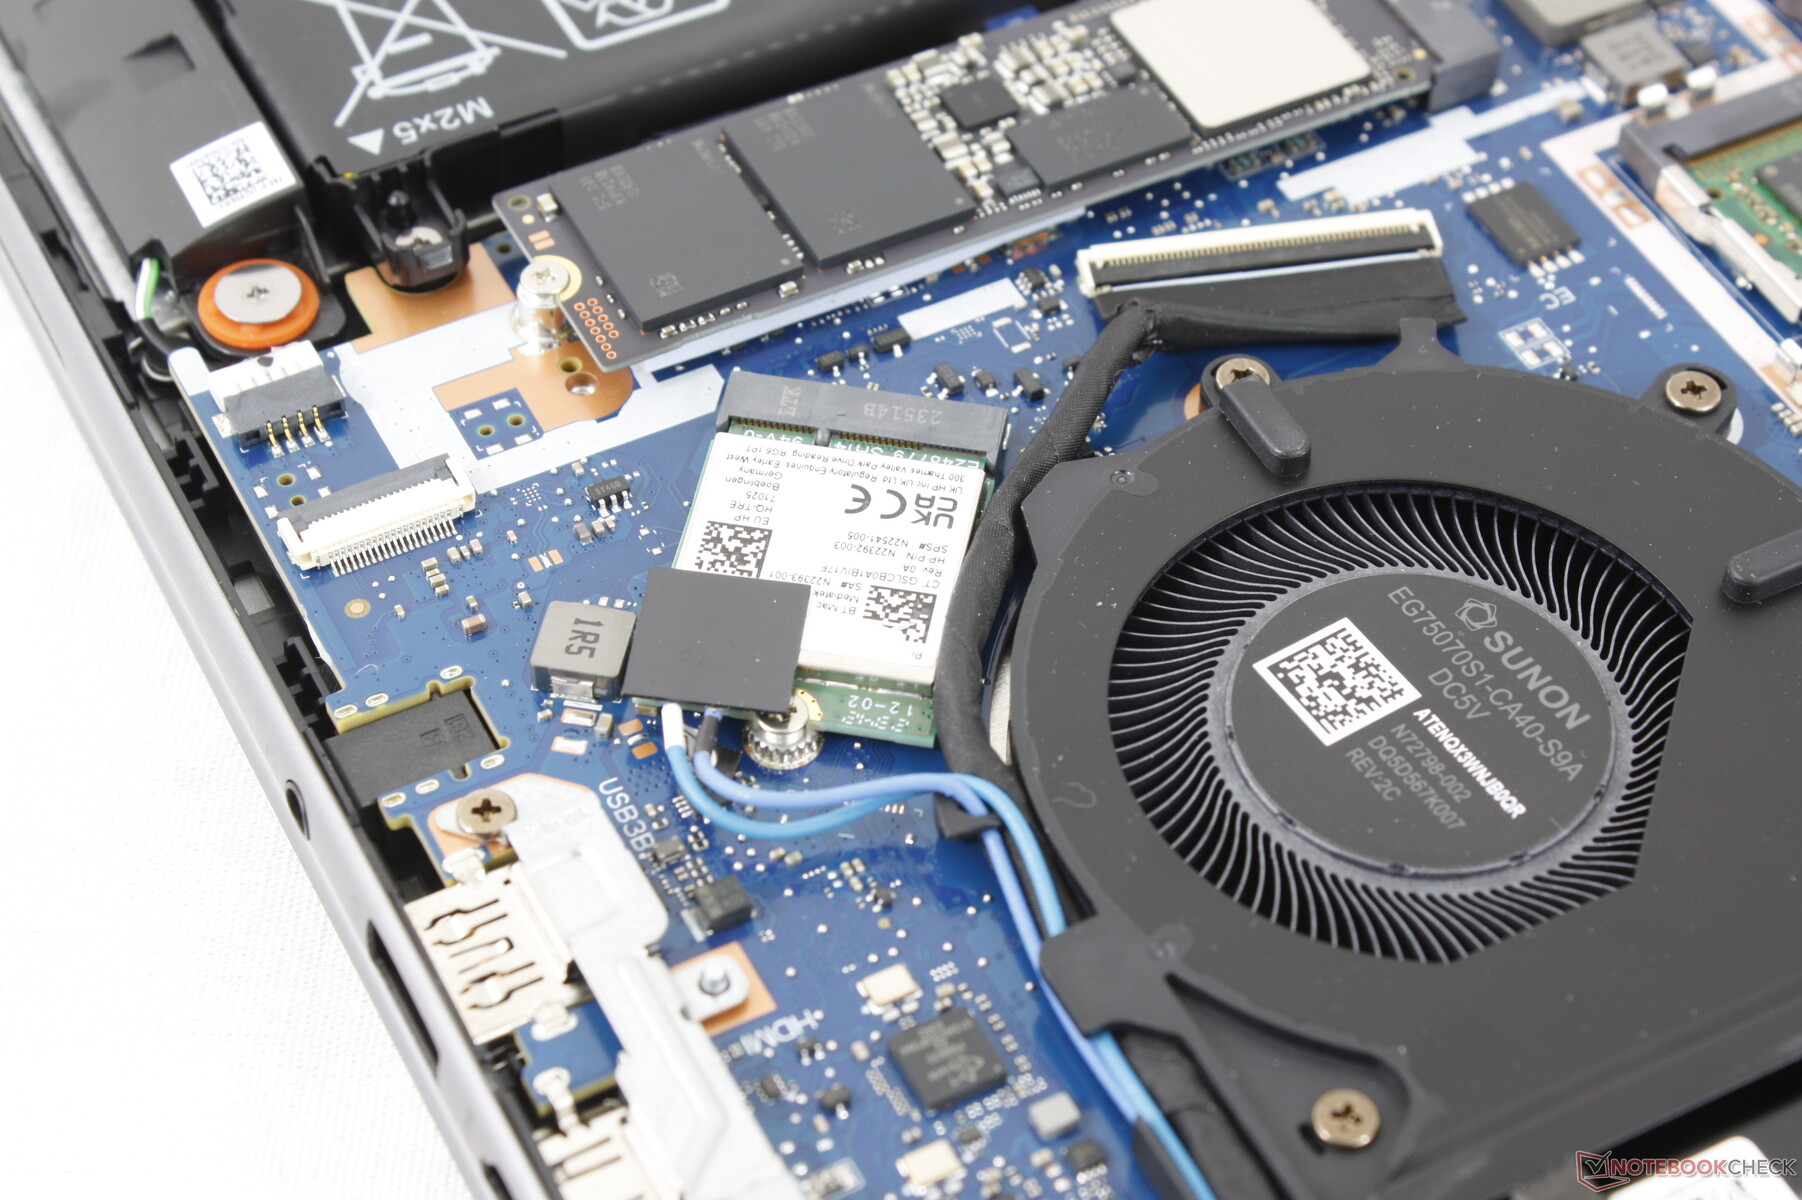
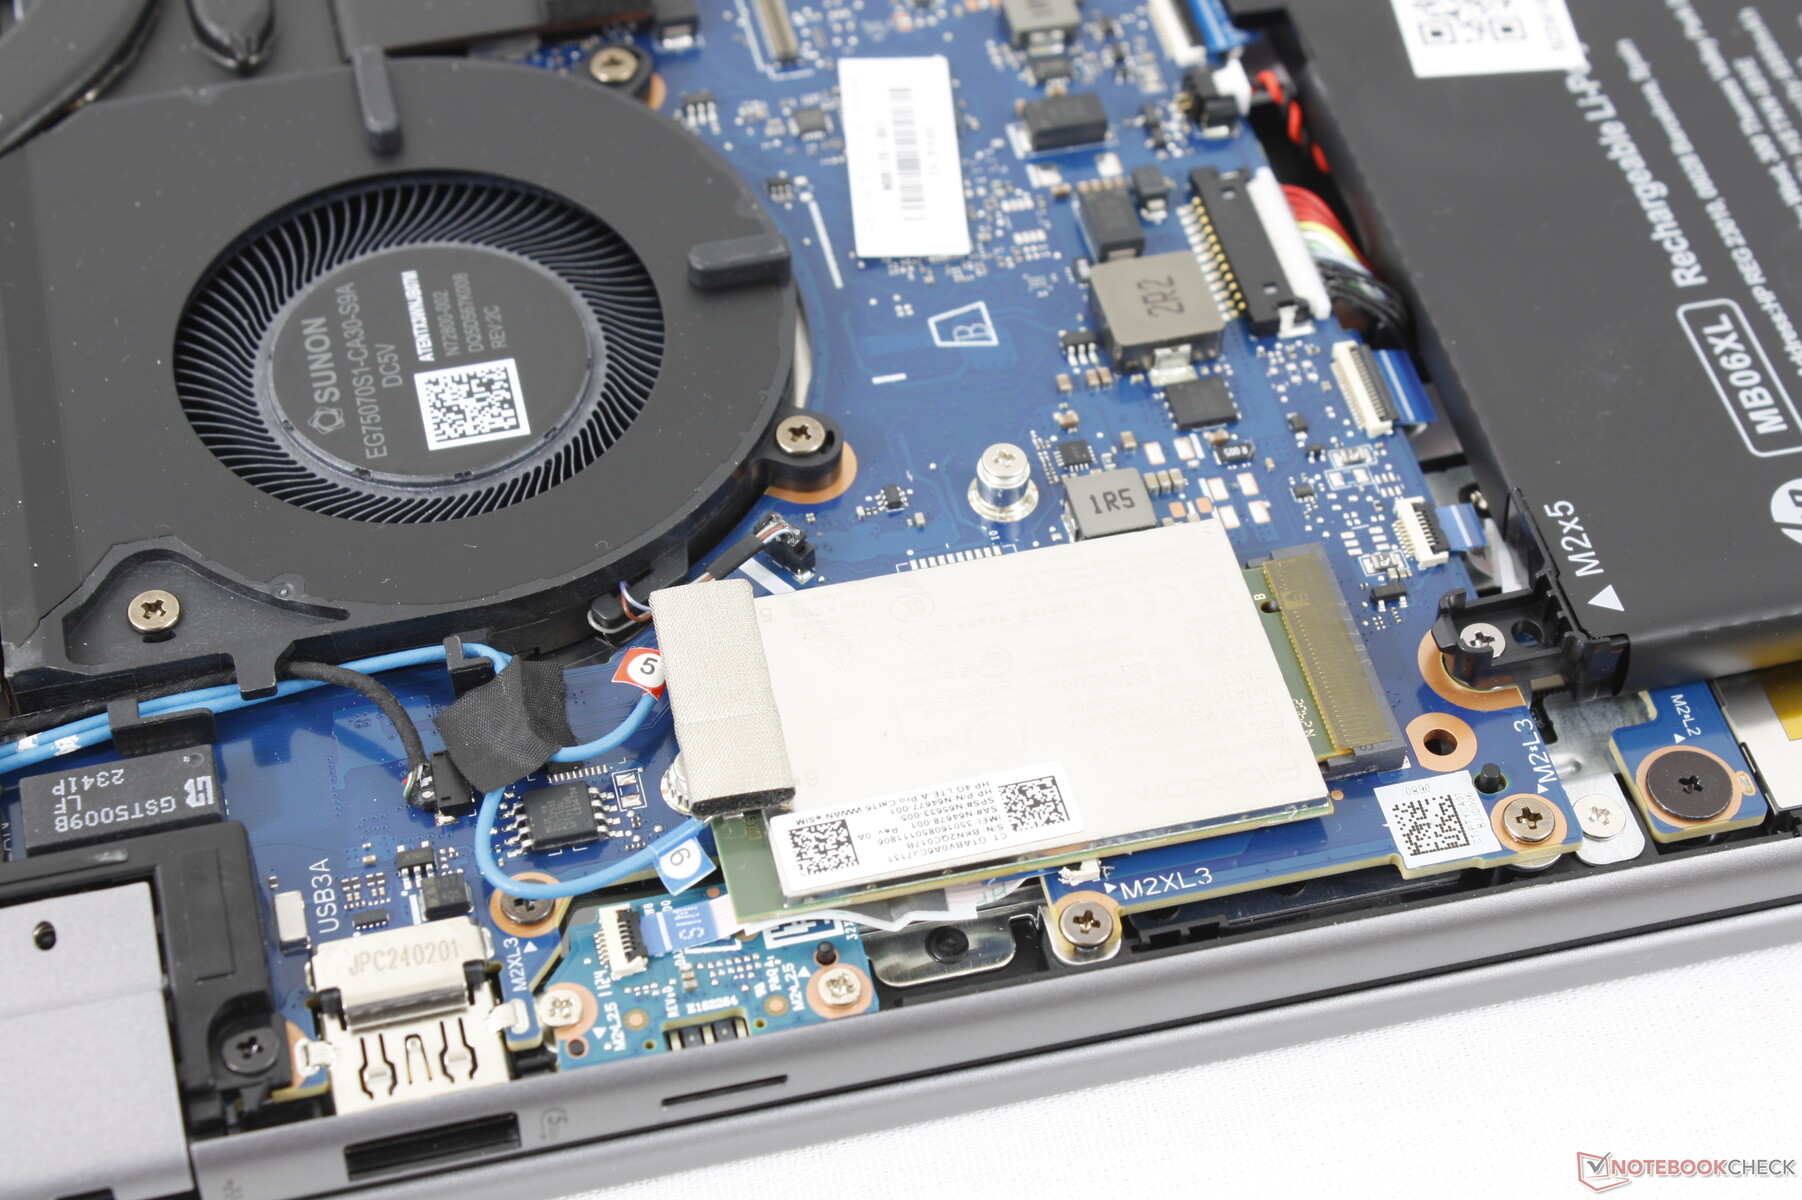
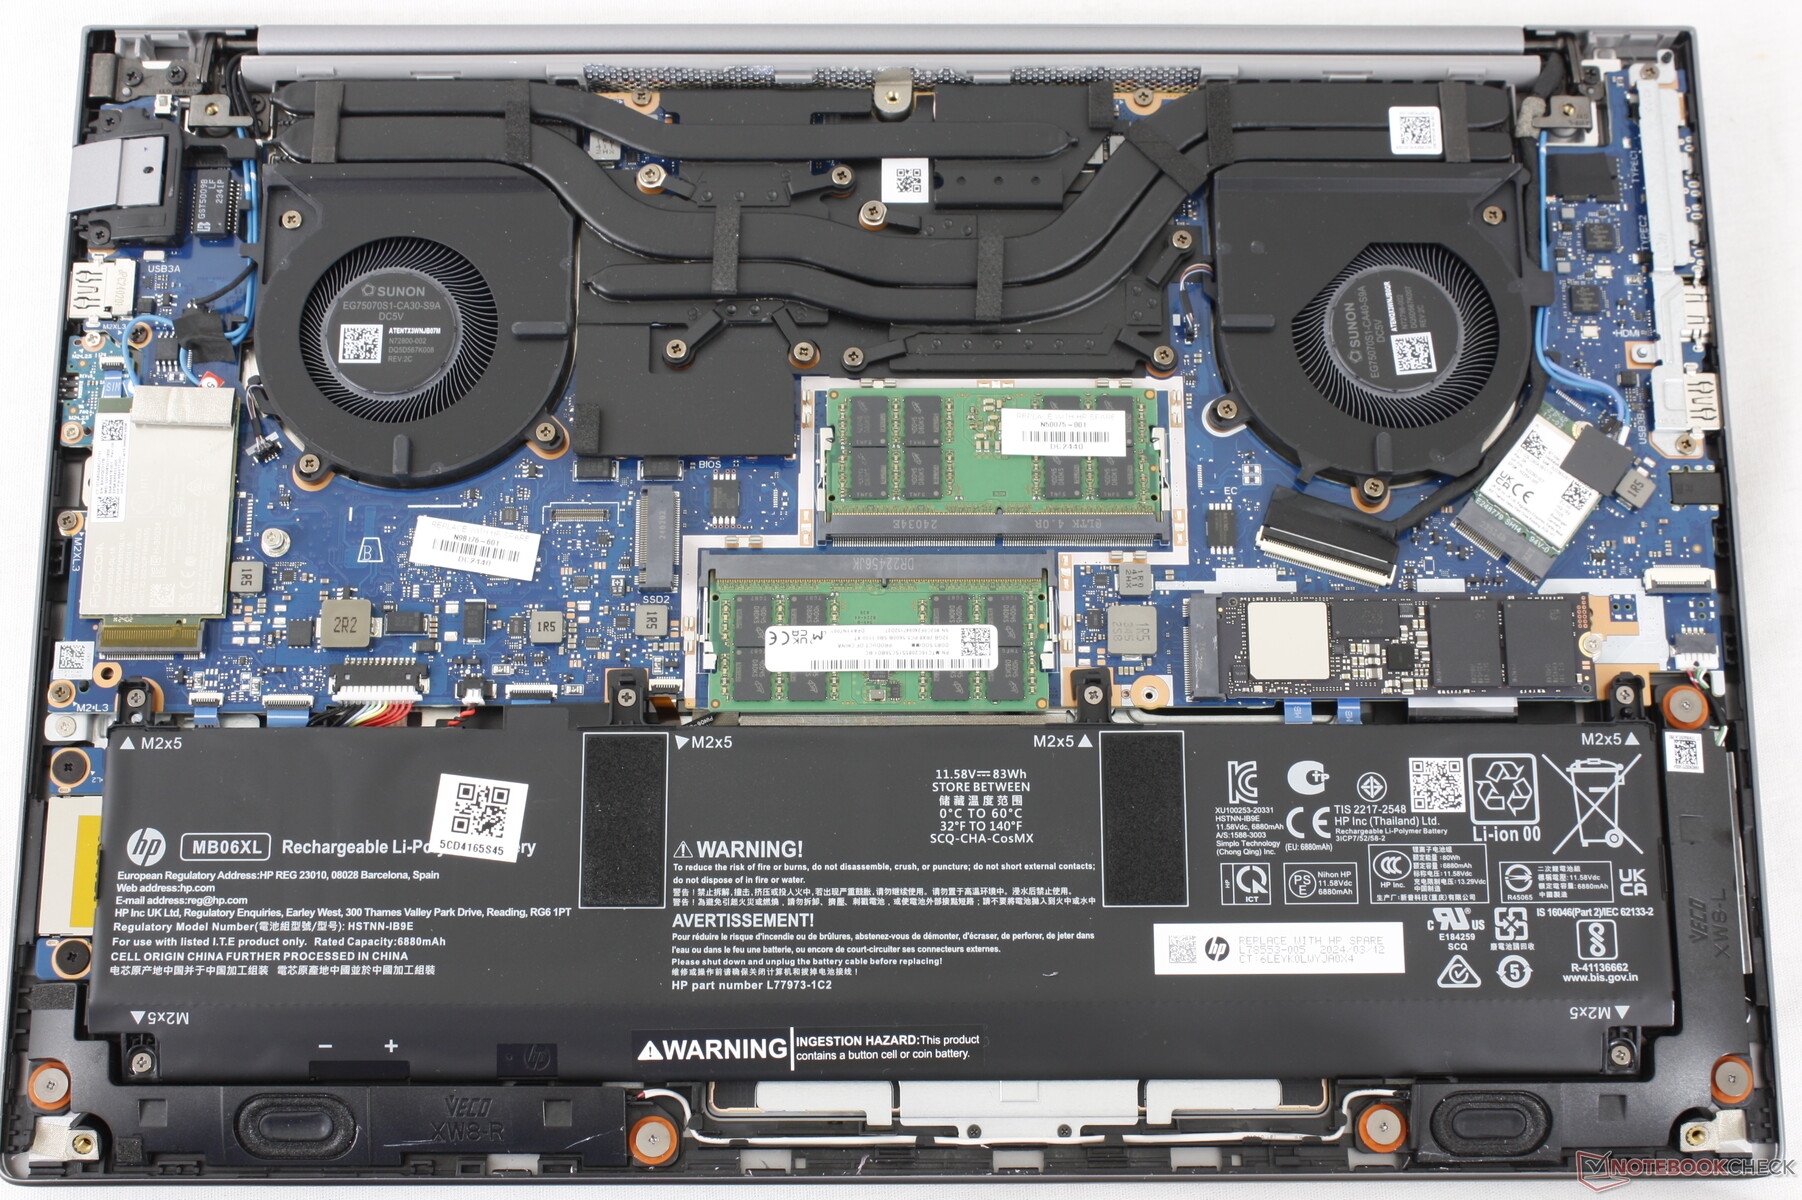
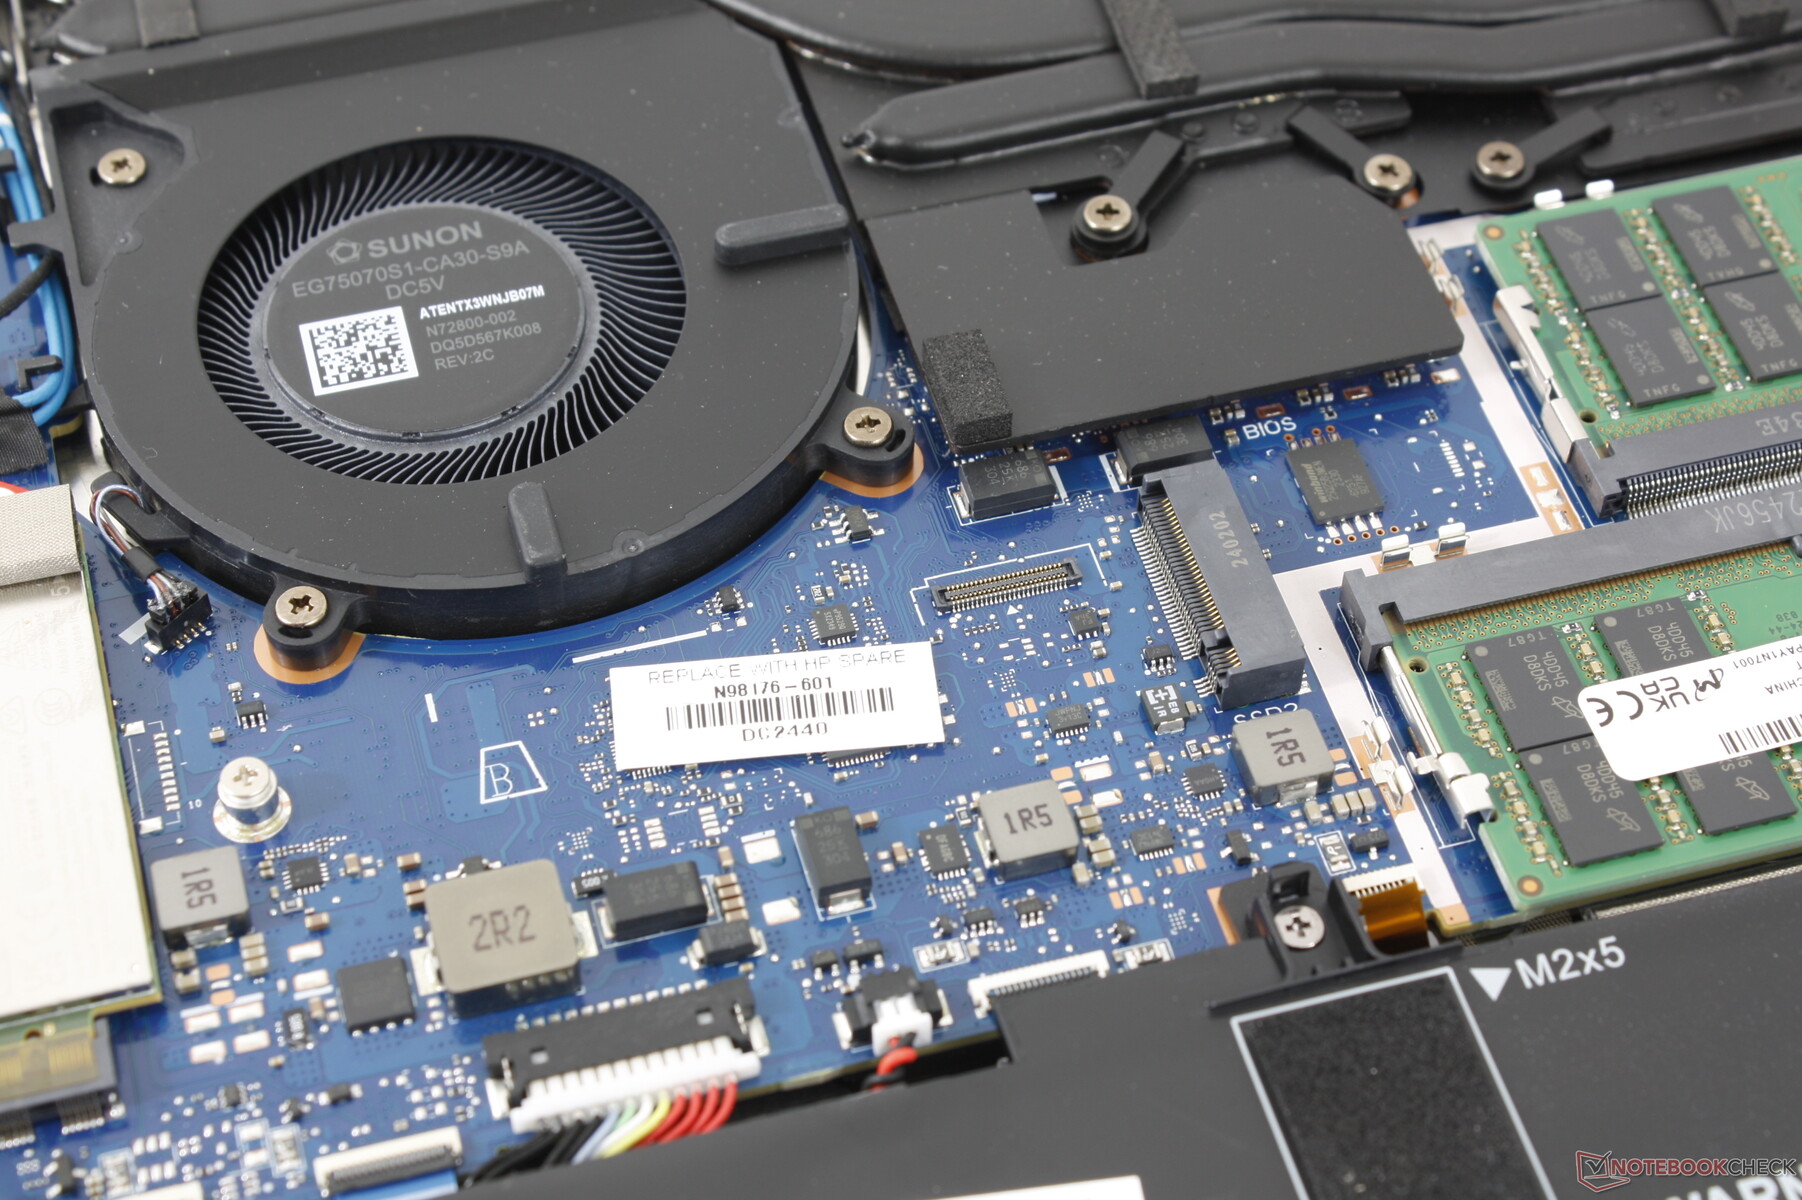
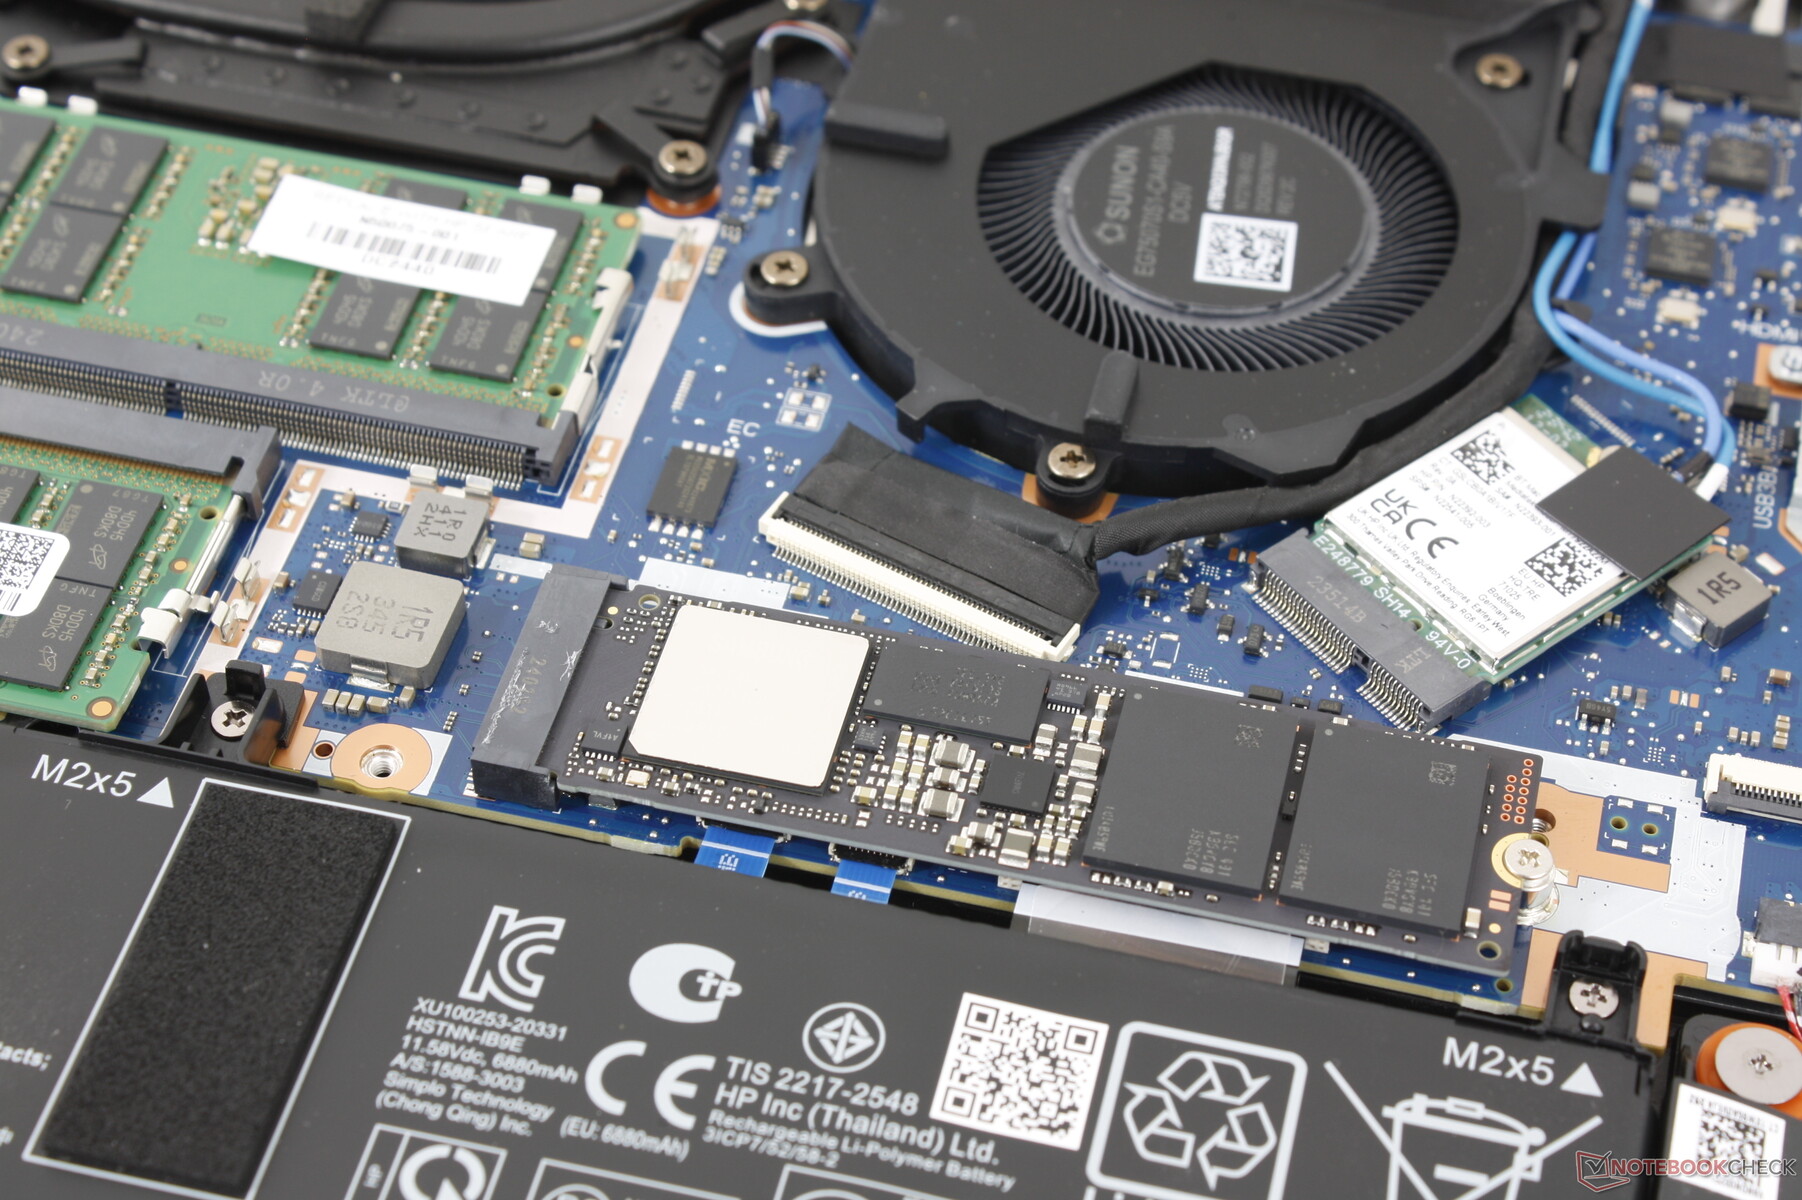
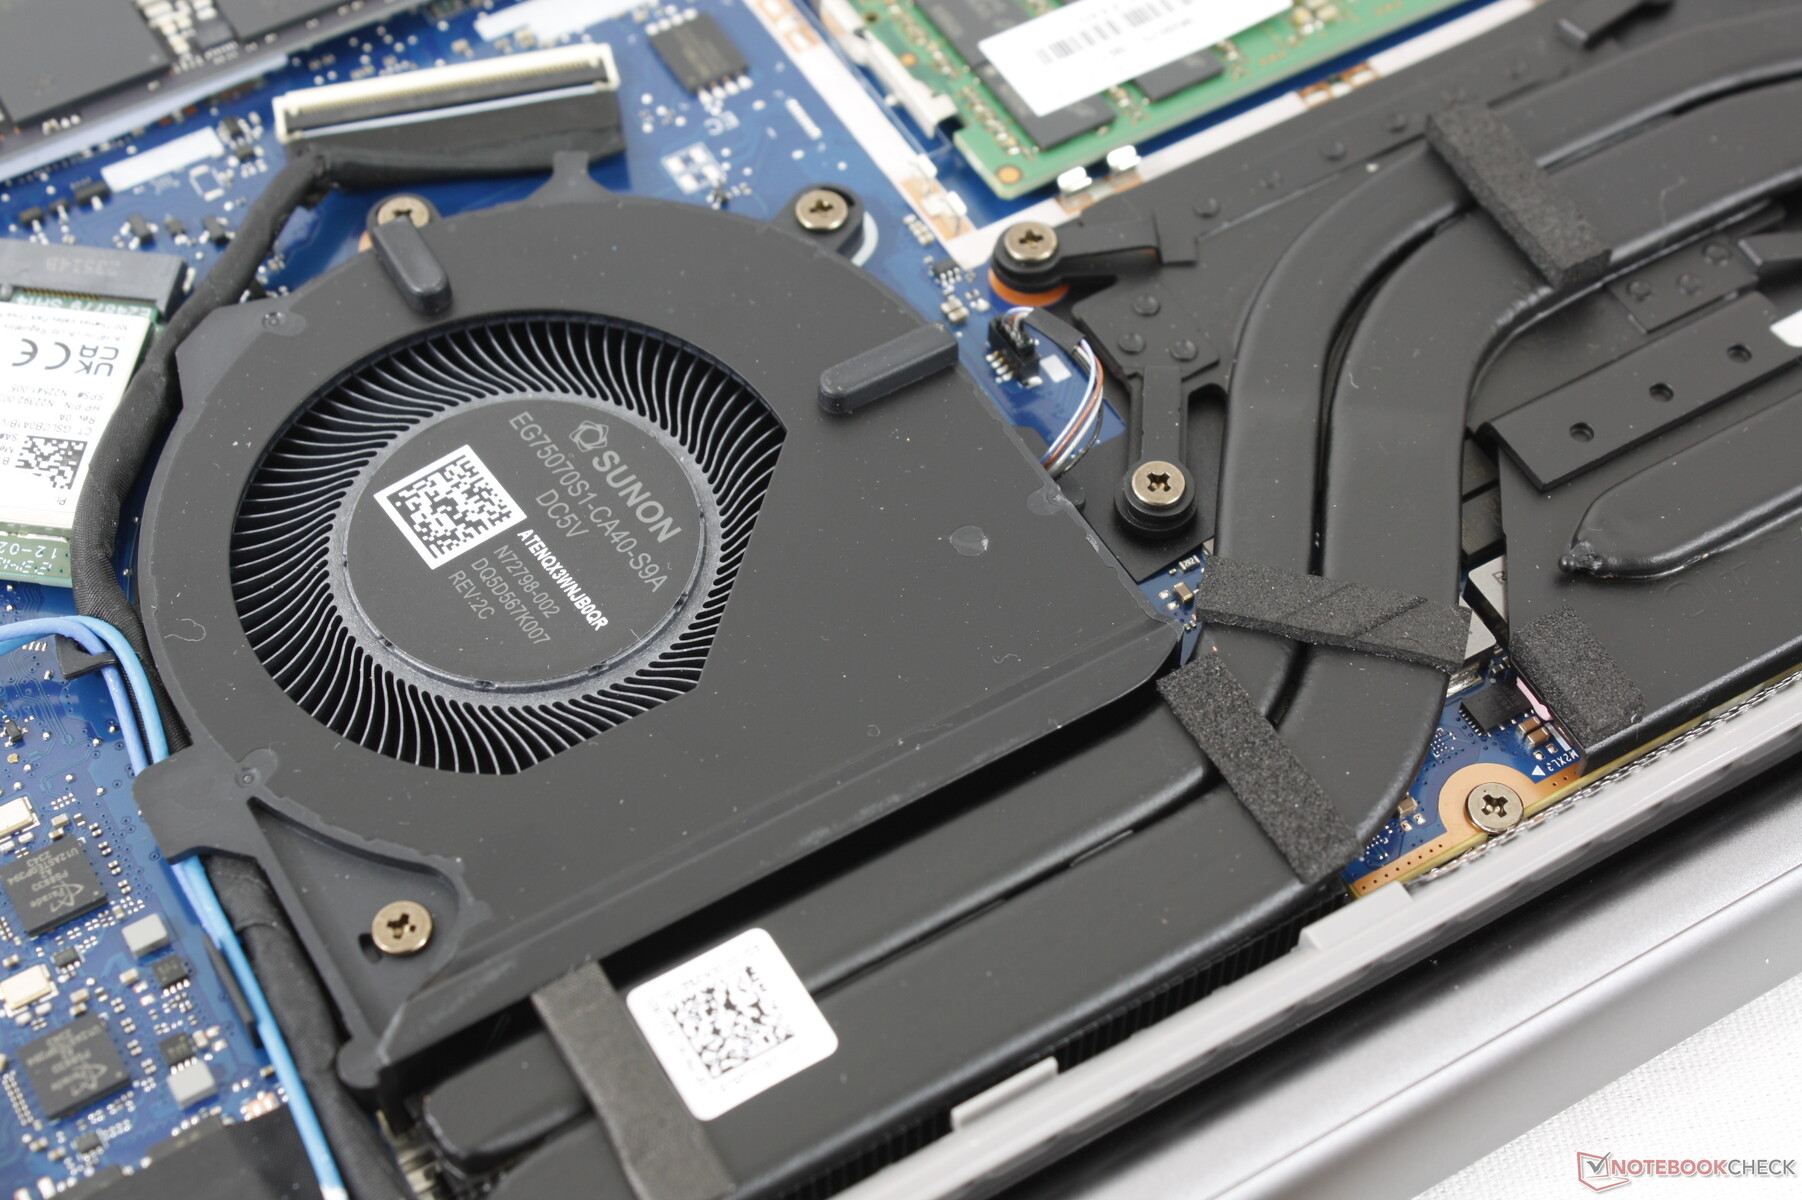
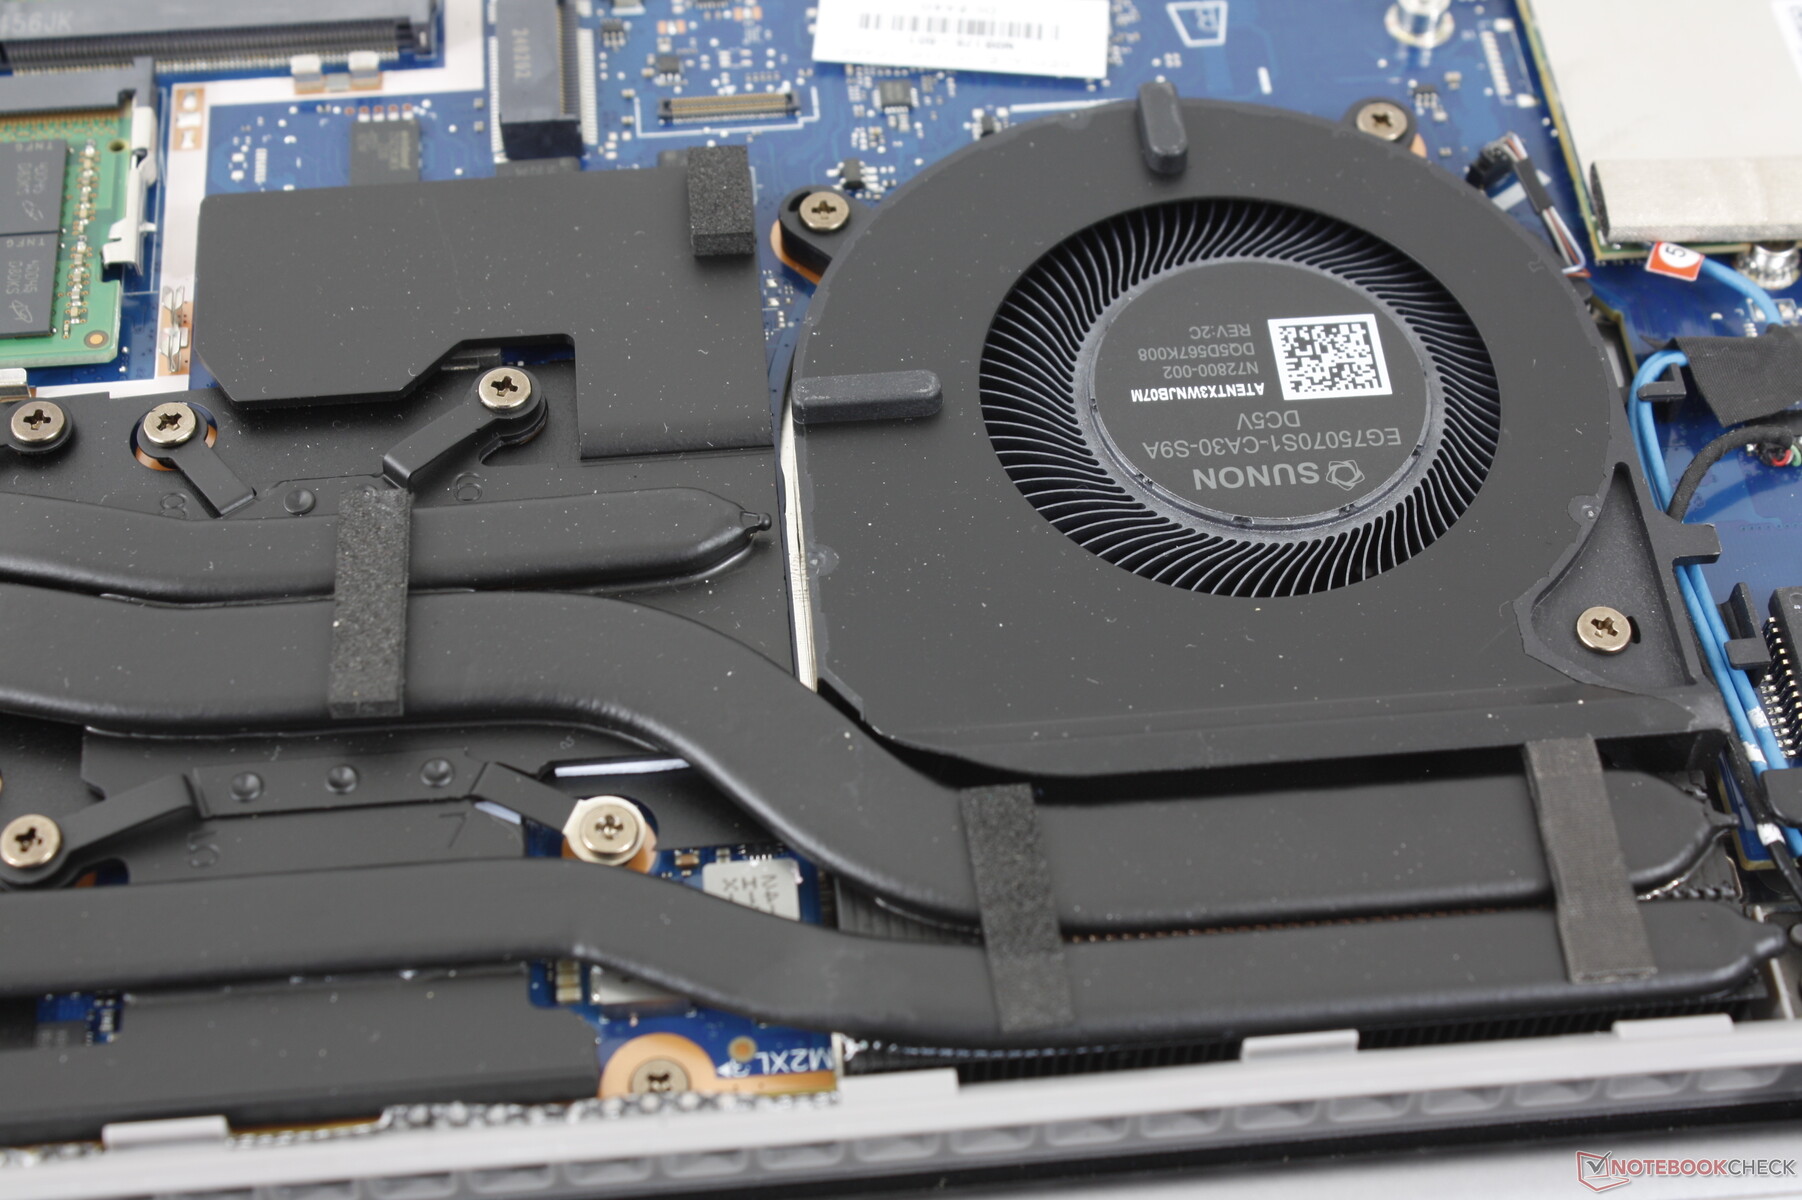
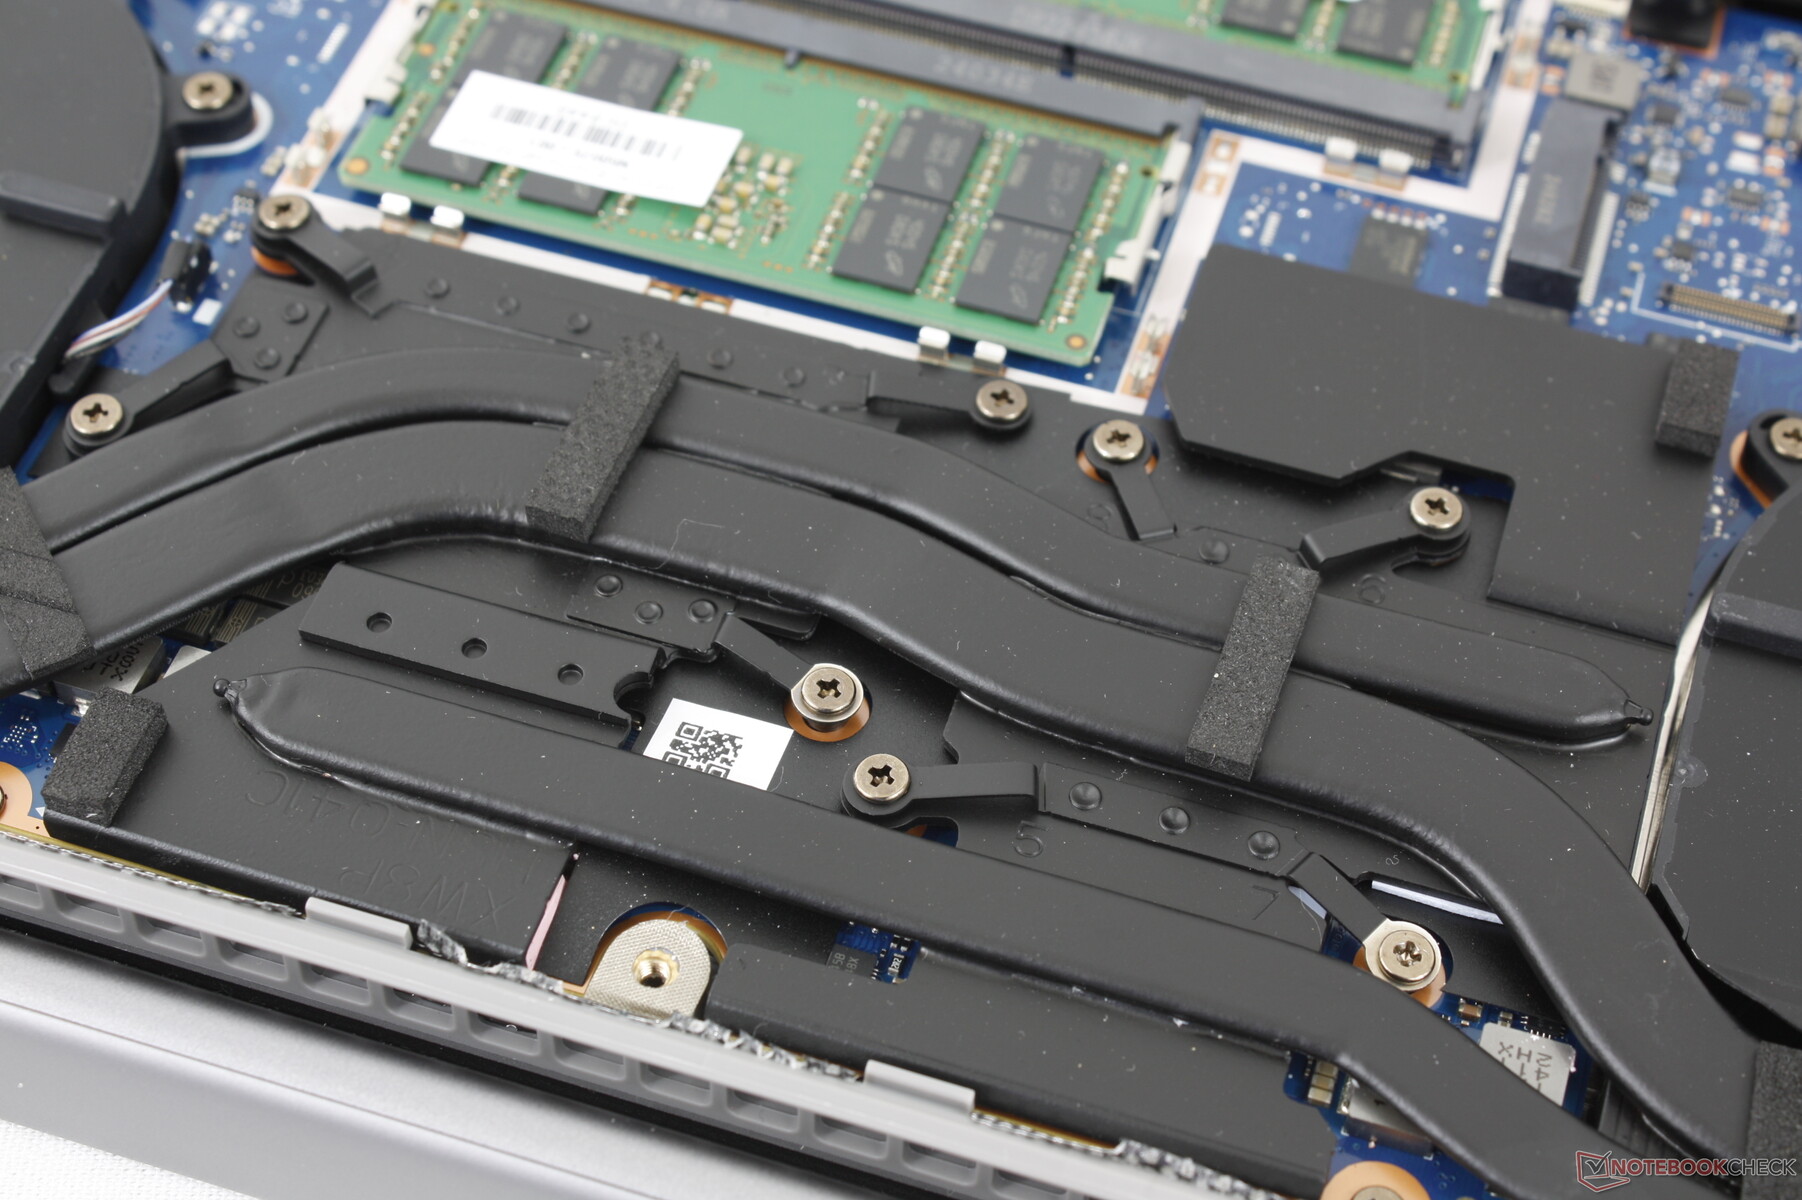
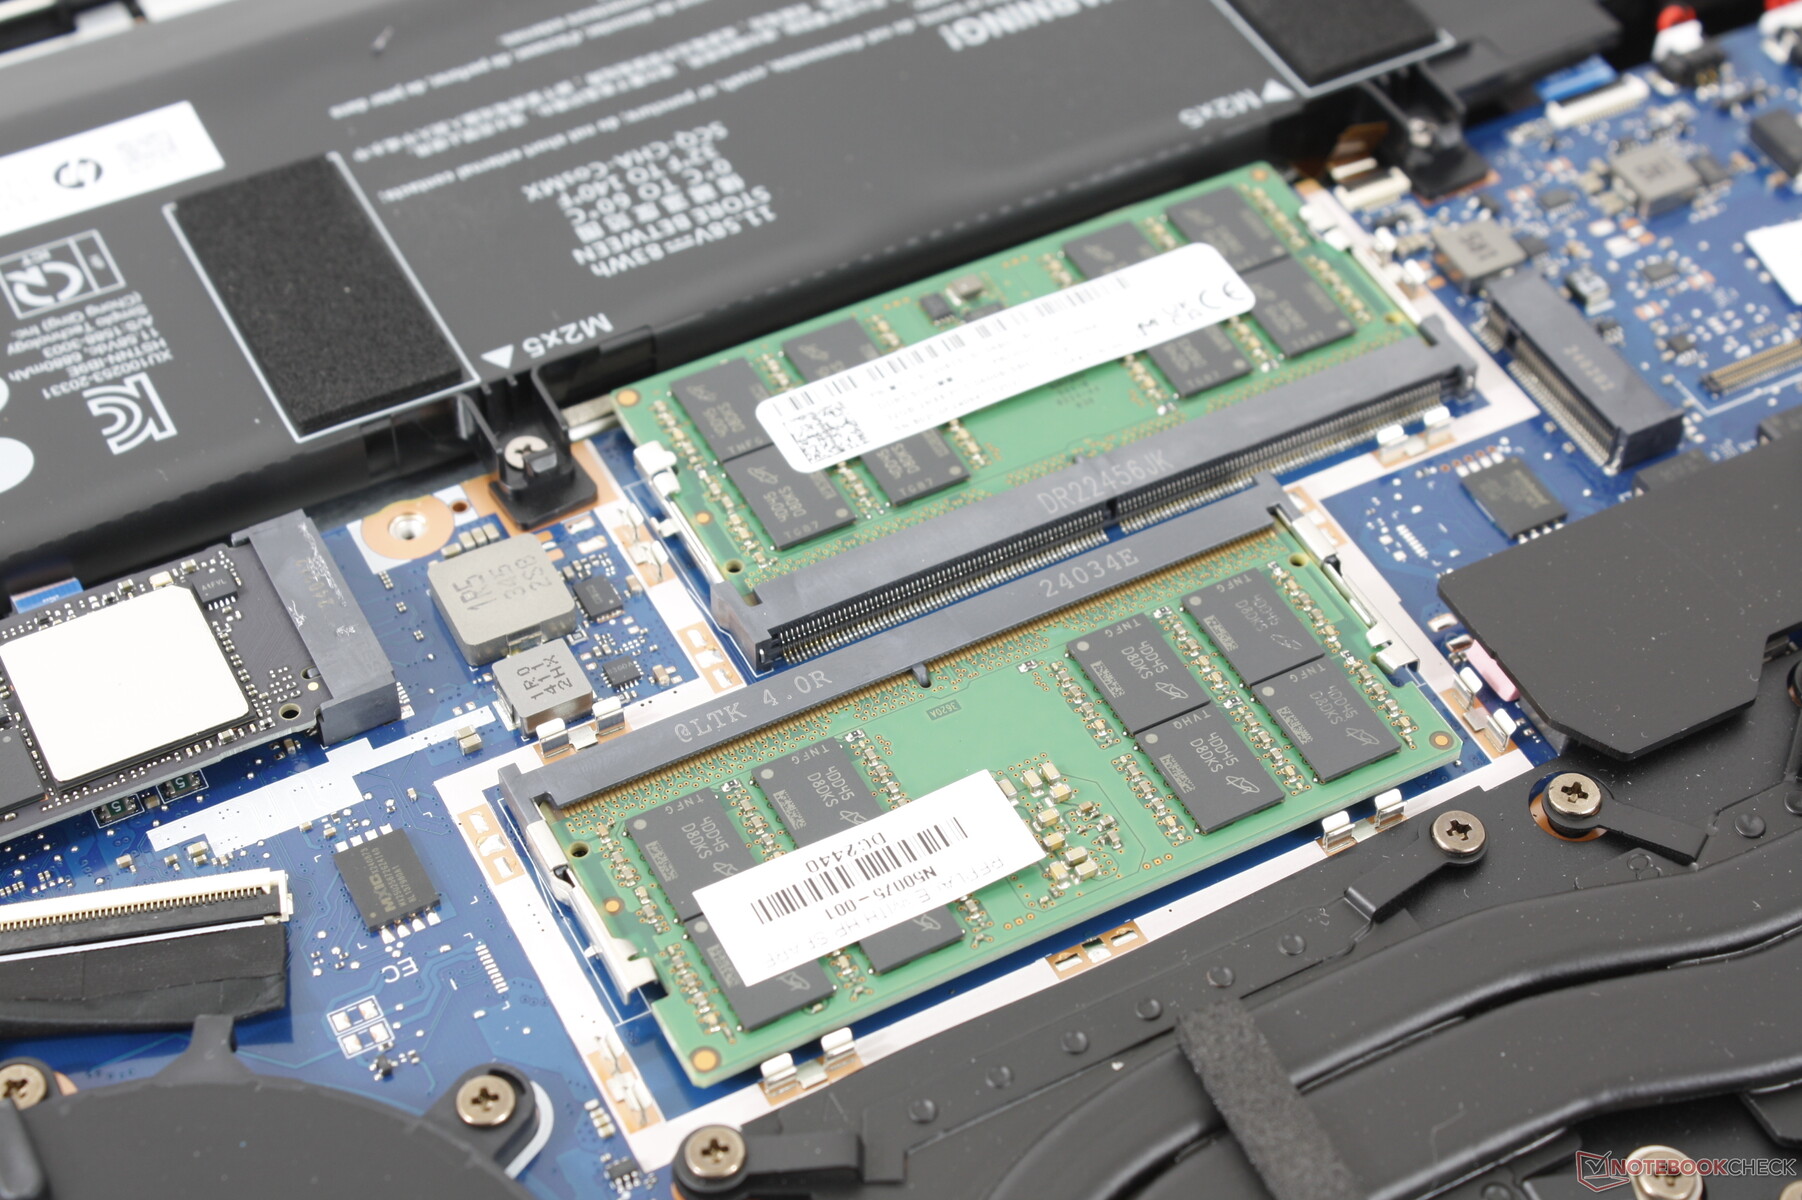
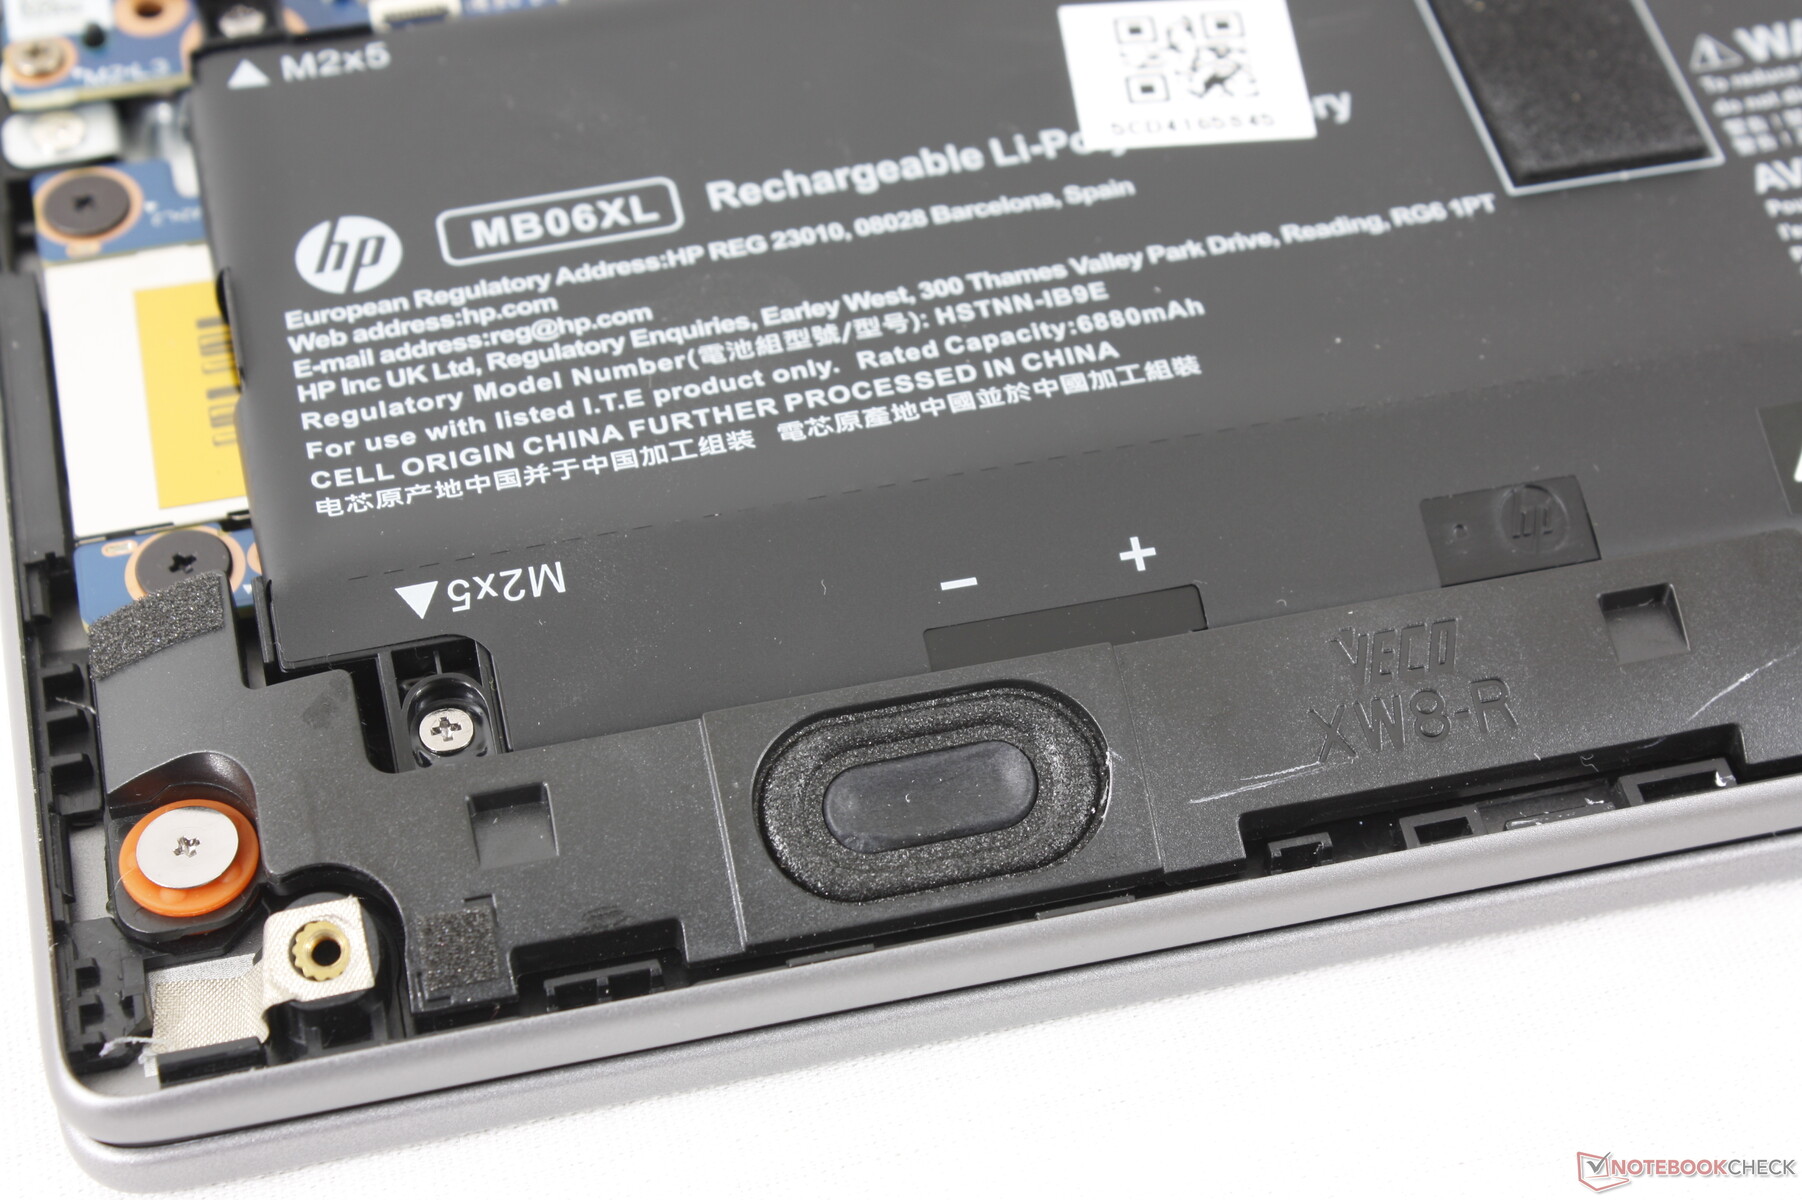
Underhåll
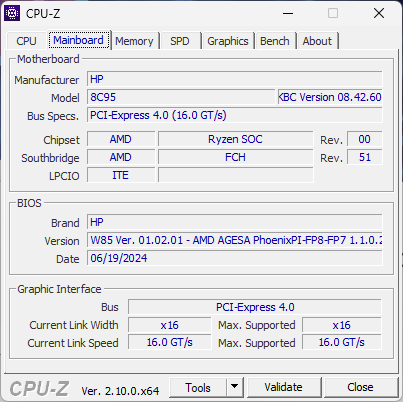
Bottenpanelen lossnar relativt enkelt med bara en stjärnskruvmejsel och en vass kant. Interndelarna har fått en helt ny design jämfört med ZBook Power 15 G10, samtidigt som samma uppgraderingsbara alternativ har behållits, som 2x SODIMM-platser, 2x PCIe4 x4 NVMe SSD-platser och en löstagbar WLAN-modul. WAN är ett tillagt alternativ den här gången.
Hållbarhet
Tillverkningen sker med låg halogenhalt medan förpackningen består av gjuten pappersmassa och återvunnen plast från 100 procent hållbara källor respektive 60 procent postkonsumtionskällor.
Tillbehör och garanti
Det finns inga extra tillbehör i lådan utöver nätadapter och pappersarbete. En besvikelse är att den begränsade standardgarantin endast är ett år om datorn köps i USA, medan ZBook Fury levereras med tre år som standard.
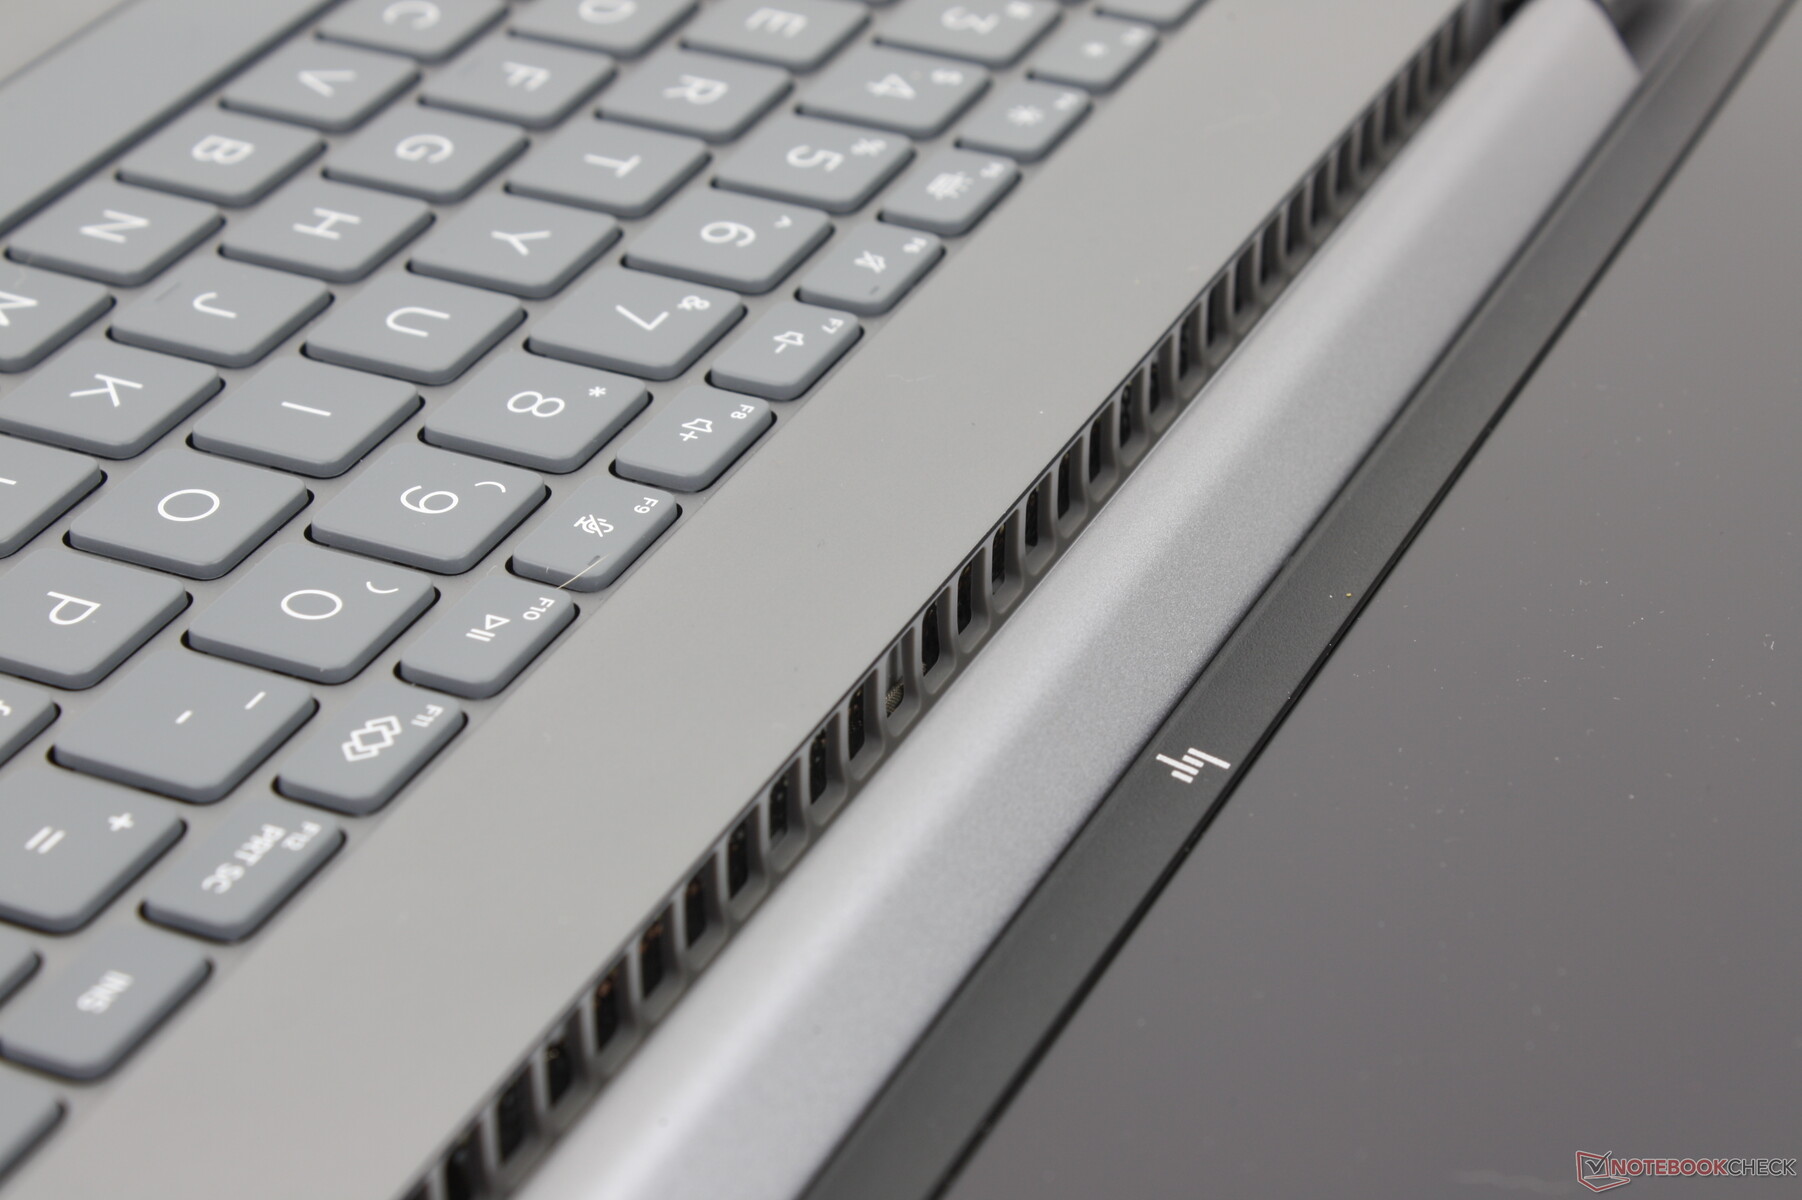
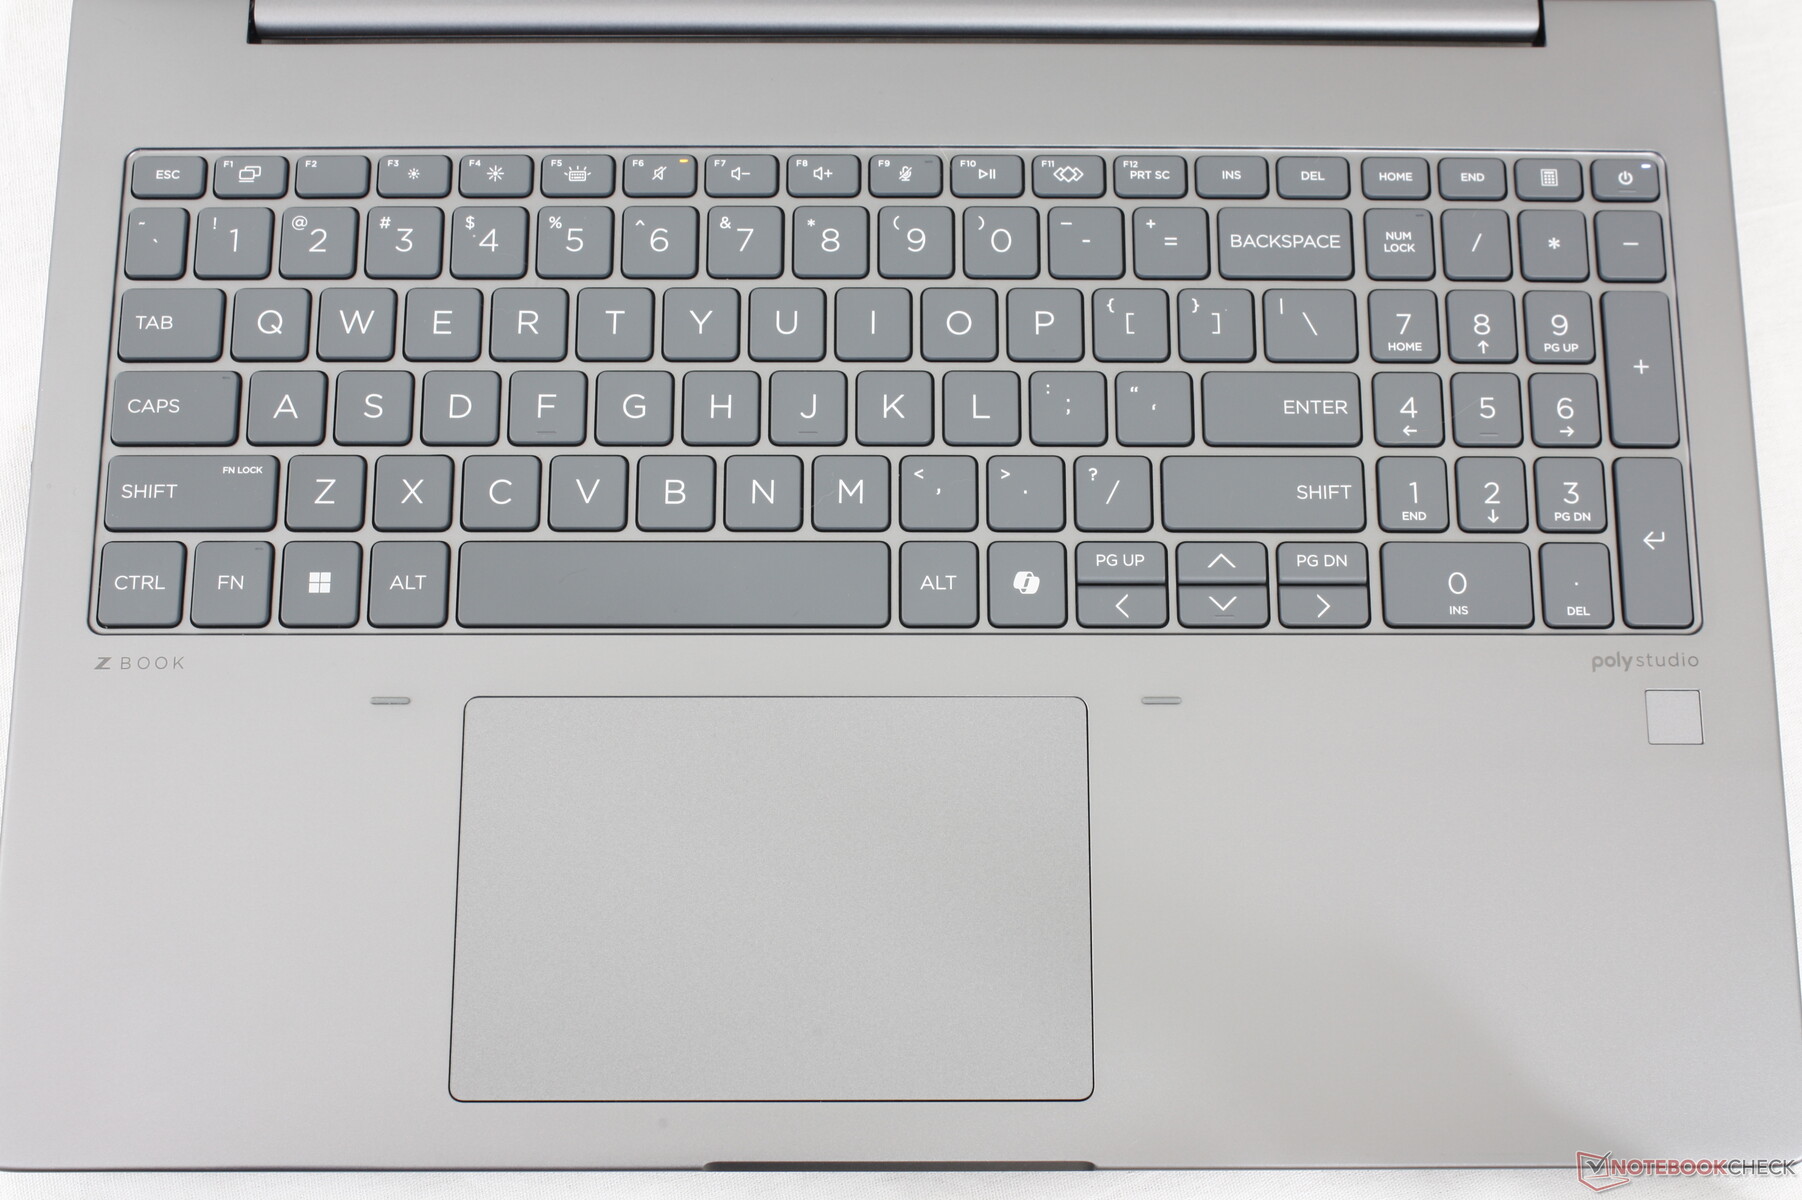
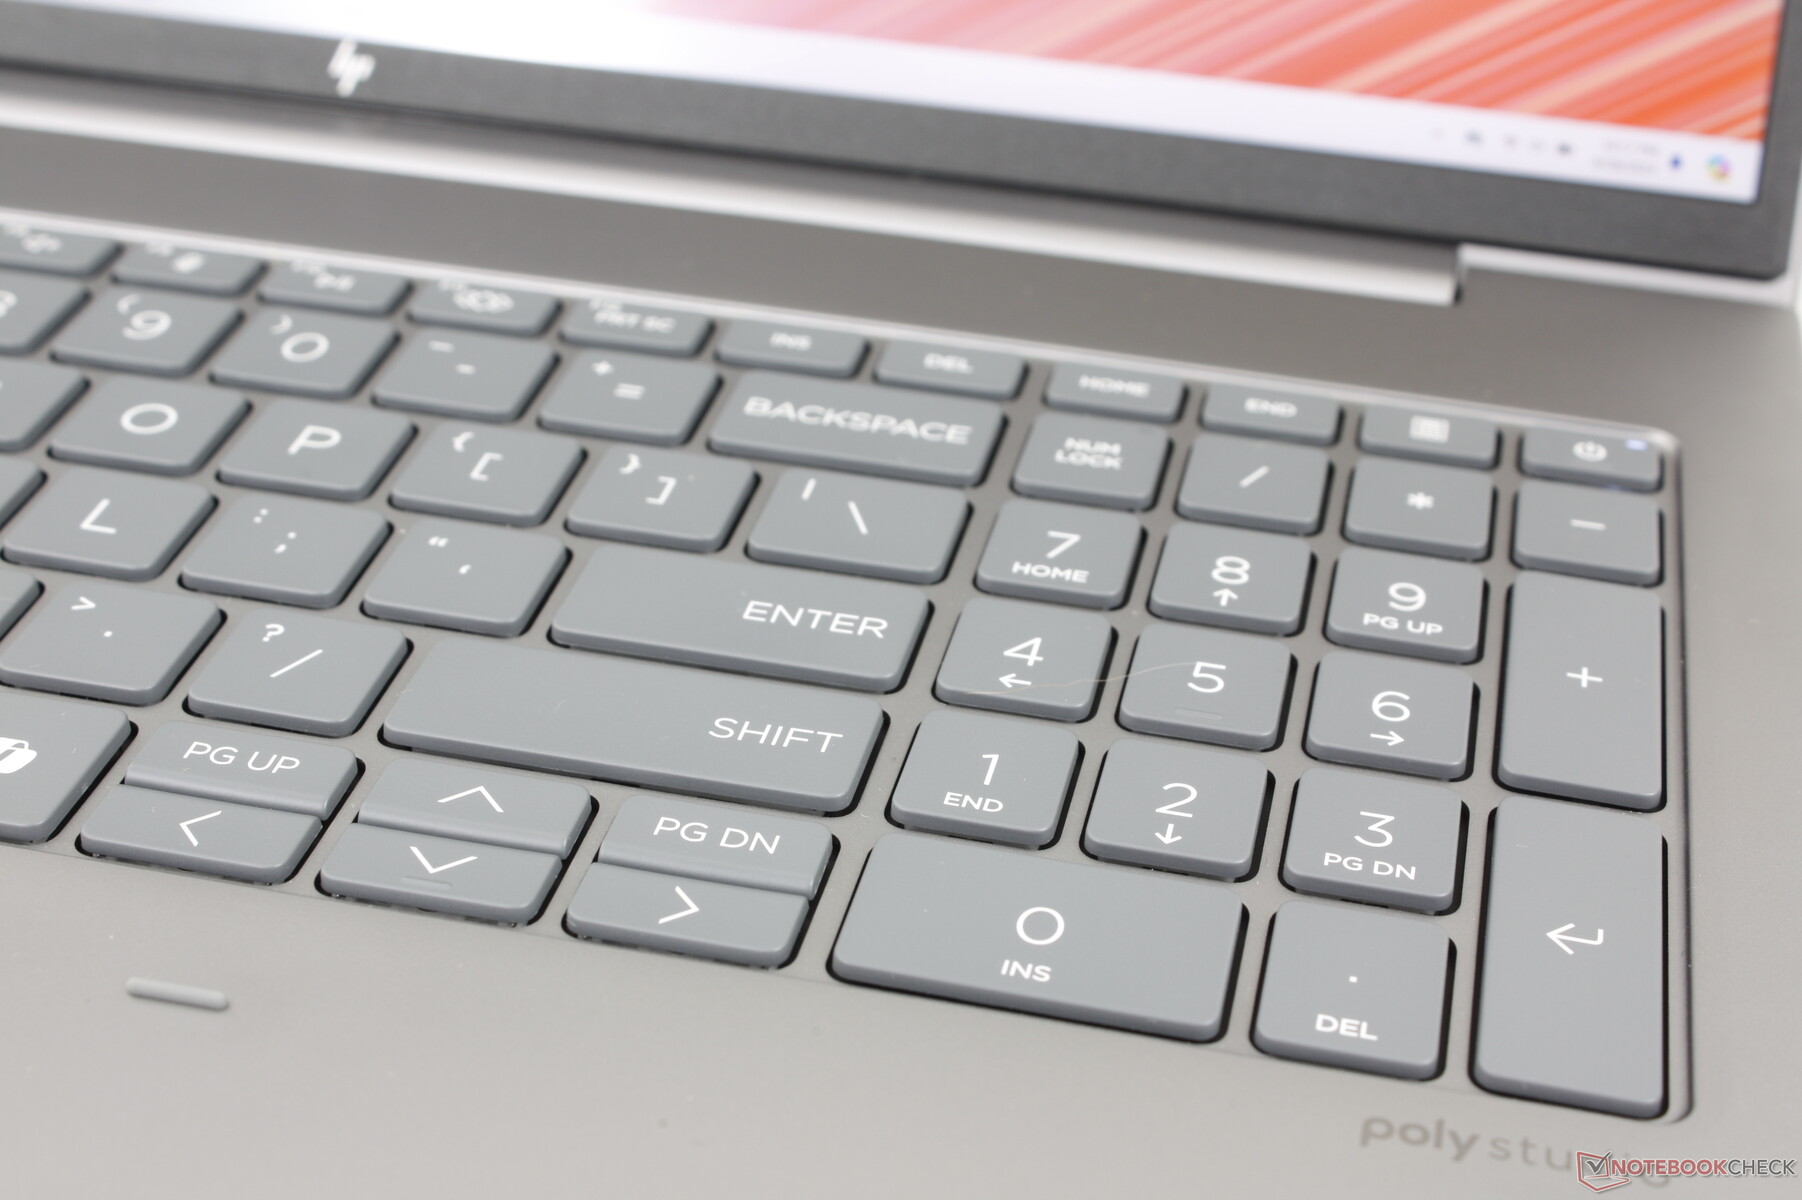
Inmatningsenheter - rymliga tangenter
Tangentbord
Skrivupplevelsen liknar den på en Spectre x360 16 genom att tangenterna är fasta med relativt skarp feedback för att vara bekväma att skriva på. Särskilt tangentrörelsen känns djupare än på de flesta Ultrabooks för att undvika den typiska grunda eller svampiga återkopplingen.
Nummerplattan har återvänt medan den saknas på den konkurrerande Precision 5690. Dess tangenter är dock något smalare än de huvudsakliga QWERTY-tangenterna, och därför är återkopplingen märkbart mjukare när man trycker på dem.
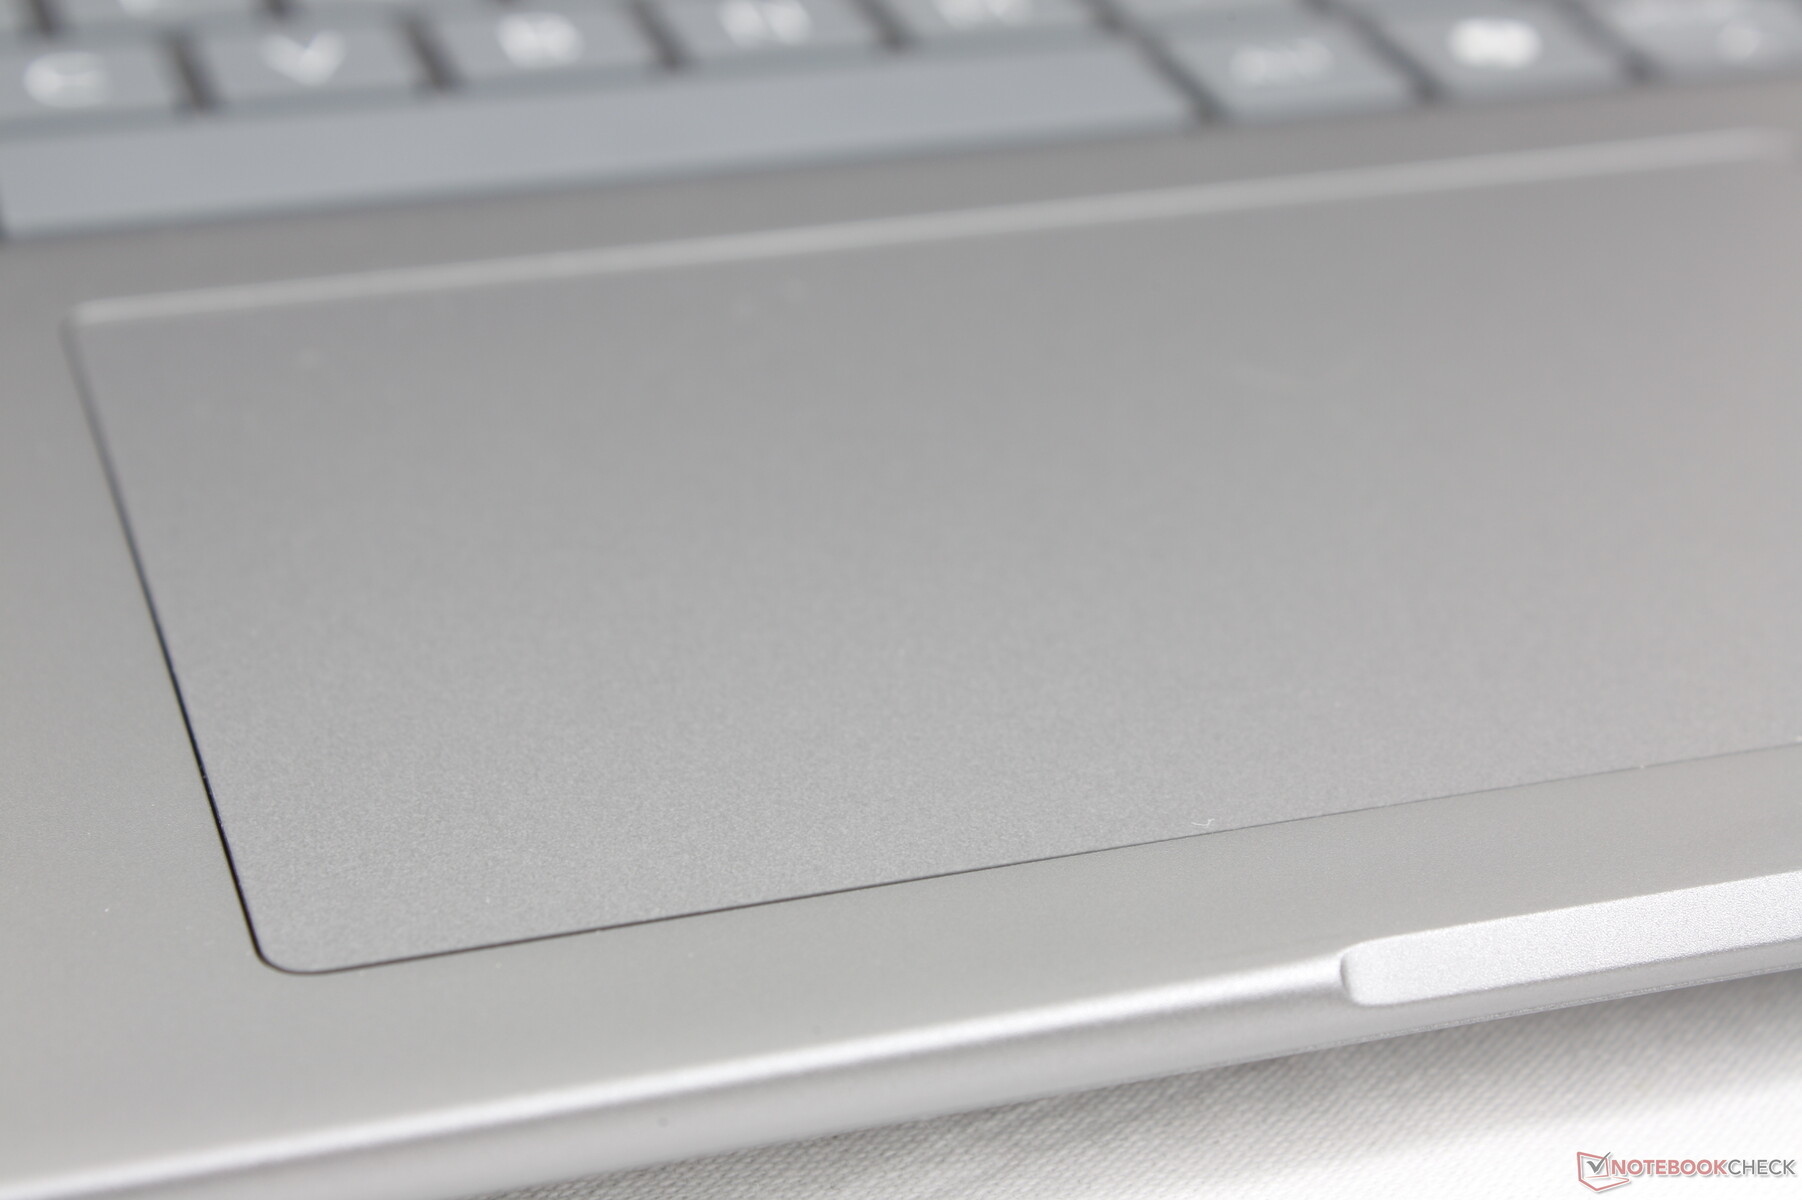
Pekplatta
Klickplattan är större än tidigare (12,5 x 8 cm jämfört med 11,5 × 7 cm) för att dra nytta av den större formfaktorn på 16 tum. Dedikerade tangenter saknas fortfarande och finns istället tillgängliga på den dyrare ZBook Fury-serien. Dragkraft och återkoppling är ändå jämn respektive klickande, vilket är mer tillförlitligt än de normalt svampigare klickplattorna på de flesta bärbara konsumentdatorer.

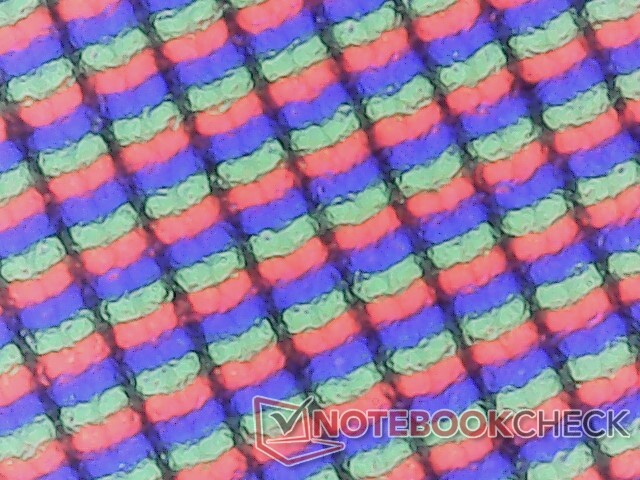
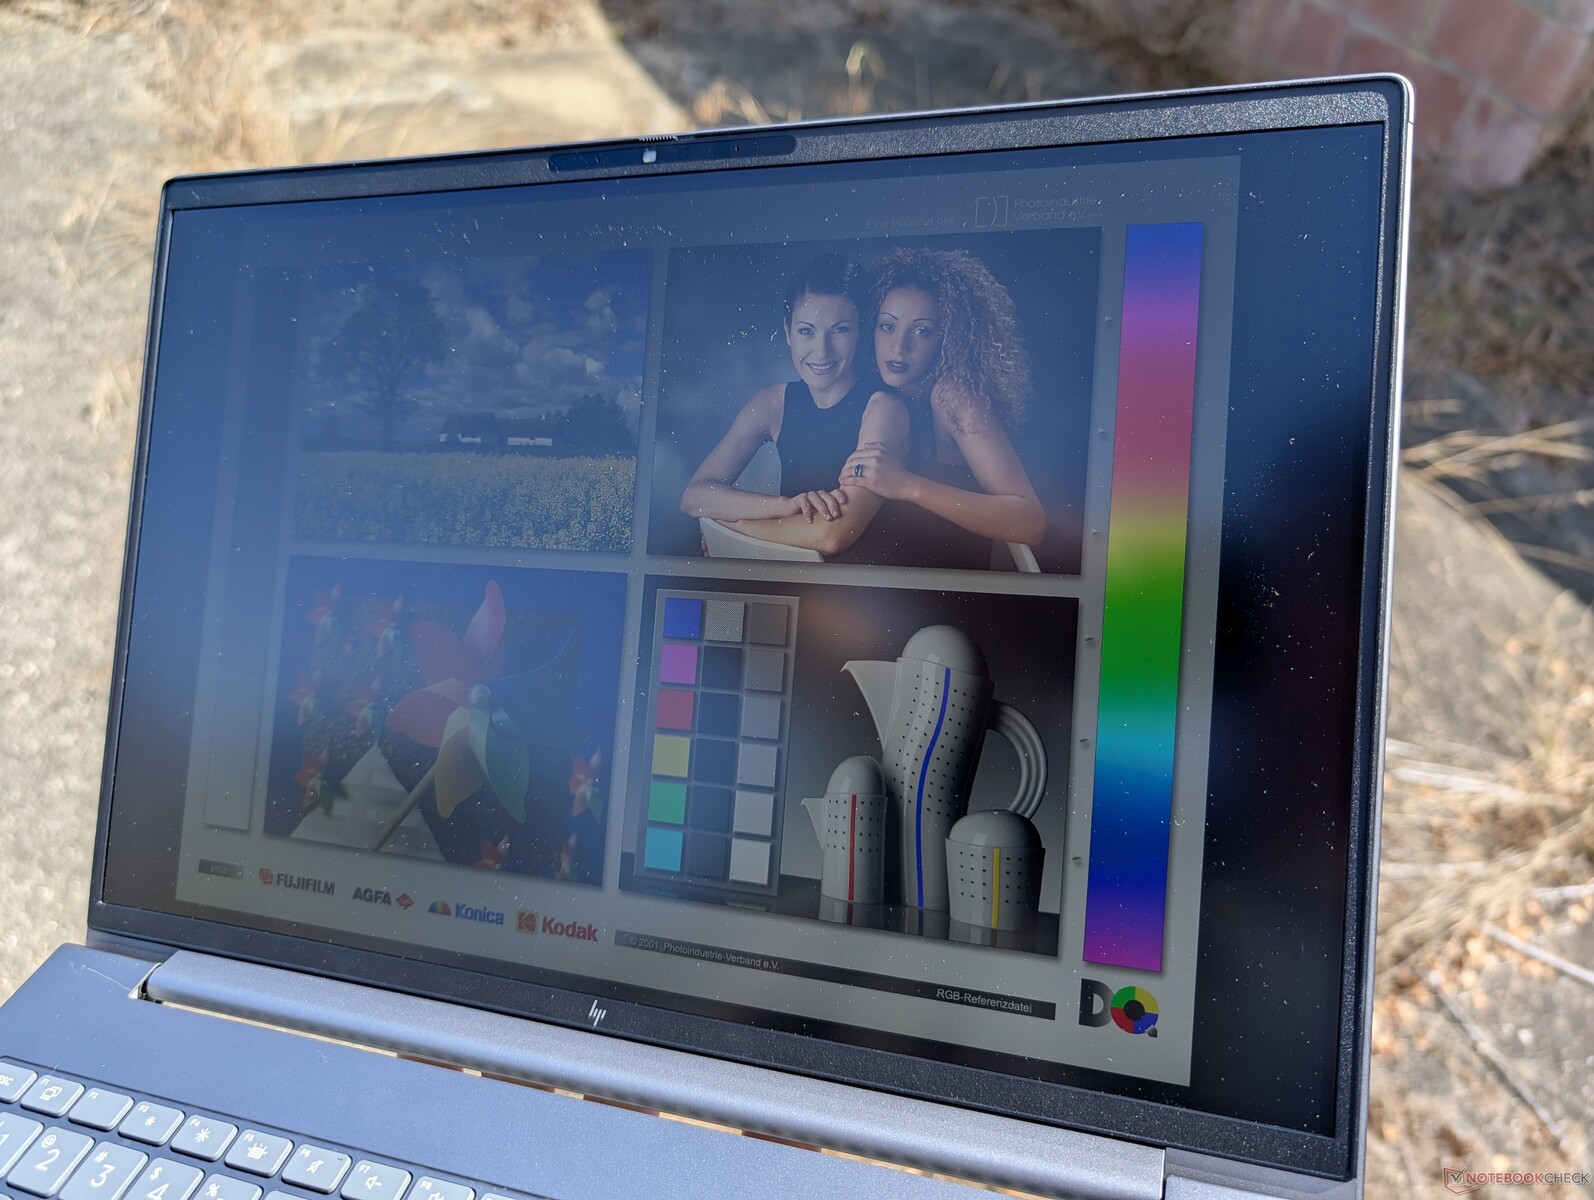
Skärm - IPS över hela linjen
Totalt fem displayalternativ finns tillgängliga enligt följande, varav alla endast är IPS. Vår konfiguration levereras med det fetmarkerade alternativet.
- 1920 x 1200, icke-touch, matt, 250 nits, 45 procent NTSC, 60 Hz
- 1920 x 1200, touch, matt, 250 nits, 45 procent NTSC, 60 Hz
- 1920 x 1200, beröringsfri, matt, 400 nits, 100 procent sRGB, 60 Hz
- 1920 x 1200, beröringsfri, matt, 1000 nits, 100 procent sRGB, HP Sure View, 60 Hz
- 2560 x 1600, beröringsfri, matt, 400 nits, 100 procent sRGB, 120 Hz
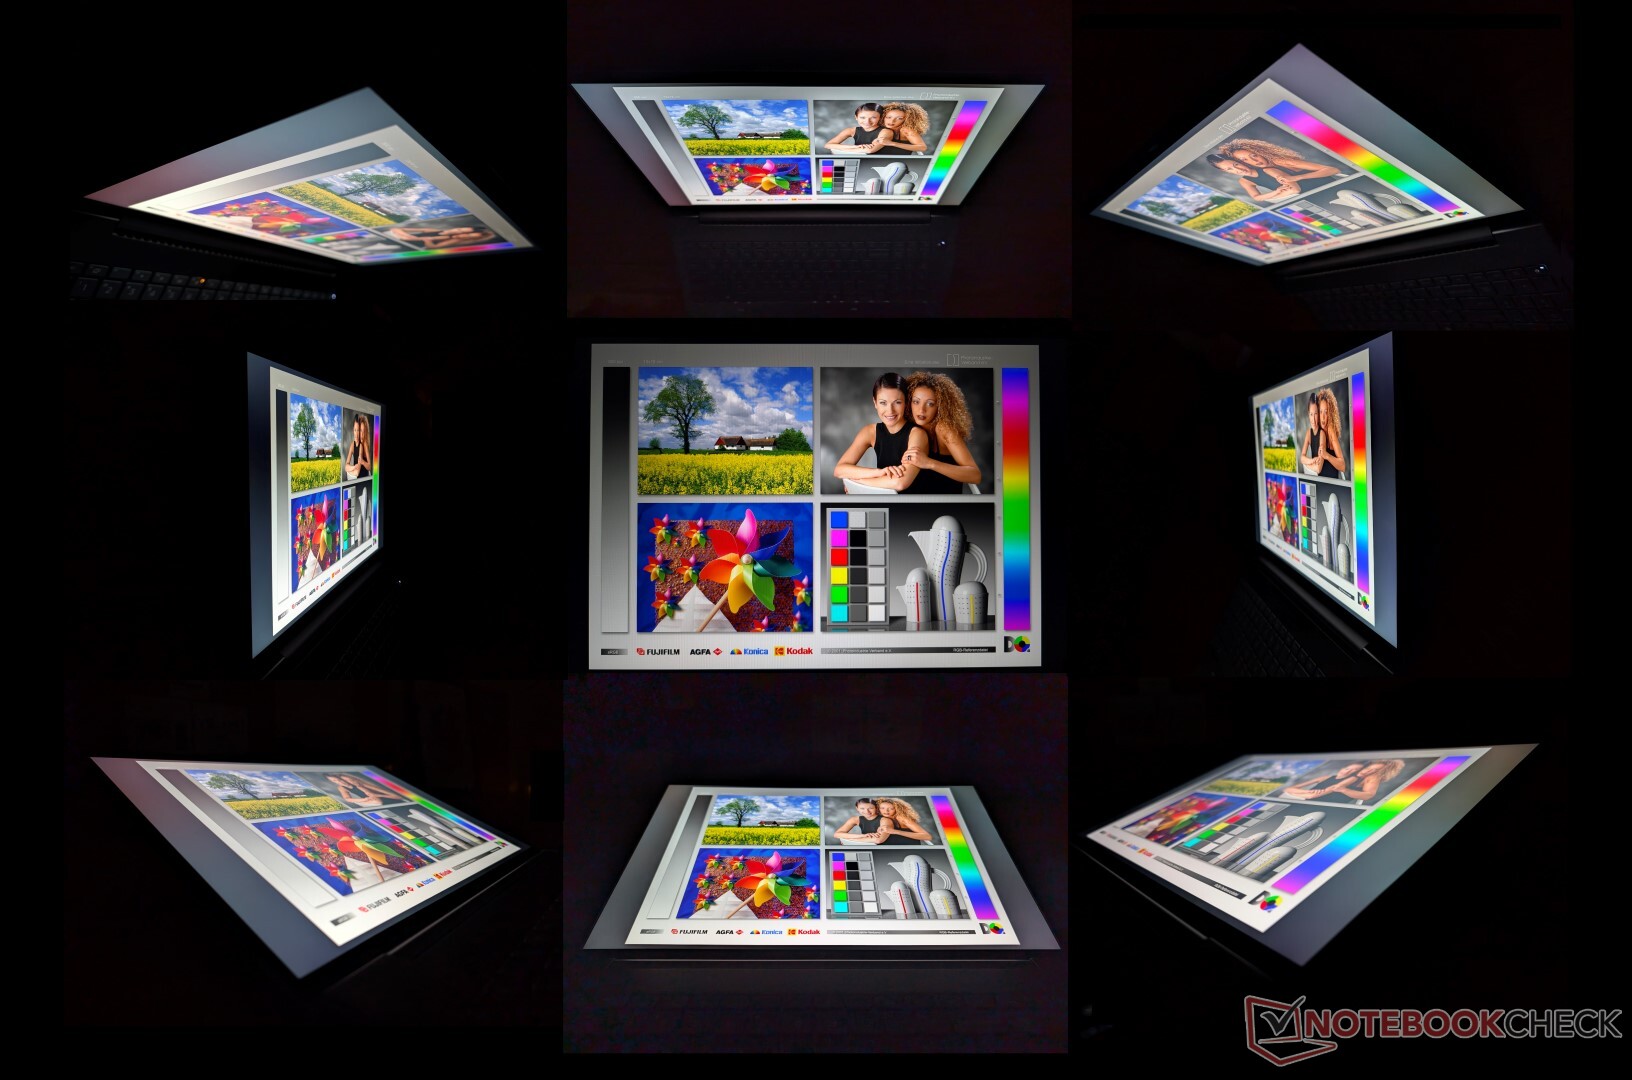
Om bildkvaliteten är ett problem bör användarna hoppa över de två första alternativen i den lägre prisklassen eftersom färgtäckningen endast skulle vara cirka 60 procent av sRGB. Den superljusstarka 1000 nit-panelen är anmärkningsvärd eftersom många andra arbetsstationer inte erbjuder denna funktion, men alternativet är tyvärr knutet till Sure View som kraftigt begränsar betraktningsvinklarna för ökad integritet. Det finns inga OLED-, HDR- eller P3-alternativ att tala om, vilket är något av en besvikelse för en arbetsstation med hög prestanda. Användare skulle behöva uppgradera till HP ZBook Fury 16 G11 eller överväga ThinkPad P16s G2 för sådana funktioner.

| |||||||||||||||||||||||||
Distribution av ljusstyrkan: 88 %
Mitt på batteriet: 470.7 cd/m²
Kontrast: 826:1 (Svärta: 0.57 cd/m²)
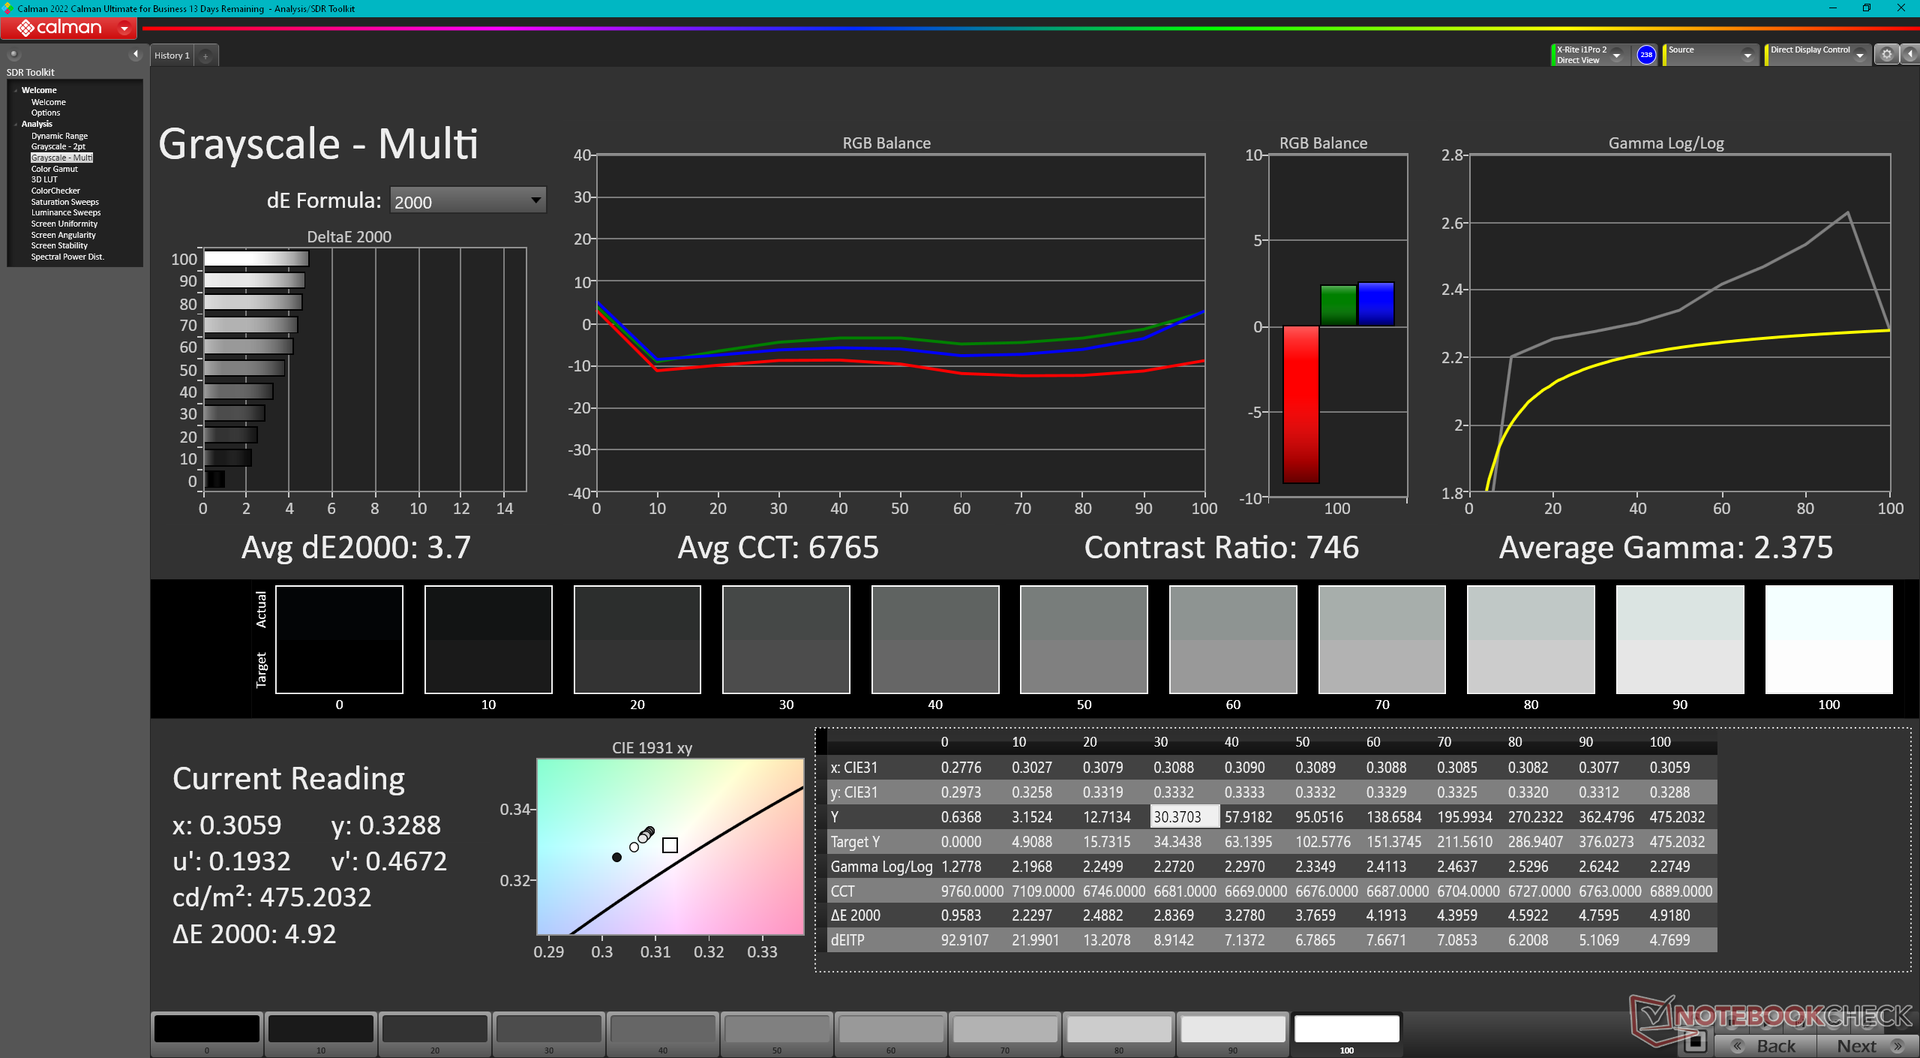
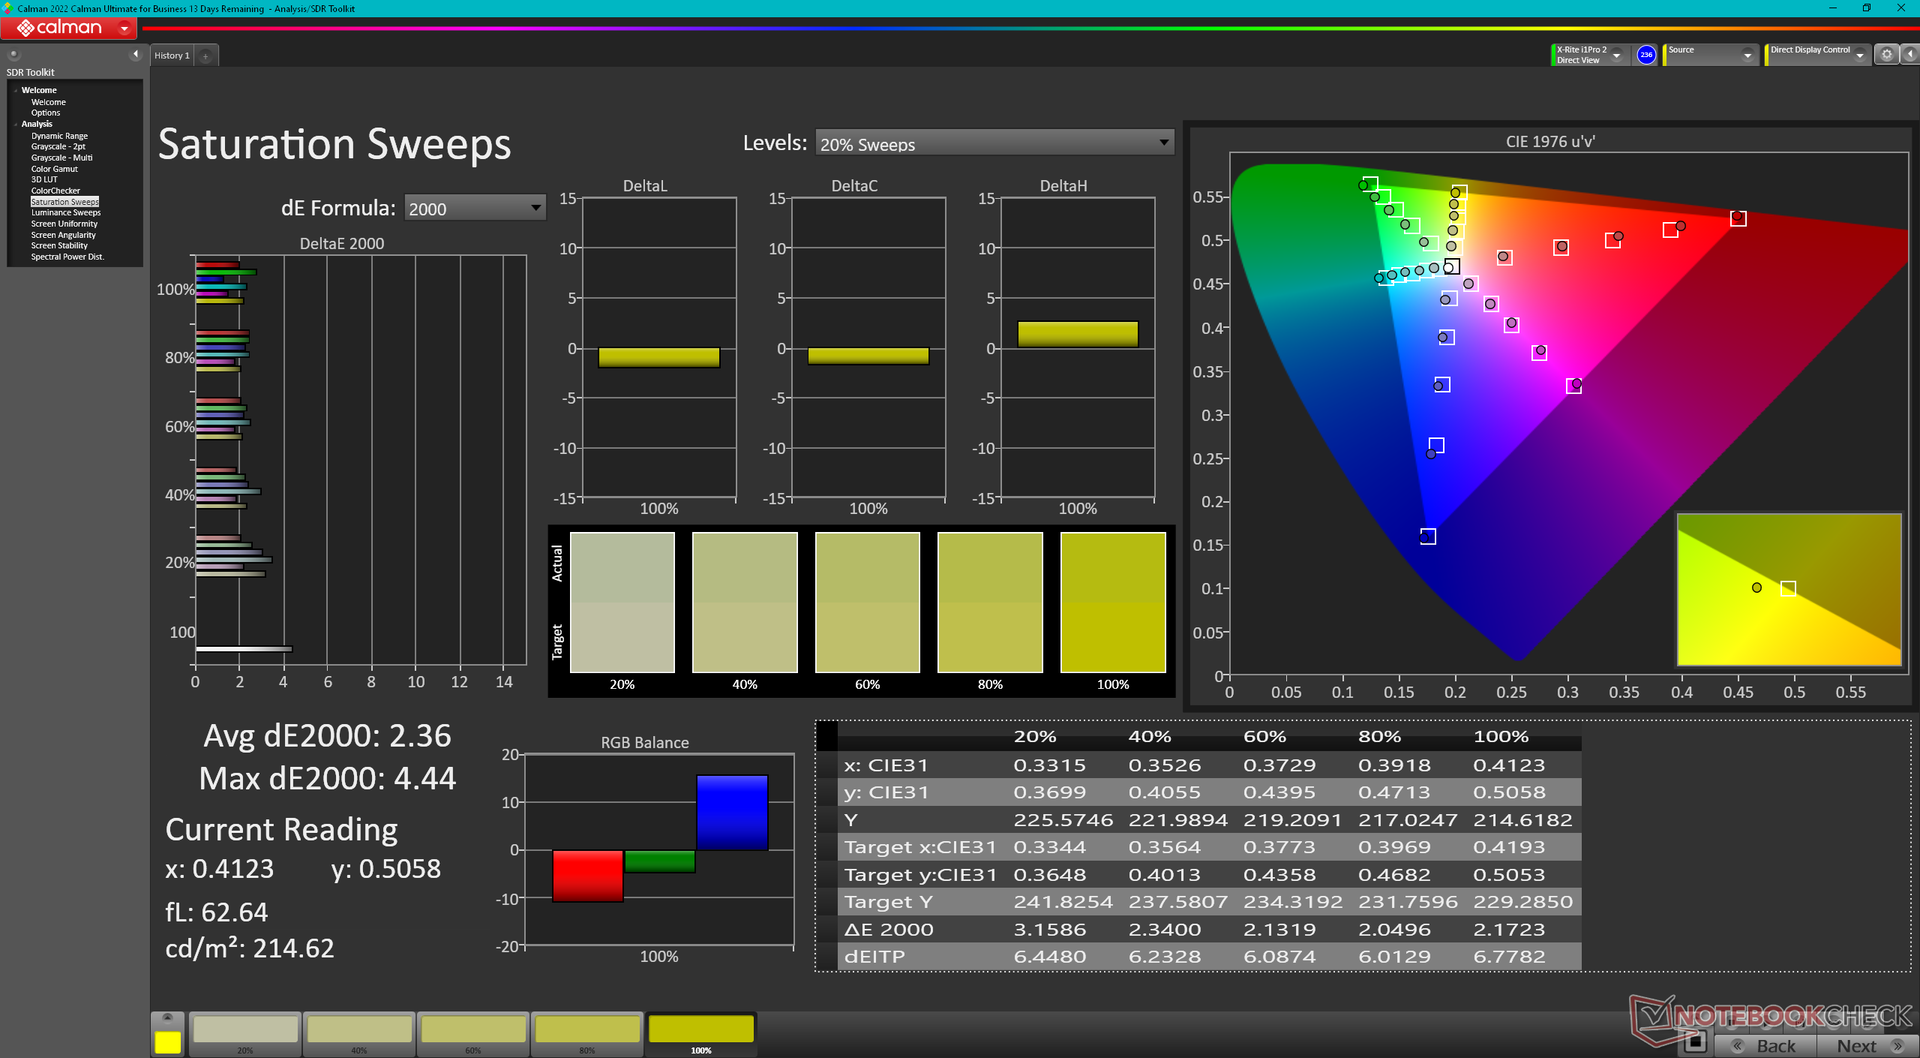
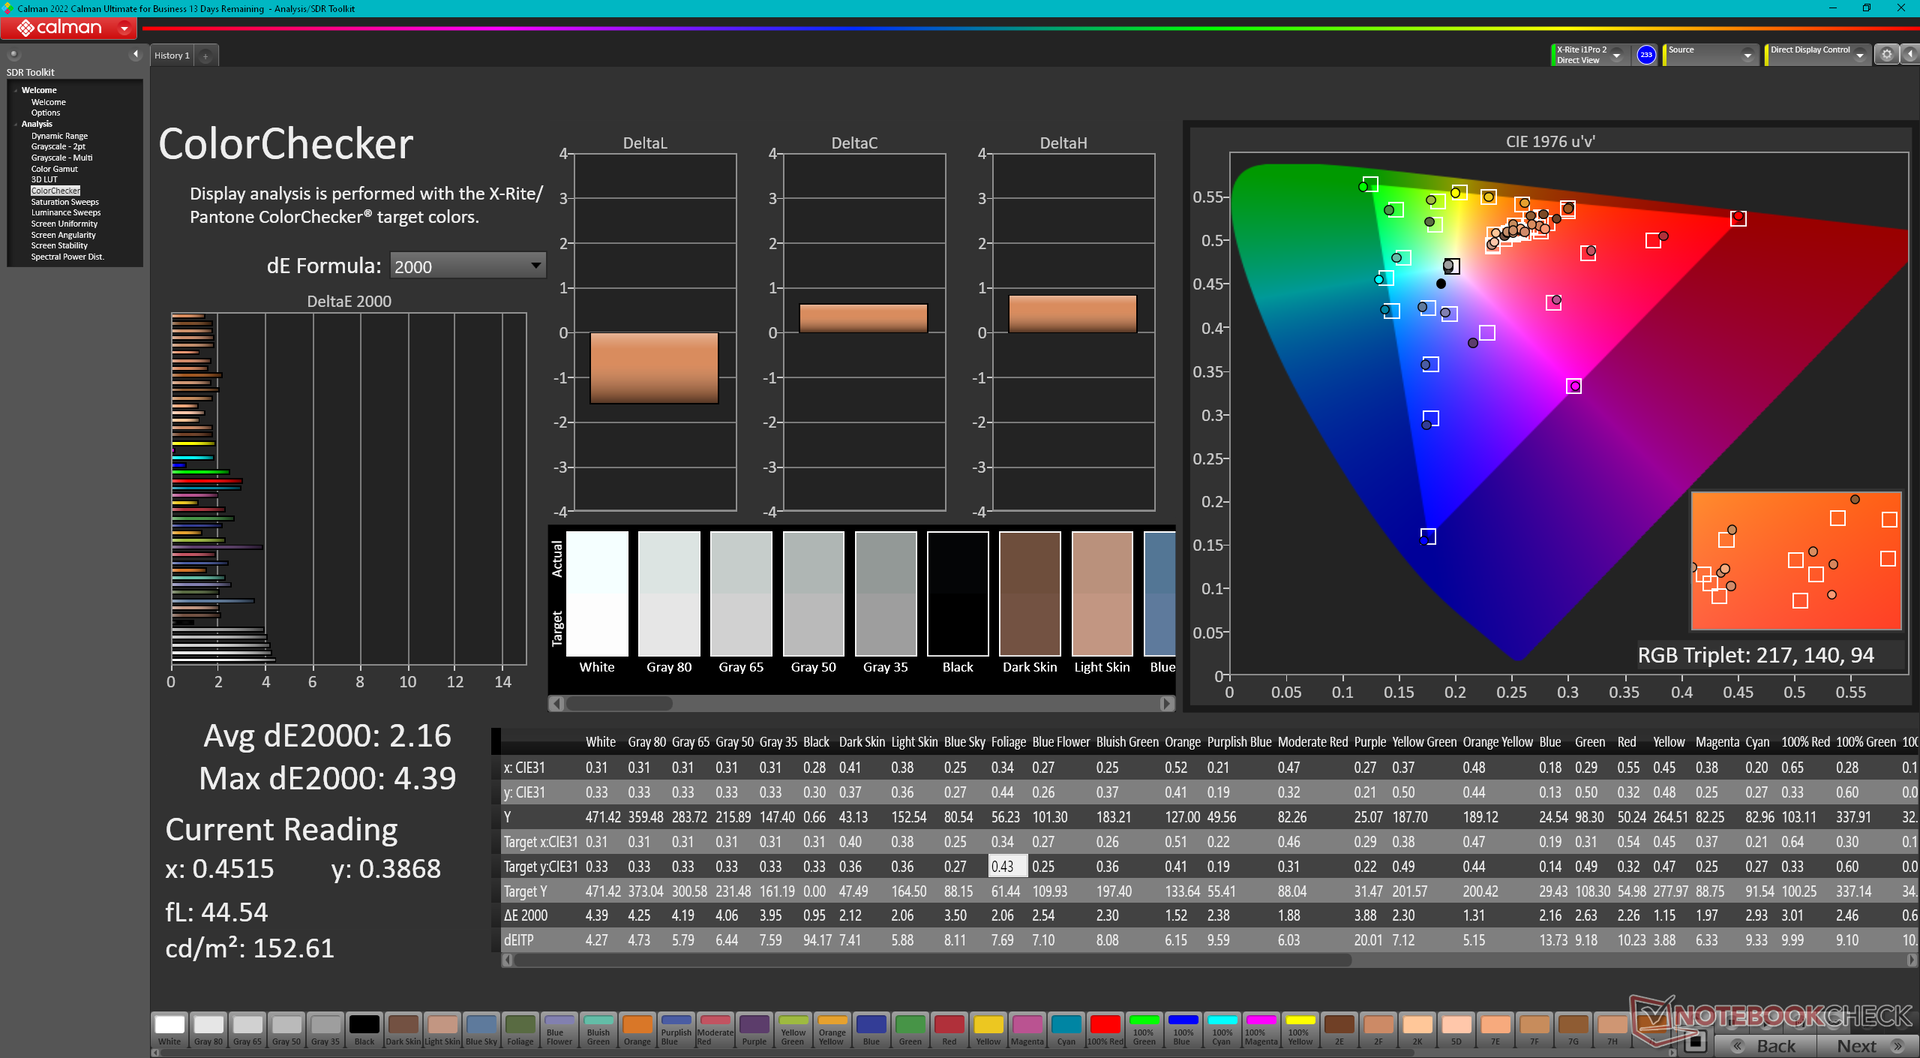
ΔE Color 2.16 | 0.5-29.43 Ø4.87, calibrated: 1.37
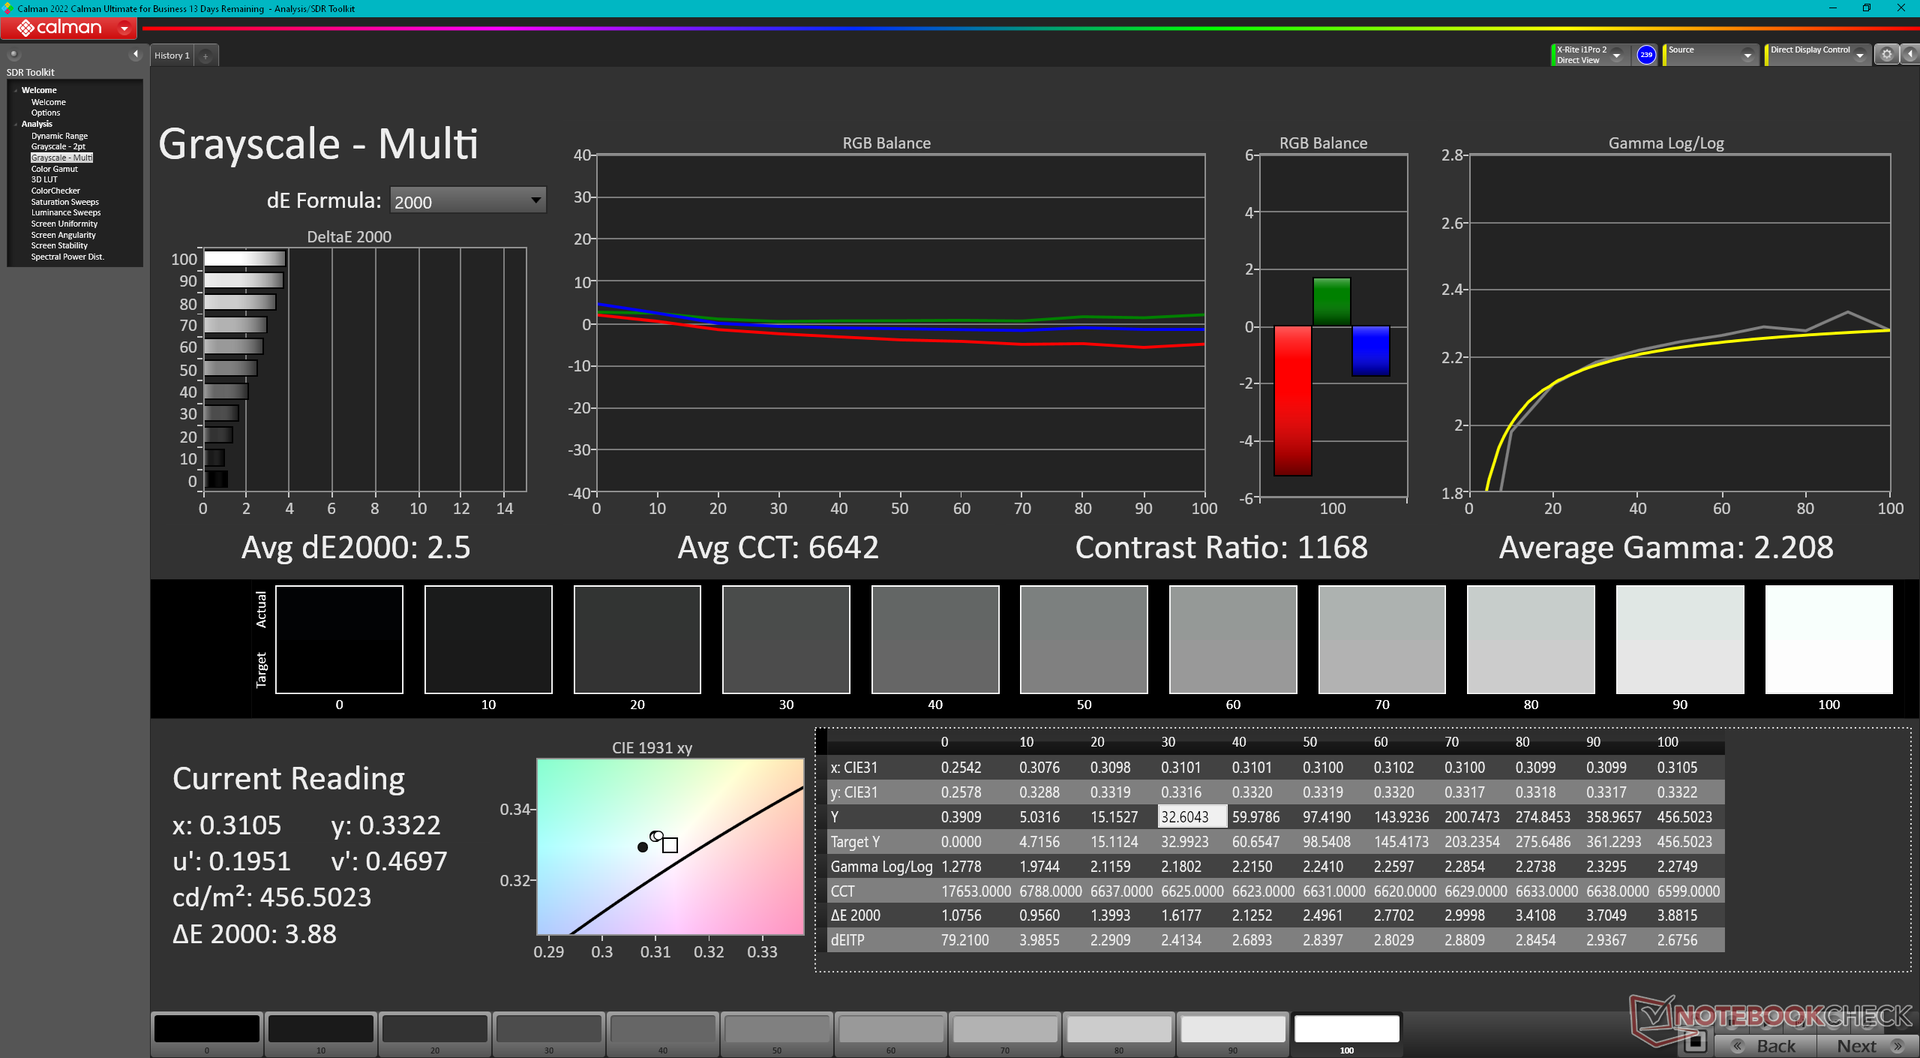
ΔE Greyscale 3.7 | 0.5-98 Ø5.1
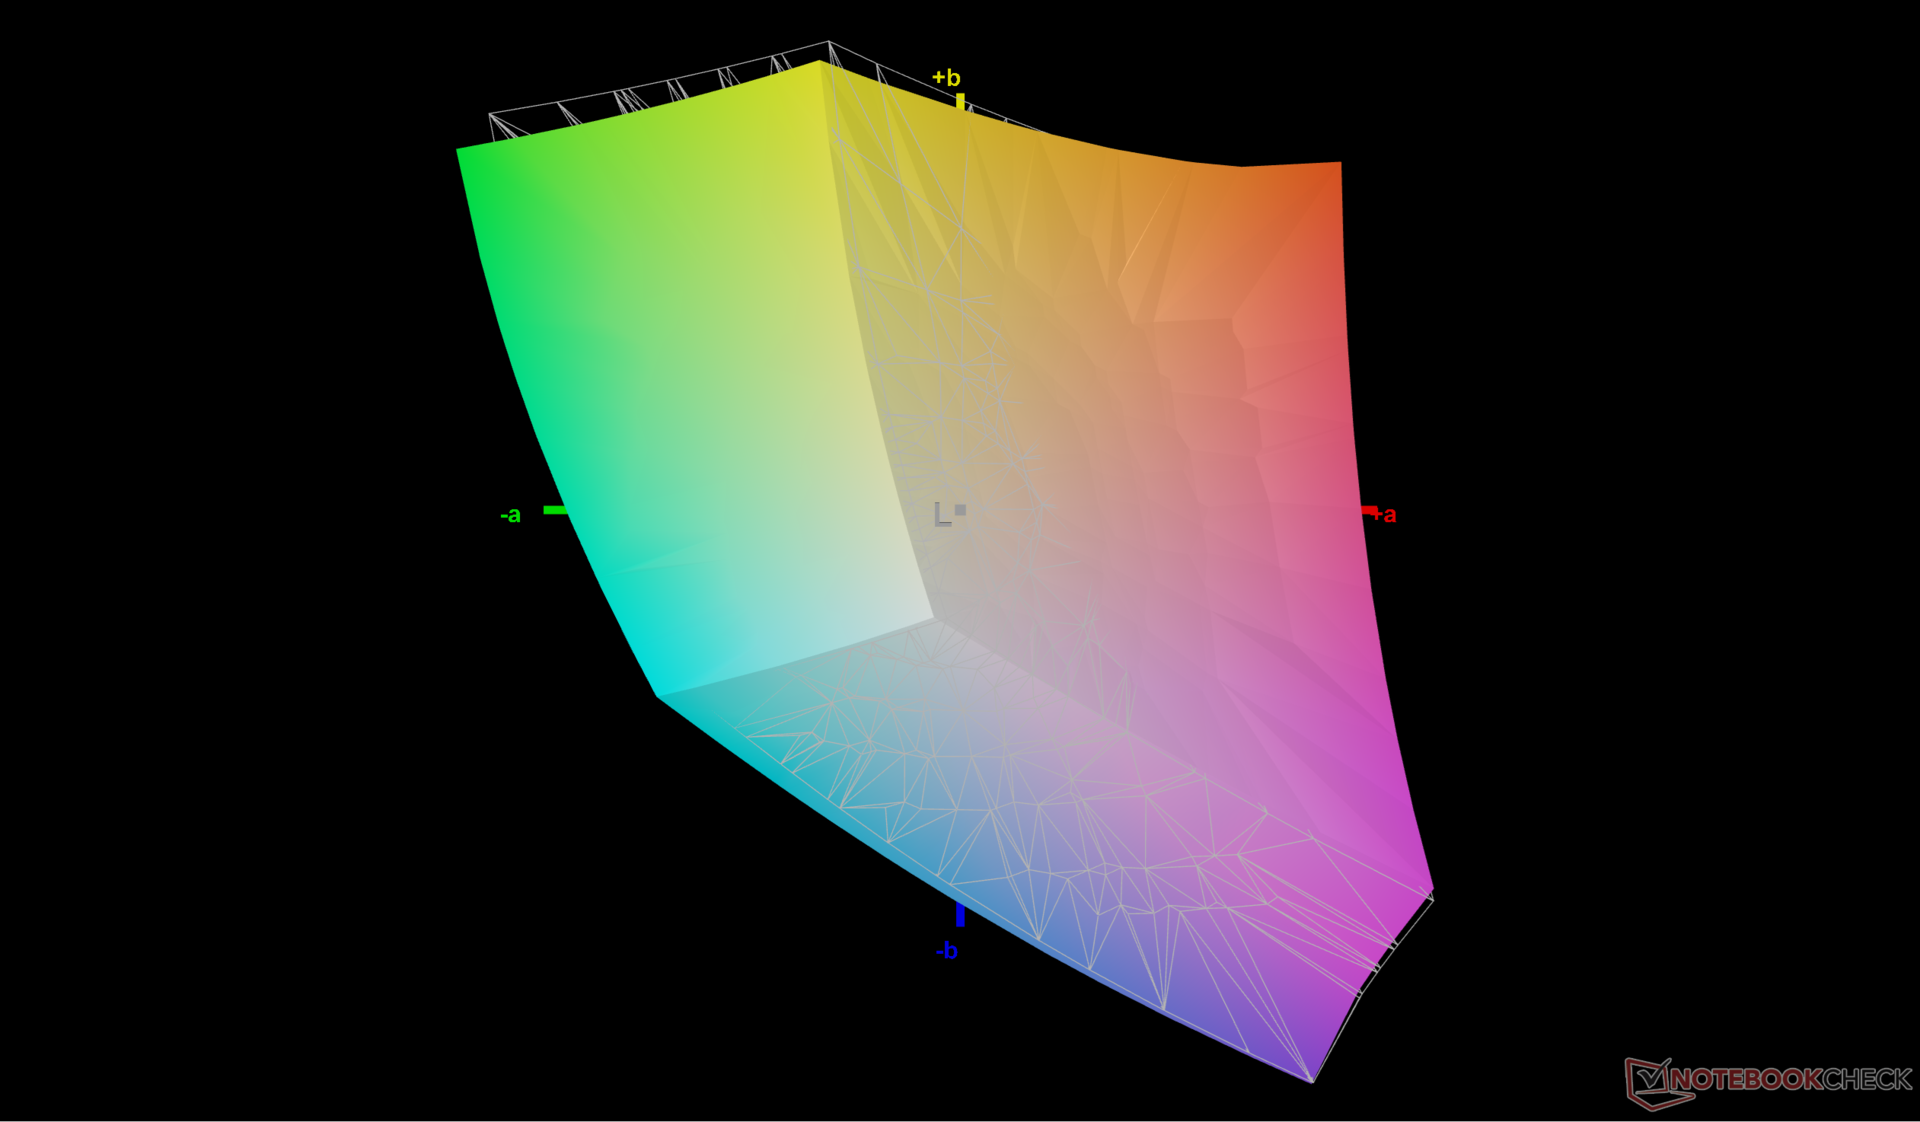
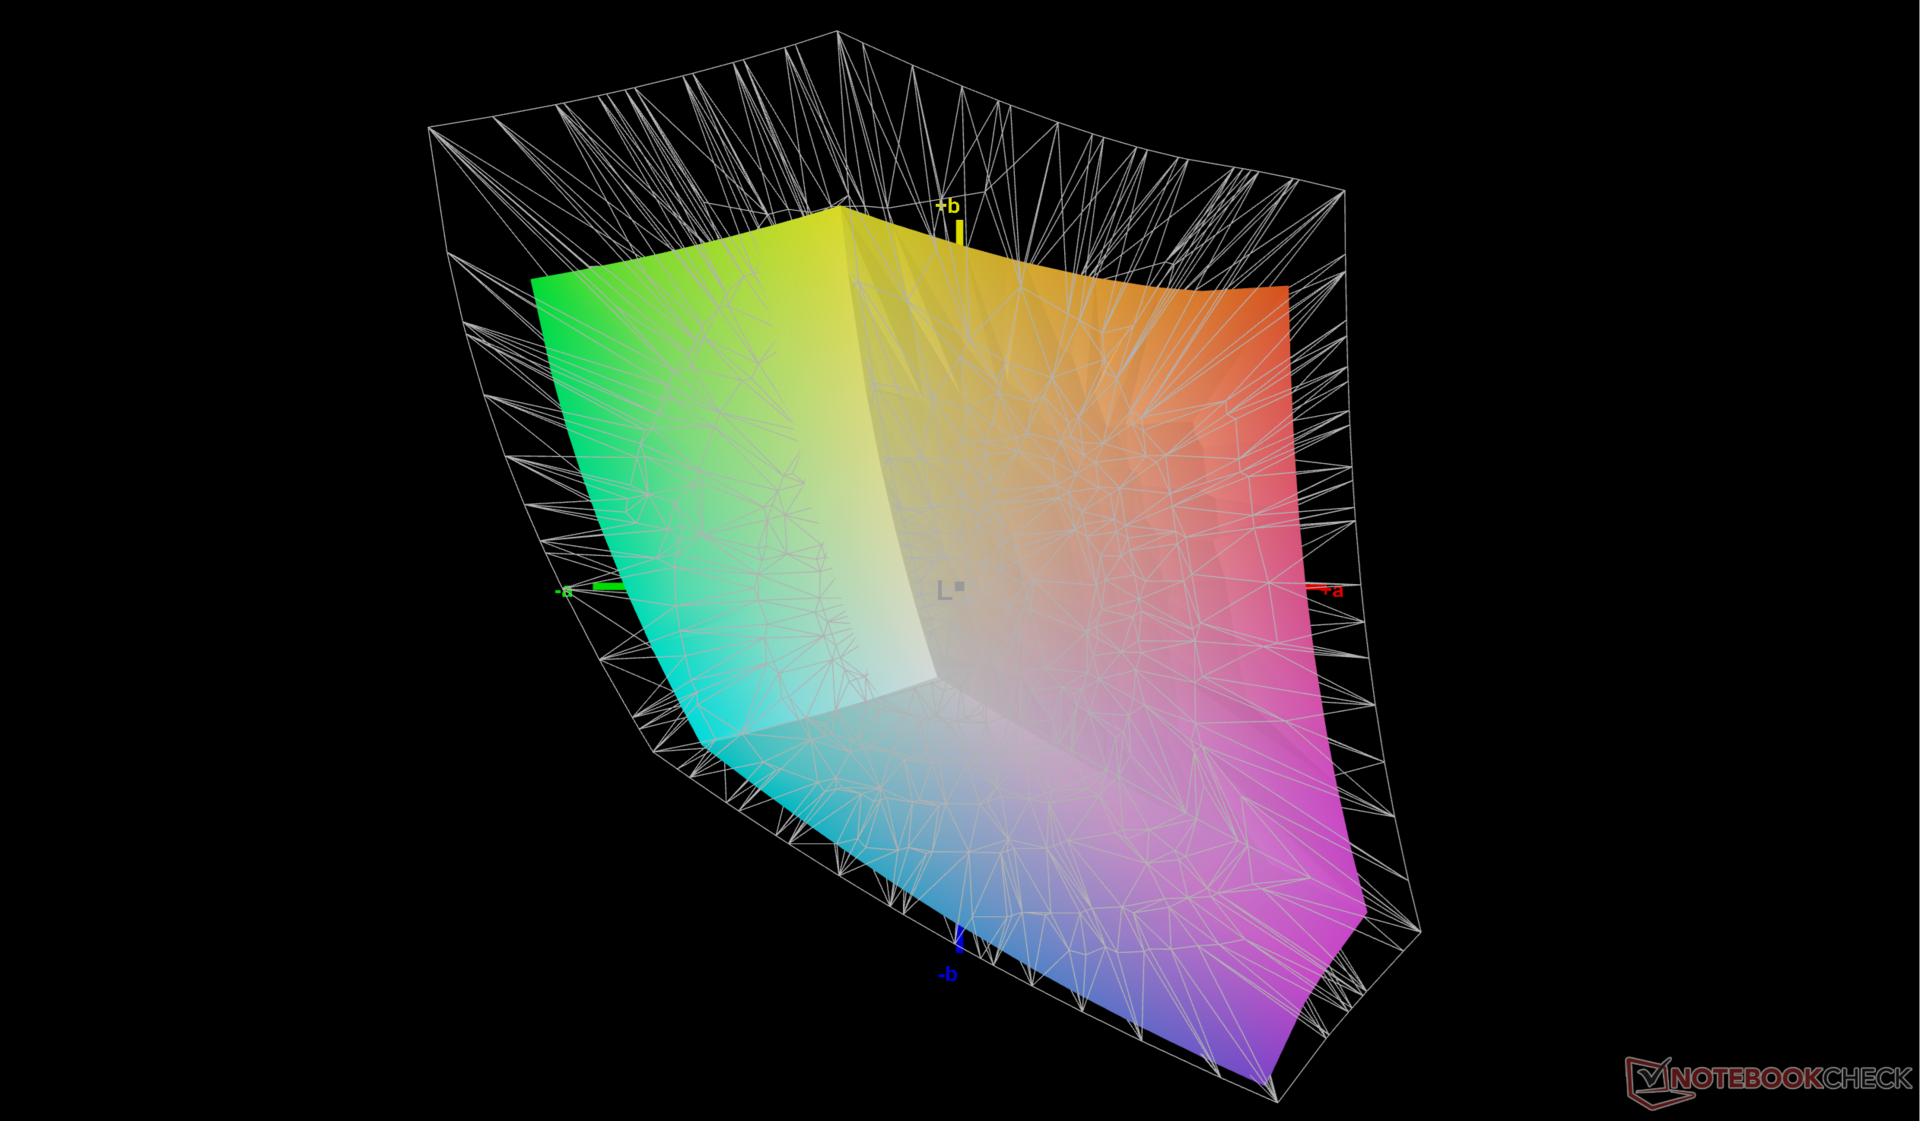
71% AdobeRGB 1998 (Argyll 2.2.0 3D)
97.7% sRGB (Argyll 2.2.0 3D)
69.1% Display P3 (Argyll 2.2.0 3D)
Gamma: 2.38
| HP ZBook Power 16 G11 A AUOA0A9, IPS, 2560x1600, 16", 120 Hz | HP ZBook Power 15 G10 BOE0B6A, IPS, 2560x1440, 15.6", 120 Hz | HP ZBook Fury 16 G11 AUO87A8, IPS, 3840x2400, 16", 120 Hz | Lenovo ThinkPad P1 Gen 7 21KV001SGE MNG007DA1-9 , IPS LED, 2560x1600, 16", 165 Hz | Lenovo ThinkPad P16s G2 21K9000CGE ATNA60YV04-0, OLED, 3840x2400, 16", 60 Hz | Dell Precision 5690 Samsung 160YV03, OLED, 3840x2400, 16", 60 Hz | |
|---|---|---|---|---|---|---|
| Display | -1% | 22% | 0% | 28% | 27% | |
| Display P3 Coverage | 69.1 | 68.2 -1% | 98.4 42% | 69.4 0% | 99.9 45% | 99.8 44% |
| sRGB Coverage | 97.7 | 95.6 -2% | 99.9 2% | 97.6 0% | 100 2% | 100 2% |
| AdobeRGB 1998 Coverage | 71 | 70.5 -1% | 86 21% | 71.8 1% | 96.9 36% | 96.6 36% |
| Response Times | -10% | 8% | -4% | 87% | 84% | |
| Response Time Grey 50% / Grey 80% * | 13.6 ? | 13 ? 4% | 11.4 ? 16% | 11.2 ? 18% | 1.5 ? 89% | 1.7 ? 87% |
| Response Time Black / White * | 8.4 ? | 10.4 ? -24% | 8.4 ? -0% | 10.6 ? -26% | 1.3 ? 85% | 1.7 ? 80% |
| PWM Frequency | 60 | 60 ? | ||||
| Screen | -13% | 5% | -10% | 2% | -14% | |
| Brightness middle | 470.7 | 313.8 -33% | 457.6 -3% | 516 10% | 416 -12% | 348.1 -26% |
| Brightness | 431 | 302 -30% | 466 8% | 505 17% | 421 -2% | 351 -19% |
| Brightness Distribution | 88 | 83 -6% | 83 -6% | 89 1% | 98 11% | 97 10% |
| Black Level * | 0.57 | 0.29 49% | 0.43 25% | 0.41 28% | ||
| Contrast | 826 | 1082 31% | 1064 29% | 1259 52% | ||
| Colorchecker dE 2000 * | 2.16 | 3.27 -51% | 2.78 -29% | 3.5 -62% | 1.3 40% | 4.18 -94% |
| Colorchecker dE 2000 max. * | 4.39 | 7.81 -78% | 5.53 -26% | 8.8 -100% | 2.8 36% | 6.68 -52% |
| Colorchecker dE 2000 calibrated * | 1.37 | 0.56 59% | 1.37 -0% | 1.2 12% | 2.9 -112% | 0.97 29% |
| Greyscale dE 2000 * | 3.7 | 5.9 -59% | 2 46% | 5.6 -51% | 1.8 51% | 1.7 54% |
| Gamma | 2.38 92% | 2.18 101% | 2.28 96% | 2.27 97% | 2.25 98% | 2.2 100% |
| CCT | 6765 96% | 6323 103% | 6806 96% | 6071 107% | 6574 99% | 6198 105% |
| Totalt genomsnitt (program/inställningar) | -8% /
-10% | 12% /
9% | -5% /
-7% | 39% /
22% | 32% /
13% |
* ... mindre är bättre
Skärmen är hyfsat kalibrerad direkt ur förpackningen mot sRGB-standarden. Om panelen kalibreras med vår X-Rite-kolorimeter skulle de genomsnittliga deltaE-värdena för gråskala och färg förbättras ytterligare från 3,7 och 2,16 till bara 2,5 respektive 1,37. Vår kalibrerade ICM-profil finns att ladda ner gratis ovan.

Visa svarstider
| ↔ Svarstid svart till vitt | ||
|---|---|---|
| 8.4 ms ... stiga ↗ och falla ↘ kombinerat | ↗ 4.5 ms stiga | 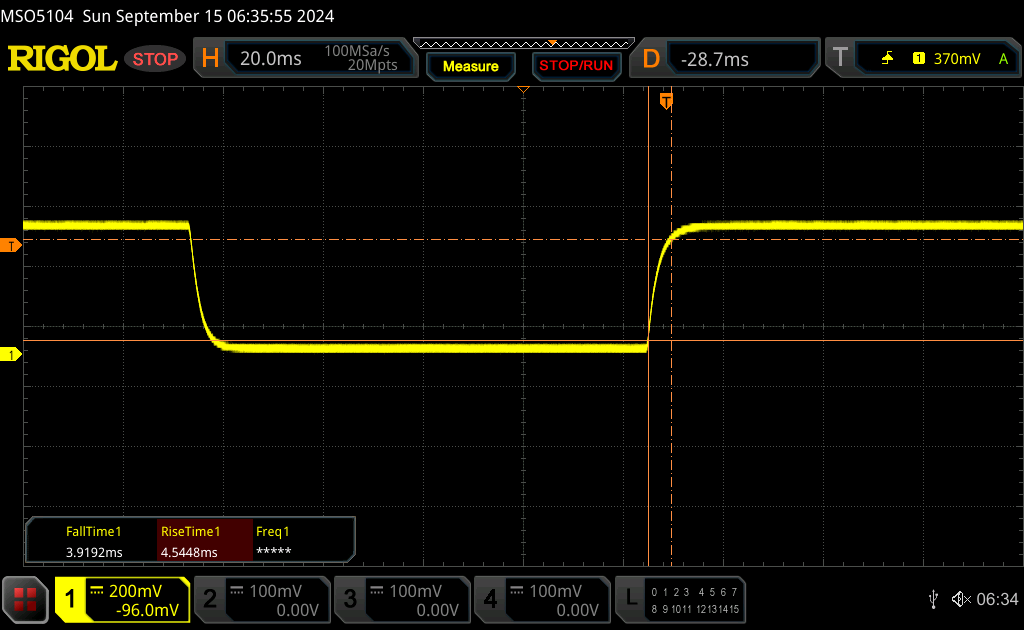 |
| ↘ 3.9 ms hösten | ||
| Skärmen visar snabba svarsfrekvenser i våra tester och bör passa för spel. I jämförelse sträcker sig alla testade enheter från 0.1 (minst) till 240 (maximalt) ms. » 21 % av alla enheter är bättre. Det betyder att den uppmätta svarstiden är bättre än genomsnittet av alla testade enheter (20.8 ms). | ||
| ↔ Svarstid 50 % grått till 80 % grått | ||
| 13.6 ms ... stiga ↗ och falla ↘ kombinerat | ↗ 7.2 ms stiga | 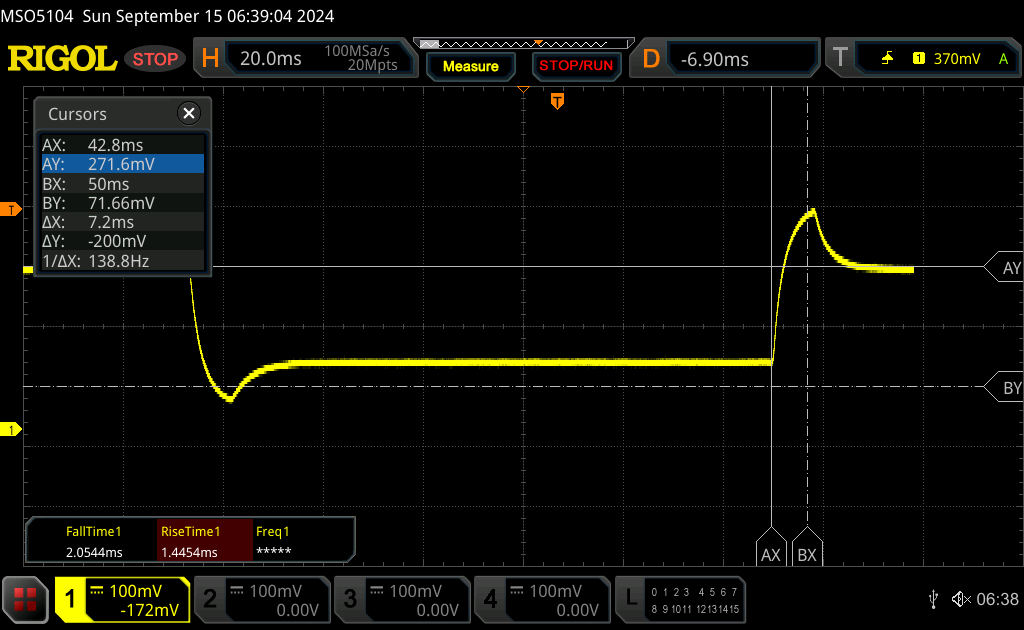 |
| ↘ 6.4 ms hösten | ||
| Skärmen visar bra svarsfrekvens i våra tester, men kan vara för långsam för konkurrenskraftiga spelare. I jämförelse sträcker sig alla testade enheter från 0.165 (minst) till 636 (maximalt) ms. » 24 % av alla enheter är bättre. Det betyder att den uppmätta svarstiden är bättre än genomsnittet av alla testade enheter (32.5 ms). | ||
Skärmflimmer / PWM (Puls-Width Modulation)
| Skärmflimmer / PWM upptäcktes inte | 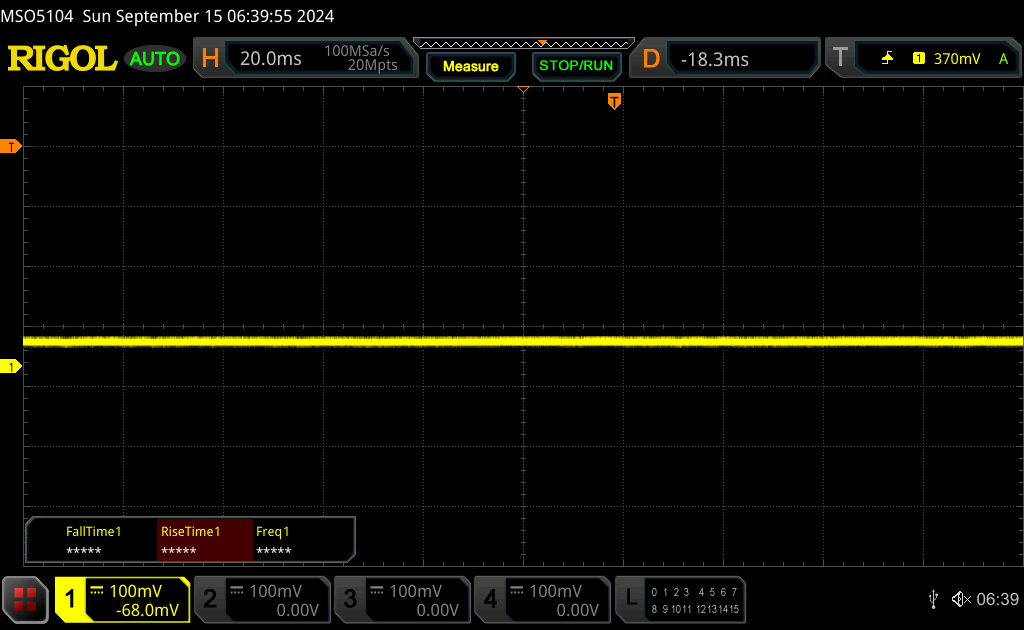 | ||
Som jämförelse: 53 % av alla testade enheter använder inte PWM för att dämpa skärmen. Om PWM upptäcktes mättes ett medelvärde av 8516 (minst: 5 - maximum: 343500) Hz. | |||
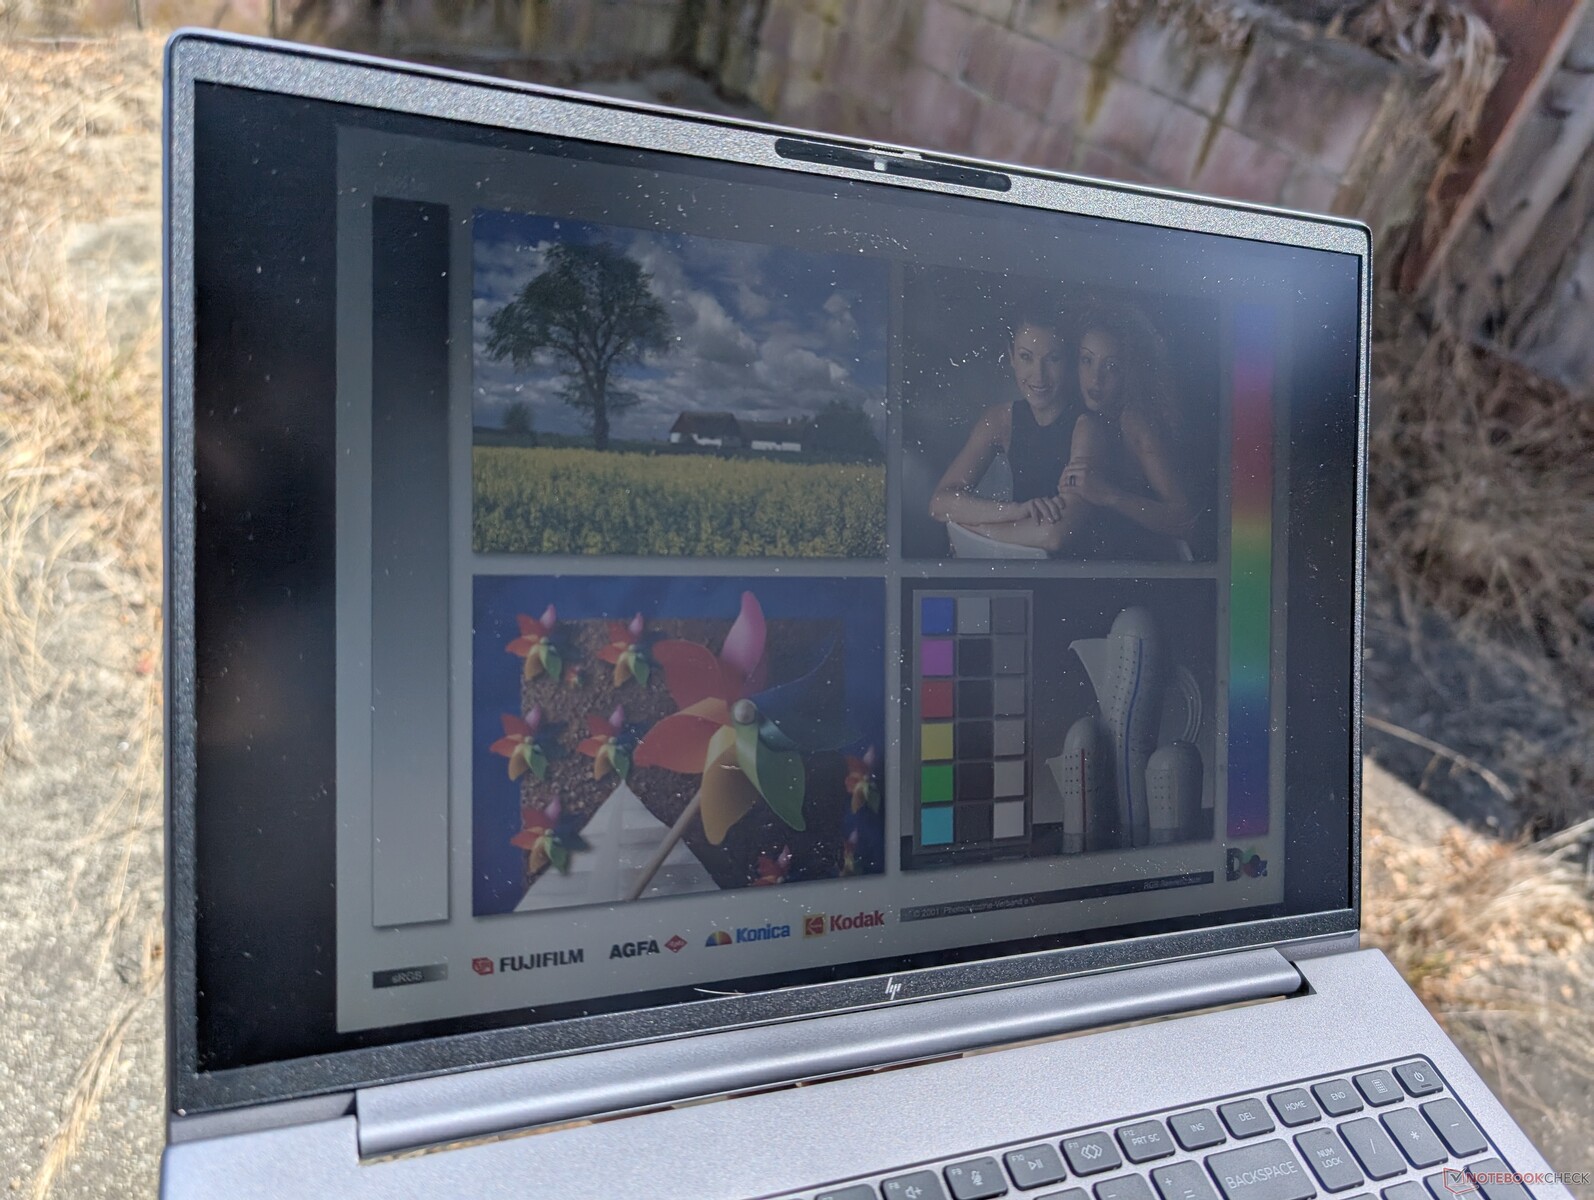
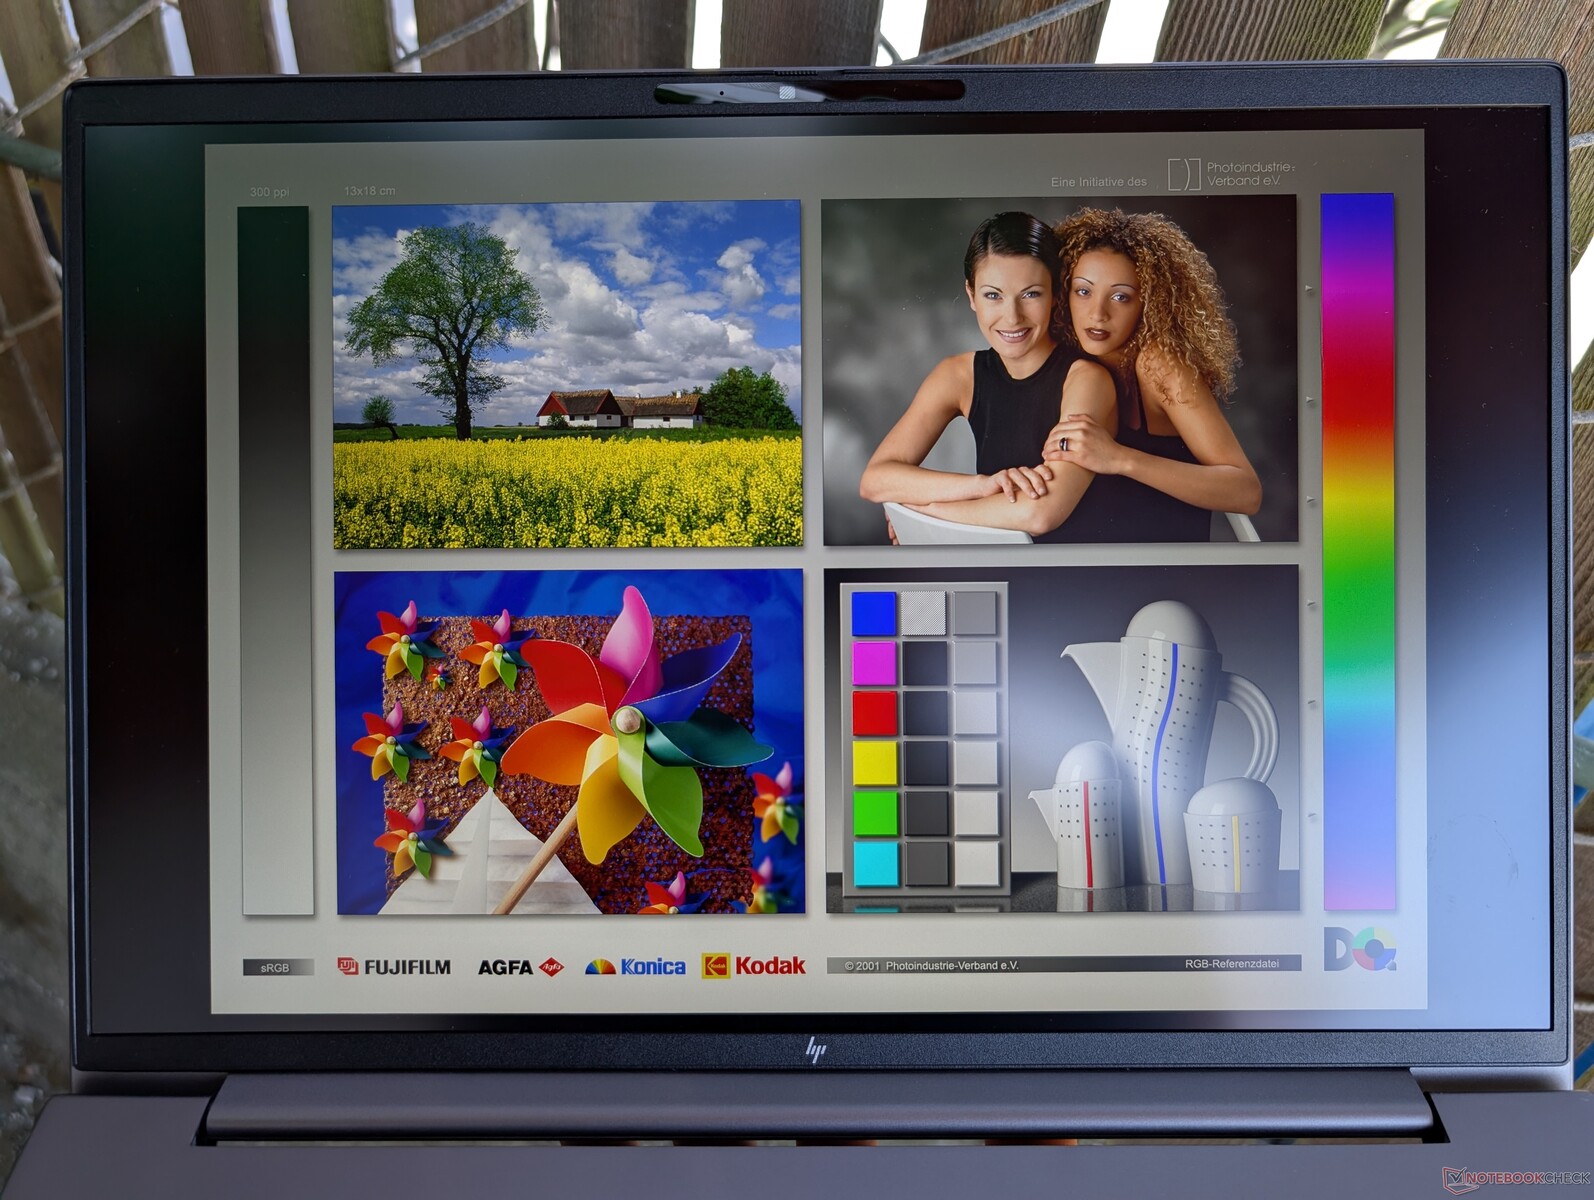
Sikten utomhus är hyfsad i skugga med vår 1600p-panel, men billigare alternativ är svagare och mer utsatta för bländning. Alternativet med 1000 nit bör övervägas om du ofta är utomhus.
Prestanda - Ny Zen 4, samma Zen 4 Prestanda
Testförhållanden
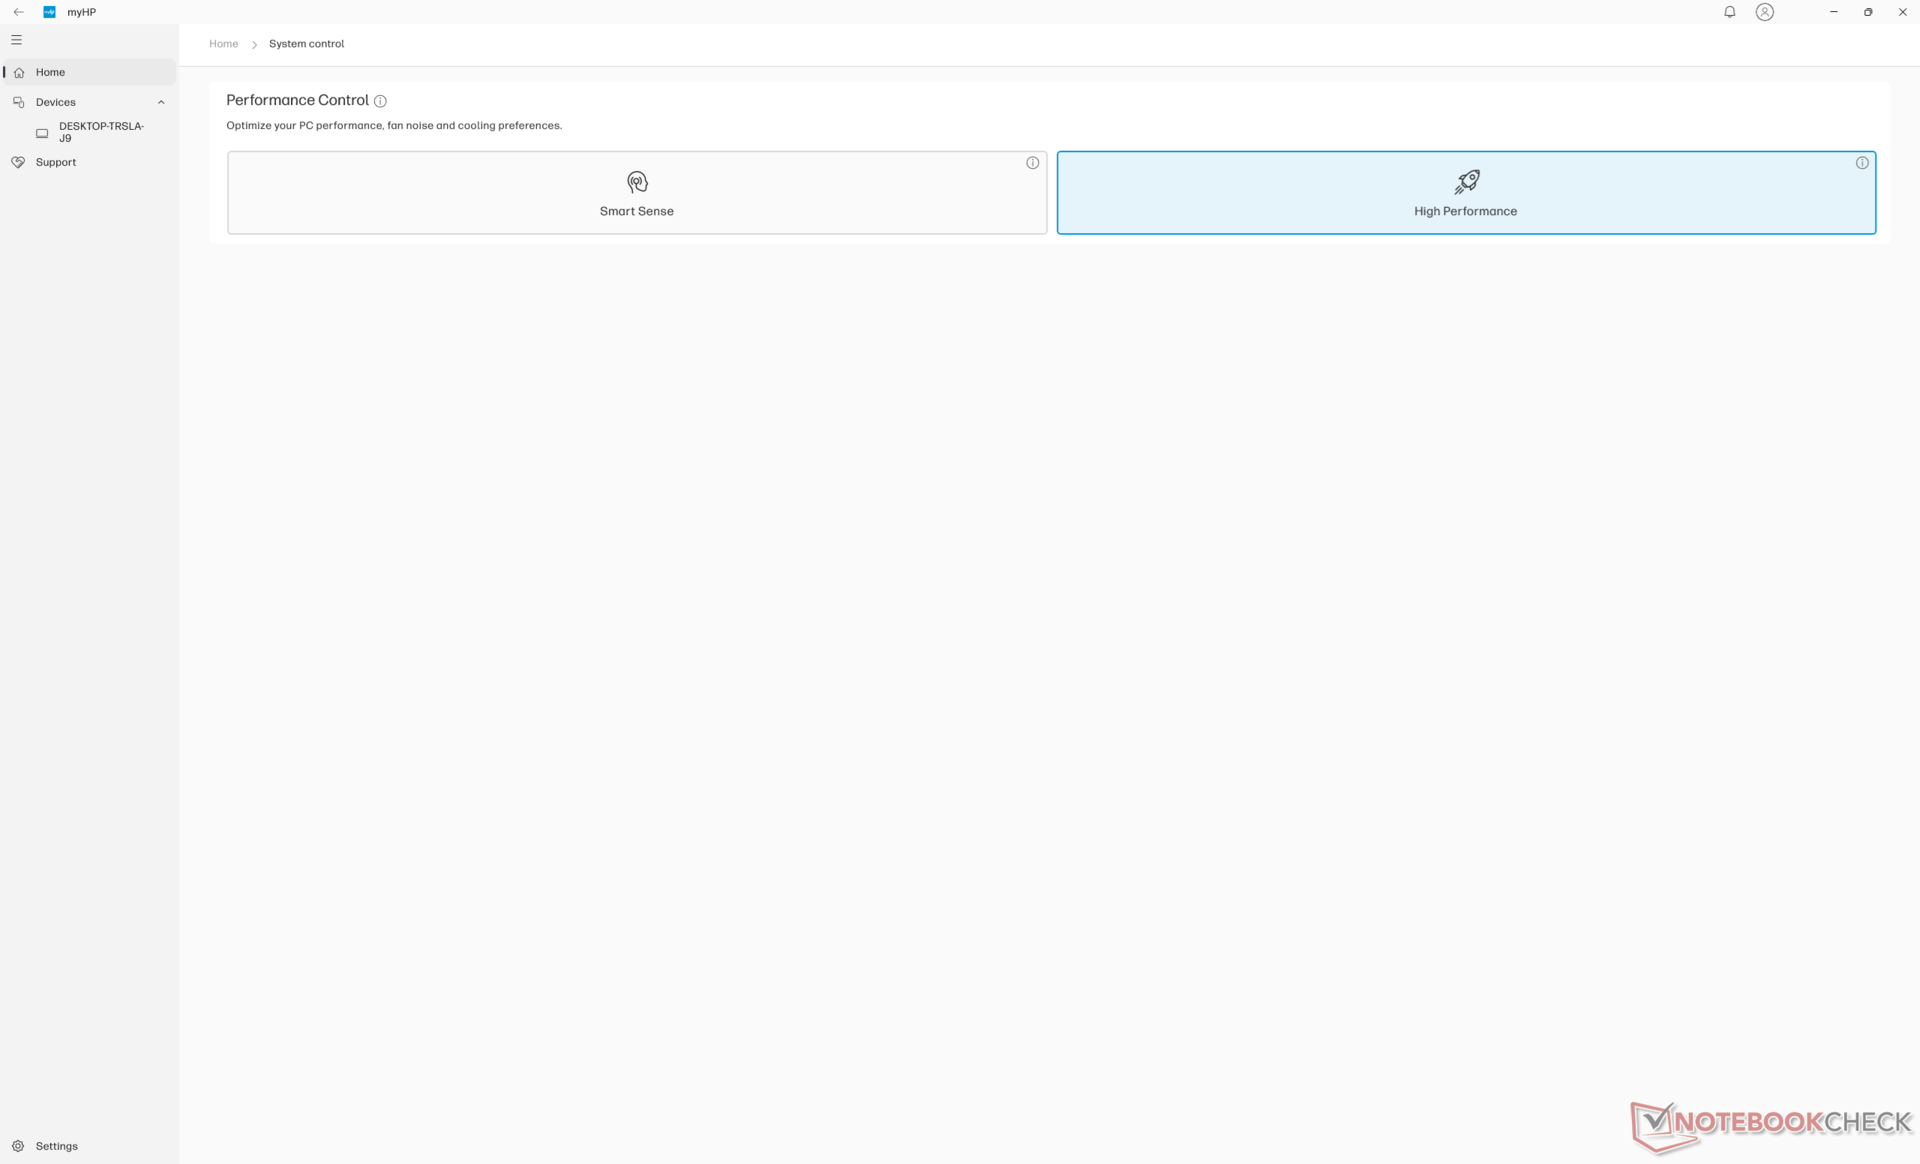
Vi ställde in både Windows och MyHP i prestandaläge innan vi körde nedanstående benchmarks. Optimus 1.0 stöds.
Processor
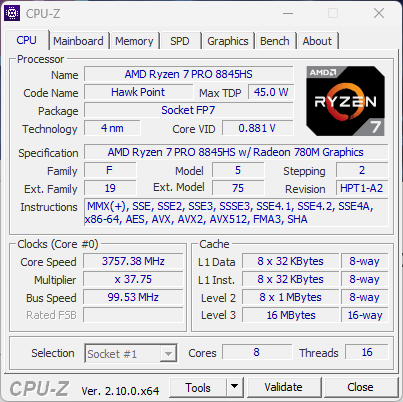
Ryzen 7 8845HS Ryzen 7 8845HS erbjuder inte mycket över Ryzen 7 7840HS som den ersätter i förra årets ZBook Power 15 G10. Faktum är att riktmärken sätter båda processorerna hals-till-hals med bara några procentenheter för att vara i huvudsak identiska. Detta kan vara en besvikelse för kraftfulla användare som förväntade sig mer betydande prestandauppgraderingar i övergången från 15-tum till 16-tum. Snabbare Raptor Lake-HX-alternativ är endast tillgängliga på HP:s tjockare ZBook Fury-serie.
Den största fördelen som Ryzen 7 8845HS har jämfört med Ryzen 7 7840HS är AI-acceleration på grund av dess integrerade NPU. Co-Pilot+ är dock inkompatibelt med Hawk Point-processorer och NPU:ns användbarhet är därför mycket begränsad på den här maskinen.
Nedgradering till Ryzen 5 8645HS förväntas minska prestandan med 25 till 30 procent medan uppgradering till Ryzen 9 8945HS förväntas förbättra prestandan med bara 5 procent.
Cinebench R15 Multi Loop
Cinebench R23: Multi Core | Single Core
Cinebench R20: CPU (Multi Core) | CPU (Single Core)
Cinebench R15: CPU Multi 64Bit | CPU Single 64Bit
Blender: v2.79 BMW27 CPU
7-Zip 18.03: 7z b 4 | 7z b 4 -mmt1
Geekbench 6.4: Multi-Core | Single-Core
Geekbench 5.5: Multi-Core | Single-Core
HWBOT x265 Benchmark v2.2: 4k Preset
LibreOffice : 20 Documents To PDF
R Benchmark 2.5: Overall mean
| Geekbench 6.4 / Multi-Core | |
| HP ZBook Fury 16 G11 | |
| Dell Precision 5690 | |
| Dell Precision 5000 5490 | |
| HP ZBook Power 15 G10 | |
| Genomsnitt AMD Ryzen 7 8845HS (11073 - 14014, n=16) | |
| HP ZBook Power 16 G11 A | |
| Lenovo ThinkPad P16s G2 21K9000CGE | |
| Lenovo ThinkPad P16v G1 AMD | |
| Geekbench 6.4 / Single-Core | |
| HP ZBook Fury 16 G11 | |
| HP ZBook Power 15 G10 | |
| Genomsnitt AMD Ryzen 7 8845HS (2510 - 2698, n=14) | |
| HP ZBook Power 16 G11 A | |
| Lenovo ThinkPad P16v G1 AMD | |
| Dell Precision 5690 | |
| Lenovo ThinkPad P16s G2 21K9000CGE | |
| Dell Precision 5000 5490 | |
Cinebench R23: Multi Core | Single Core
Cinebench R20: CPU (Multi Core) | CPU (Single Core)
Cinebench R15: CPU Multi 64Bit | CPU Single 64Bit
Blender: v2.79 BMW27 CPU
7-Zip 18.03: 7z b 4 | 7z b 4 -mmt1
Geekbench 6.4: Multi-Core | Single-Core
Geekbench 5.5: Multi-Core | Single-Core
HWBOT x265 Benchmark v2.2: 4k Preset
LibreOffice : 20 Documents To PDF
R Benchmark 2.5: Overall mean
* ... mindre är bättre
AIDA64: FP32 Ray-Trace | FPU Julia | CPU SHA3 | CPU Queen | FPU SinJulia | FPU Mandel | CPU AES | CPU ZLib | FP64 Ray-Trace | CPU PhotoWorxx
| Performance Rating | |
| Genomsnitt AMD Ryzen 7 8845HS | |
| HP ZBook Power 15 G10 | |
| HP ZBook Power 16 G11 A | |
| HP ZBook Fury 16 G11 | |
| Lenovo ThinkPad P16s G2 21K9000CGE | |
| Dell Precision 5690 | |
| Lenovo ThinkPad P1 Gen 7 21KV001SGE | |
| AIDA64 / FP32 Ray-Trace | |
| Genomsnitt AMD Ryzen 7 8845HS (23708 - 29544, n=12) | |
| HP ZBook Power 15 G10 | |
| HP ZBook Power 16 G11 A | |
| Lenovo ThinkPad P16s G2 21K9000CGE | |
| HP ZBook Fury 16 G11 | |
| Dell Precision 5690 | |
| Lenovo ThinkPad P1 Gen 7 21KV001SGE | |
| AIDA64 / FPU Julia | |
| HP ZBook Power 16 G11 A | |
| Genomsnitt AMD Ryzen 7 8845HS (99659 - 125873, n=12) | |
| HP ZBook Power 15 G10 | |
| HP ZBook Fury 16 G11 | |
| Lenovo ThinkPad P16s G2 21K9000CGE | |
| Dell Precision 5690 | |
| Lenovo ThinkPad P1 Gen 7 21KV001SGE | |
| AIDA64 / CPU SHA3 | |
| HP ZBook Fury 16 G11 | |
| HP ZBook Power 16 G11 A | |
| Genomsnitt AMD Ryzen 7 8845HS (4332 - 5180, n=12) | |
| HP ZBook Power 15 G10 | |
| Lenovo ThinkPad P16s G2 21K9000CGE | |
| Dell Precision 5690 | |
| Lenovo ThinkPad P1 Gen 7 21KV001SGE | |
| AIDA64 / CPU Queen | |
| HP ZBook Fury 16 G11 | |
| HP ZBook Power 16 G11 A | |
| Genomsnitt AMD Ryzen 7 8845HS (109458 - 124695, n=12) | |
| HP ZBook Power 15 G10 | |
| Lenovo ThinkPad P16s G2 21K9000CGE | |
| Dell Precision 5690 | |
| Lenovo ThinkPad P1 Gen 7 21KV001SGE | |
| AIDA64 / FPU SinJulia | |
| Genomsnitt AMD Ryzen 7 8845HS (14062 - 15519, n=12) | |
| HP ZBook Power 15 G10 | |
| HP ZBook Power 16 G11 A | |
| Lenovo ThinkPad P16s G2 21K9000CGE | |
| HP ZBook Fury 16 G11 | |
| Dell Precision 5690 | |
| Lenovo ThinkPad P1 Gen 7 21KV001SGE | |
| AIDA64 / FPU Mandel | |
| Genomsnitt AMD Ryzen 7 8845HS (53436 - 67367, n=12) | |
| HP ZBook Power 15 G10 | |
| HP ZBook Power 16 G11 A | |
| Lenovo ThinkPad P16s G2 21K9000CGE | |
| HP ZBook Fury 16 G11 | |
| Dell Precision 5690 | |
| Lenovo ThinkPad P1 Gen 7 21KV001SGE | |
| AIDA64 / CPU AES | |
| HP ZBook Fury 16 G11 | |
| Genomsnitt AMD Ryzen 7 8845HS (64515 - 172642, n=12) | |
| Dell Precision 5690 | |
| HP ZBook Power 15 G10 | |
| Lenovo ThinkPad P1 Gen 7 21KV001SGE | |
| HP ZBook Power 16 G11 A | |
| Lenovo ThinkPad P16s G2 21K9000CGE | |
| AIDA64 / CPU ZLib | |
| HP ZBook Fury 16 G11 | |
| Dell Precision 5690 | |
| Lenovo ThinkPad P1 Gen 7 21KV001SGE | |
| HP ZBook Power 16 G11 A | |
| HP ZBook Power 15 G10 | |
| Lenovo ThinkPad P16s G2 21K9000CGE | |
| Genomsnitt AMD Ryzen 7 8845HS (627 - 1080, n=12) | |
| AIDA64 / FP64 Ray-Trace | |
| HP ZBook Power 15 G10 | |
| Genomsnitt AMD Ryzen 7 8845HS (12361 - 15911, n=12) | |
| HP ZBook Power 16 G11 A | |
| Lenovo ThinkPad P16s G2 21K9000CGE | |
| HP ZBook Fury 16 G11 | |
| Dell Precision 5690 | |
| Lenovo ThinkPad P1 Gen 7 21KV001SGE | |
| AIDA64 / CPU PhotoWorxx | |
| Dell Precision 5690 | |
| HP ZBook Power 15 G10 | |
| Lenovo ThinkPad P1 Gen 7 21KV001SGE | |
| HP ZBook Power 16 G11 A | |
| Genomsnitt AMD Ryzen 7 8845HS (33192 - 41668, n=12) | |
| Lenovo ThinkPad P16s G2 21K9000CGE | |
| HP ZBook Fury 16 G11 | |
Stresstest
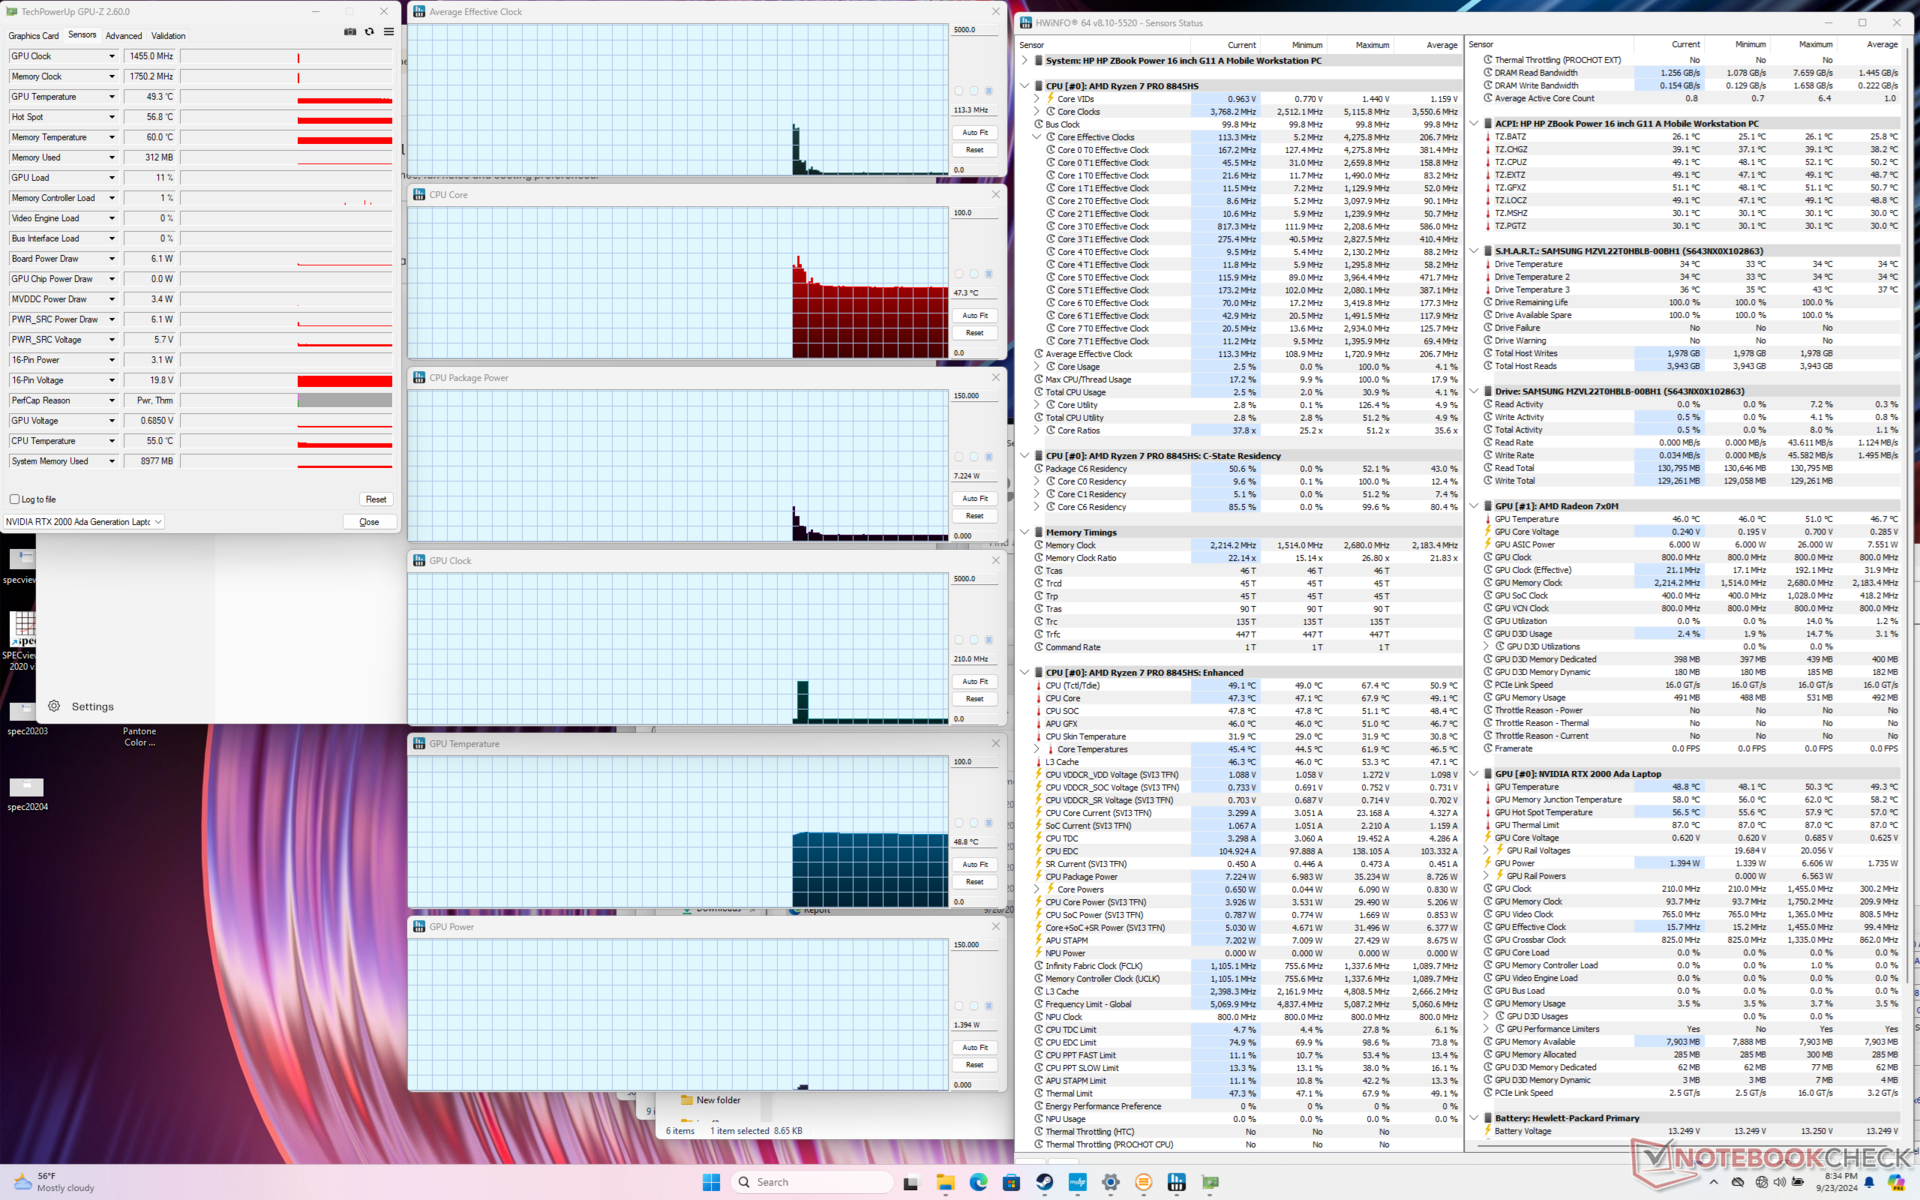
Processorn ökade till 4,3 GHz, 65 W och 90 C när Prime95-belastningen inleddes för att sedan snabbt sjunka och stabiliseras på 3,8 GHz och 50 W för att förhindra högre kärntemperaturer. Resultaten ligger nära vad vi observerade på ZBook Power 15 G10 om inte något varmare med några grader.
Intressant nog stryps processorn kraftigare till bara 2,8 GHz när både Prime95 och FurMark körs samtidigt, istället för 3,8 GHz som på förra årets modell. Denna förändring var sannolikt för att förbättra kärntemperaturen; CPU:n stabiliseras nu vid en mer bekväm 66 C istället för 99 C på ZBook Power 15 G10.
Att köra Cyberpunk 2077 i balanserat läge istället för prestandaläge resulterar i både något svalare kärntemperaturer och något långsammare genomsnittliga klockfrekvenser som visas nedan. GPU-kortets strömförbrukning skulle också sjunka från 35 W till 30 W jämfört med det annonserade maxvärdet på 50 W.
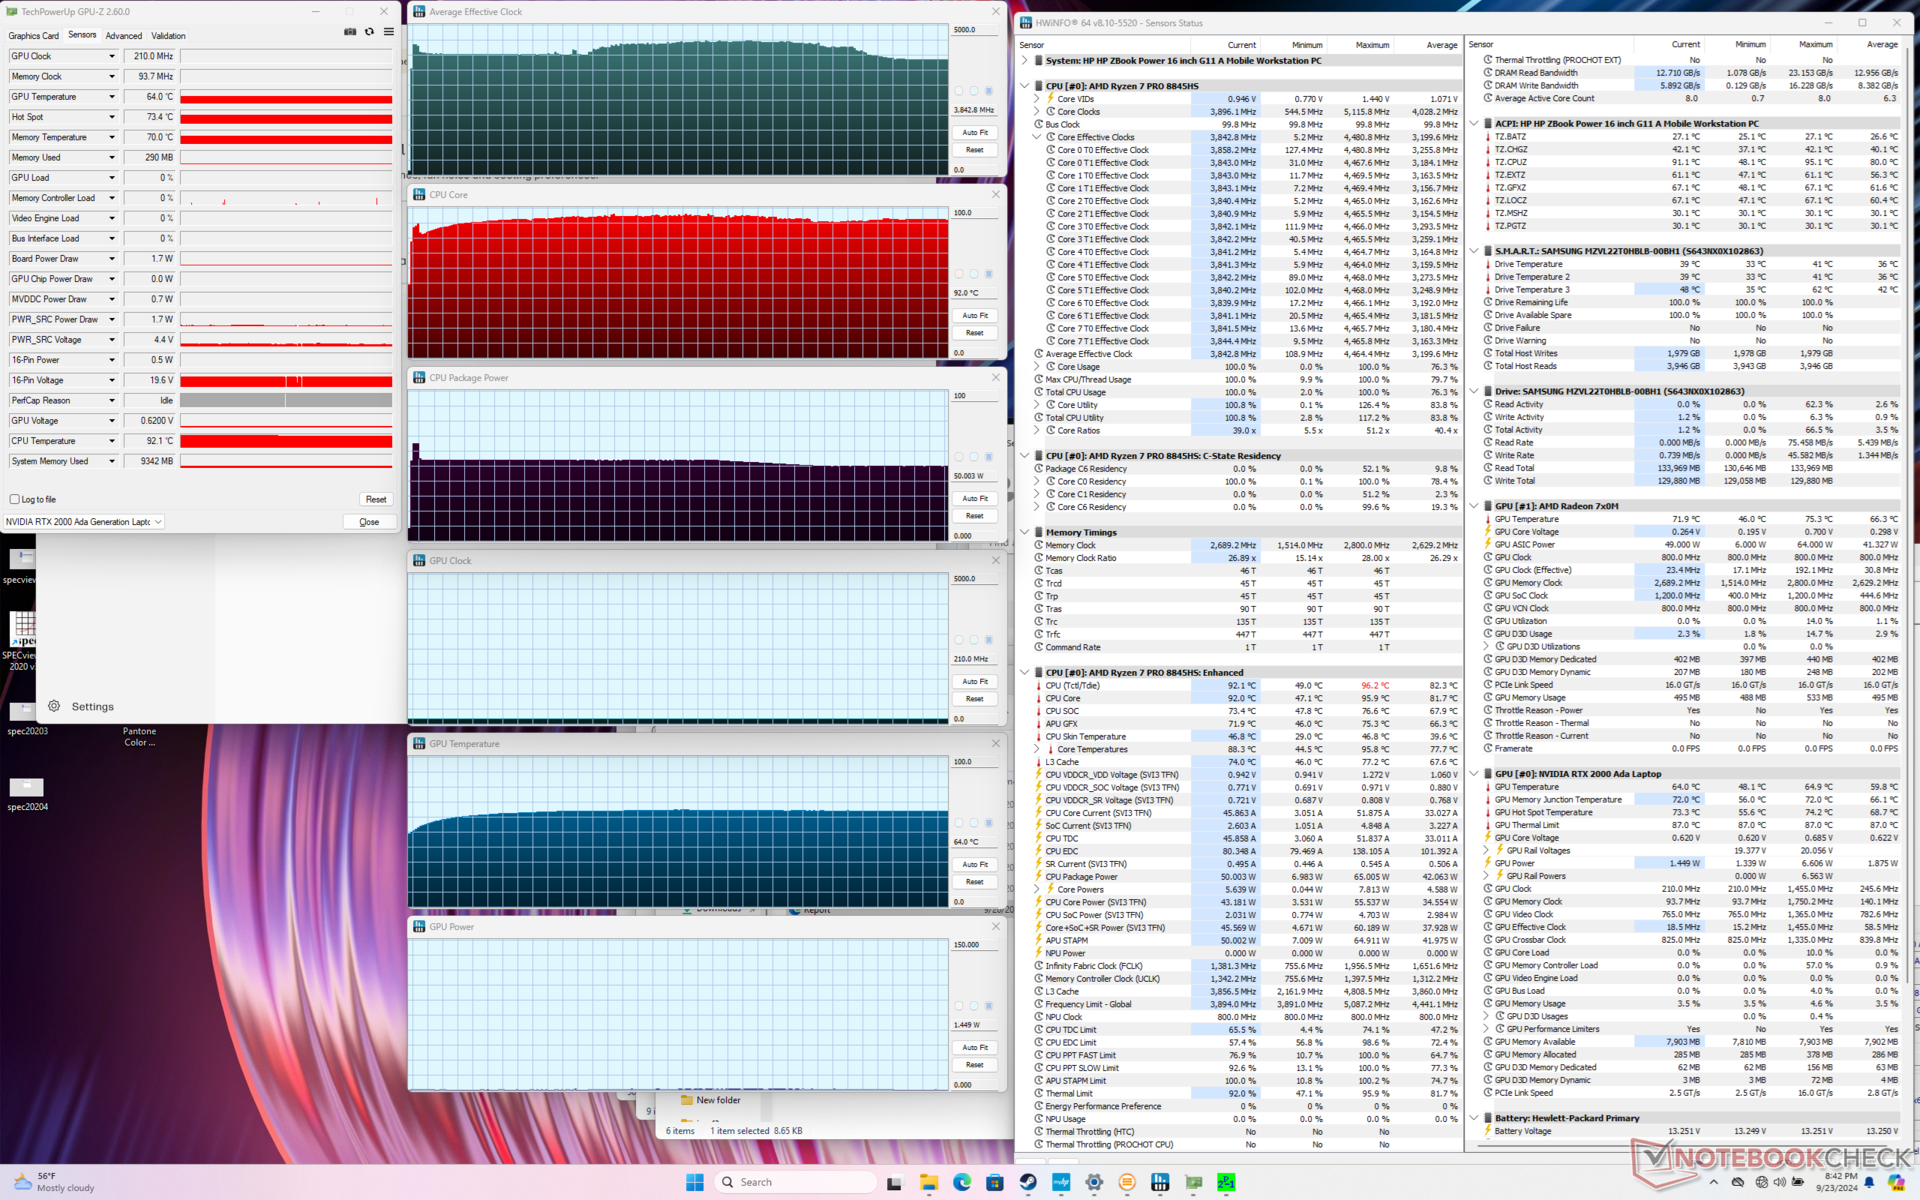
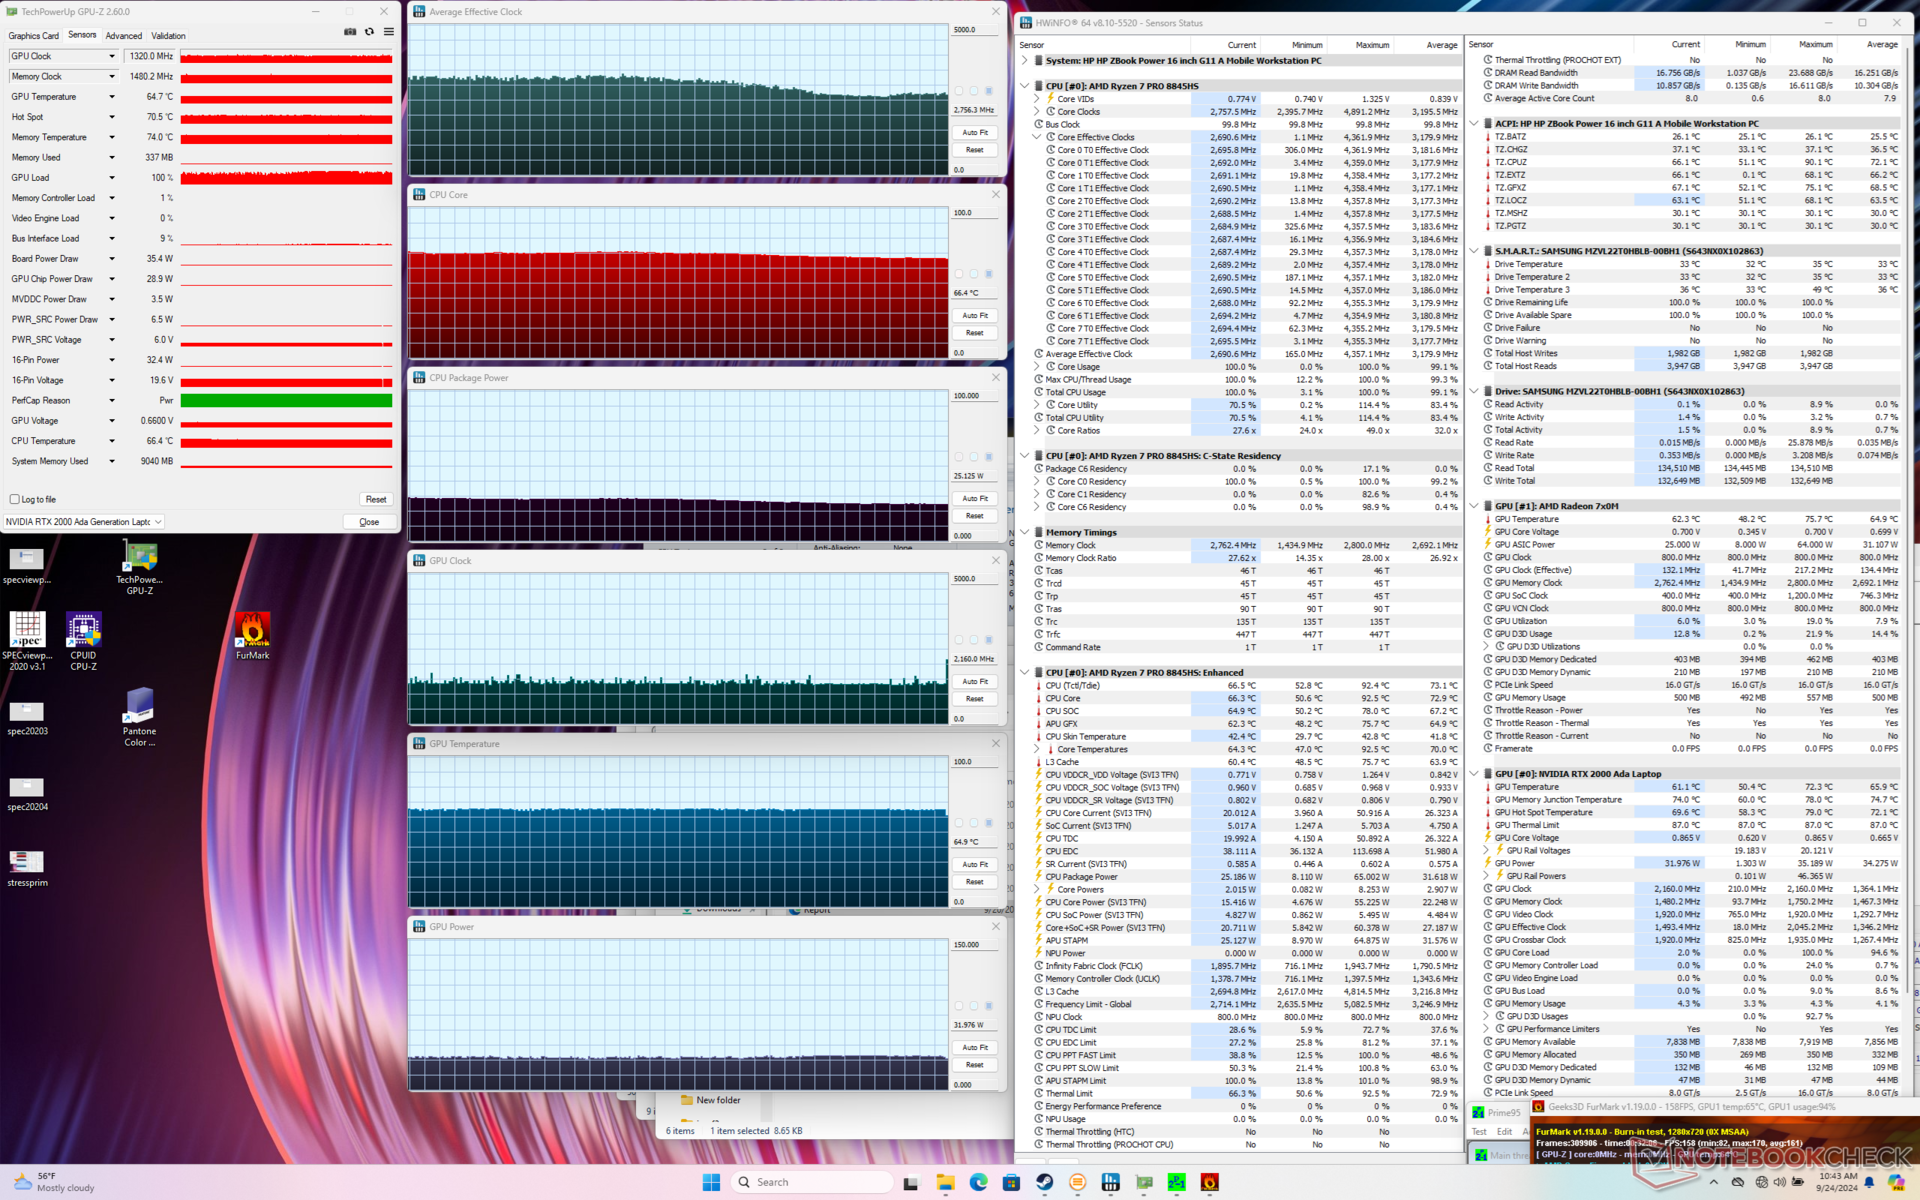
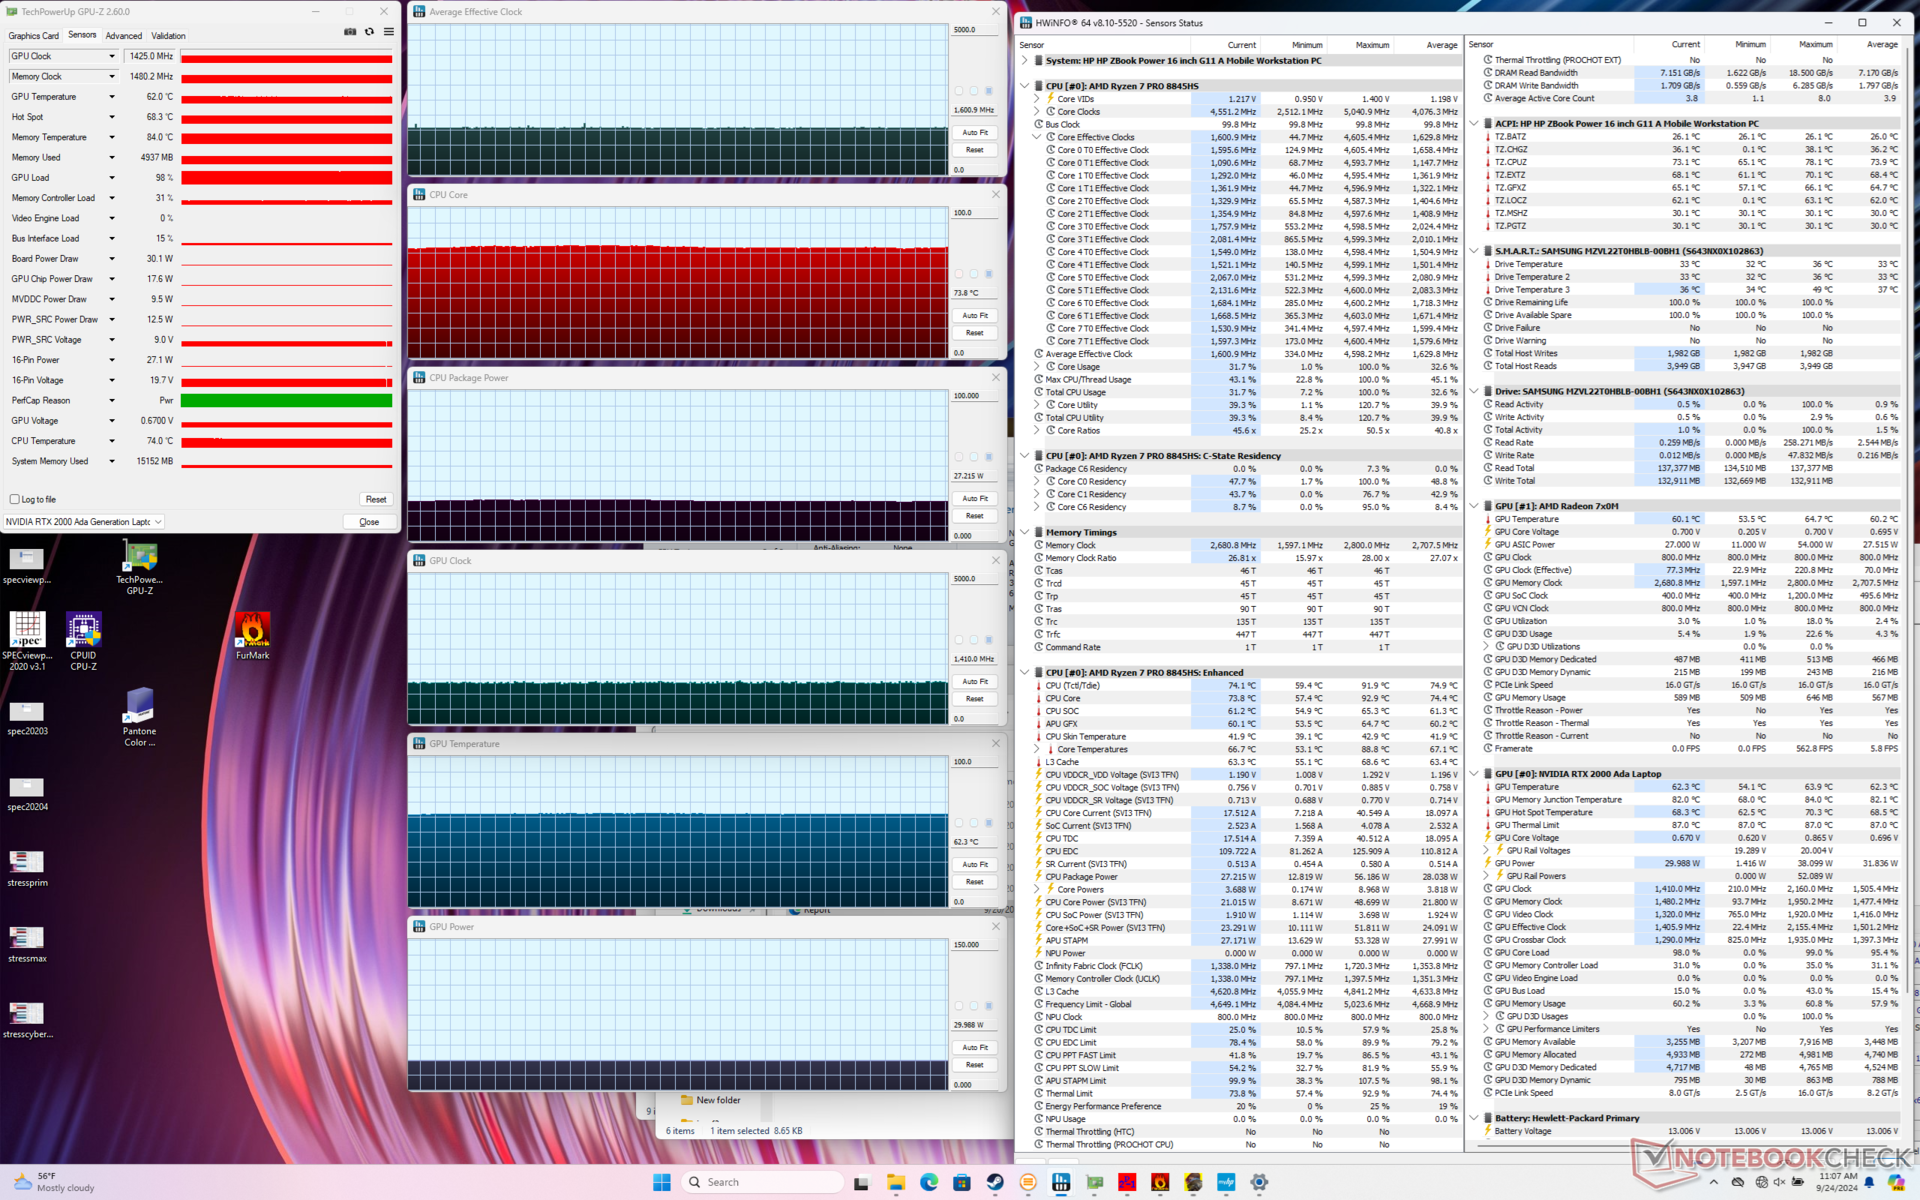
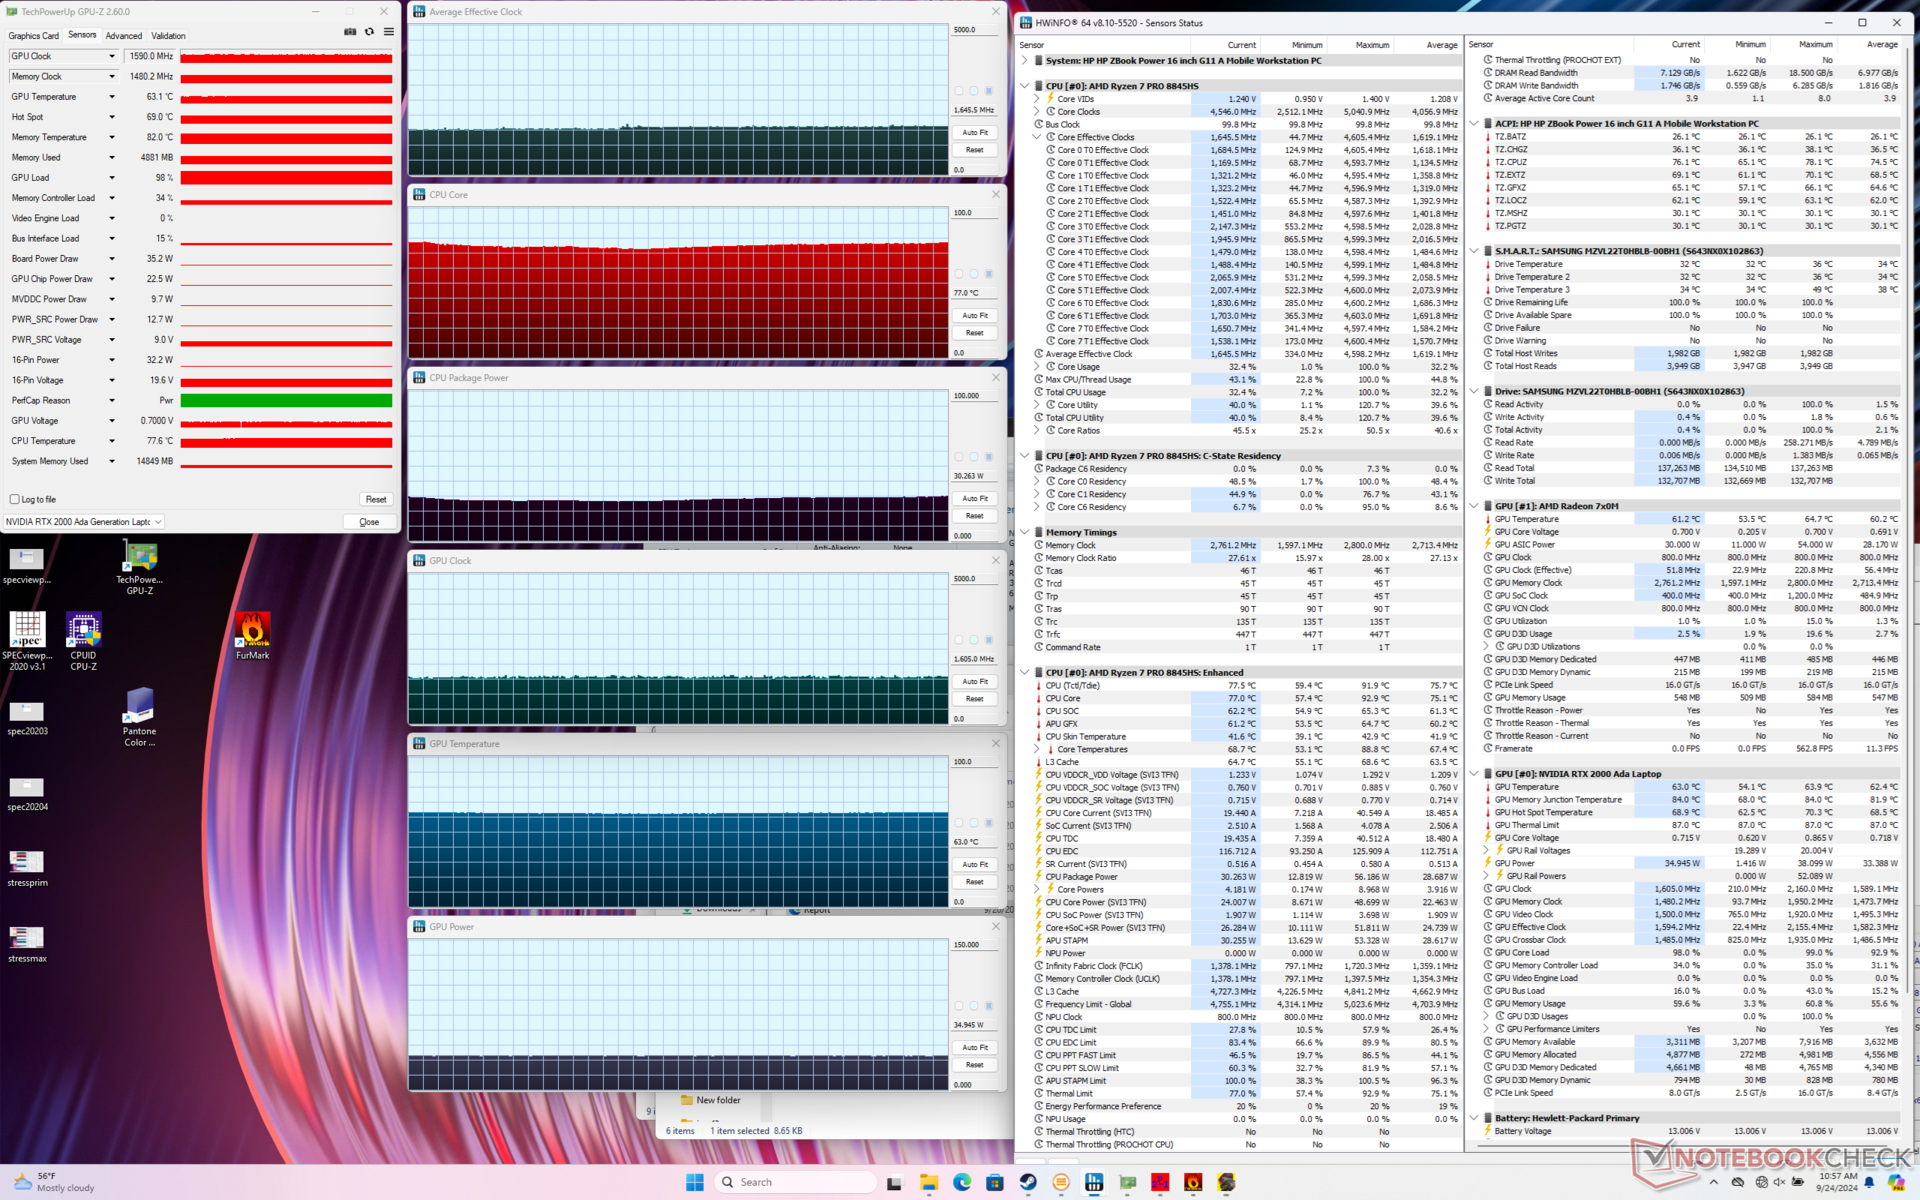
| Genomsnittlig CPU-klocka (GHz) | GPU-klocka (MHz) | Genomsnittlig CPU-temperatur (°C) | Genomsnittlig GPU-temperatur (°C) | |
| System i viloläge | -- | -- | 47 | 49 |
| Prime95 Stress | 3.9 | -- | 92 | 64 |
| Prime95 + FurMark Stress | 2.8 | 1320 | 66 | 65 |
| Cyberpunk 2077 Stress (Balanserat läge) | 1.6 | 1425 | 74 | 62 |
| Cyberpunk 2077 Stress (Performance mode) | 1.7 | 1590 | 77 | 63 |
Systemets prestanda
PCMark-resultaten är nästan identiska med vad vi registrerade på förra årets ZBook Power 15 G10. Detta innebär att traditionella dagliga belastningar som surfning eller redigering inte är märkbart snabbare på vår nyare modell. RAM-prestandan har inte heller förbättrats.
Vi upplevde ett problem med väckning från viloläge där en hård avstängning krävdes för att återgå till Windows. Vi kunde inte replikera problemet på ett tillförlitligt sätt, men det faktum att det överhuvudtaget inträffade på en mobil arbetsstation är ändå anmärkningsvärt.

CrossMark: Overall | Productivity | Creativity | Responsiveness
WebXPRT 3: Overall
WebXPRT 4: Overall
Mozilla Kraken 1.1: Total
| PCMark 10 / Score | |
| Dell Precision 5690 | |
| HP ZBook Fury 16 G11 | |
| HP ZBook Power 15 G10 | |
| HP ZBook Power 16 G11 A | |
| Genomsnitt AMD Ryzen 7 8845HS, NVIDIA RTX 2000 Ada Generation Laptop GPU (n=1) | |
| Lenovo ThinkPad P1 Gen 7 21KV001SGE | |
| Lenovo ThinkPad P16s G2 21K9000CGE | |
| PCMark 10 / Essentials | |
| Dell Precision 5690 | |
| HP ZBook Power 15 G10 | |
| HP ZBook Power 16 G11 A | |
| Genomsnitt AMD Ryzen 7 8845HS, NVIDIA RTX 2000 Ada Generation Laptop GPU (n=1) | |
| Lenovo ThinkPad P1 Gen 7 21KV001SGE | |
| Lenovo ThinkPad P16s G2 21K9000CGE | |
| HP ZBook Fury 16 G11 | |
| PCMark 10 / Productivity | |
| Dell Precision 5690 | |
| HP ZBook Power 15 G10 | |
| HP ZBook Power 16 G11 A | |
| Genomsnitt AMD Ryzen 7 8845HS, NVIDIA RTX 2000 Ada Generation Laptop GPU (n=1) | |
| HP ZBook Fury 16 G11 | |
| Lenovo ThinkPad P1 Gen 7 21KV001SGE | |
| Lenovo ThinkPad P16s G2 21K9000CGE | |
| PCMark 10 / Digital Content Creation | |
| HP ZBook Fury 16 G11 | |
| Dell Precision 5690 | |
| Lenovo ThinkPad P1 Gen 7 21KV001SGE | |
| HP ZBook Power 15 G10 | |
| HP ZBook Power 16 G11 A | |
| Genomsnitt AMD Ryzen 7 8845HS, NVIDIA RTX 2000 Ada Generation Laptop GPU (n=1) | |
| Lenovo ThinkPad P16s G2 21K9000CGE | |
| CrossMark / Overall | |
| HP ZBook Fury 16 G11 | |
| Dell Precision 5690 | |
| HP ZBook Power 16 G11 A | |
| Genomsnitt AMD Ryzen 7 8845HS, NVIDIA RTX 2000 Ada Generation Laptop GPU (n=1) | |
| Lenovo ThinkPad P1 Gen 7 21KV001SGE | |
| HP ZBook Power 15 G10 | |
| Lenovo ThinkPad P16s G2 21K9000CGE | |
| CrossMark / Productivity | |
| HP ZBook Fury 16 G11 | |
| Dell Precision 5690 | |
| HP ZBook Power 16 G11 A | |
| Genomsnitt AMD Ryzen 7 8845HS, NVIDIA RTX 2000 Ada Generation Laptop GPU (n=1) | |
| Lenovo ThinkPad P1 Gen 7 21KV001SGE | |
| HP ZBook Power 15 G10 | |
| Lenovo ThinkPad P16s G2 21K9000CGE | |
| CrossMark / Creativity | |
| HP ZBook Fury 16 G11 | |
| HP ZBook Power 16 G11 A | |
| Genomsnitt AMD Ryzen 7 8845HS, NVIDIA RTX 2000 Ada Generation Laptop GPU (n=1) | |
| Dell Precision 5690 | |
| Lenovo ThinkPad P1 Gen 7 21KV001SGE | |
| HP ZBook Power 15 G10 | |
| Lenovo ThinkPad P16s G2 21K9000CGE | |
| CrossMark / Responsiveness | |
| HP ZBook Fury 16 G11 | |
| Dell Precision 5690 | |
| HP ZBook Power 16 G11 A | |
| Genomsnitt AMD Ryzen 7 8845HS, NVIDIA RTX 2000 Ada Generation Laptop GPU (n=1) | |
| Lenovo ThinkPad P1 Gen 7 21KV001SGE | |
| Lenovo ThinkPad P16s G2 21K9000CGE | |
| HP ZBook Power 15 G10 | |
| WebXPRT 3 / Overall | |
| HP ZBook Fury 16 G11 | |
| HP ZBook Power 15 G10 | |
| HP ZBook Power 16 G11 A | |
| Genomsnitt AMD Ryzen 7 8845HS, NVIDIA RTX 2000 Ada Generation Laptop GPU (n=1) | |
| Dell Precision 5690 | |
| Lenovo ThinkPad P1 Gen 7 21KV001SGE | |
| Lenovo ThinkPad P16s G2 21K9000CGE | |
| WebXPRT 4 / Overall | |
| HP ZBook Fury 16 G11 | |
| Dell Precision 5690 | |
| Lenovo ThinkPad P1 Gen 7 21KV001SGE | |
| HP ZBook Power 16 G11 A | |
| Genomsnitt AMD Ryzen 7 8845HS, NVIDIA RTX 2000 Ada Generation Laptop GPU (n=1) | |
| HP ZBook Power 15 G10 | |
| Mozilla Kraken 1.1 / Total | |
| Lenovo ThinkPad P16s G2 21K9000CGE | |
| HP ZBook Power 15 G10 | |
| HP ZBook Power 16 G11 A | |
| Genomsnitt AMD Ryzen 7 8845HS, NVIDIA RTX 2000 Ada Generation Laptop GPU (n=1) | |
| Lenovo ThinkPad P1 Gen 7 21KV001SGE | |
| Dell Precision 5690 | |
| HP ZBook Fury 16 G11 | |
* ... mindre är bättre
| PCMark 10 Score | 7376 poäng | |
Hjälp | ||
| AIDA64 / Memory Copy | |
| Dell Precision 5690 | |
| HP ZBook Power 15 G10 | |
| Genomsnitt AMD Ryzen 7 8845HS (61459 - 71873, n=12) | |
| Lenovo ThinkPad P16s G2 21K9000CGE | |
| Lenovo ThinkPad P1 Gen 7 21KV001SGE | |
| HP ZBook Power 16 G11 A | |
| HP ZBook Fury 16 G11 | |
| AIDA64 / Memory Read | |
| Dell Precision 5690 | |
| Lenovo ThinkPad P1 Gen 7 21KV001SGE | |
| HP ZBook Power 15 G10 | |
| HP ZBook Power 16 G11 A | |
| HP ZBook Fury 16 G11 | |
| Genomsnitt AMD Ryzen 7 8845HS (49866 - 61976, n=12) | |
| Lenovo ThinkPad P16s G2 21K9000CGE | |
| AIDA64 / Memory Write | |
| Lenovo ThinkPad P16s G2 21K9000CGE | |
| Genomsnitt AMD Ryzen 7 8845HS (68425 - 93239, n=12) | |
| HP ZBook Power 15 G10 | |
| HP ZBook Power 16 G11 A | |
| Dell Precision 5690 | |
| Lenovo ThinkPad P1 Gen 7 21KV001SGE | |
| HP ZBook Fury 16 G11 | |
| AIDA64 / Memory Latency | |
| Dell Precision 5690 | |
| Lenovo ThinkPad P1 Gen 7 21KV001SGE | |
| Lenovo ThinkPad P16s G2 21K9000CGE | |
| HP ZBook Power 15 G10 | |
| HP ZBook Power 16 G11 A | |
| Genomsnitt AMD Ryzen 7 8845HS (82.5 - 117, n=12) | |
| HP ZBook Fury 16 G11 | |
* ... mindre är bättre
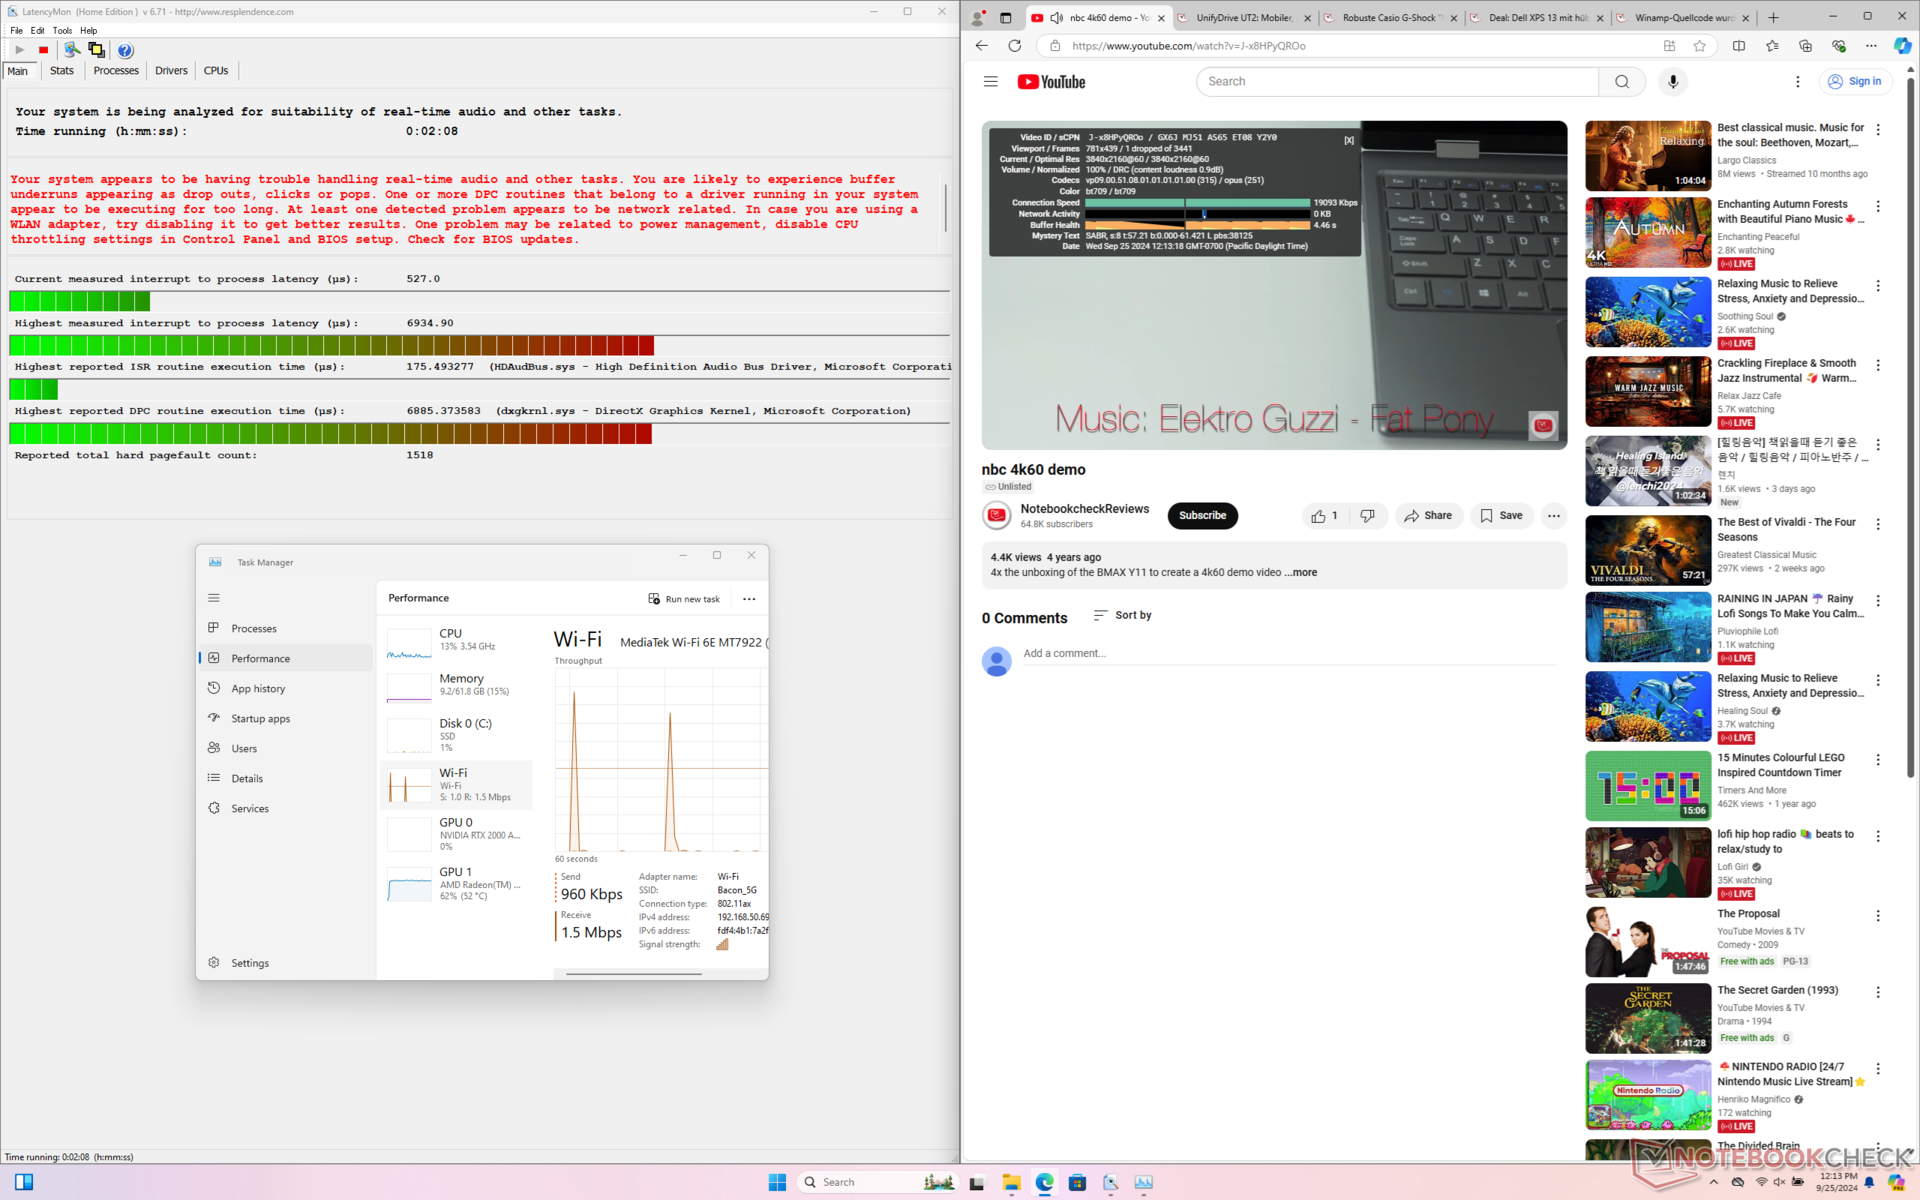
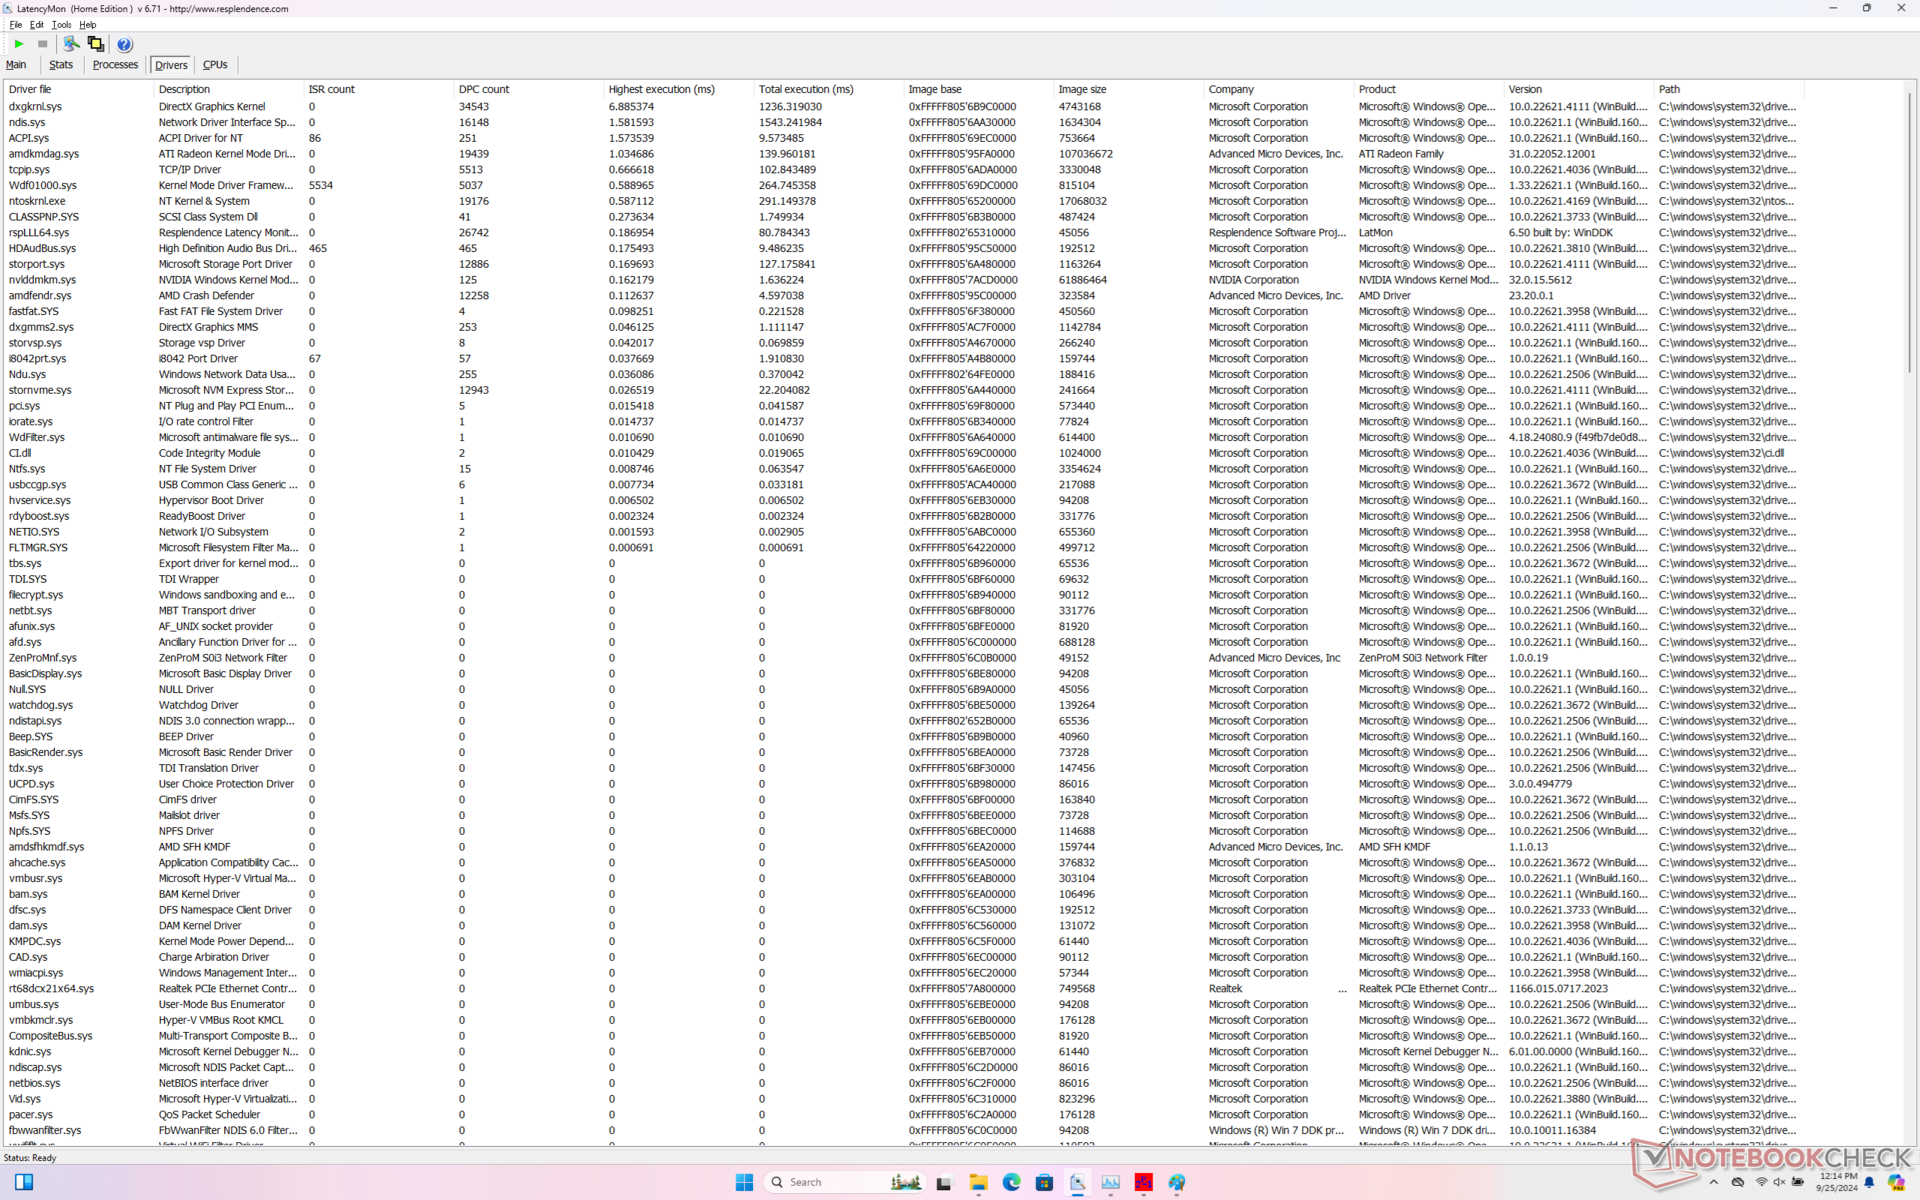
DPC-fördröjning
LatencyMon avslöjar DPC-problem relaterade till HDAudBus.sys även efter flera omtest. 4K-videouppspelning med 60 FPS är annars utmärkt med bara en enda tappad bild registrerad under ett 60-sekundersfönster.
| DPC Latencies / LatencyMon - interrupt to process latency (max), Web, Youtube, Prime95 | |
| HP ZBook Fury 16 G11 | |
| HP ZBook Power 16 G11 A | |
| HP ZBook Power 15 G10 | |
| Lenovo ThinkPad P1 Gen 7 21KV001SGE | |
| Lenovo ThinkPad P16s G2 21K9000CGE | |
| Dell Precision 5690 | |
* ... mindre är bättre
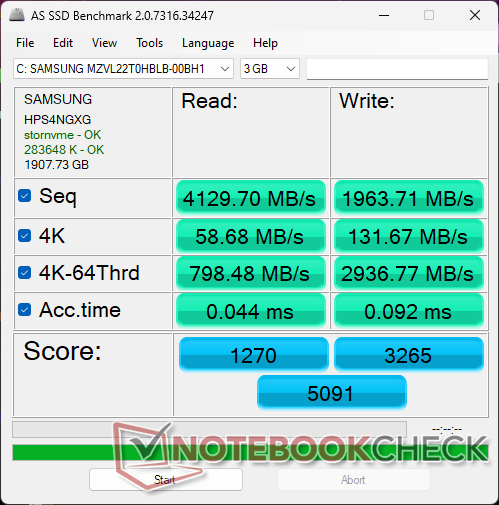
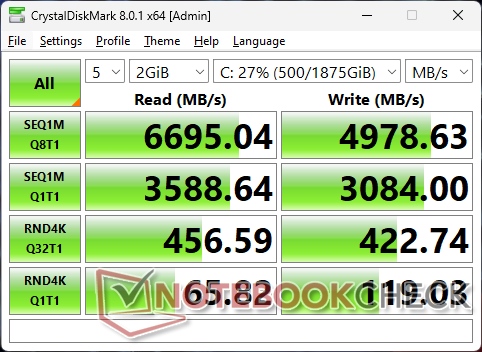
Lagringsenheter
Vår testenhet levereras med en 2 TB Samsung PM9A1 PCIe4 x4 NVMe SSD för sekventiella läshastigheter så höga som 6700 MB/s. Tyvärr skulle enheten snabbt gasa ner till låga 2000 MB/s efter bara några minuters stress, vilket visas av våra DiskSpd-looptestresultat nedan. Vi upprepade testet och resultaten förbättrades inte. Detta är en besvikelse eftersom WD-enheten i den äldre ZBook Power 15 G10 inte uppvisade några problem med strypning. En värmespridare skulle sannolikt ha förbättrat prestandan.

| Drive Performance Rating - Percent | |
| HP ZBook Fury 16 G11 | |
| Dell Precision 5690 | |
| Lenovo ThinkPad P16s G2 21K9000CGE | |
| HP ZBook Power 15 G10 | |
| HP ZBook Power 16 G11 A | |
| Lenovo ThinkPad P1 Gen 7 21KV001SGE | |
* ... mindre är bättre
Disk Throttling: DiskSpd Read Loop, Queue Depth 8
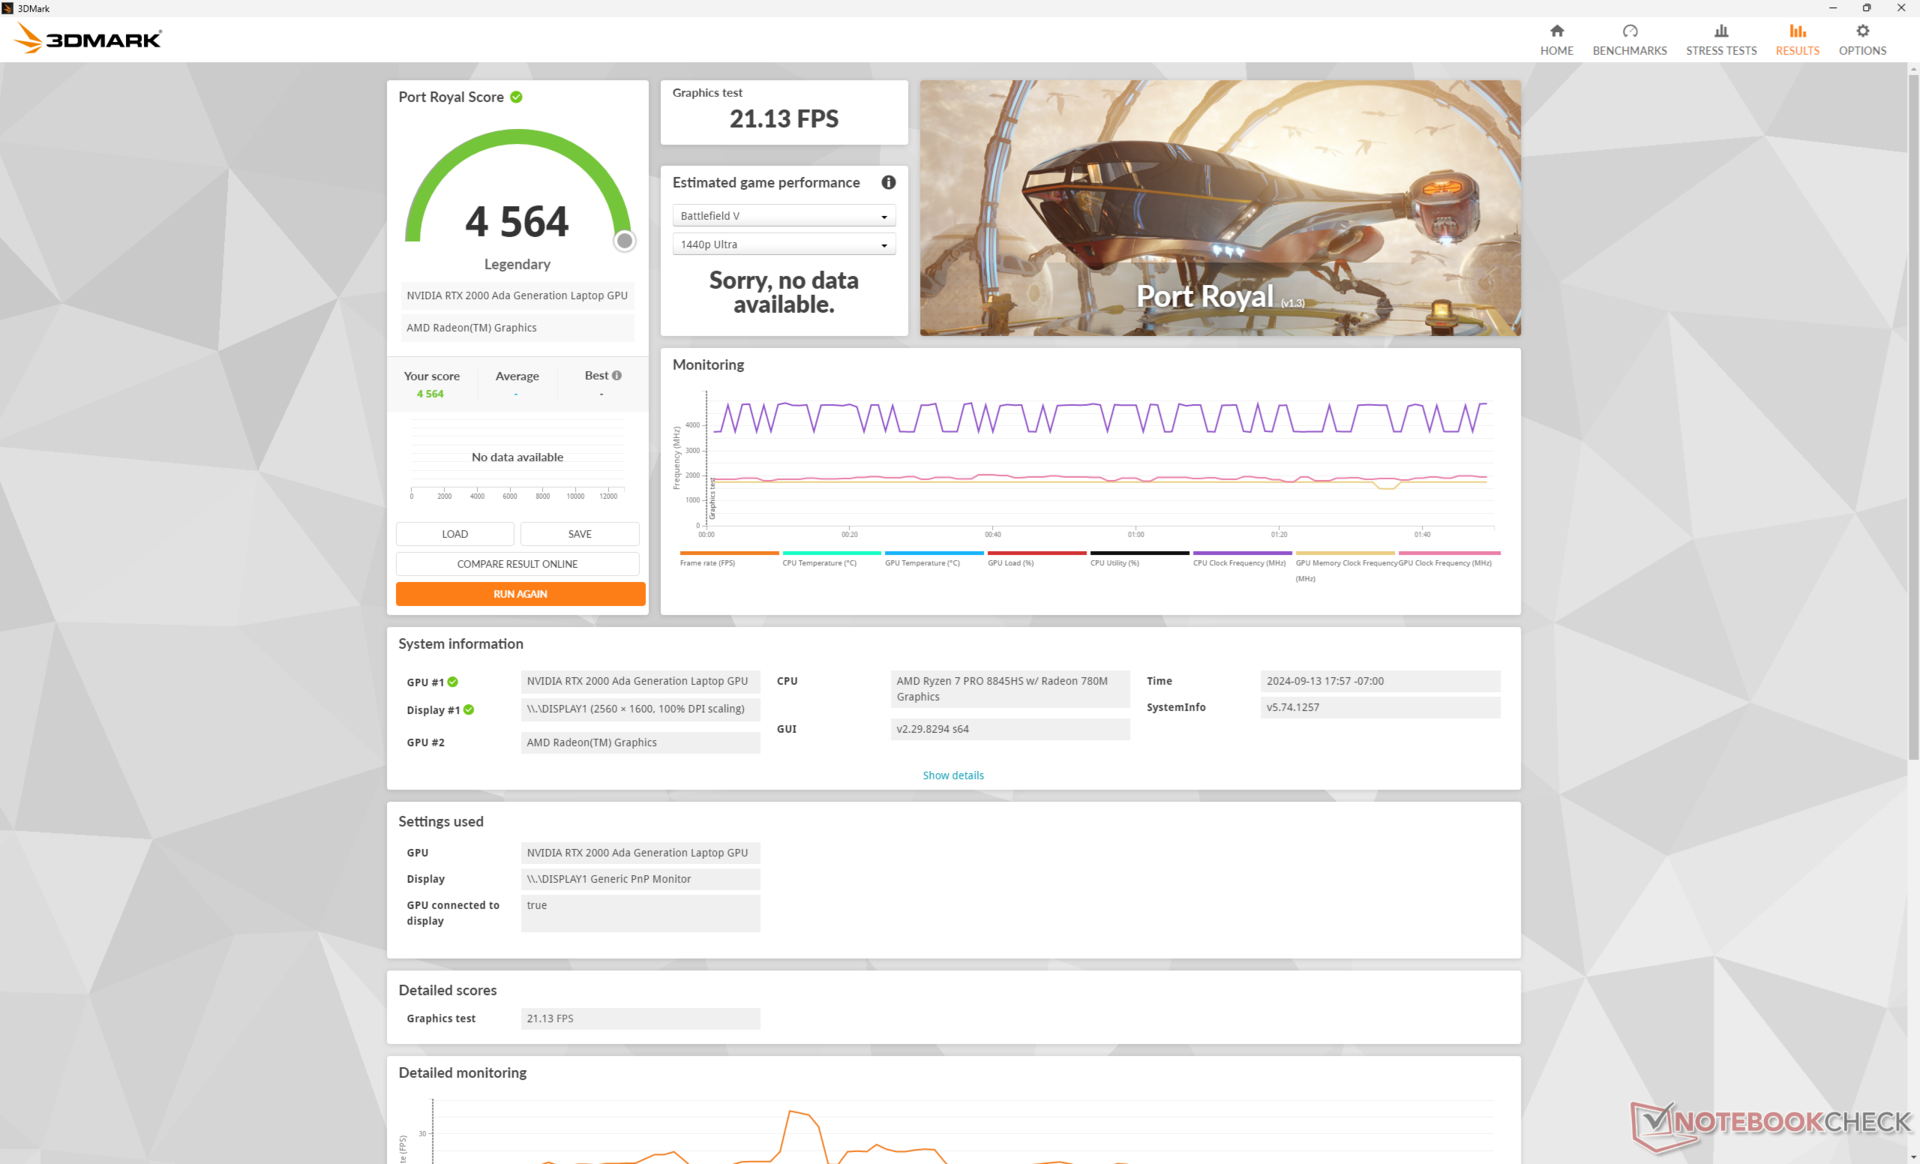
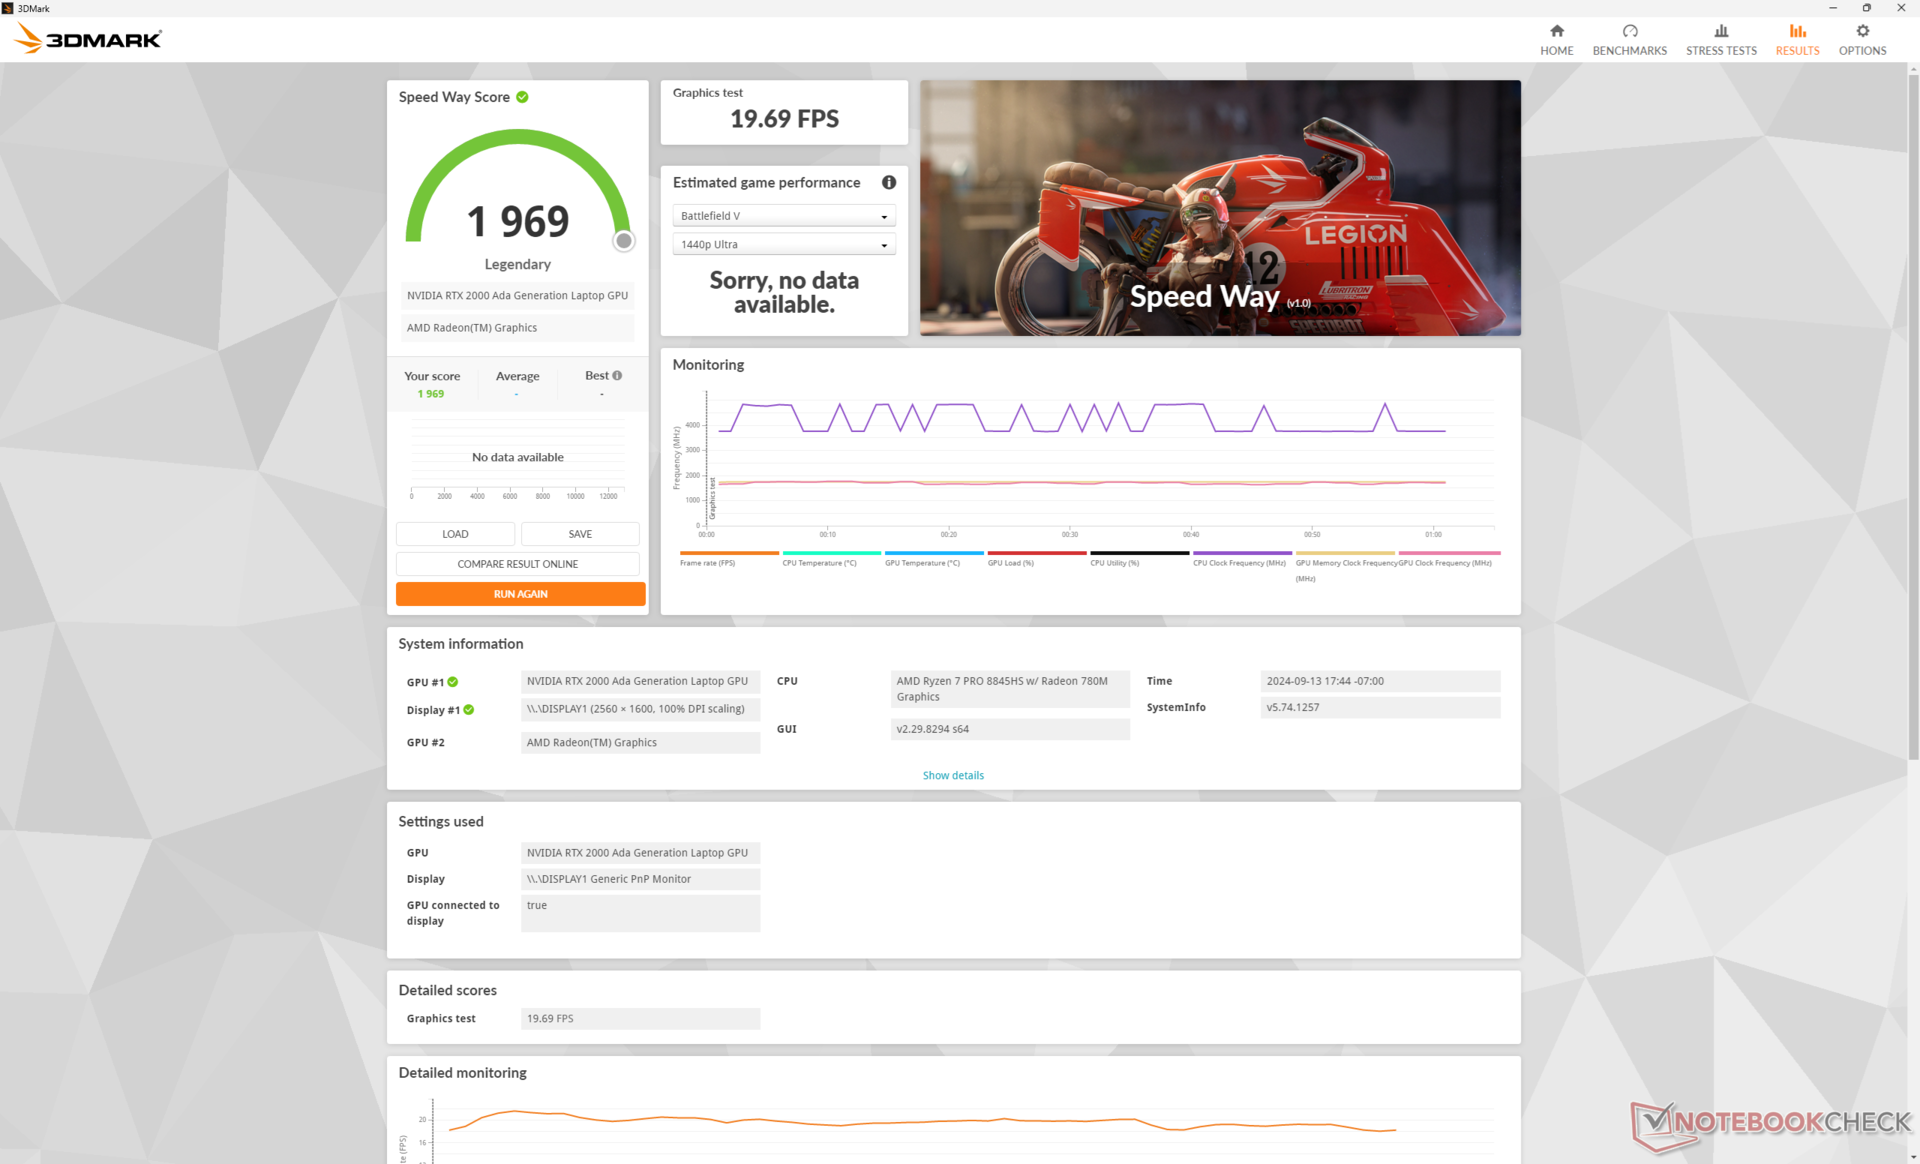
GPU-prestanda
Alternativen för diskreta GPU:er är identiska med 15-tums ZBook Power 15 G10 eftersom Nvidia ännu inte har lanserat någon efterföljare till den mobila Ada Lovelace-serien. Dessutom har kylningslösningen inte förbättrats nämnvärt under övergången till en 16-tums formfaktor, vilket innebär att ZBook Power 16 G11 fortfarande är begränsad till samma 50 W TGP-tak och RTX 1000 Ada, RTX 2000 Adaoch RTX 3000 Ada grafikalternativ som tidigare. Användare måste överväga den tjockare ZBook Fury 16-serien för avancerade RTX Ada-alternativ.
Uppgradering till RTX 3000 Ada ger i bästa fall marginella prestandaförbättringar baserat på vår erfarenhet av Dell Precision 5490.
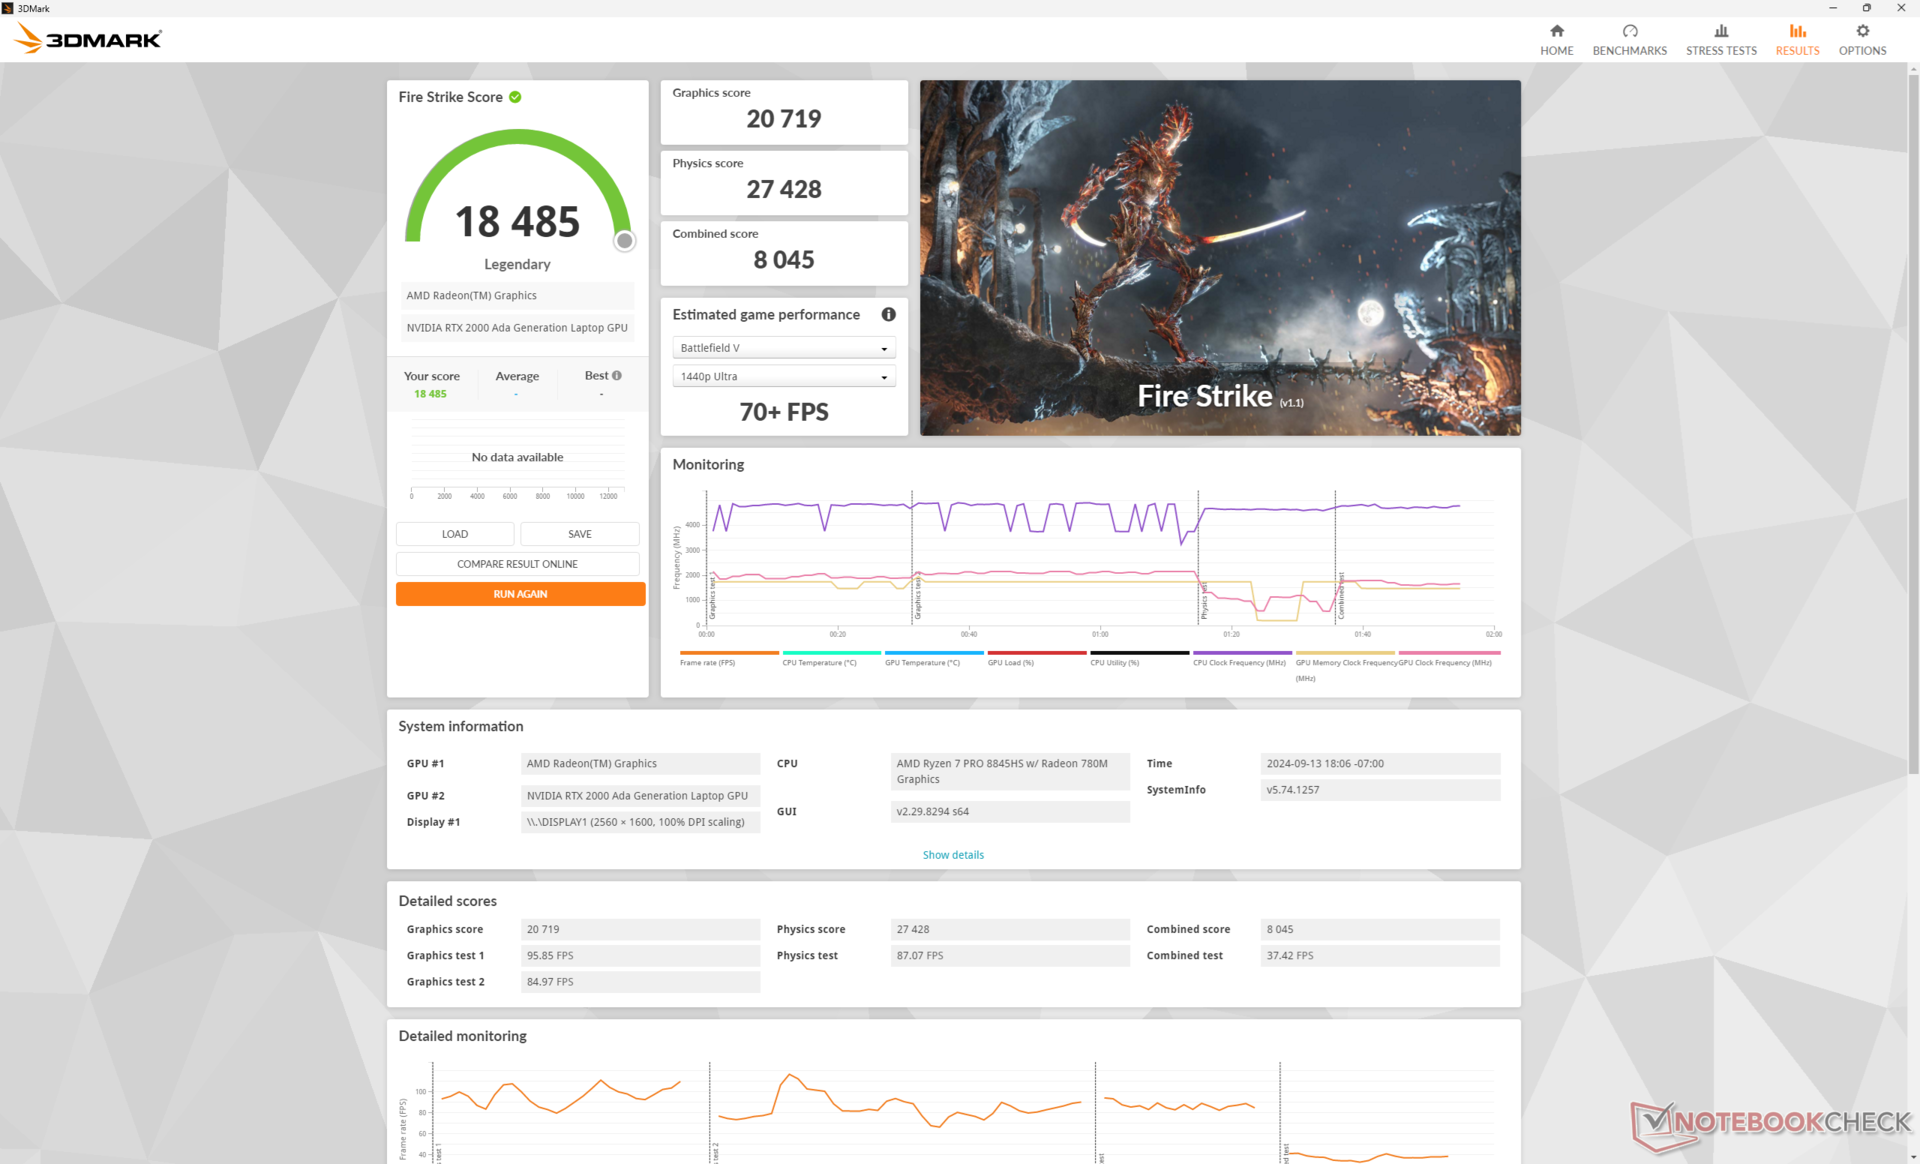
| Effektprofil | Grafikpoäng | Fysikpoäng | Kombinerad poäng |
| Prestanda-läge | 20719 | 27428 | 8045 |
| Balanserat läge | 19961 (-4%) | 26363 (-4%) | 7633 (-5%) |
| Batteri | 8108 (-61%) | 6149 (-78%) | 1727 (-79%) |
Att köra i balanserat läge istället för prestandaläge påverkar prestandan något, vilket framgår av vår Fire Strike resultattabell ovan. Både CPU- och GPU-prestanda minskar dock avsevärt om du kör på batterier.
| 3DMark Performance Rating - Percent | |
| Dell Precision 5690 -3! | |
| HP ZBook Fury 16 G11 | |
| HP ZBook Fury 16 G9 -3! | |
| HP ZBook Power 16 G11 A | |
| Genomsnitt NVIDIA RTX 2000 Ada Generation Laptop GPU | |
| Dell Precision 5000 5490 -3! | |
| MSI CreatorPro Z16P B12UKST -19! | |
| HP ZBook Power 15 G10 -11! | |
| Asus ExpertBook B6 Flip B6602FC2 -19! | |
| Lenovo ThinkPad P16v G1 AMD -18! | |
| Lenovo ThinkPad P1 G4-20Y4Z9DVUS -19! | |
| Lenovo ThinkPad P16s G2 21K9000CGE -19! | |
| HP ZBook Firefly 16 G9-6B897EA -19! | |
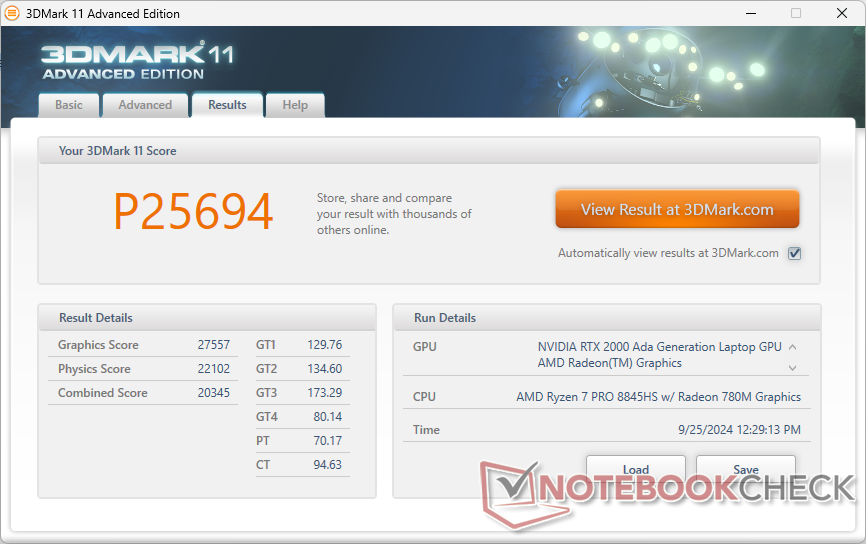
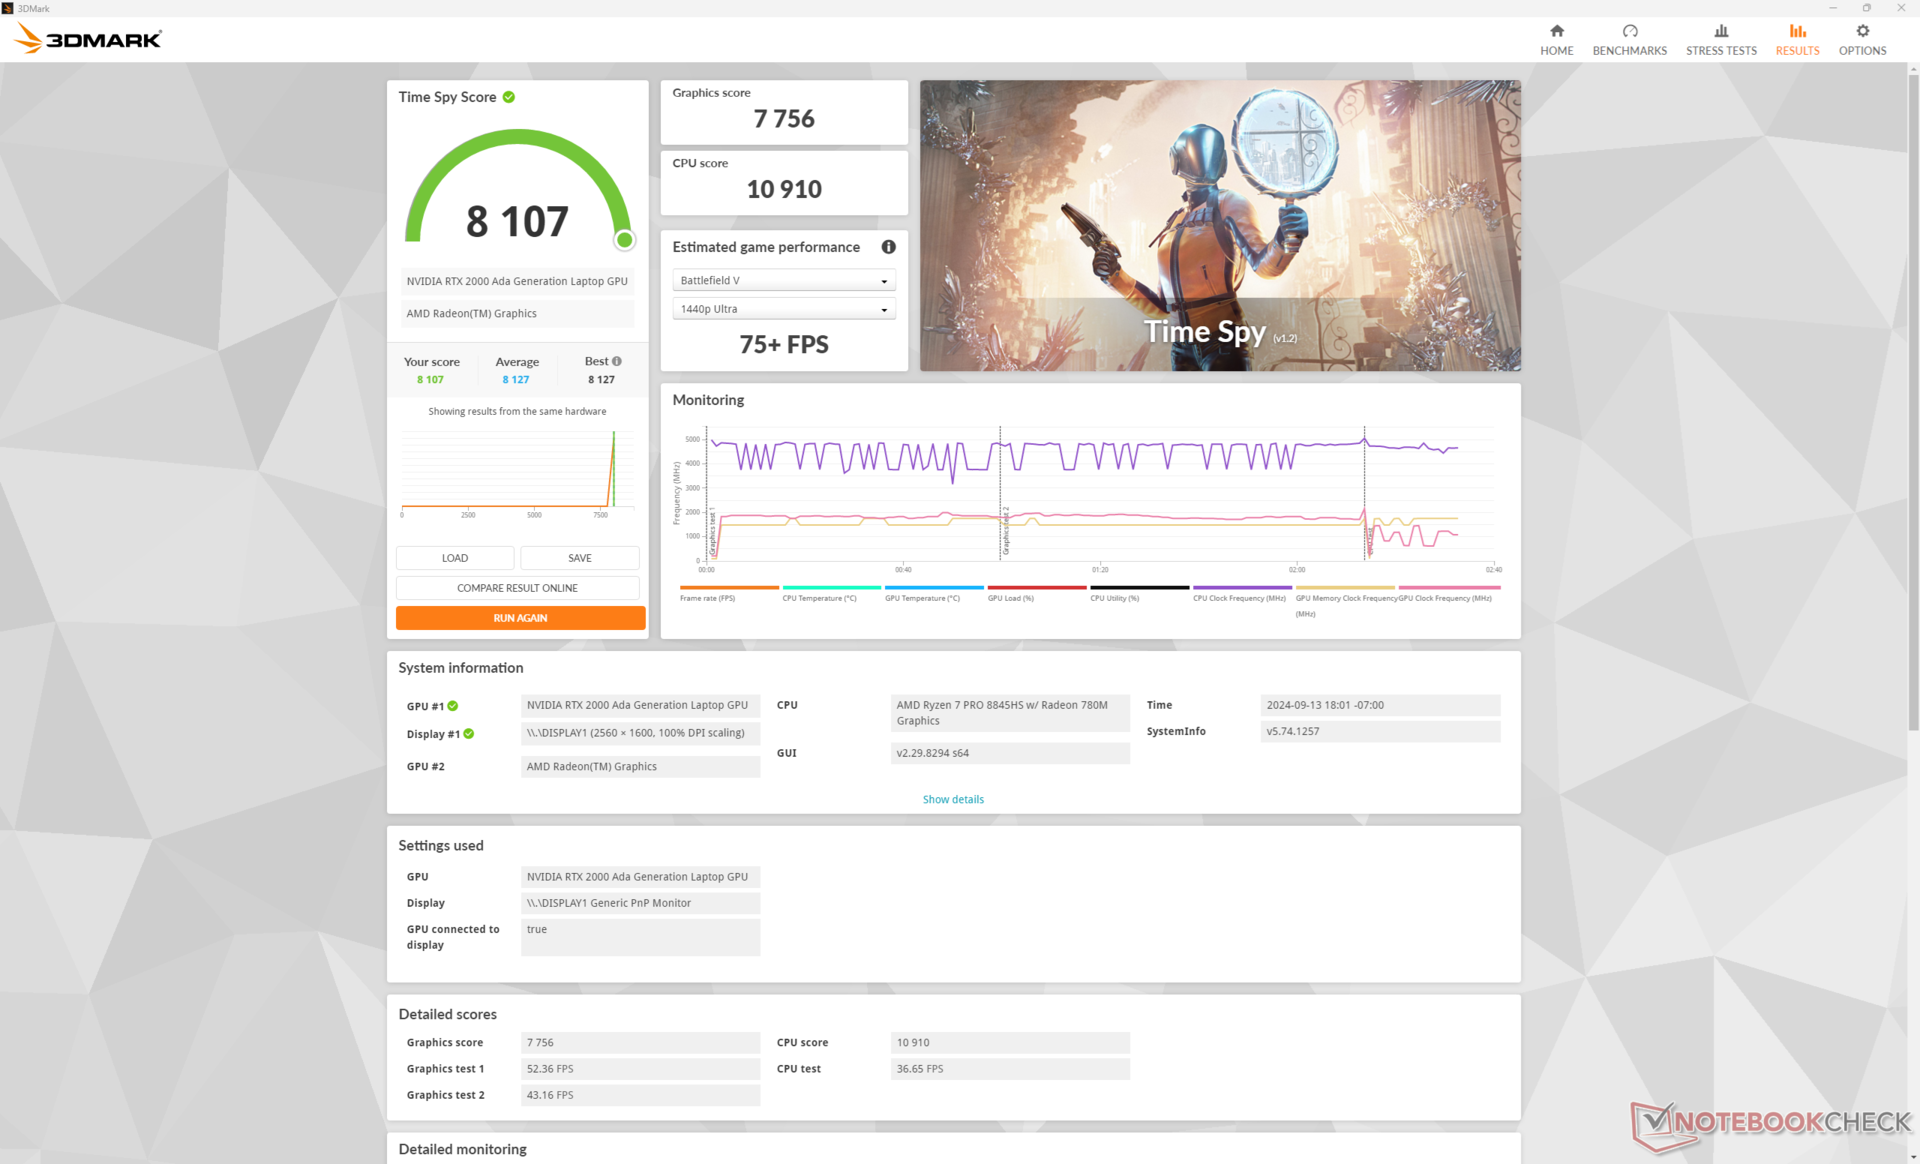
| 3DMark 11 Performance | 25694 poäng | |
| 3DMark Cloud Gate Standard Score | 51846 poäng | |
| 3DMark Fire Strike Score | 18485 poäng | |
| 3DMark Time Spy Score | 8107 poäng | |
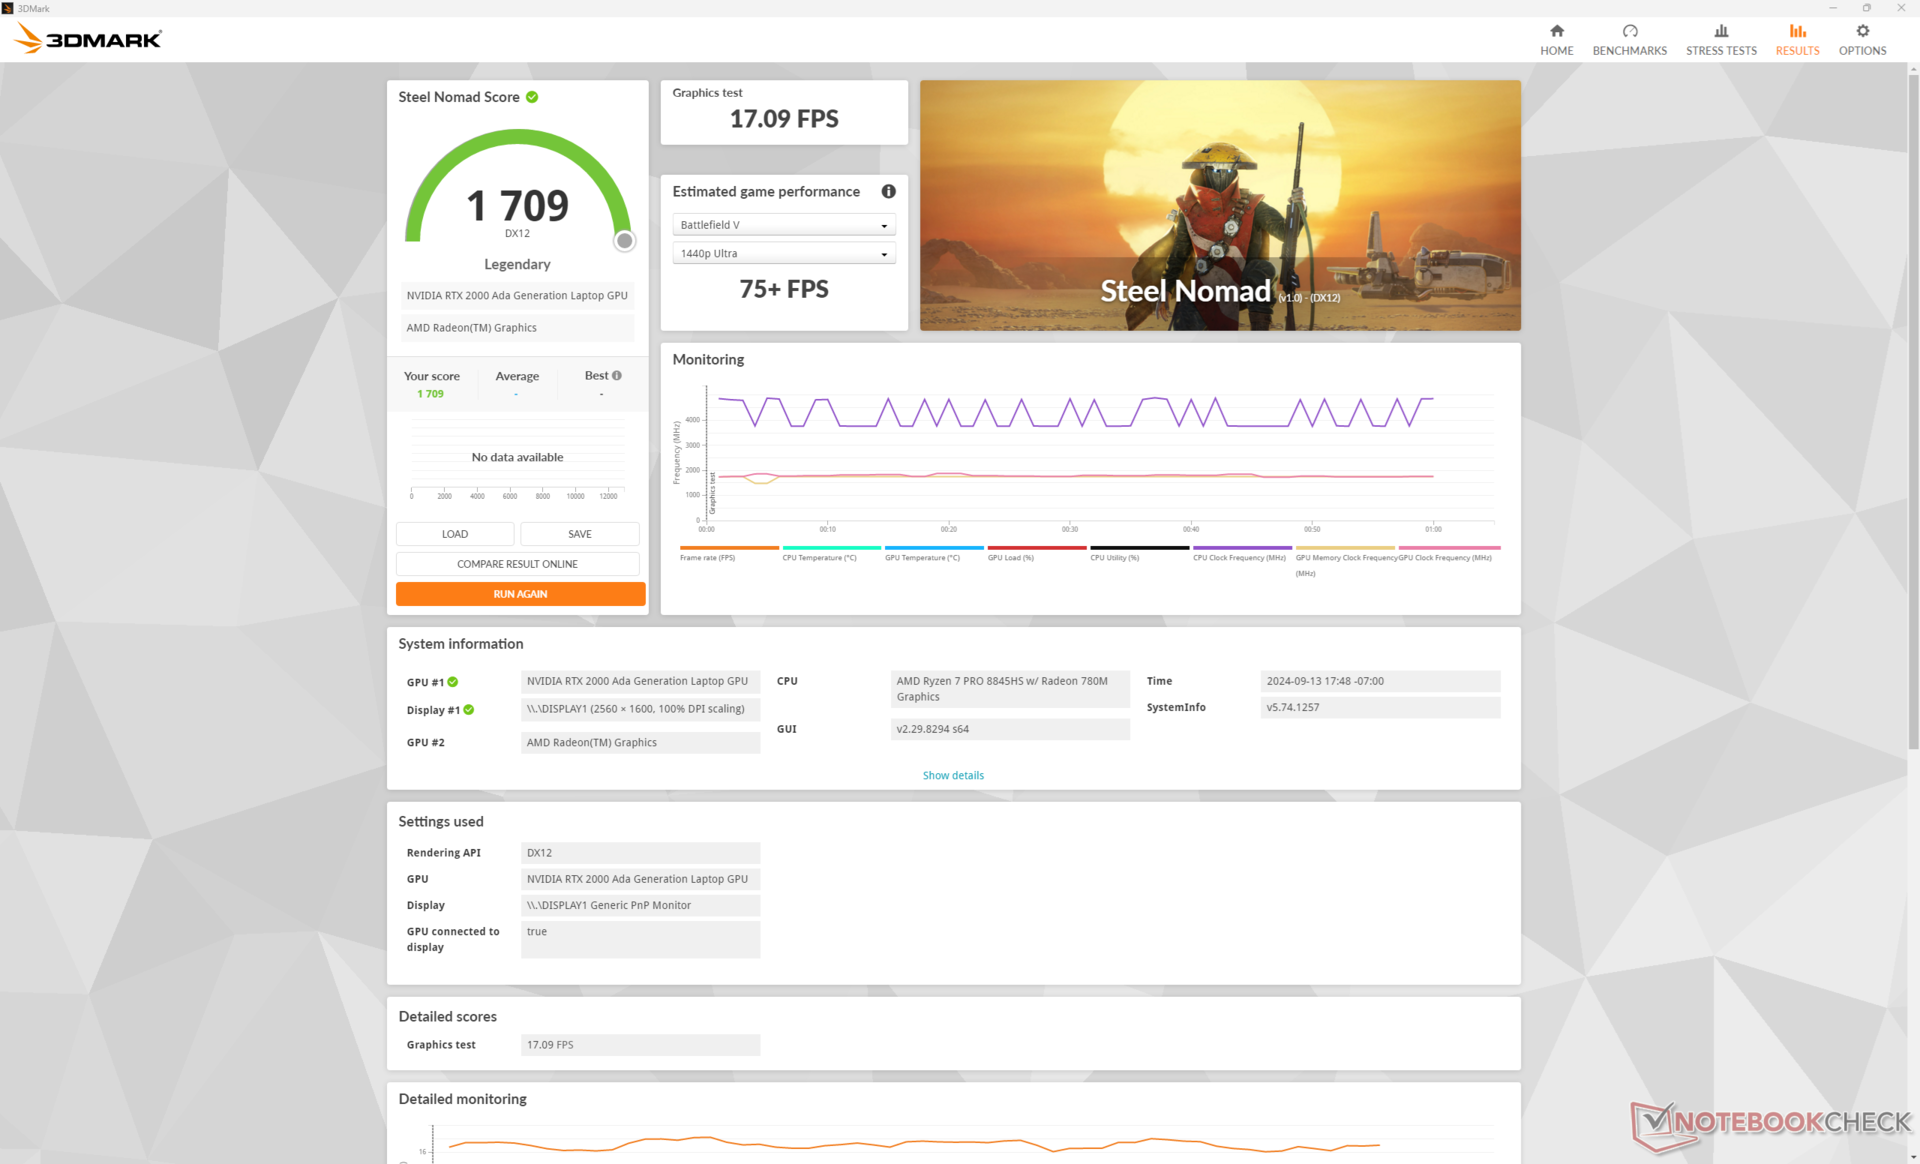
| 3DMark Steel Nomad Score | 1709 poäng | |
Hjälp | ||
* ... mindre är bättre
Prestanda för spel
Även om RTX 2000 Ada inte är optimerad för spel är den mest lik bärbara datorer som körs på GeForce RTX 3060 eller RTX 4060.
| GTA V - 1920x1080 Highest Settings possible AA:4xMSAA + FX AF:16x | |
| HP ZBook Fury 16 G9 | |
| HP ZBook Fury 16 G11 | |
| MSI CreatorPro Z16P B12UKST | |
| HP ZBook Power 16 G11 A | |
| HP ZBook Power 15 G10 | |
| Asus ExpertBook B6 Flip B6602FC2 | |
| Lenovo ThinkPad P16v G1 AMD | |
| HP ZBook Firefly 16 G9-6B897EA | |
| Lenovo ThinkPad P16s G2 21K9000CGE | |
Cyberpunk 2077 ultra FPS Chart
| låg | med. | hög | ultra | QHD | |
|---|---|---|---|---|---|
| GTA V (2015) | 180.6 | 162.7 | 90.3 | 63.4 | |
| Dota 2 Reborn (2015) | 145.2 | 142 | 126.1 | 119.9 | |
| Final Fantasy XV Benchmark (2018) | 166.1 | 89.3 | 66.3 | 49.4 | |
| X-Plane 11.11 (2018) | 83.2 | 72.1 | 60.6 | ||
| Far Cry 5 (2018) | 138 | 111 | 104 | 98 | 67 |
| Strange Brigade (2018) | 329 | 187.8 | 158.1 | 138.5 | 99.5 |
| Tiny Tina's Wonderlands (2022) | 139.1 | 115.1 | 80 | 64.4 | 46.3 |
| F1 22 (2022) | 186.6 | 171.1 | 129.1 | 46.2 | 29.8 |
| Baldur's Gate 3 (2023) | 87.1 | 75.7 | 67.6 | 66.1 | 45.6 |
| Cyberpunk 2077 2.2 Phantom Liberty (2023) | 81.1 | 61.4 | 51.7 | 44.8 | 29.7 |
Utsläpp
Systembuller
Fläktens ljudnivåer och beteende liknar det vi observerade på förra årets modell. Systemet förblir tyst på bara 25,4 dB(A) även efter att ha kört den första benchmarkscenen i 3DMark 06, vilket är mycket tystare än konkurrerande modeller som ThinkPad P16s G2 eller Precision 5690 under liknande förhållanden.
Tänk på att fläktljudet är märkbart tystare i balanserat läge; att köra Cyberpunk 2077 i prestandaläge kan vara så högt som 43 dB(A) jämfört med endast 37,5 dB(A) i balanserat läge.
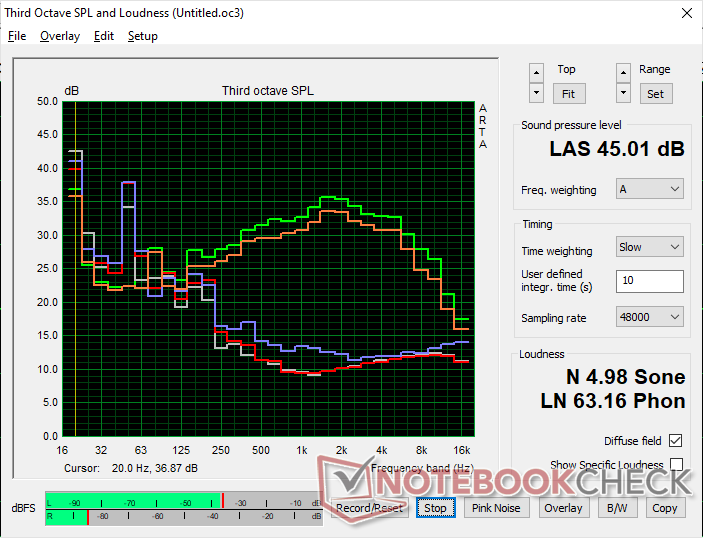
Ljudnivå
| Låg belastning |
| 23.8 / 24.2 / 24.2 dB(A) |
| Hög belastning |
| 25.4 / 45 dB(A) |
 | ||
30 dB tyst 40 dB(A) hörbar 50 dB(A) högt ljud |
||
min: | ||
| HP ZBook Power 16 G11 A NVIDIA RTX 2000 Ada Generation Laptop GPU, R7 8845HS, Samsung PM9A1 MZVL22T0HBLB | HP ZBook Power 15 G10 NVIDIA RTX 2000 Ada Generation Laptop GPU, R7 PRO 7840HS, WDC PC SN810 2TB | HP ZBook Fury 16 G11 NVIDIA RTX 3500 Ada Generation Laptop GPU, i9-14900HX, SK hynix PC801 HFS001TEJ9X101N | Lenovo ThinkPad P1 Gen 7 21KV001SGE NVIDIA GeForce RTX 4060 Laptop GPU, Ultra 7 155H, Kioxia XG8 KXG8AZNV1T02 | Lenovo ThinkPad P16s G2 21K9000CGE Radeon 780M, R7 PRO 7840U, SK hynix PC801 HFS001TEJ9X162N | Dell Precision 5690 NVIDIA RTX 5000 Ada Generation Laptop GPU, Ultra 9 185H, 2x Samsung PM9A1 1TB (RAID 0) | |
|---|---|---|---|---|---|---|
| Noise | -3% | -15% | -18% | -3% | -17% | |
| av / miljö * | 23.5 | 24.2 -3% | 23.2 1% | 24.7 -5% | 22.6 4% | 23.4 -0% |
| Idle Minimum * | 23.8 | 24.4 -3% | 23.2 3% | 24.7 -4% | 22.6 5% | 23.6 1% |
| Idle Average * | 24.2 | 24.4 -1% | 23.2 4% | 24.7 -2% | 22.6 7% | 24.9 -3% |
| Idle Maximum * | 24.2 | 24.4 -1% | 29.5 -22% | 24.7 -2% | 22.6 7% | 30.9 -28% |
| Load Average * | 25.4 | 27.4 -8% | 43 -69% | 43.7 -72% | 37.8 -49% | 40.4 -59% |
| Cyberpunk 2077 ultra * | 43 | 48.2 -12% | 53.2 -24% | |||
| Load Maximum * | 45 | 46.8 -4% | 48.2 -7% | 53.3 -18% | 40.5 10% | 51.9 -15% |
| Witcher 3 ultra * | 43.3 | 40.3 | 48.3 |
* ... mindre är bättre
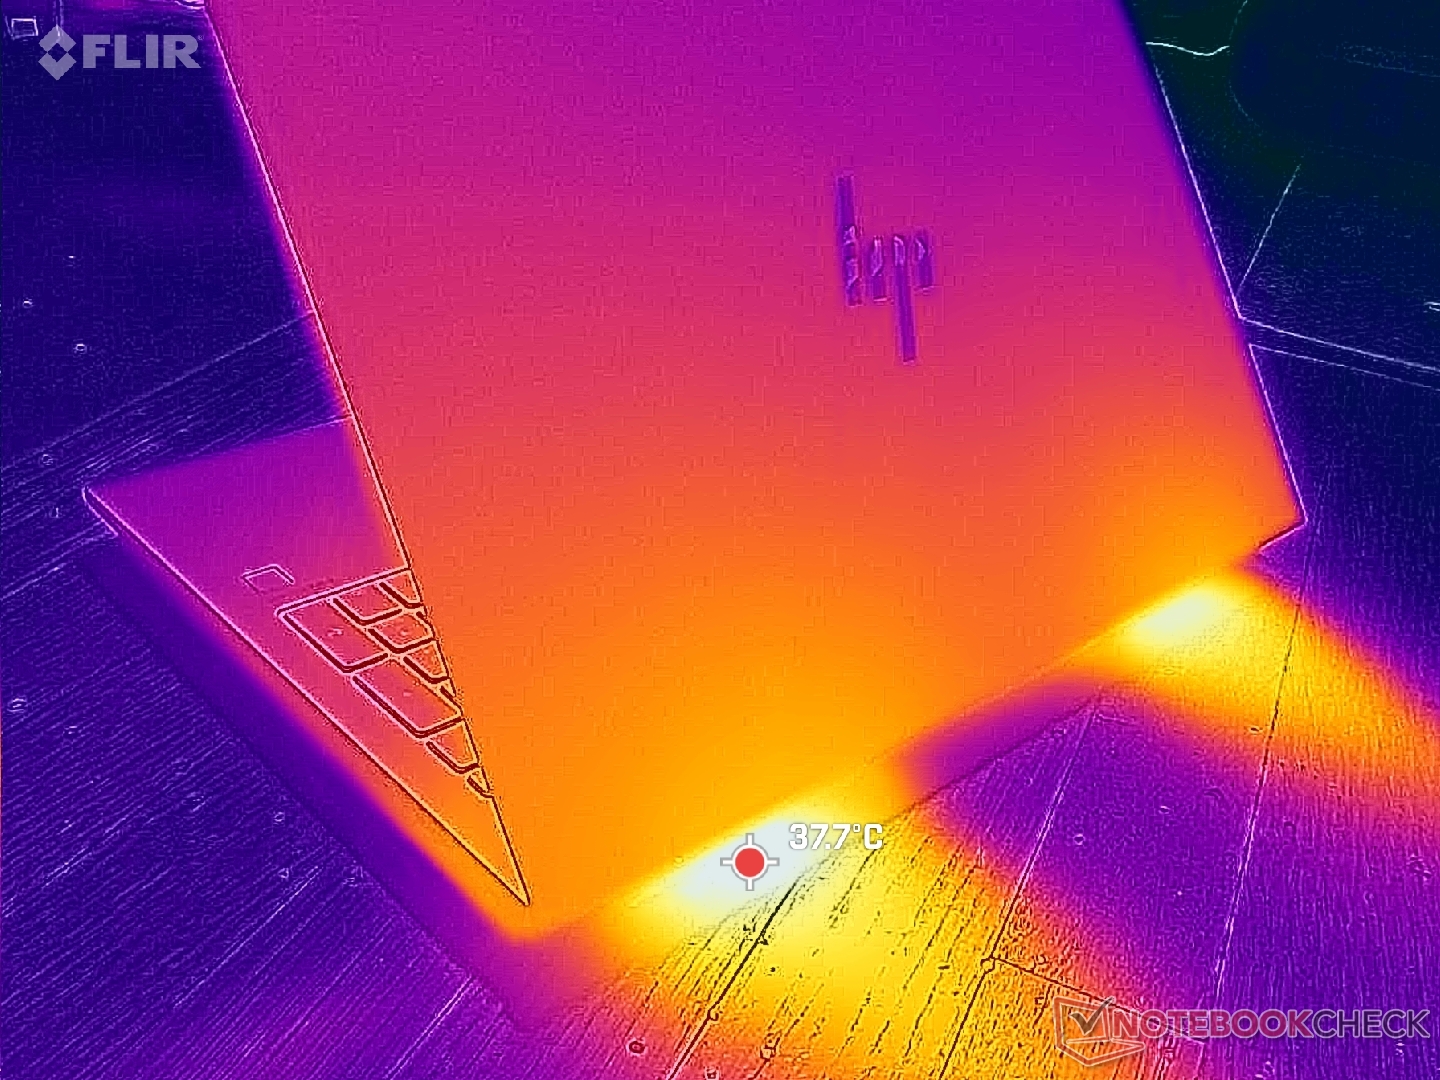
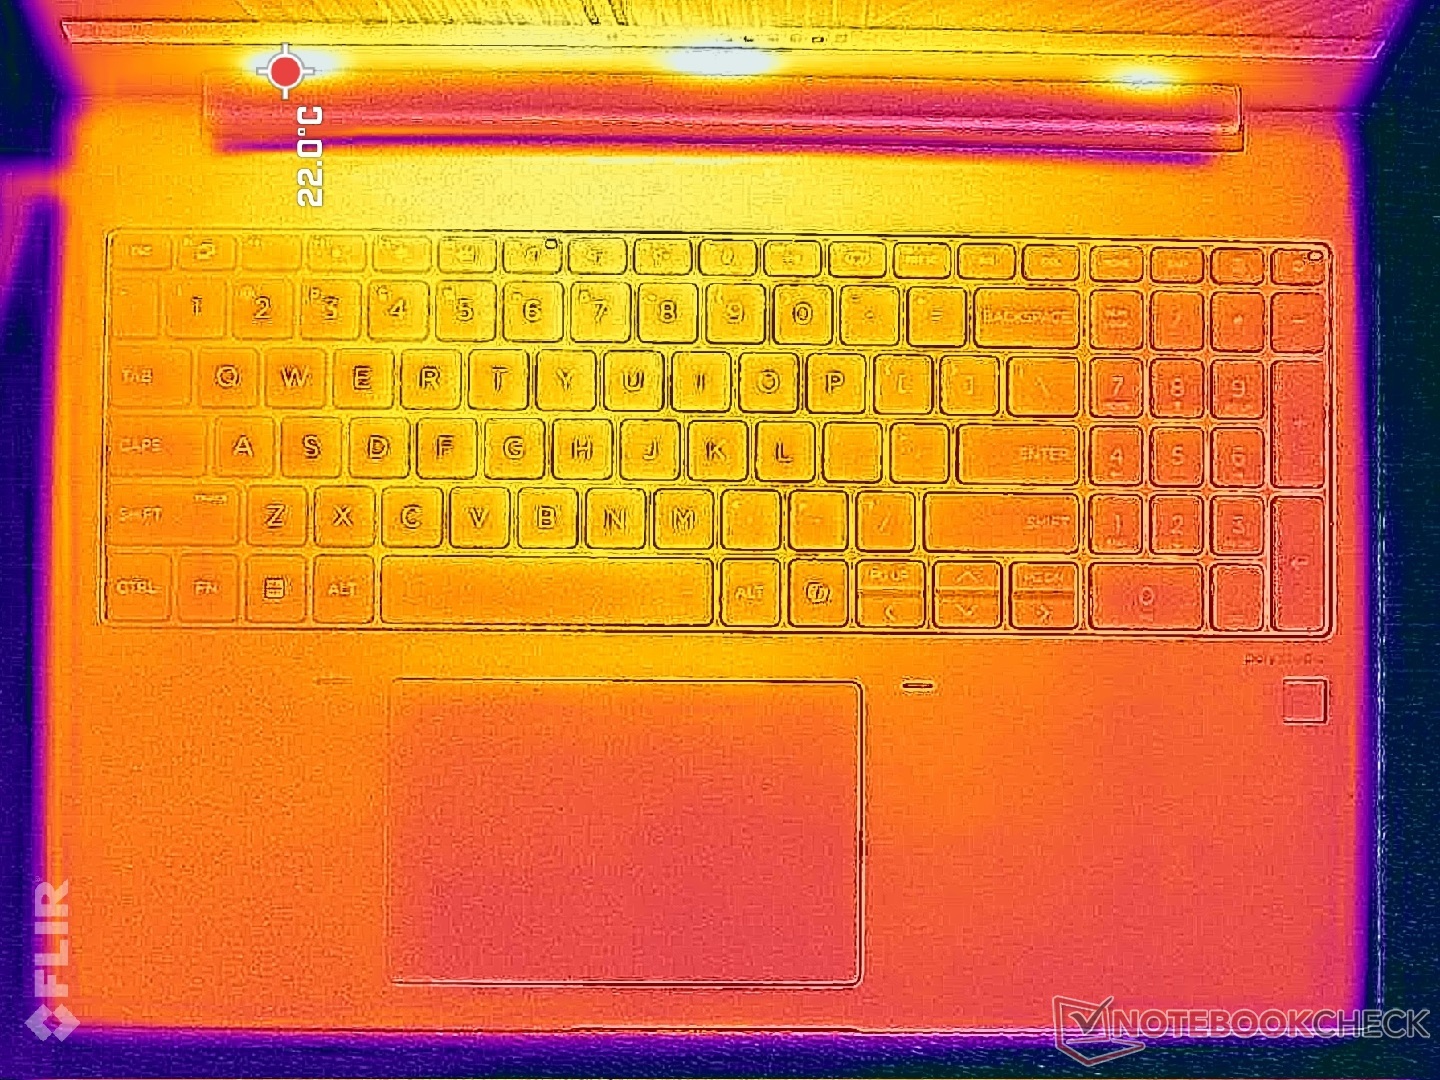
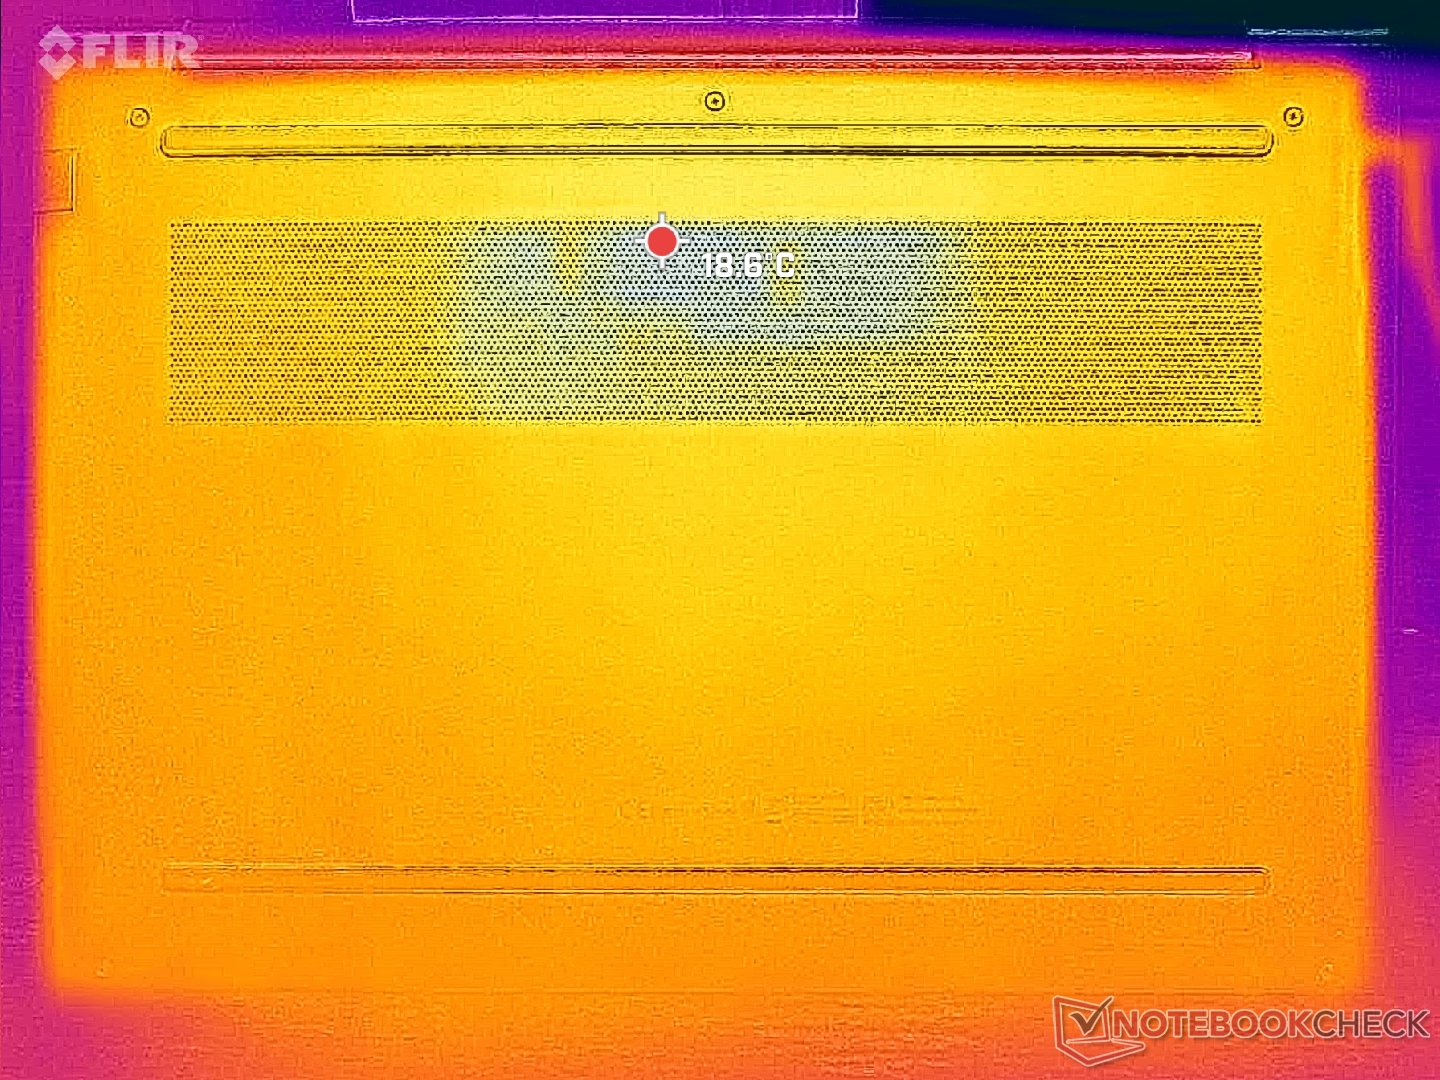
Temperatur
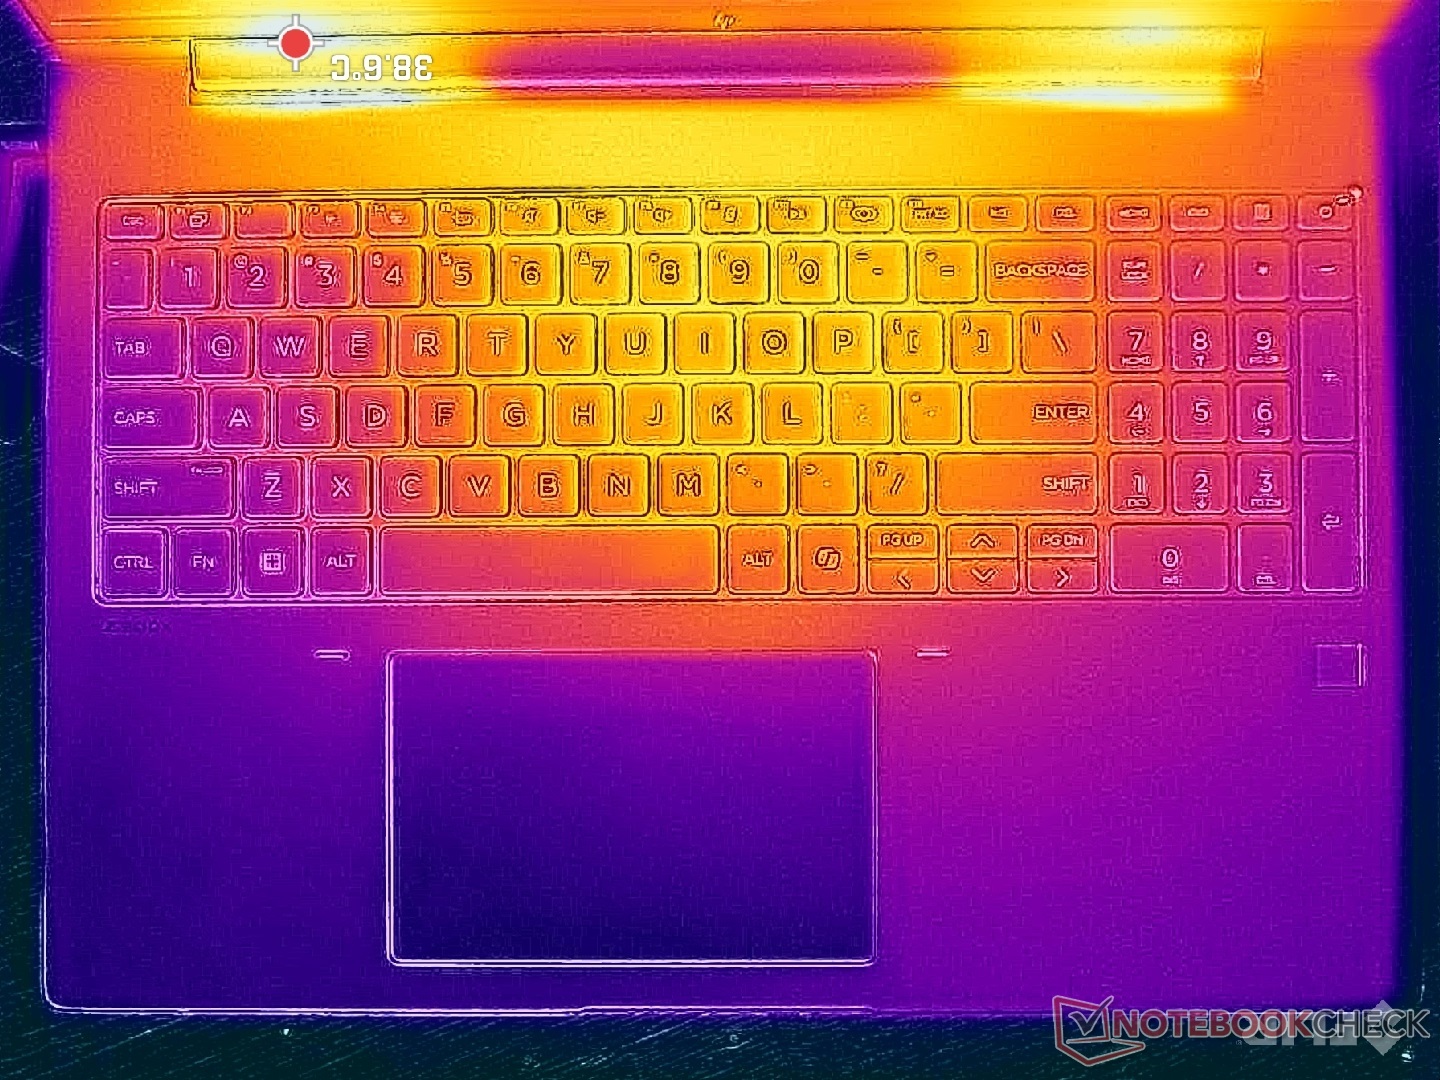
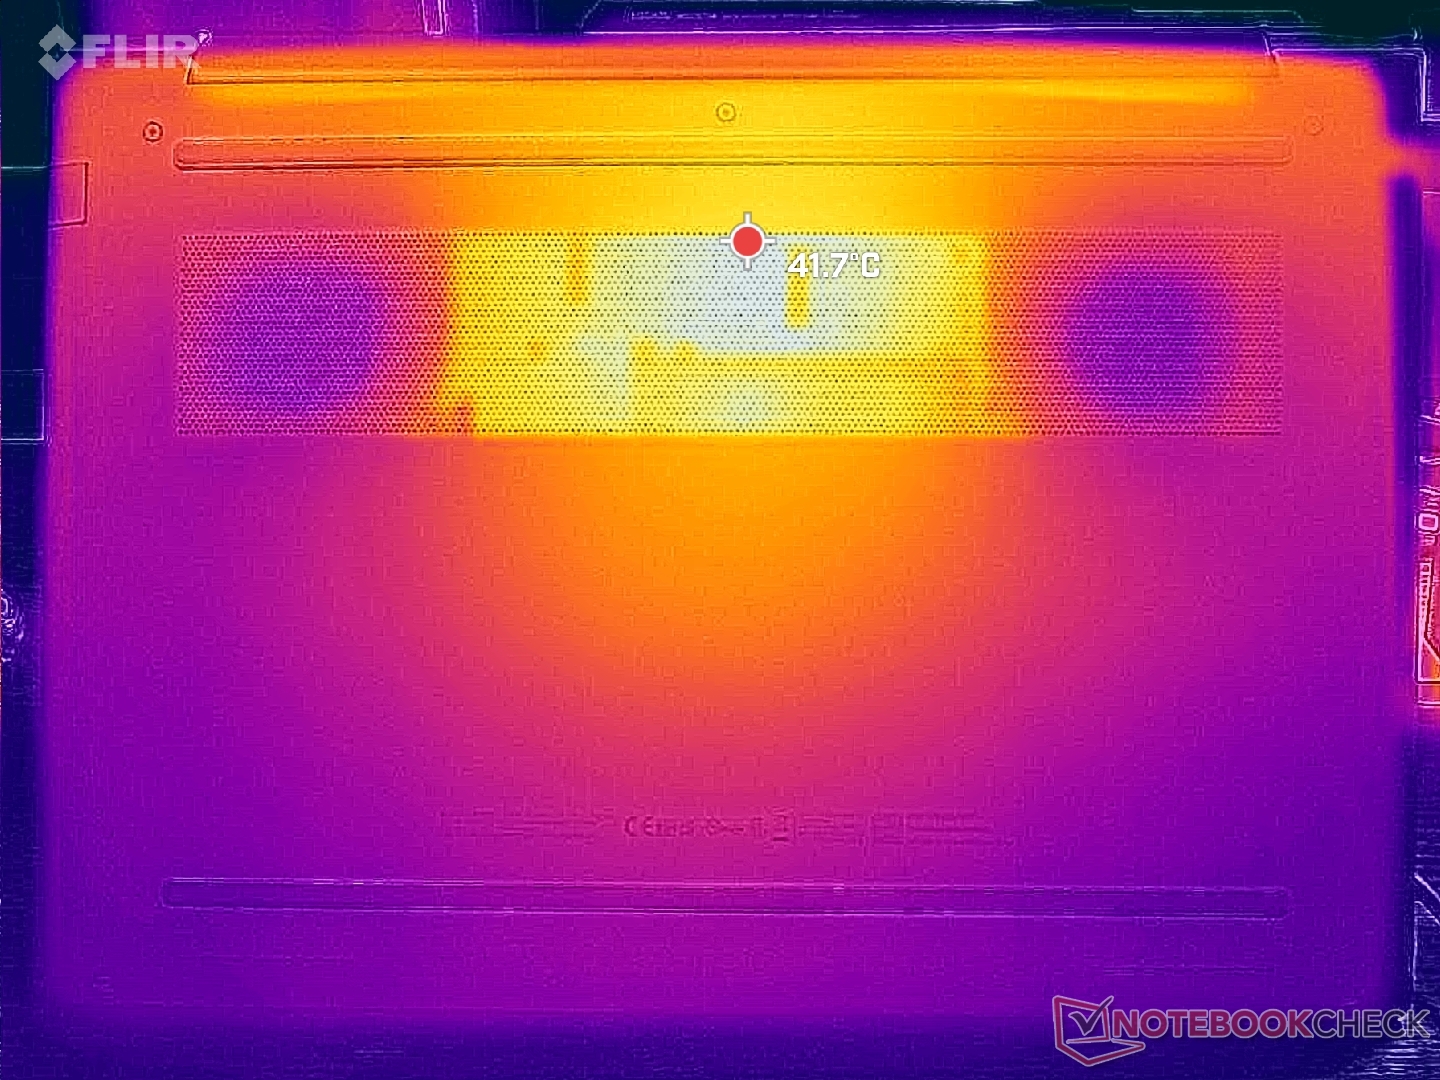
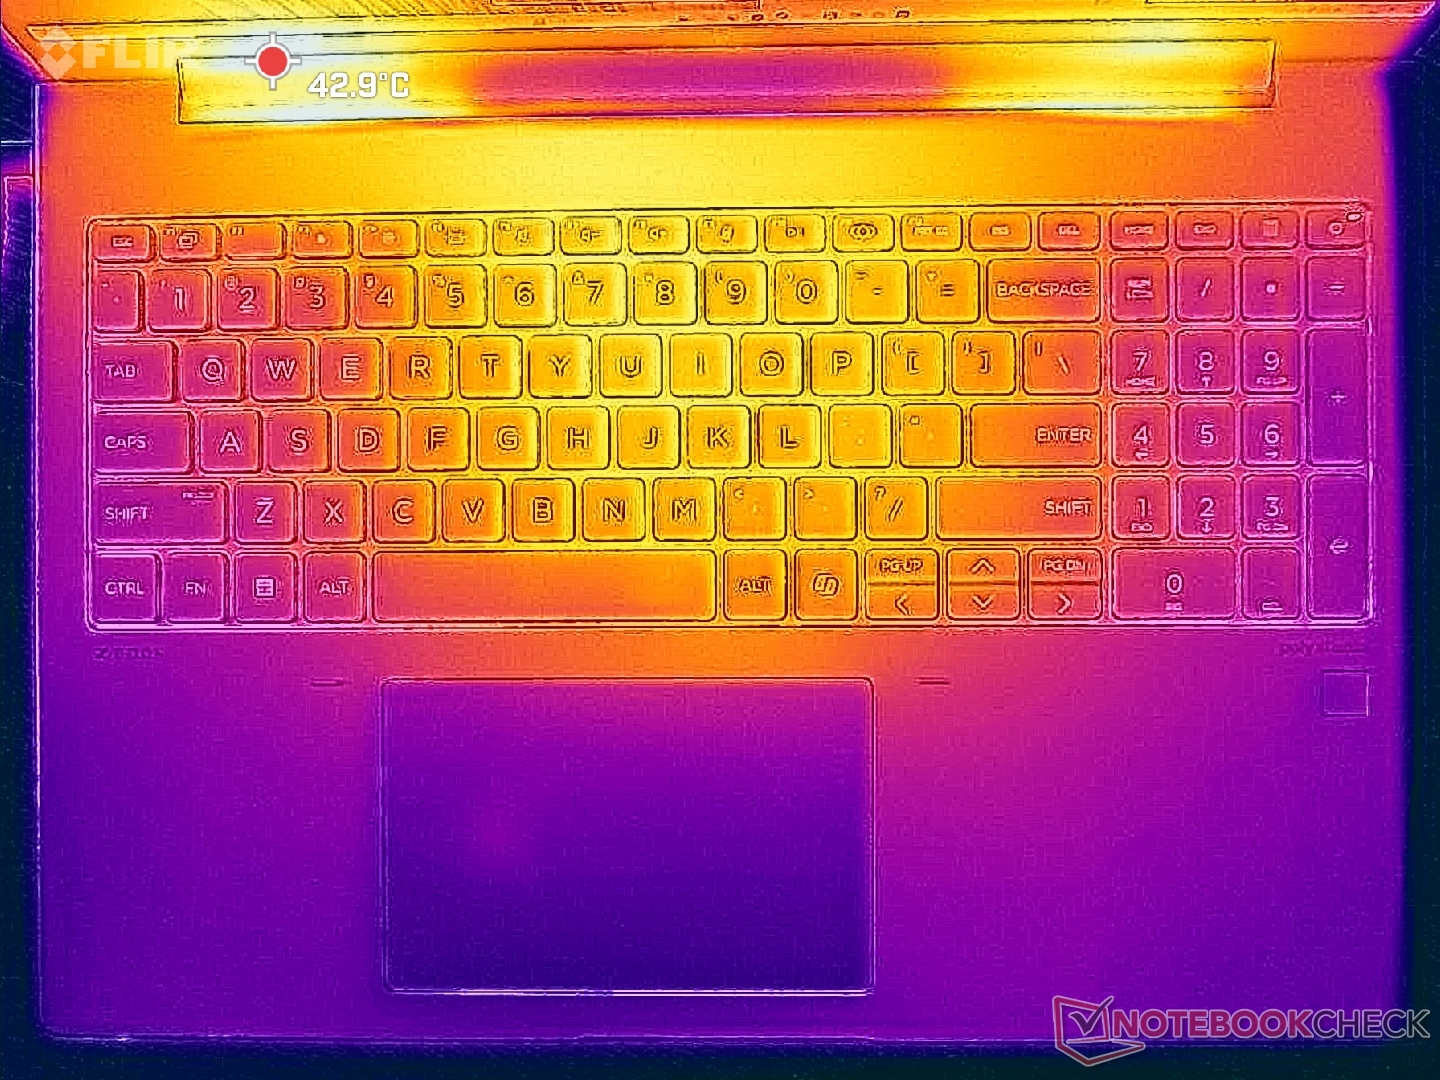
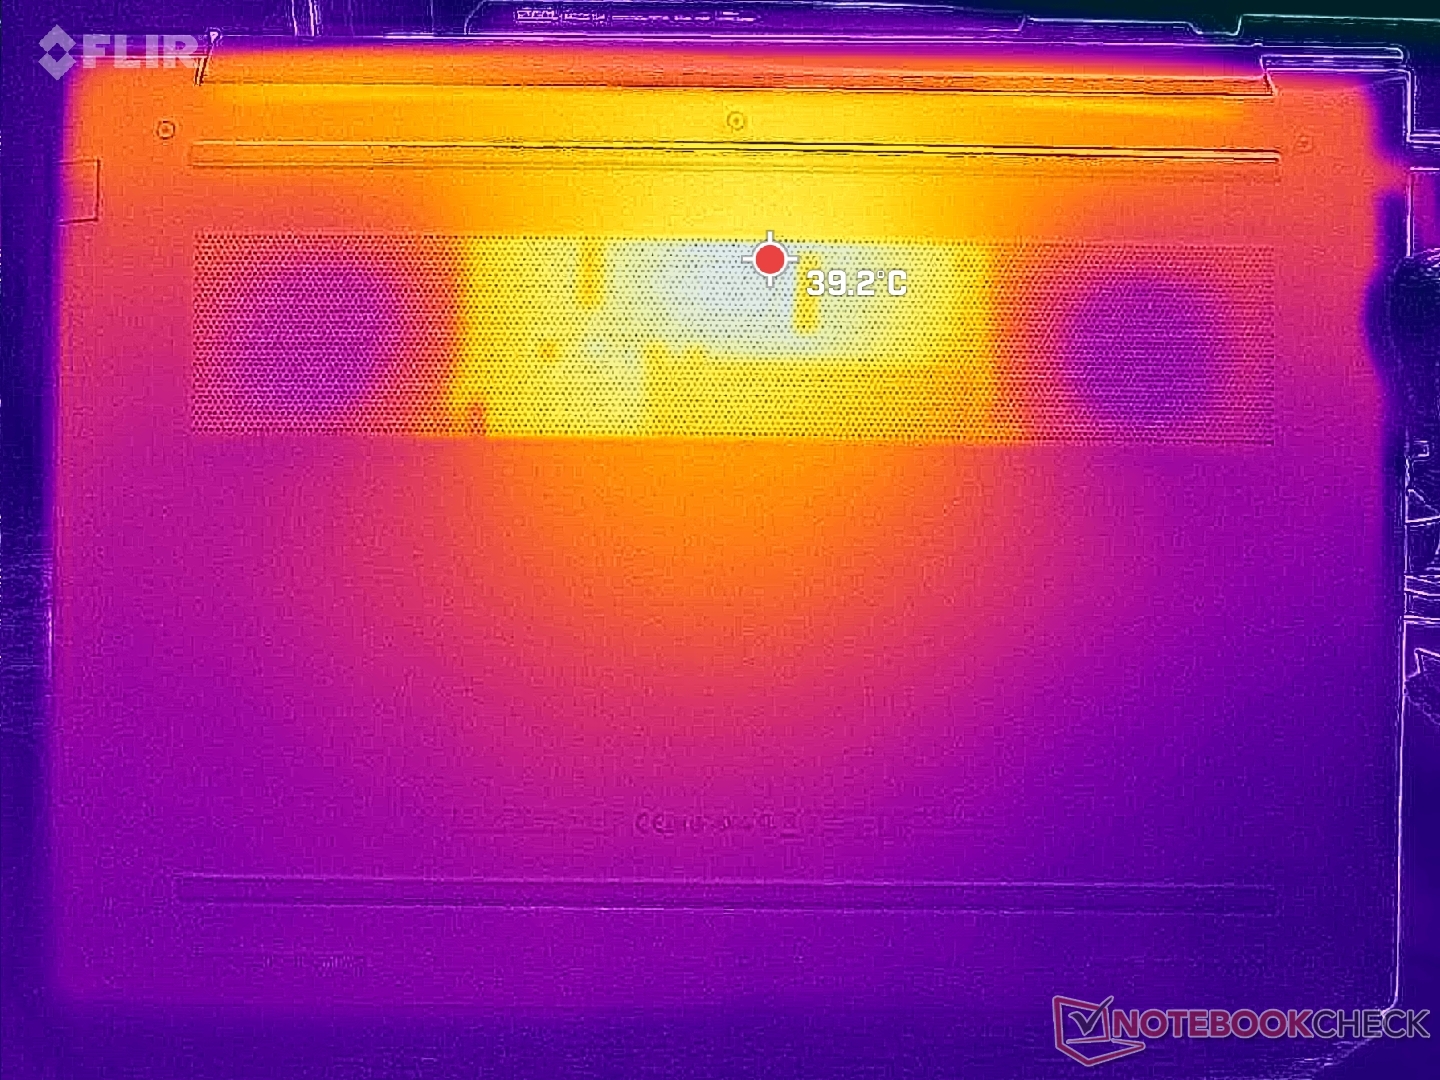
Yttemperaturerna är i allmänhet svalare på vår nya 16-tumsformfaktor, särskilt när det gäller bottenkåpan. Hot spots på undersidan når bara 41 C när man kör krävande belastningar jämfört med 48 C på den äldre ZBook Power 15 G10. Den heta punkten på tangentbordets mitt når också 41 C medan handledsstöden och sidorna förblir svalare och mer bekväma för handflator och fingrar.
Jämfört med den mer kraftfulla Precision 5690är Dell-enheten ännu varmare på tangentbordet samtidigt som den är svalare på undersidan.
(±) Den maximala temperaturen på ovansidan är 40.6 °C / 105 F, jämfört med genomsnittet av 38.2 °C / 101 F , allt från 22.2 till 69.8 °C för klassen Workstation.
(±) Botten värms upp till maximalt 40.6 °C / 105 F, jämfört med genomsnittet av 41.2 °C / 106 F
(+) Vid tomgångsbruk är medeltemperaturen för ovansidan 24.6 °C / 76 F, jämfört med enhetsgenomsnittet på 32 °C / ### class_avg_f### F.
(+) 3: The average temperature for the upper side is 30.1 °C / 86 F, compared to the average of 32 °C / 90 F for the class Workstation.
(+) Handledsstöden och pekplattan är kallare än hudtemperaturen med maximalt 27.2 °C / 81 F och är därför svala att ta på.
(±) Medeltemperaturen för handledsstödsområdet på liknande enheter var 27.8 °C / 82 F (+0.6 °C / 1 F).
| HP ZBook Power 16 G11 A AMD Ryzen 7 8845HS, NVIDIA RTX 2000 Ada Generation Laptop GPU | HP ZBook Power 15 G10 AMD Ryzen 7 PRO 7840HS, NVIDIA RTX 2000 Ada Generation Laptop GPU | HP ZBook Fury 16 G11 Intel Core i9-14900HX, NVIDIA RTX 3500 Ada Generation Laptop GPU | Lenovo ThinkPad P1 Gen 7 21KV001SGE Intel Core Ultra 7 155H, NVIDIA GeForce RTX 4060 Laptop GPU | Lenovo ThinkPad P16s G2 21K9000CGE AMD Ryzen 7 PRO 7840U, AMD Radeon 780M | Dell Precision 5690 Intel Core Ultra 9 185H, Nvidia RTX 5000 Ada Generation Laptop GPU | |
|---|---|---|---|---|---|---|
| Heat | -7% | -26% | -8% | -9% | -8% | |
| Maximum Upper Side * | 40.6 | 42.4 -4% | 42.2 -4% | 50.3 -24% | 42.7 -5% | 46.6 -15% |
| Maximum Bottom * | 40.6 | 47.8 -18% | 48 -18% | 38 6% | 47.2 -16% | 33 19% |
| Idle Upper Side * | 26 | 26.8 -3% | 37 -42% | 28.3 -9% | 27.8 -7% | 32.4 -25% |
| Idle Bottom * | 26.6 | 27.2 -2% | 36.8 -38% | 27.3 -3% | 28.4 -7% | 29.4 -11% |
* ... mindre är bättre
Högtalare
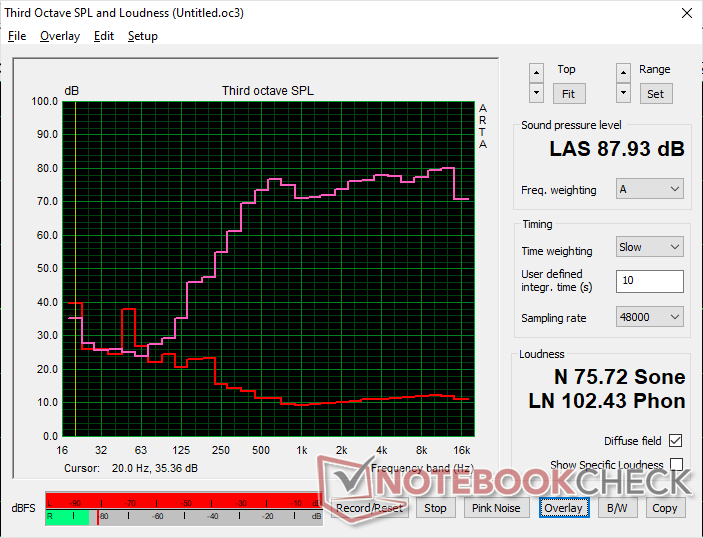
HP ZBook Power 16 G11 A ljudanalys
(+) | högtalare kan spela relativt högt (87.9 dB)
Bas 100 - 315 Hz
(-) | nästan ingen bas - i genomsnitt 28.1% lägre än medianen
(±) | linjäriteten för basen är genomsnittlig (9% delta till föregående frekvens)
Mellan 400 - 2000 Hz
(+) | balanserad mellan - endast 1.9% från medianen
(+) | mids är linjära (4.8% delta till föregående frekvens)
Högsta 2 - 16 kHz
(+) | balanserade toppar - endast 3.6% från medianen
(+) | toppar är linjära (2.4% delta till föregående frekvens)
Totalt 100 - 16 000 Hz
(±) | linjäriteten för det totala ljudet är genomsnittlig (15.1% skillnad mot median)
Jämfört med samma klass
» 29% av alla testade enheter i den här klassen var bättre, 7% liknande, 63% sämre
» Den bästa hade ett delta på 7%, genomsnittet var 18%, sämst var 35%
Jämfört med alla testade enheter
» 19% av alla testade enheter var bättre, 4% liknande, 77% sämre
» Den bästa hade ett delta på 4%, genomsnittet var 24%, sämst var 134%
Apple MacBook Pro 16 2021 M1 Pro ljudanalys
(+) | högtalare kan spela relativt högt (84.7 dB)
Bas 100 - 315 Hz
(+) | bra bas - bara 3.8% från medianen
(+) | basen är linjär (5.2% delta till föregående frekvens)
Mellan 400 - 2000 Hz
(+) | balanserad mellan - endast 1.3% från medianen
(+) | mids är linjära (2.1% delta till föregående frekvens)
Högsta 2 - 16 kHz
(+) | balanserade toppar - endast 1.9% från medianen
(+) | toppar är linjära (2.7% delta till föregående frekvens)
Totalt 100 - 16 000 Hz
(+) | det totala ljudet är linjärt (4.6% skillnad mot median)
Jämfört med samma klass
» 0% av alla testade enheter i den här klassen var bättre, 0% liknande, 100% sämre
» Den bästa hade ett delta på 5%, genomsnittet var 18%, sämst var 45%
Jämfört med alla testade enheter
» 0% av alla testade enheter var bättre, 0% liknande, 100% sämre
» Den bästa hade ett delta på 4%, genomsnittet var 24%, sämst var 134%
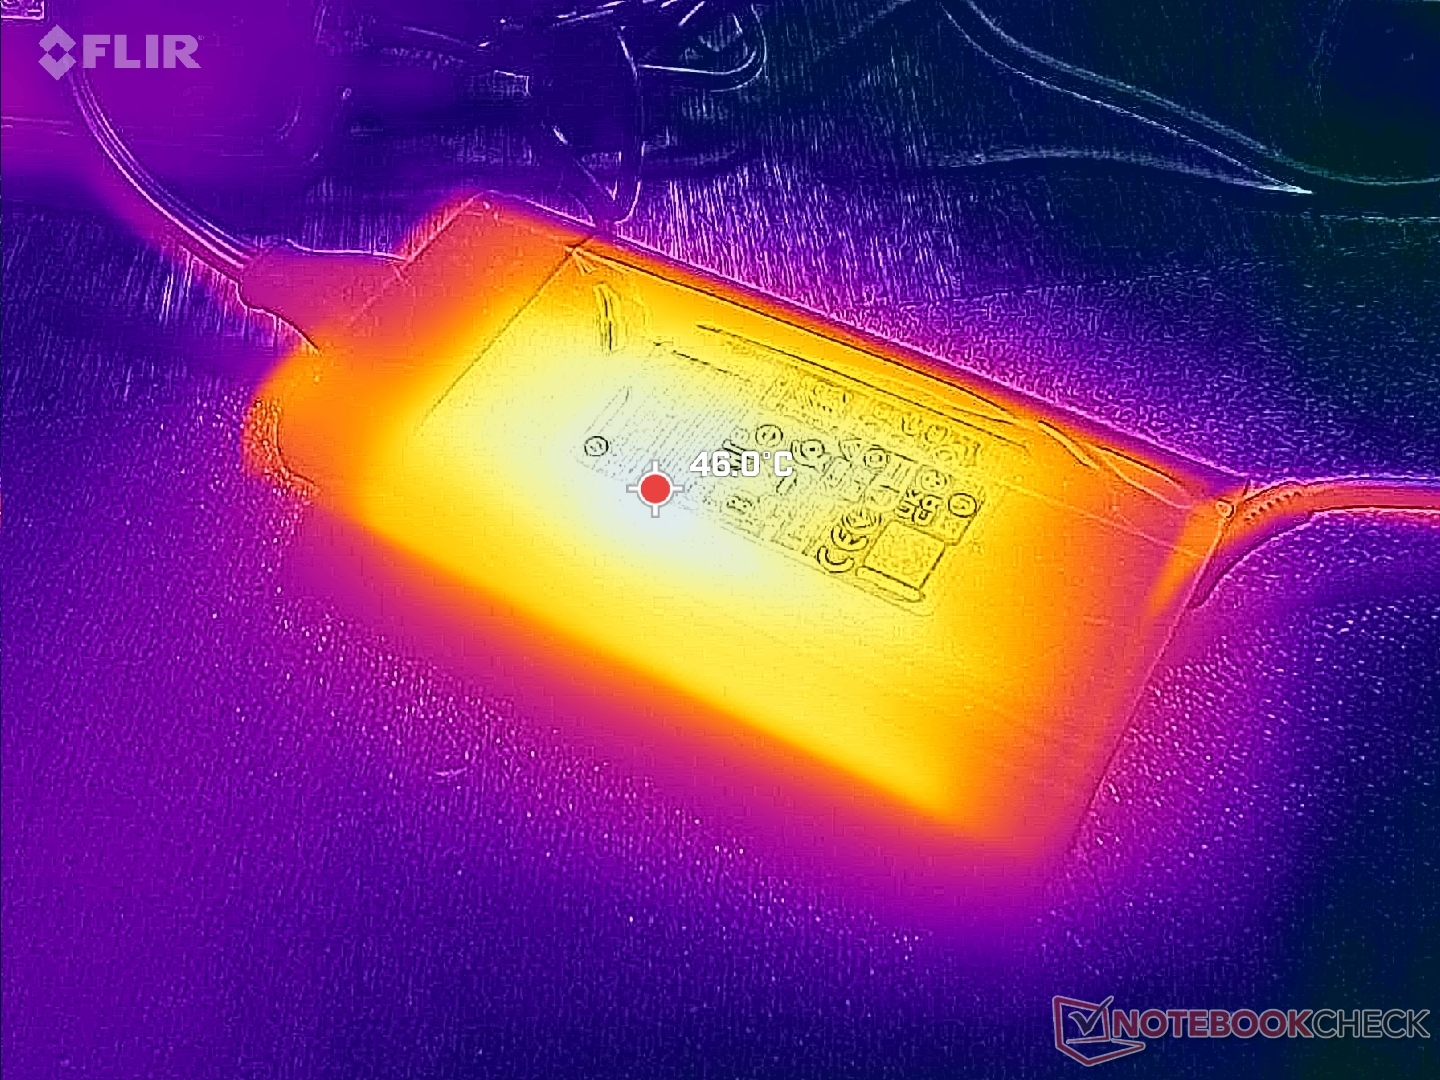
Energiförvaltning
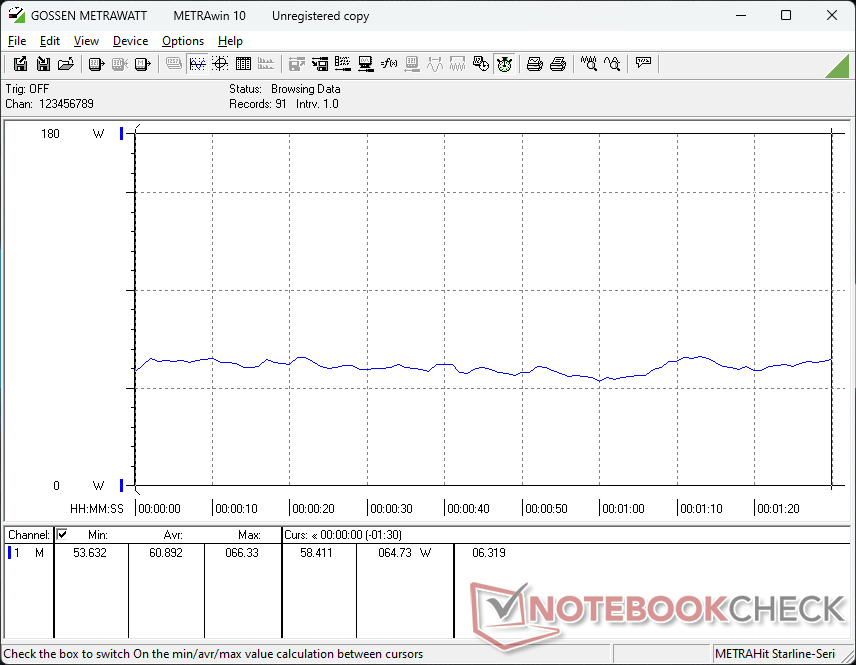
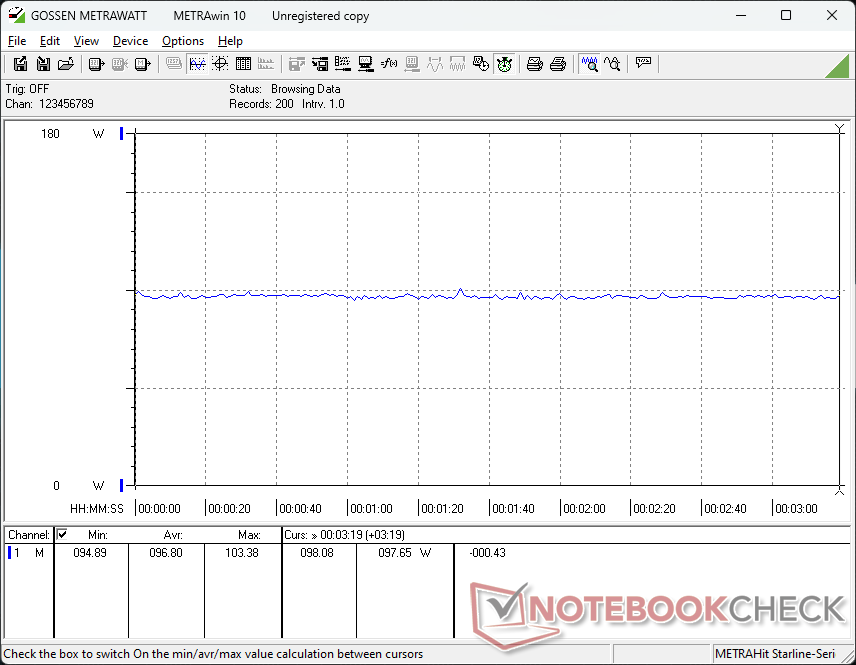
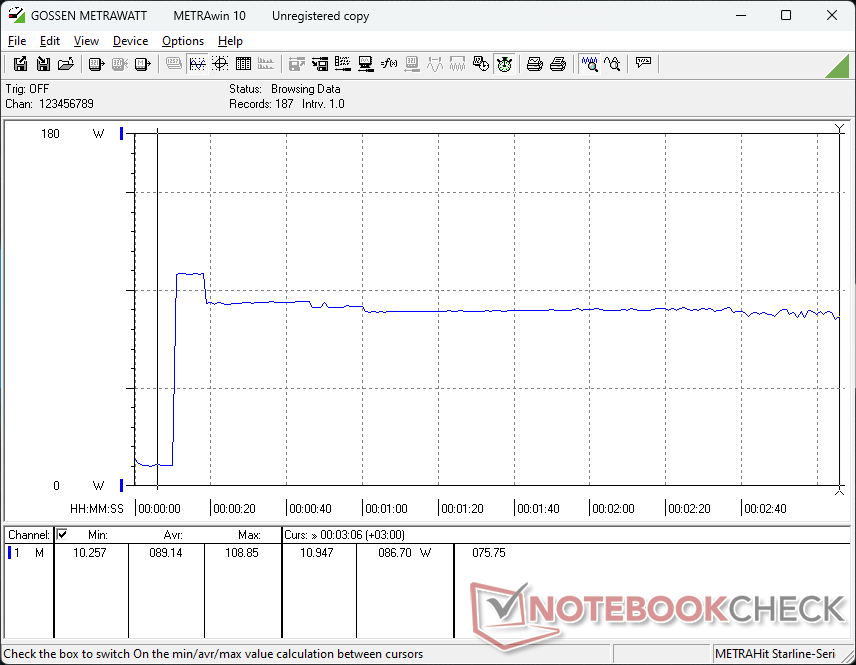
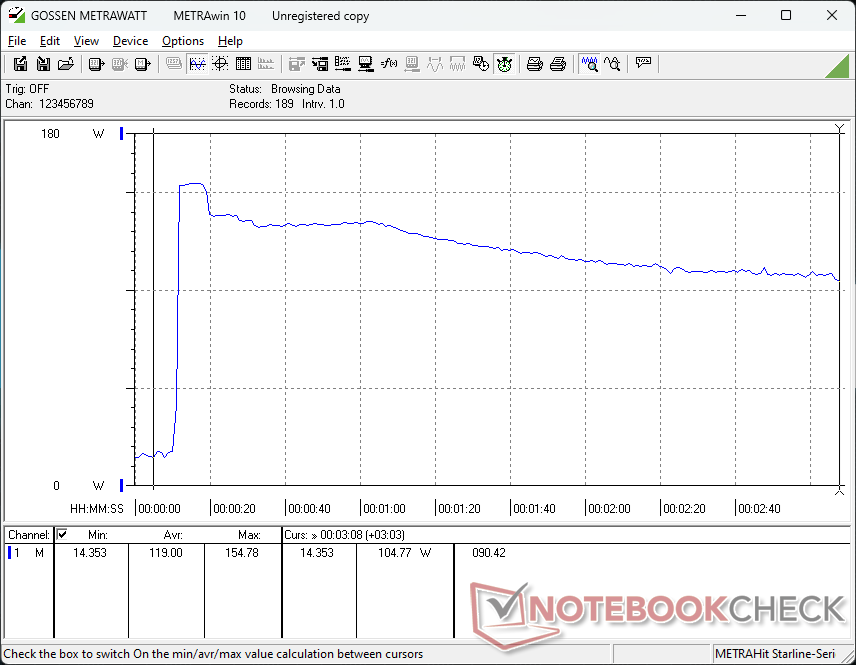
Strömförbrukning
Förbrukningsnivåer och beteende liknar det vi observerade på ZBook Power 15 G10, vilket inte är förvånande med tanke på att strömförbrukningen är densamma mellan dem. Den kanske mest anmärkningsvärda skillnaden är den lägre förbrukningen på cirka 25 W när Prime95 och FurMark körs samtidigt. Detta kan tillskrivas den kraftigare strypningen för att kyla kärntemperaturen när man kör sådana belastningar som nämns i avsnittet Stresstest ovan.
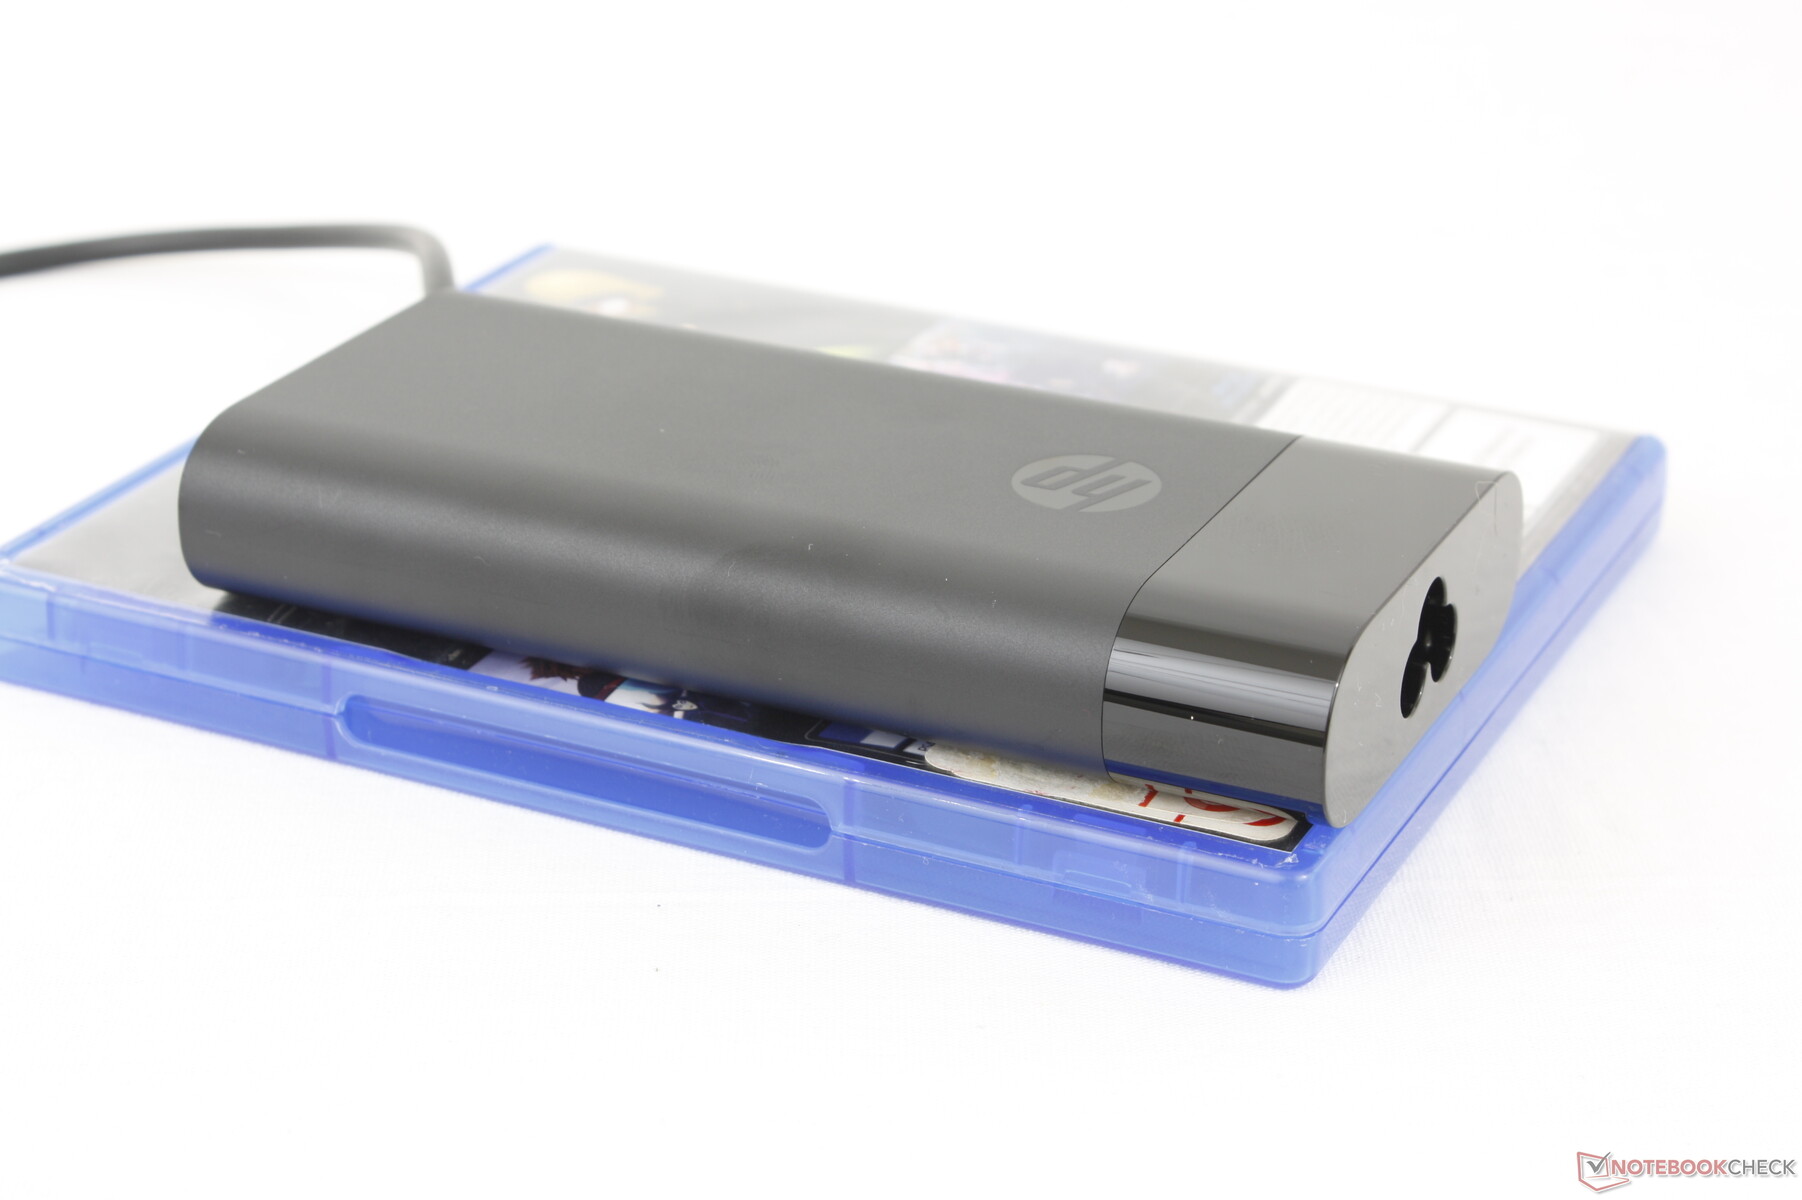
Vi kan registrera ett tillfälligt maximalt uttag på 155 W från den medelstora (~13,8 x 6,5 x 2,2 cm) 150 W AC-adaptern.
| Av/Standby | |
| Låg belastning | |
| Hög belastning |
|
Förklaring:
min: | |
| HP ZBook Power 16 G11 A R7 8845HS, NVIDIA RTX 2000 Ada Generation Laptop GPU, Samsung PM9A1 MZVL22T0HBLB, IPS, 2560x1600, 16" | HP ZBook Power 15 G10 R7 PRO 7840HS, NVIDIA RTX 2000 Ada Generation Laptop GPU, WDC PC SN810 2TB, IPS, 2560x1440, 15.6" | HP ZBook Fury 16 G11 i9-14900HX, NVIDIA RTX 3500 Ada Generation Laptop GPU, SK hynix PC801 HFS001TEJ9X101N, IPS, 3840x2400, 16" | Lenovo ThinkPad P1 Gen 7 21KV001SGE Ultra 7 155H, NVIDIA GeForce RTX 4060 Laptop GPU, Kioxia XG8 KXG8AZNV1T02, IPS LED, 2560x1600, 16" | Lenovo ThinkPad P16s G2 21K9000CGE R7 PRO 7840U, Radeon 780M, SK hynix PC801 HFS001TEJ9X162N, OLED, 3840x2400, 16" | Dell Precision 5690 Ultra 9 185H, NVIDIA RTX 5000 Ada Generation Laptop GPU, 2x Samsung PM9A1 1TB (RAID 0), OLED, 3840x2400, 16" | |
|---|---|---|---|---|---|---|
| Power Consumption | -13% | -80% | -35% | 20% | -67% | |
| Idle Minimum * | 4.6 | 5.3 -15% | 8.6 -87% | 7.3 -59% | 6.1 -33% | 7.9 -72% |
| Idle Average * | 10 | 9.9 1% | 14.8 -48% | 12.3 -23% | 6.5 35% | 12 -20% |
| Idle Maximum * | 10.6 | 16.7 -58% | 15.7 -48% | 17.9 -69% | 7 34% | 28.6 -170% |
| Load Average * | 60.9 | 61.3 -1% | 129.4 -112% | 78.2 -28% | 56.6 7% | 98.8 -62% |
| Cyberpunk 2077 ultra external monitor * | 92.8 | 192.6 -108% | 117.7 -27% | |||
| Cyberpunk 2077 ultra * | 96.8 | 199.4 -106% | 123.5 -28% | |||
| Load Maximum * | 154.8 | 145.3 6% | 236.1 -53% | 167.5 -8% | 68.3 56% | 174.8 -13% |
| Witcher 3 ultra * | 87.9 | 61.2 | 144.5 |
* ... mindre är bättre
Power Consumption Cyberpunk / Stress Test
Power Consumption external Monitor
Batteritid
Batterikapaciteten har inte ändrats från förra årets ZBook Power 15 G10 trots uppdateringarna av formfaktorn. Kanske av en tillfällighet förblir drifttiden nästan densamma på drygt 9,5 timmars WLAN-surfning i verkligheten innan automatisk avstängning.
Laddning från tom till full kapacitet går relativt snabbt på under 70 minuter. Laddning via USB-C stöds, om än i långsammare hastigheter.
| HP ZBook Power 16 G11 A R7 8845HS, NVIDIA RTX 2000 Ada Generation Laptop GPU, 83 Wh | HP ZBook Power 15 G10 R7 PRO 7840HS, NVIDIA RTX 2000 Ada Generation Laptop GPU, 83 Wh | HP ZBook Fury 16 G11 i9-14900HX, NVIDIA RTX 3500 Ada Generation Laptop GPU, 95 Wh | Lenovo ThinkPad P1 Gen 7 21KV001SGE Ultra 7 155H, NVIDIA GeForce RTX 4060 Laptop GPU, 90 Wh | Lenovo ThinkPad P16s G2 21K9000CGE R7 PRO 7840U, Radeon 780M, 84 Wh | Dell Precision 5690 Ultra 9 185H, NVIDIA RTX 5000 Ada Generation Laptop GPU, 98 Wh | |
|---|---|---|---|---|---|---|
| Batteridrifttid | 3% | -31% | 7% | -1% | -6% | |
| Reader / Idle | 1566 | |||||
| WiFi v1.3 | 582 | 601 3% | 402 -31% | 595 2% | 635 9% | 549 -6% |
| Load | 103 | 114 11% | 92 -11% | |||
| H.264 | 797 |
För
Emot
Bedömning - Större skärm men samma prestanda
ZBook Power 16 G11 ersätter ZBook Power 15-serien med en större och tyngre 16-tumsdesign. Man skulle kunna tro att den större formfaktorn leder till snabbare prestanda, men så är tyvärr inte fallet. De nya Hawk Point-processorerna erbjuder inte mycket jämfört med förra årets Phoenix-alternativ medan GPU-alternativen är exakt desamma ner till deras TGP-tak. Chassiombyggnaden var HP:s chans att uppgradera kylningslösningen och pressa mer prestanda ur processorerna, men vi antar att tillverkaren inte ville inkräkta för mycket på ZBook Fury-territoriet i det högre prissegmentet.
Skärmalternativen är också lite av en besvikelse för en arbetsstation. Förutom det unika 1000-nit-alternativet finns det inga anmärkningsvärda funktioner som OLED, P3-färger eller 4K-upplösning. Sådana paneler skulle ha gjort den större skärmstorleken mycket mer tilltalande jämfört med den utgående 15,6-tumsversionen. Istället är användarna begränsade till 2K och IPS.
ZBook Power 16 G11 erbjuder inte mycket annat än den större 16-tumsskärmen jämfört med sin föregångare. Prestanda och funktioner är nästan identiska mellan de två modellerna.
HP är fortfarande en stark arbetsstation i mellanklassen trots avsaknaden av prestandauppgraderingar och nya funktioner. CPU-prestanda är fortfarande märkbart snabbare än ThinkPad P16s G2 som är begränsad till processorer i Ryzen-U-serien, samtidigt som den är billigare än den populära Dell Precision 5690 när den konfigureras med samma GPU. Om du redan äger en ZBook Power 15 G10 kan dock den tyngre 16-tumsversionen kännas som ett steg åt sidan.
Pris och tillgänglighet
HP levererar nu ZBook Power 16 G11 A som börjar på $1140 med baskonfigurationen Ryzen 5 och iGPU. Vår recensionskonfiguration med Ryzen 7 CPU, RTX 2000 Ada GPU och 1600p-skärm säljs för cirka 2000 $.
Obs: Vi har nyligen uppdaterat vårt betygssystem och resultaten från version 8 är inte jämförbara med resultaten från version 7. Mer information finns tillgänglig här .
HP ZBook Power 16 G11 A
- 09/30/2024 v8
Allen Ngo
 Total Sustainability Score:
 Genomskinlighet
Valet av enheter som ska granskas görs av vår redaktion. Testprovet gavs till författaren som ett lån av tillverkaren eller återförsäljaren för denna recension. Långivaren hade inget inflytande på denna recension och inte heller fick tillverkaren en kopia av denna recension innan publiceringen. Det fanns ingen skyldighet att publicera denna recension. Vi accepterar aldrig ersättning eller betalning i utbyte mot våra recensioner. Som ett oberoende medieföretag är Notebookcheck inte föremål för auktoritet från tillverkare, återförsäljare eller förlag.
This is how Notebookcheck is testingEvery year, Notebookcheck independently reviews hundreds of laptops and smartphones using standardized procedures to ensure that all results are comparable. We have continuously developed our test methods for around 20 years and set industry standards in the process. In our test labs, high-quality measuring equipment is utilized by experienced technicians and editors. These tests involve a multi-stage validation process. Our complex rating system is based on hundreds of well-founded measurements and benchmarks, which maintains objectivity.
Price comparison

