

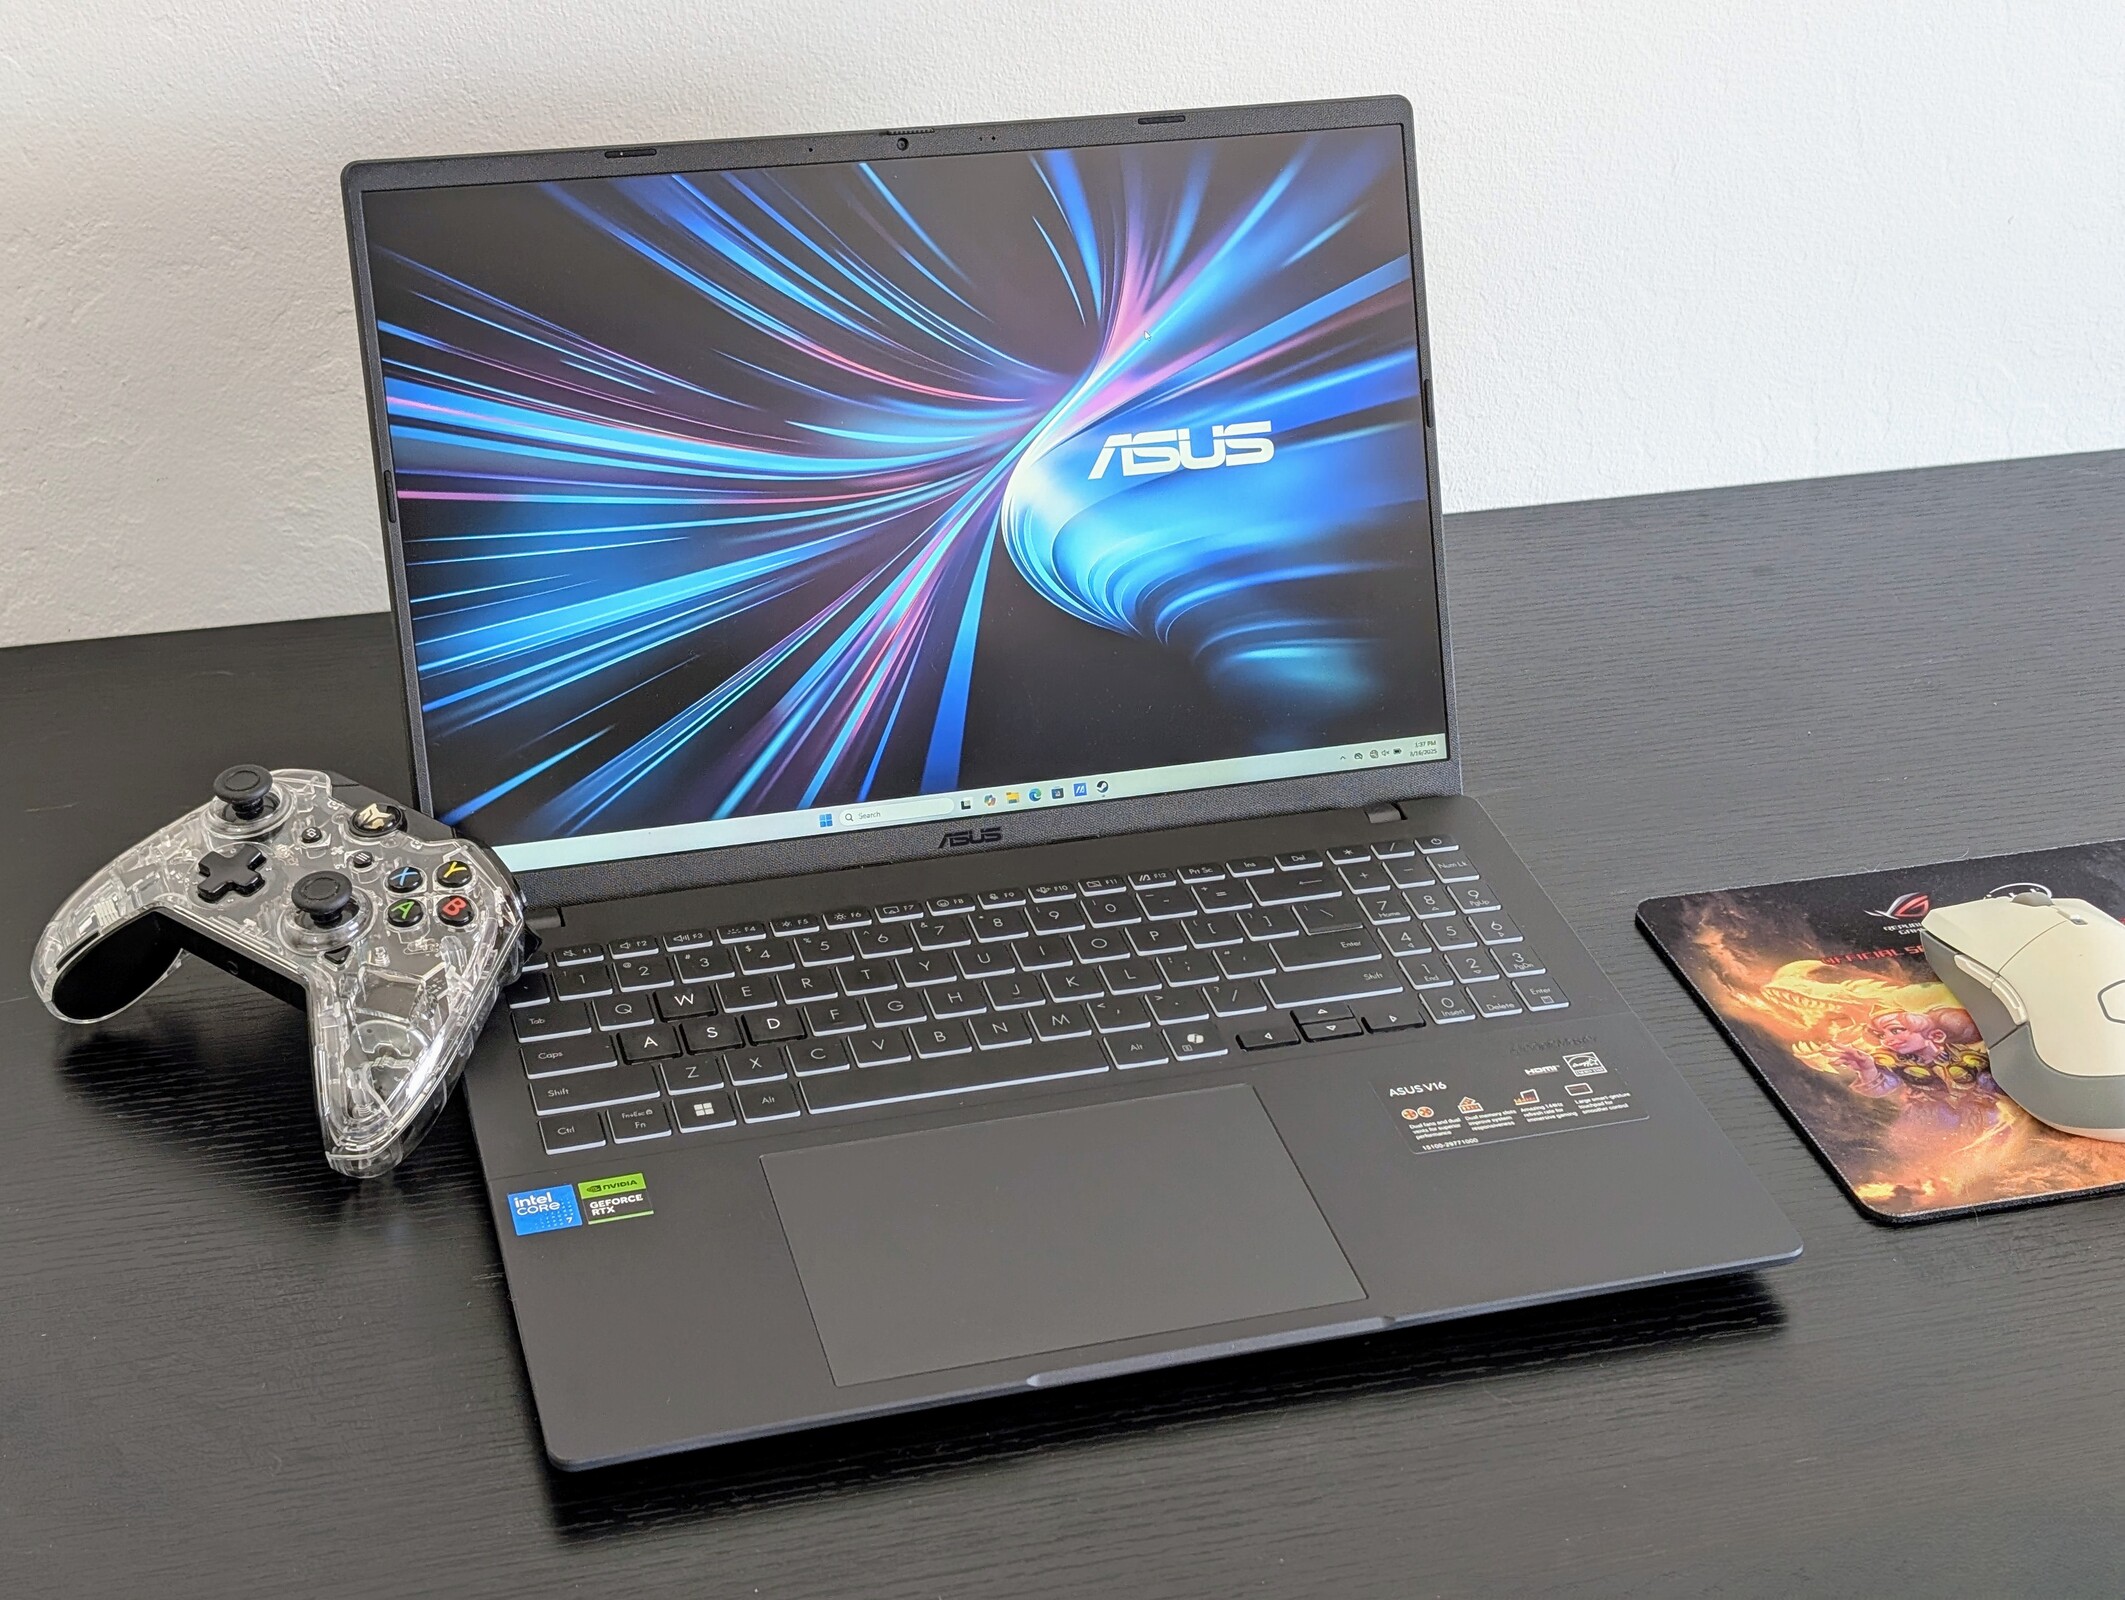
Asus V16 V3607V recension av bärbar dator: GeForce RTX-grafik utan att spränga banken
Debut för Core 7 240H-prestanda.
Så länge du vet var du kan skära ner kan Asus V16 vara en solid universallösning som fungerar tillräckligt bra för de flesta scenarier i hemmet, på kontoret eller i klassrummet.Allen Ngo, 👁 Allen Ngo (översatt av DeepL / Ninh Duy) Publicerad 🇺🇸 🇫🇷 ...
Utlåtande - Välutrustad och billig
I takt med att Vivobook-serien klättrar i pris introducerades V16 som det nya lägre alternativet för användare med snävare budgetar. V16 uppfyller detta ~ $ 1000-utrymme ganska bra genom att balansera en ny och anständigt snabb CPU med en diskret RTX GPU i en design som är ganska tunn och bärbar för att vara konkurrenskraftig mot HP Pavilion Plus 16 eller tyngre Dell Inspiron 16 Plus 7640.
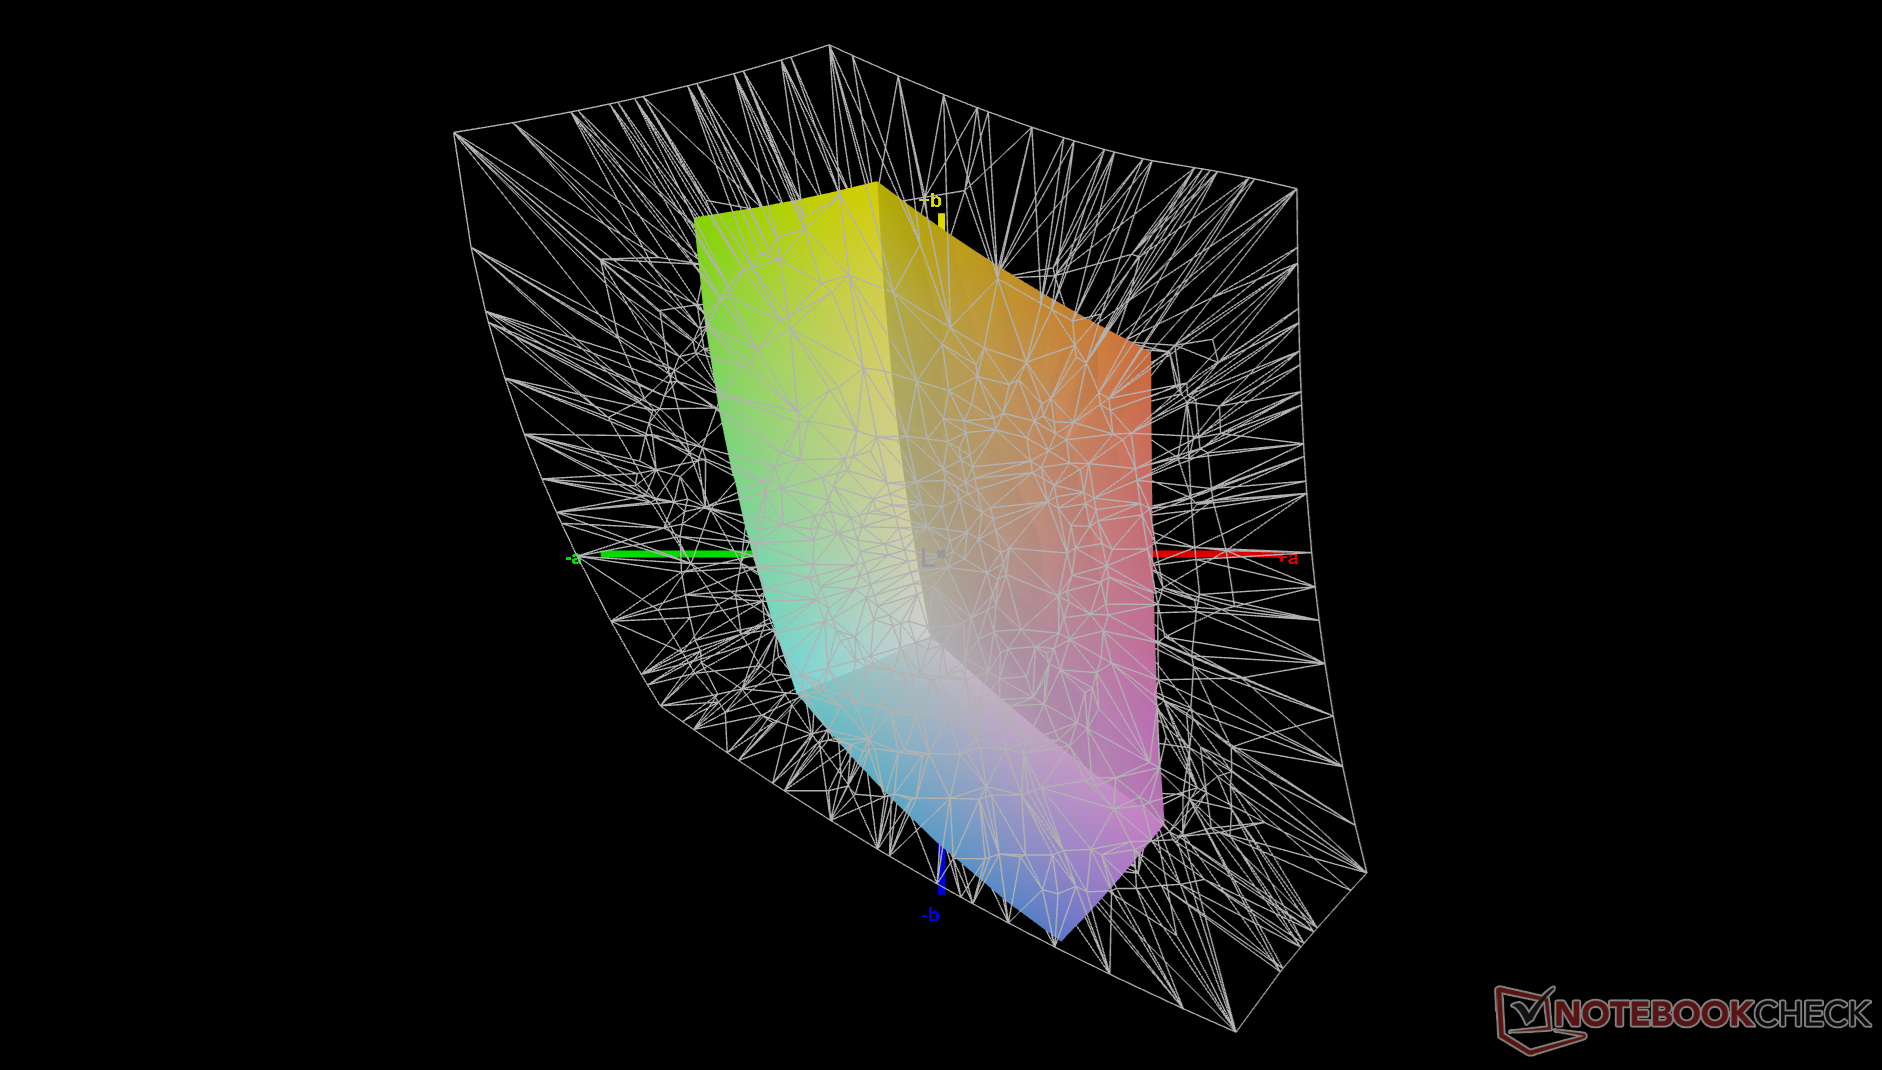
De skurna hörnen är ändå märkbara. Skärmen erbjuder till exempel smal färgtäckning medan plastchassit kan kännas ganska billigt. Den tidigare nämnda HP känns starkare och den erbjuder även >99 procent sRGB-färger, om än till högre priser än vår Asus.
RTX 4050-konfigurationen säljs i skrivande stund för 100 USD mer än RTX 3050-konfigurationen. Potentiella köpare kanske vill överväga RTX 4050-alternativet eftersom det erbjuder över 50 procent snabbare grafikprestanda än RTX 3050.
För
Emot
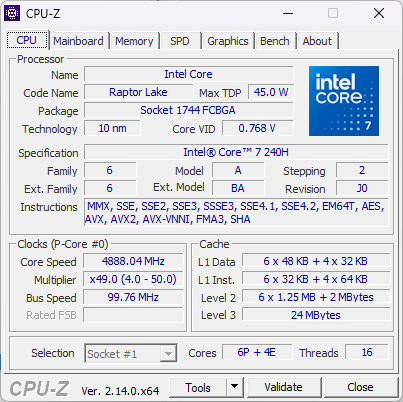
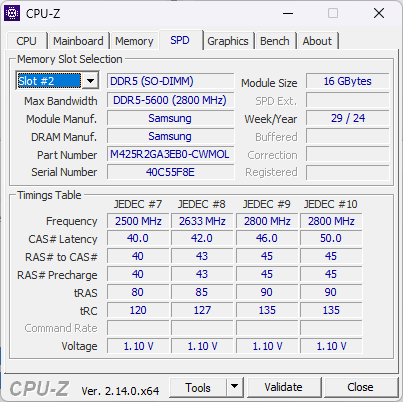
V16, som inte ska förväxlas med VivoBook 16, är Asus budgetmodell för multimedia med startpriser som är ännu lägre än VivoBook-serien. Den saknar vissa lyxiga funktioner som finns på VivoBook, som OLED och attraktiva metalldesigner. 2025 V16 levereras med den nya övre mellanklassmodellen Core 7 240H.
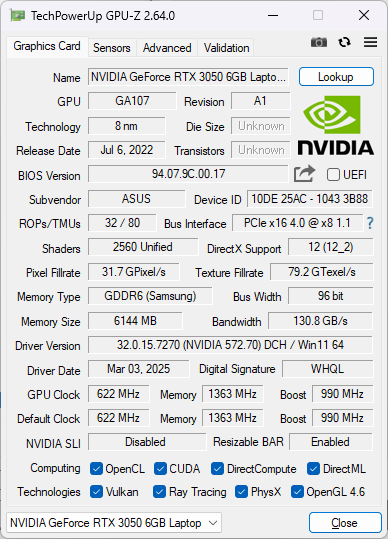
Vår testenhet levereras med den tidigare nämnda processorn, 1200p 144 Hz IPS-skärm och den äldre 6 GB GeForce RTX 3050 för att hålla priserna under $ 1000. Andra SKU: er kan levereras med RTX 4050 istället.
Alternativ till V16 inkluderar andra bärbara multimedia-datorer med diskreta GPU: er som HP Pavilion Plus 16, Dell Inspiron 16 Plus, eller Lenovo IdeaPad Pro 5 16.
Fler recensioner av Asus:
Specifikationer
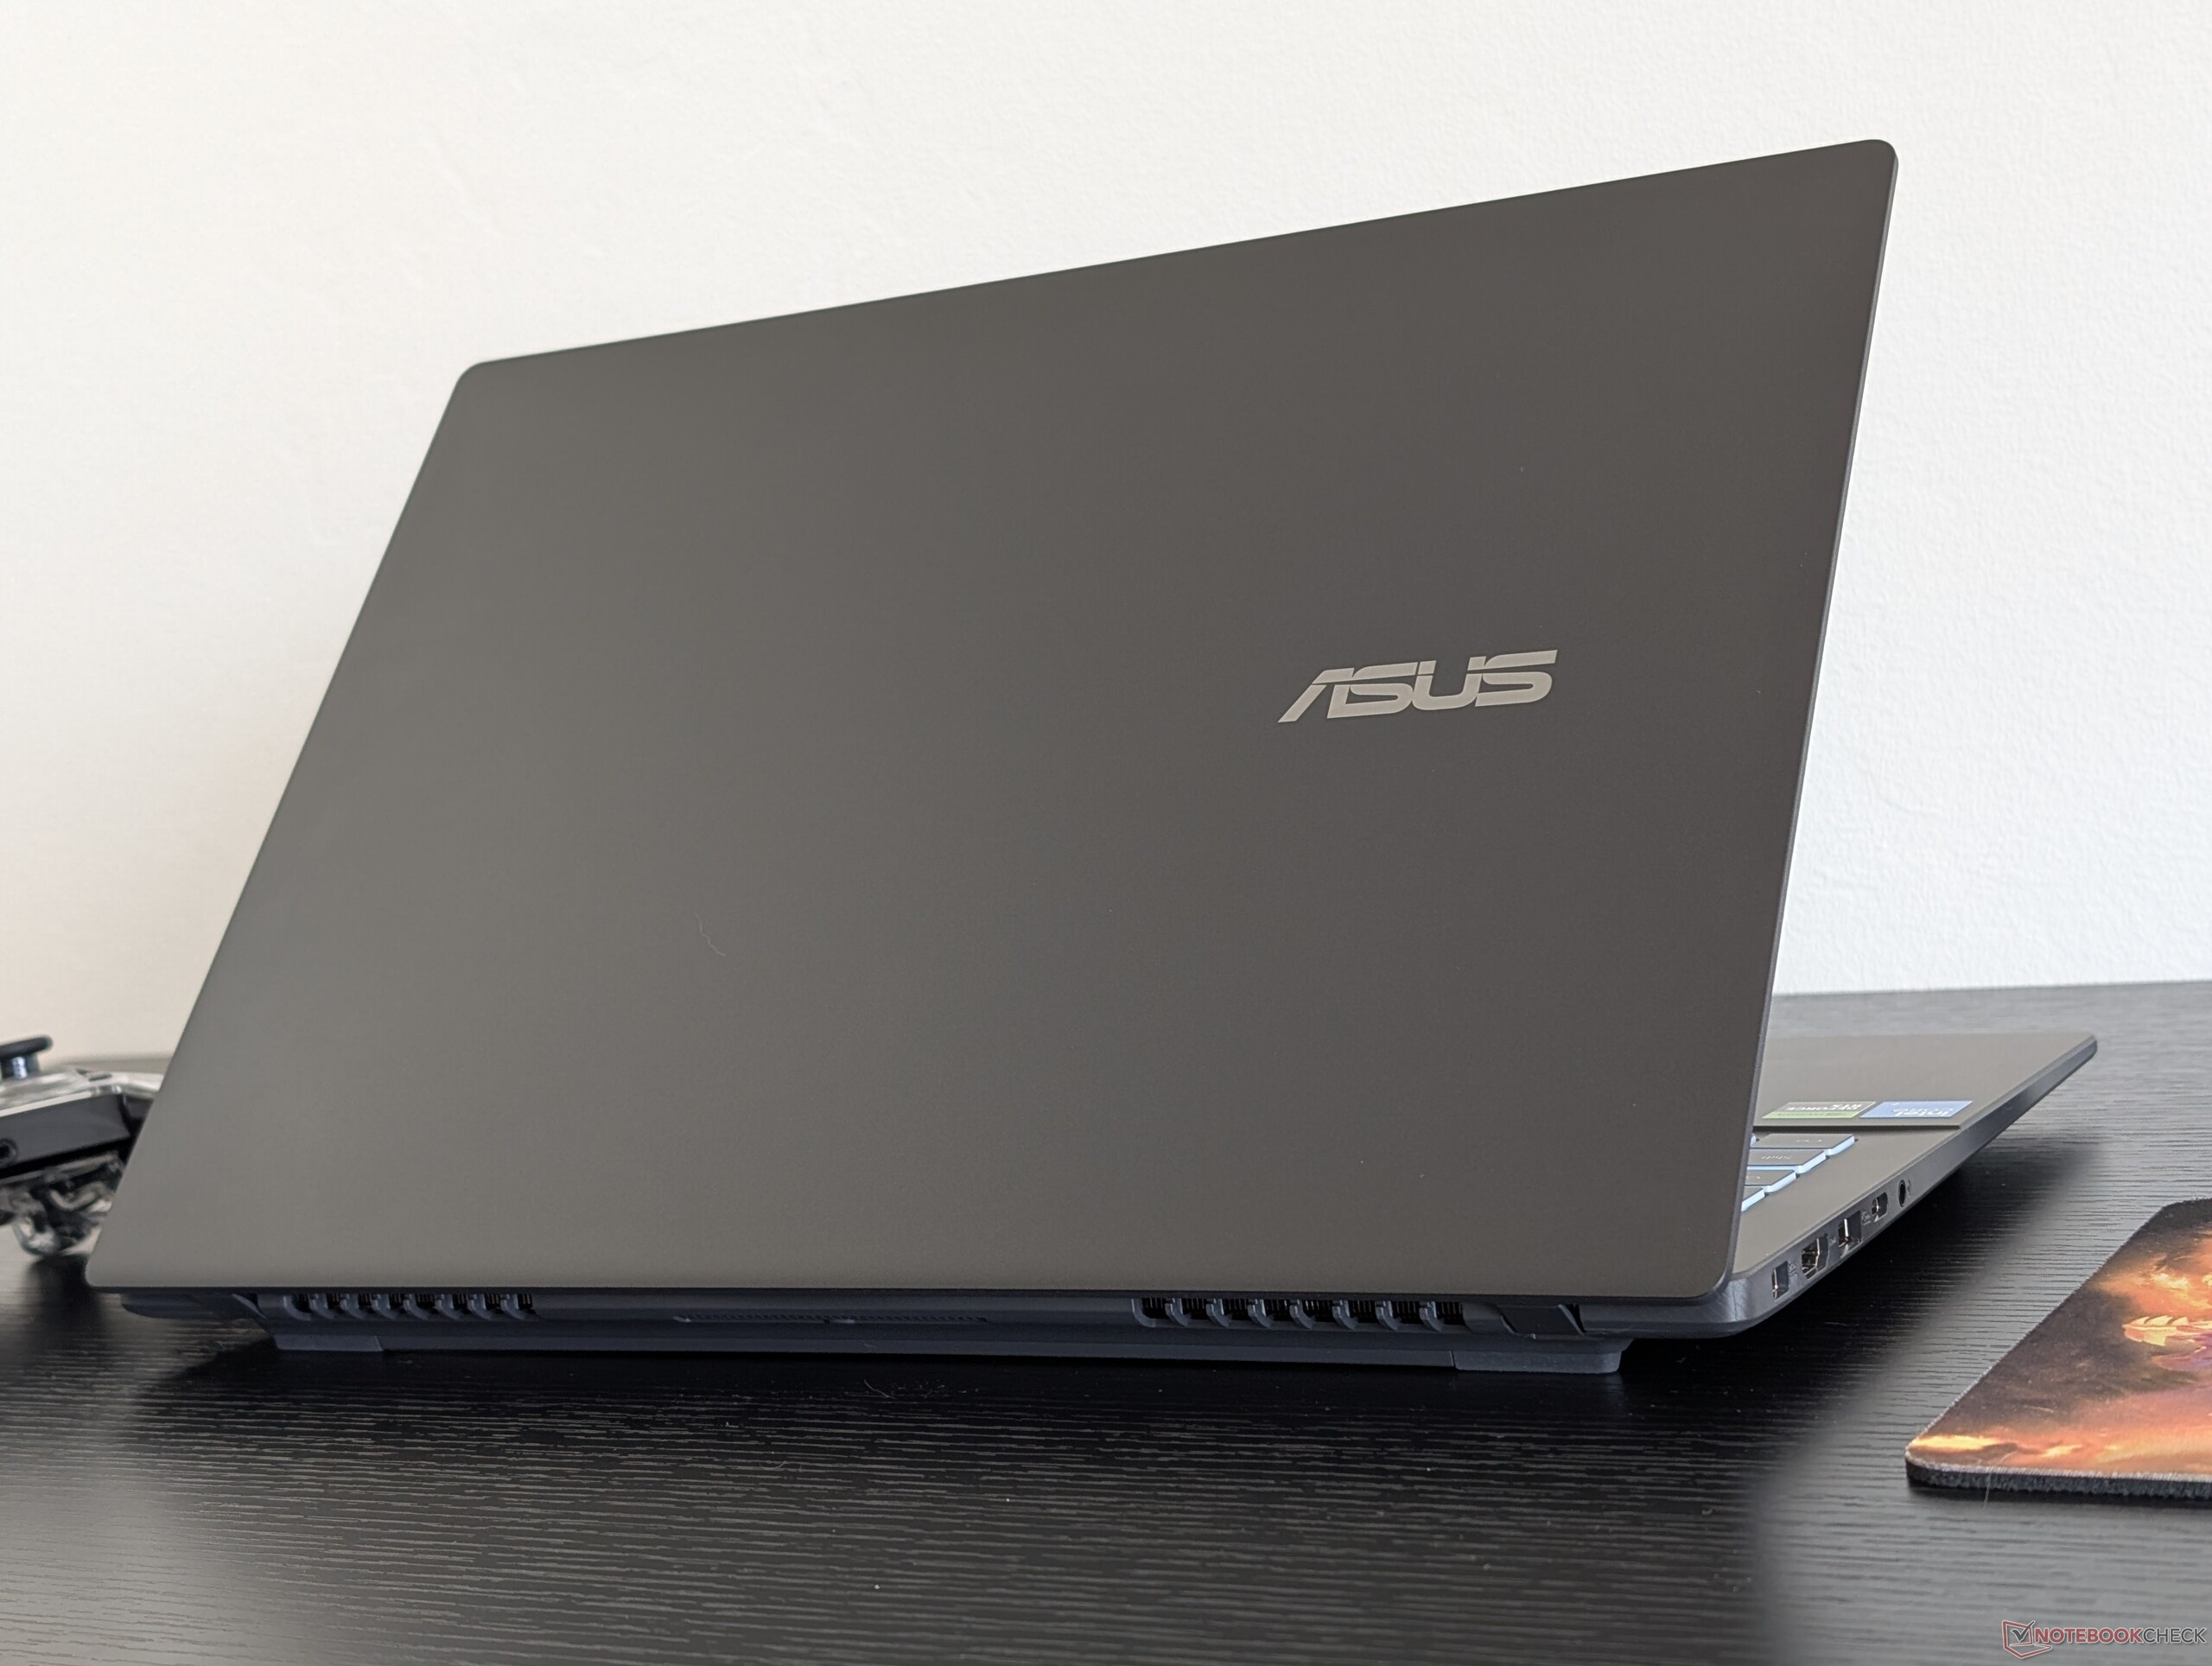
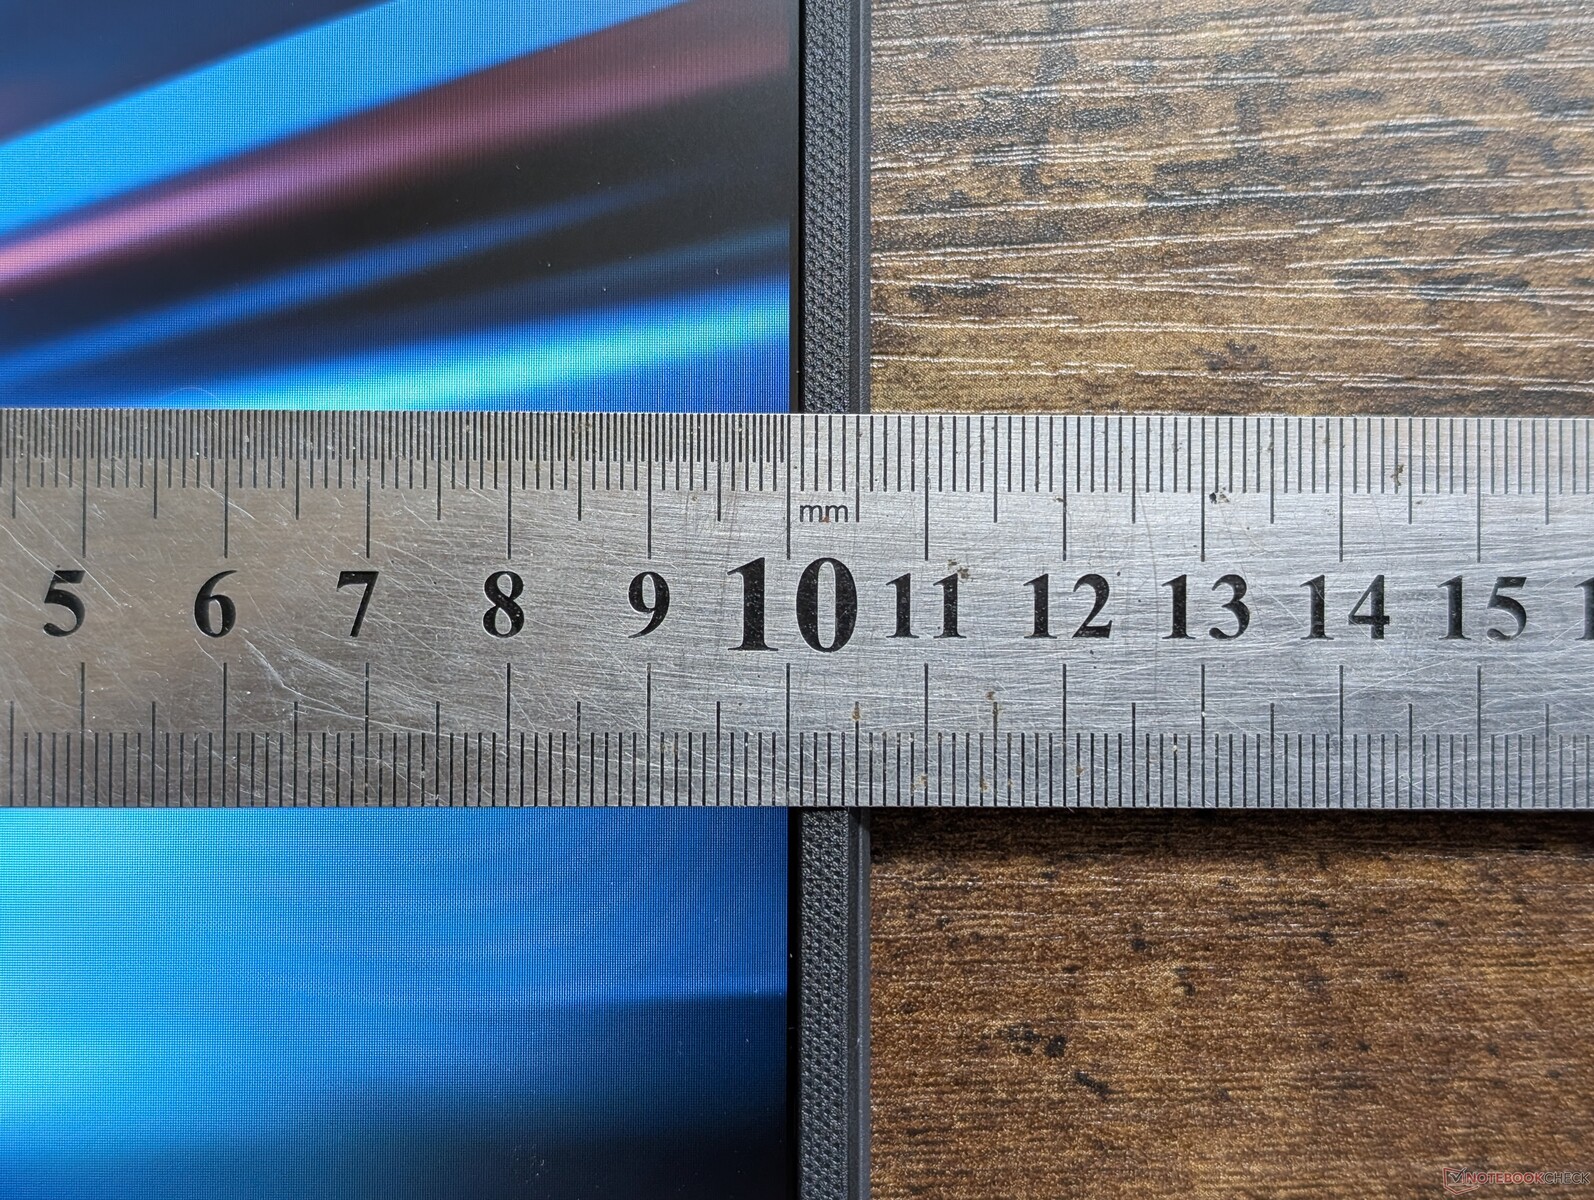
Fodral - Monotone svart plast
Chassit är helt i plast, även ytterhöljet där tillverkare ofta använder metall för att ge ett bättre första intryck. Basen och locket är benägna att vridas och är extremt mottagliga för fula fingeravtryck.
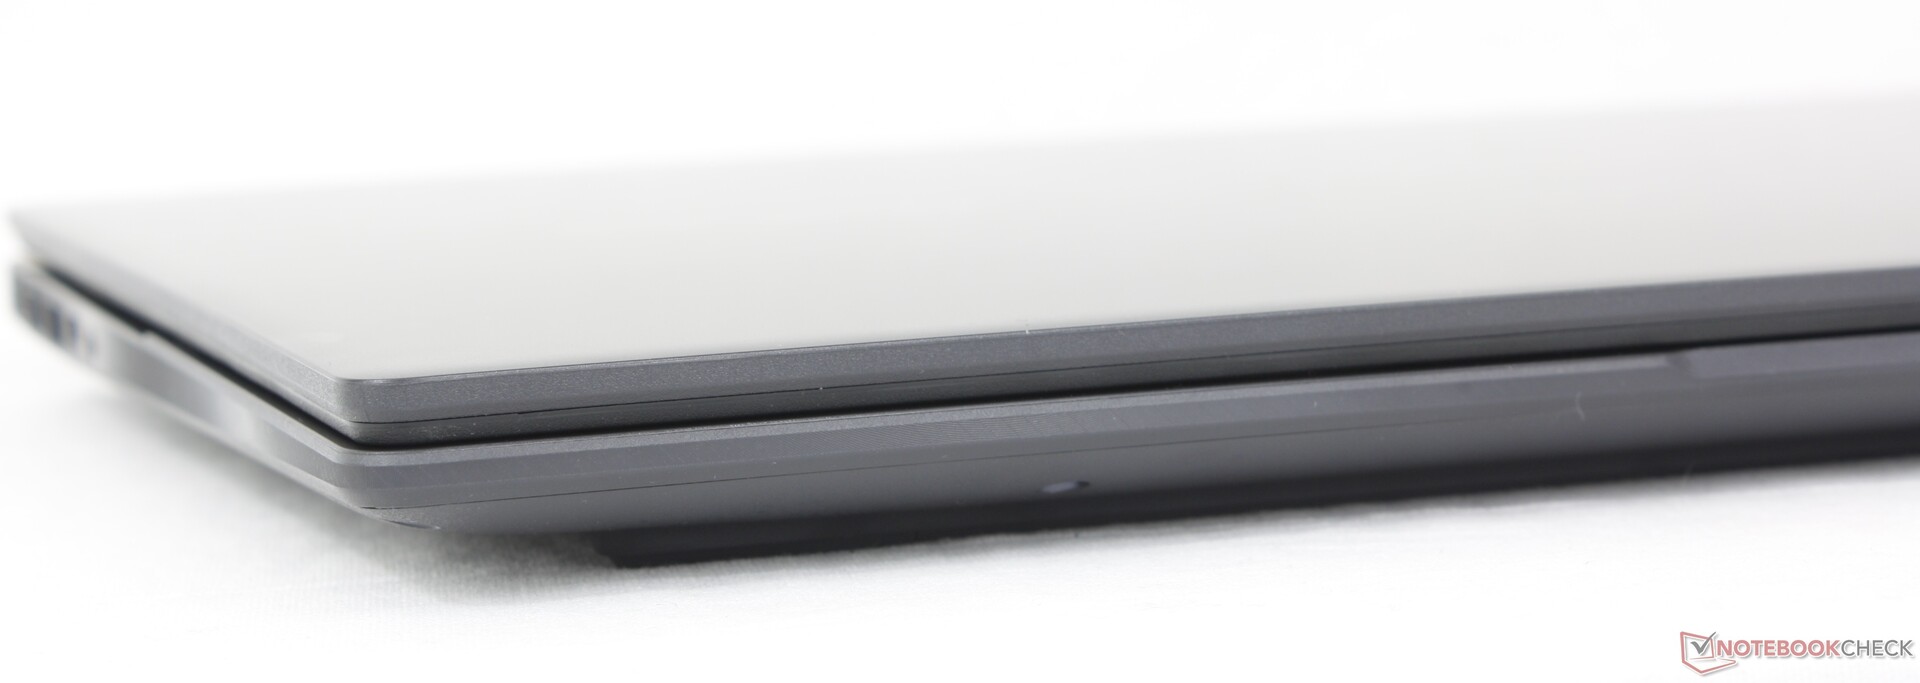
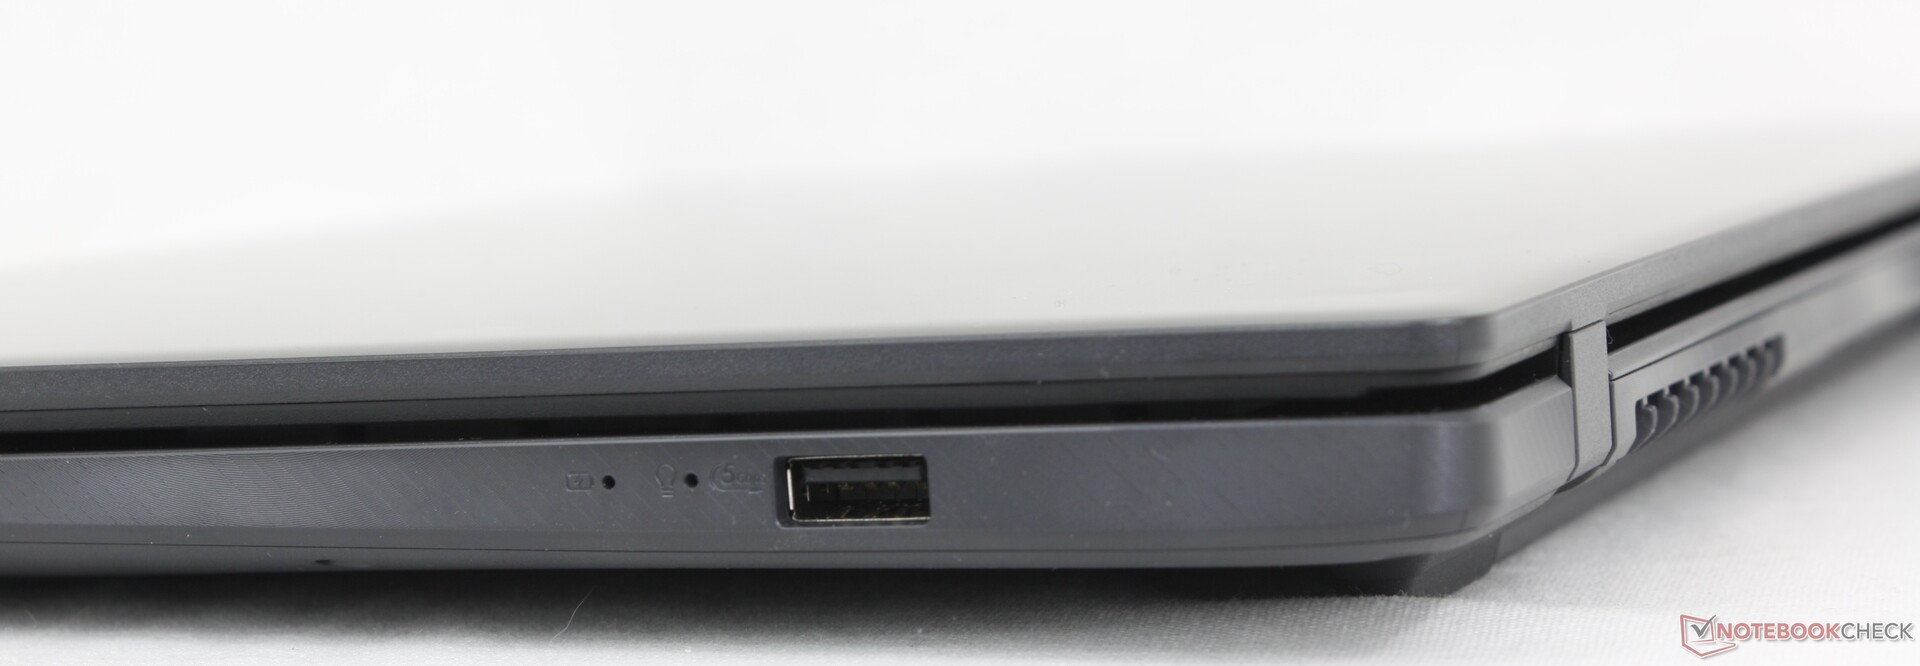
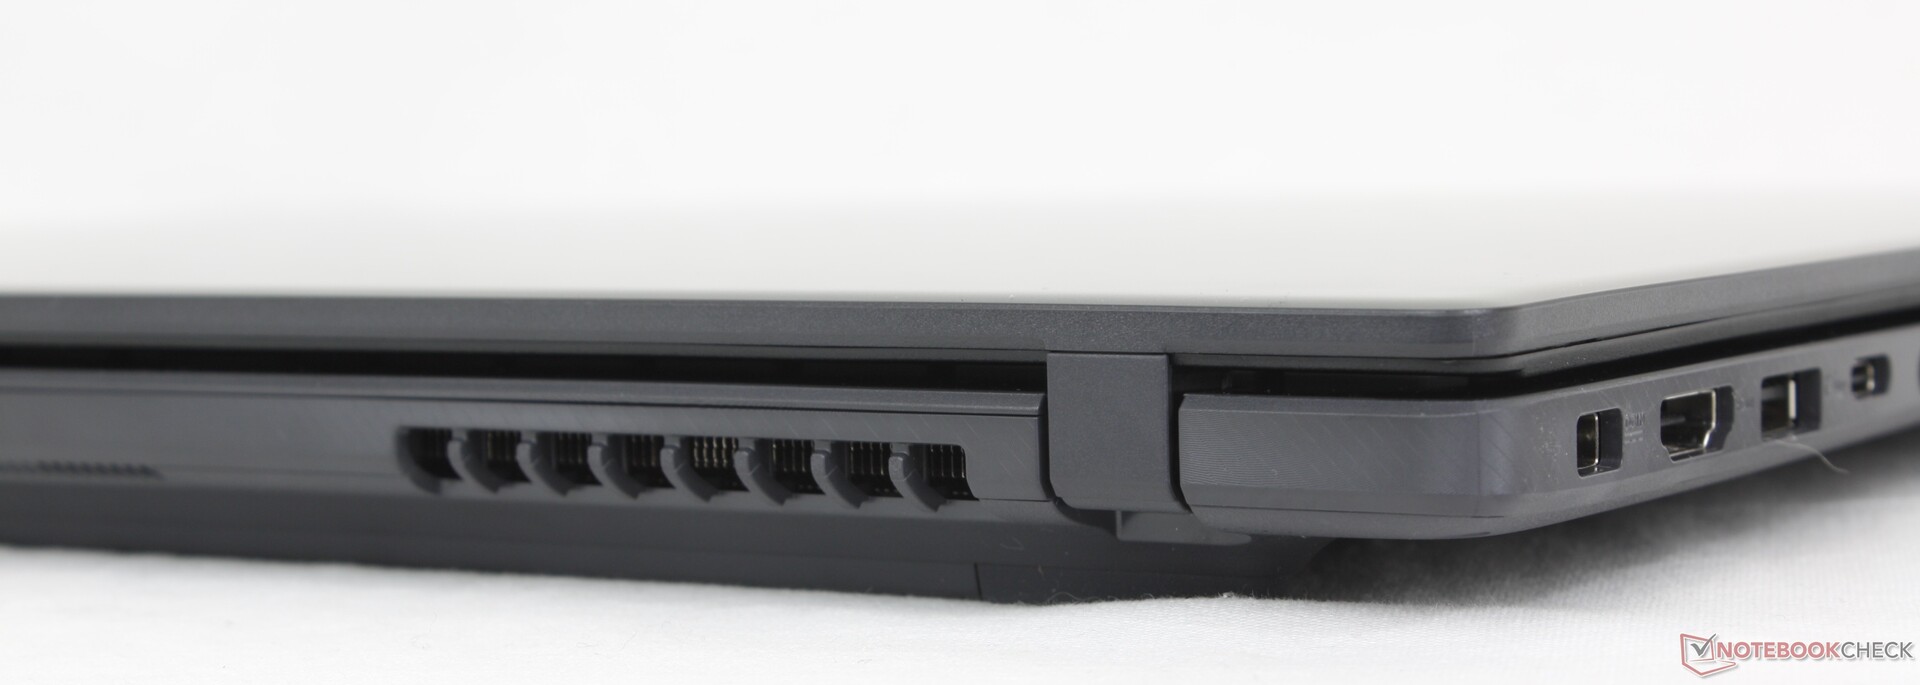
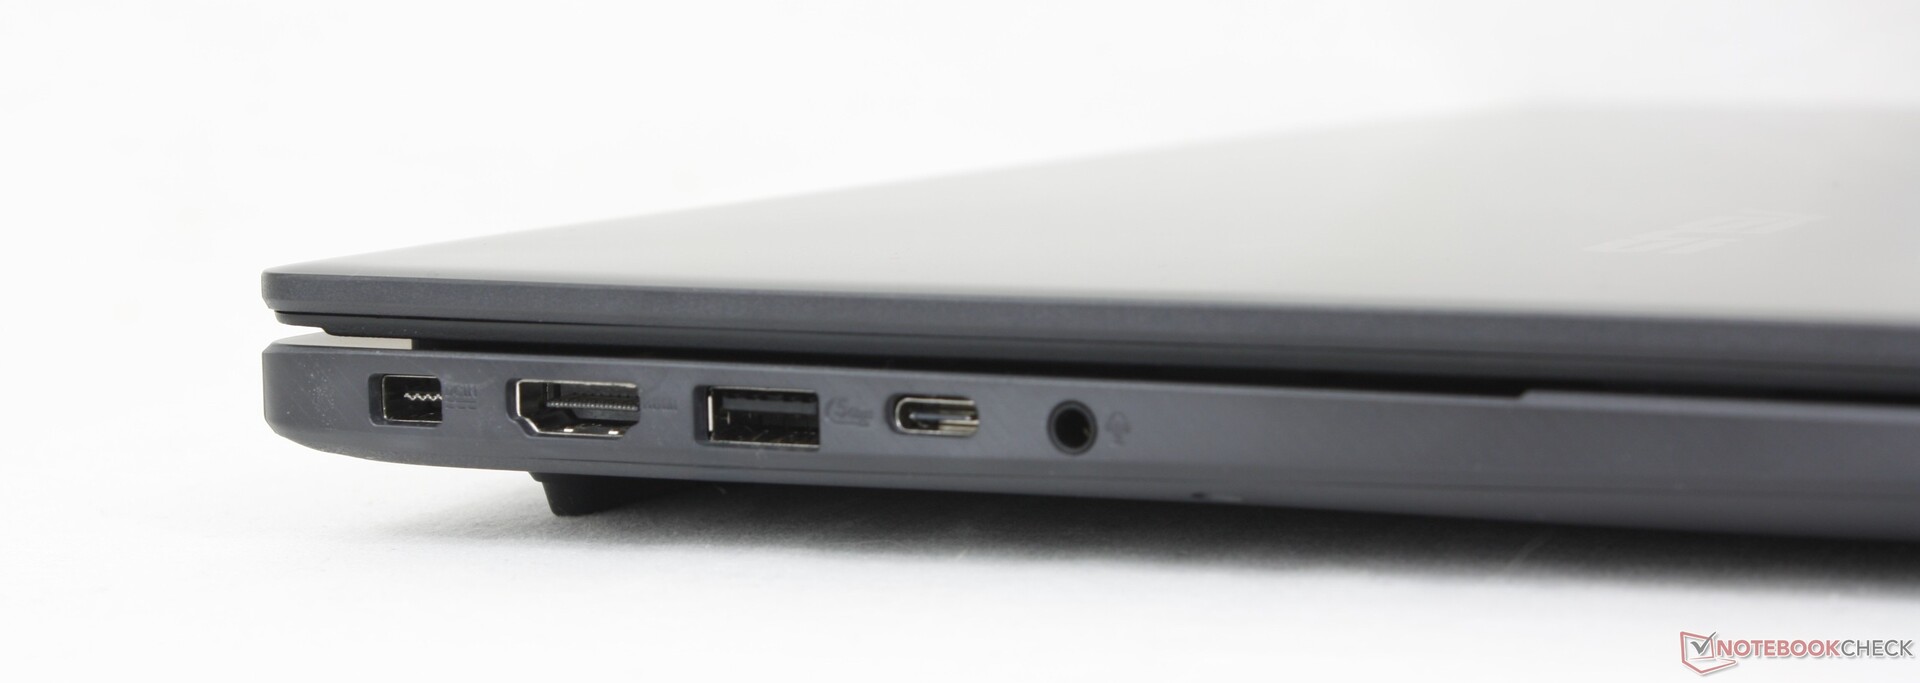
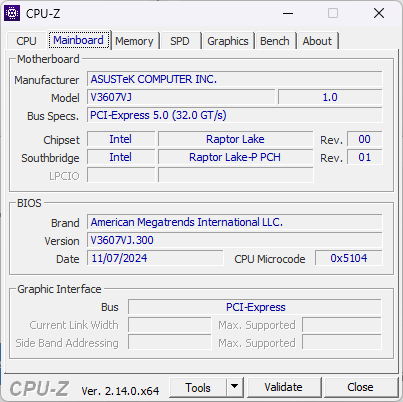
Anslutningsmöjligheter
USB-C-porten stöder inte Thunderbolt till skillnad från på den dyrare VivoBook Pro 16 som integrerar ett bredare utbud av portar. Irriterande nog använder V16 också en annan AC-adapterkabel än VivoBook-serien.
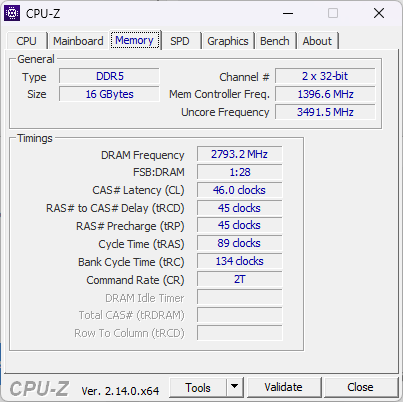
Kommunikation
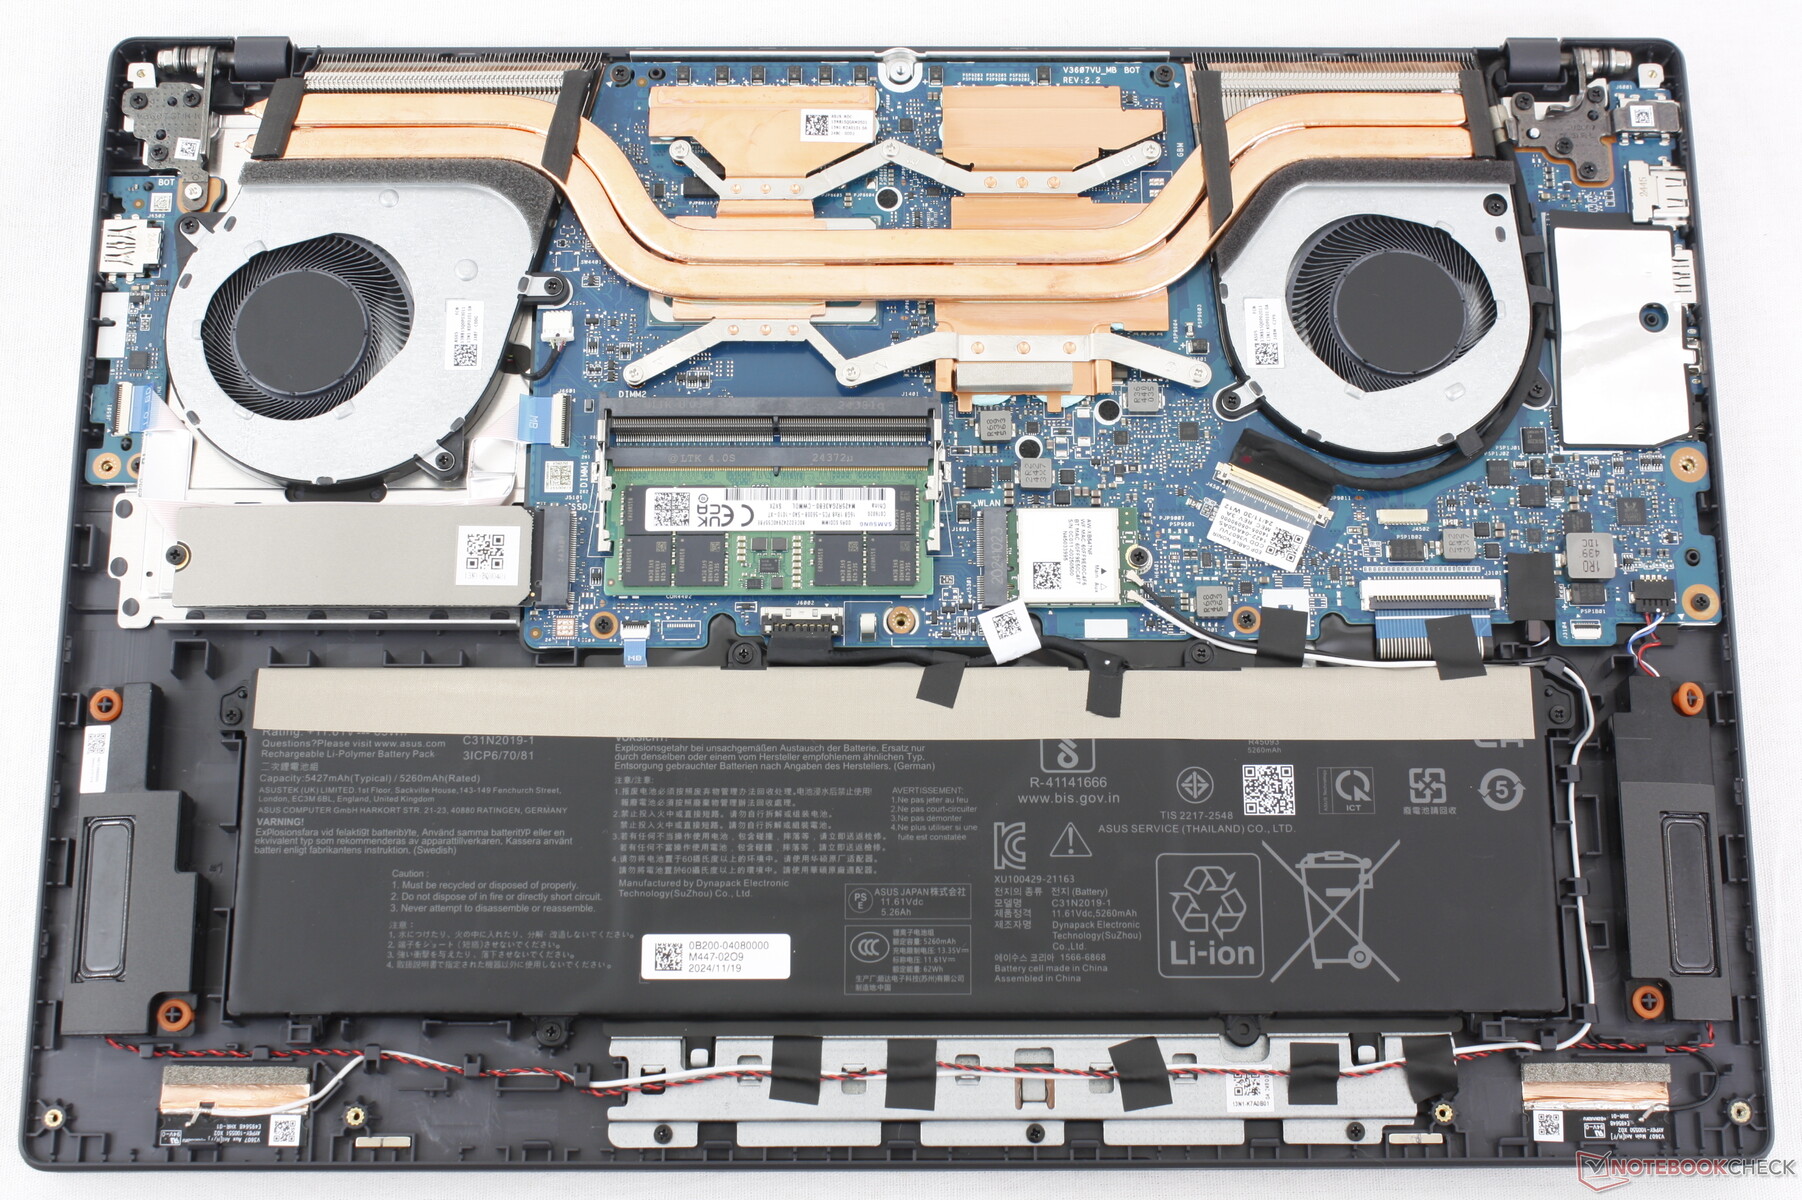
Den löstagbara Realtek RTL8852BE levereras som standard för Wi-Fi 6 och Bluetooth 5.3-anslutning. Det finns inget stöd för Wi-Fi 6E eller Wi-Fi 7.
Webbkamera
En 2 MP webbkamera med fysisk slutare är standard. Det finns ingen IR-kamera för att spara på kostnaderna.


Underhåll
Bottenpanelen kan lossas relativt enkelt med bara en stjärnskruvmejsel för enkel service. En sekundär SSD stöds inte.
Hållbarhet
Asus strävar efter att vara koldioxidneutrala, men i övrigt finns det inga detaljer om tillverkningsprocessen för V16. Detaljhandelsförpackningen består mestadels av papper och kartong med mycket lite plastförpackning.
Tillbehör och garanti
Det finns inga extra tillbehör i lådan förutom nätadapter och papper. Ett års tillverkargaranti gäller vid köp i USA.
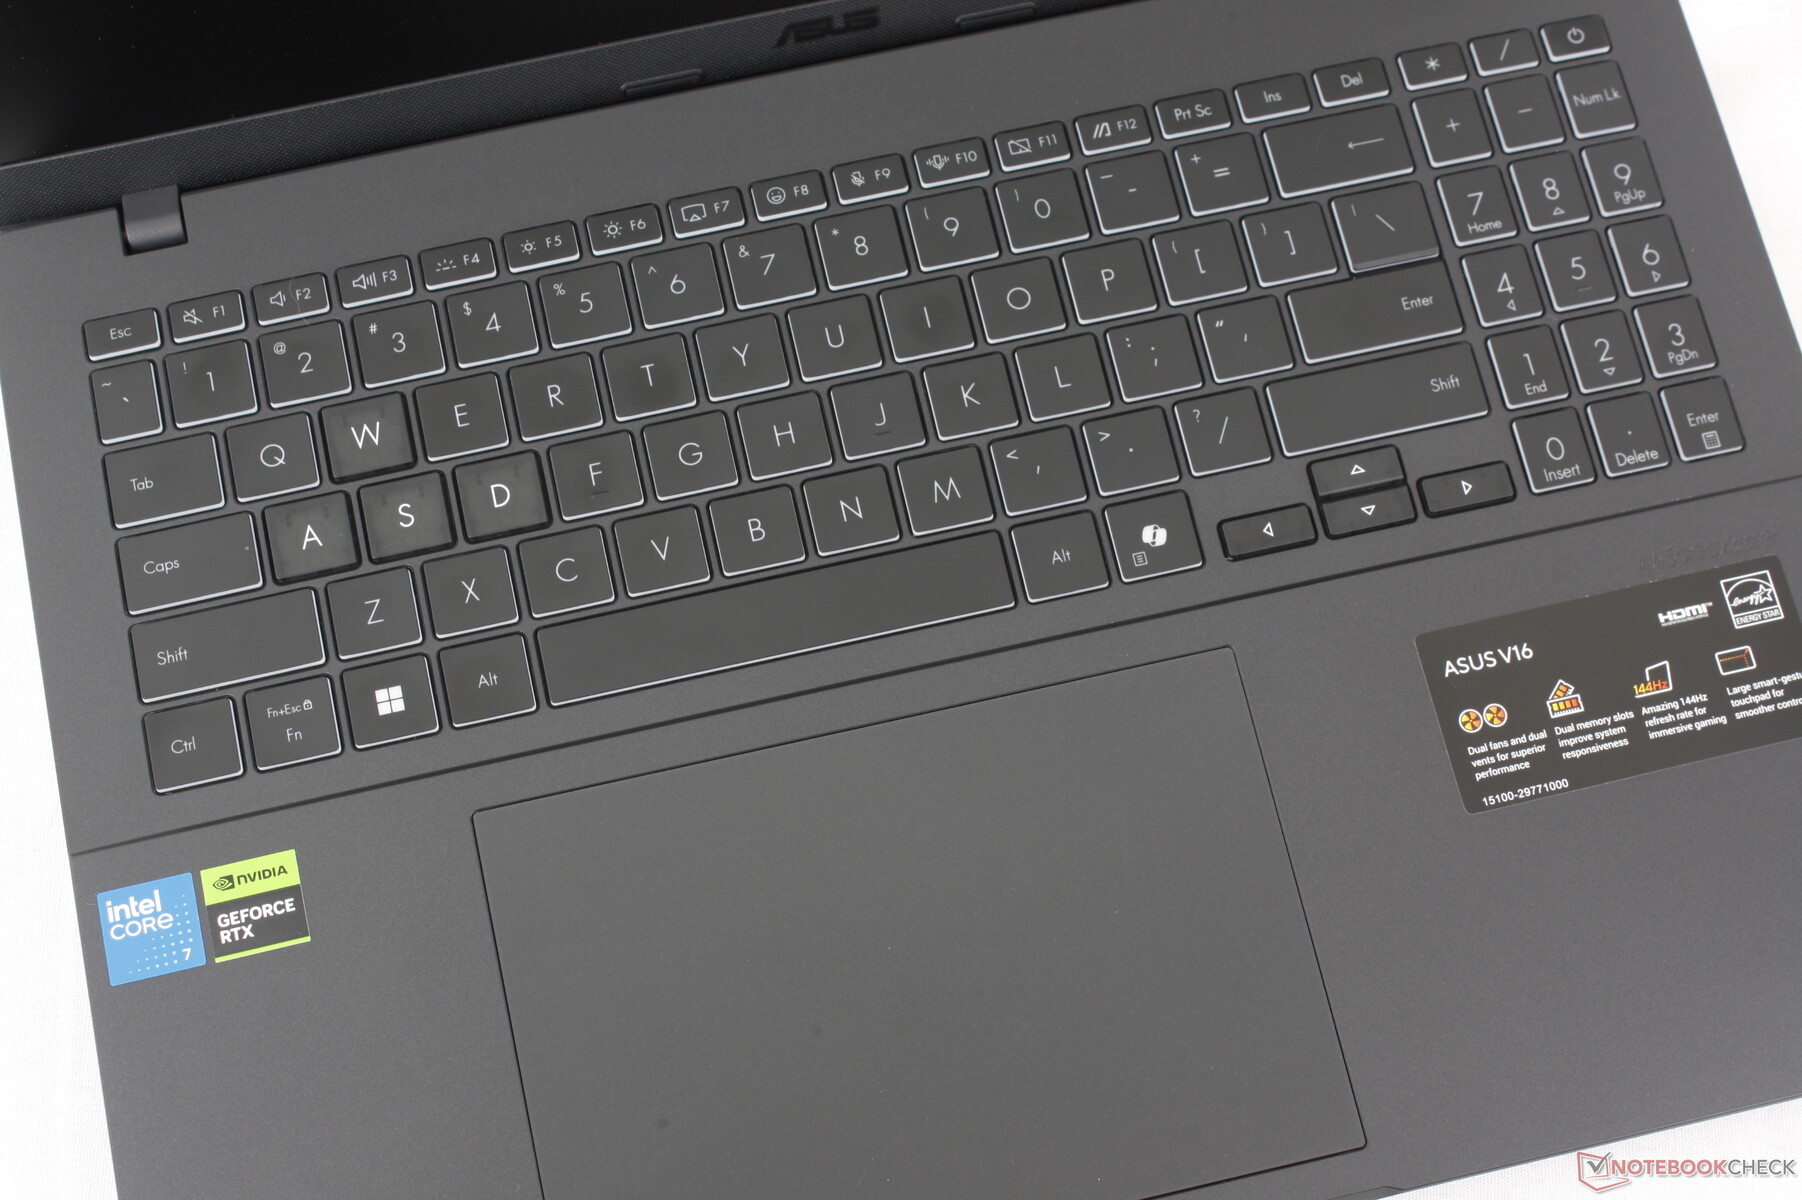
Inmatningsenheter - VivoBook Vibes
Tangentbord
V16 använder tangentbordet från VivoBook 16-serien på gott och ont. Resan och återkopplingen kunde ha varit djupare respektive starkare, men det fungerar tillräckligt pålitligt utan att behöva spendera mer på alternativ med bättre tangentbord som en ThinkPad T-serien eller EliteBook.
Pekplatta
Klickplattan är stor med 15 x 10 cm jämfört med bara 11,5 x 8 cm på Dell Inspiron 16 Plus 7640. Tyvärr är återkopplingen mycket mjuk och tyst. Att trycka ner kräver också mer kraft än på de flesta andra bärbara datorer, vilket kan bli obekvämt efter en kort stund.
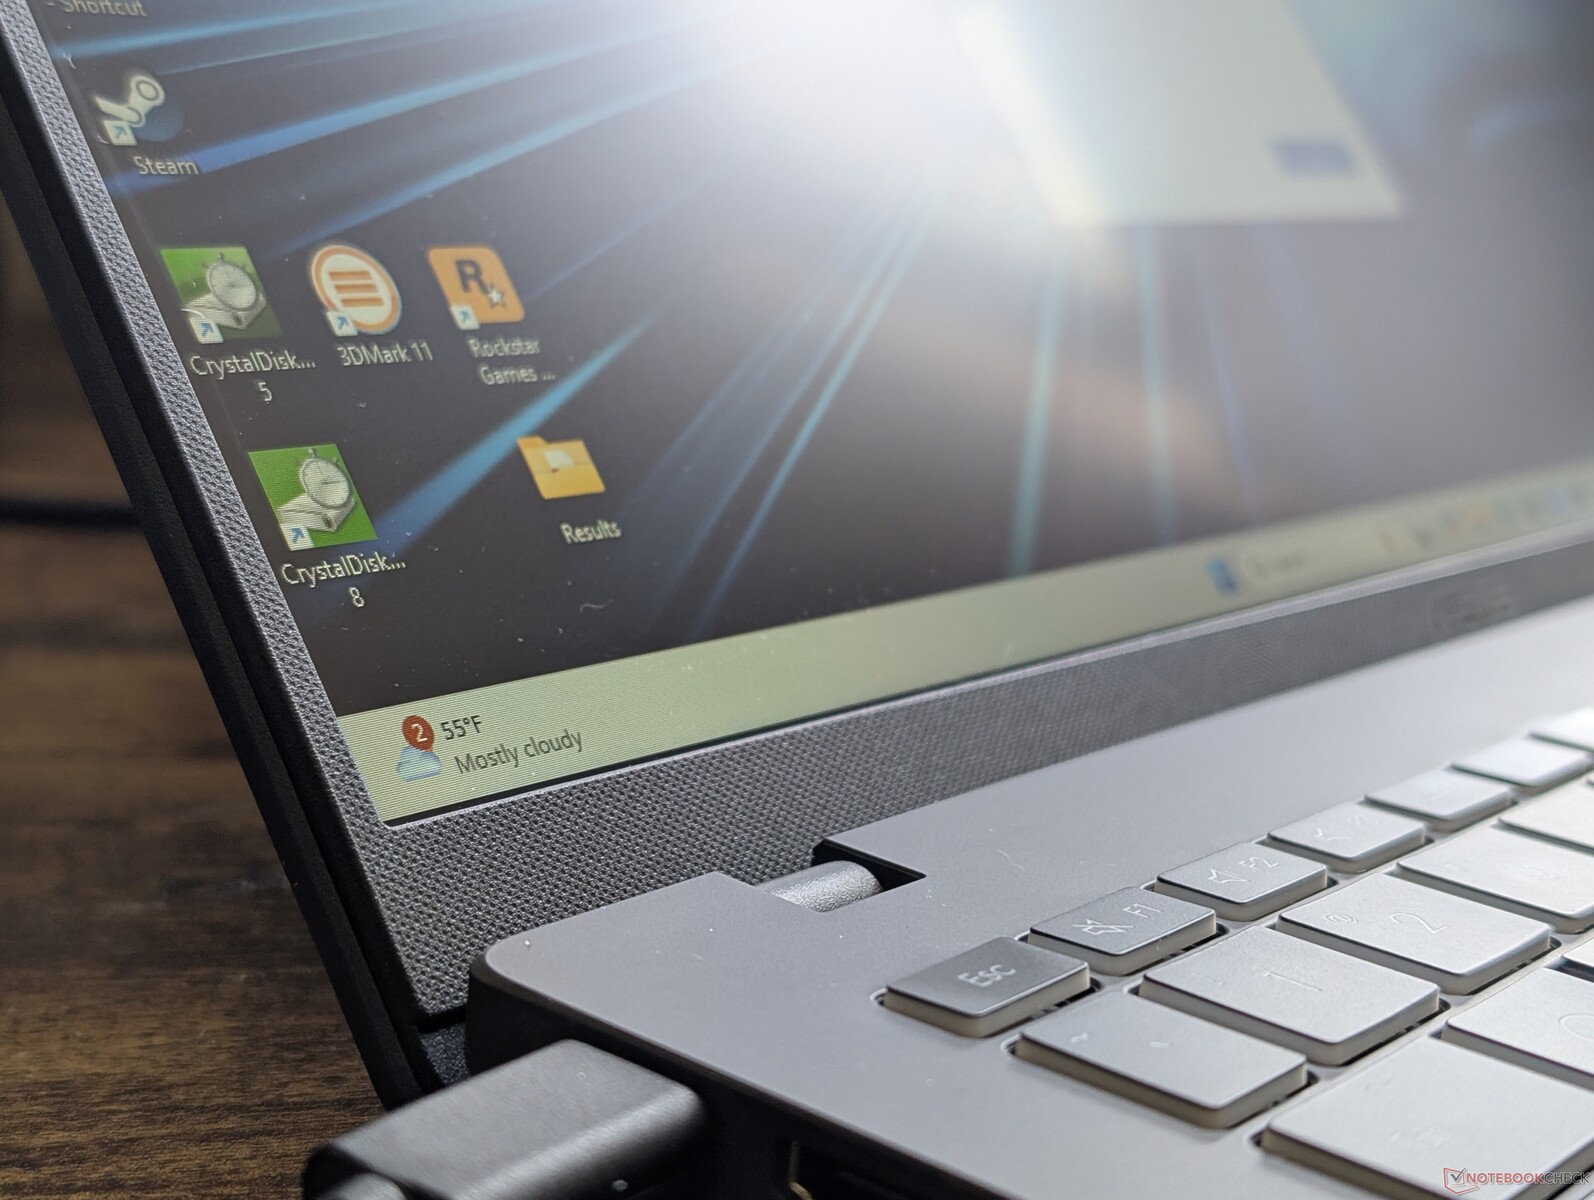
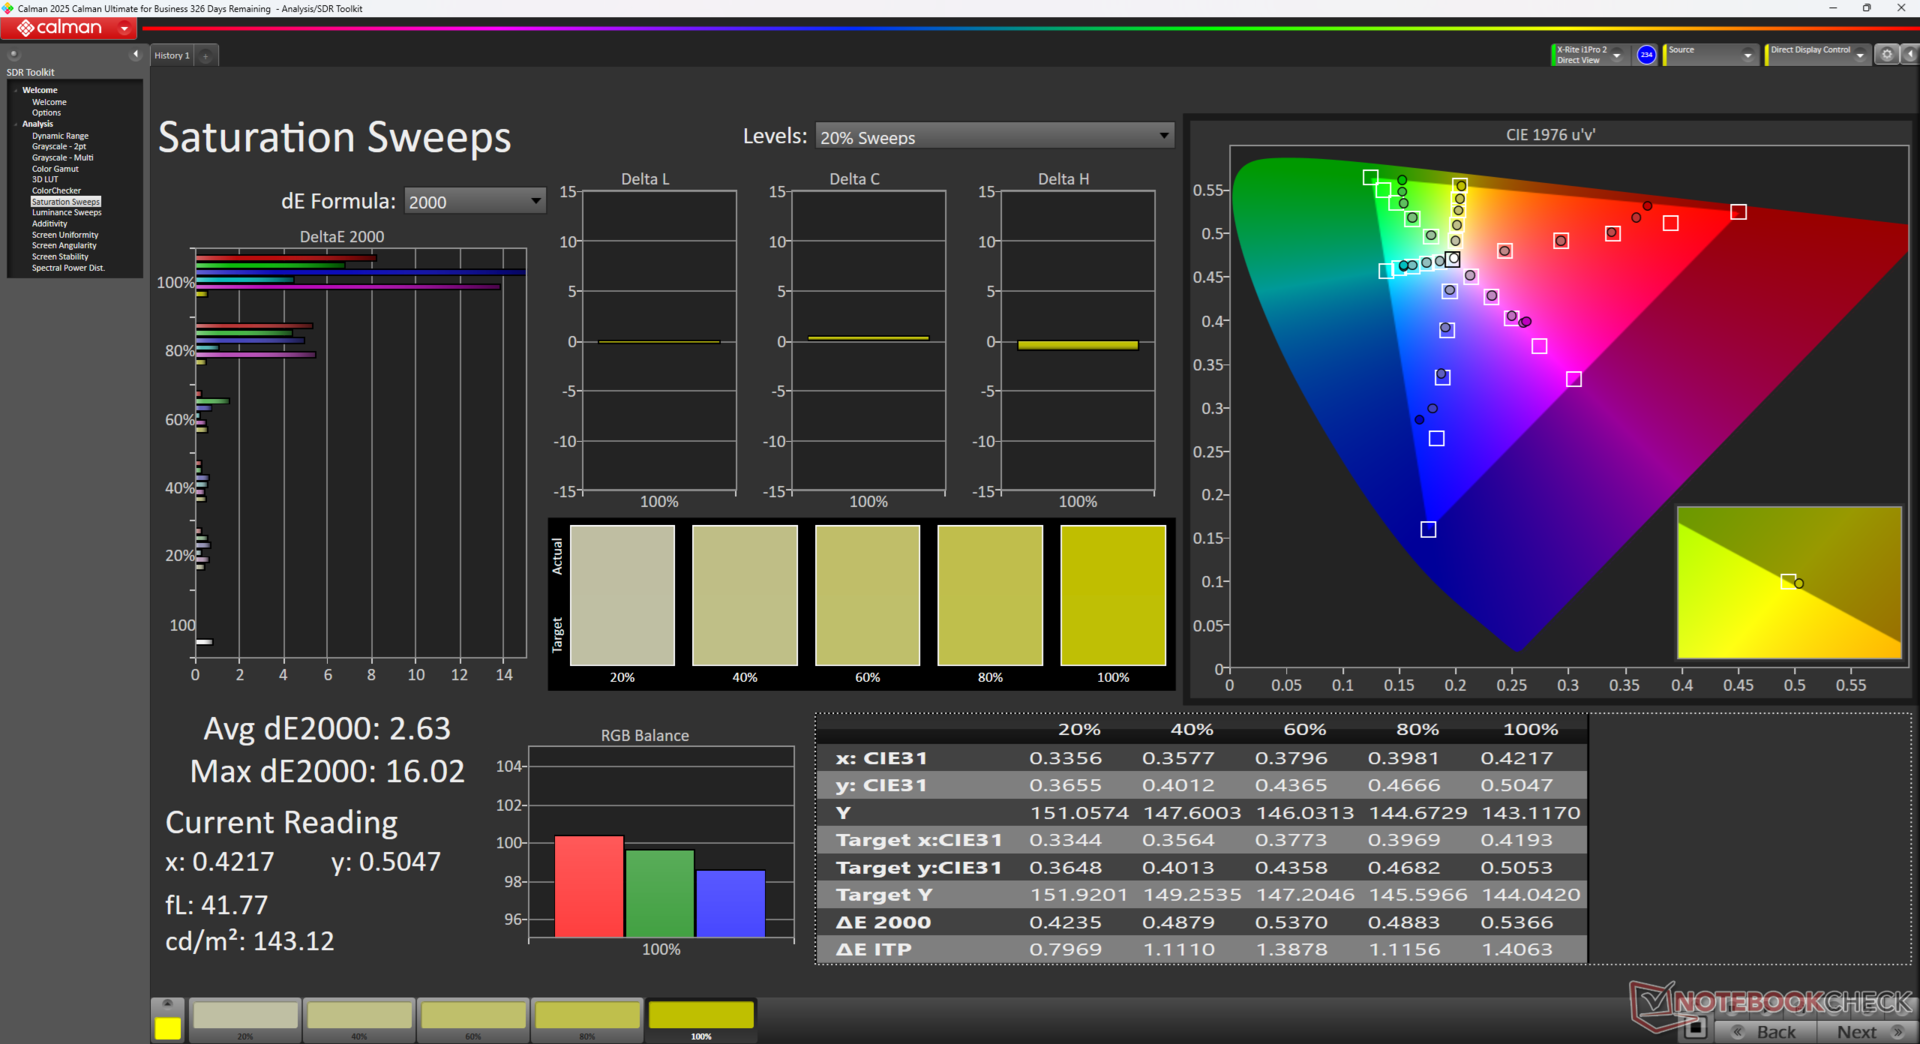
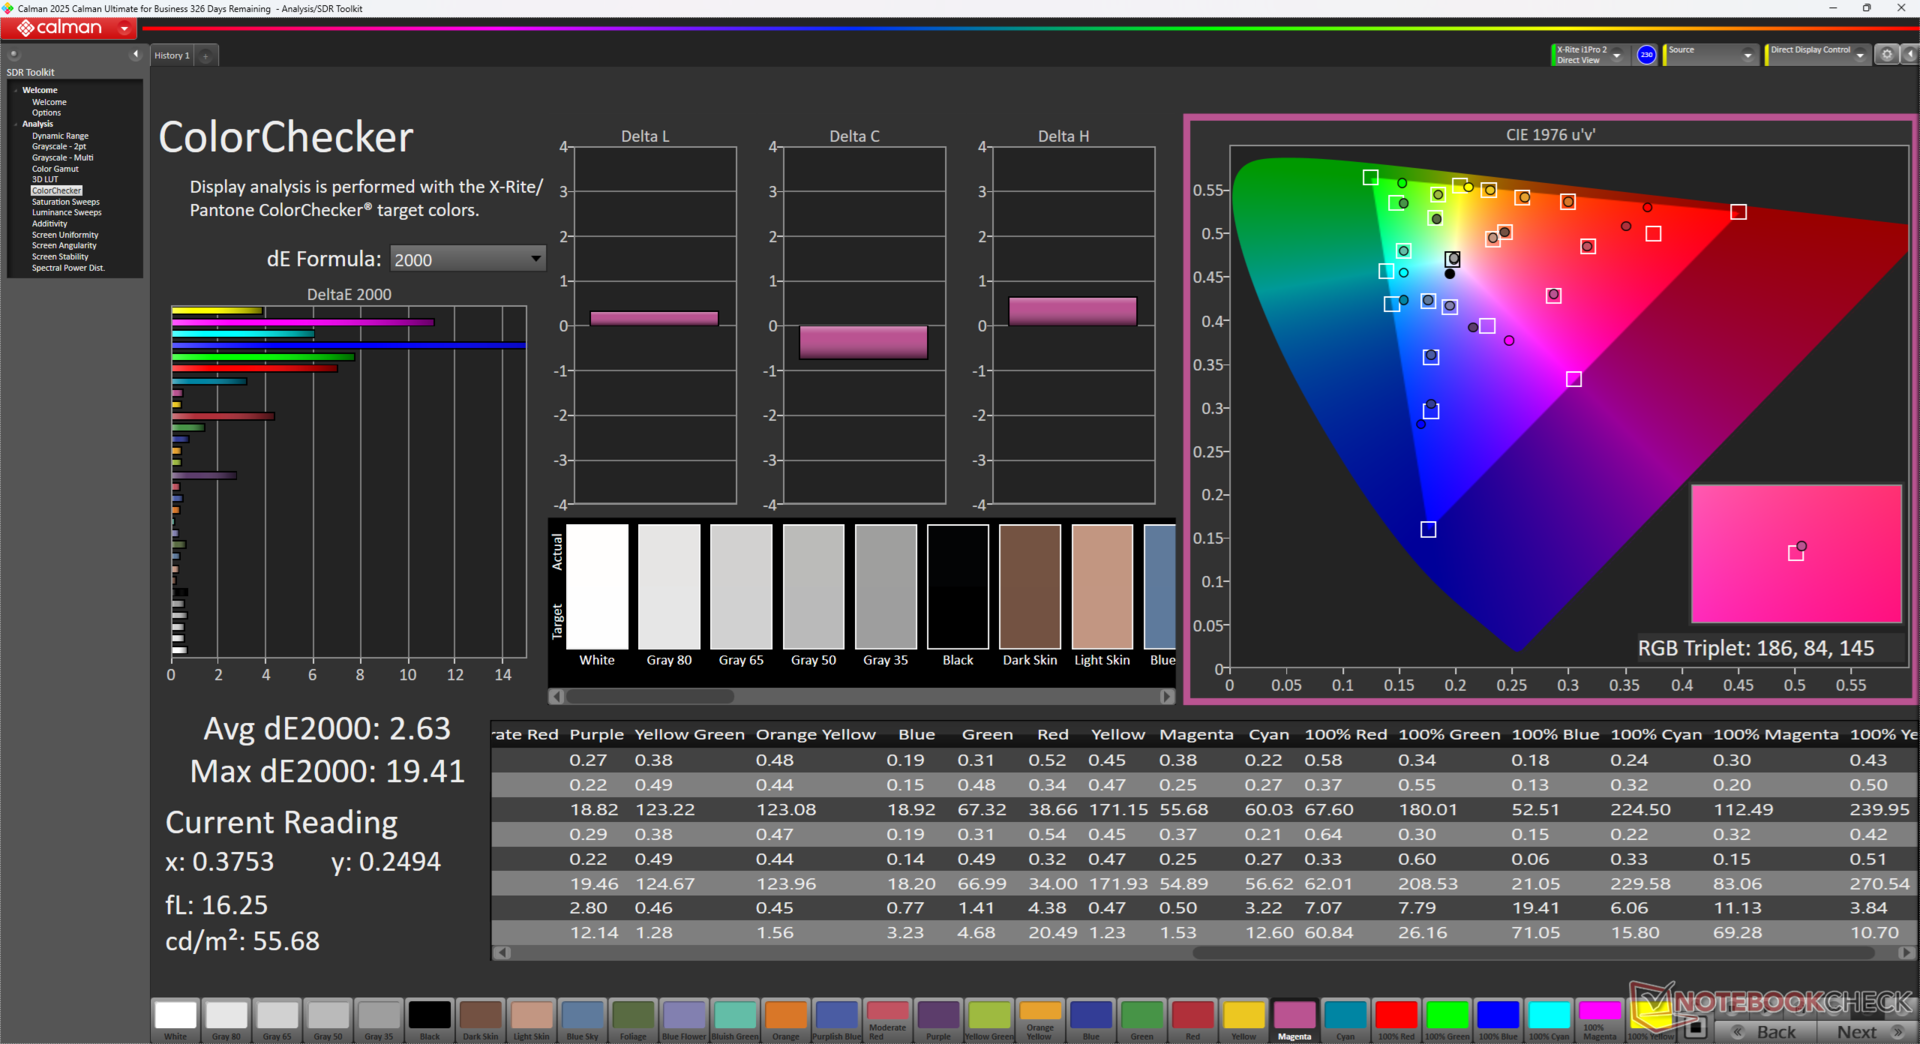
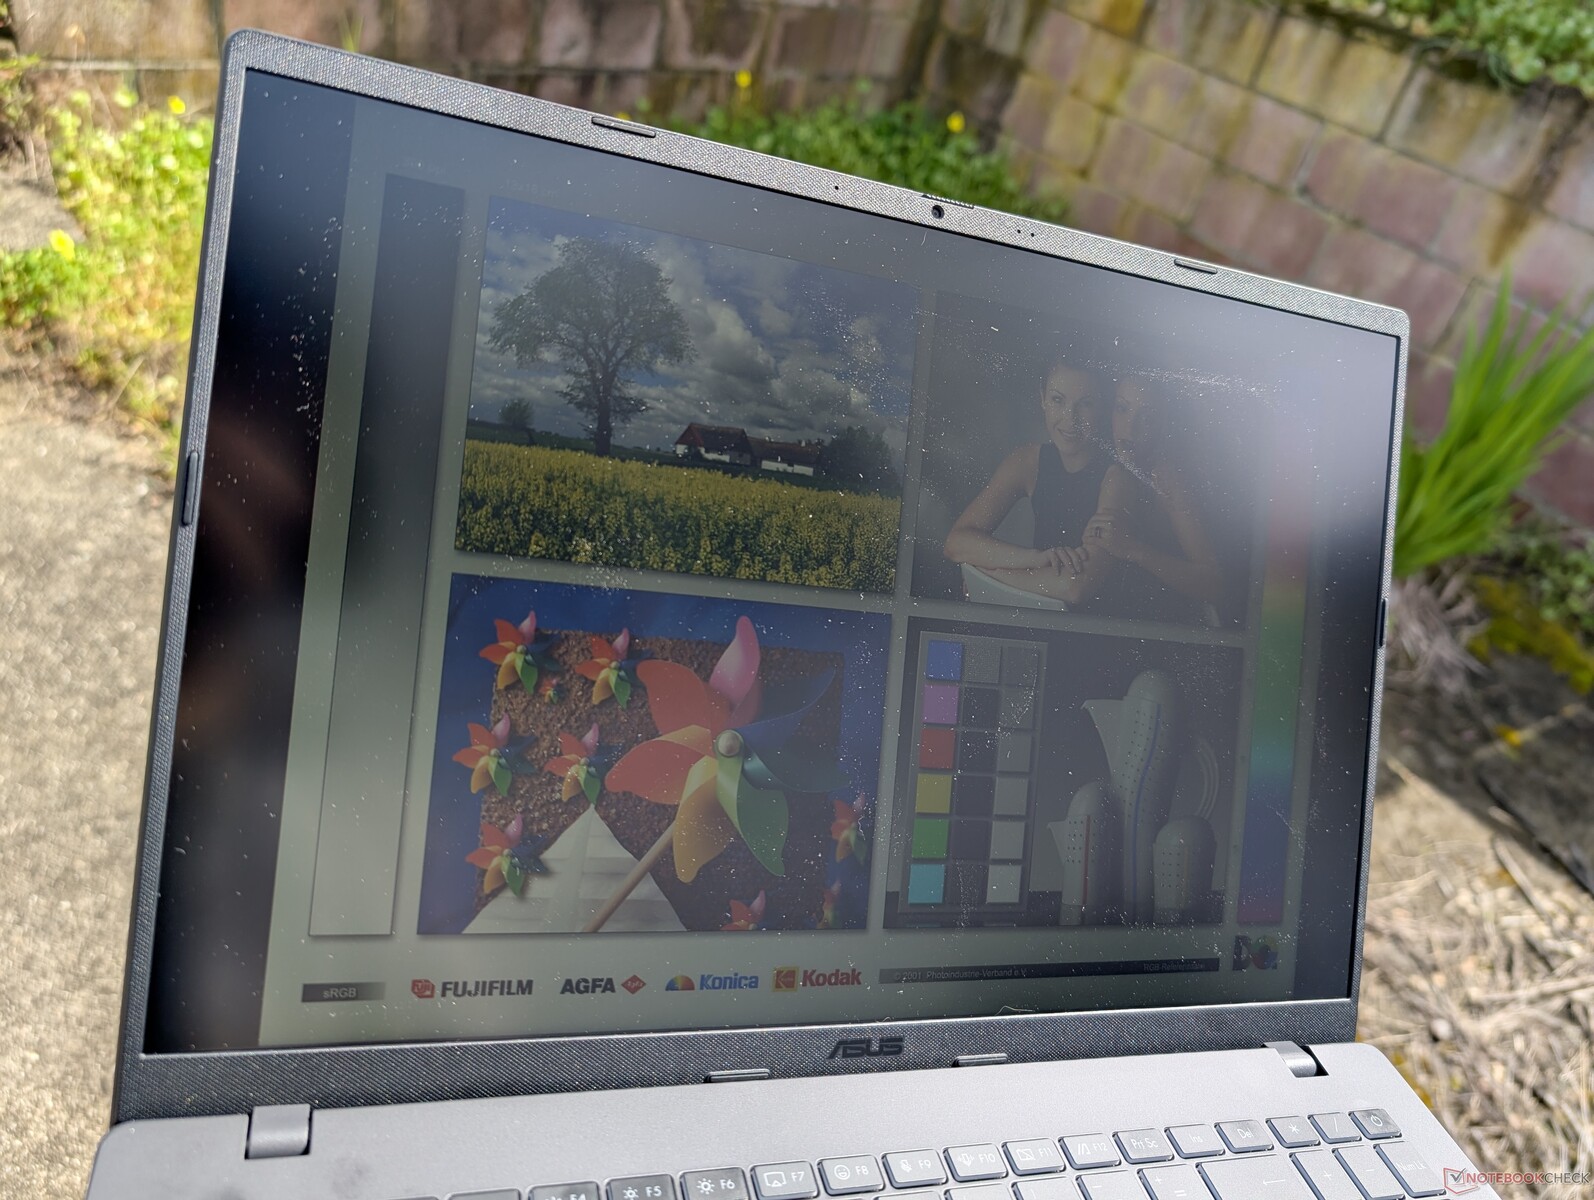
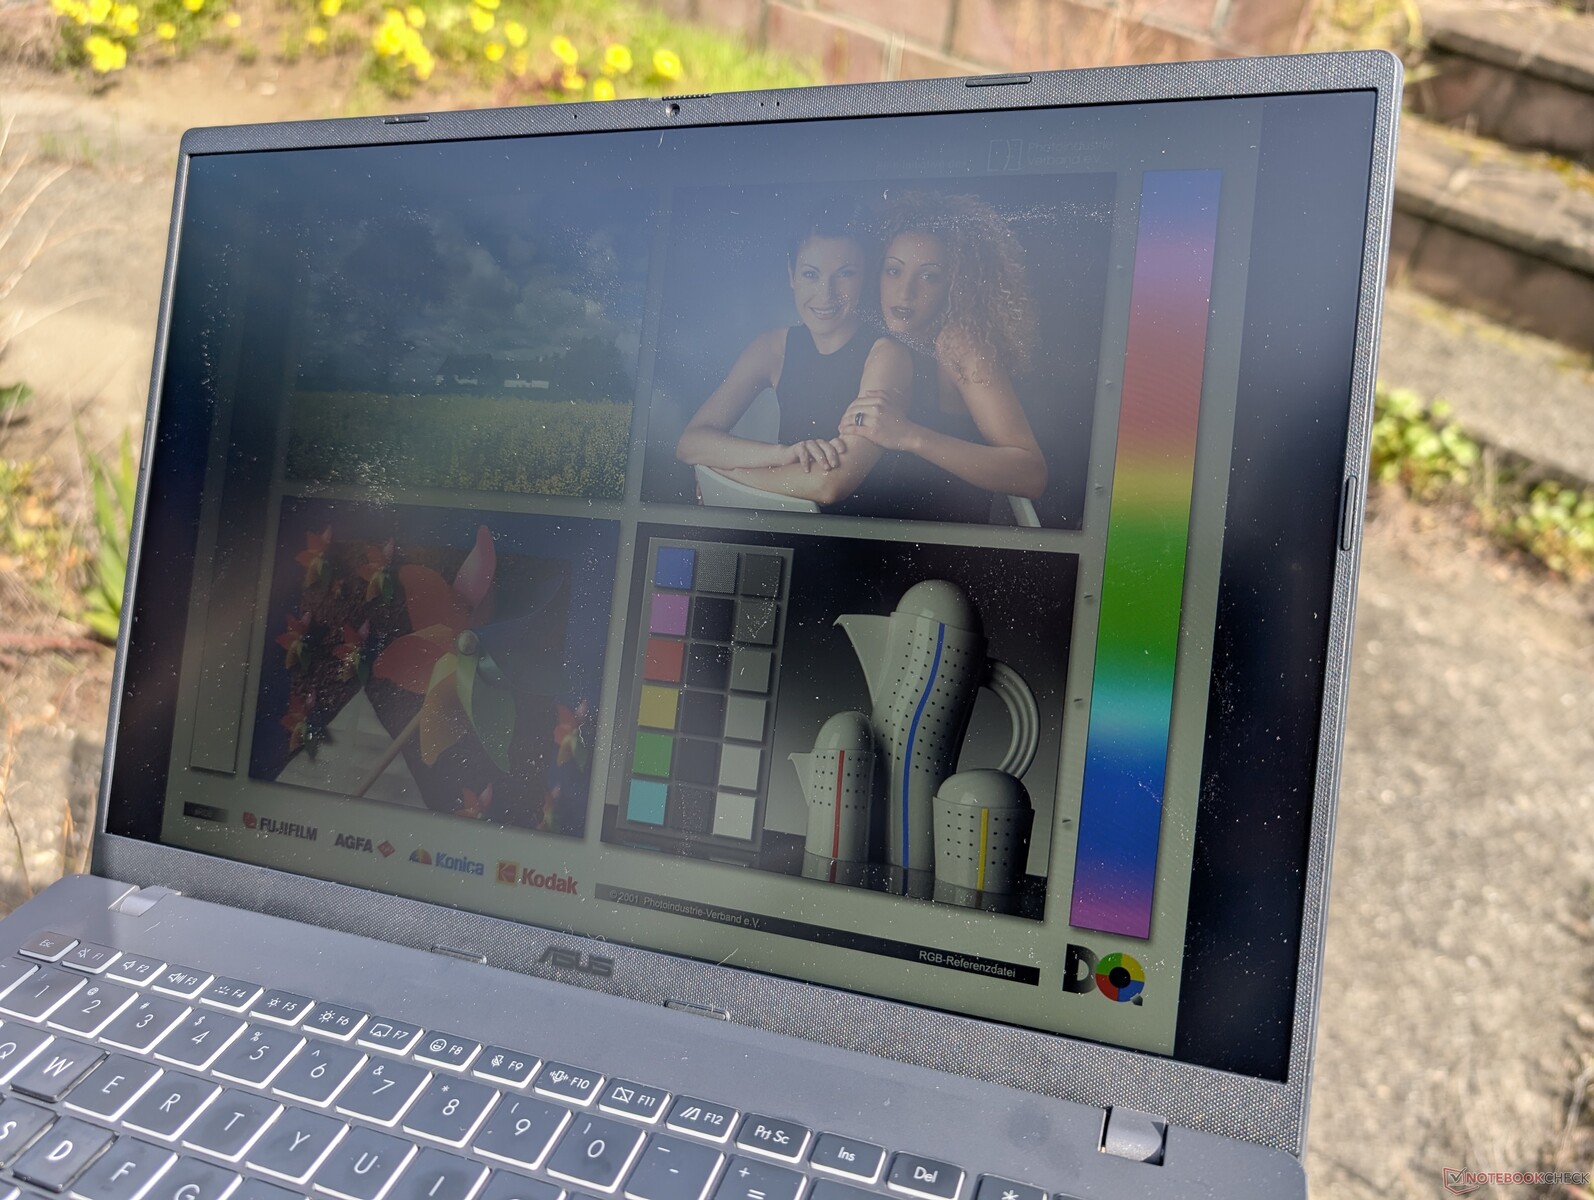
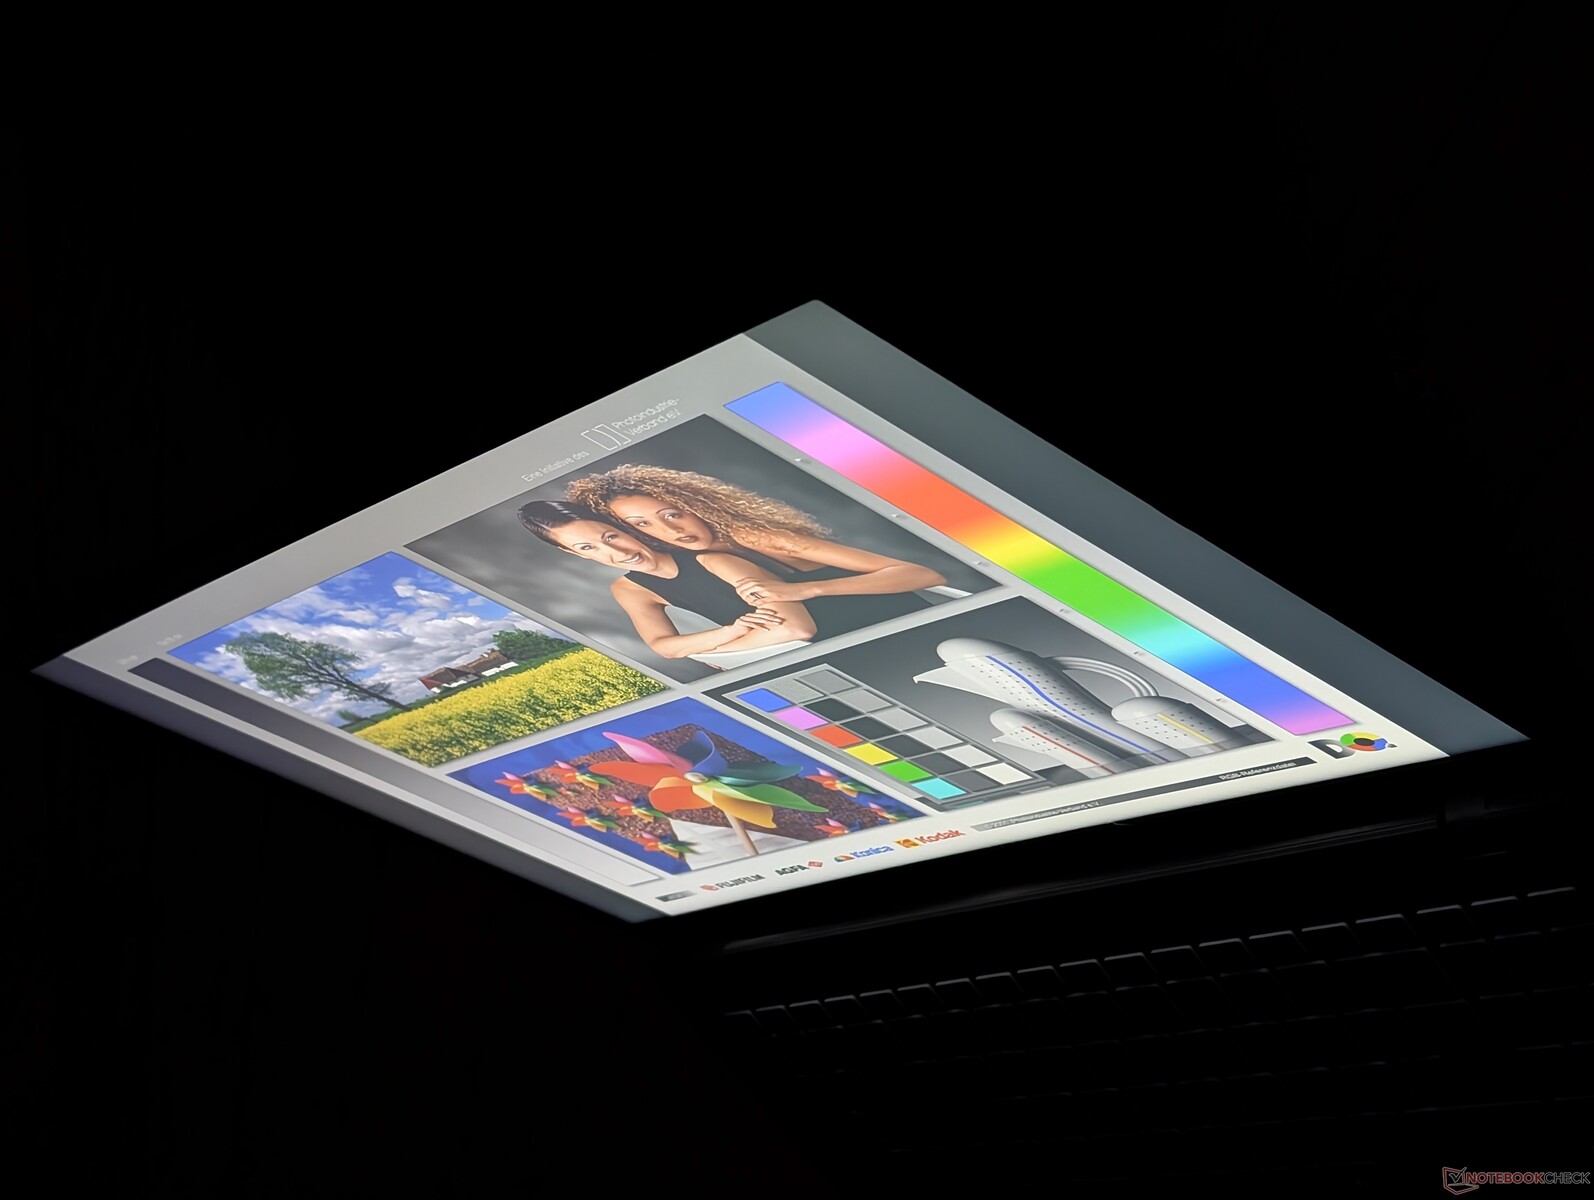
Display - 144 Hz ingår som standard
Den mest anmärkningsvärda egenskapen hos skärmen är dess inbyggda uppdateringsfrekvens på 144 Hz som ger smidig markörstyrning och respons. I övrigt är det en budgetpanel med sina smala färger, låga kontrastförhållande och genomsnittliga maximala ljusstyrka.
| |||||||||||||||||||||||||
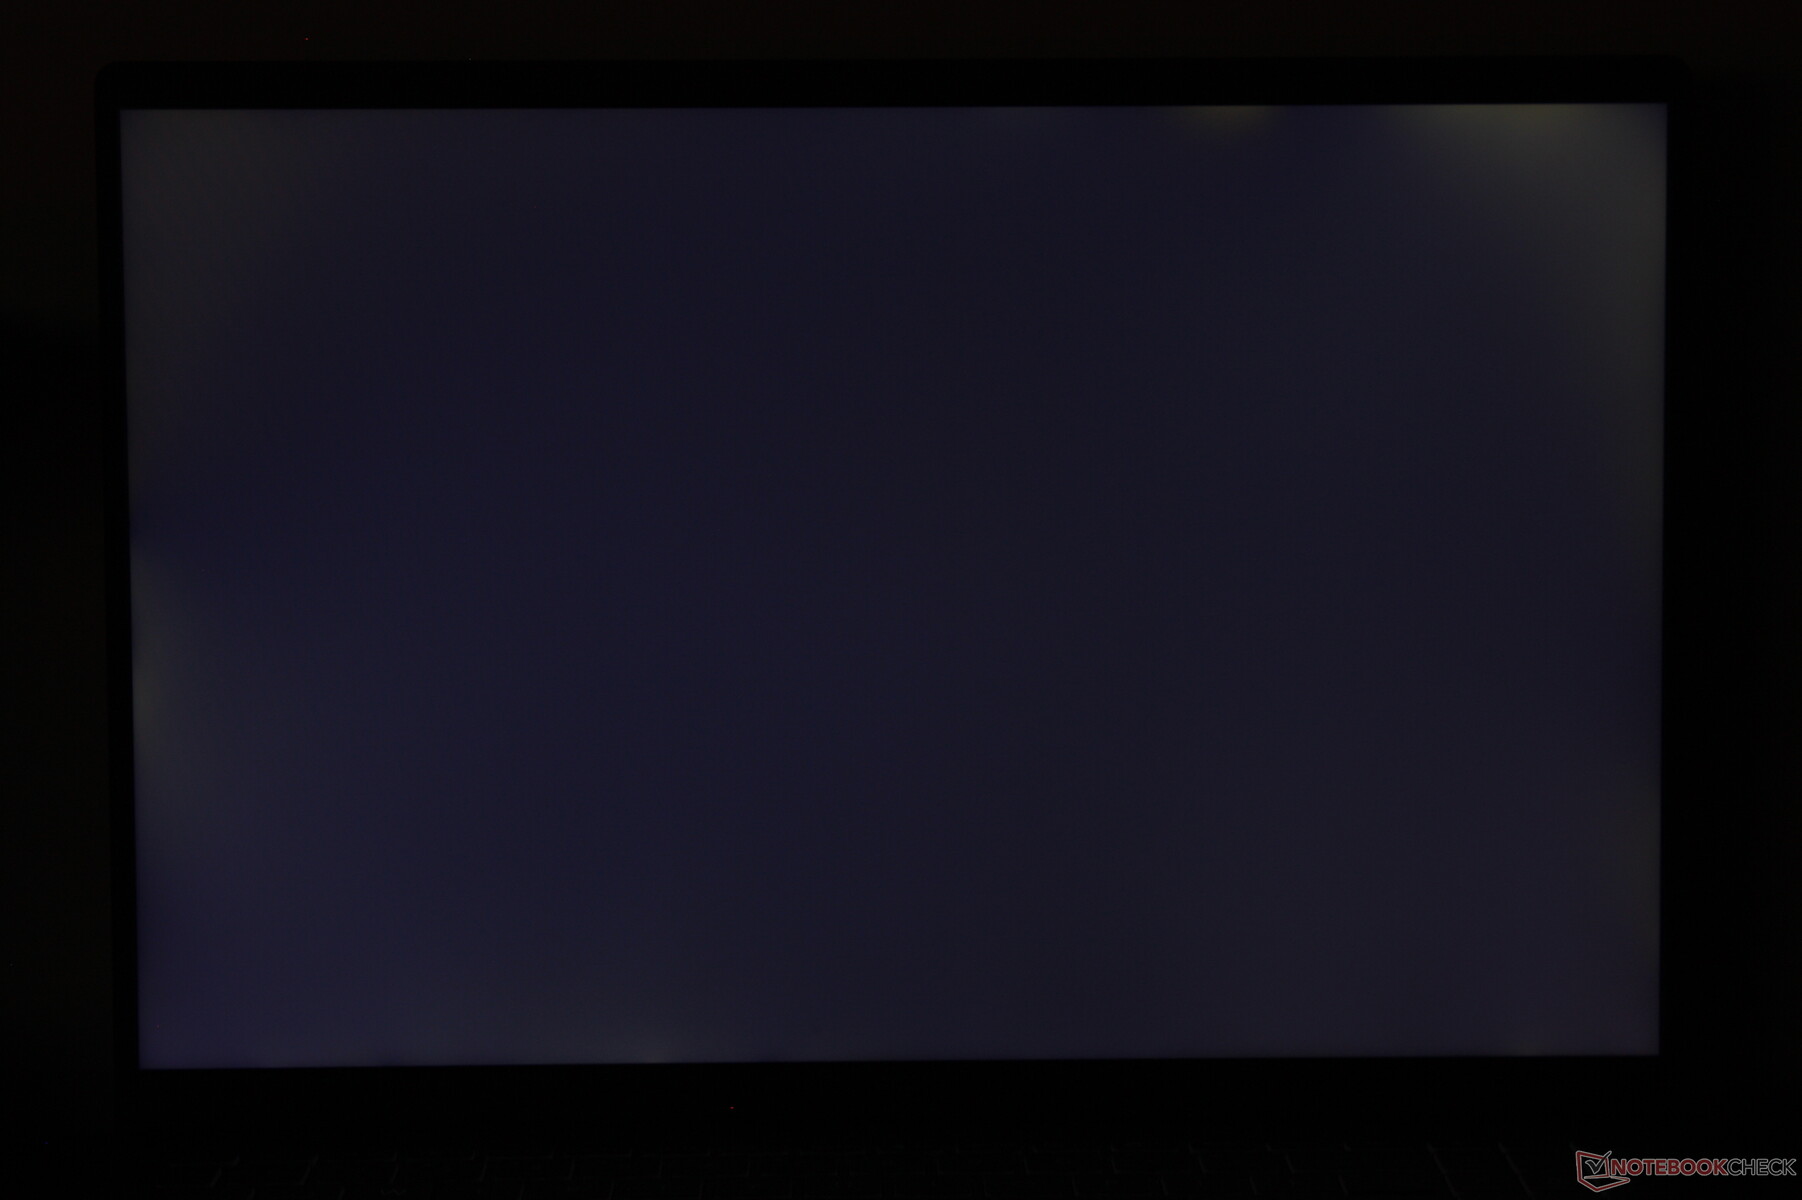
Distribution av ljusstyrkan: 88 %
Mitt på batteriet: 313.3 cd/m²
Kontrast: 627:1 (Svärta: 0.5 cd/m²)
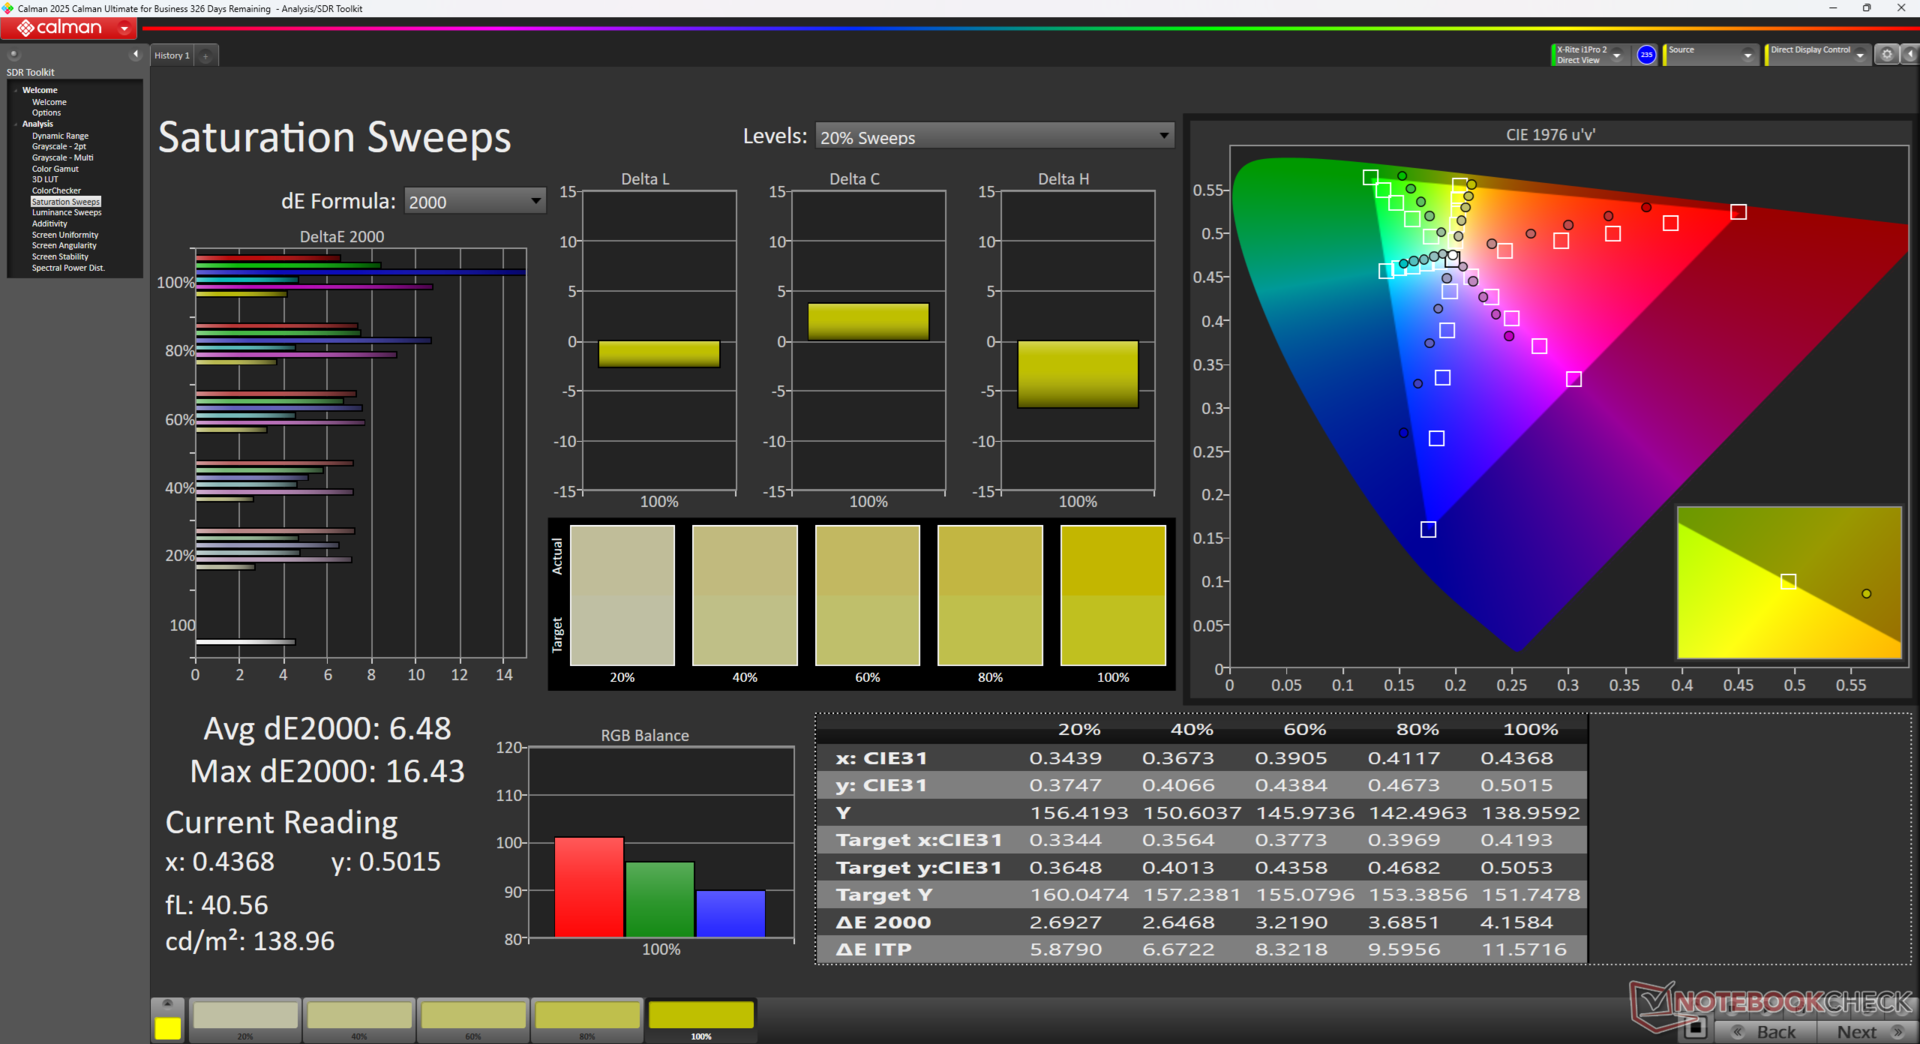
ΔE Color 6.09 | 0.5-29.43 Ø4.87, calibrated: 2.63
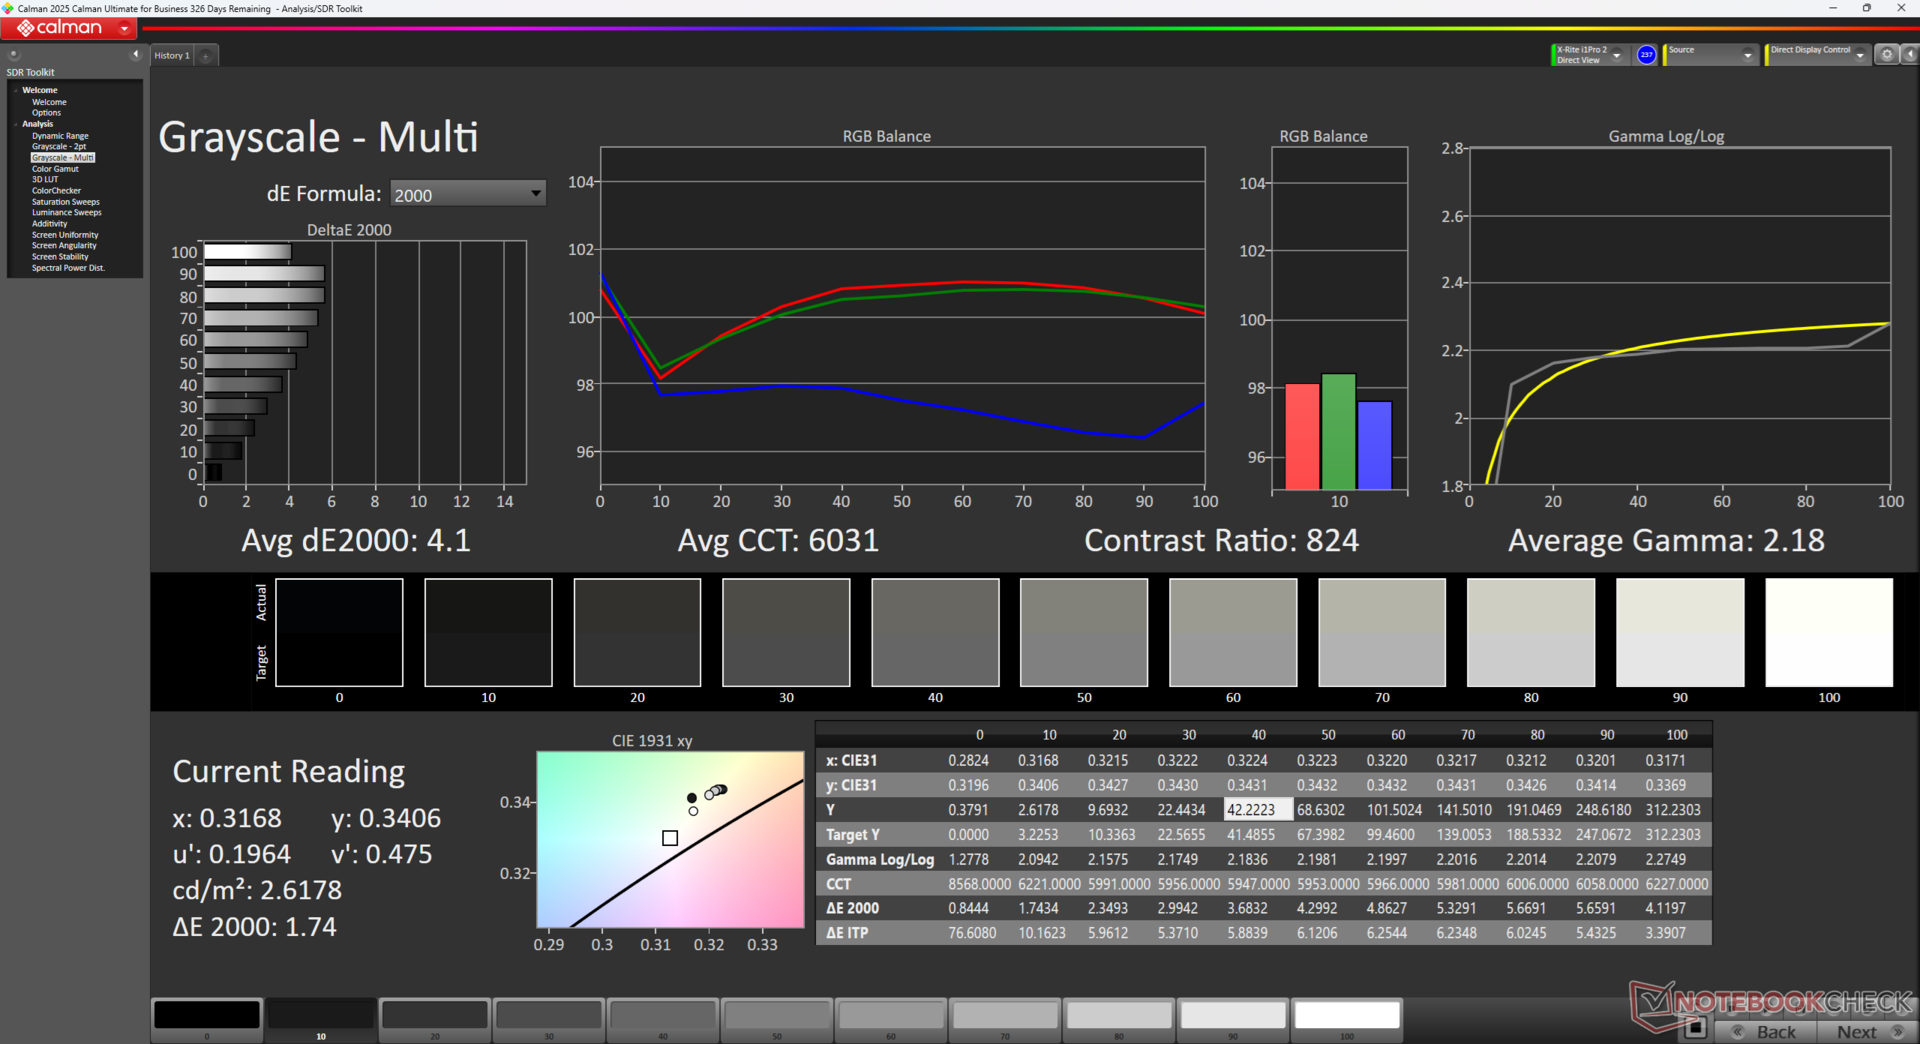
ΔE Greyscale 4.1 | 0.5-98 Ø5.1
42.2% AdobeRGB 1998 (Argyll 2.2.0 3D)
59.7% sRGB (Argyll 2.2.0 3D)
40.9% Display P3 (Argyll 2.2.0 3D)
Gamma: 2.18
| Asus V16 V3607V MNG007QX2-2, IPS, 1920x1200, 16", 144 Hz | Asus VivoBook Pro 16 K6602VU Samsung ATNA60BX01-1, OLED, 3200x2000, 16", 120 Hz | Dell Inspiron 16 Plus 7640 AU Optronics B160QAN, IPS, 2560x1600, 16", 120 Hz | Lenovo ThinkBook 16 G7 IML LEN160WUXGA, IPS, 1920x1200, 16", 60 Hz | HP Pavilion Plus 16-ab0456tx AU Optronics AUOFDA4, IPS, 2560x1600, 16", 120 Hz | Acer Swift Edge 16 SFE16-44-R0XV Samsung ATNA60BX03-0, OLED, 3200x2000, 16", 120 Hz | |
|---|---|---|---|---|---|---|
| Display | 112% | 78% | 2% | 76% | 115% | |
| Display P3 Coverage | 40.9 | 98.7 141% | 76 86% | 41.6 2% | 74.6 82% | 99.9 144% |
| sRGB Coverage | 59.7 | 99.7 67% | 99.8 67% | 61.2 3% | 99 66% | 100 68% |
| AdobeRGB 1998 Coverage | 42.2 | 96.5 129% | 76.7 82% | 43 2% | 76.5 81% | 98 132% |
| Response Times | 58% | -11% | 9% | 59% | 97% | |
| Response Time Grey 50% / Grey 80% * | 22.9 ? | 0.68 ? 97% | 25.6 ? -12% | 18.4 ? 20% | 9.06 ? 60% | 0.4 ? 98% |
| Response Time Black / White * | 16.1 ? | 13.2 ? 18% | 17.6 ? -9% | 16.5 ? -2% | 6.7 ? 58% | 0.6 ? 96% |
| PWM Frequency | 240 ? | 120 ? | ||||
| Screen | 26% | 45% | -7% | 36% | 7243% | |
| Brightness middle | 313.3 | 353 13% | 314.7 0% | 321.2 3% | 403 29% | 407 30% |
| Brightness | 298 | 354 19% | 291 -2% | 319 7% | 394 32% | 405 36% |
| Brightness Distribution | 88 | 98 11% | 89 1% | 92 5% | 90 2% | 98 11% |
| Black Level * | 0.5 | 0.28 44% | 0.37 26% | 0.34 32% | 0.001 100% | |
| Contrast | 627 | 1124 79% | 868 38% | 1185 89% | 407000 64812% | |
| Colorchecker dE 2000 * | 6.09 | 4.23 31% | 1.62 73% | 8.7 -43% | 3.13 49% | 2.27 63% |
| Colorchecker dE 2000 max. * | 19.31 | 7.13 63% | 2.94 85% | 19.85 -3% | 6.14 68% | 4.46 77% |
| Colorchecker dE 2000 calibrated * | 2.63 | 2.42 8% | 1.08 59% | 1.82 31% | 1.65 37% | 2.17 17% |
| Greyscale dE 2000 * | 4.1 | 2.5 39% | 1.3 68% | 9.2 -124% | 4.5 -10% | 2.3 44% |
| Gamma | 2.18 101% | 2.4 92% | 2.26 97% | 2.83 78% | 2.18 101% | 2.231 99% |
| CCT | 6031 108% | 6642 98% | 6385 102% | 6200 105% | 6261 104% | 6443 101% |
| Totalt genomsnitt (program/inställningar) | 65% /
53% | 37% /
44% | 1% /
-3% | 57% /
48% | 2485% /
4695% |
* ... mindre är bättre
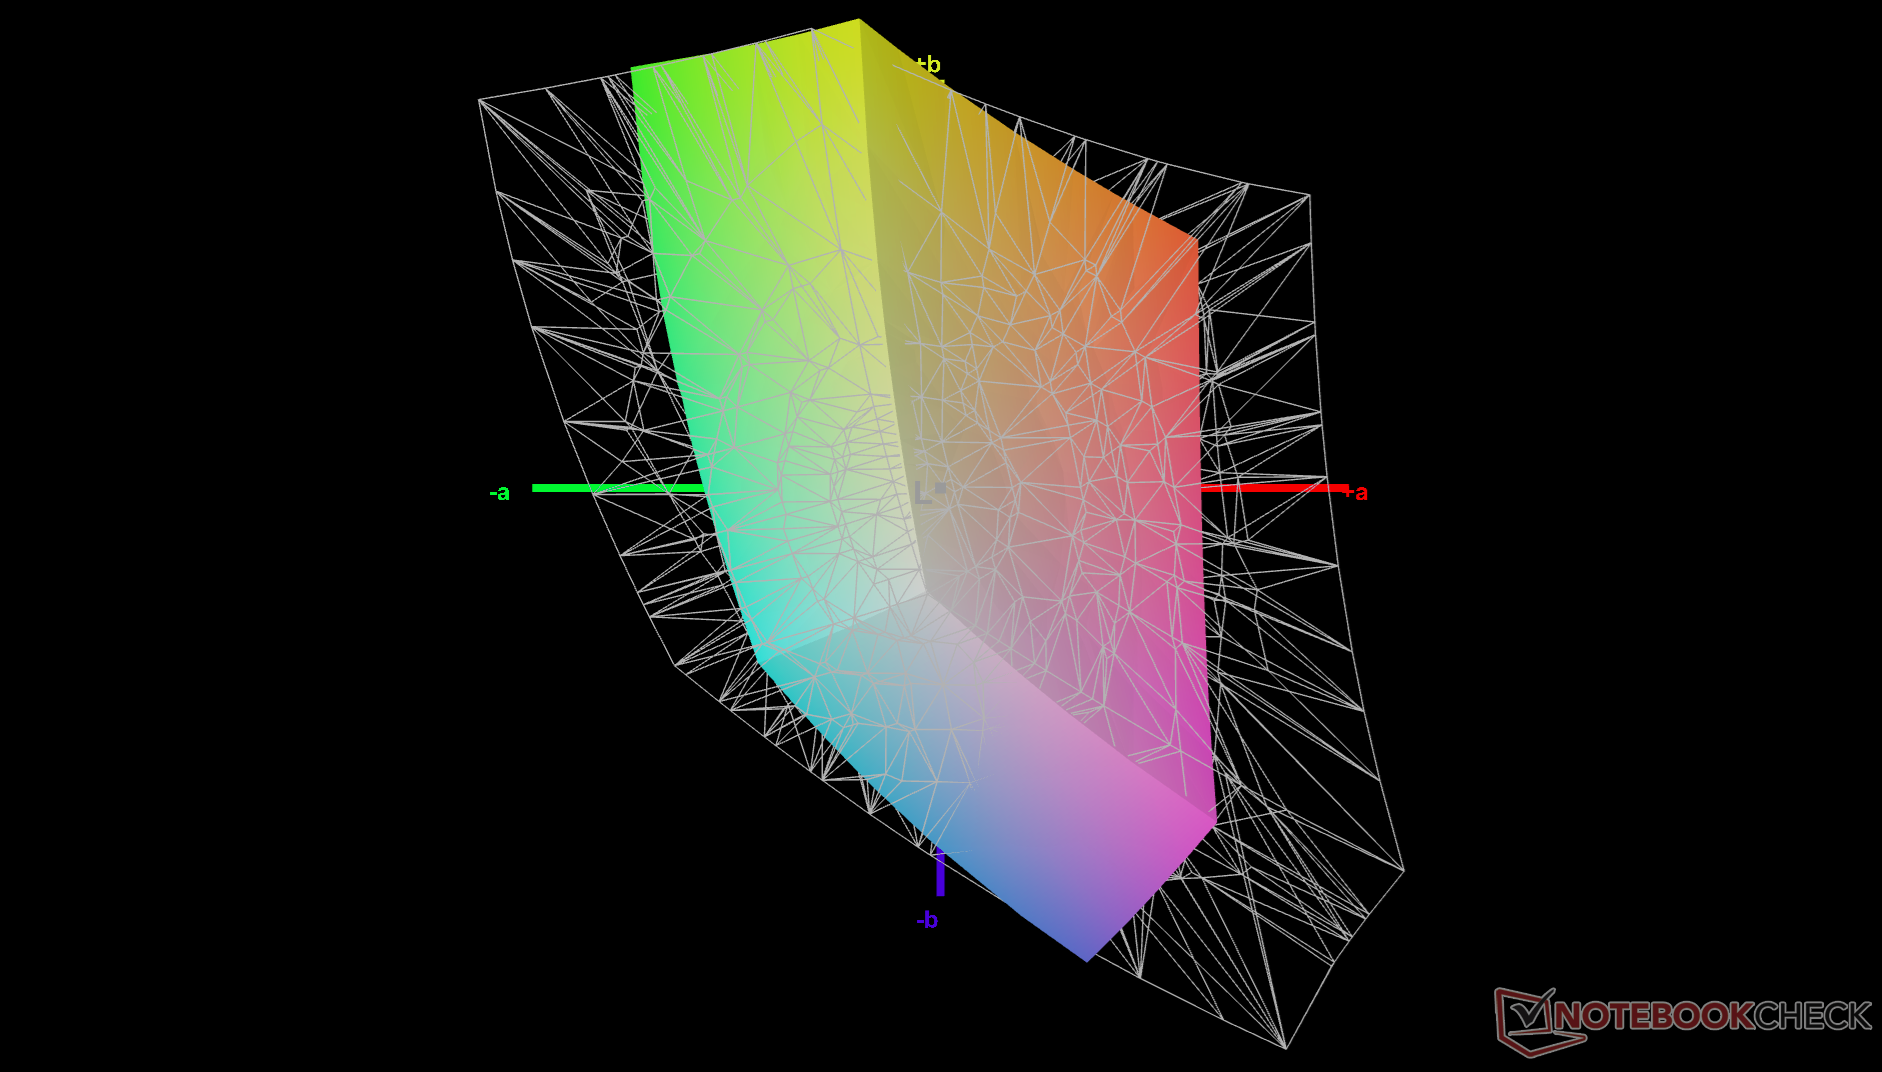
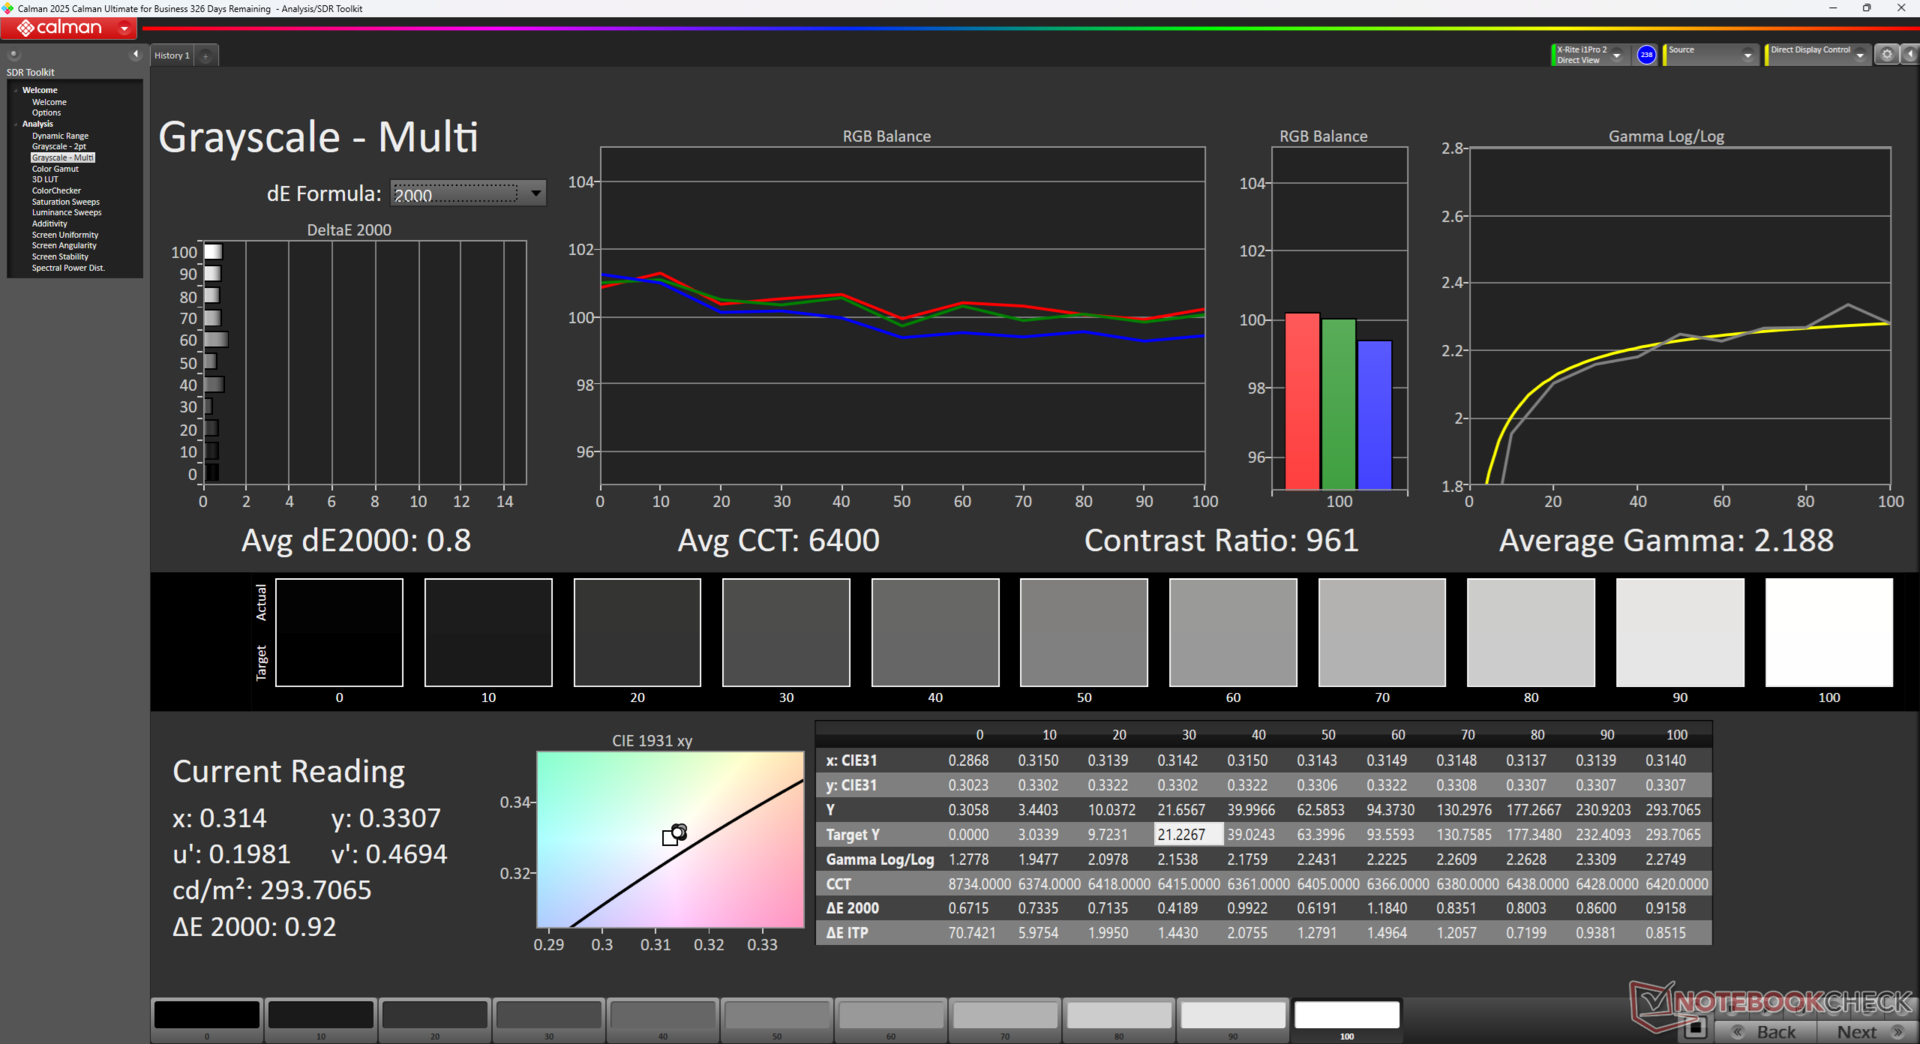
De genomsnittliga deltaE-värdena för gråskala och färg är hyfsade direkt från förpackningen, 4,1 respektive 6,09. Våra egna kalibreringsinsatser med en X-Rite-kolorimeter skulle förbättra dessa värden till bara 0,8 och 2,63.

Visa svarstider
| ↔ Svarstid svart till vitt | ||
|---|---|---|
| 16.1 ms ... stiga ↗ och falla ↘ kombinerat | ↗ 8.2 ms stiga | 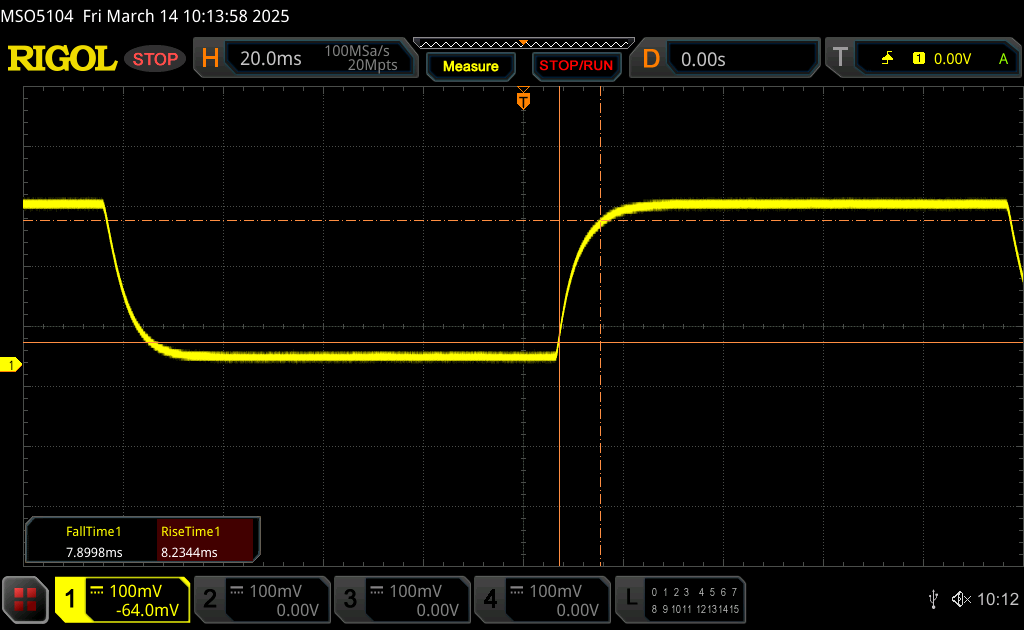 |
| ↘ 7.9 ms hösten | ||
| Skärmen visar bra svarsfrekvens i våra tester, men kan vara för långsam för konkurrenskraftiga spelare. I jämförelse sträcker sig alla testade enheter från 0.1 (minst) till 240 (maximalt) ms. » 35 % av alla enheter är bättre. Det betyder att den uppmätta svarstiden är bättre än genomsnittet av alla testade enheter (20.8 ms). | ||
| ↔ Svarstid 50 % grått till 80 % grått | ||
| 22.9 ms ... stiga ↗ och falla ↘ kombinerat | ↗ 11.2 ms stiga | 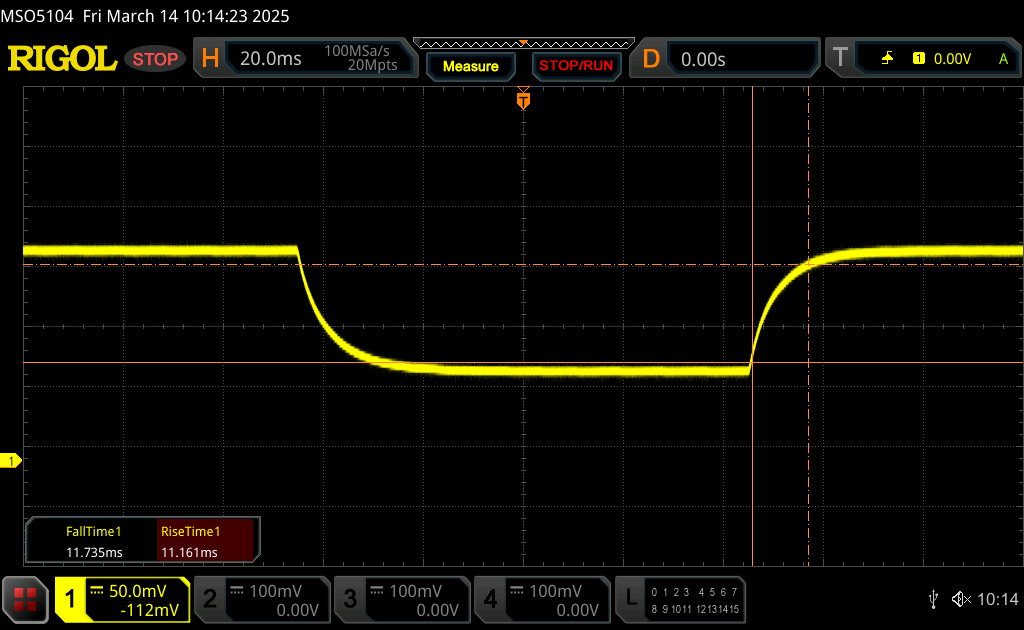 |
| ↘ 11.7 ms hösten | ||
| Skärmen visar bra svarsfrekvens i våra tester, men kan vara för långsam för konkurrenskraftiga spelare. I jämförelse sträcker sig alla testade enheter från 0.165 (minst) till 636 (maximalt) ms. » 31 % av alla enheter är bättre. Det betyder att den uppmätta svarstiden är bättre än genomsnittet av alla testade enheter (32.5 ms). | ||
Skärmflimmer / PWM (Puls-Width Modulation)
| Skärmflimmer / PWM upptäcktes inte |  | ||
Som jämförelse: 53 % av alla testade enheter använder inte PWM för att dämpa skärmen. Om PWM upptäcktes mättes ett medelvärde av 8516 (minst: 5 - maximum: 343500) Hz. | |||

Prestanda - Inga anmärkningsvärda förbättringar

Testförhållanden
Vi ställde in Windows i prestandaläge och MyAsus i prestandaläge och optimerat läge innan vi körde nedanstående benchmarks. Den diskreta GPU:n kan inaktiveras helt utan att behöva startas om.
Processor
Core Core 7 240H presterar på samma sätt som Core Ultra 155H, men utan den integrerade NPU:n för att spara kostnader. Målgruppen av budgetspelare eller redaktörer kommer troligen inte ens att behöva eller använda NPU.
Cinebench R15 Multi Loop
Cinebench R23: Multi Core | Single Core
Cinebench R20: CPU (Multi Core) | CPU (Single Core)
Cinebench R15: CPU Multi 64Bit | CPU Single 64Bit
Blender: v2.79 BMW27 CPU
7-Zip 18.03: 7z b 4 | 7z b 4 -mmt1
Geekbench 6.4: Multi-Core | Single-Core
Geekbench 5.5: Multi-Core | Single-Core
HWBOT x265 Benchmark v2.2: 4k Preset
LibreOffice : 20 Documents To PDF
R Benchmark 2.5: Overall mean
| CPU Performance Rating | |
| Lenovo ThinkBook 16p G5 IRX 21N50011GE | |
| Asus TUF Gaming A16 FA608WV | |
| MSI Prestige 16 AI Evo B2HMG | |
| Lenovo ThinkPad Z16 Gen 2 | |
| Genomsnitt Intel Core 7 240H | |
| Asus V16 V3607V | |
| HP Spectre x360 16 RTX 4050 -1! | |
| Acer Aspire 16 A16-51GM-77G2 | |
| Cinebench R23 / Multi Core | |
| Lenovo ThinkBook 16p G5 IRX 21N50011GE | |
| Asus TUF Gaming A16 FA608WV | |
| MSI Prestige 16 AI Evo B2HMG | |
| Lenovo ThinkPad Z16 Gen 2 | |
| HP Spectre x360 16 RTX 4050 | |
| Asus V16 V3607V | |
| Genomsnitt Intel Core 7 240H (n=1) | |
| Acer Aspire 16 A16-51GM-77G2 | |
| Cinebench R23 / Single Core | |
| Lenovo ThinkBook 16p G5 IRX 21N50011GE | |
| MSI Prestige 16 AI Evo B2HMG | |
| Asus TUF Gaming A16 FA608WV | |
| Acer Aspire 16 A16-51GM-77G2 | |
| Asus V16 V3607V | |
| Genomsnitt Intel Core 7 240H (n=1) | |
| Lenovo ThinkPad Z16 Gen 2 | |
| HP Spectre x360 16 RTX 4050 | |
| Cinebench R20 / CPU (Multi Core) | |
| Lenovo ThinkBook 16p G5 IRX 21N50011GE | |
| Asus TUF Gaming A16 FA608WV | |
| MSI Prestige 16 AI Evo B2HMG | |
| Lenovo ThinkPad Z16 Gen 2 | |
| Asus V16 V3607V | |
| Genomsnitt Intel Core 7 240H (n=1) | |
| HP Spectre x360 16 RTX 4050 | |
| Acer Aspire 16 A16-51GM-77G2 | |
| Cinebench R20 / CPU (Single Core) | |
| Lenovo ThinkBook 16p G5 IRX 21N50011GE | |
| MSI Prestige 16 AI Evo B2HMG | |
| Asus TUF Gaming A16 FA608WV | |
| Acer Aspire 16 A16-51GM-77G2 | |
| Asus V16 V3607V | |
| Genomsnitt Intel Core 7 240H (n=1) | |
| Lenovo ThinkPad Z16 Gen 2 | |
| HP Spectre x360 16 RTX 4050 | |
| Cinebench R15 / CPU Multi 64Bit | |
| Lenovo ThinkBook 16p G5 IRX 21N50011GE | |
| Asus TUF Gaming A16 FA608WV | |
| MSI Prestige 16 AI Evo B2HMG | |
| Lenovo ThinkPad Z16 Gen 2 | |
| Asus V16 V3607V | |
| Genomsnitt Intel Core 7 240H (n=1) | |
| HP Spectre x360 16 RTX 4050 | |
| Acer Aspire 16 A16-51GM-77G2 | |
| Cinebench R15 / CPU Single 64Bit | |
| Lenovo ThinkBook 16p G5 IRX 21N50011GE | |
| MSI Prestige 16 AI Evo B2HMG | |
| Asus TUF Gaming A16 FA608WV | |
| Acer Aspire 16 A16-51GM-77G2 | |
| Lenovo ThinkPad Z16 Gen 2 | |
| Asus V16 V3607V | |
| Genomsnitt Intel Core 7 240H (n=1) | |
| HP Spectre x360 16 RTX 4050 | |
| Blender / v2.79 BMW27 CPU | |
| Acer Aspire 16 A16-51GM-77G2 | |
| Asus V16 V3607V | |
| Genomsnitt Intel Core 7 240H (n=1) | |
| MSI Prestige 16 AI Evo B2HMG | |
| Lenovo ThinkPad Z16 Gen 2 | |
| Asus TUF Gaming A16 FA608WV | |
| Lenovo ThinkBook 16p G5 IRX 21N50011GE | |
| 7-Zip 18.03 / 7z b 4 | |
| Lenovo ThinkBook 16p G5 IRX 21N50011GE | |
| Asus TUF Gaming A16 FA608WV | |
| Lenovo ThinkPad Z16 Gen 2 | |
| MSI Prestige 16 AI Evo B2HMG | |
| HP Spectre x360 16 RTX 4050 | |
| Asus V16 V3607V | |
| Genomsnitt Intel Core 7 240H (n=1) | |
| Acer Aspire 16 A16-51GM-77G2 | |
| 7-Zip 18.03 / 7z b 4 -mmt1 | |
| Lenovo ThinkBook 16p G5 IRX 21N50011GE | |
| Acer Aspire 16 A16-51GM-77G2 | |
| Lenovo ThinkPad Z16 Gen 2 | |
| Asus V16 V3607V | |
| Genomsnitt Intel Core 7 240H (n=1) | |
| Asus TUF Gaming A16 FA608WV | |
| MSI Prestige 16 AI Evo B2HMG | |
| HP Spectre x360 16 RTX 4050 | |
| Geekbench 6.4 / Multi-Core | |
| Lenovo ThinkBook 16p G5 IRX 21N50011GE | |
| MSI Prestige 16 AI Evo B2HMG | |
| Asus TUF Gaming A16 FA608WV | |
| Lenovo ThinkPad Z16 Gen 2 | |
| Genomsnitt Intel Core 7 240H (11285 - 12846, n=2) | |
| HP Spectre x360 16 RTX 4050 | |
| Asus V16 V3607V | |
| Acer Aspire 16 A16-51GM-77G2 | |
| Geekbench 6.4 / Single-Core | |
| Lenovo ThinkBook 16p G5 IRX 21N50011GE | |
| MSI Prestige 16 AI Evo B2HMG | |
| Asus TUF Gaming A16 FA608WV | |
| Acer Aspire 16 A16-51GM-77G2 | |
| Genomsnitt Intel Core 7 240H (2646 - 2648, n=2) | |
| Asus V16 V3607V | |
| Lenovo ThinkPad Z16 Gen 2 | |
| HP Spectre x360 16 RTX 4050 | |
| Geekbench 5.5 / Multi-Core | |
| Lenovo ThinkBook 16p G5 IRX 21N50011GE | |
| MSI Prestige 16 AI Evo B2HMG | |
| Asus TUF Gaming A16 FA608WV | |
| HP Spectre x360 16 RTX 4050 | |
| Lenovo ThinkPad Z16 Gen 2 | |
| Asus V16 V3607V | |
| Genomsnitt Intel Core 7 240H (n=1) | |
| Acer Aspire 16 A16-51GM-77G2 | |
| Geekbench 5.5 / Single-Core | |
| Lenovo ThinkBook 16p G5 IRX 21N50011GE | |
| Asus TUF Gaming A16 FA608WV | |
| MSI Prestige 16 AI Evo B2HMG | |
| Acer Aspire 16 A16-51GM-77G2 | |
| Lenovo ThinkPad Z16 Gen 2 | |
| Asus V16 V3607V | |
| Genomsnitt Intel Core 7 240H (n=1) | |
| HP Spectre x360 16 RTX 4050 | |
| HWBOT x265 Benchmark v2.2 / 4k Preset | |
| Lenovo ThinkBook 16p G5 IRX 21N50011GE | |
| Asus TUF Gaming A16 FA608WV | |
| MSI Prestige 16 AI Evo B2HMG | |
| Lenovo ThinkPad Z16 Gen 2 | |
| Asus V16 V3607V | |
| Genomsnitt Intel Core 7 240H (n=1) | |
| HP Spectre x360 16 RTX 4050 | |
| Acer Aspire 16 A16-51GM-77G2 | |
| LibreOffice / 20 Documents To PDF | |
| Asus V16 V3607V | |
| Genomsnitt Intel Core 7 240H (n=1) | |
| Asus TUF Gaming A16 FA608WV | |
| Lenovo ThinkPad Z16 Gen 2 | |
| Lenovo ThinkBook 16p G5 IRX 21N50011GE | |
| HP Spectre x360 16 RTX 4050 | |
| MSI Prestige 16 AI Evo B2HMG | |
| Acer Aspire 16 A16-51GM-77G2 | |
| R Benchmark 2.5 / Overall mean | |
| HP Spectre x360 16 RTX 4050 | |
| Lenovo ThinkPad Z16 Gen 2 | |
| Acer Aspire 16 A16-51GM-77G2 | |
| MSI Prestige 16 AI Evo B2HMG | |
| Asus V16 V3607V | |
| Genomsnitt Intel Core 7 240H (n=1) | |
| Asus TUF Gaming A16 FA608WV | |
| Lenovo ThinkBook 16p G5 IRX 21N50011GE | |
* ... mindre är bättre
AIDA64: FP32 Ray-Trace | FPU Julia | CPU SHA3 | CPU Queen | FPU SinJulia | FPU Mandel | CPU AES | CPU ZLib | FP64 Ray-Trace | CPU PhotoWorxx
| Performance Rating | |
| Asus VivoBook Pro 16 K6602VU | |
| HP Pavilion Plus 16-ab0456tx | |
| Dell Inspiron 16 Plus 7640 | |
| Acer Swift Edge 16 SFE16-44-R0XV | |
| Asus V16 V3607V | |
| Genomsnitt Intel Core 7 240H | |
| Lenovo ThinkBook 16 G7 IML | |
| AIDA64 / FP32 Ray-Trace | |
| Acer Swift Edge 16 SFE16-44-R0XV | |
| HP Pavilion Plus 16-ab0456tx | |
| Dell Inspiron 16 Plus 7640 | |
| Asus V16 V3607V | |
| Genomsnitt Intel Core 7 240H (n=1) | |
| Asus VivoBook Pro 16 K6602VU | |
| Lenovo ThinkBook 16 G7 IML | |
| AIDA64 / FPU Julia | |
| HP Pavilion Plus 16-ab0456tx | |
| Asus VivoBook Pro 16 K6602VU | |
| Dell Inspiron 16 Plus 7640 | |
| Acer Swift Edge 16 SFE16-44-R0XV | |
| Asus V16 V3607V | |
| Genomsnitt Intel Core 7 240H (n=1) | |
| Lenovo ThinkBook 16 G7 IML | |
| AIDA64 / CPU SHA3 | |
| HP Pavilion Plus 16-ab0456tx | |
| Dell Inspiron 16 Plus 7640 | |
| Asus VivoBook Pro 16 K6602VU | |
| Acer Swift Edge 16 SFE16-44-R0XV | |
| Asus V16 V3607V | |
| Genomsnitt Intel Core 7 240H (n=1) | |
| Lenovo ThinkBook 16 G7 IML | |
| AIDA64 / CPU Queen | |
| HP Pavilion Plus 16-ab0456tx | |
| Asus VivoBook Pro 16 K6602VU | |
| Dell Inspiron 16 Plus 7640 | |
| Acer Swift Edge 16 SFE16-44-R0XV | |
| Asus V16 V3607V | |
| Genomsnitt Intel Core 7 240H (n=1) | |
| Lenovo ThinkBook 16 G7 IML | |
| AIDA64 / FPU SinJulia | |
| Acer Swift Edge 16 SFE16-44-R0XV | |
| Dell Inspiron 16 Plus 7640 | |
| HP Pavilion Plus 16-ab0456tx | |
| Asus VivoBook Pro 16 K6602VU | |
| Asus V16 V3607V | |
| Genomsnitt Intel Core 7 240H (n=1) | |
| Lenovo ThinkBook 16 G7 IML | |
| AIDA64 / FPU Mandel | |
| Acer Swift Edge 16 SFE16-44-R0XV | |
| HP Pavilion Plus 16-ab0456tx | |
| Dell Inspiron 16 Plus 7640 | |
| Asus VivoBook Pro 16 K6602VU | |
| Asus V16 V3607V | |
| Genomsnitt Intel Core 7 240H (n=1) | |
| Lenovo ThinkBook 16 G7 IML | |
| AIDA64 / CPU AES | |
| Asus VivoBook Pro 16 K6602VU | |
| Dell Inspiron 16 Plus 7640 | |
| HP Pavilion Plus 16-ab0456tx | |
| Acer Swift Edge 16 SFE16-44-R0XV | |
| Asus V16 V3607V | |
| Genomsnitt Intel Core 7 240H (n=1) | |
| Lenovo ThinkBook 16 G7 IML | |
| AIDA64 / CPU ZLib | |
| Dell Inspiron 16 Plus 7640 | |
| HP Pavilion Plus 16-ab0456tx | |
| Asus VivoBook Pro 16 K6602VU | |
| Asus V16 V3607V | |
| Genomsnitt Intel Core 7 240H (n=1) | |
| Lenovo ThinkBook 16 G7 IML | |
| Acer Swift Edge 16 SFE16-44-R0XV | |
| AIDA64 / FP64 Ray-Trace | |
| Acer Swift Edge 16 SFE16-44-R0XV | |
| HP Pavilion Plus 16-ab0456tx | |
| Asus VivoBook Pro 16 K6602VU | |
| Dell Inspiron 16 Plus 7640 | |
| Asus V16 V3607V | |
| Genomsnitt Intel Core 7 240H (n=1) | |
| Lenovo ThinkBook 16 G7 IML | |
| AIDA64 / CPU PhotoWorxx | |
| HP Pavilion Plus 16-ab0456tx | |
| Dell Inspiron 16 Plus 7640 | |
| Asus VivoBook Pro 16 K6602VU | |
| Acer Swift Edge 16 SFE16-44-R0XV | |
| Lenovo ThinkBook 16 G7 IML | |
| Asus V16 V3607V | |
| Genomsnitt Intel Core 7 240H (n=1) | |
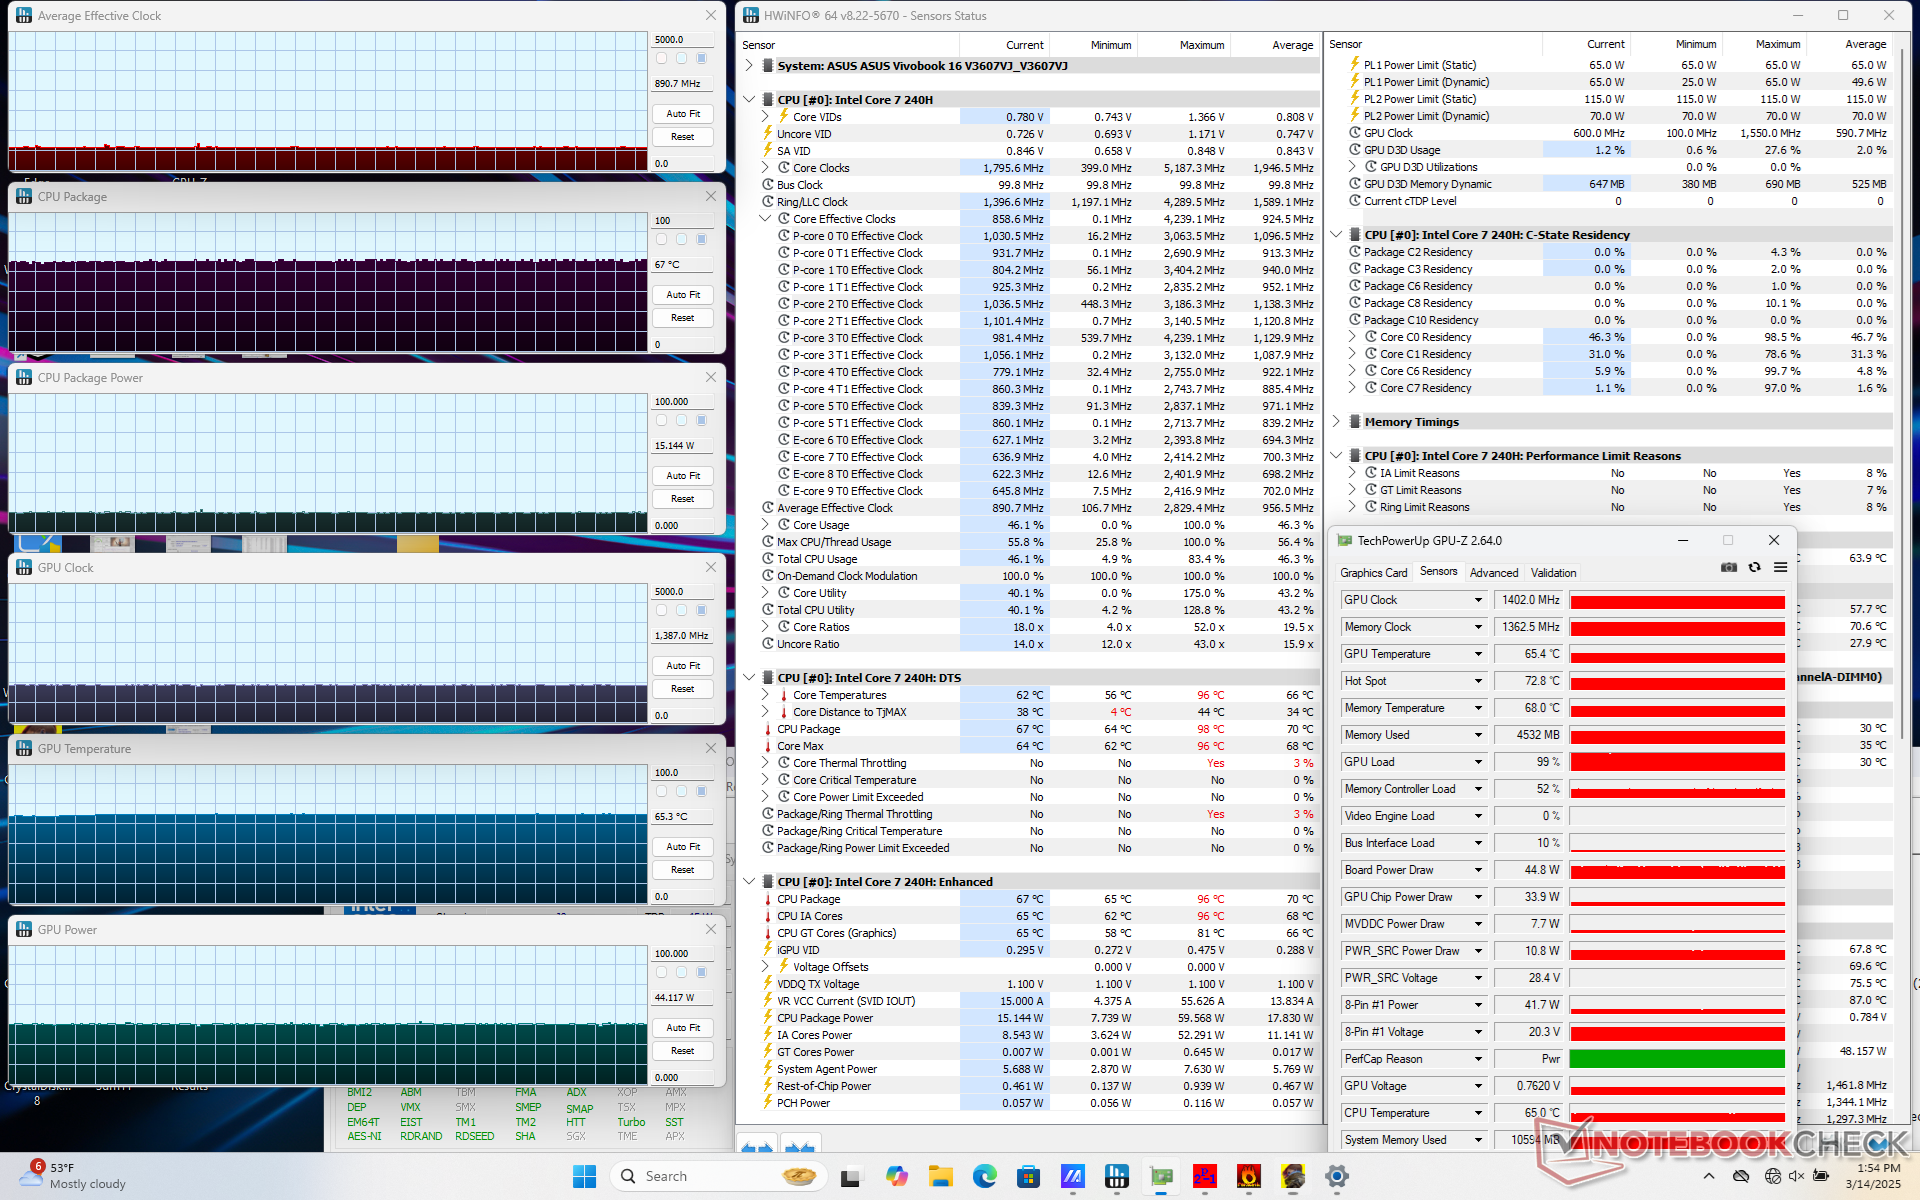
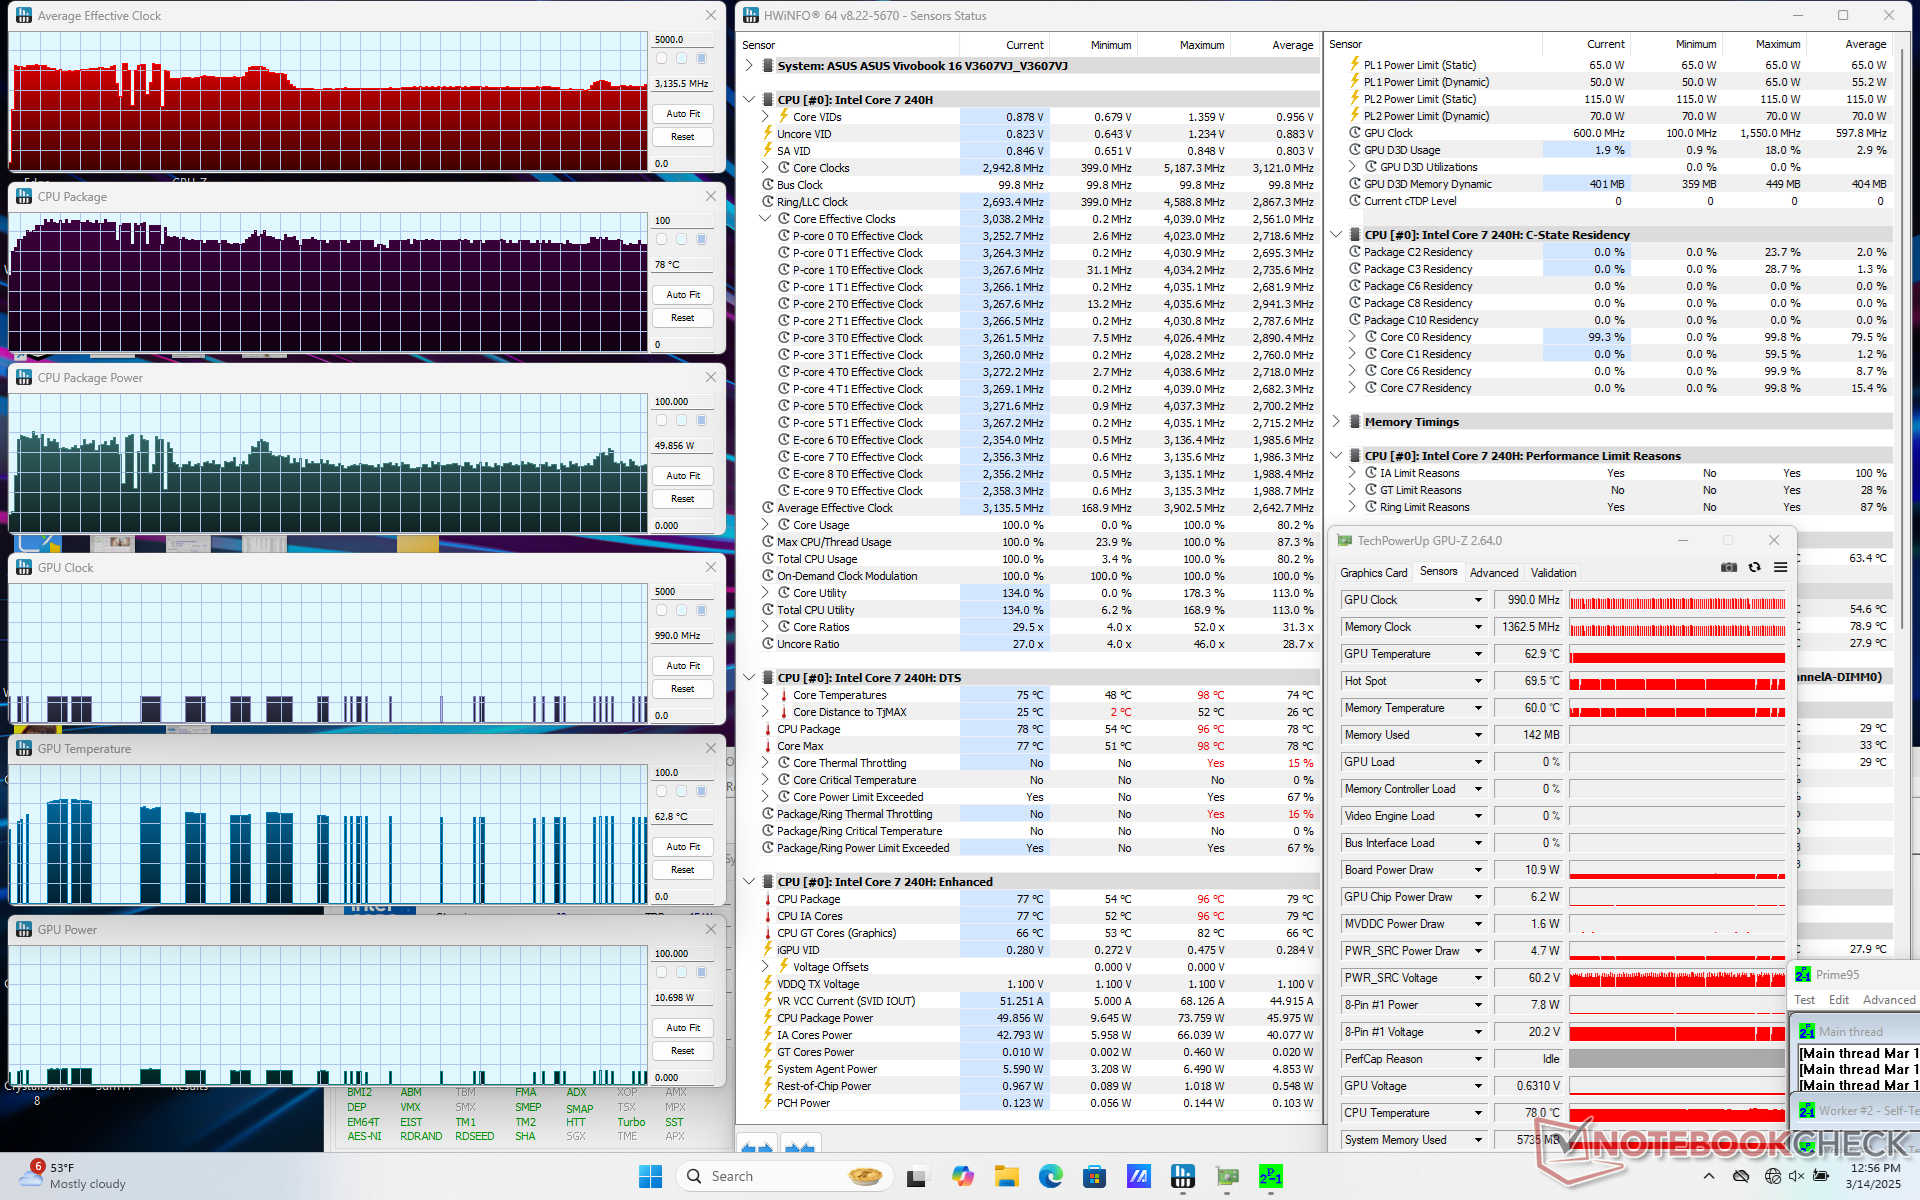
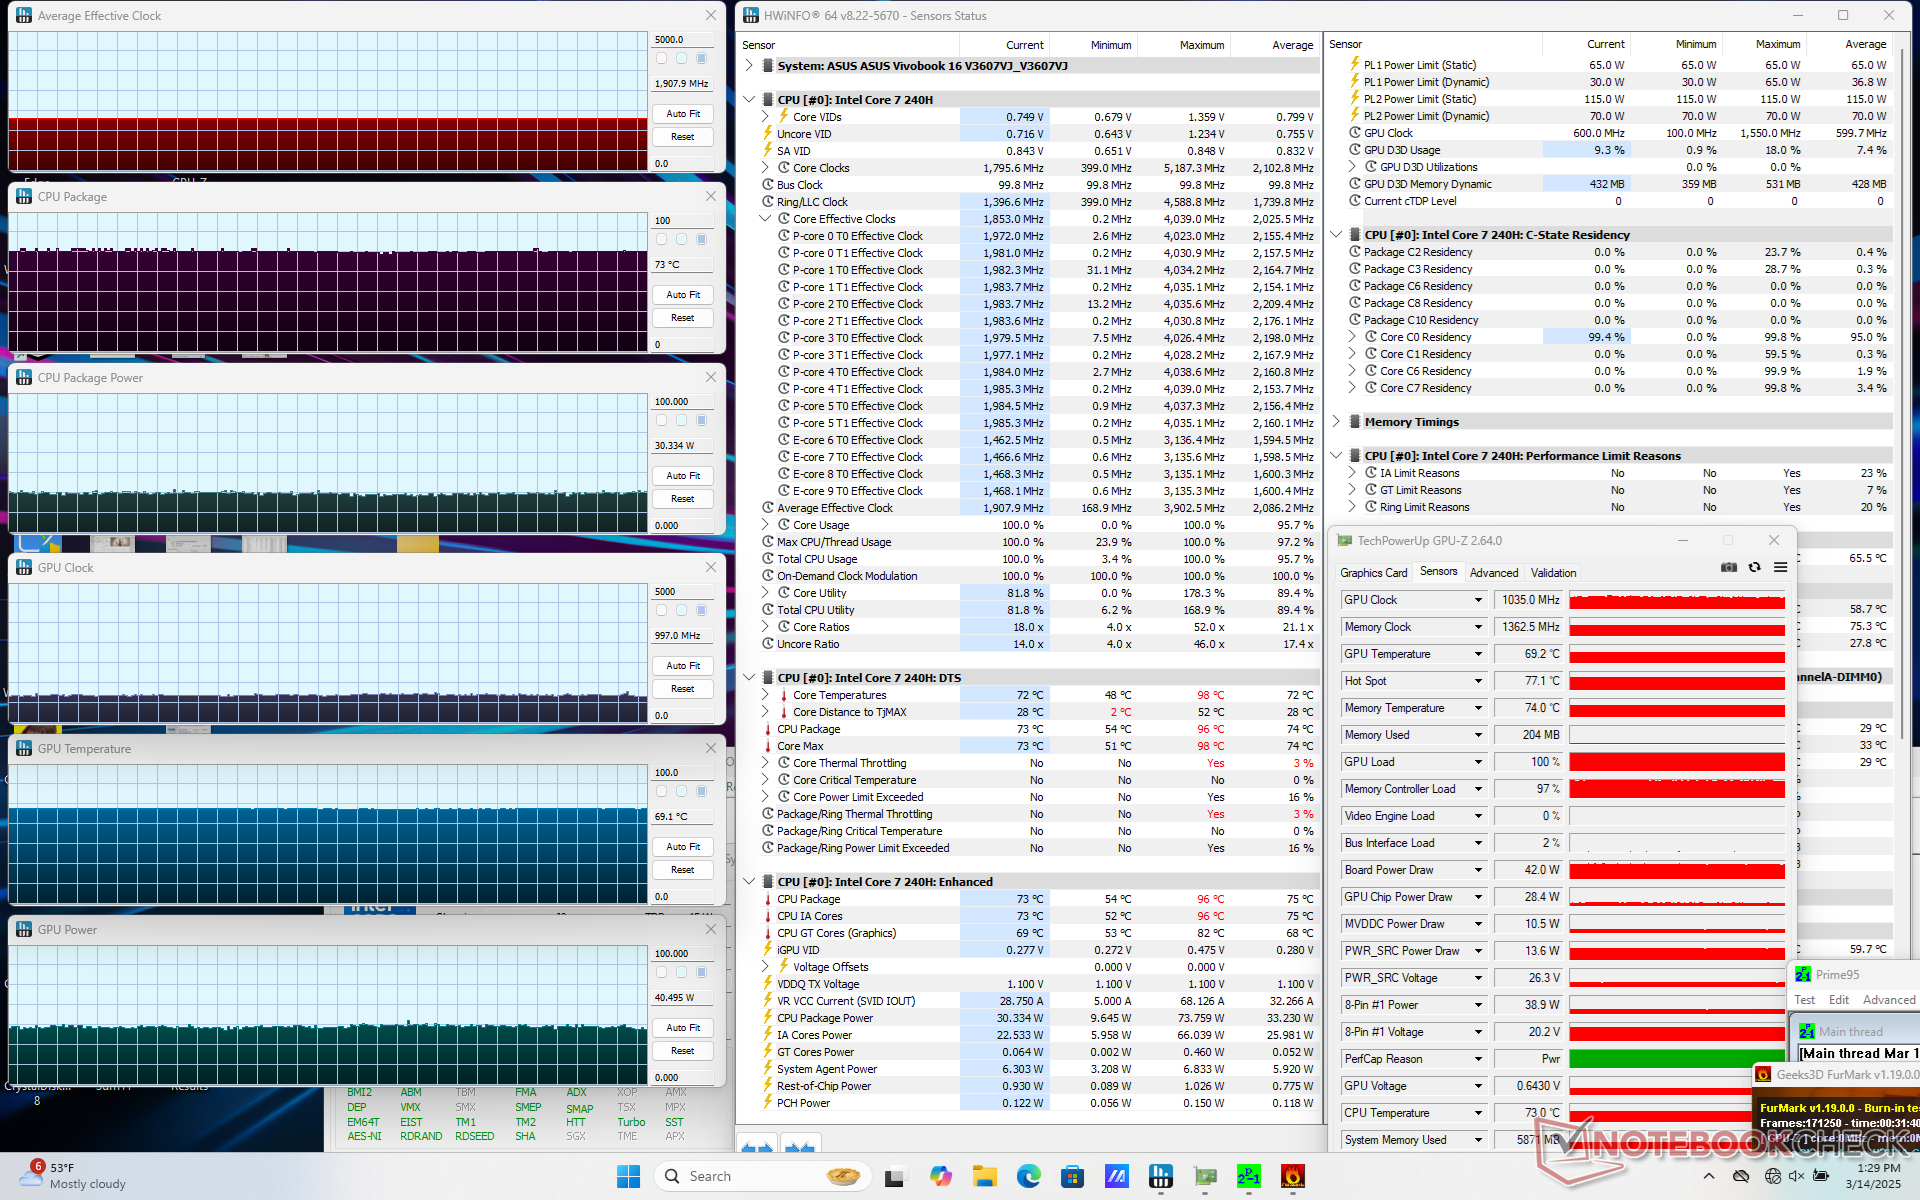
Stresstest
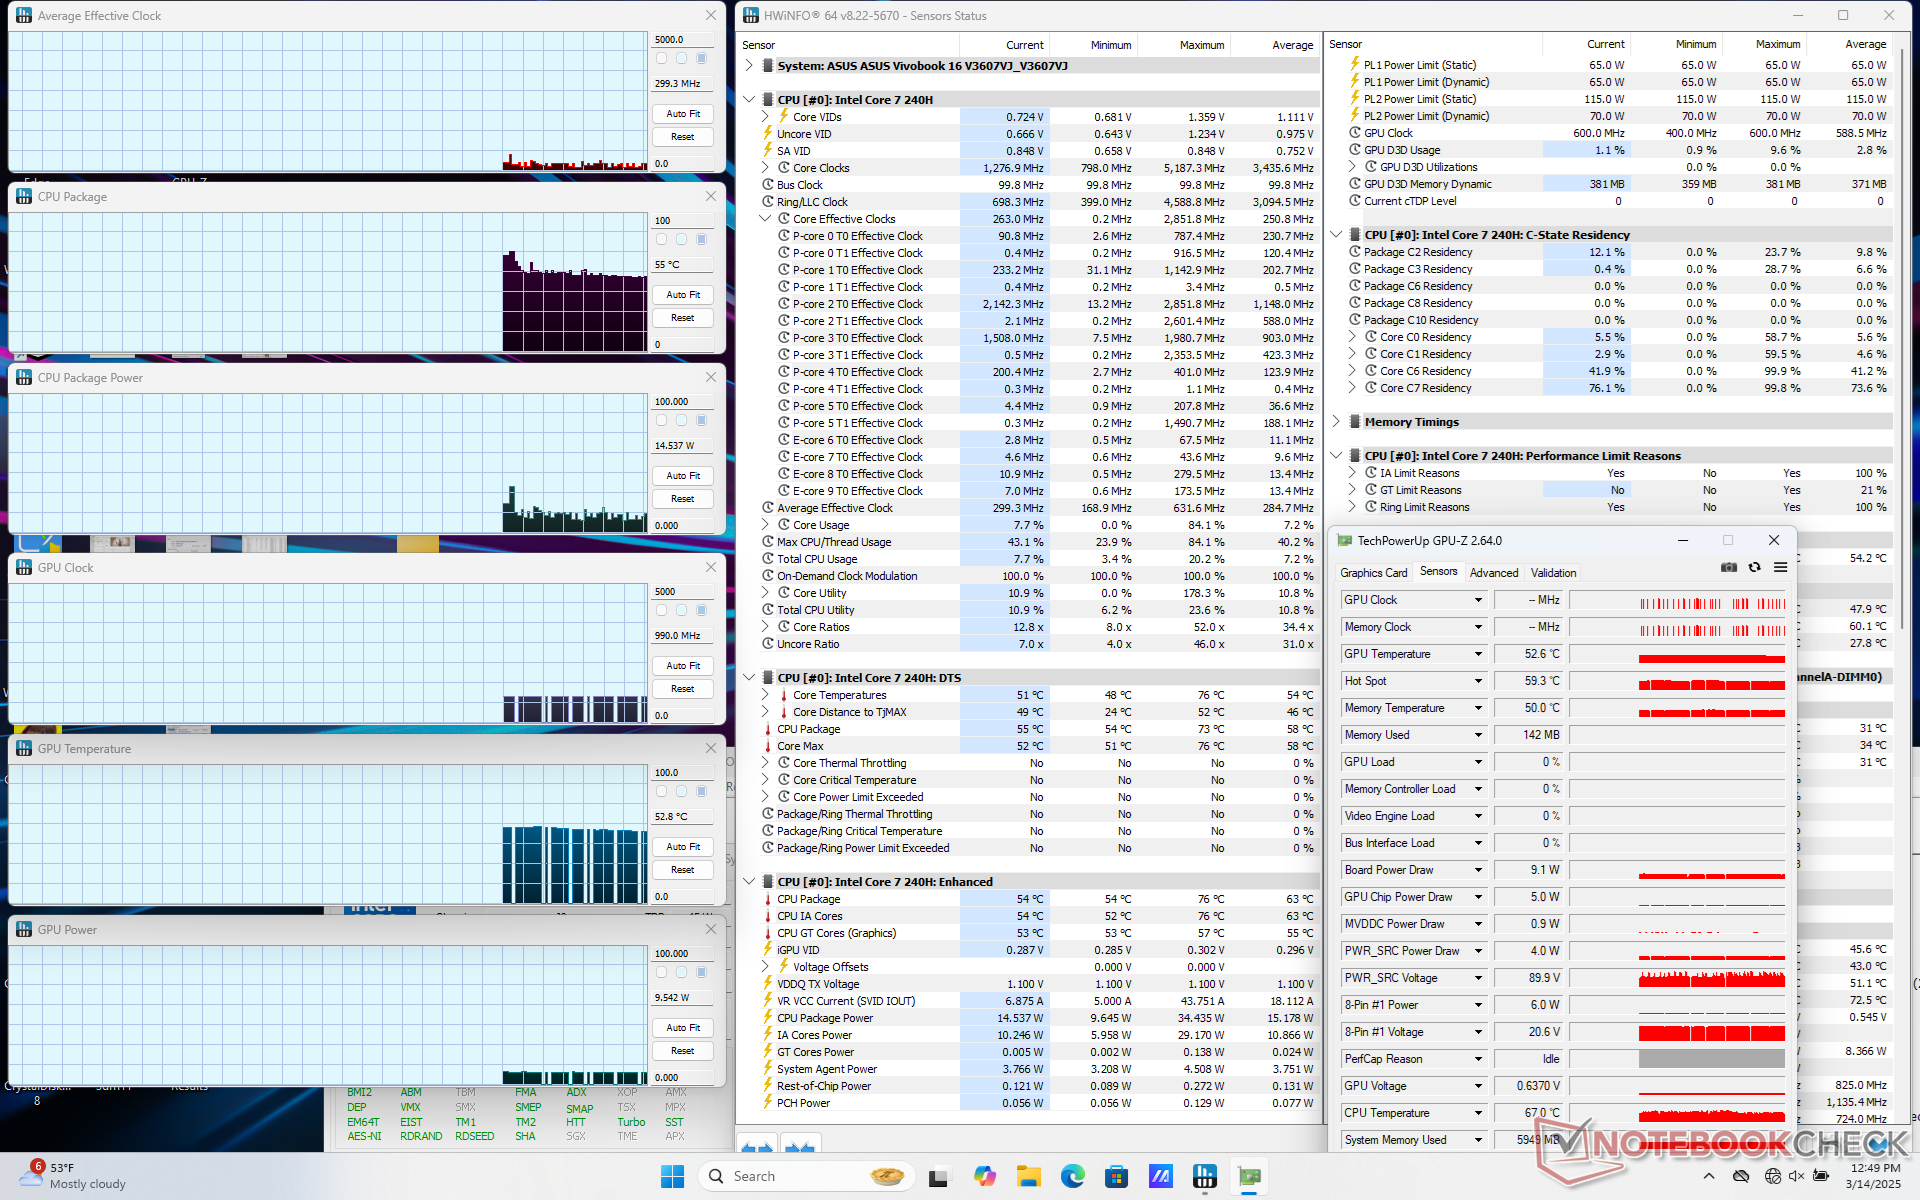
Processorn ökade till 3,9 GHz och 71 W i bara någon minut tills den nådde en kärntemperatur på 94 C. Den minskade sedan till så lågt som 2,4 GHz och 33 W innan den studsade tillbaka till ~ 3,1 GHz och 50 W.
Spelprestanda skulle också sjunka något om man körde i balanserat/standardläge istället för prestandaläge. Ett "Full-speed"-läge finns också tillgängligt på MyAsus, men det ger inga prestandafördelar jämfört med Performance-läget i våra tester.
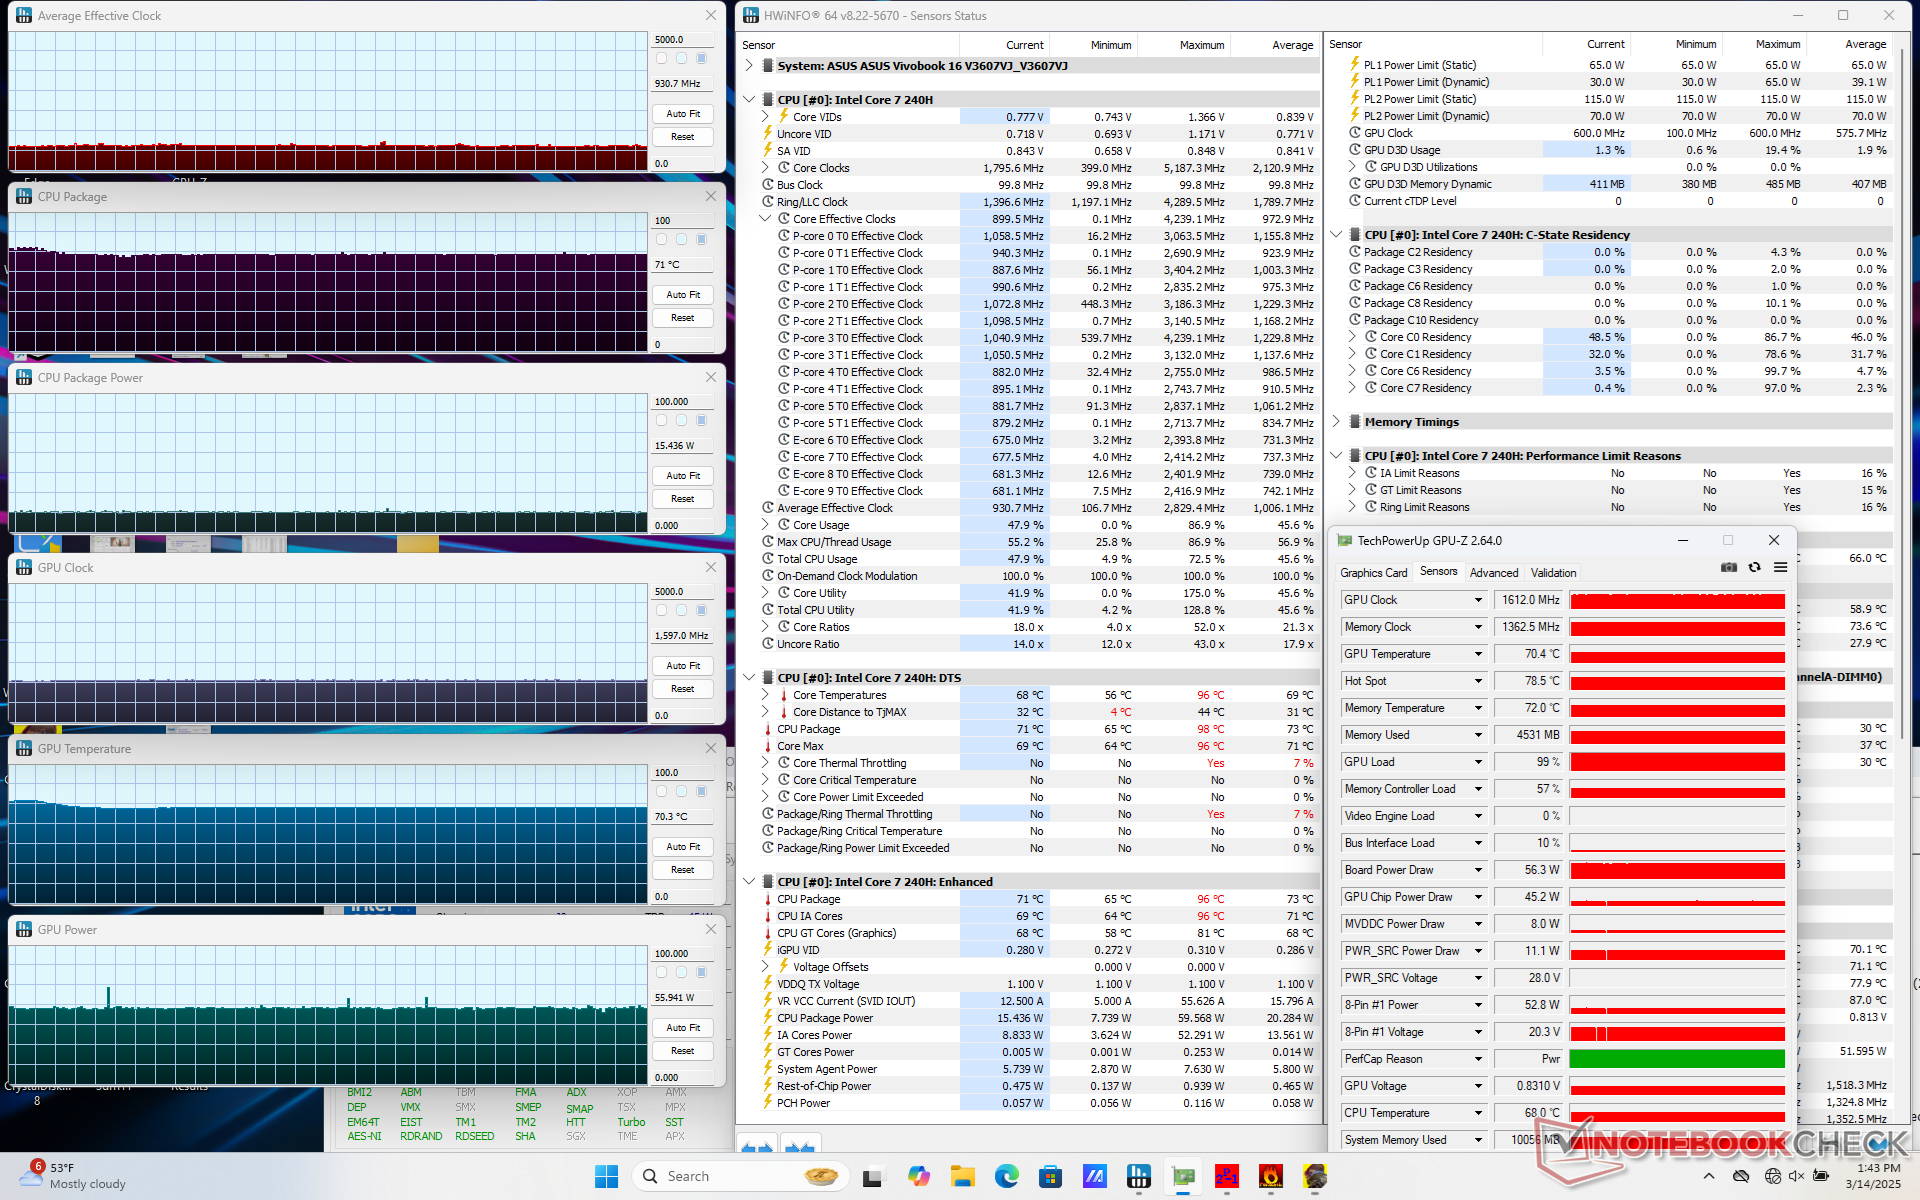
| Genomsnittlig CPU-klocka (GHz) | GPU-klocka (MHz) | Genomsnittlig CPU-temperatur (°C) | Genomsnittlig GPU-temperatur (°C) | |
| System i viloläge | -- | -- | 55 | 53 |
| Prime95 Stress | 3.1 | -- | 78 | 63 |
| Prime95 + FurMark Stress | 1.9 | 1035 | 73 | 69 |
| Cyberpunk 2077 Stress (Performance mode) | 0,9 | 1612 | 71 | 70 |
| Cyberpunk 2077 Stress (Balanserat läge) | 0,9 | 1402 | 67 | 65 |
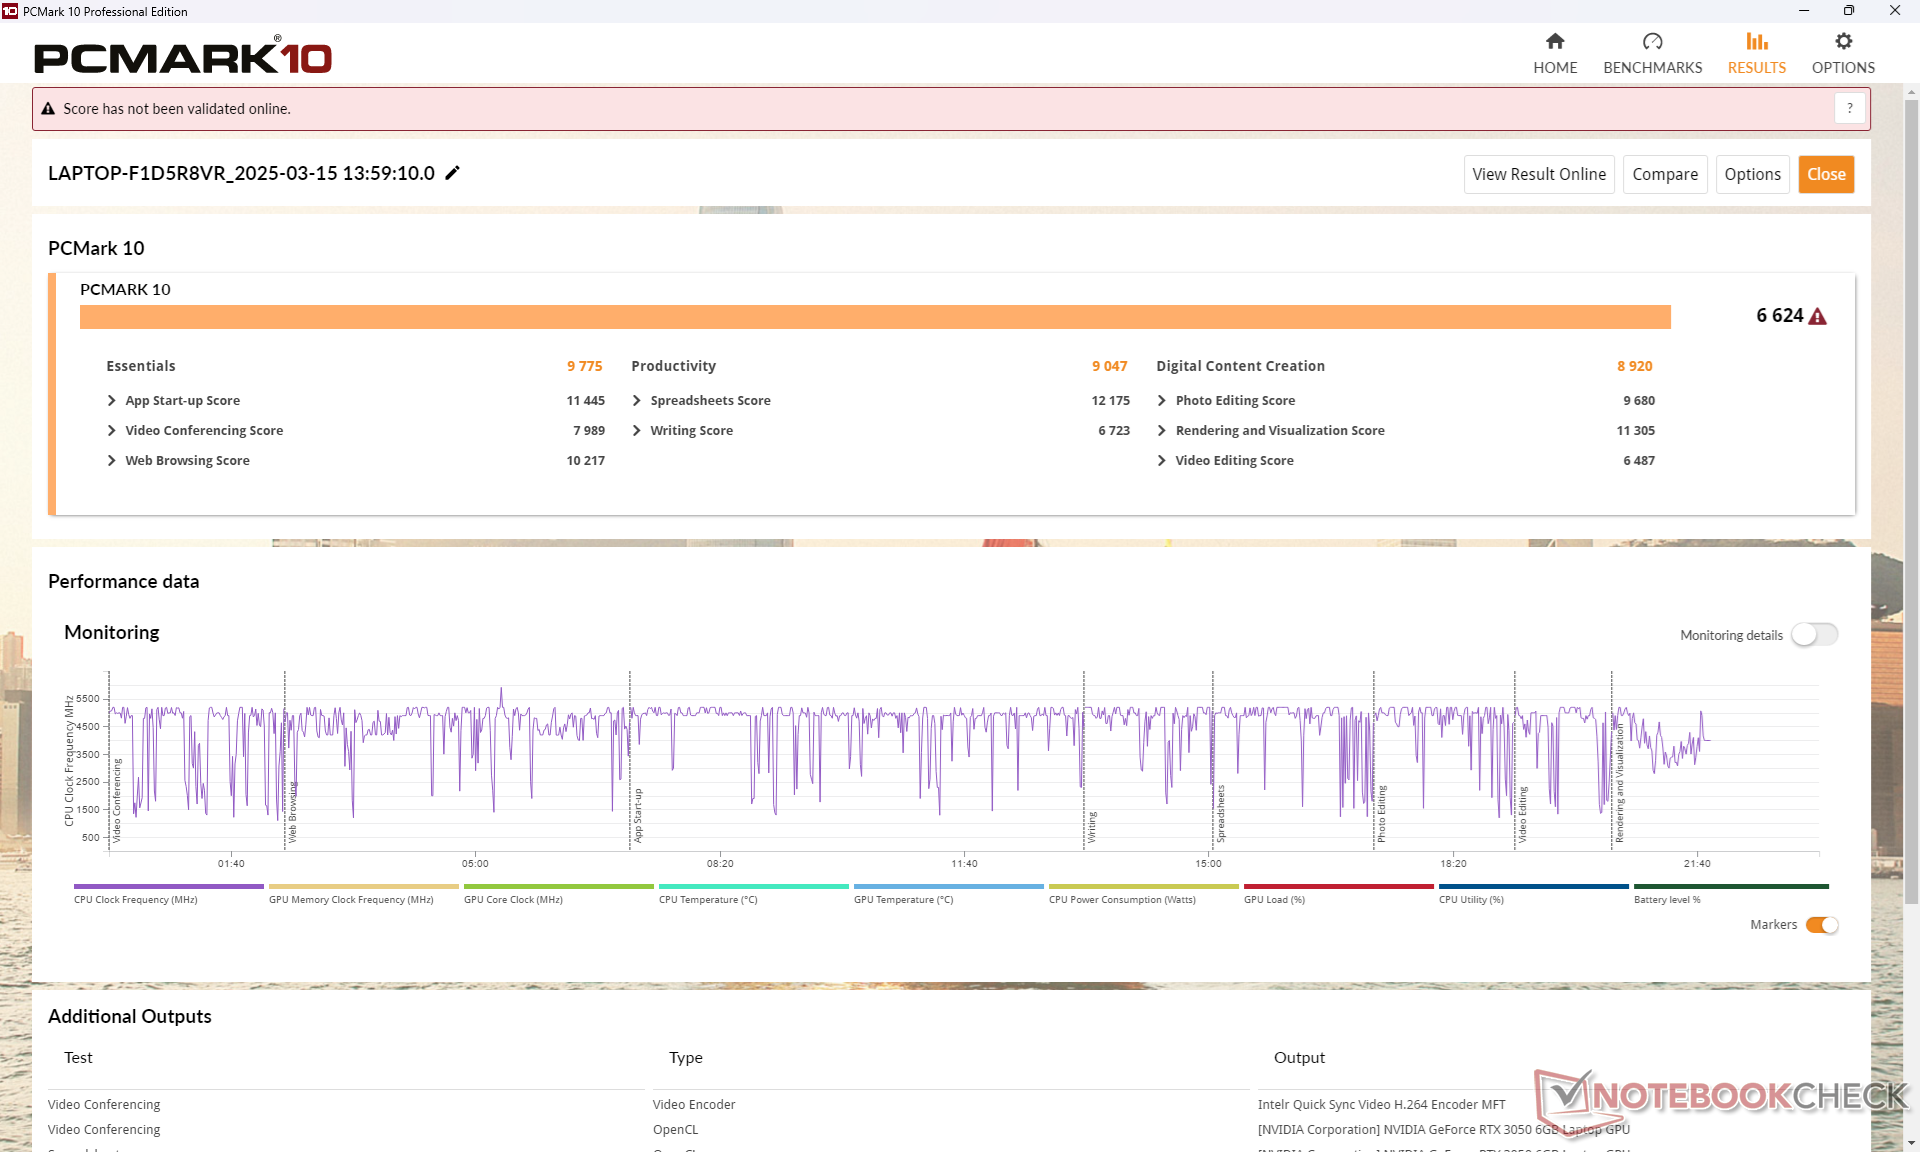
Systemets prestanda
CrossMark: Overall | Productivity | Creativity | Responsiveness
WebXPRT 3: Overall
WebXPRT 4: Overall
Mozilla Kraken 1.1: Total
| PCMark 10 / Score | |
| Asus VivoBook Pro 16 K6602VU | |
| Dell Inspiron 16 Plus 7640 | |
| Asus V16 V3607V | |
| Genomsnitt Intel Core 7 240H, NVIDIA GeForce RTX 3050 6GB Laptop GPU (n=1) | |
| HP Pavilion Plus 16-ab0456tx | |
| Acer Swift Edge 16 SFE16-44-R0XV | |
| Lenovo ThinkBook 16 G7 IML | |
| PCMark 10 / Essentials | |
| Dell Inspiron 16 Plus 7640 | |
| Asus VivoBook Pro 16 K6602VU | |
| Acer Swift Edge 16 SFE16-44-R0XV | |
| HP Pavilion Plus 16-ab0456tx | |
| Lenovo ThinkBook 16 G7 IML | |
| Asus V16 V3607V | |
| Genomsnitt Intel Core 7 240H, NVIDIA GeForce RTX 3050 6GB Laptop GPU (n=1) | |
| PCMark 10 / Productivity | |
| Acer Swift Edge 16 SFE16-44-R0XV | |
| Asus V16 V3607V | |
| Genomsnitt Intel Core 7 240H, NVIDIA GeForce RTX 3050 6GB Laptop GPU (n=1) | |
| HP Pavilion Plus 16-ab0456tx | |
| Asus VivoBook Pro 16 K6602VU | |
| Dell Inspiron 16 Plus 7640 | |
| Lenovo ThinkBook 16 G7 IML | |
| PCMark 10 / Digital Content Creation | |
| Dell Inspiron 16 Plus 7640 | |
| Asus VivoBook Pro 16 K6602VU | |
| Asus V16 V3607V | |
| Genomsnitt Intel Core 7 240H, NVIDIA GeForce RTX 3050 6GB Laptop GPU (n=1) | |
| HP Pavilion Plus 16-ab0456tx | |
| Acer Swift Edge 16 SFE16-44-R0XV | |
| Lenovo ThinkBook 16 G7 IML | |
| CrossMark / Overall | |
| Asus V16 V3607V | |
| Genomsnitt Intel Core 7 240H, NVIDIA GeForce RTX 3050 6GB Laptop GPU (n=1) | |
| HP Pavilion Plus 16-ab0456tx | |
| Asus VivoBook Pro 16 K6602VU | |
| Dell Inspiron 16 Plus 7640 | |
| Lenovo ThinkBook 16 G7 IML | |
| CrossMark / Productivity | |
| Asus V16 V3607V | |
| Genomsnitt Intel Core 7 240H, NVIDIA GeForce RTX 3050 6GB Laptop GPU (n=1) | |
| Asus VivoBook Pro 16 K6602VU | |
| HP Pavilion Plus 16-ab0456tx | |
| Dell Inspiron 16 Plus 7640 | |
| Lenovo ThinkBook 16 G7 IML | |
| CrossMark / Creativity | |
| HP Pavilion Plus 16-ab0456tx | |
| Asus V16 V3607V | |
| Genomsnitt Intel Core 7 240H, NVIDIA GeForce RTX 3050 6GB Laptop GPU (n=1) | |
| Dell Inspiron 16 Plus 7640 | |
| Asus VivoBook Pro 16 K6602VU | |
| Lenovo ThinkBook 16 G7 IML | |
| CrossMark / Responsiveness | |
| Asus V16 V3607V | |
| Genomsnitt Intel Core 7 240H, NVIDIA GeForce RTX 3050 6GB Laptop GPU (n=1) | |
| Asus VivoBook Pro 16 K6602VU | |
| HP Pavilion Plus 16-ab0456tx | |
| Dell Inspiron 16 Plus 7640 | |
| Lenovo ThinkBook 16 G7 IML | |
| WebXPRT 3 / Overall | |
| Dell Inspiron 16 Plus 7640 | |
| HP Pavilion Plus 16-ab0456tx | |
| Acer Swift Edge 16 SFE16-44-R0XV | |
| Acer Swift Edge 16 SFE16-44-R0XV | |
| Lenovo ThinkBook 16 G7 IML | |
| WebXPRT 4 / Overall | |
| Asus V16 V3607V | |
| Genomsnitt Intel Core 7 240H, NVIDIA GeForce RTX 3050 6GB Laptop GPU (n=1) | |
| HP Pavilion Plus 16-ab0456tx | |
| Dell Inspiron 16 Plus 7640 | |
| Acer Swift Edge 16 SFE16-44-R0XV | |
| Asus VivoBook Pro 16 K6602VU | |
| Lenovo ThinkBook 16 G7 IML | |
| Mozilla Kraken 1.1 / Total | |
| Lenovo ThinkBook 16 G7 IML | |
| Acer Swift Edge 16 SFE16-44-R0XV | |
| Acer Swift Edge 16 SFE16-44-R0XV | |
| Asus VivoBook Pro 16 K6602VU | |
| Dell Inspiron 16 Plus 7640 | |
| Asus V16 V3607V | |
| Genomsnitt Intel Core 7 240H, NVIDIA GeForce RTX 3050 6GB Laptop GPU (n=1) | |
| HP Pavilion Plus 16-ab0456tx | |
* ... mindre är bättre
| PCMark 10 Score | 6624 poäng | |
Hjälp | ||
| AIDA64 / Memory Copy | |
| Acer Swift Edge 16 SFE16-44-R0XV | |
| HP Pavilion Plus 16-ab0456tx | |
| Dell Inspiron 16 Plus 7640 | |
| Asus VivoBook Pro 16 K6602VU | |
| Lenovo ThinkBook 16 G7 IML | |
| Asus V16 V3607V | |
| Genomsnitt Intel Core 7 240H (n=1) | |
| AIDA64 / Memory Read | |
| Dell Inspiron 16 Plus 7640 | |
| Asus VivoBook Pro 16 K6602VU | |
| HP Pavilion Plus 16-ab0456tx | |
| Acer Swift Edge 16 SFE16-44-R0XV | |
| Asus V16 V3607V | |
| Genomsnitt Intel Core 7 240H (n=1) | |
| Lenovo ThinkBook 16 G7 IML | |
| AIDA64 / Memory Write | |
| Acer Swift Edge 16 SFE16-44-R0XV | |
| HP Pavilion Plus 16-ab0456tx | |
| Dell Inspiron 16 Plus 7640 | |
| Asus VivoBook Pro 16 K6602VU | |
| Lenovo ThinkBook 16 G7 IML | |
| Asus V16 V3607V | |
| Genomsnitt Intel Core 7 240H (n=1) | |
| AIDA64 / Memory Latency | |
| Lenovo ThinkBook 16 G7 IML | |
| Dell Inspiron 16 Plus 7640 | |
| Acer Swift Edge 16 SFE16-44-R0XV | |
| Asus V16 V3607V | |
| Genomsnitt Intel Core 7 240H (n=1) | |
| Asus VivoBook Pro 16 K6602VU | |
| HP Pavilion Plus 16-ab0456tx | |
* ... mindre är bättre
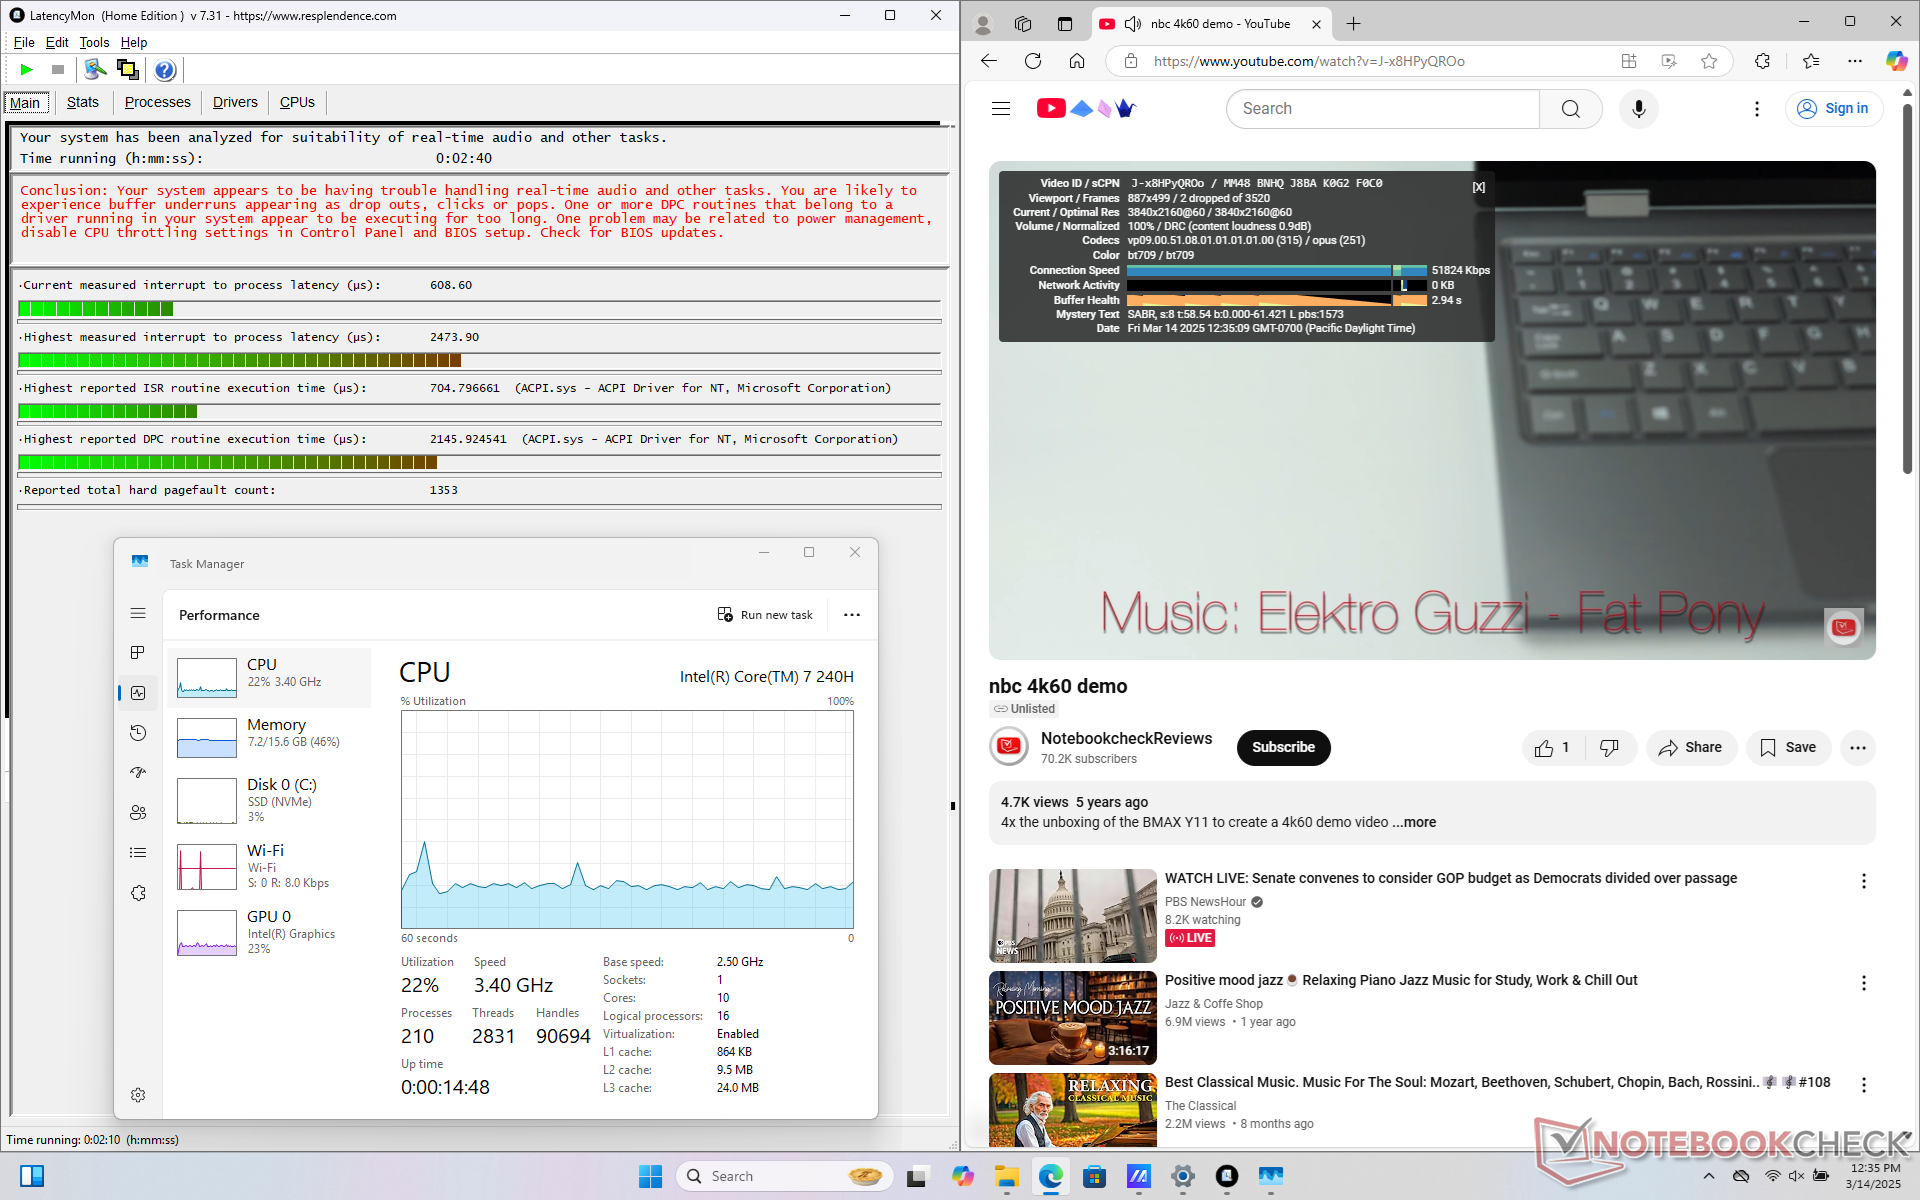
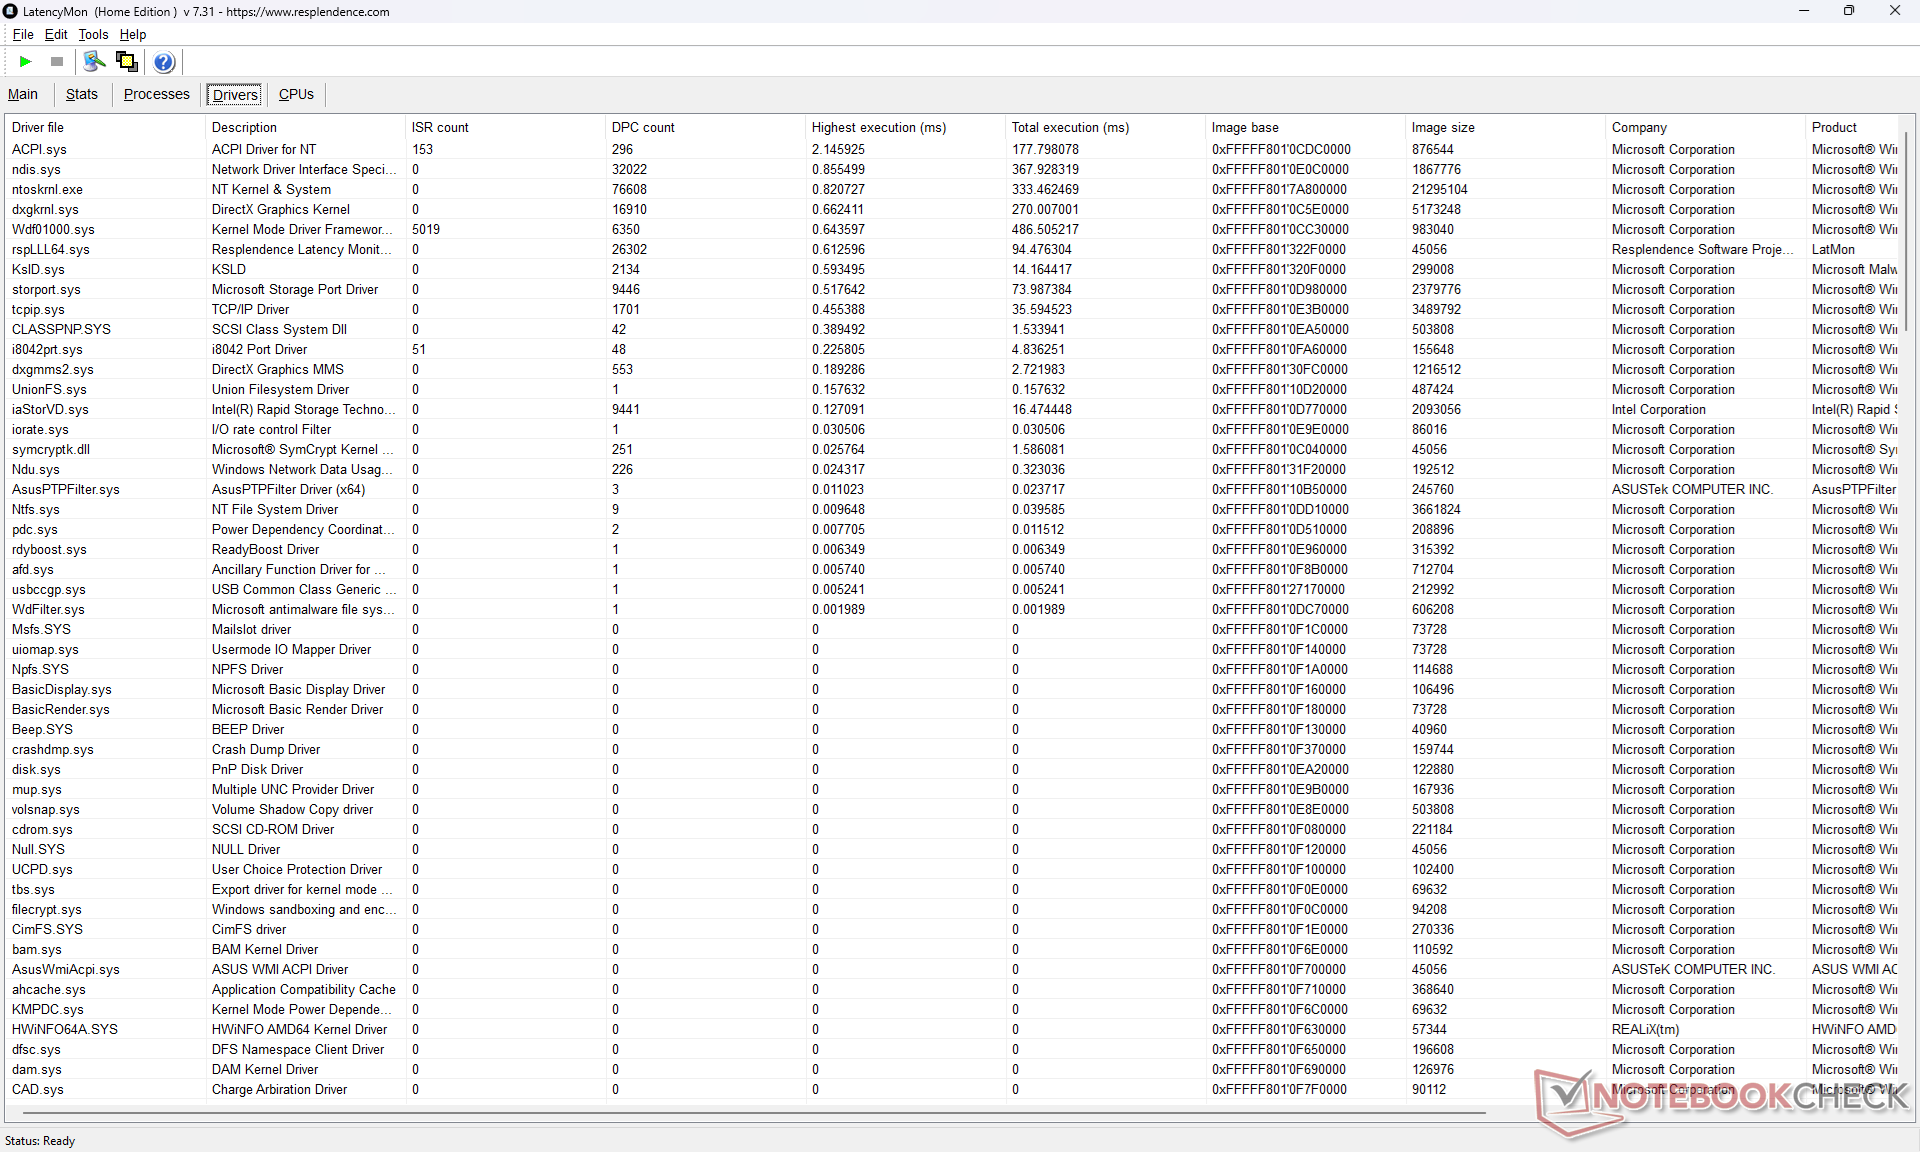
DPC-fördröjning
LatencyMon visar DPC-problem när du öppnar flera flikar på vår hemsida och endast ett par tappade bildrutor under vårt 4K60-videouppspelningstest.
| DPC Latencies / LatencyMon - interrupt to process latency (max), Web, Youtube, Prime95 | |
| Acer Swift Edge 16 SFE16-44-R0XV | |
| HP Pavilion Plus 16-ab0456tx | |
| Asus V16 V3607V | |
| Asus VivoBook Pro 16 K6602VU | |
| Lenovo ThinkBook 16 G7 IML | |
| Dell Inspiron 16 Plus 7640 | |
* ... mindre är bättre
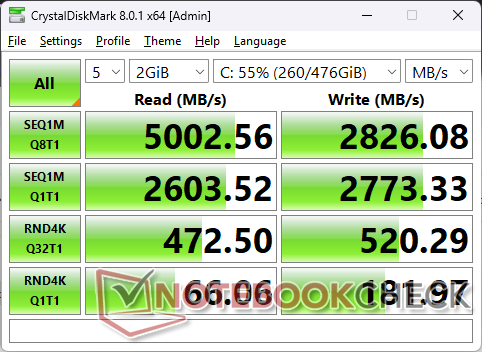
Lagringsenheter
Samsung MZVL8512HELU PCIe4 SSD på 512 GB når en maxhastighet på strax under 5000 MB/s. Prestanda skulle dock strypas efter några minuters användning, vilket visas av vår graf nedan.


| Drive Performance Rating - Percent | |
| Acer Swift Edge 16 SFE16-44-R0XV | |
| HP Pavilion Plus 16-ab0456tx | |
| Asus V16 V3607V | |
| Asus VivoBook Pro 16 K6602VU | |
| Dell Inspiron 16 Plus 7640 | |
| Lenovo ThinkBook 16 G7 IML | |
* ... mindre är bättre
Disk Throttling: DiskSpd Read Loop, Queue Depth 8
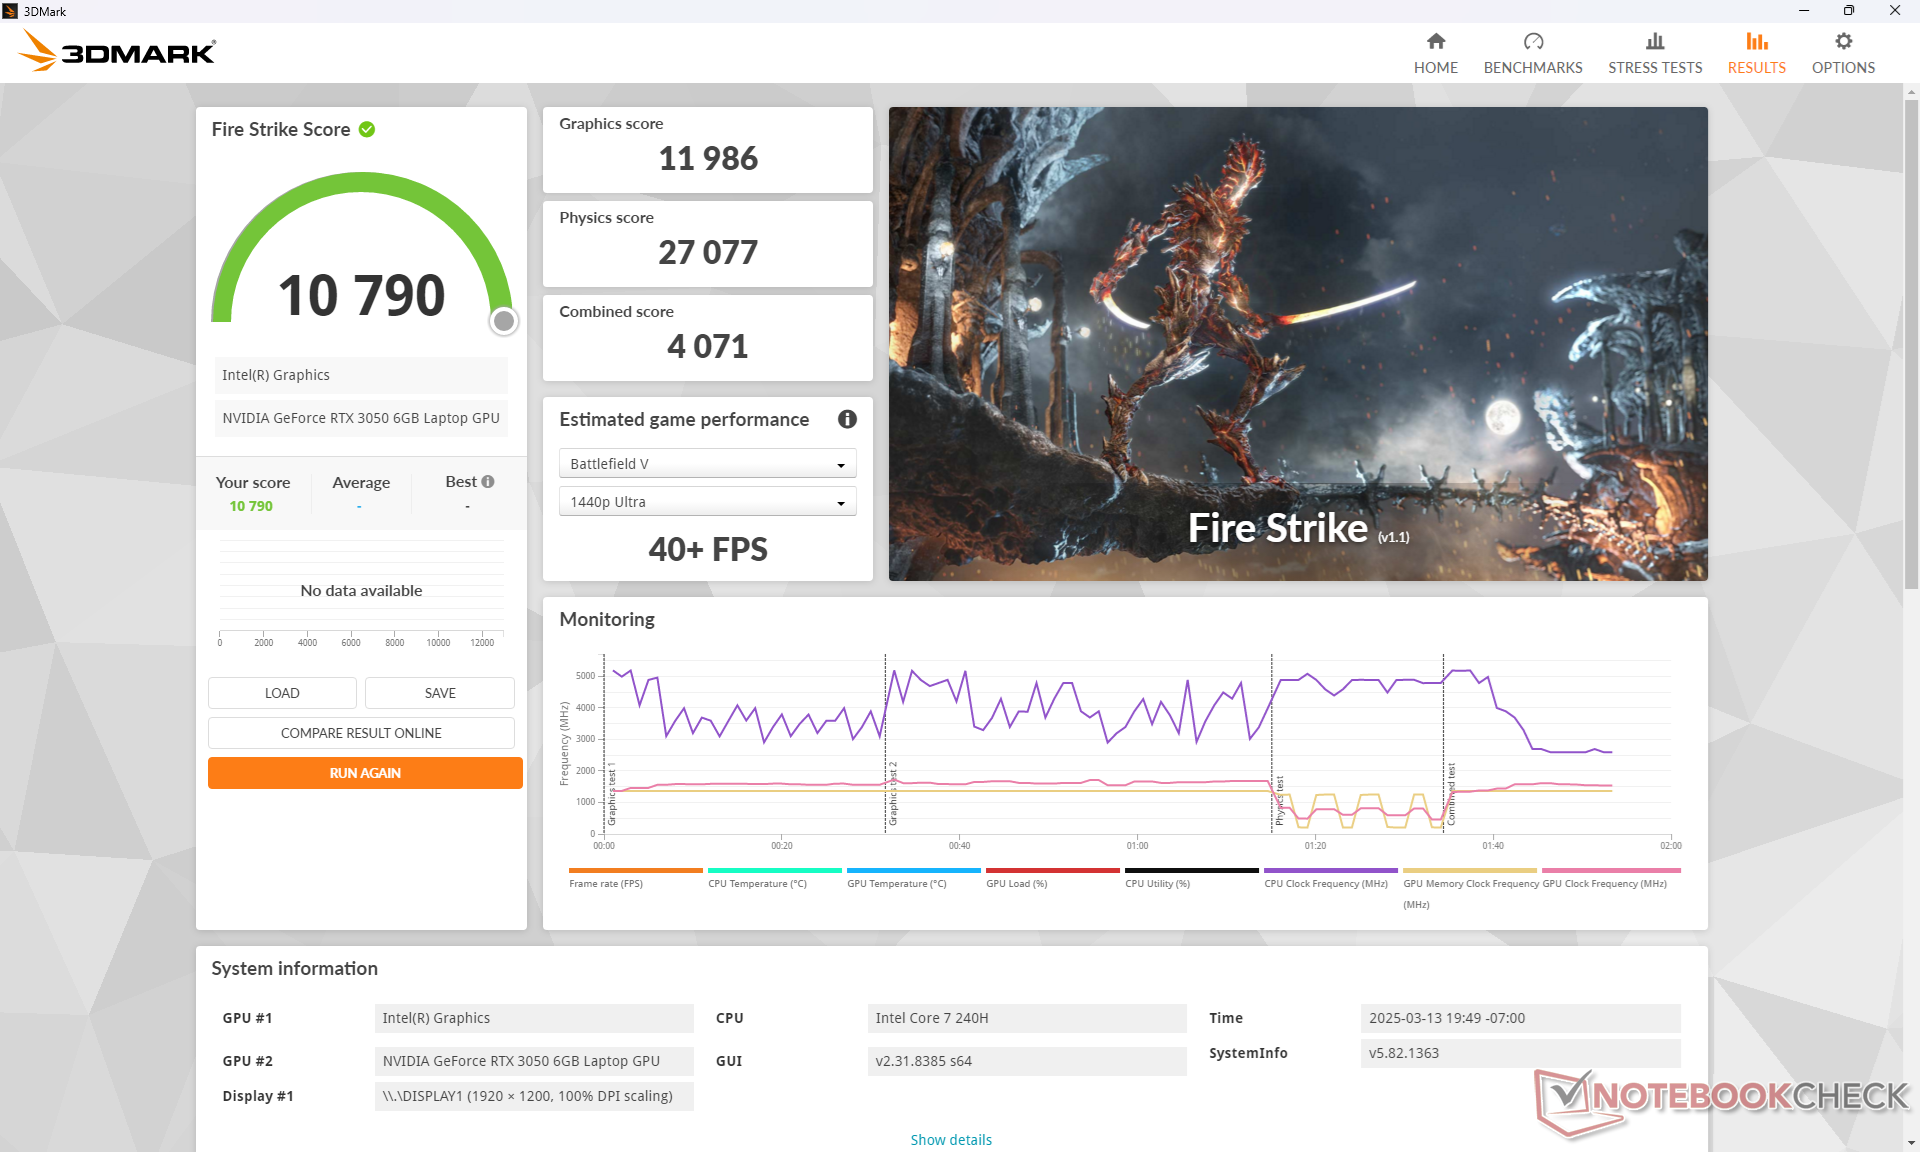
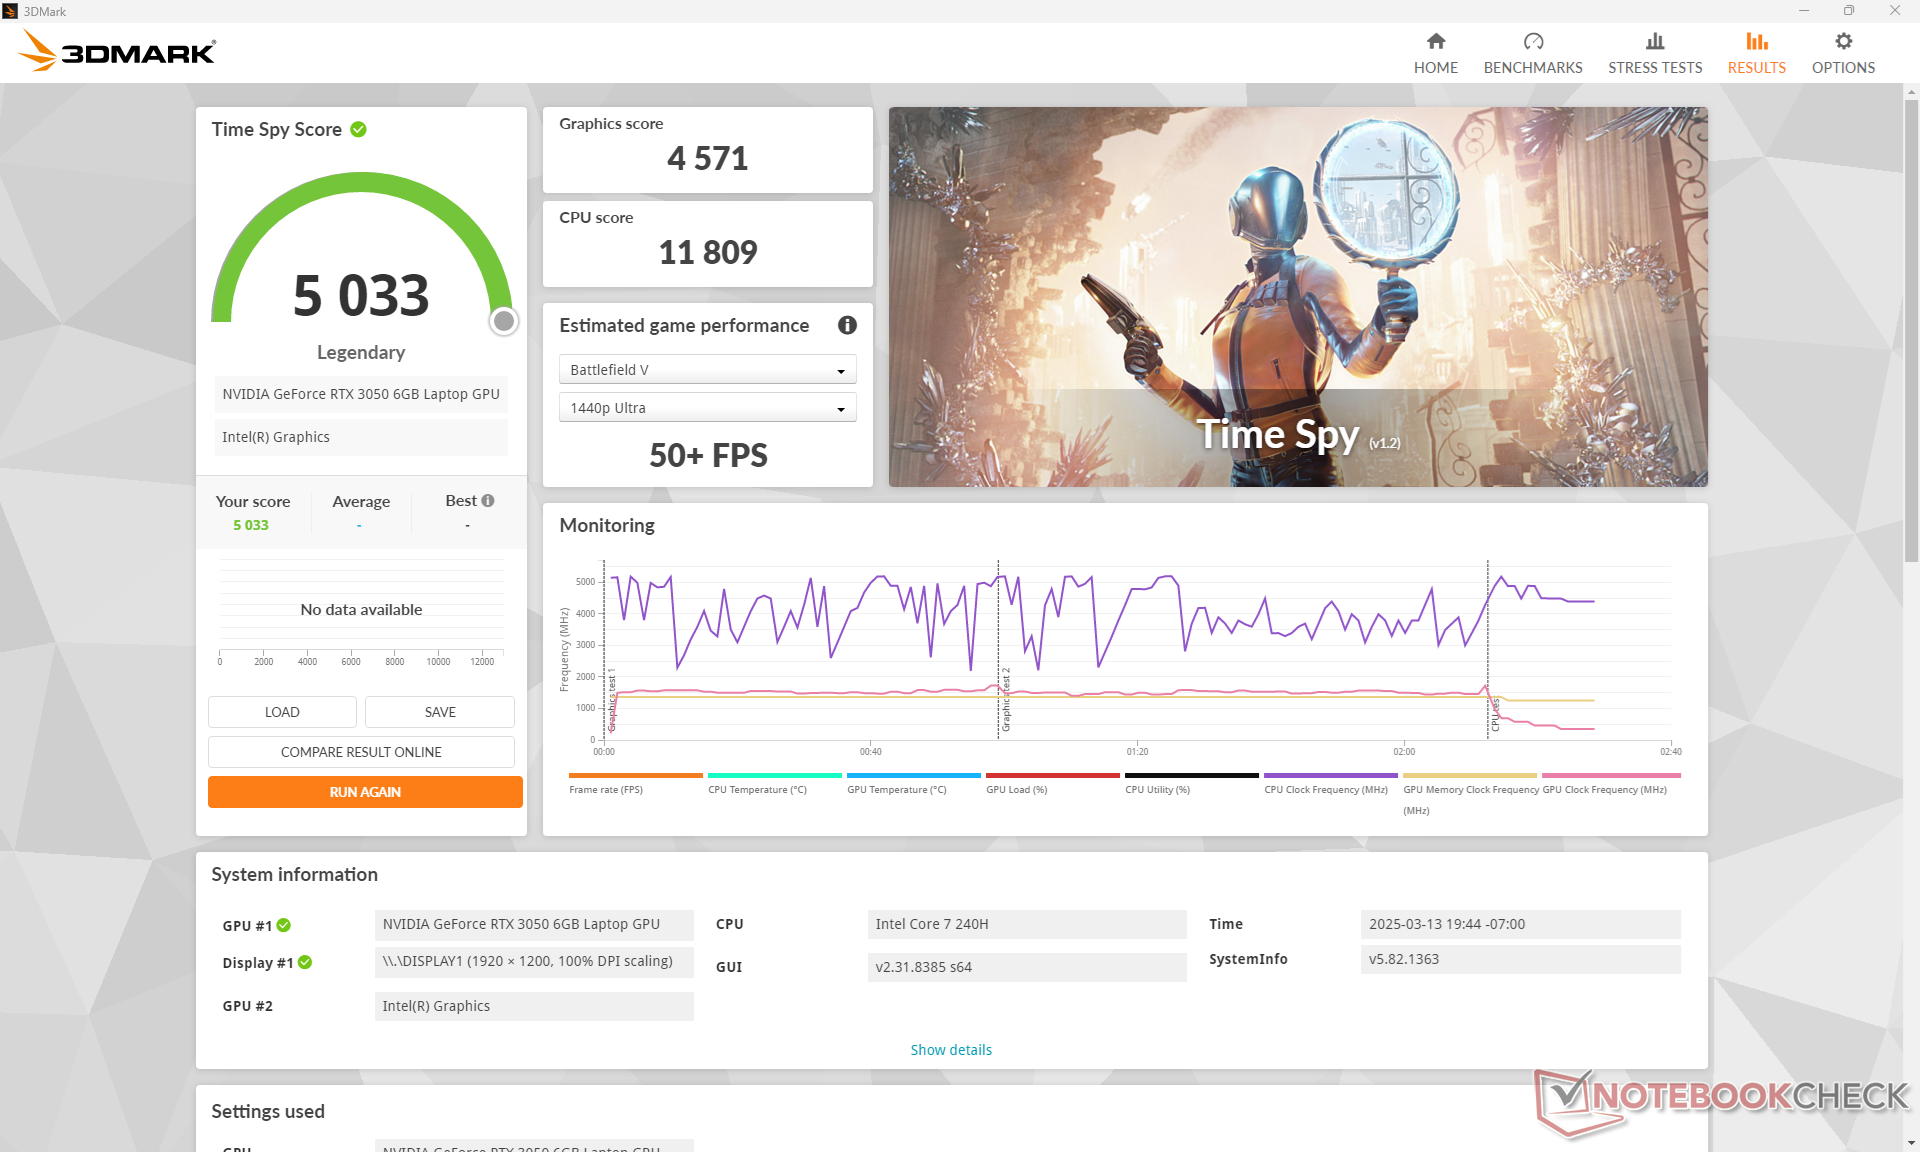
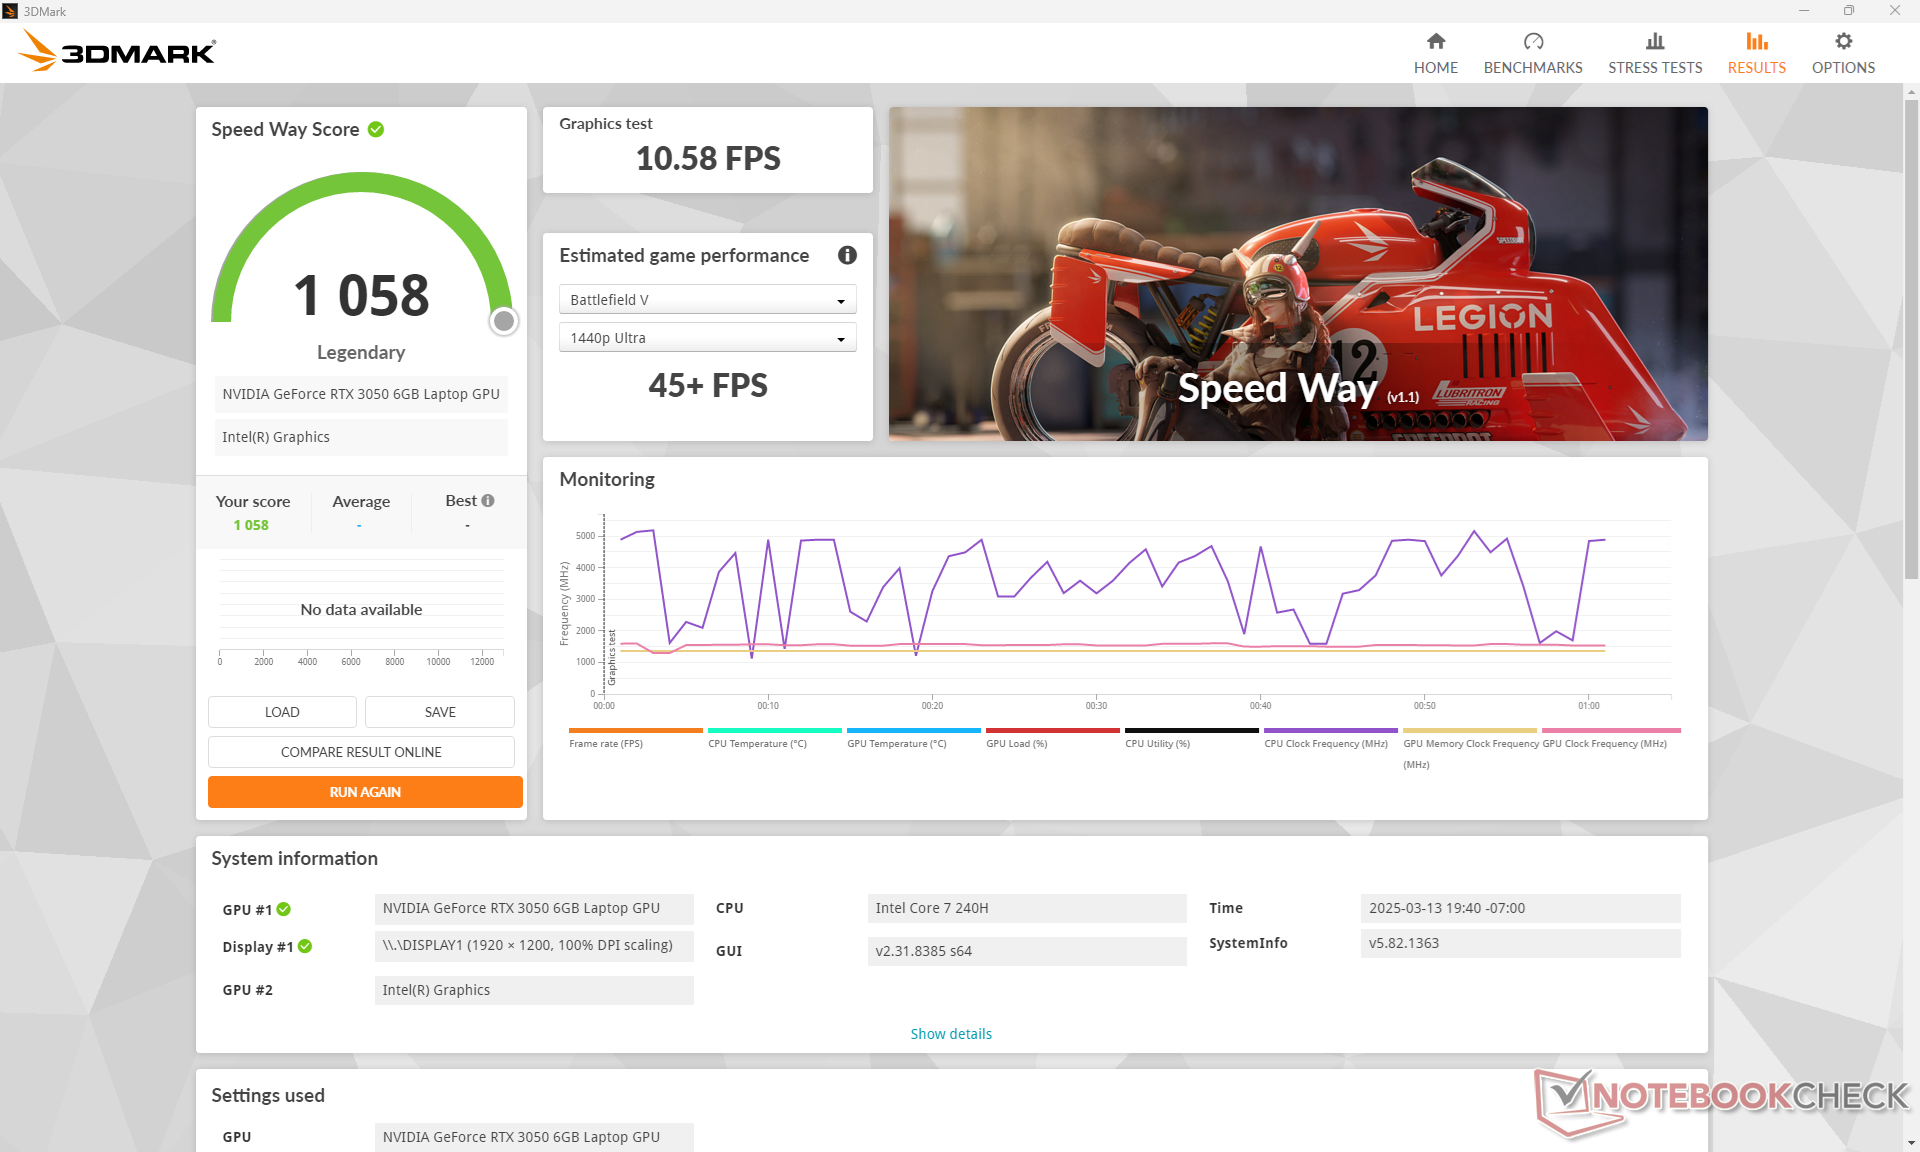
GPU-prestanda
Den nya GeForce RTX 3050 är cirka 20 till 25 procent snabbare än RTX 2050 eller 30 till 35 procent långsammare än RTX 4050. Observera att Asus levereras med den bättre 6 GB-versionen av RTX 3050 istället för 4 GB-versionen.
| Kraftprofil | Grafikpoäng | Fysikpoäng | Kombinerad poäng |
| Prestanda-läge | 11986 | 27077 | 4071 |
| Balanserat läge | 11317 (-6%) | 28246 (-0%) | 3842 (-6%) |
| Batterikraft | 9900 (-17%) | 20557 (-24%) | 3573 (-12%) |
Att köra i balanserat läge påverkar grafikprestandan något medan batteriläget skulle minska prestandan ytterligare, vilket framgår av vår Fire Strike resultattabell ovan.
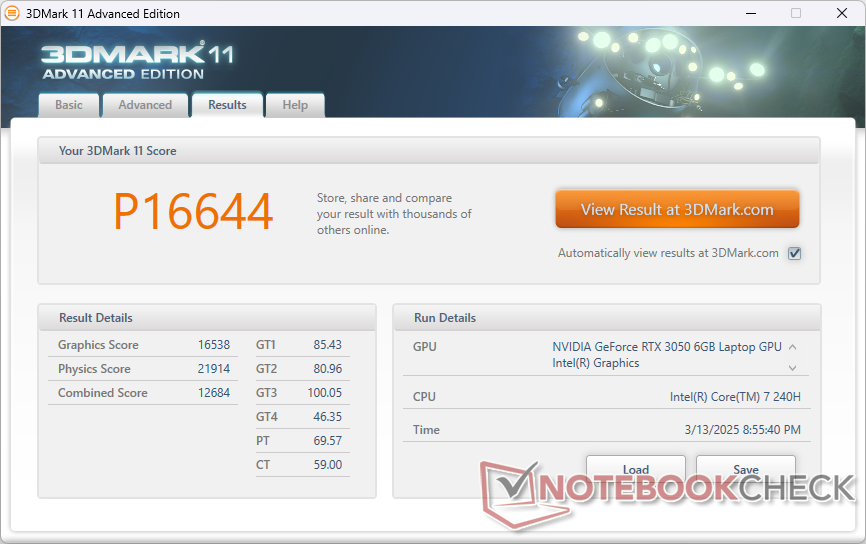
| 3DMark 11 Performance | 16644 poäng | |
| 3DMark Fire Strike Score | 10790 poäng | |
| 3DMark Time Spy Score | 5033 poäng | |
Hjälp | ||
* ... mindre är bättre
Spelprestanda
RTX 3050 kanske börjar bli till åren, men den är fortfarande tillräckligt kraftfull för att köra krävande titlar som Cyberpunk 2077 i den inbyggda upplösningen på 1080p eller 1200p med de flesta inställningar på High.
| F1 22 | |
| 1280x720 Ultra Low Preset AA:T AF:16x | |
| Lenovo ThinkPad Z16 Gen 2 | |
| Asus V16 V3607V | |
| Genomsnitt NVIDIA GeForce RTX 3050 6GB Laptop GPU (198 - 236, n=3) | |
| HP Spectre x360 16 RTX 4050 | |
| 1920x1080 Low Preset AA:T AF:16x | |
| HP Spectre x360 16 RTX 4050 | |
| Asus V16 V3607V | |
| Genomsnitt NVIDIA GeForce RTX 3050 6GB Laptop GPU (110.9 - 163.5, n=4) | |
| Lenovo ThinkPad Z16 Gen 2 | |
| 1920x1080 Medium Preset AA:T AF:16x | |
| HP Spectre x360 16 RTX 4050 | |
| Asus V16 V3607V | |
| Genomsnitt NVIDIA GeForce RTX 3050 6GB Laptop GPU (106.1 - 151.5, n=4) | |
| Lenovo ThinkPad Z16 Gen 2 | |
| 1920x1080 High Preset AA:T AF:16x | |
| HP Spectre x360 16 RTX 4050 | |
| Asus V16 V3607V | |
| Genomsnitt NVIDIA GeForce RTX 3050 6GB Laptop GPU (85.5 - 109.7, n=4) | |
| Lenovo ThinkPad Z16 Gen 2 | |
| 1920x1080 Ultra High Preset AA:T AF:16x | |
| HP Spectre x360 16 RTX 4050 | |
| Genomsnitt NVIDIA GeForce RTX 3050 6GB Laptop GPU (30.7 - 34, n=4) | |
| Asus V16 V3607V | |
| Lenovo ThinkPad Z16 Gen 2 | |
| Tiny Tina's Wonderlands | |
| 1280x720 Lowest Preset (DX12) | |
| Lenovo ThinkPad Z16 Gen 2 | |
| Asus V16 V3607V | |
| Genomsnitt NVIDIA GeForce RTX 3050 6GB Laptop GPU (n=1) | |
| 1920x1080 Low Preset (DX12) | |
| HP Spectre x360 16 RTX 4050 | |
| Lenovo ThinkPad Z16 Gen 2 | |
| Genomsnitt NVIDIA GeForce RTX 3050 6GB Laptop GPU (105.6 - 113.3, n=2) | |
| Asus V16 V3607V | |
| 1920x1080 Medium Preset (DX12) | |
| HP Spectre x360 16 RTX 4050 | |
| Lenovo ThinkPad Z16 Gen 2 | |
| Genomsnitt NVIDIA GeForce RTX 3050 6GB Laptop GPU (84.7 - 89.7, n=2) | |
| Asus V16 V3607V | |
| 1920x1080 High Preset (DX12) | |
| HP Spectre x360 16 RTX 4050 | |
| Lenovo ThinkPad Z16 Gen 2 | |
| Genomsnitt NVIDIA GeForce RTX 3050 6GB Laptop GPU (55.9 - 59.2, n=2) | |
| Asus V16 V3607V | |
| 1920x1080 Badass Preset (DX12) | |
| HP Spectre x360 16 RTX 4050 | |
| Genomsnitt NVIDIA GeForce RTX 3050 6GB Laptop GPU (44.3 - 46.4, n=2) | |
| Asus V16 V3607V | |
| Lenovo ThinkPad Z16 Gen 2 | |
Cyberpunk 2077 ultra FPS Chart
| låg | med. | hög | ultra | |
|---|---|---|---|---|
| GTA V (2015) | 184.2 | 178.4 | 127.3 | 63.2 |
| Dota 2 Reborn (2015) | 181.4 | 161.2 | 146.8 | 135.1 |
| Final Fantasy XV Benchmark (2018) | 126.5 | 67.6 | 49.1 | |
| X-Plane 11.11 (2018) | 96.3 | 89.3 | 78.6 | |
| Far Cry 5 (2018) | 149 | 85 | 78 | 74 |
| Strange Brigade (2018) | 246 | 106.9 | 88.4 | 77 |
| Tiny Tina's Wonderlands (2022) | 105.6 | 84.7 | 55.9 | 44.3 |
| F1 22 (2022) | 149.9 | 138.9 | 102 | 31.6 |
| Baldur's Gate 3 (2023) | 59.7 | 50.3 | 45.4 | 44.3 |
| Cyberpunk 2077 2.2 Phantom Liberty (2023) | 66.7 | 51.4 | 42.7 | 36.1 |
Utsläpp
Systembuller
Fläktljudet är i allmänhet tyst under låg belastning, men det ökar tyvärr ganska snabbt när mer krävande belastningar introduceras, t.ex. när applikationer startas. Gaming i balanserat läge är något tystare än i prestandaläget (38,3 dB(A) jämfört med 40,5 dB(A)), till priset av något långsammare grafikprestanda som nämnts ovan.
Ljudnivå
| Låg belastning |
| 23.5 / 23.7 / 23.7 dB(A) |
| Hög belastning |
| 48 / 51 dB(A) |
 | ||
30 dB tyst 40 dB(A) hörbar 50 dB(A) högt ljud |
||
min: | ||
| Asus V16 V3607V GeForce RTX 3050 6GB Laptop GPU, Core 7 240H | Asus VivoBook Pro 16 K6602VU NVIDIA GeForce RTX 4050 Laptop GPU, i9-13900H, Micron 2400 MTFDKBA1T0QFM | Dell Inspiron 16 Plus 7640 NVIDIA GeForce RTX 4060 Laptop GPU, Ultra 7 155H, SK hynix BC901 HFS001TEJ4X164N | Lenovo ThinkBook 16 G7 IML Graphics 4-Core, Ultra 5 125U, SK hynix HFS512GEJ4X112N | HP Pavilion Plus 16-ab0456tx GeForce RTX 3050 6GB Laptop GPU, i7-13700H, WDC PC SN810 1TB | Acer Swift Edge 16 SFE16-44-R0XV Radeon 760M, R5 8640U, Micron 3400 MTFDKBA512TFH 512GB | |
|---|---|---|---|---|---|---|
| Noise | -4% | 5% | 18% | 9% | -13% | |
| av / miljö * | 23.3 | 20.96 10% | 23.8 -2% | 23.1 1% | 22.22 5% | 25 -7% |
| Idle Minimum * | 23.5 | 25.28 -8% | 24.2 -3% | 23.1 2% | 22.22 5% | 26 -11% |
| Idle Average * | 23.7 | 25.28 -7% | 24.2 -2% | 23.1 3% | 22.22 6% | 29 -22% |
| Idle Maximum * | 23.7 | 25.28 -7% | 24.2 -2% | 23.1 3% | 22.22 6% | 39 -65% |
| Load Average * | 48 | 51.88 -8% | 28.9 40% | 23.2 52% | 42.03 12% | 45 6% |
| Cyberpunk 2077 ultra * | 40.5 | 29.2 28% | 43 -6% | |||
| Load Maximum * | 51 | 51.8 -2% | 51 -0% | 32.6 36% | 42.1 17% | 45 12% |
| Witcher 3 ultra * | 49 | 51 | 42.1 |
* ... mindre är bättre
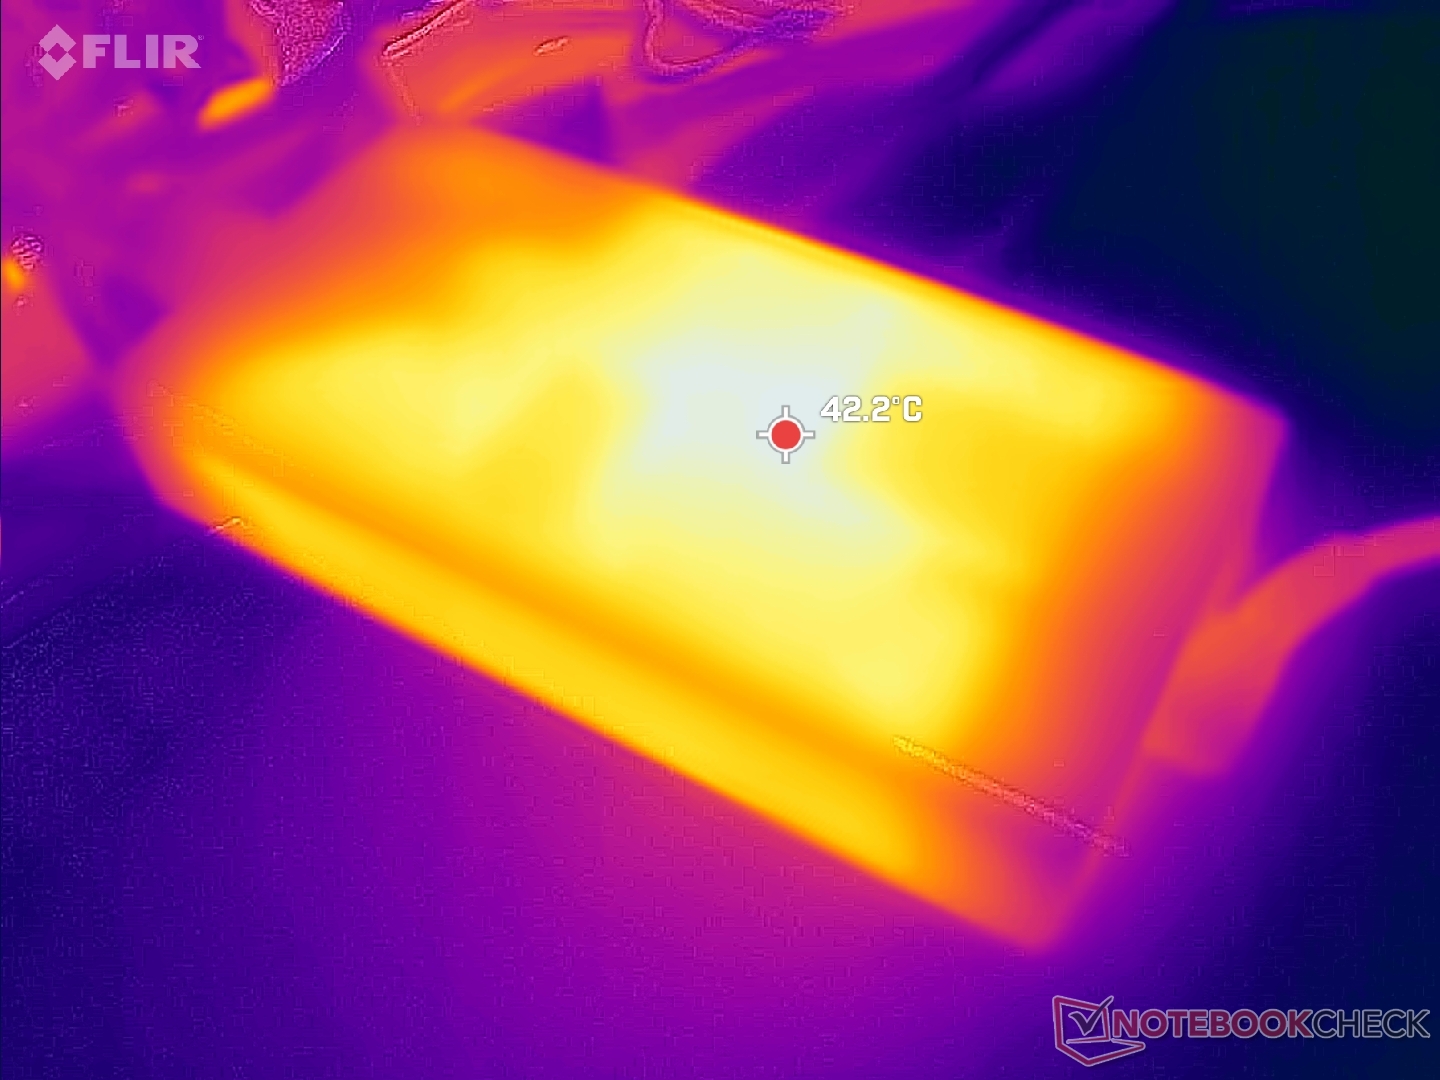
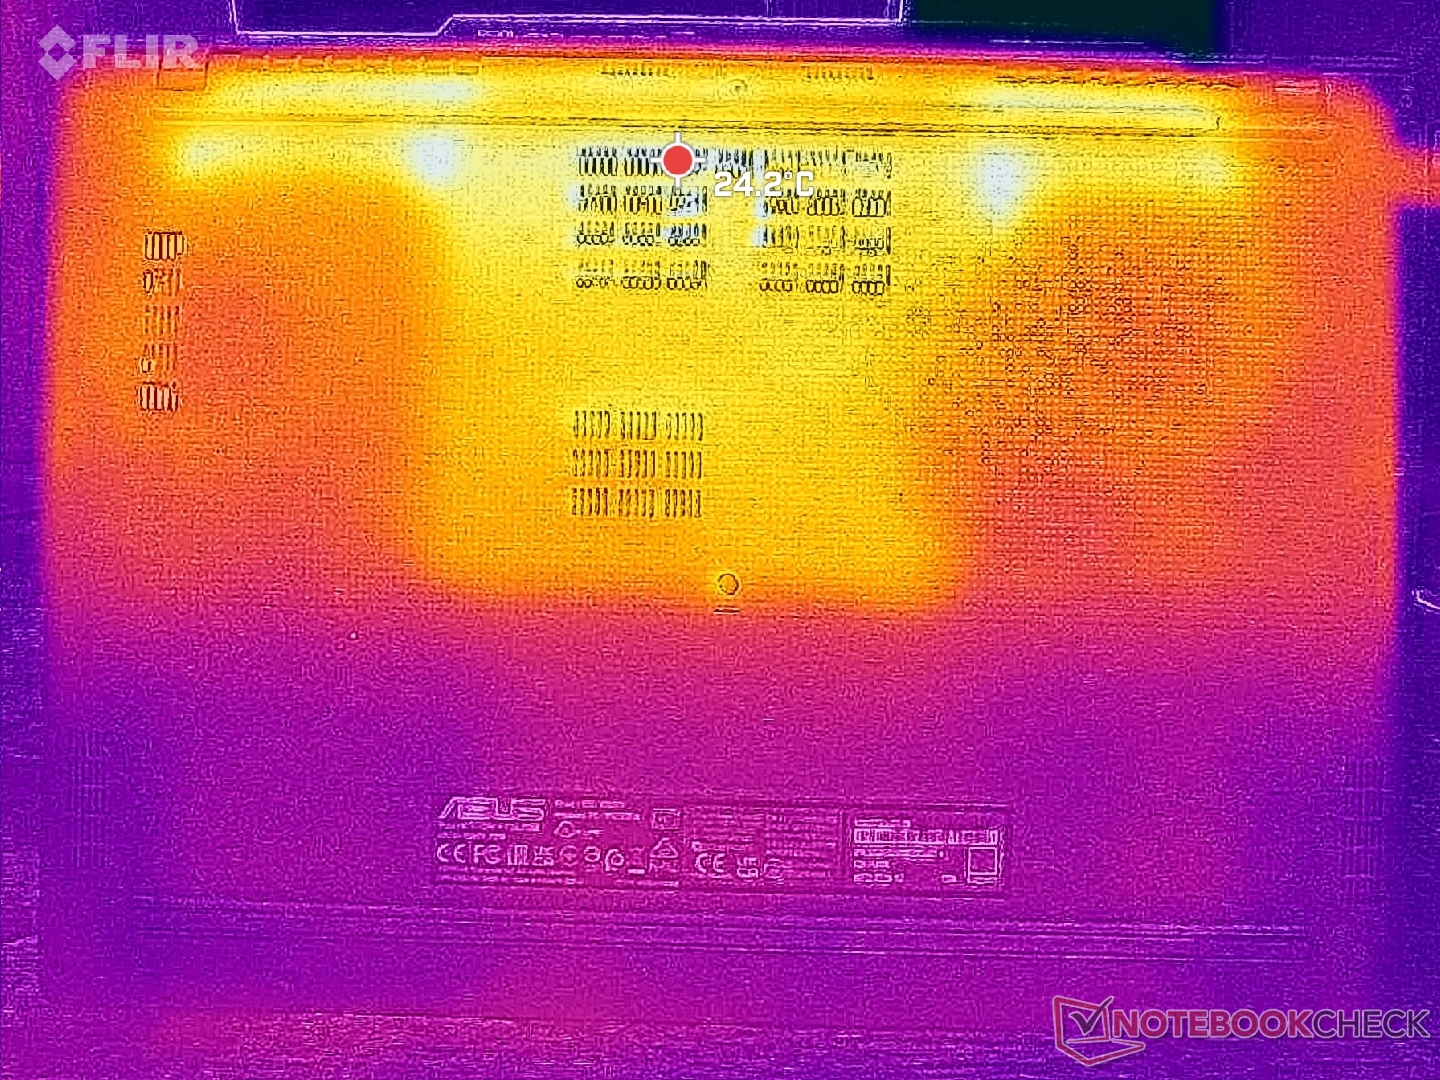
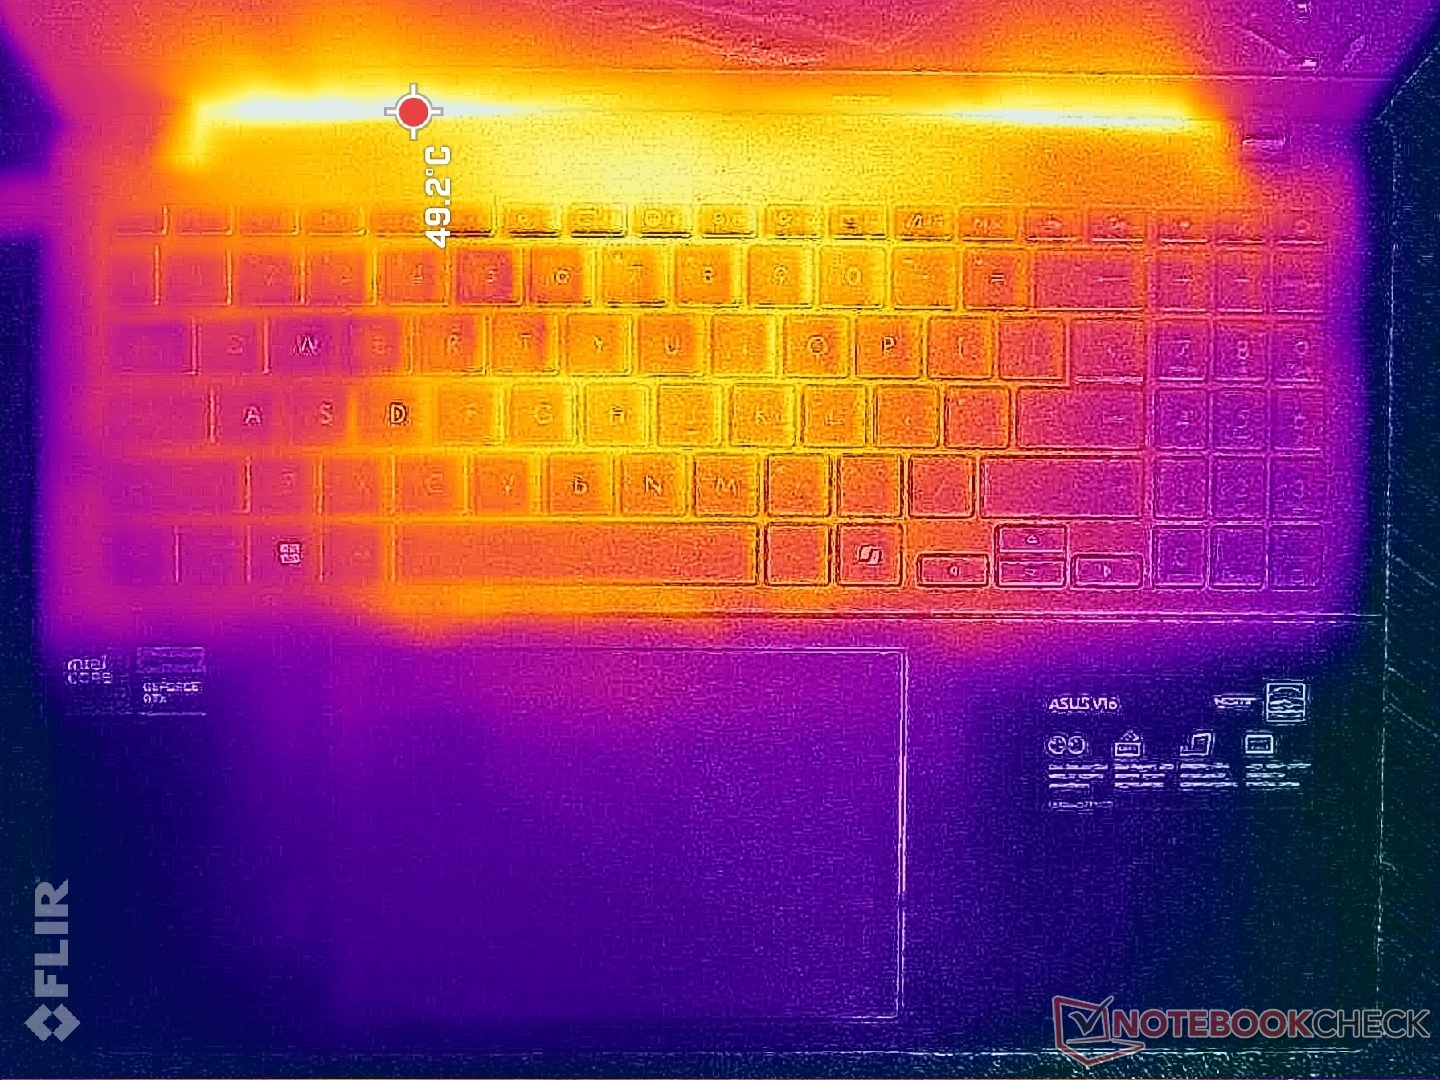
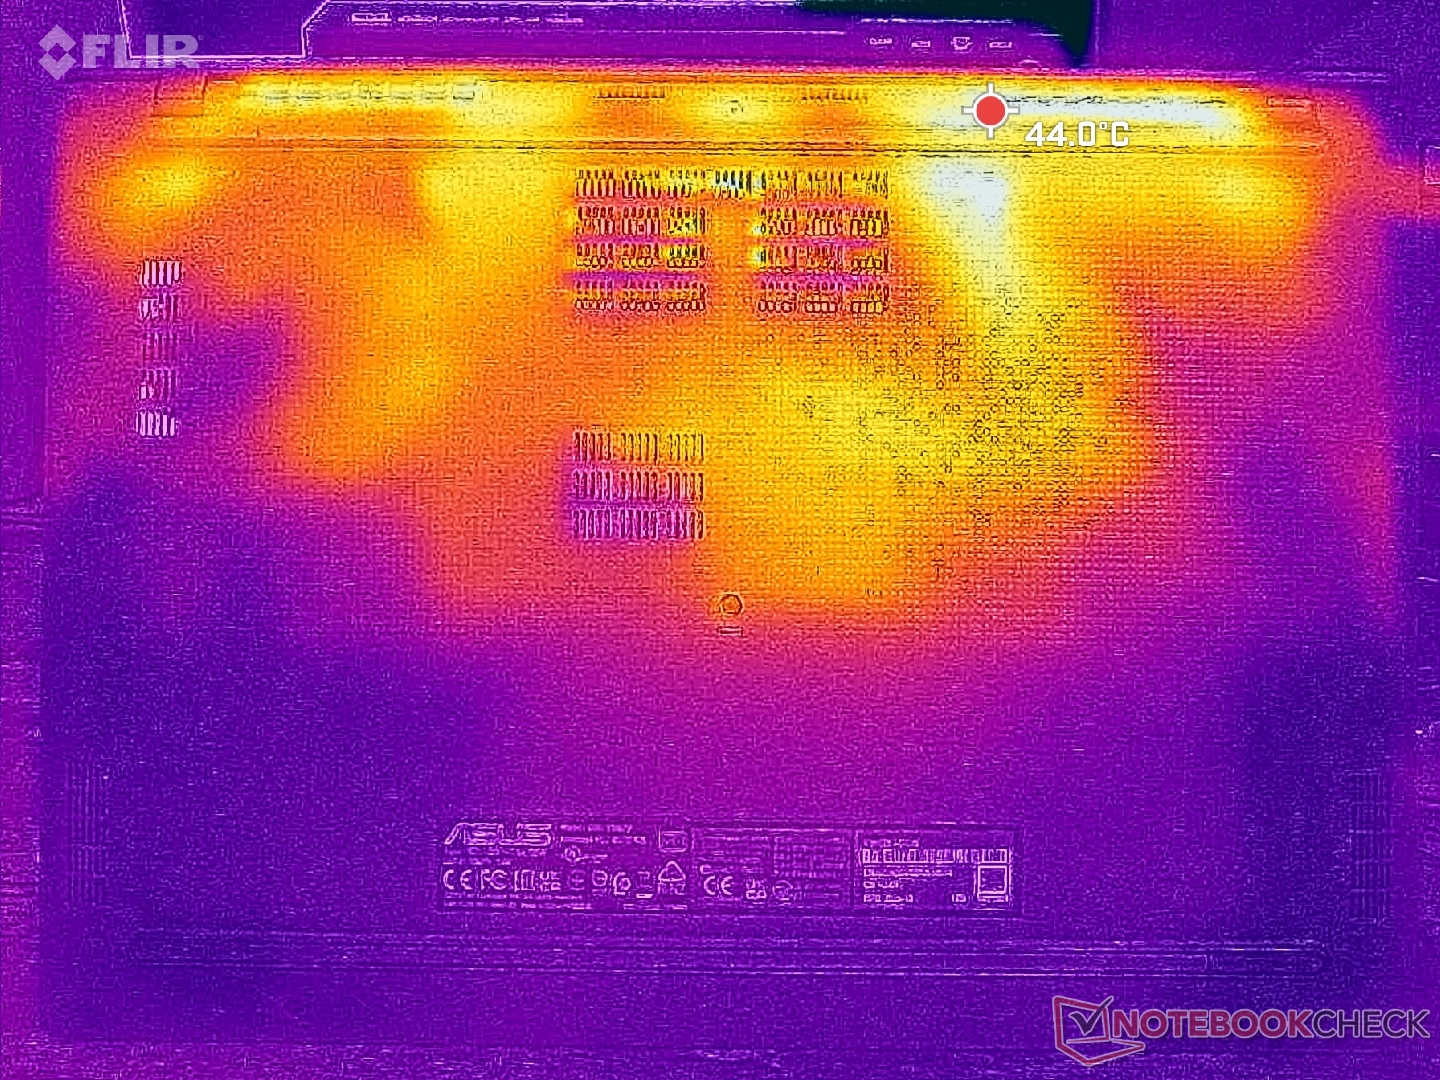
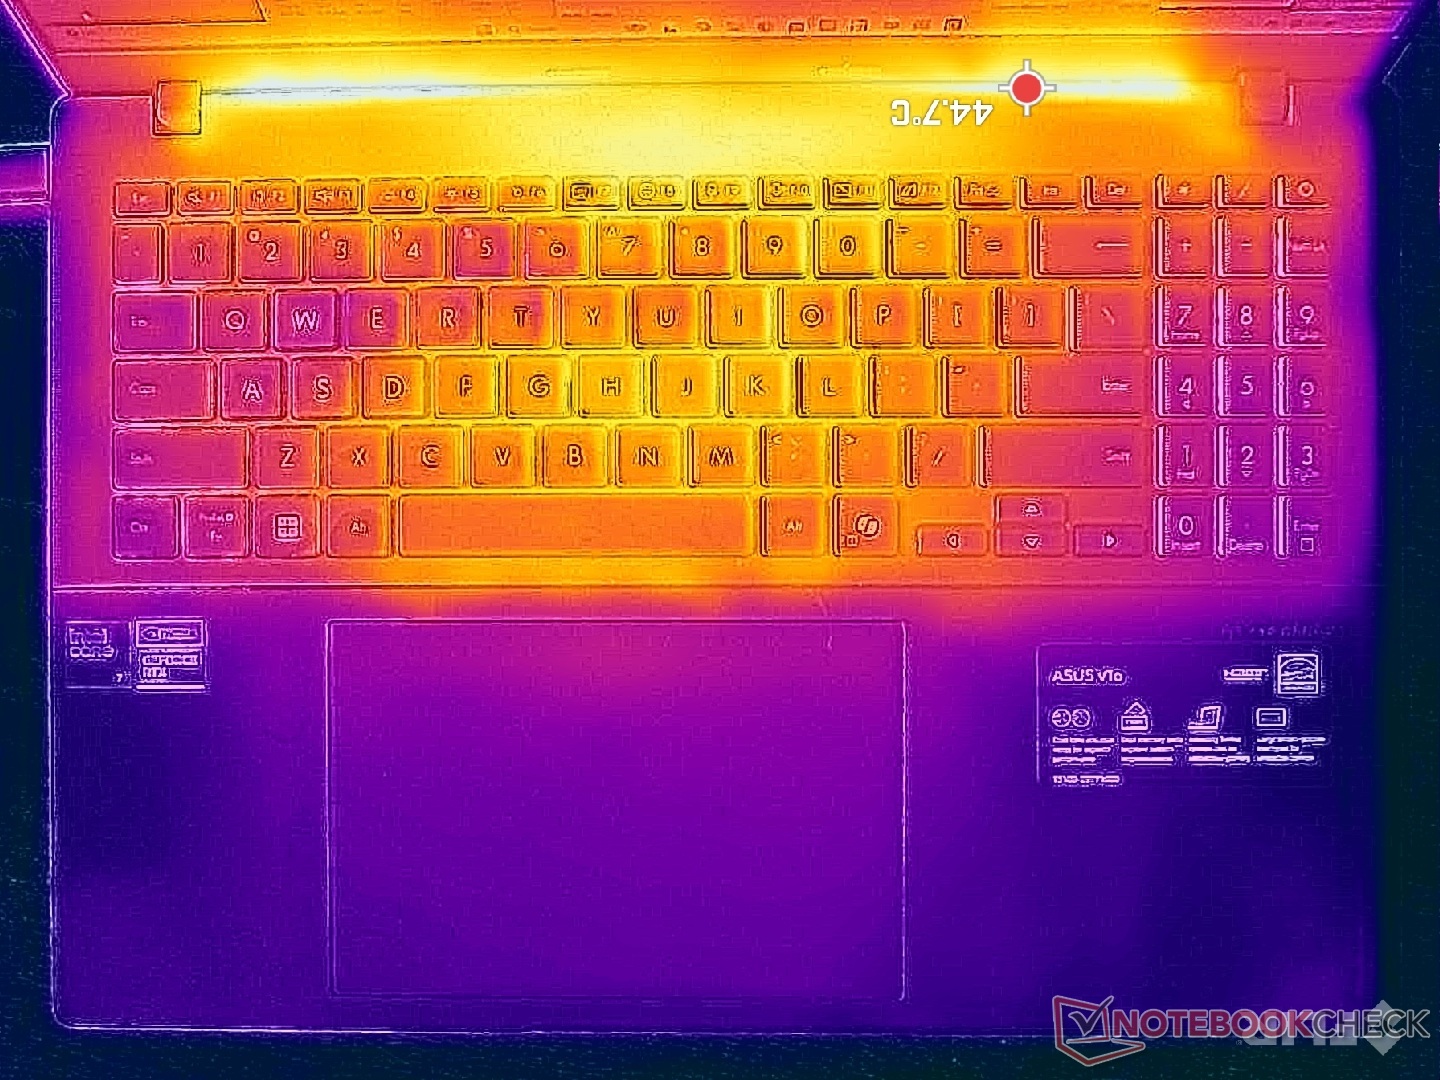
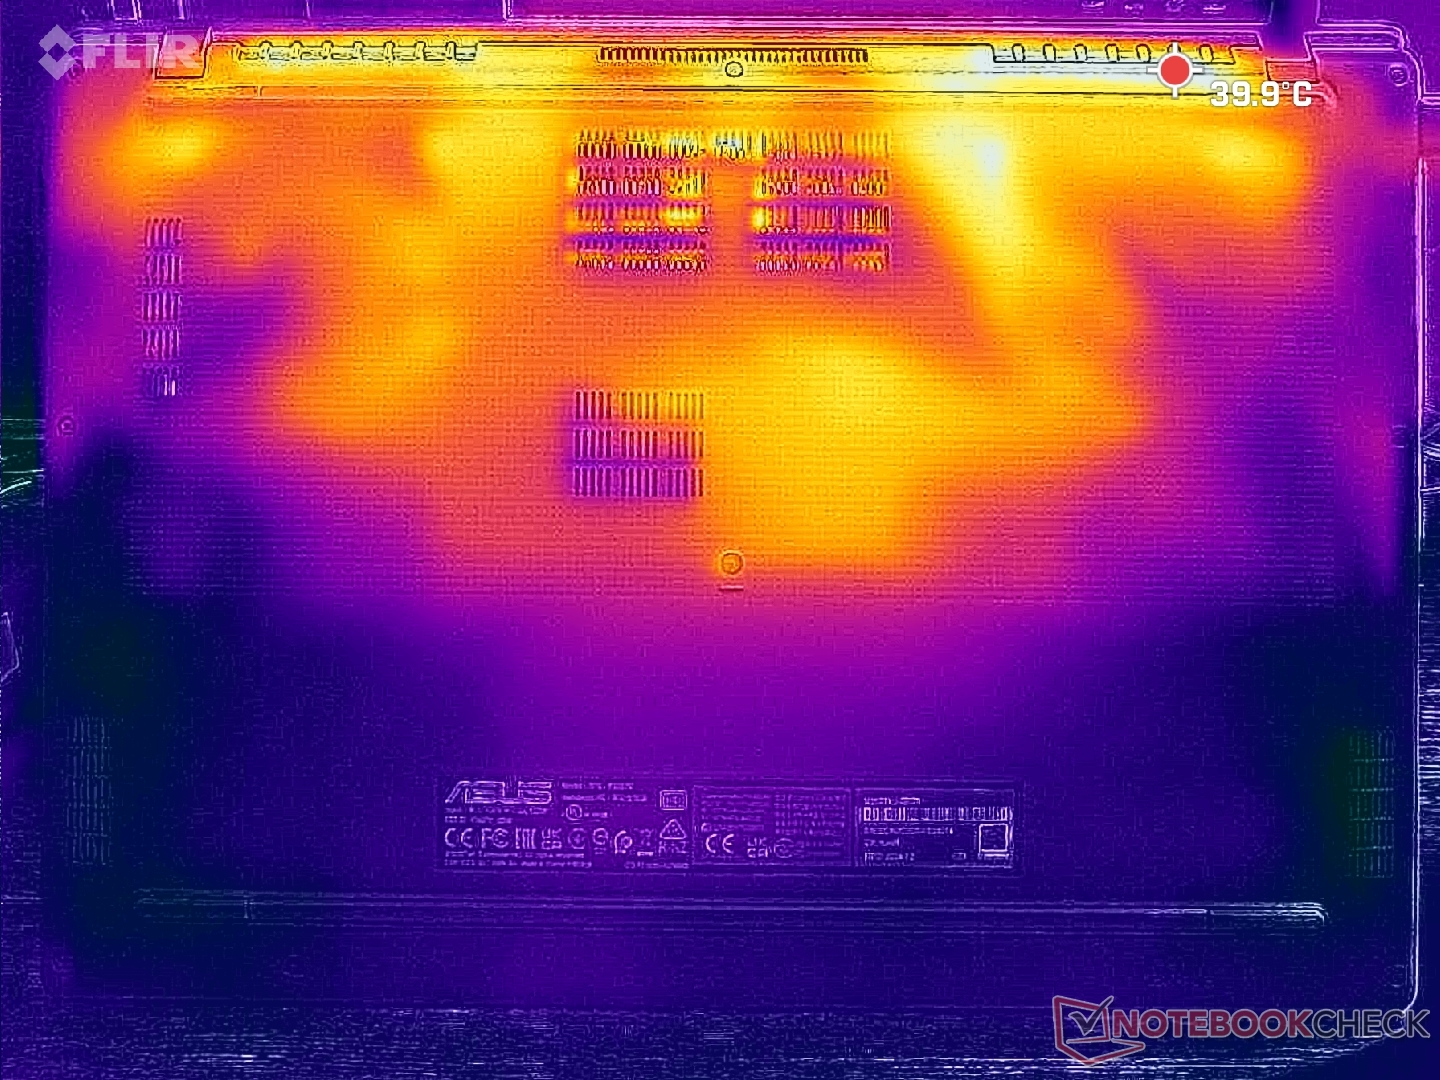
Temperatur
De hetaste punkterna är mot baksidan där temperaturen kan nå över 40 C, vilket framgår av temperaturkartorna nedan. Handledsstöden, numpad och WASD-tangenterna skulle förbli svalare för skrivning eller speländamål.
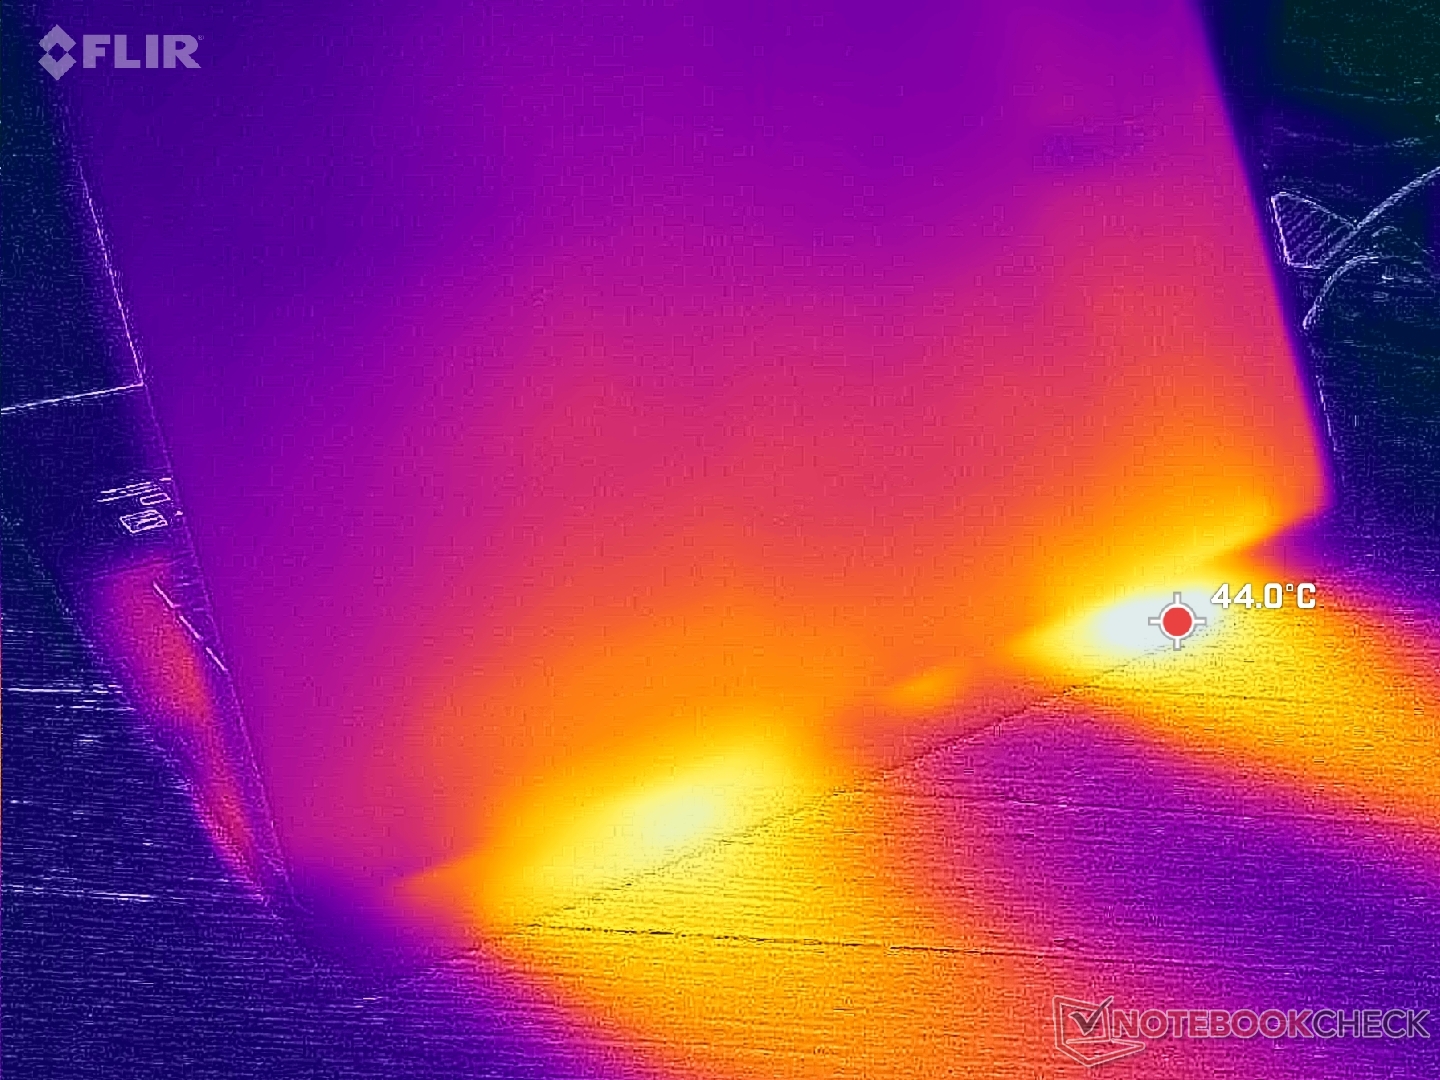
(±) Den maximala temperaturen på ovansidan är 41.2 °C / 106 F, jämfört med genomsnittet av 36.9 °C / 98 F , allt från 21.1 till 71 °C för klassen Multimedia.
(+) Botten värms upp till maximalt 34.4 °C / 94 F, jämfört med genomsnittet av 39.2 °C / 103 F
(+) Vid tomgångsbruk är medeltemperaturen för ovansidan 24.6 °C / 76 F, jämfört med enhetsgenomsnittet på 31.3 °C / ### class_avg_f### F.
(+) 3: The average temperature for the upper side is 31.2 °C / 88 F, compared to the average of 31.3 °C / 88 F for the class Multimedia.
(+) Handledsstöden och pekplattan är kallare än hudtemperaturen med maximalt 21.8 °C / 71.2 F och är därför svala att ta på.
(+) Medeltemperaturen för handledsstödsområdet på liknande enheter var 28.8 °C / 83.8 F (+7 °C / 12.6 F).

| Asus V16 V3607V Intel Core 7 240H, NVIDIA GeForce RTX 3050 6GB Laptop GPU | Asus VivoBook Pro 16 K6602VU Intel Core i9-13900H, NVIDIA GeForce RTX 4050 Laptop GPU | Dell Inspiron 16 Plus 7640 Intel Core Ultra 7 155H, NVIDIA GeForce RTX 4060 Laptop GPU | Lenovo ThinkBook 16 G7 IML Intel Core Ultra 5 125U, Intel Graphics 4-Core iGPU (Arc) | HP Pavilion Plus 16-ab0456tx Intel Core i7-13700H, NVIDIA GeForce RTX 3050 6GB Laptop GPU | Acer Swift Edge 16 SFE16-44-R0XV AMD Ryzen 5 8640U, AMD Radeon 760M | |
|---|---|---|---|---|---|---|
| Heat | -30% | -13% | 7% | -28% | -24% | |
| Maximum Upper Side * | 41.2 | 42.6 -3% | 43.4 -5% | 33.2 19% | 49.6 -20% | 48 -17% |
| Maximum Bottom * | 34.4 | 48.4 -41% | 41.6 -21% | 41.2 -20% | 45.8 -33% | 60 -74% |
| Idle Upper Side * | 28.8 | 39.4 -37% | 32.8 -14% | 23.4 19% | 39.2 -36% | 28 3% |
| Idle Bottom * | 29 | 39.8 -37% | 32.4 -12% | 26.6 8% | 35.4 -22% | 31 -7% |
* ... mindre är bättre
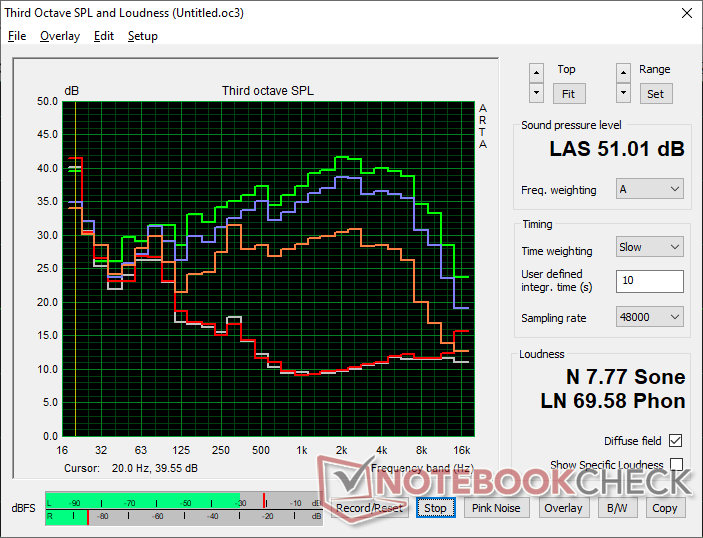
Högtalare
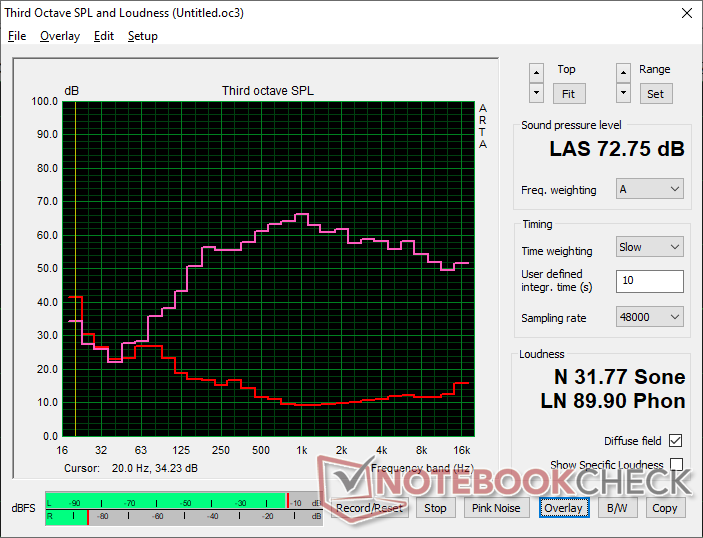
Asus V16 V3607V ljudanalys
(±) | högtalarljudstyrkan är genomsnittlig men bra (72.8 dB)
Bas 100 - 315 Hz
(±) | reducerad bas - i genomsnitt 7.7% lägre än medianen
(±) | linjäriteten för basen är genomsnittlig (7.8% delta till föregående frekvens)
Mellan 400 - 2000 Hz
(+) | balanserad mellan - endast 4.7% från medianen
(+) | mids är linjära (4.8% delta till föregående frekvens)
Högsta 2 - 16 kHz
(+) | balanserade toppar - endast 1.9% från medianen
(+) | toppar är linjära (5.3% delta till föregående frekvens)
Totalt 100 - 16 000 Hz
(+) | det totala ljudet är linjärt (13.2% skillnad mot median)
Jämfört med samma klass
» 23% av alla testade enheter i den här klassen var bättre, 5% liknande, 72% sämre
» Den bästa hade ett delta på 5%, genomsnittet var 18%, sämst var 45%
Jämfört med alla testade enheter
» 12% av alla testade enheter var bättre, 3% liknande, 86% sämre
» Den bästa hade ett delta på 4%, genomsnittet var 24%, sämst var 134%
Apple MacBook Pro 16 2021 M1 Pro ljudanalys
(+) | högtalare kan spela relativt högt (84.7 dB)
Bas 100 - 315 Hz
(+) | bra bas - bara 3.8% från medianen
(+) | basen är linjär (5.2% delta till föregående frekvens)
Mellan 400 - 2000 Hz
(+) | balanserad mellan - endast 1.3% från medianen
(+) | mids är linjära (2.1% delta till föregående frekvens)
Högsta 2 - 16 kHz
(+) | balanserade toppar - endast 1.9% från medianen
(+) | toppar är linjära (2.7% delta till föregående frekvens)
Totalt 100 - 16 000 Hz
(+) | det totala ljudet är linjärt (4.6% skillnad mot median)
Jämfört med samma klass
» 0% av alla testade enheter i den här klassen var bättre, 0% liknande, 100% sämre
» Den bästa hade ett delta på 5%, genomsnittet var 18%, sämst var 45%
Jämfört med alla testade enheter
» 0% av alla testade enheter var bättre, 0% liknande, 100% sämre
» Den bästa hade ett delta på 4%, genomsnittet var 24%, sämst var 134%
Energiförvaltning
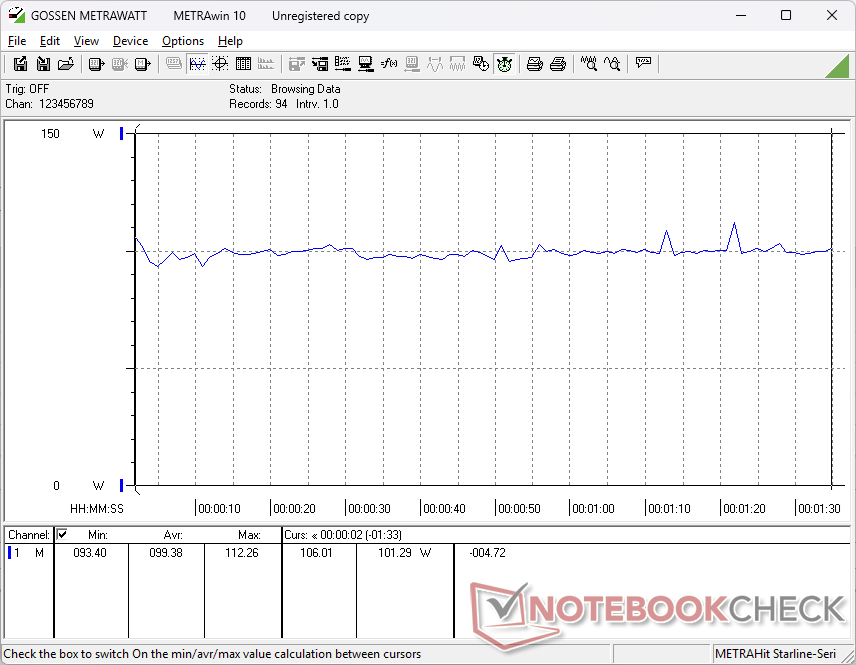
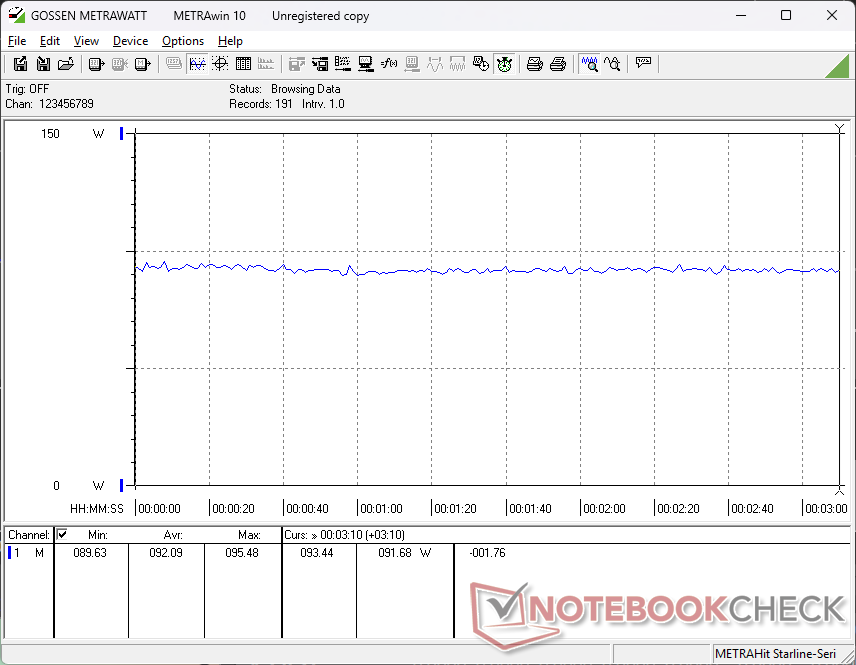
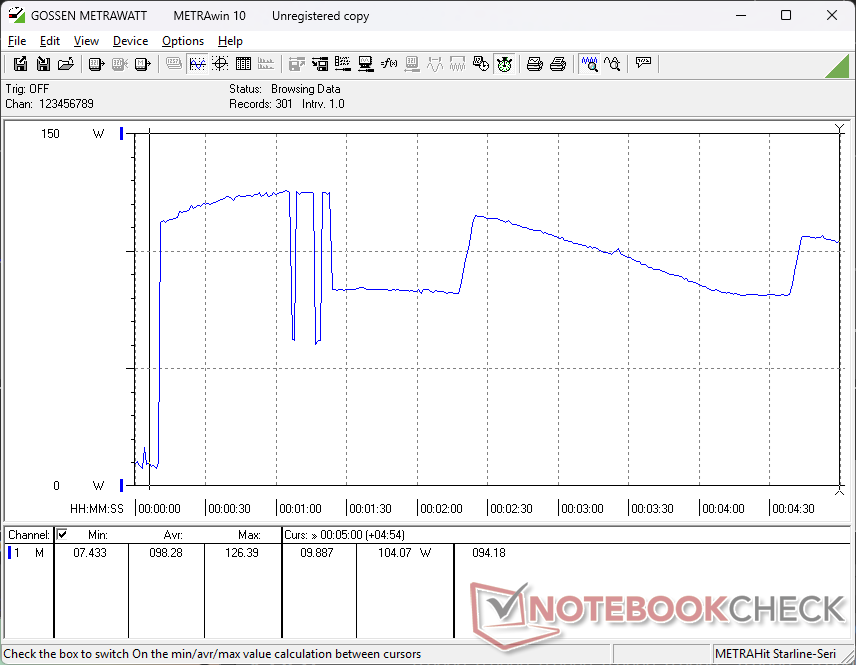
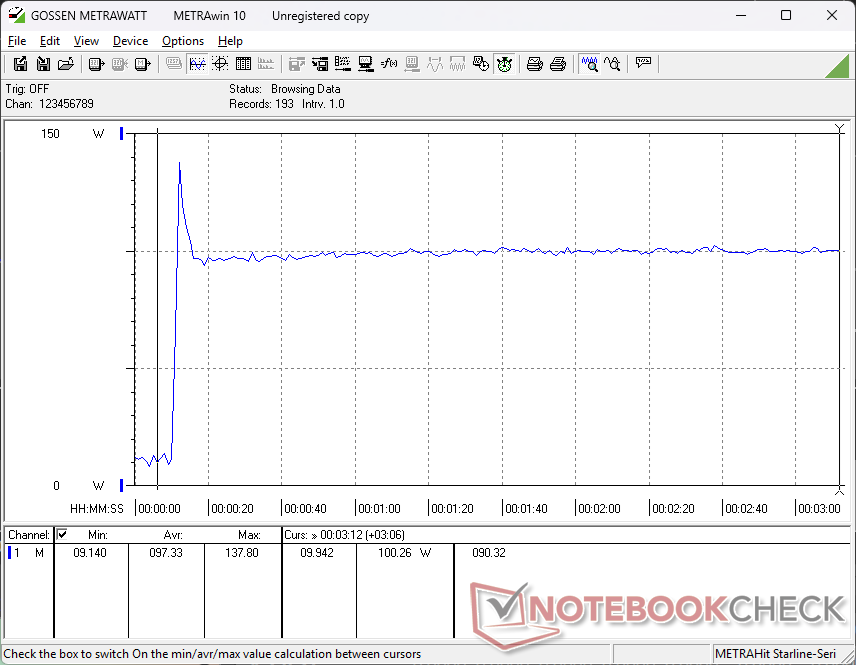
Strömförbrukning
Tomgångskörning kan variera från bara 2 W med dGPU inaktiverad eller upp till 11 W med dGPU aktiverad och på maximal ljusstyrka. Förbrukningen fluktuerar kraftigt när man kör Prime95-stress på grund av det prestandastrypande beteende som nämns ovan.
| Av/Standby | |
| Låg belastning | |
| Hög belastning |
|
Förklaring:
min: | |
| Asus V16 V3607V Core 7 240H, GeForce RTX 3050 6GB Laptop GPU, , IPS, 1920x1200, 16" | Asus VivoBook Pro 16 K6602VU i9-13900H, NVIDIA GeForce RTX 4050 Laptop GPU, Micron 2400 MTFDKBA1T0QFM, OLED, 3200x2000, 16" | Dell Inspiron 16 Plus 7640 Ultra 7 155H, NVIDIA GeForce RTX 4060 Laptop GPU, SK hynix BC901 HFS001TEJ4X164N, IPS, 2560x1600, 16" | Lenovo ThinkBook 16 G7 IML Ultra 5 125U, Graphics 4-Core, SK hynix HFS512GEJ4X112N, IPS, 1920x1200, 16" | HP Pavilion Plus 16-ab0456tx i7-13700H, GeForce RTX 3050 6GB Laptop GPU, WDC PC SN810 1TB, IPS, 2560x1600, 16" | Acer Swift Edge 16 SFE16-44-R0XV R5 8640U, Radeon 760M, Micron 3400 MTFDKBA512TFH 512GB, OLED, 3200x2000, 16" | |
|---|---|---|---|---|---|---|
| Power Consumption | -247% | -22% | 18% | -13% | -19% | |
| Idle Minimum * | 2.1 | 21.06 -903% | 4.2 -100% | 4.3 -105% | 3.3 -57% | 8 -281% |
| Idle Average * | 7.2 | 24.27 -237% | 6.9 4% | 8.9 -24% | 7.3 -1% | 10 -39% |
| Idle Maximum * | 10.7 | 25.12 -135% | 15.2 -42% | 9.1 15% | 14.24 -33% | 15 -40% |
| Load Average * | 99.4 | 52.4 47% | 70.4 29% | 31.7 68% | 91.7 8% | 42 58% |
| Cyberpunk 2077 ultra external monitor * | 88.7 | 35.2 60% | 42.8 52% | |||
| Cyberpunk 2077 ultra * | 92.1 | 39.4 57% | 44.4 52% | |||
| Load Maximum * | 137.8 | 146 -6% | 137.4 -0% | 66.7 52% | 115.8 16% | 49 64% |
| Witcher 3 ultra * | 110.2 | 115.9 | 96.2 |
* ... mindre är bättre
Power Consumption Cyberpunk / Stress Test
Power Consumption external Monitor
Batteritid
Drifttiden för WLAN är respektabel med nästan 9 timmars surfning i verkligheten trots det medelstora 63 Wh-batteriet. Testet utfördes med dGPU inaktiv och i Eco/Balanced-läge.
| Asus V16 V3607V Core 7 240H, GeForce RTX 3050 6GB Laptop GPU, 63 Wh | Asus VivoBook Pro 16 K6602VU i9-13900H, NVIDIA GeForce RTX 4050 Laptop GPU, 96 Wh | Dell Inspiron 16 Plus 7640 Ultra 7 155H, NVIDIA GeForce RTX 4060 Laptop GPU, 90 Wh | Lenovo ThinkBook 16 G7 IML Ultra 5 125U, Graphics 4-Core, 45 Wh | HP Pavilion Plus 16-ab0456tx i7-13700H, GeForce RTX 3050 6GB Laptop GPU, 68 Wh | Acer Swift Edge 16 SFE16-44-R0XV R5 8640U, Radeon 760M, 54 Wh | |
|---|---|---|---|---|---|---|
| Batteridrifttid | 12% | 48% | -2% | 16% | -46% | |
| WiFi v1.3 | 539 | 606 12% | 799 48% | 528 -2% | 624 16% | 290 -46% |
| H.264 | 585 | 720 | ||||
| Reader / Idle | 1150 | |||||
| Load | 79 |
Notebookcheck Betyg
Asus V16 V3607V
- 03/19/2025 v8
Allen Ngo
 Total Sustainability Score:
 Potential Competitors in Comparison
Bild | Modell / recensioner | Pris | Vikt | Höjd | Skärm |
|---|---|---|---|---|---|
1. 78.5%  | Asus V16 V3607V Intel Core 7 240H ⎘ NVIDIA GeForce RTX 3050 6GB Laptop GPU ⎘ 16 GB Minne | Listpris: 900 USD | 2 kg | 22 mm | 16.00" 1920x1200 142 PPI IPS |
2. 87.6% v7 (old)  | Asus VivoBook Pro 16 K6602VU Intel Core i9-13900H ⎘ NVIDIA GeForce RTX 4050 Laptop GPU ⎘ 16 GB Minne, 1024 GB SSD | Amazon: 1. $1,649.00 ASUS Vivobook Pro K6602V 202... 2. $1,401.57 ASUS VivoBook Pro 16X OLED S... 3. $1,999.99 ASUS Vivobook Pro 16X OLED L... Listpris: 2199 EUR | 1.9 kg | 19 mm | 16.00" 3200x2000 236 PPI OLED |
3. 83.4%  | Dell Inspiron 16 Plus 7640 Intel Core Ultra 7 155H ⎘ NVIDIA GeForce RTX 4060 Laptop GPU ⎘ 16 GB Minne, 1024 GB SSD | Amazon: $1,299.99 Listpris: 1300 USD | 2.2 kg | 19.9 mm | 16.00" 2560x1600 189 PPI IPS |
4. 83%  | Lenovo ThinkBook 16 G7 IML Intel Core Ultra 5 125U ⎘ Intel Graphics 4-Core iGPU (Arc) ⎘ 16 GB Minne, 512 GB SSD | Amazon: $833.82 Listpris: 750 USD | 1.8 kg | 17.5 mm | 16.00" 1920x1200 142 PPI IPS |
5. 88.7% v7 (old)  | HP Pavilion Plus 16-ab0456tx Intel Core i7-13700H ⎘ NVIDIA GeForce RTX 3050 6GB Laptop GPU ⎘ 16 GB Minne, 1024 GB SSD | Amazon: 1. $35.49 200W 150W 135W AC Charger Fo... 2. $1,120.18 HP Pavilion Plus 16 inch Lap... 3. $55.00 Laptop LCD Bezel for HP Pavi... Listpris: 1350 USD | 1.9 kg | 19.9 mm | 16.00" 2560x1600 189 PPI IPS |
6. 81.3%  | Acer Swift Edge 16 SFE16-44-R0XV AMD Ryzen 5 8640U ⎘ AMD Radeon 760M ⎘ 16 GB Minne, 512 GB SSD | Amazon: 1. $219.89 HOULISE Replacement for Acer... Listpris: 1000 EUR | 1.2 kg | 13 mm | 16.00" 3200x2000 236 PPI OLED |
Genomskinlighet
Valet av enheter som ska granskas görs av vår redaktion. Testprovet gavs till författaren som ett lån av tillverkaren eller återförsäljaren för denna recension. Långivaren hade inget inflytande på denna recension och inte heller fick tillverkaren en kopia av denna recension innan publiceringen. Det fanns ingen skyldighet att publicera denna recension. Vi accepterar aldrig ersättning eller betalning i utbyte mot våra recensioner. Som ett oberoende medieföretag är Notebookcheck inte föremål för auktoritet från tillverkare, återförsäljare eller förlag.
This is how Notebookcheck is testingEvery year, Notebookcheck independently reviews hundreds of laptops and smartphones using standardized procedures to ensure that all results are comparable. We have continuously developed our test methods for around 20 years and set industry standards in the process. In our test labs, high-quality measuring equipment is utilized by experienced technicians and editors. These tests involve a multi-stage validation process. Our complex rating system is based on hundreds of well-founded measurements and benchmarks, which maintains objectivity.

