MSI Raider 18 HX A14V recension: Titan-prestanda utan Titan-priset
")
Större bärbara speldatorer på 18 tum gör en slags comeback när sortimentet fortsätter att stadigt expandera. MSI erbjuder redan den "ultimata" 18-tums spelupplevelsen med Titan 18 HXmen den här senaste Raider 18 HX-modellen är en nivå lägre när det gäller funktioner för att sänka inträdesbarriären.
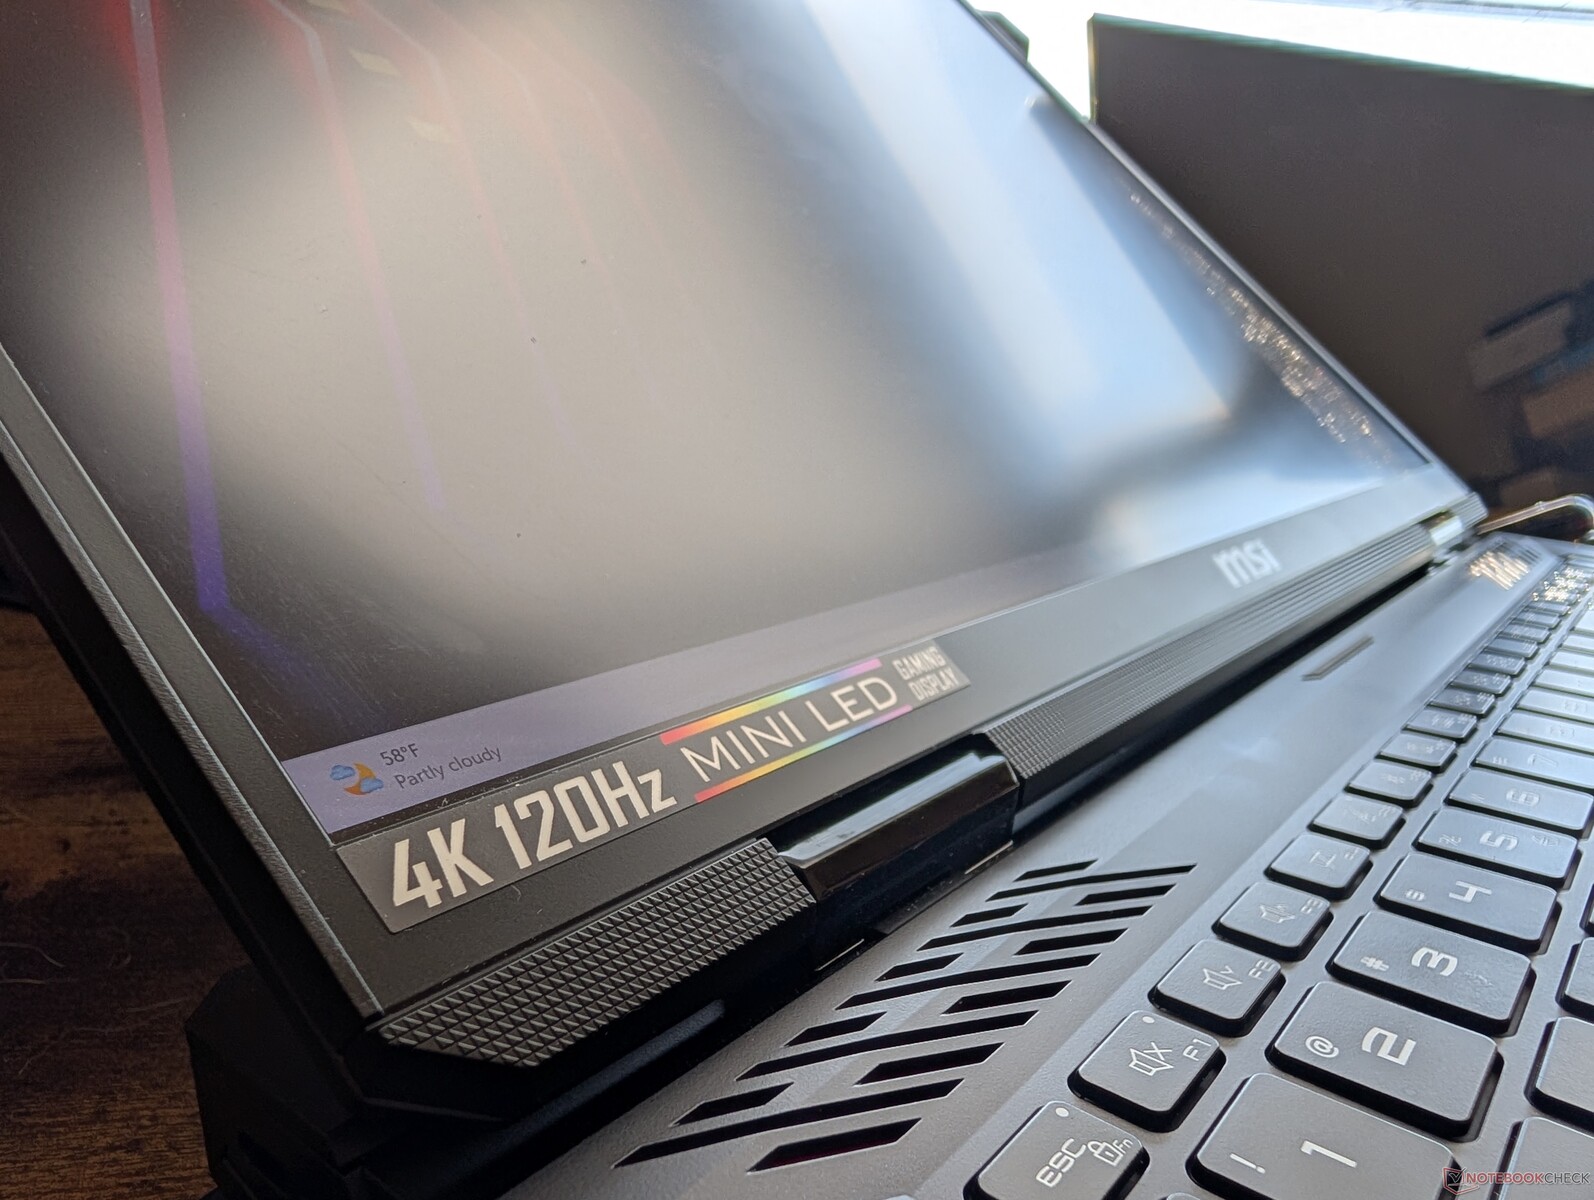
Vår testenhet är en mellankonfiguration med Raptor Lake-R Core i9-14900HX CPU, 175 W GeForce RTX 4080 GPU och 3840 x 2400 120 Hz Mini-LED-skärm för cirka $3200 i detaljhandeln. Andra SKU:er inkluderar Zen 4 Ryzen 9 7945HX, RTX 4070, RTX 4090 eller QHD+ 2560 x 1600 240 Hz IPS-skärm istället.
Konkurrenter till Raider 18 HX inkluderar andra 18-tums bärbara speldatorer som Razer Blade 18, Alienware m18 R2, eller Asus ROG Strix G18.
Fler MSI-recensioner:
Potentiella konkurrenter i jämförelse
Gradering | Version | Datum | Modell | Vikt | Höjd | Storlek | Upplösning | Pris |
|---|---|---|---|---|---|---|---|---|
| 84.7 % | v8 | 09/2024 | MSI Raider 18 HX A14V i9-14900HX, NVIDIA GeForce RTX 4080 Laptop GPU | 3.6 kg | 32 mm | 18.00" | 3840x2400 | |
| 90.5 % v7 (old) | v7 (old) | 05/2024 | Razer Blade 18 2024 RZ09-0509 i9-14900HX, NVIDIA GeForce RTX 4090 Laptop GPU | 3.1 kg | 21.9 mm | 18.00" | 2560x1600 | from EUR 4500 |
| 89.5 % v7 (old) | v7 (old) | 03/2024 | Alienware m18 R2 i9-14900HX, NVIDIA GeForce RTX 4090 Laptop GPU | 4 kg | 26.7 mm | 18.00" | 2560x1600 | |
| 88.8 % v7 (old) | v7 (old) | 01/2024 | MSI Titan 18 HX A14VIG i9-14900HX, NVIDIA GeForce RTX 4090 Laptop GPU | 3.6 kg | 32.1 mm | 18.00" | 3840x2400 | |
| 87.4 % v7 (old) | v7 (old) | 03/2023 | Asus ROG Strix G18 G814JI i7-13650HX, NVIDIA GeForce RTX 4070 Laptop GPU | 3 kg | 31 mm | 18.00" | 2560x1600 | |
| 87.1 % v7 (old) | v7 (old) | 03/2024 | Acer Predator Helios 18 PH18-72-98MW i9-14900HX, NVIDIA GeForce RTX 4090 Laptop GPU | 3.3 kg | 29.5 mm | 18.00" | 2560x1600 |
Obs: Vi har nyligen uppdaterat vårt betygssystem och resultaten från version 8 är inte jämförbara med resultaten från version 7. Mer information finns tillgänglig här .
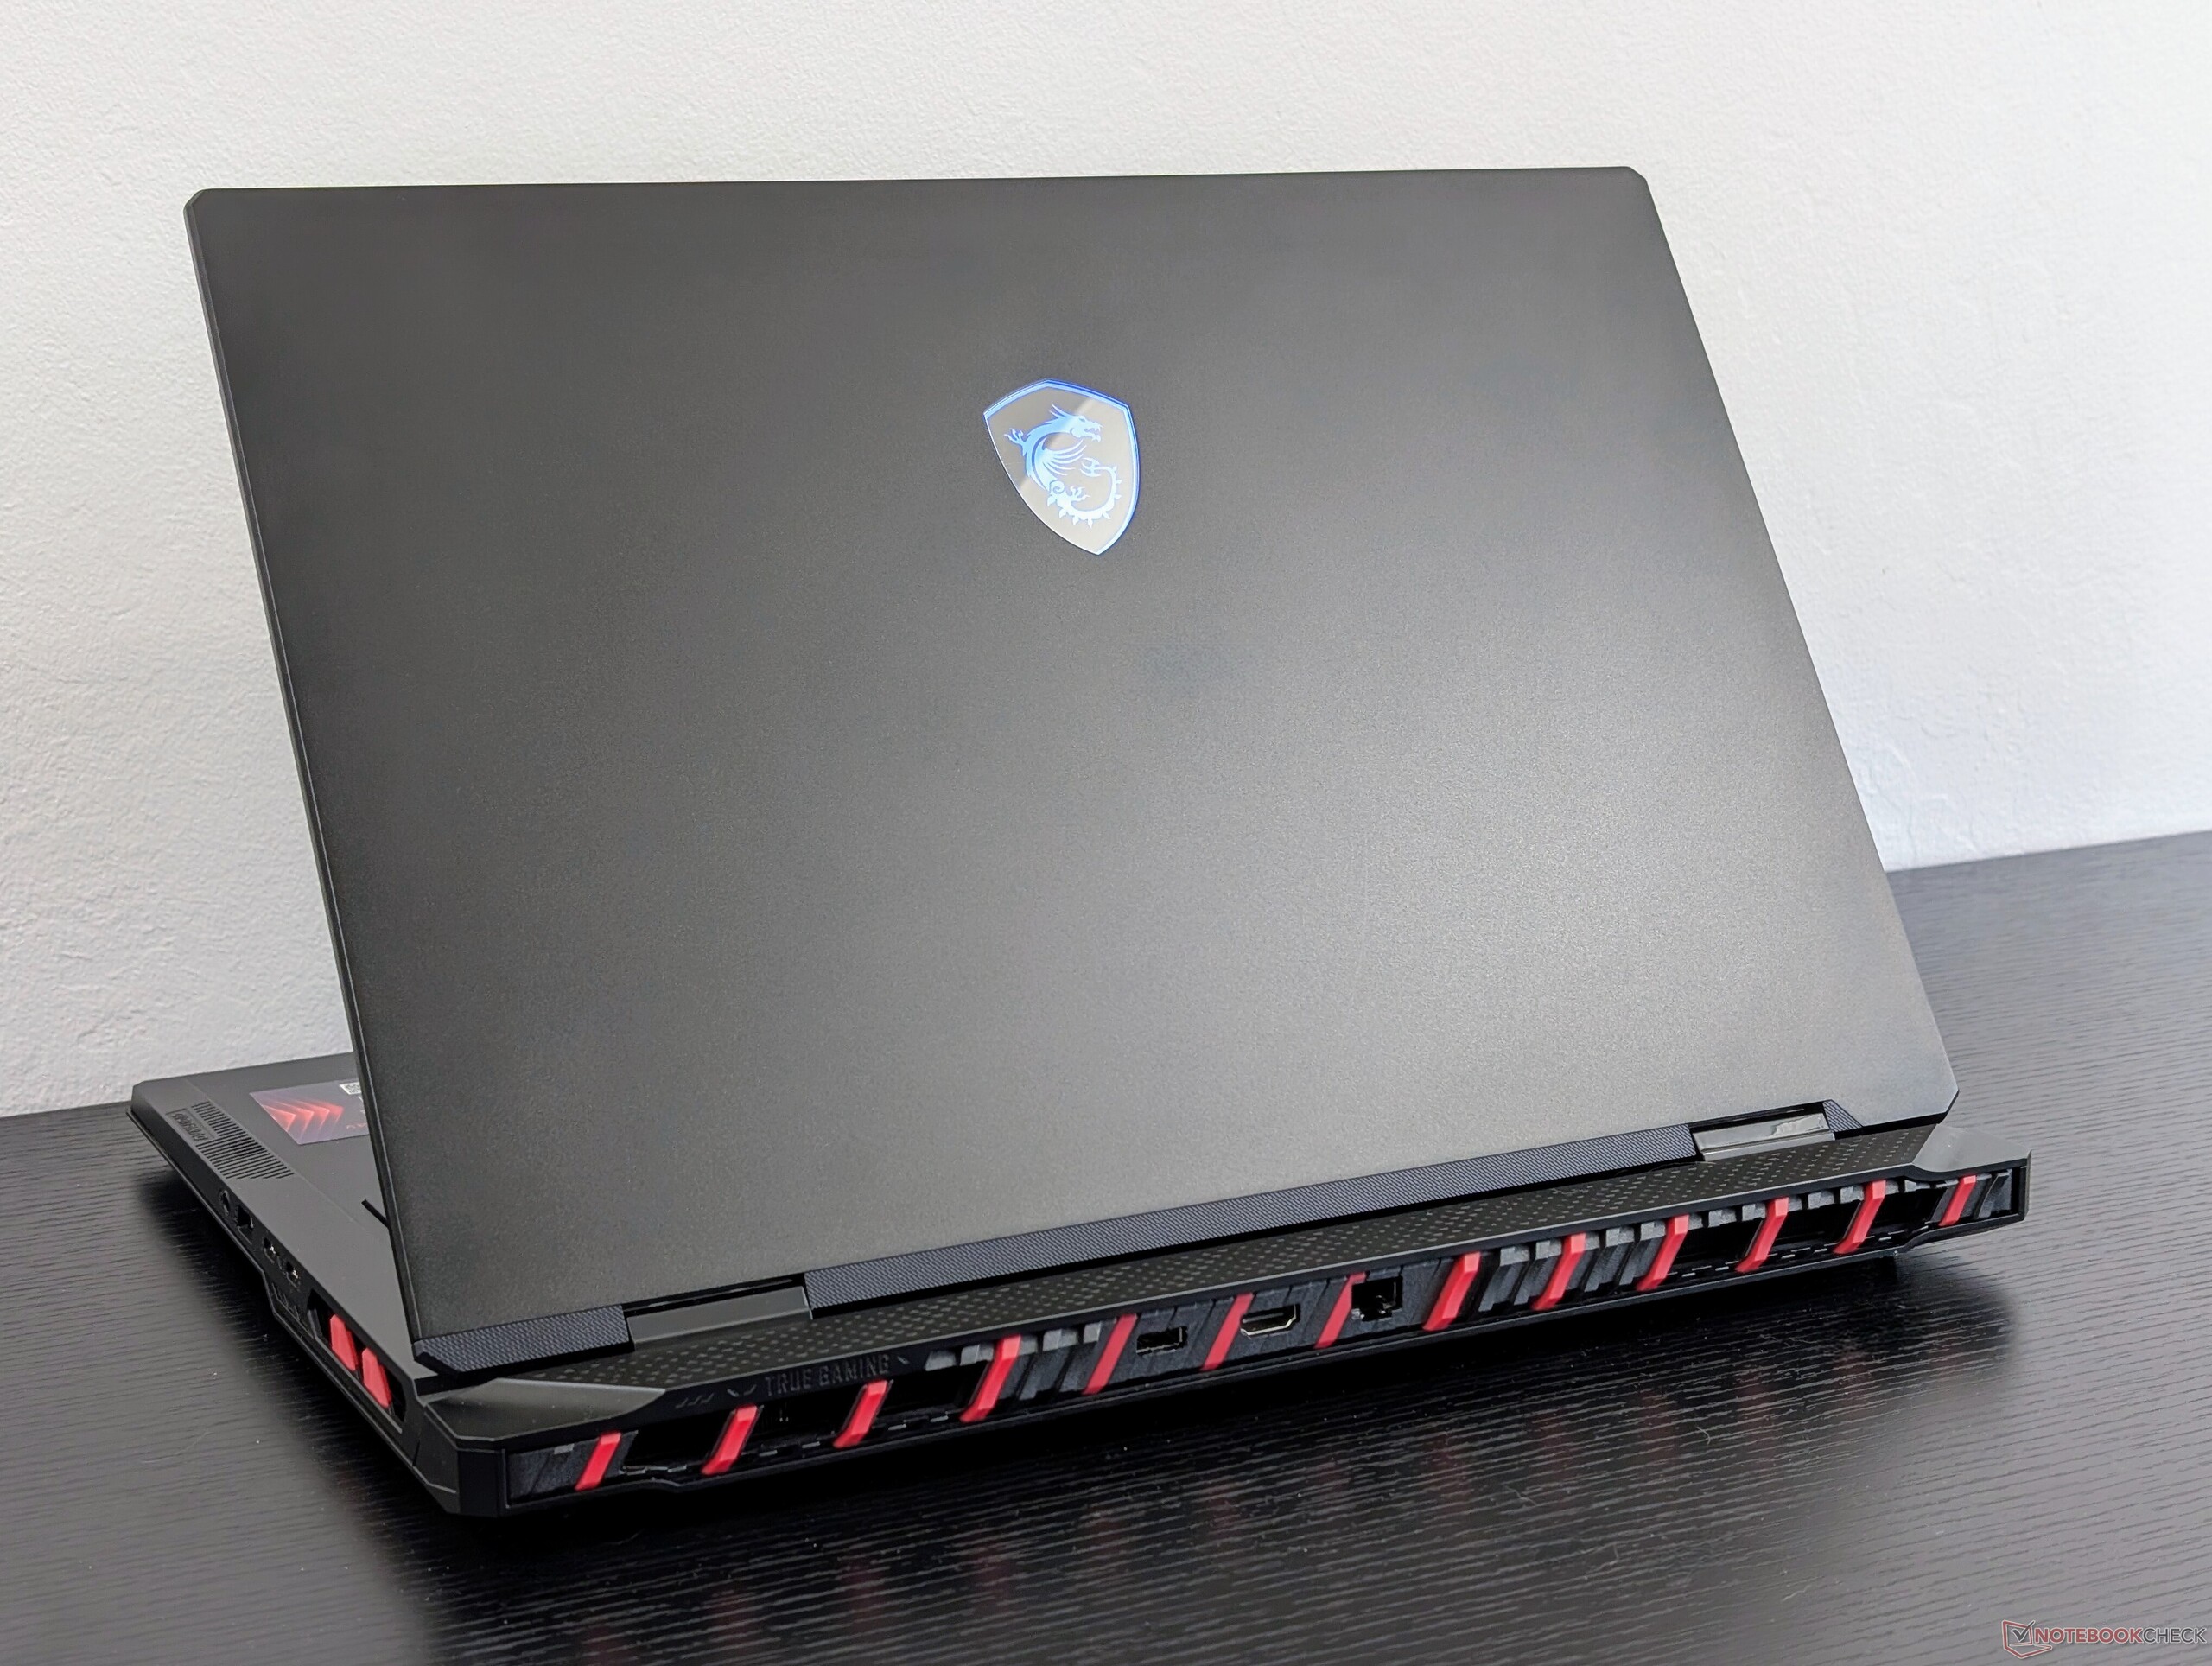
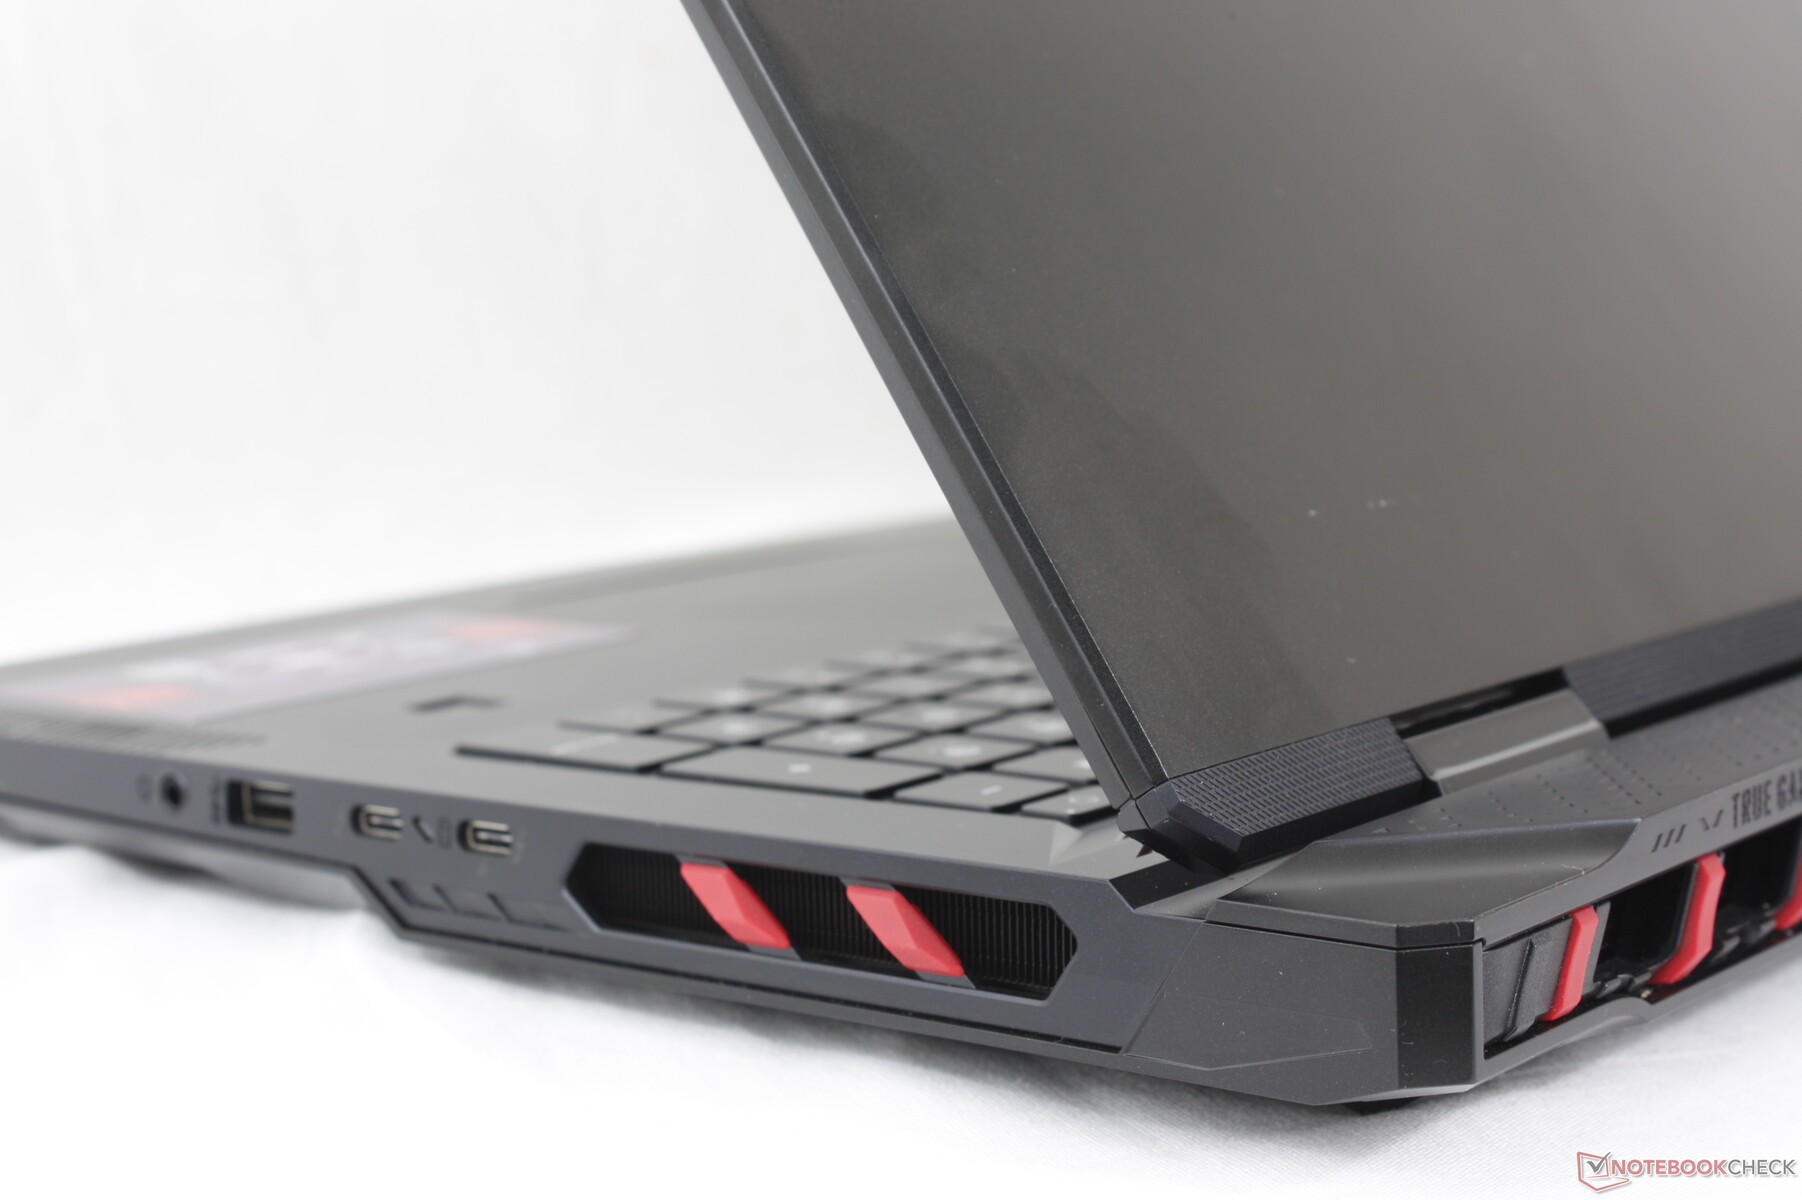
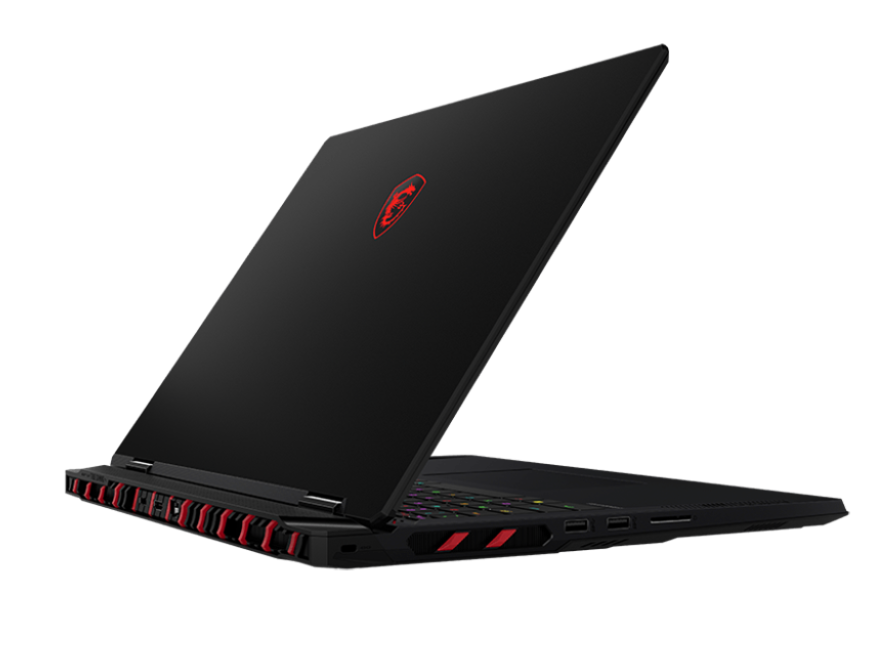
Case - Från blå drake till röd
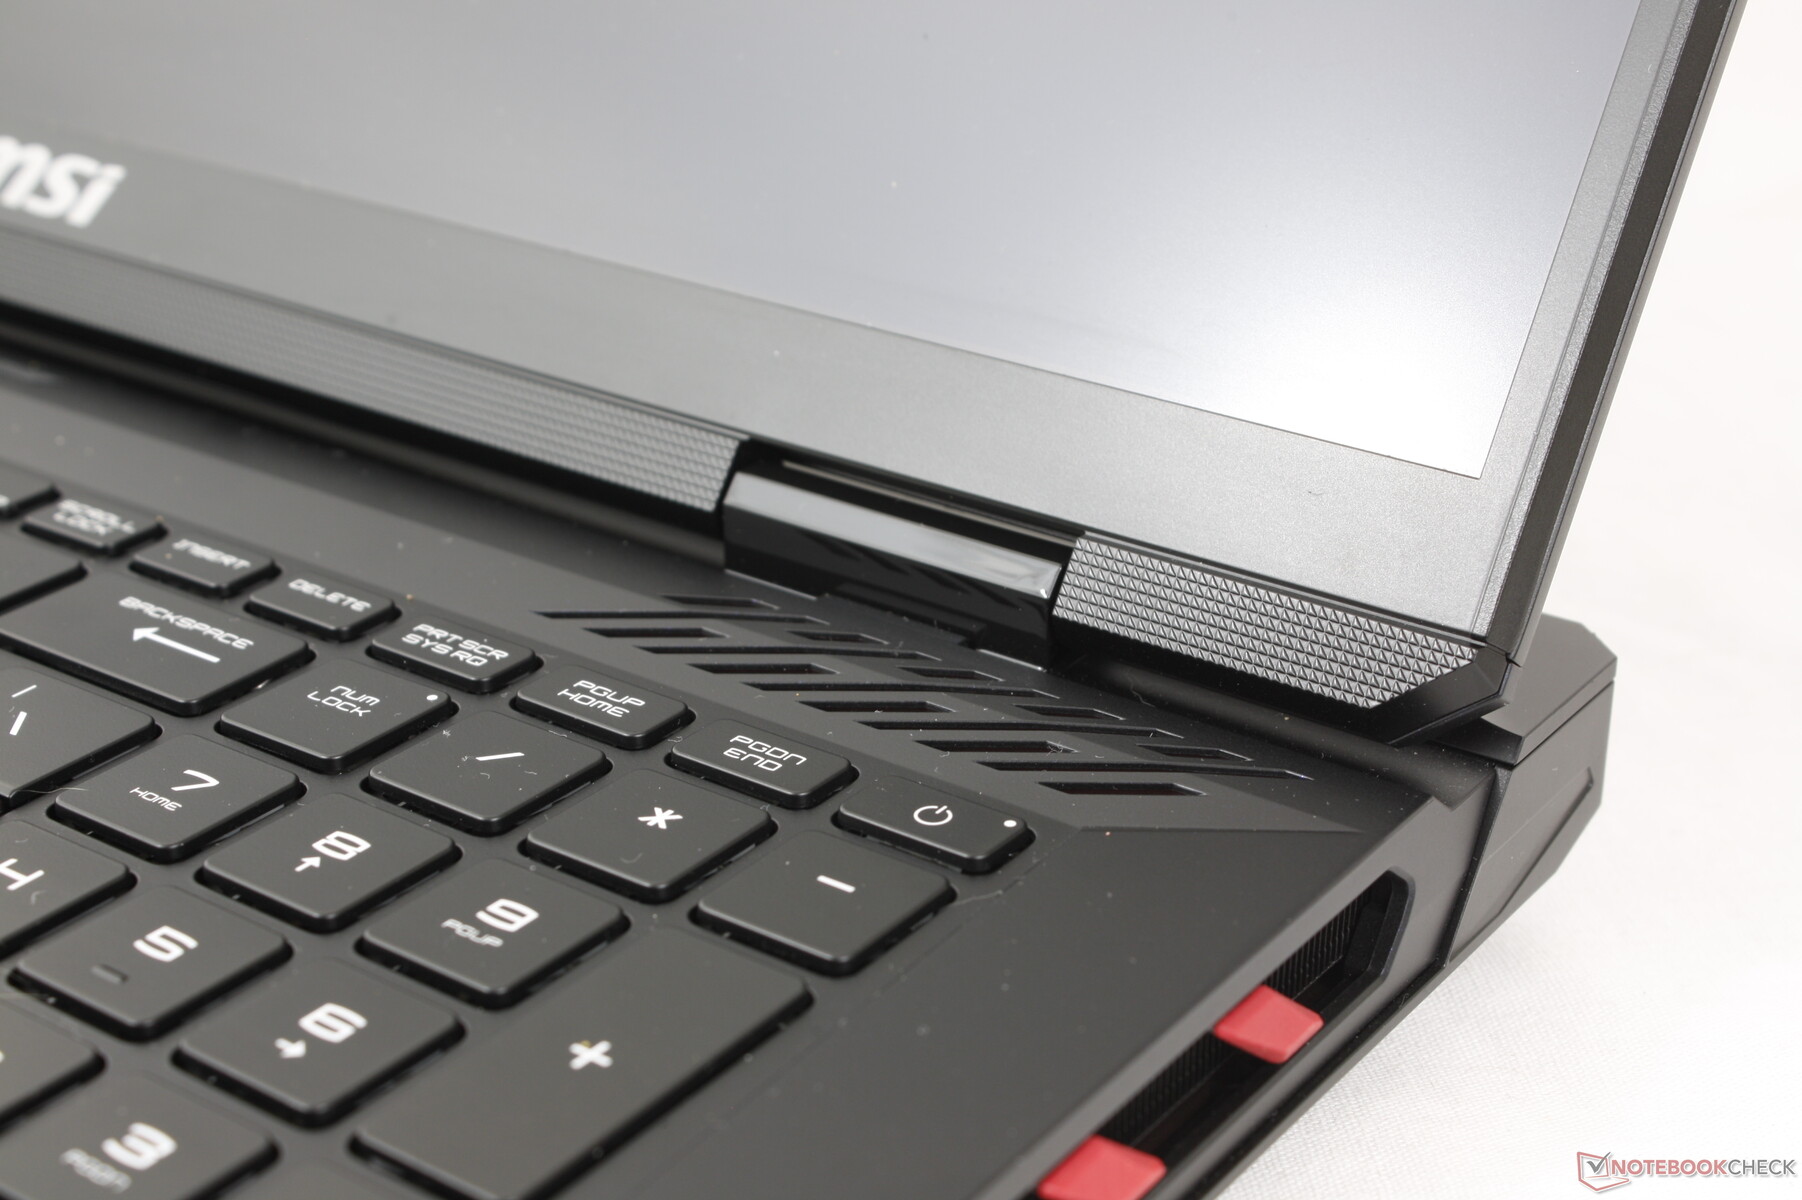
Chassit är ett derivat av Titan 18 HX. De röda accenterna på Titan är istället blå på den nya Raider och de flesta ytor är kolsvarta istället för grå eller silver för ett generellt mörkare utseende. MSI har också lagt till en LED-list längs systemets framkant, något som saknades på Titan. Förändringarna är till stor del estetiska och därför känns Raider fortfarande lika stark som sitt dyrare syskon eftersom de underliggande materialen och skelettet är desamma.
Den kanske mest anmärkningsvärda visuella skillnaden mellan Raider 18 HX och Titan 18 HX är det omdesignade tangentbordsdäcket. Medan Titan 18 HX har ett plattare däck med en snygg glaspanel som sträcker sig över handledsstöden och klickplattan, tar Raider ett mer traditionellt tillvägagångssätt utan glas och bara en grundläggande klickplatta.
Mått och vikt är i stort sett identiska med Titan 18 HX trots alla yttre skillnader mellan dem. Modellen ligger därför i mitten av paketet när det gäller bärbarhet, eftersom alternativ som Alienware m18 R2 är tyngre och större medan ROG Strix G18 eller Blade 18 var och en är mycket lättare.
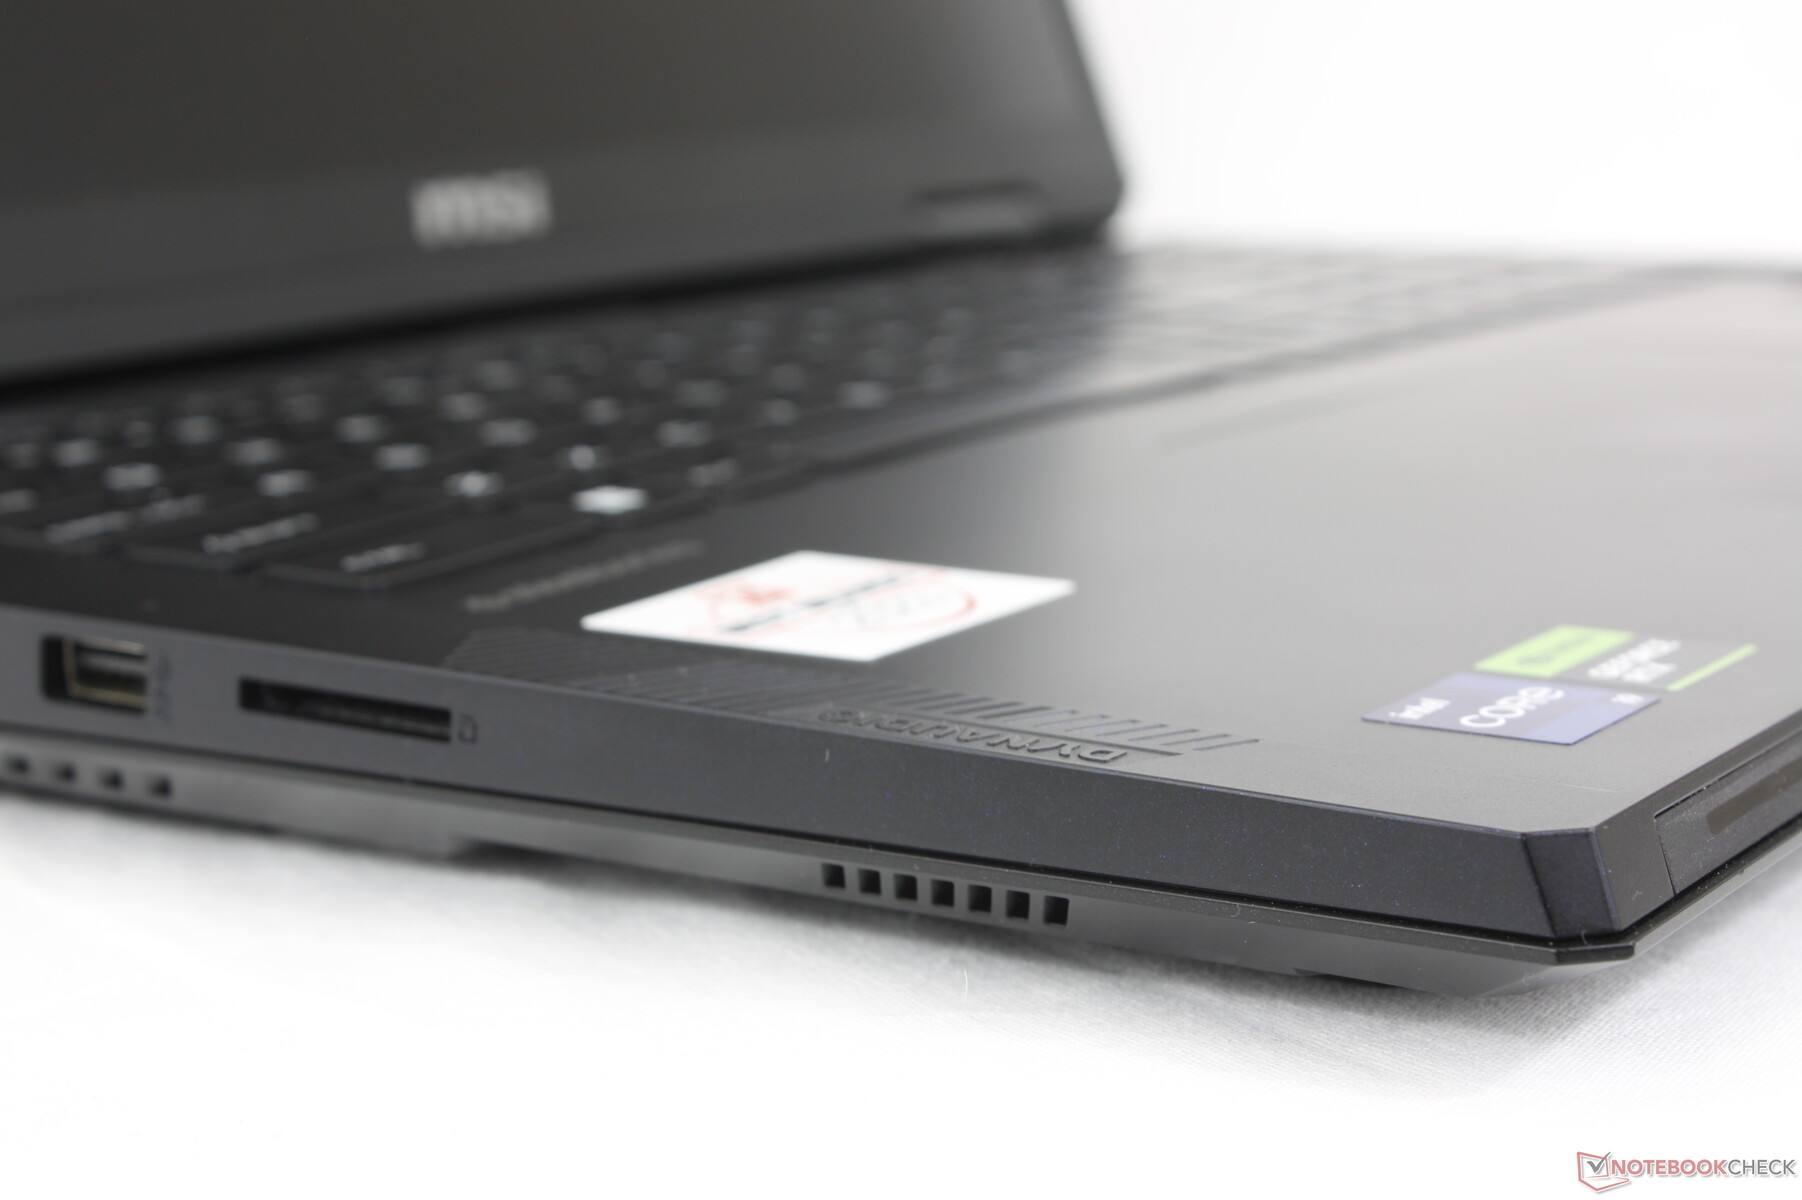
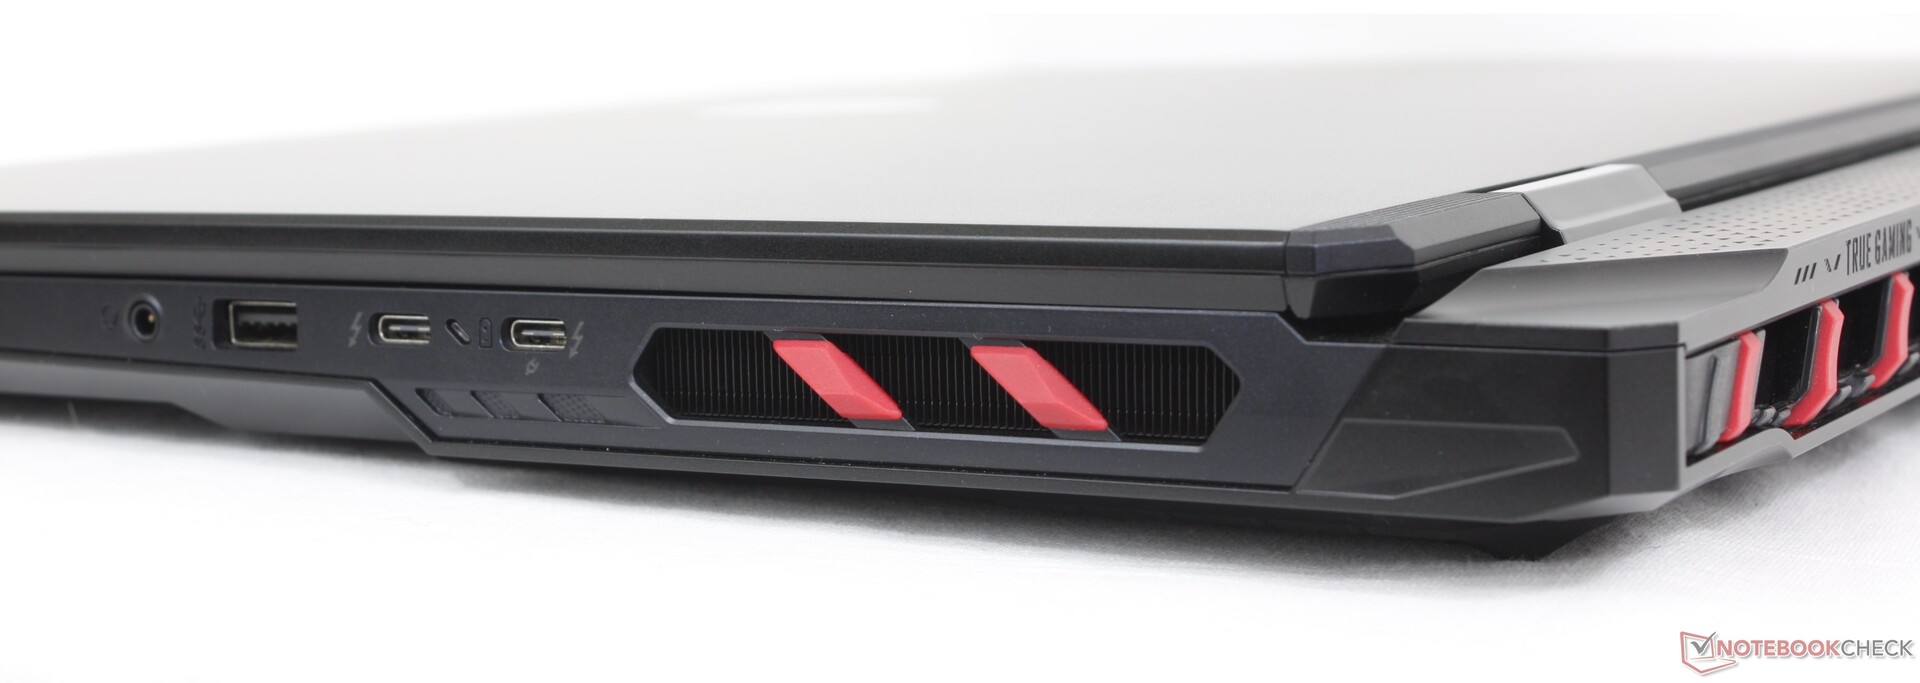
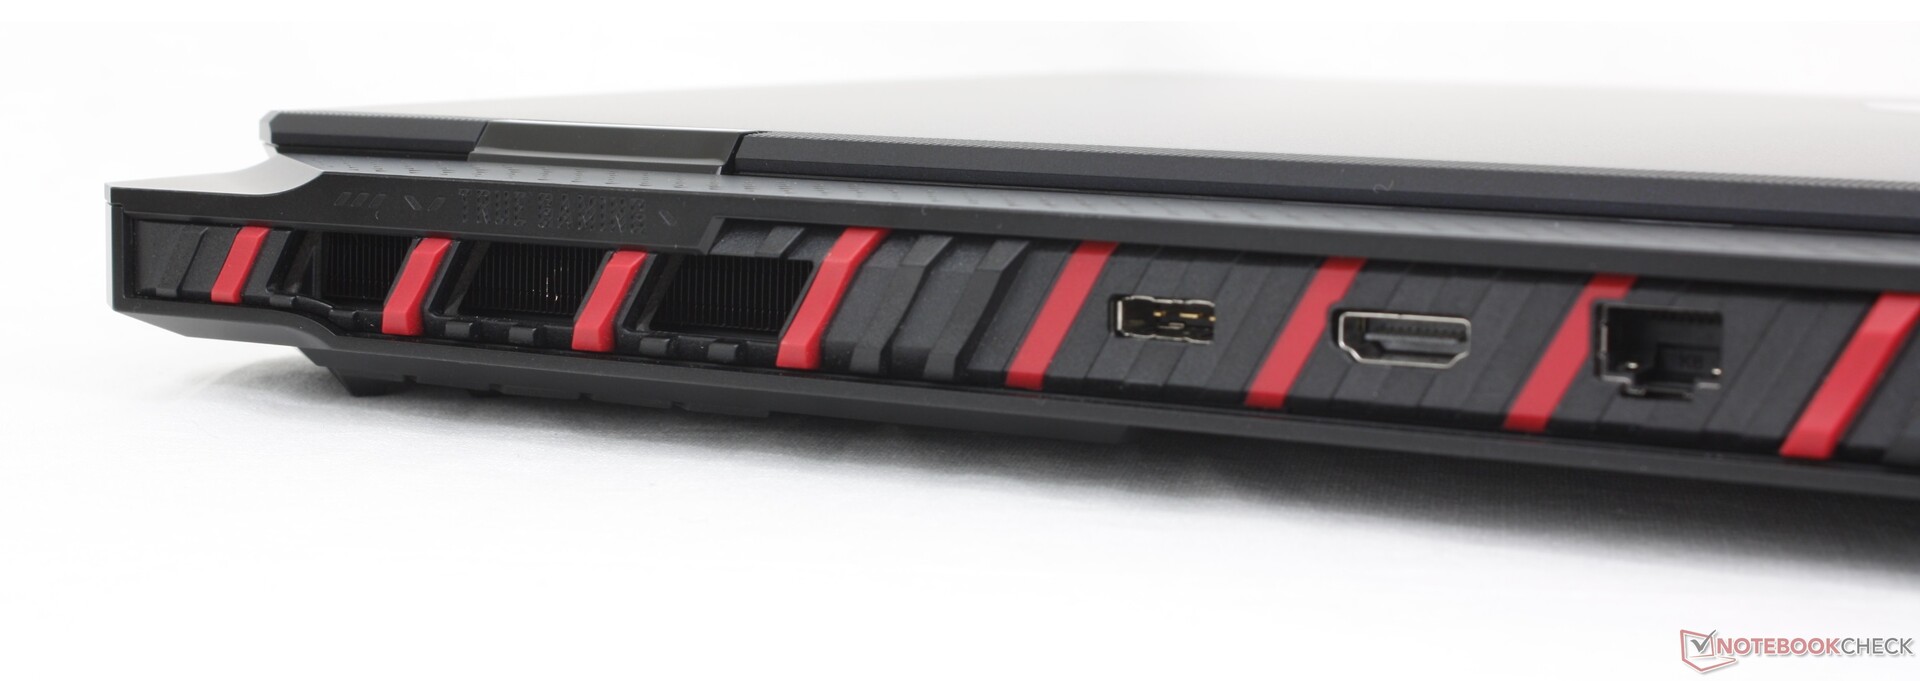
Anslutningsmöjligheter
Portar och positionering är identiska med Titan 18 HX, vilket är en stor ledtråd om vad du kan förvänta dig under huven. De integrerade alternativen är jämförbara med vad du hittar på Blade 18 eller ROG Strix G18 om än i mycket olika arrangemang.
Tänk på att endast en av de två USB-C-portarna stöder Power Delivery. Båda är annars kompatibla med DisplayPort.

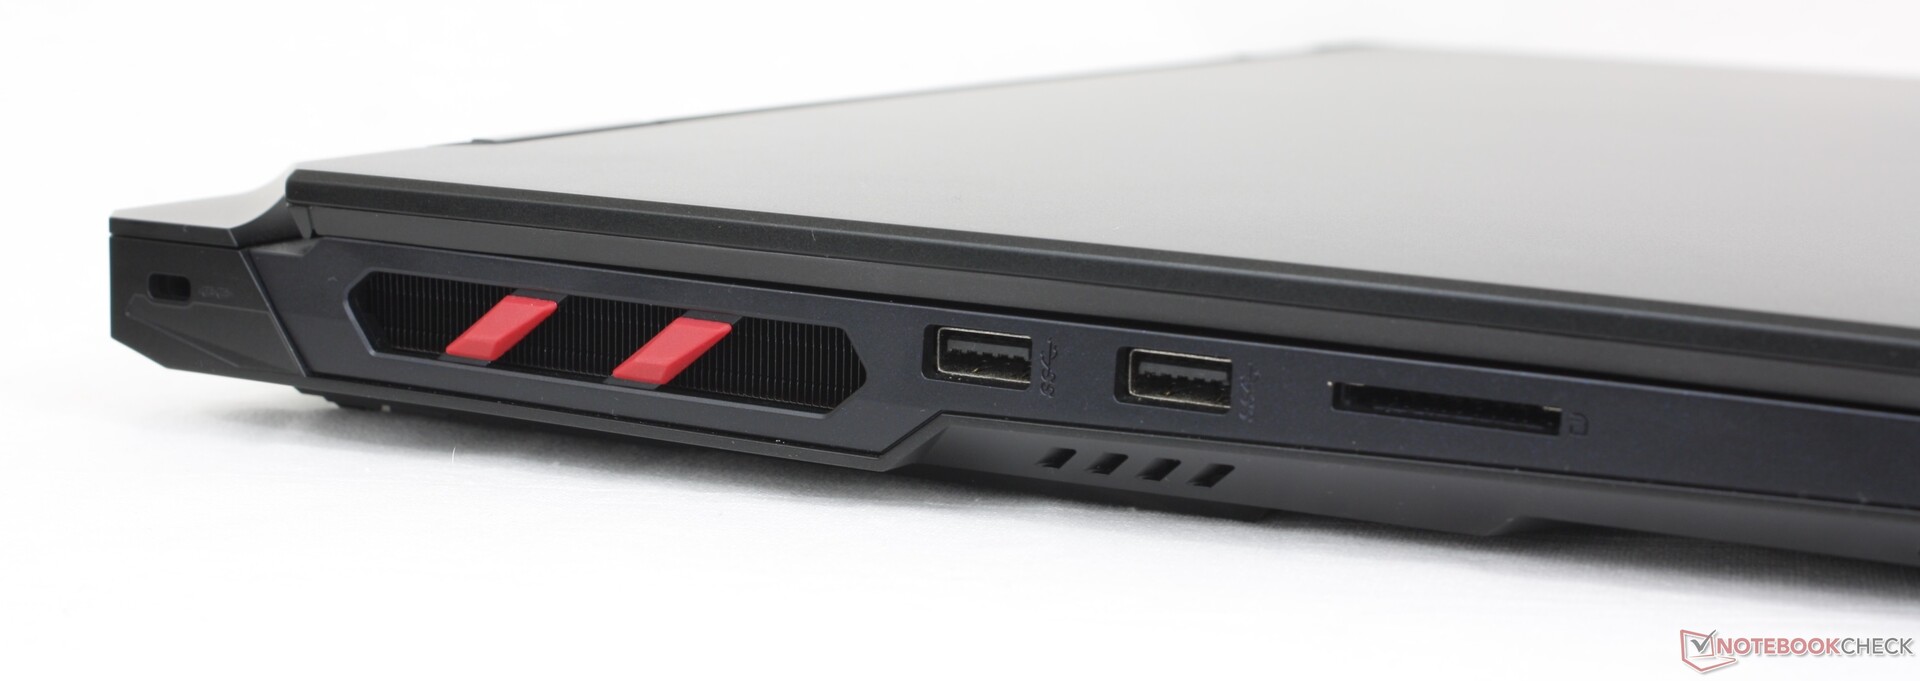
SD-kortläsare
Med cirka 90 MB/s är den integrerade SD-läsaren hyfsad men i övrigt långsam i förhållande till det höga priset på Raider 18 HX. SD-kortläsarna på Razer Blade 18 eller Alienware m18 R2är till exempel över två gånger snabbare i jämförelse.
| SD Card Reader | |
| average JPG Copy Test (av. of 3 runs) | |
| Alienware m18 R2 (Toshiba Exceria Pro SDXC 64 GB UHS-II) | |
| Razer Blade 18 2024 RZ09-0509 (Toshiba Exceria Pro SDXC 64 GB UHS-II) | |
| Acer Predator Helios 18 PH18-72-98MW (AV PRO microSD 128 GB V60) | |
| MSI Raider 18 HX A14V (Toshiba Exceria Pro SDXC 64 GB UHS-II) | |
| MSI Titan 18 HX A14VIG (Toshiba Exceria Pro SDXC 64 GB UHS-II) | |
| maximum AS SSD Seq Read Test (1GB) | |
| Razer Blade 18 2024 RZ09-0509 (Toshiba Exceria Pro SDXC 64 GB UHS-II) | |
| Alienware m18 R2 (Toshiba Exceria Pro SDXC 64 GB UHS-II) | |
| MSI Titan 18 HX A14VIG (Toshiba Exceria Pro SDXC 64 GB UHS-II) | |
| MSI Raider 18 HX A14V (Toshiba Exceria Pro SDXC 64 GB UHS-II) | |
| Acer Predator Helios 18 PH18-72-98MW (AV PRO microSD 128 GB V60) | |
Kommunikation
Killer BE1750x levereras som standard med Wi-Fi 7 och Bluetooth 5.4-anslutning. Överföringshastigheterna är stabila och tillförlitliga när de kopplas ihop med vår testrouter Wi-Fi 6E.
Webbkamera
En 2 MP webbkamera med IR och fysisk slutare är standard precis som på Titan 18 HX. Intressant nog skulle kameran också uppvisa liknande ljusstyrkeproblem.


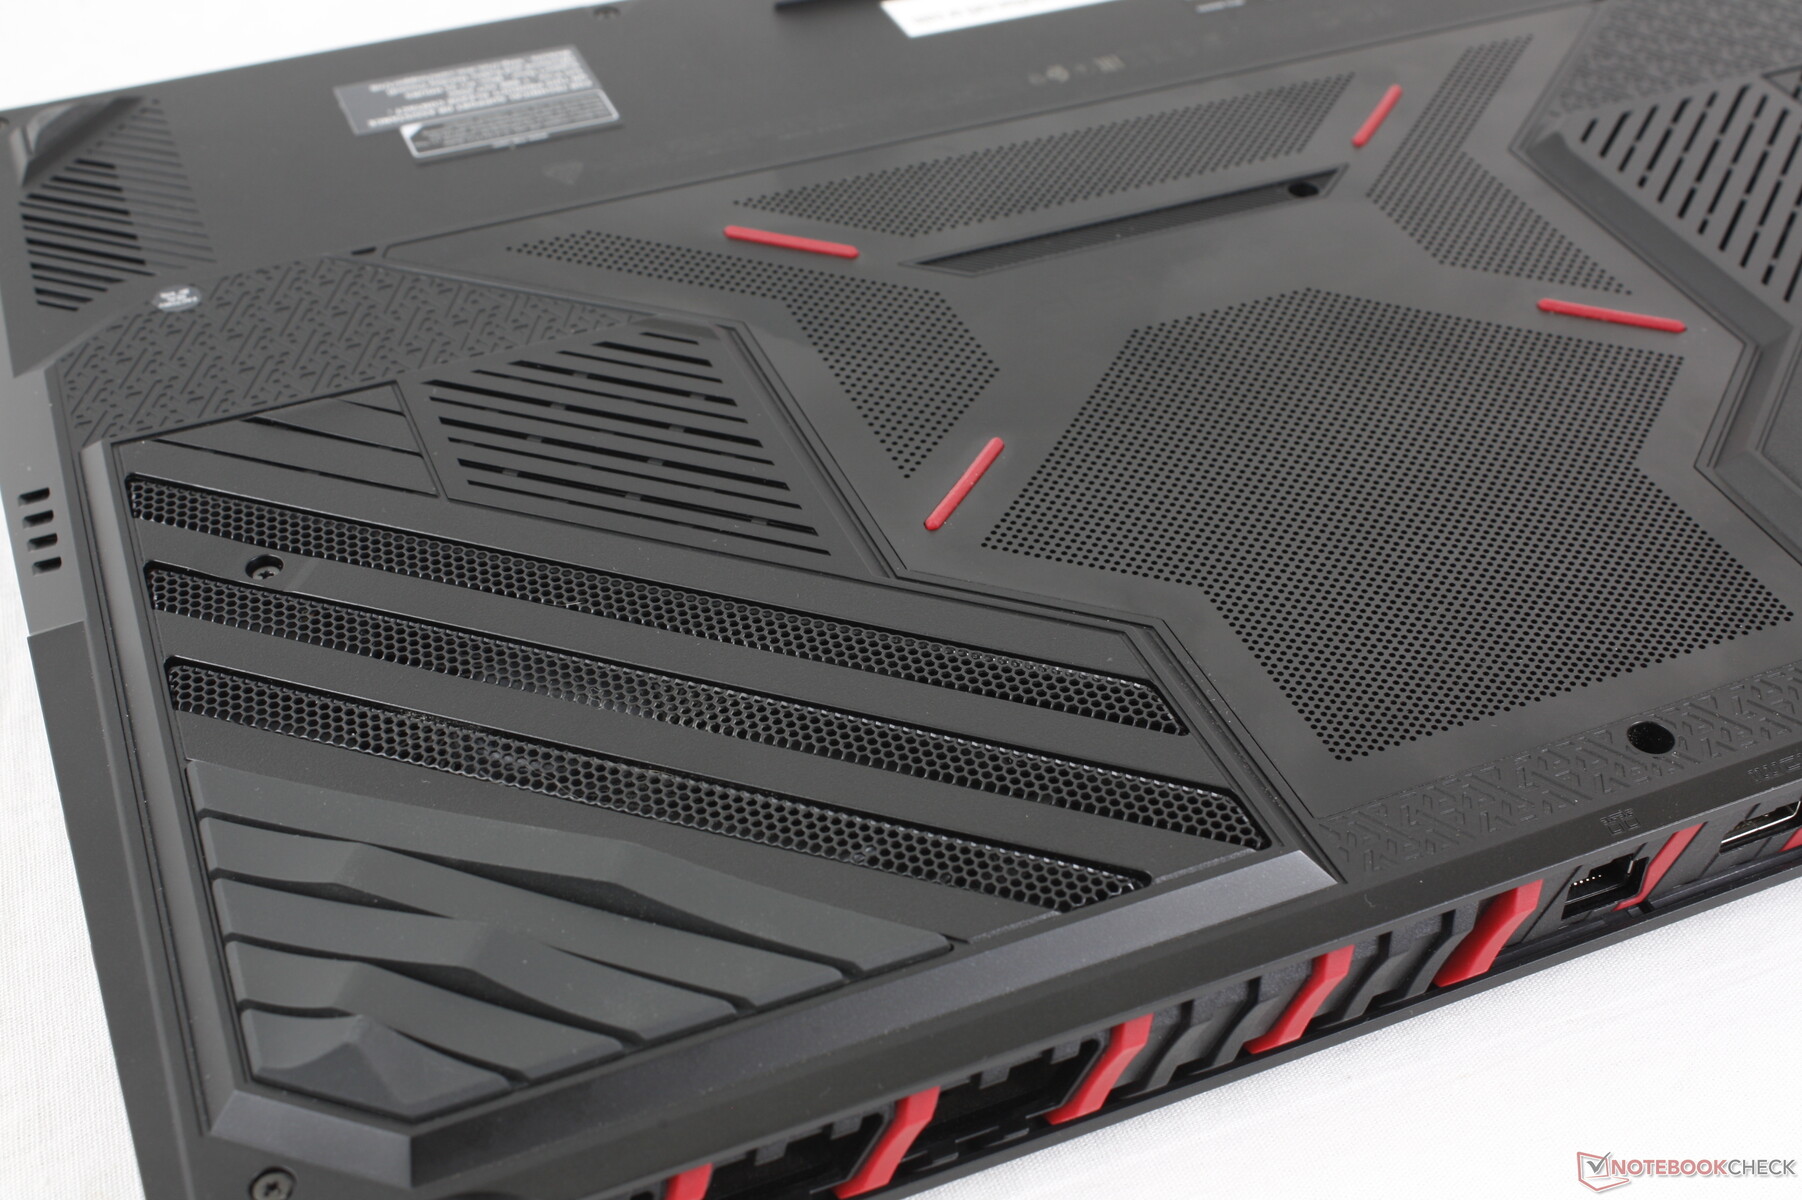
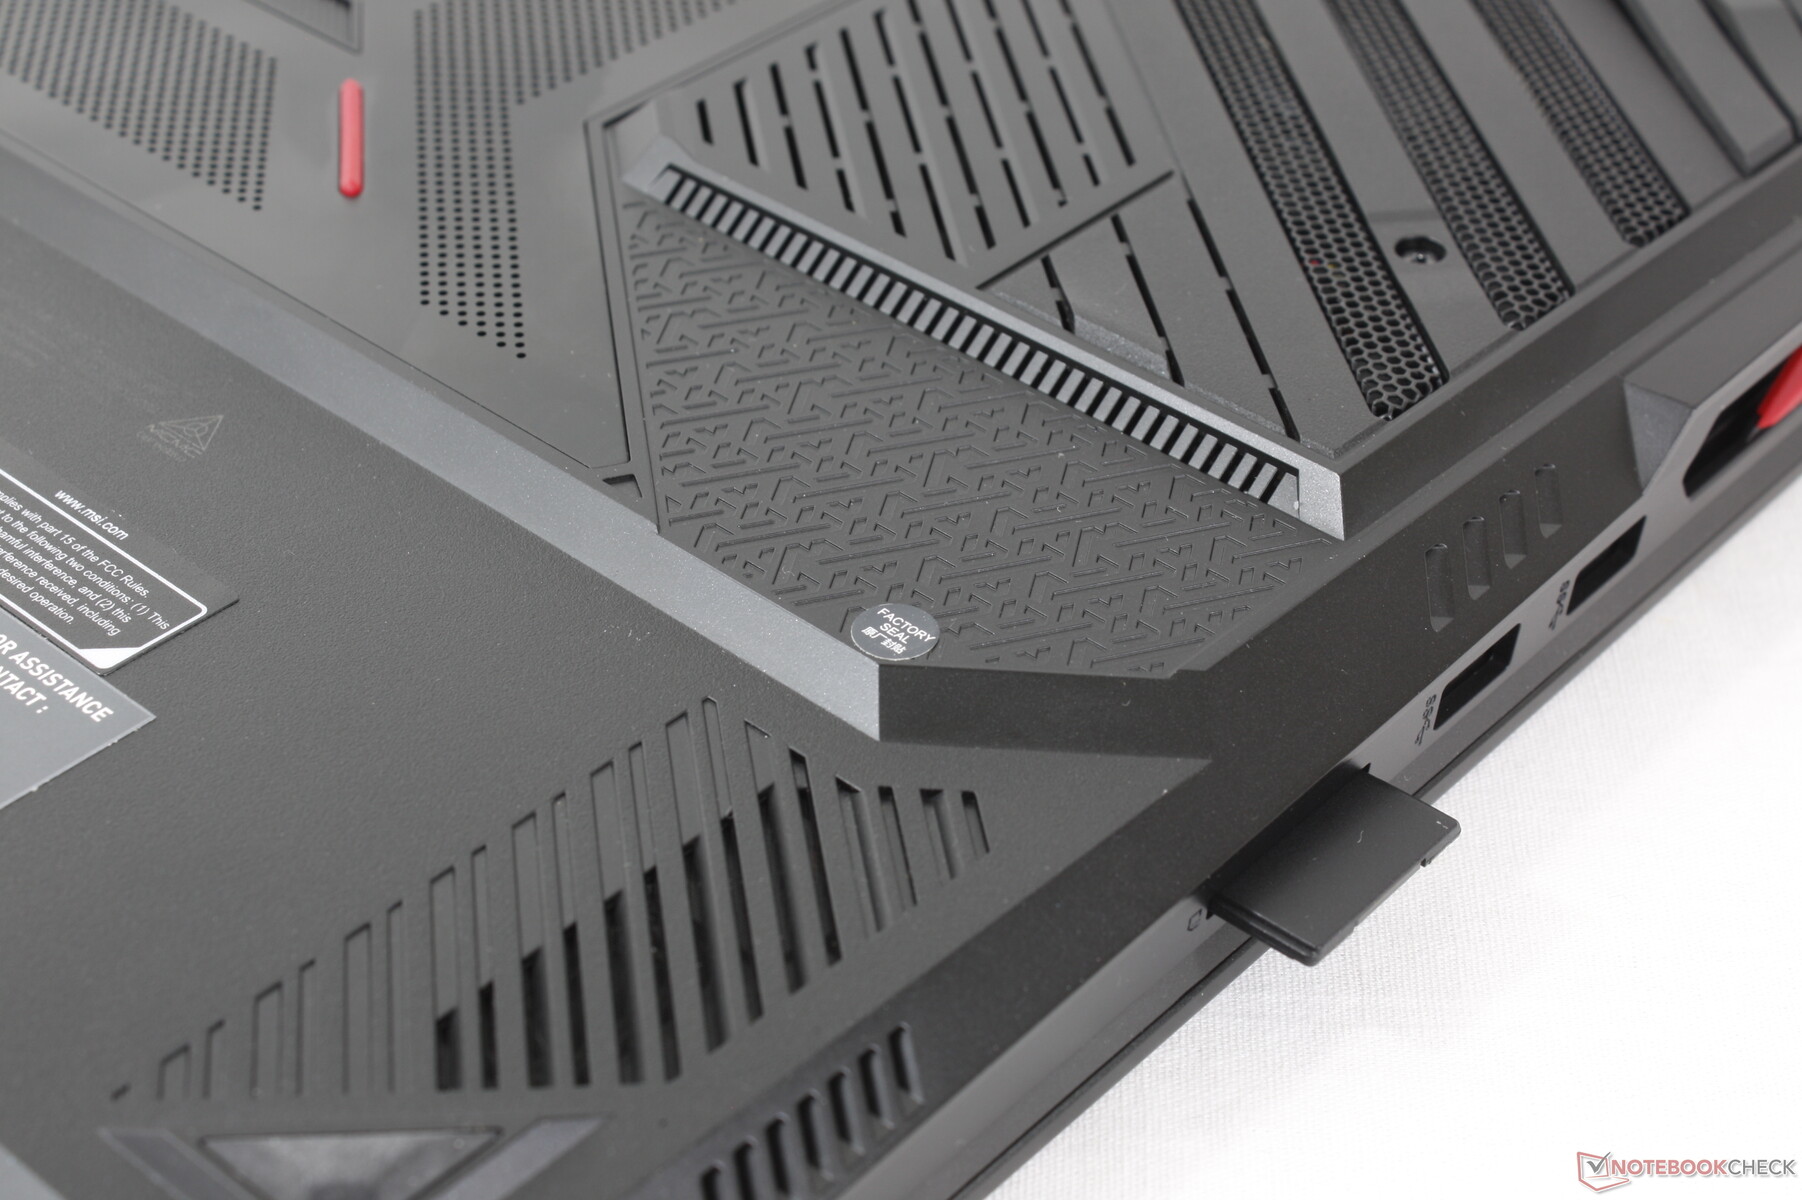
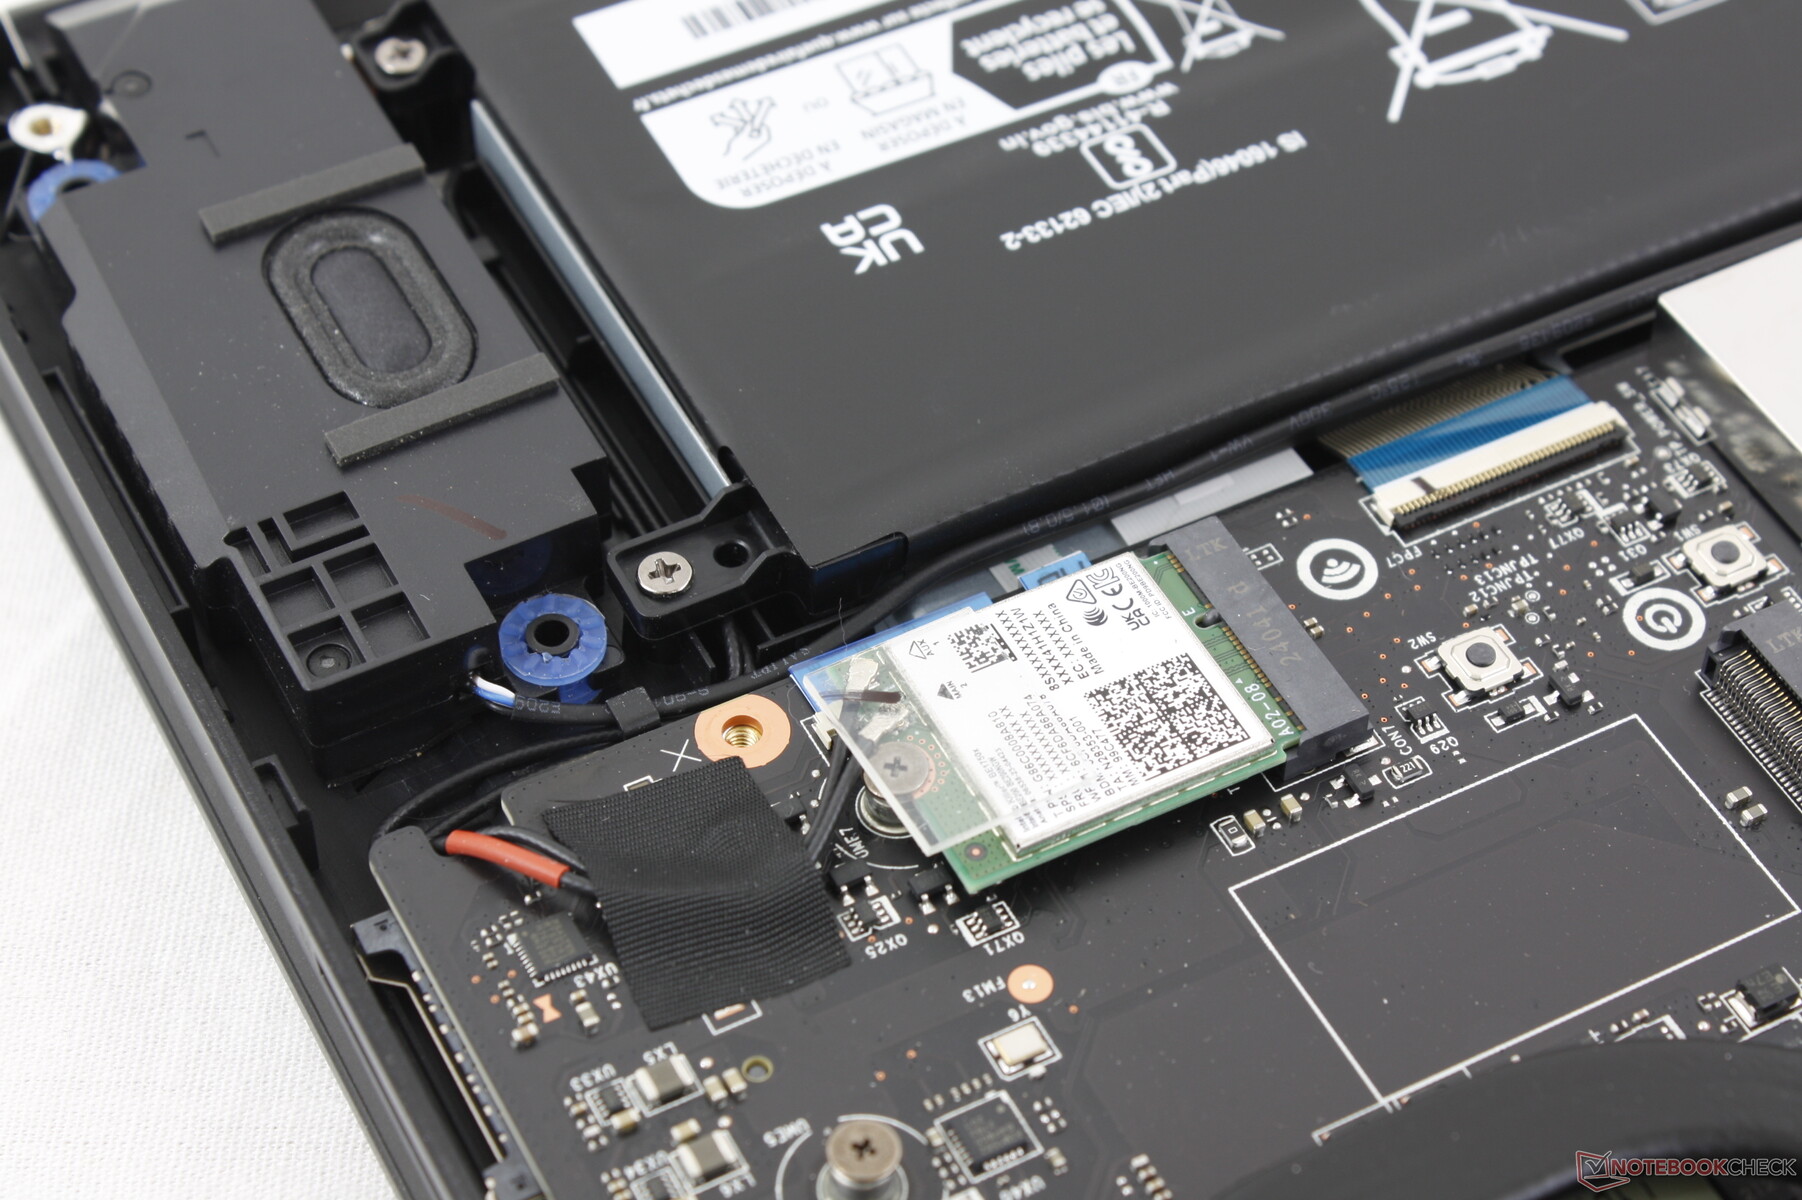
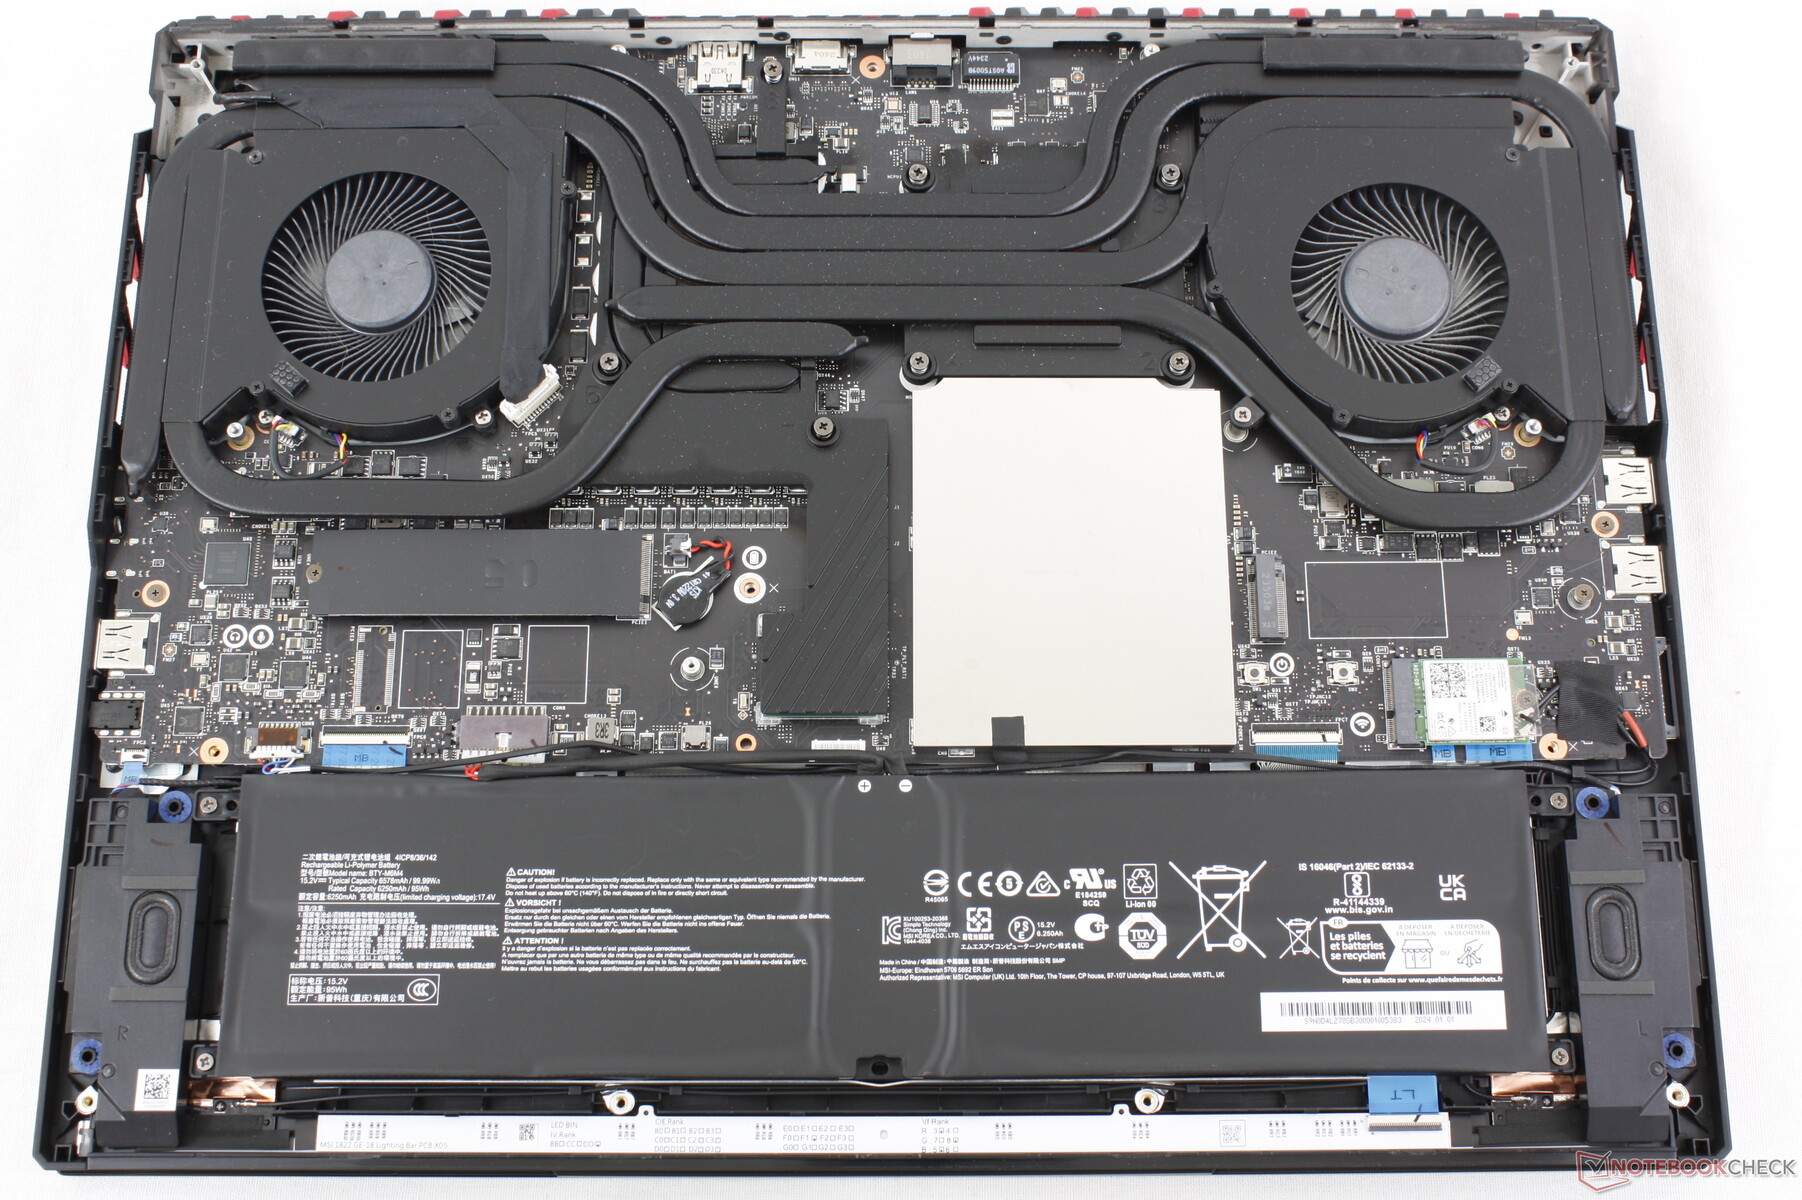
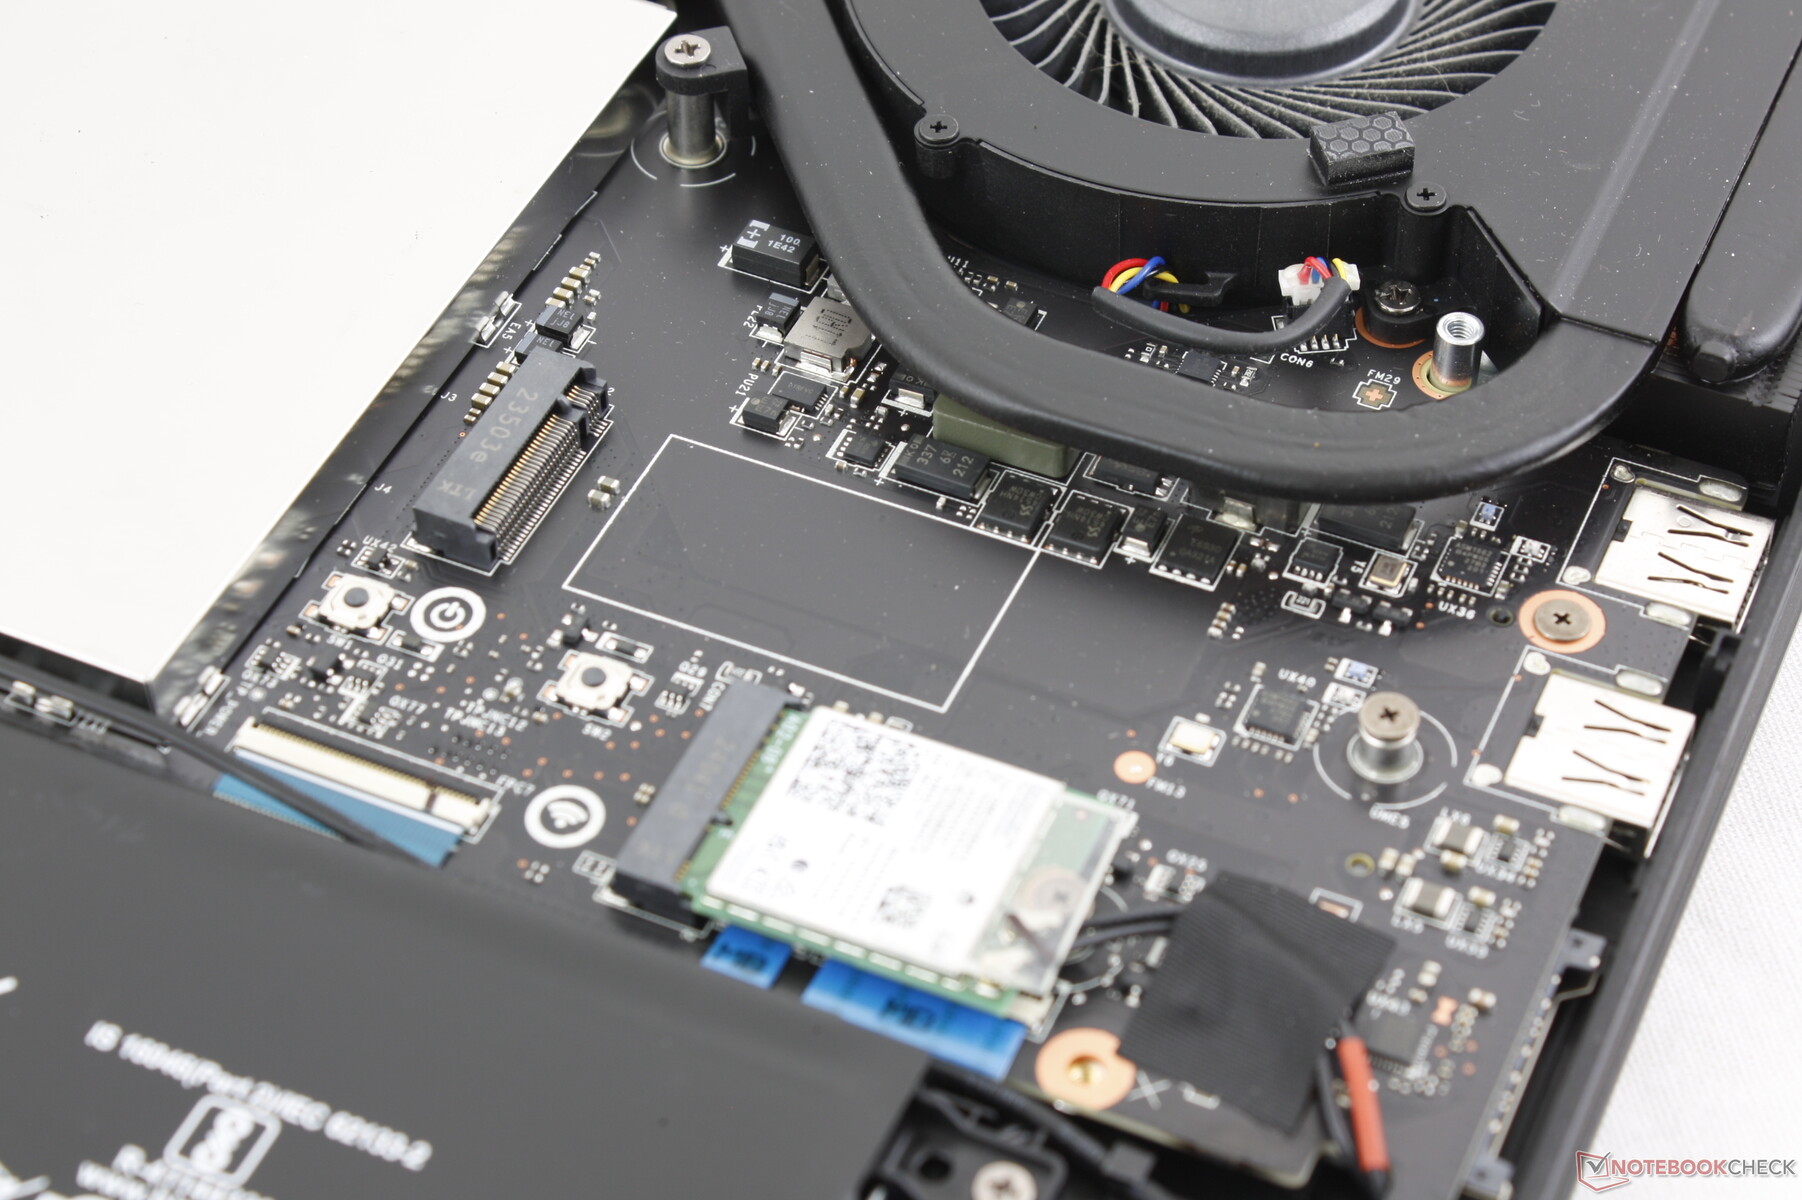
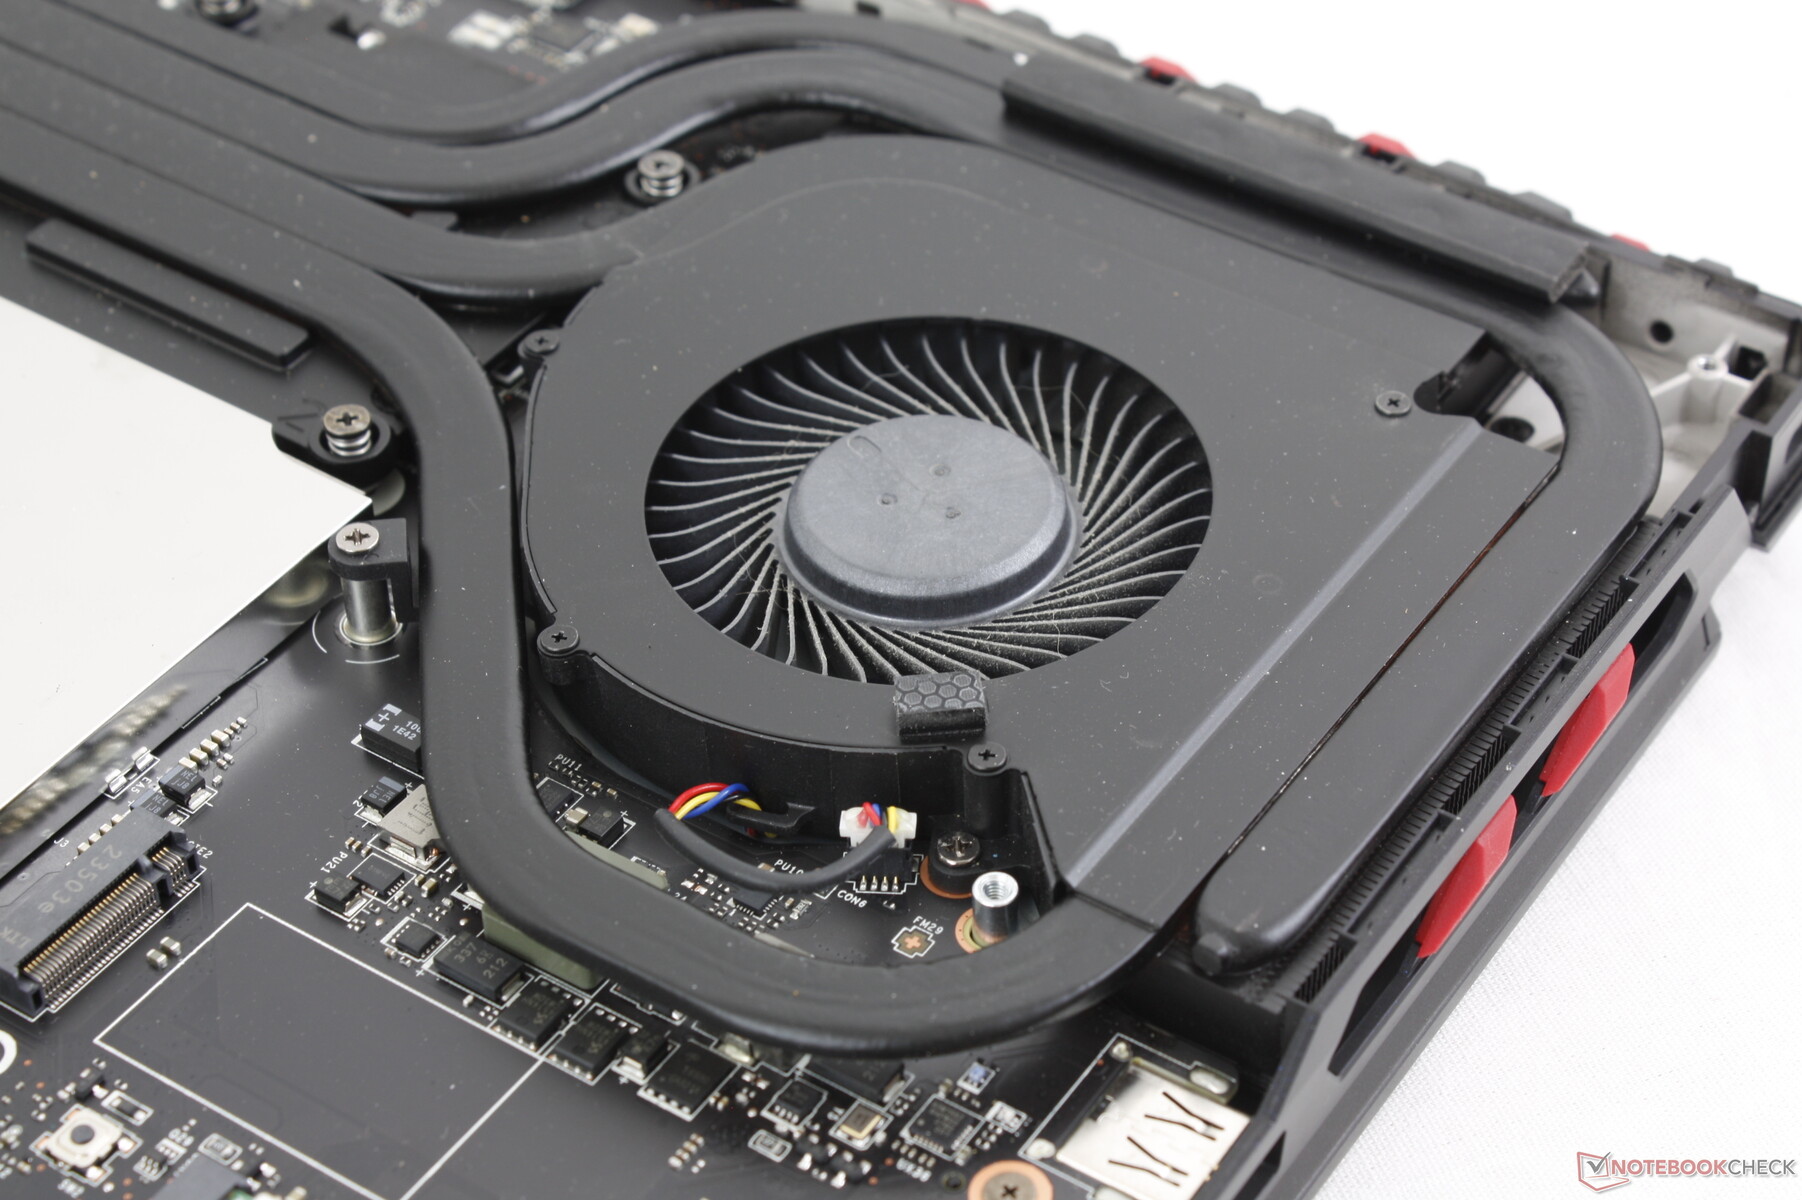
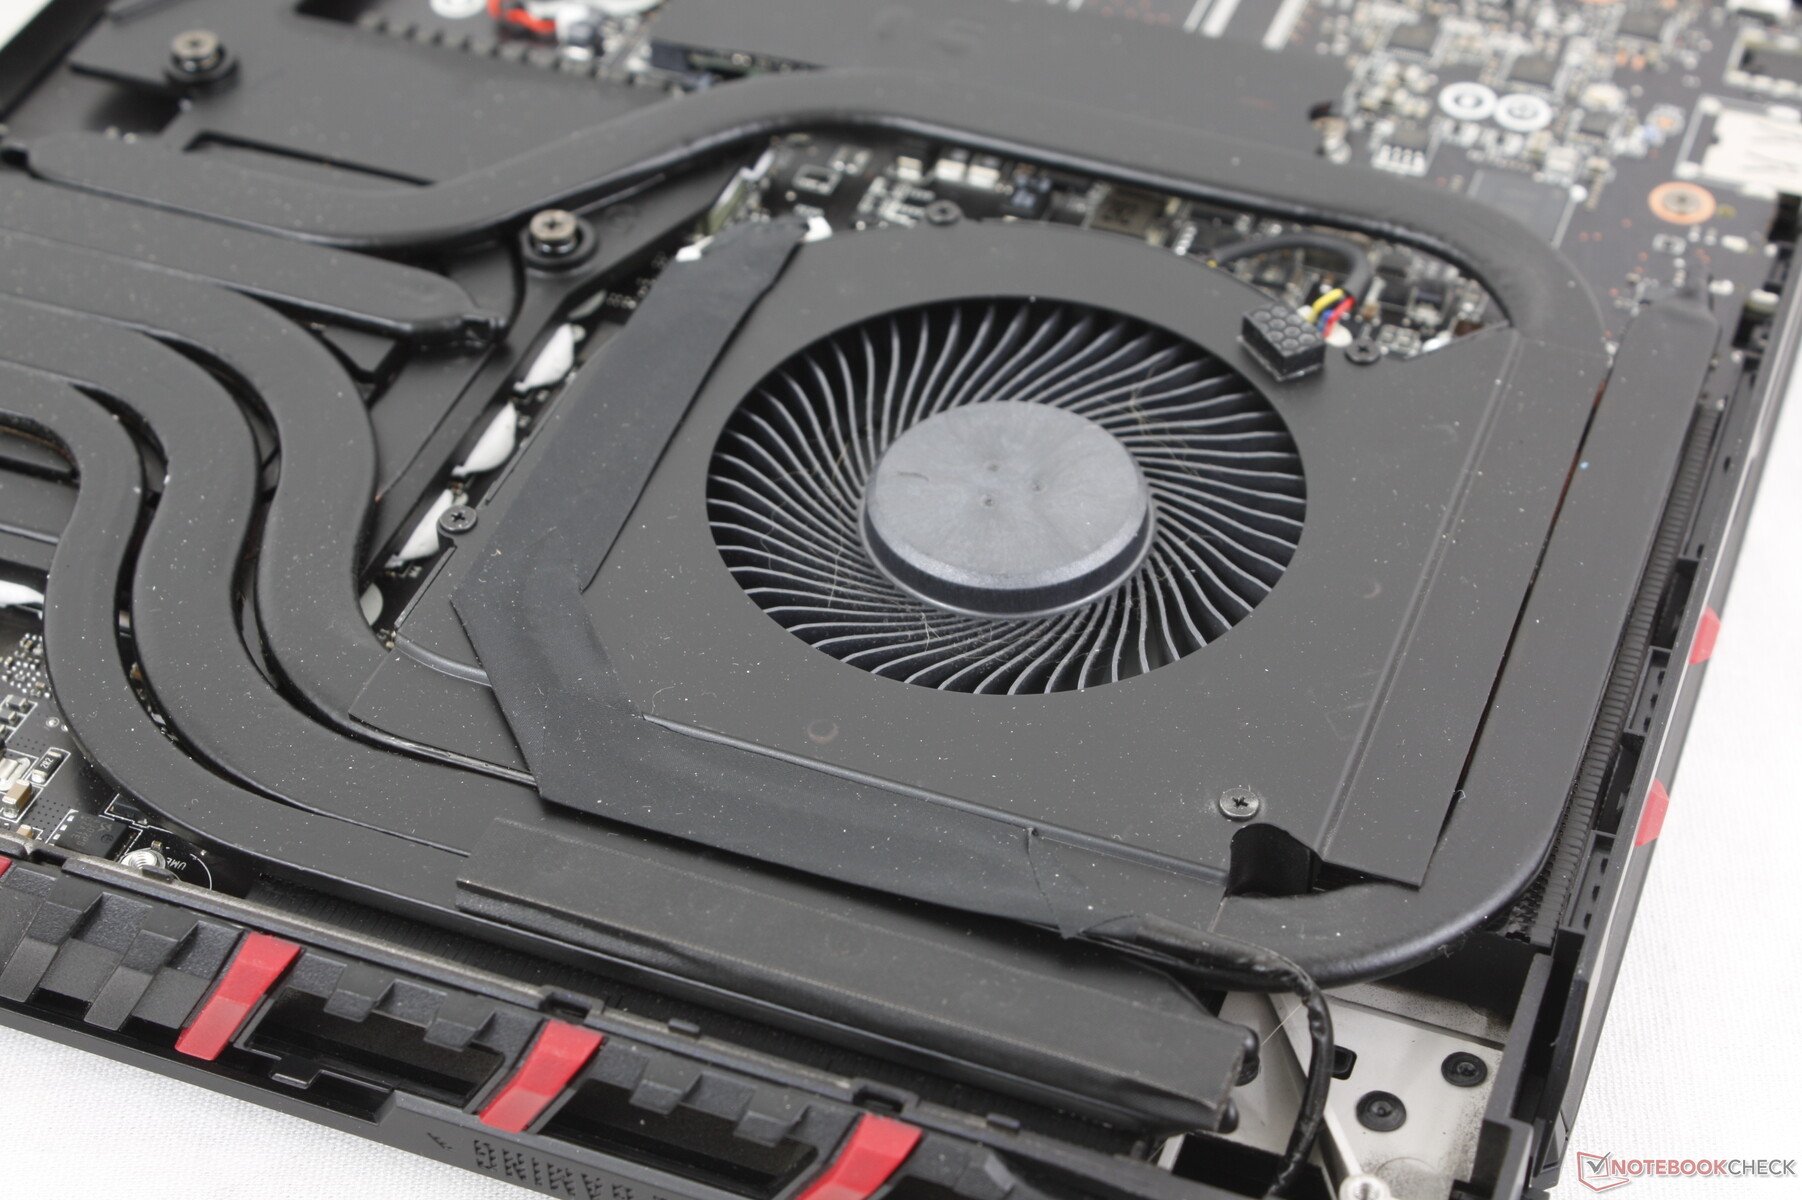
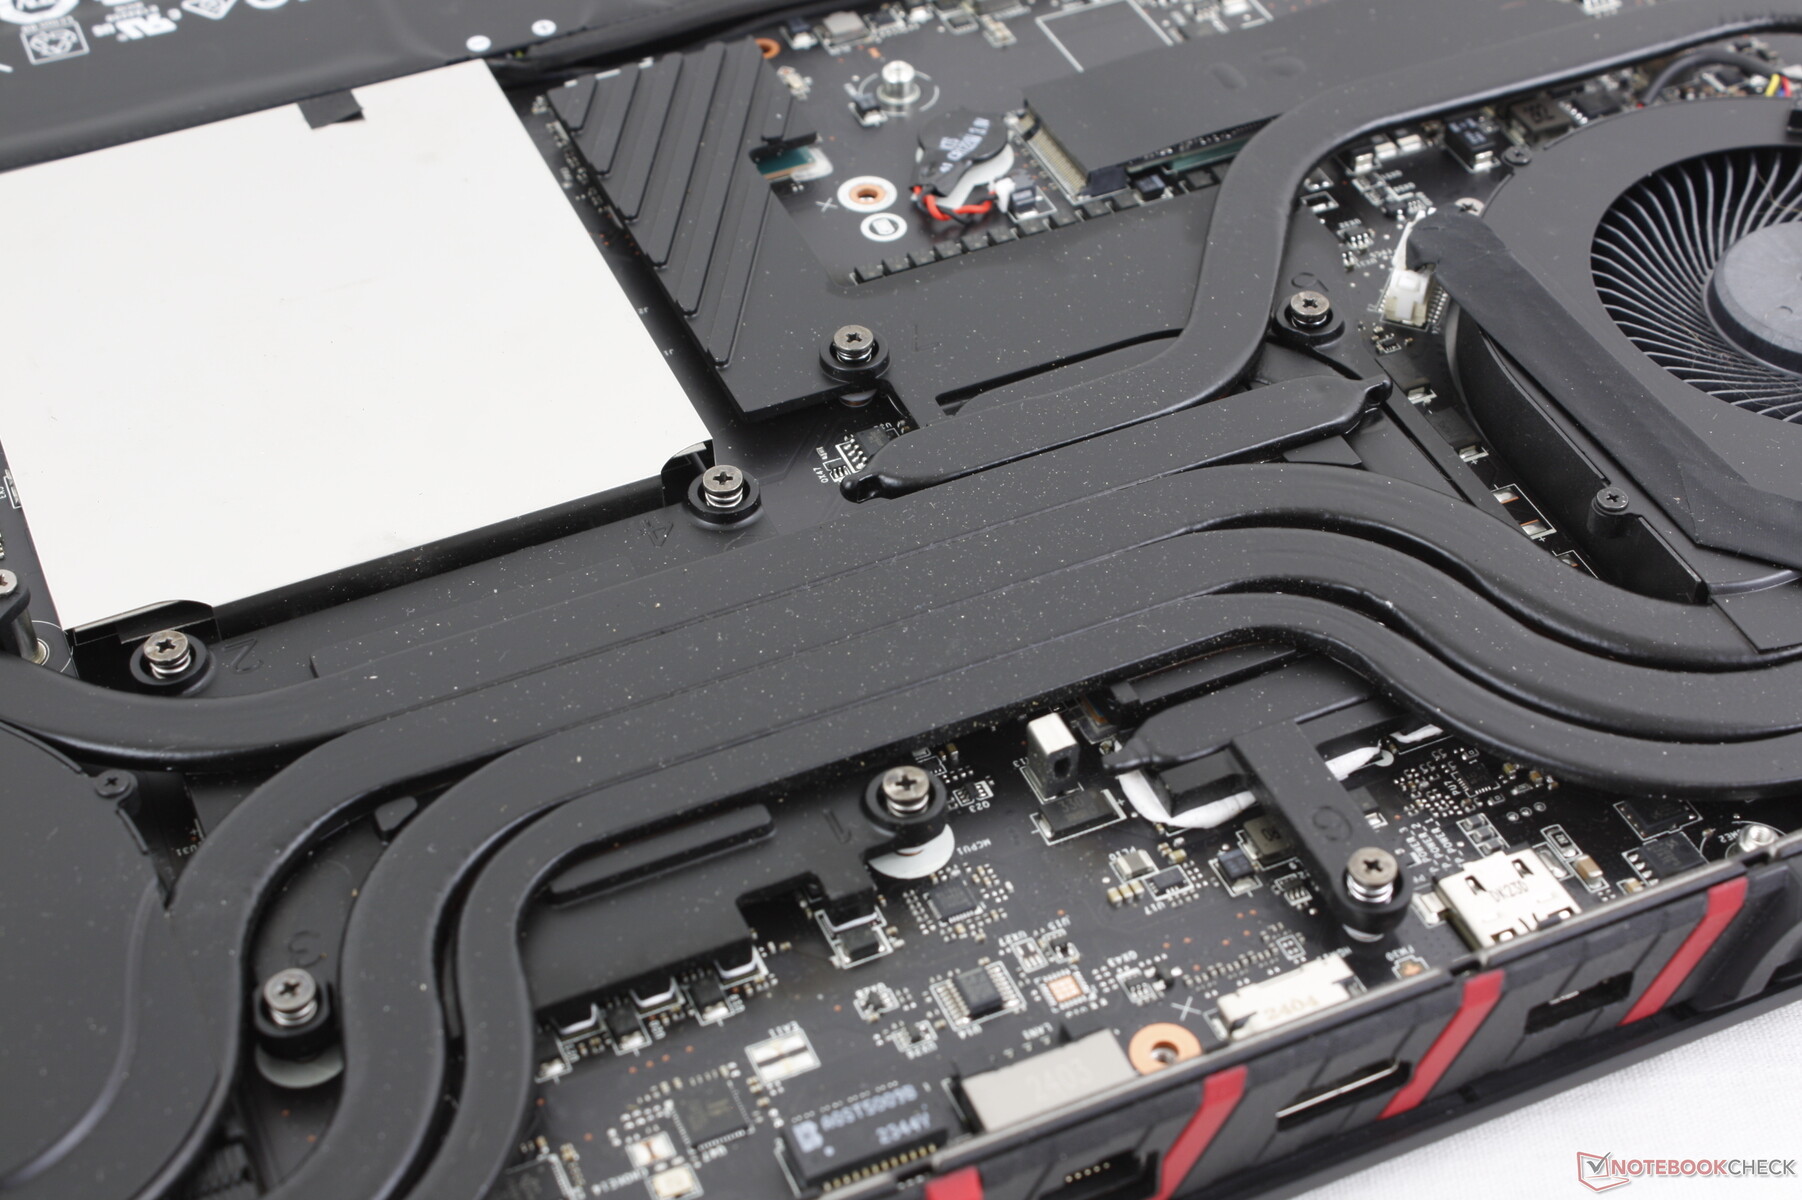
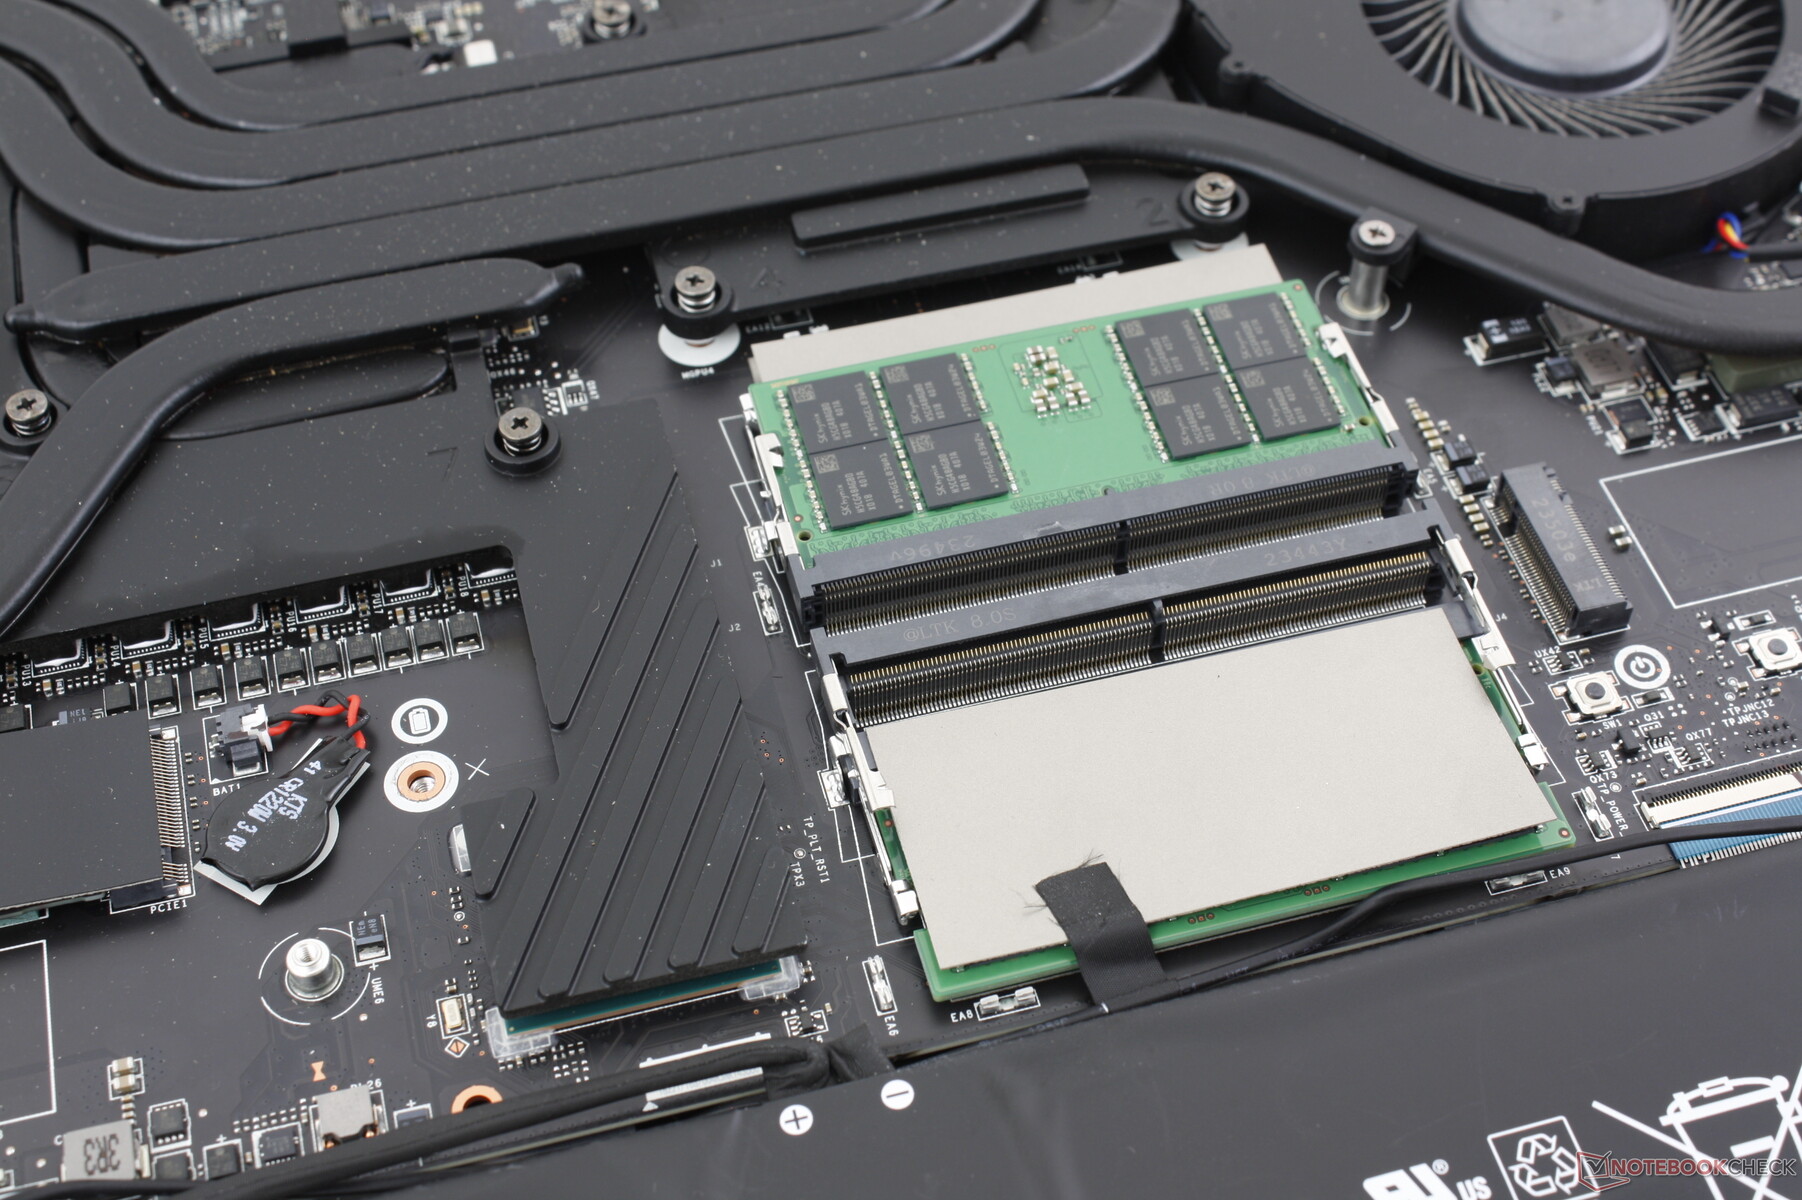
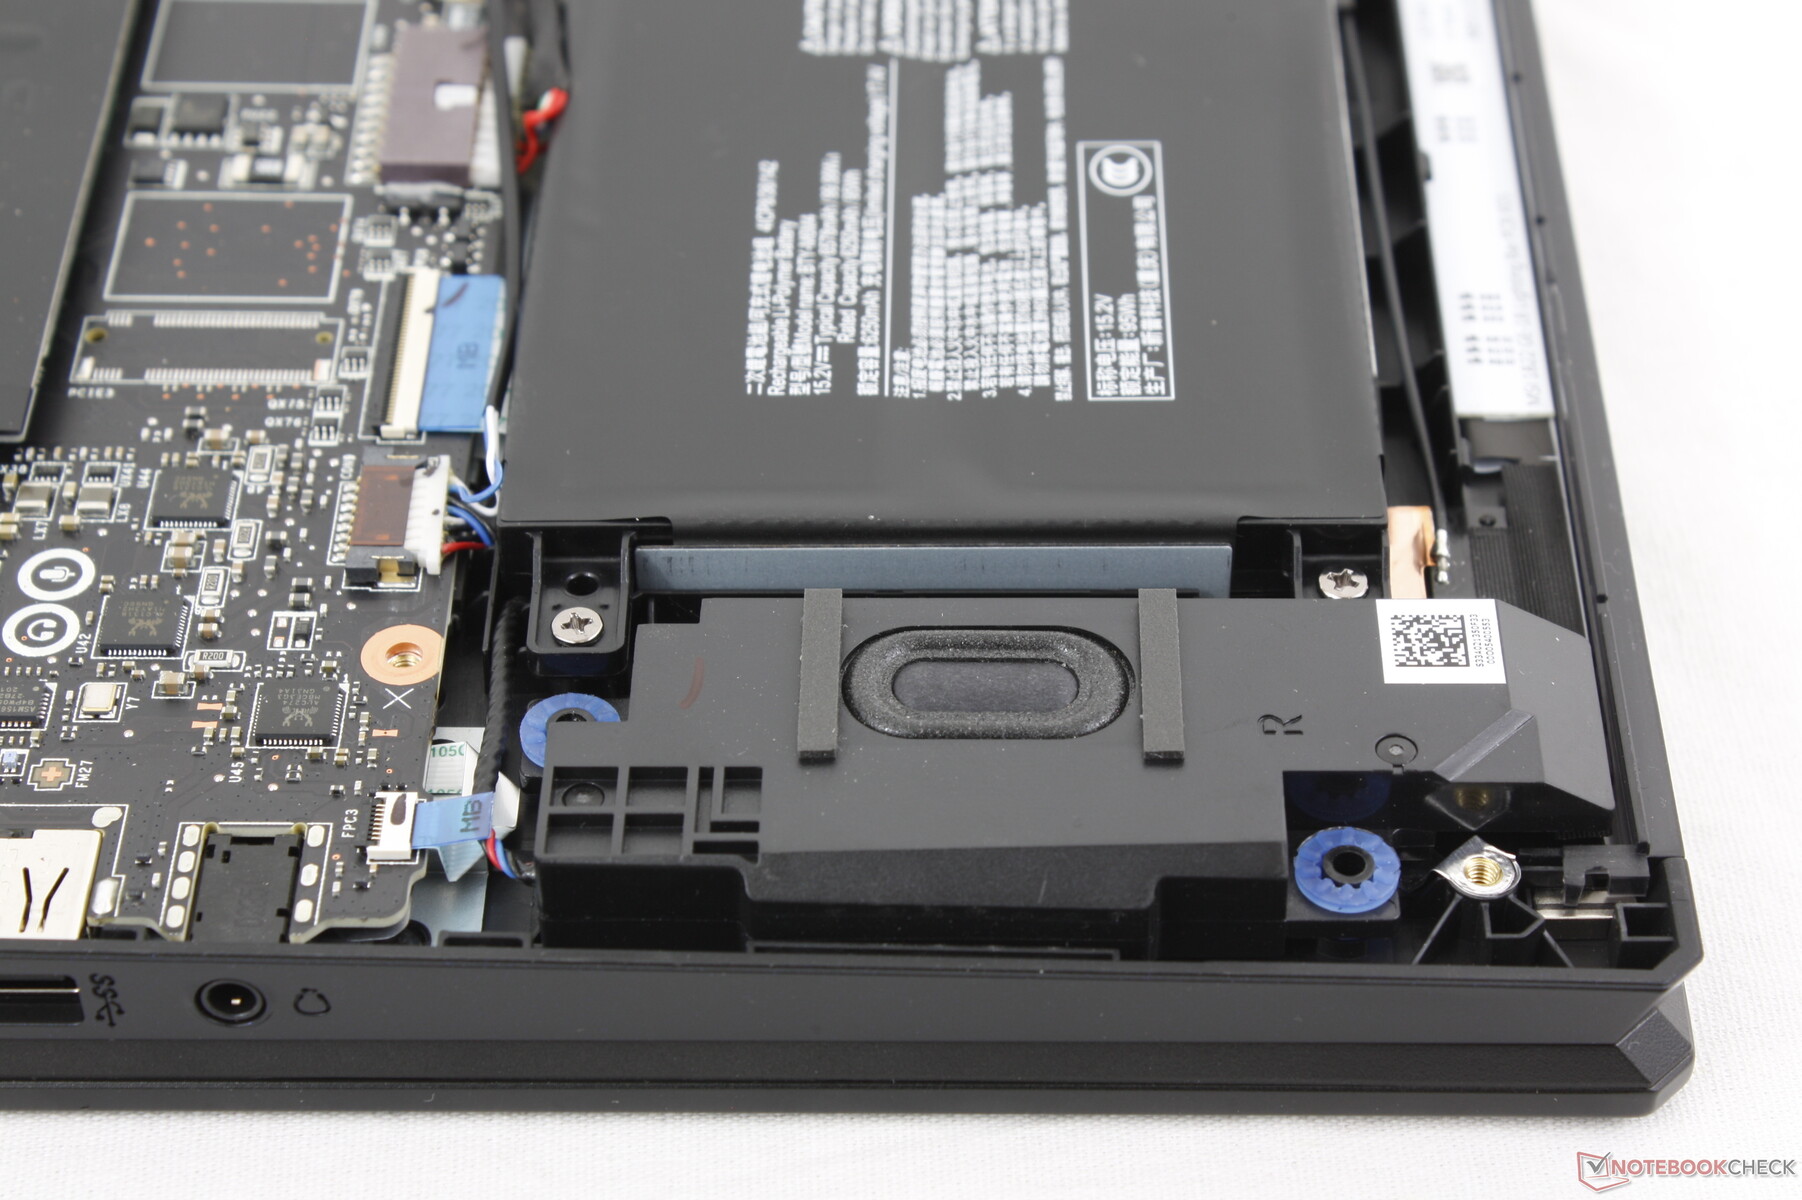
Underhåll
Bottenpanelen sitter fast med 12 Phillips-skruvar som är relativt lätta att ta bort. MSI fortsätter dock att vara en av få tillverkare med en anti-tamper-klistermärke som täcker en av skruvarna som måste brytas för även enkla uppgraderingar som RAM eller lagring.
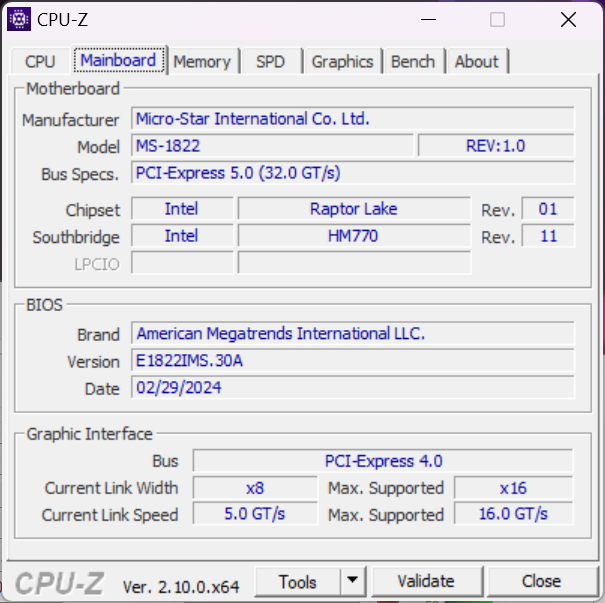
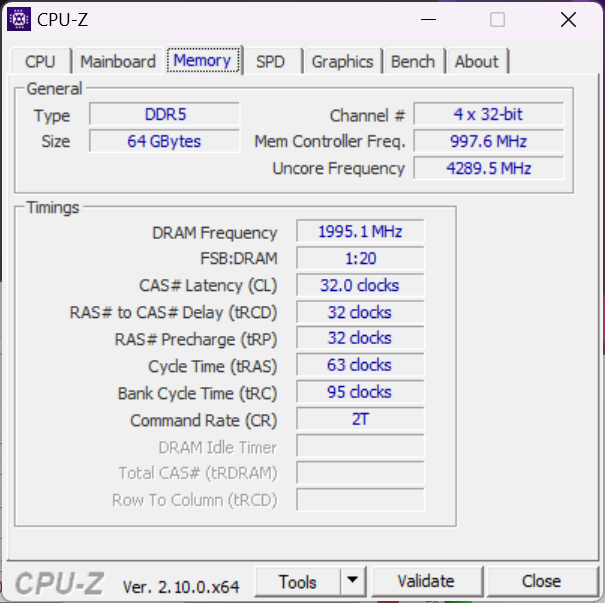
Raider 18 HX delar många av samma interna komponenter som Titan 18 HX. Användare har tillgång till två M.2 2280 SSD-kortplatser och fyra DDR5 SODIMM-kortplatser. Observera att den tredje M.2 SSD-platsen har tagits bort från den här modellen; användare måste uppgradera till Titan 18 HX för en sådan funktion.

Hållbarhet
Förpackningen är helt återvinningsbar och består nästan uteslutande av kartong med endast lite plastomslag för användarhandboken. Det finns dock ingen information om eventuella återvunna material som använts vid tillverkningen av systemet.
Tillbehör och garanti
Det finns inga extra tillbehör i lådan förutom nätadapter och pappersarbete. Äldre Raider-modeller levererades med en rengöringsduk i sammet, men detta verkar inte längre vara fallet.
Den vanliga ettåriga begränsade tillverkargarantin gäller om den köps i USA.
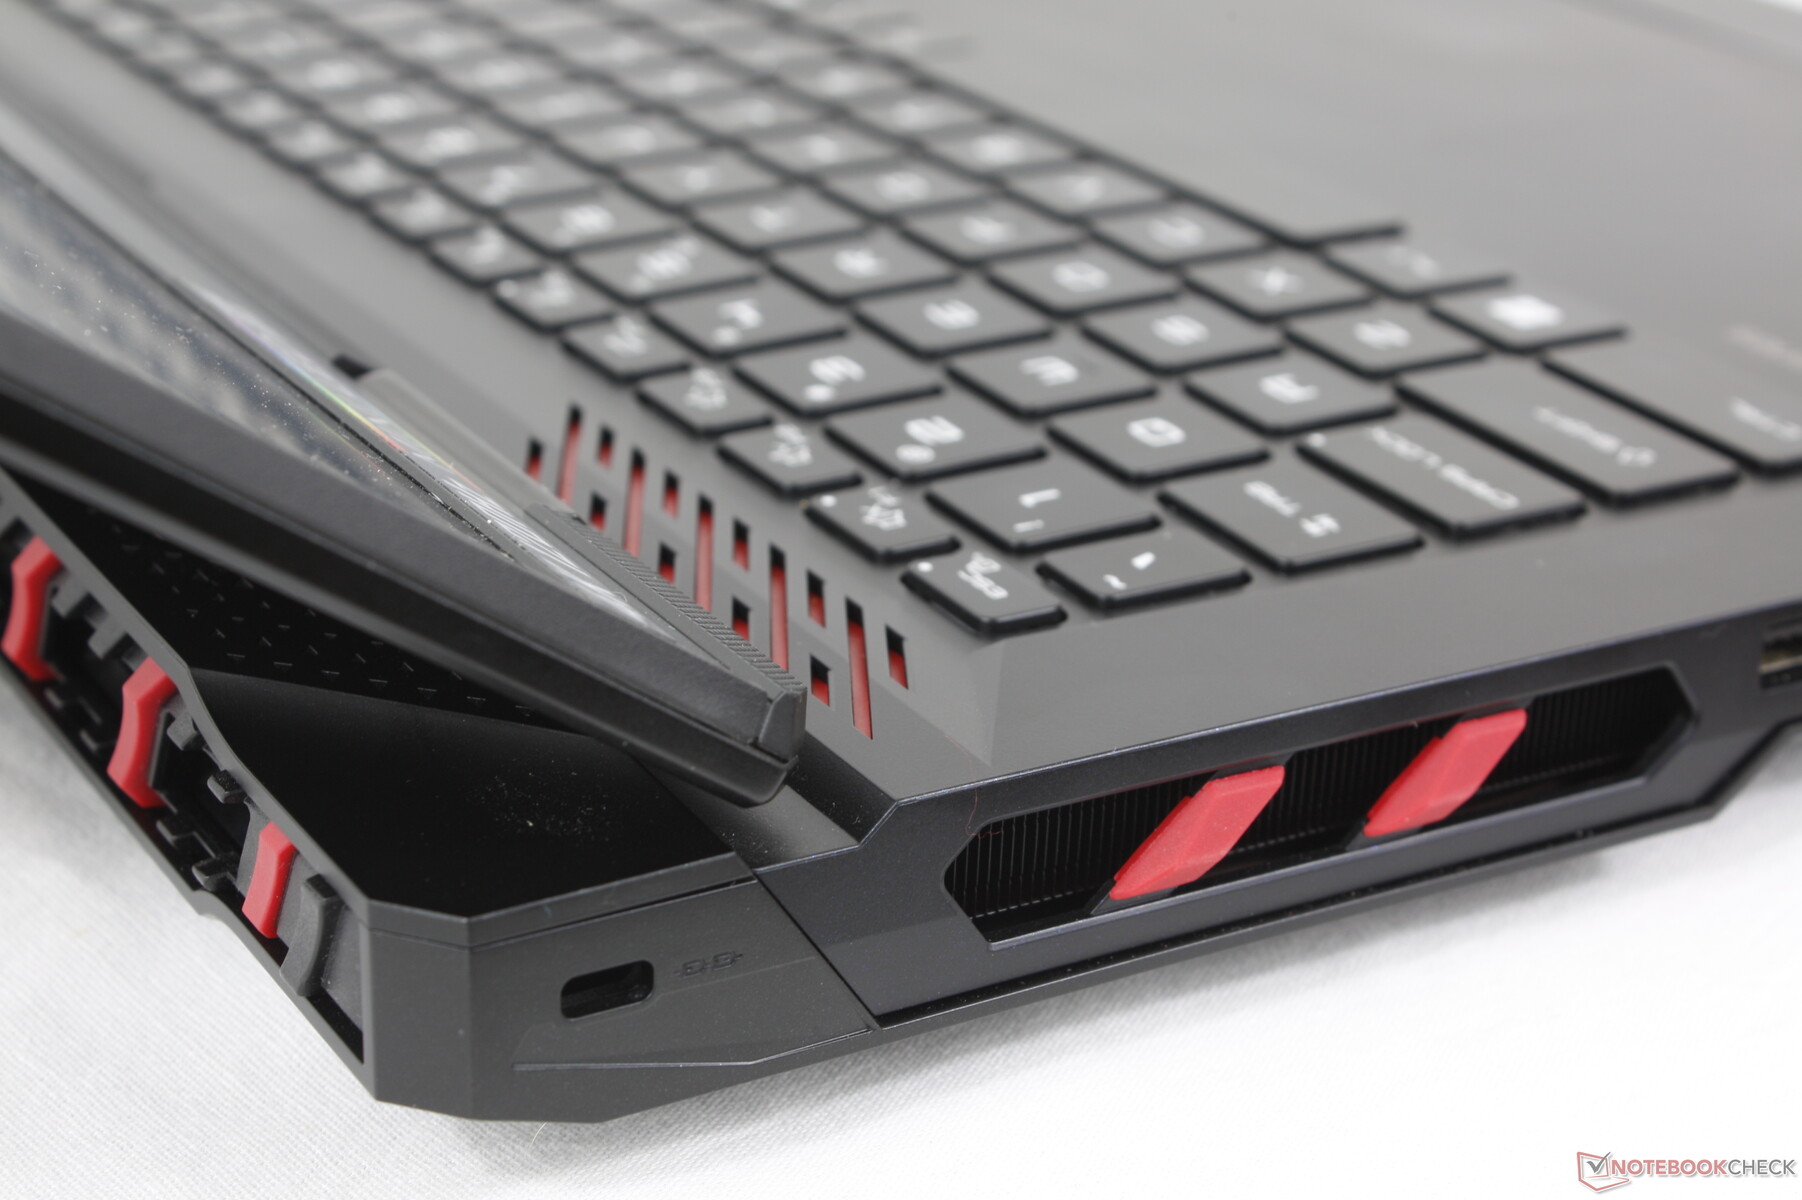
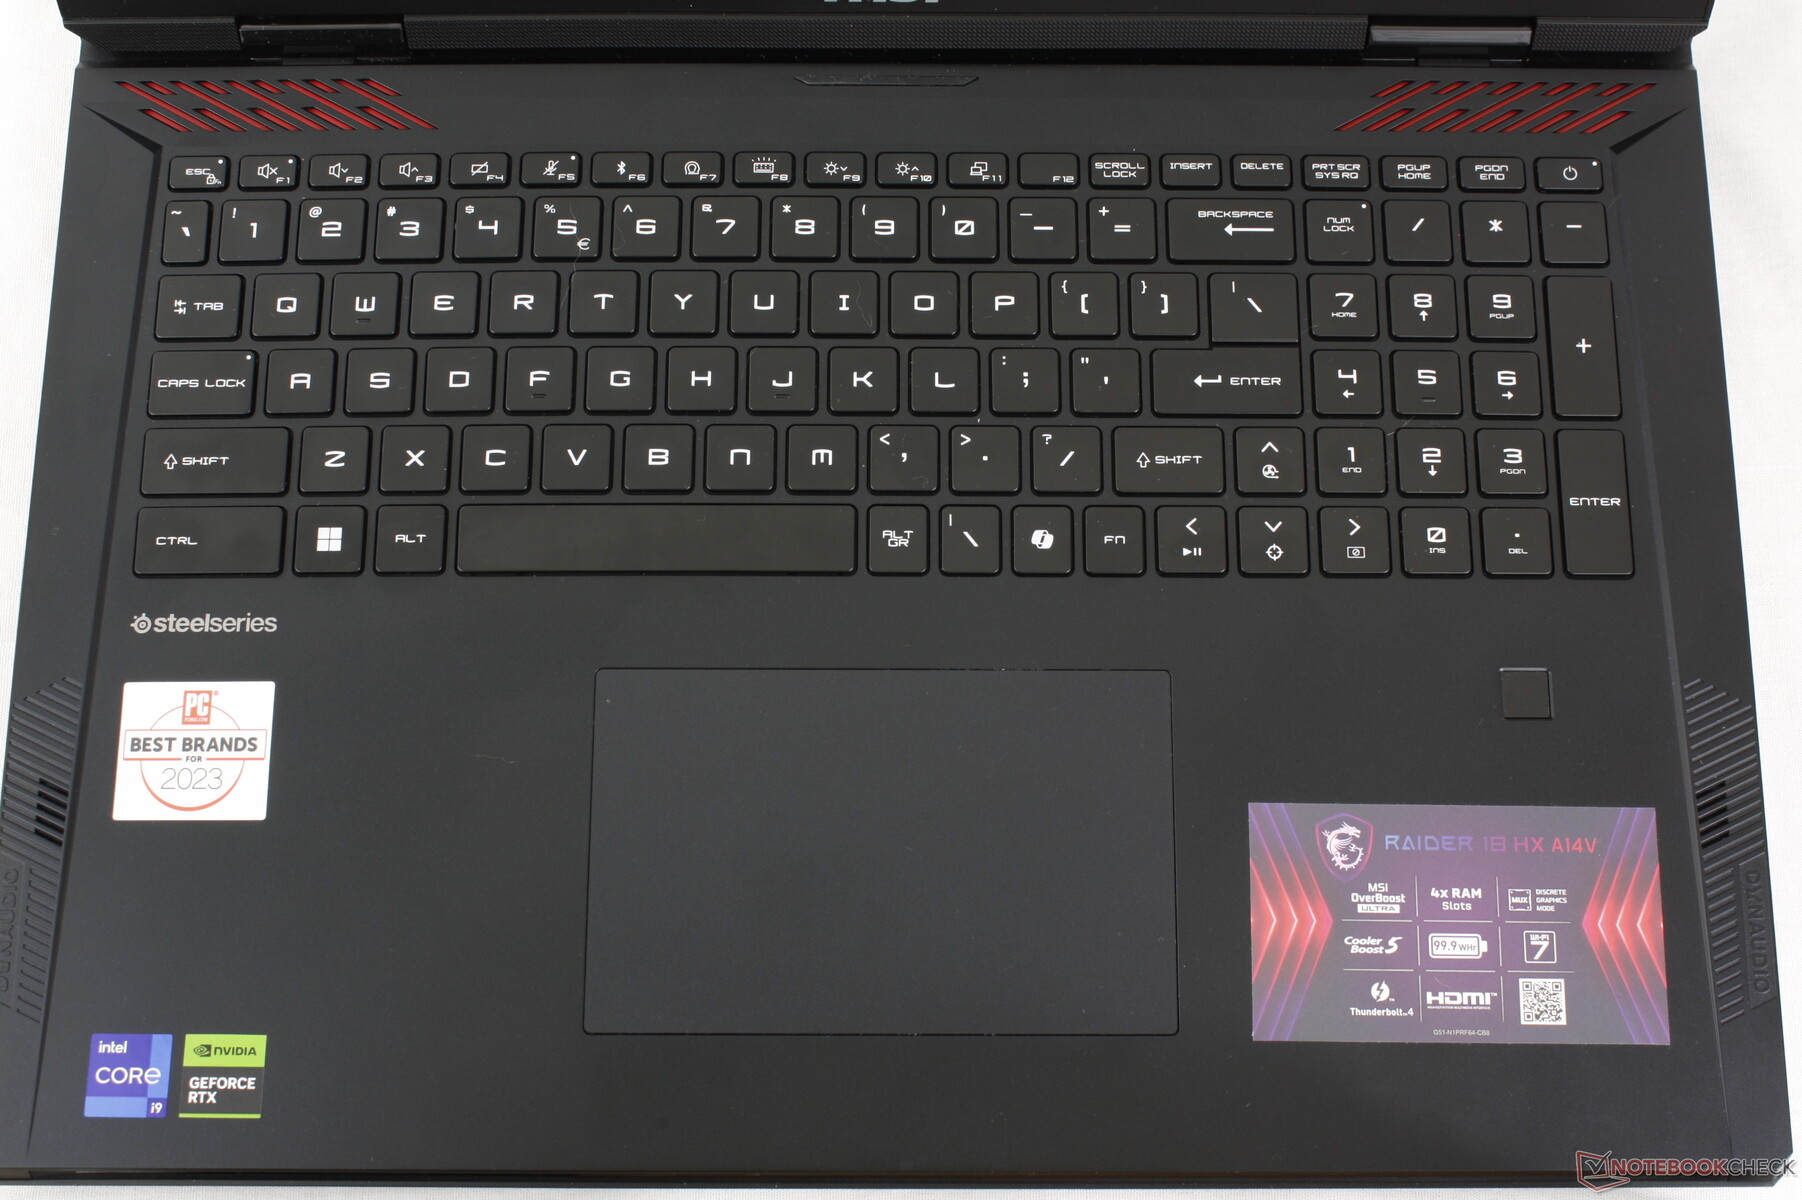
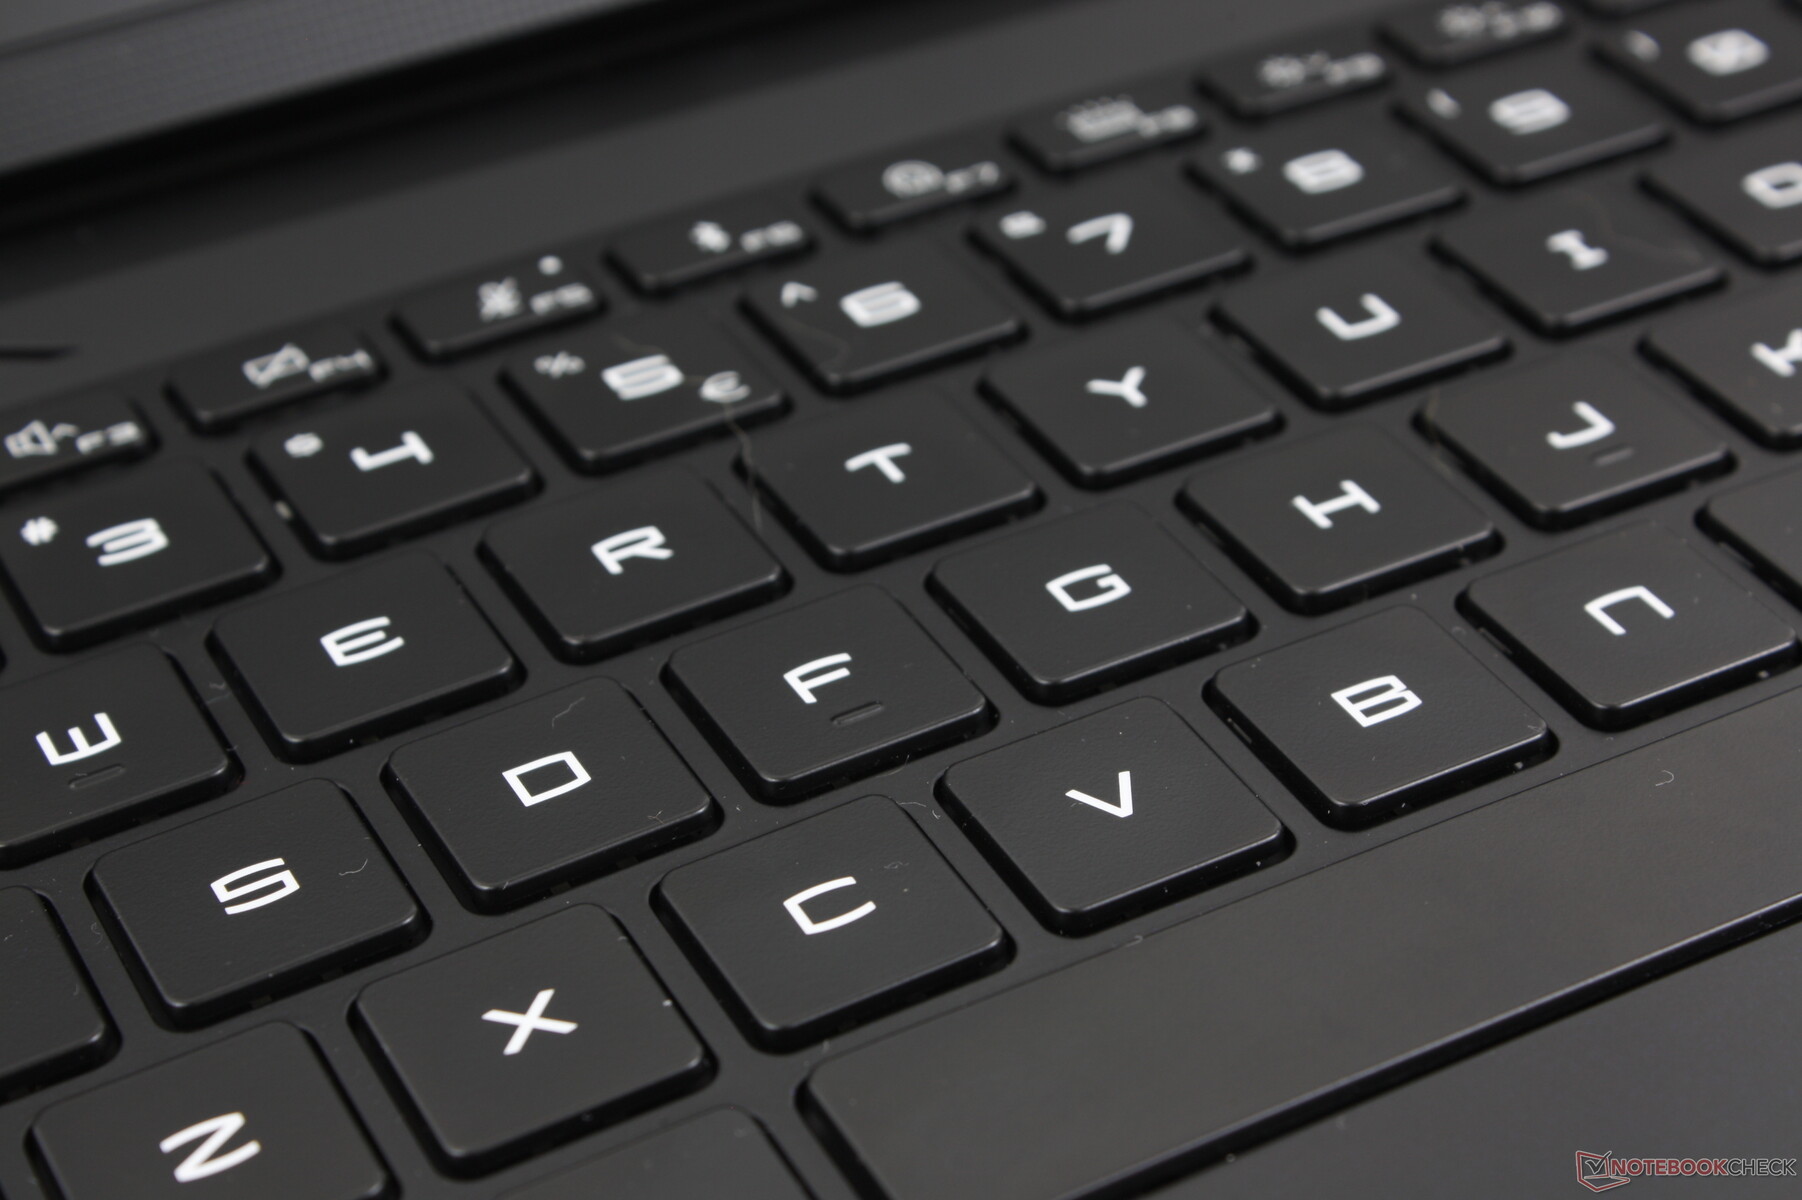
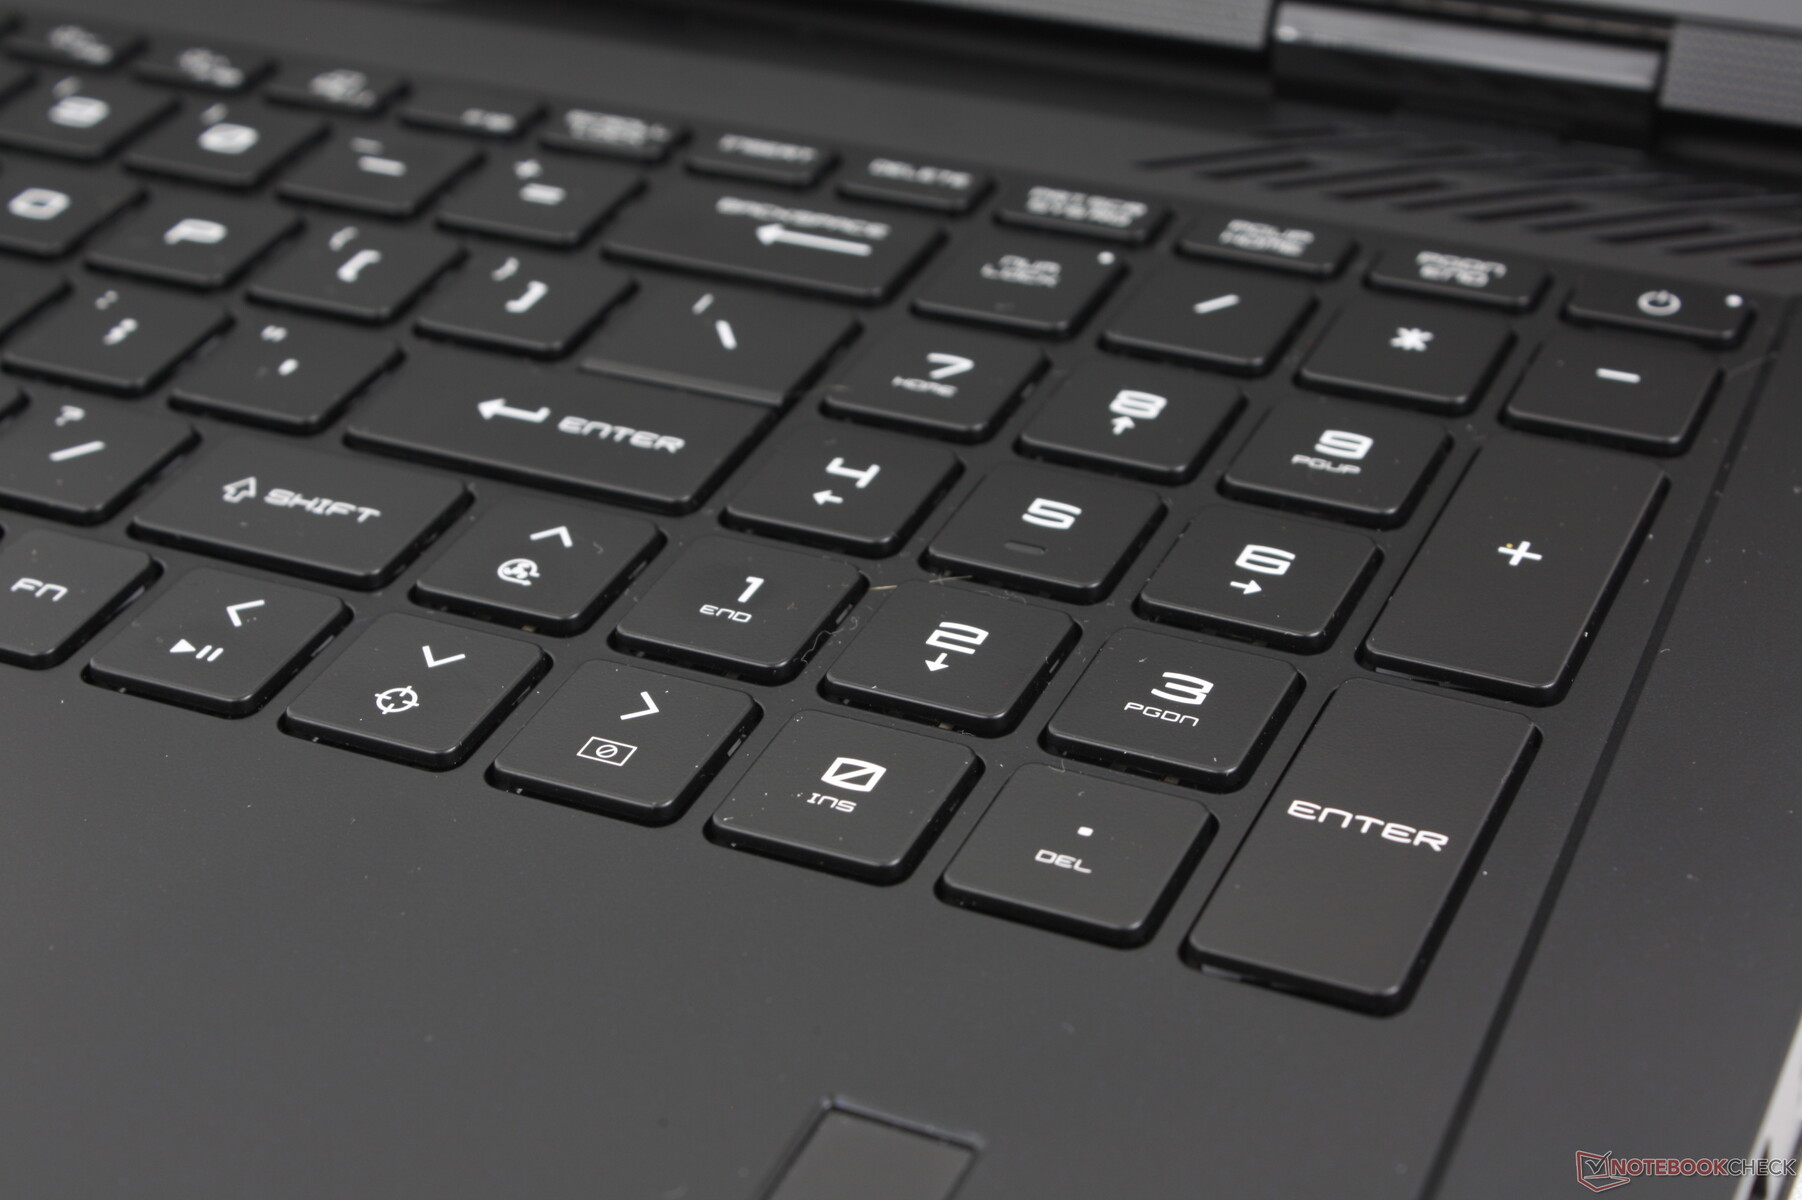
Inmatningsenheter - bekant framför fantasifullt
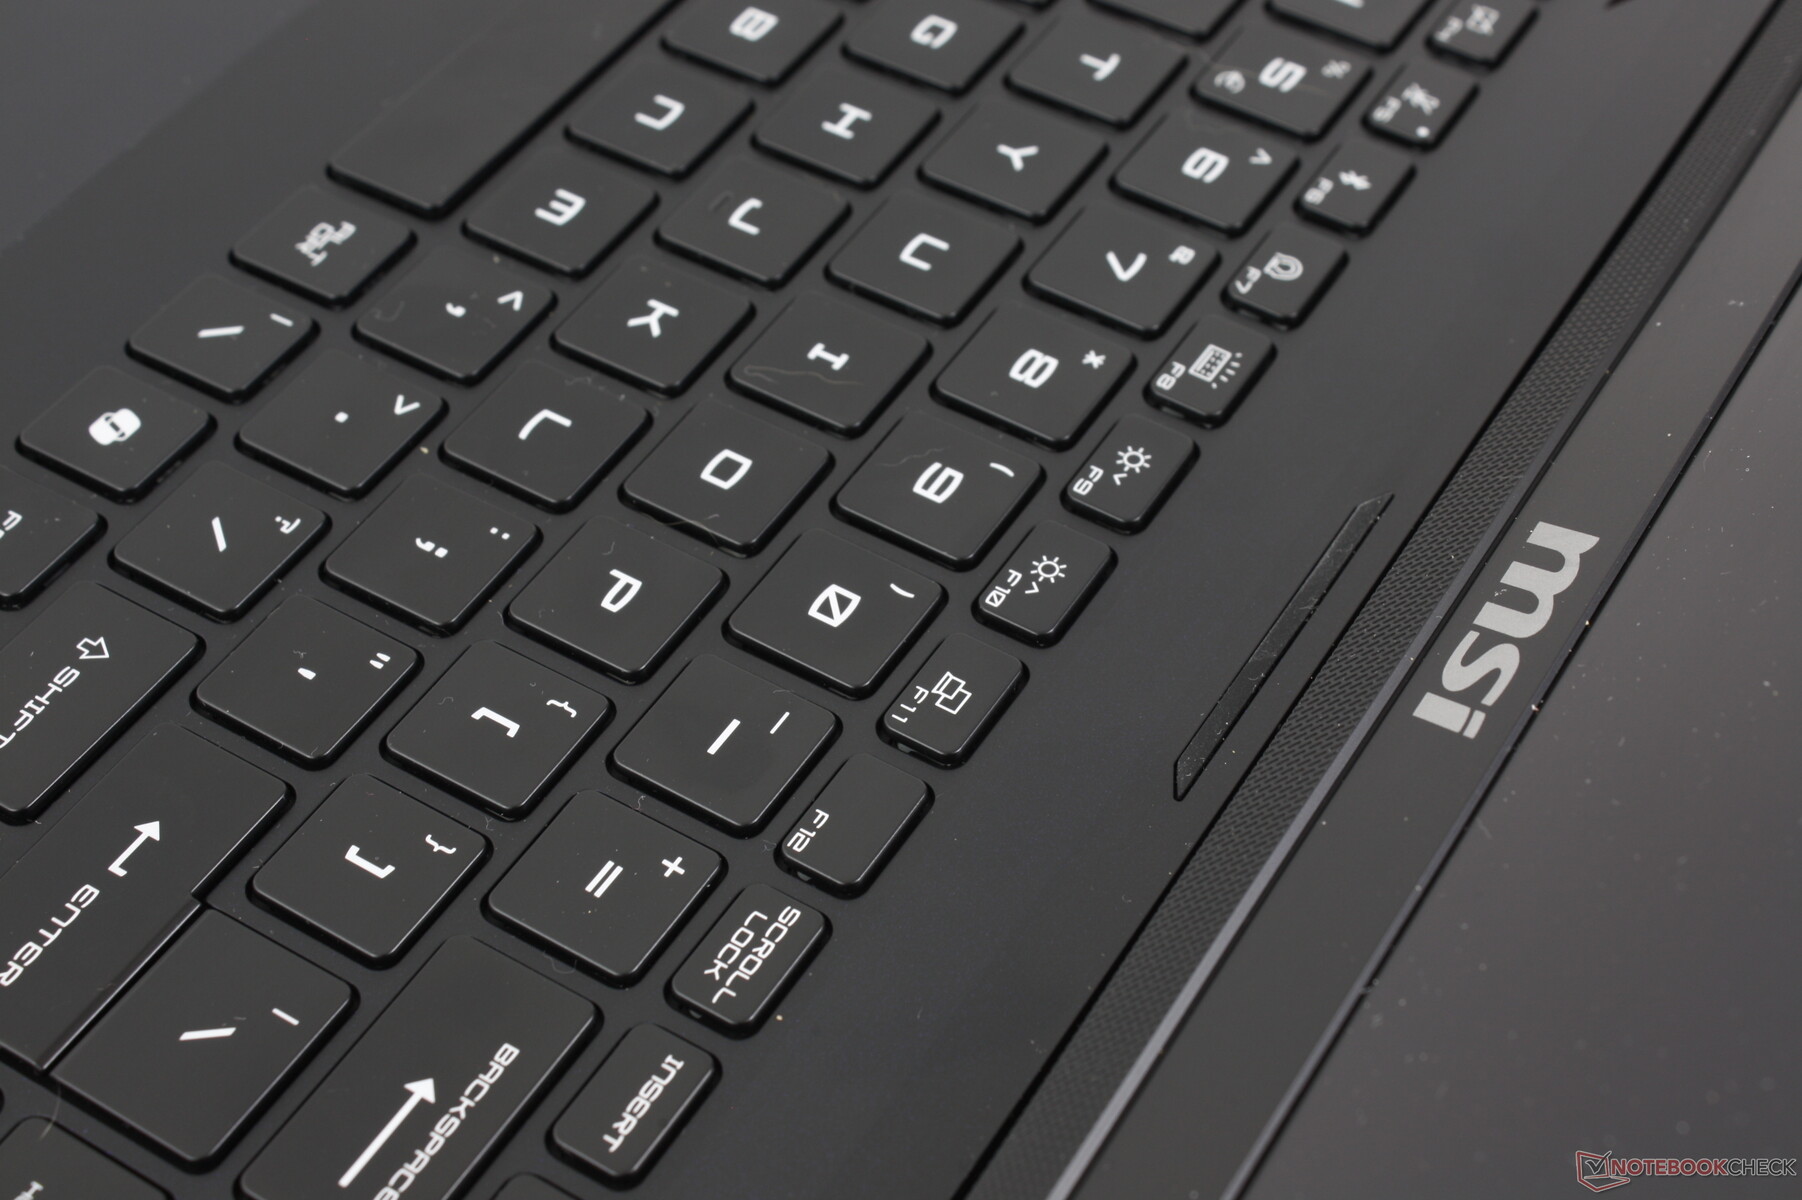
Tangentbord
Tangentbordet är visuellt identiskt med det som sitter på Titan 18 HX, men med en mycket viktig skillnad: Avsaknaden av mekaniska CherryMX-alternativ. Att skriva på Raider 18 HX är därför närmare att skriva på mer traditionella bärbara tangentbord som på MSI Stealth 16 eller äldre generationens Raider-modeller. Återkopplingen är inte alls lika klickig eller fast, men det mjukare klirret kan vara att föredra i miljöer som konferensrum, klassrum, bibliotek eller studentrum.
Vi uppskattar särskilt det fullstora numeriska tangentbordet och piltangenterna, eftersom dessa vanligtvis är smalare och mindre än de huvudsakliga QWERTY-tangenterna på de flesta andra bärbara datorer. Att arbeta med kalkylblad är därför mer bekvämt på Raider 18 HX än på Blade 18 eller ROG Strix G18.
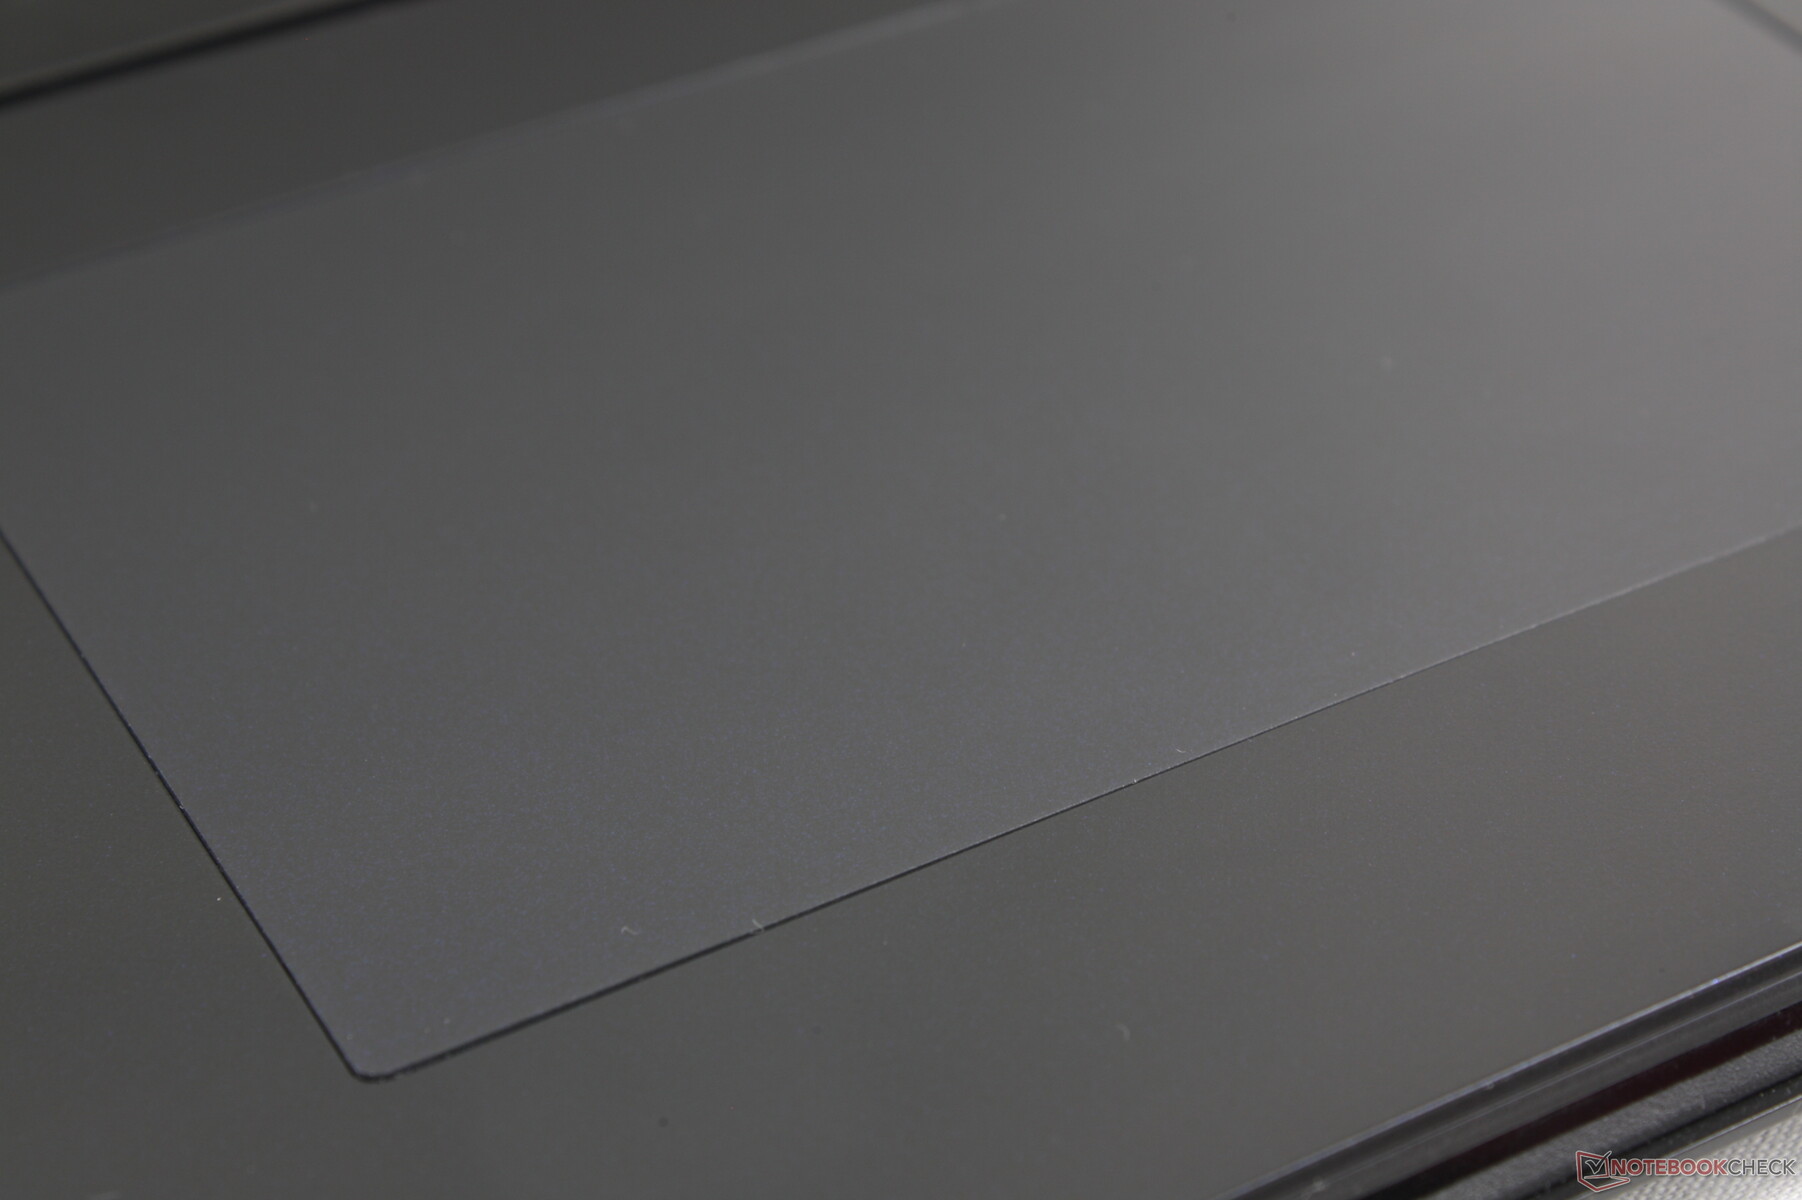
Pekplatta
Till skillnad från den snygga LED-belysta kantlösa klickplattan på Titan 18 HX använder Raider 18 HX en traditionell klickplatta för en mer bekant känsla. Storleken är exakt densamma (13 x 8,2 cm) och den är utan tvekan bekvämare att använda eftersom den inte försöker vara något nytt eller lösa ett problem som inte fanns från början. Dragkraften är ultrasmidig med bara lite klister vid långsammare hastigheter för noggrannhet.
Att trycka ner för att få ett klick är tyvärr fortfarande grunt och mjukt med otillfredsställande feedback. Ett starkare och fastare klick hade varit att föredra, eller till och med en återgång till dedikerade musknappar eftersom tangentbordet är ganska rymligt.
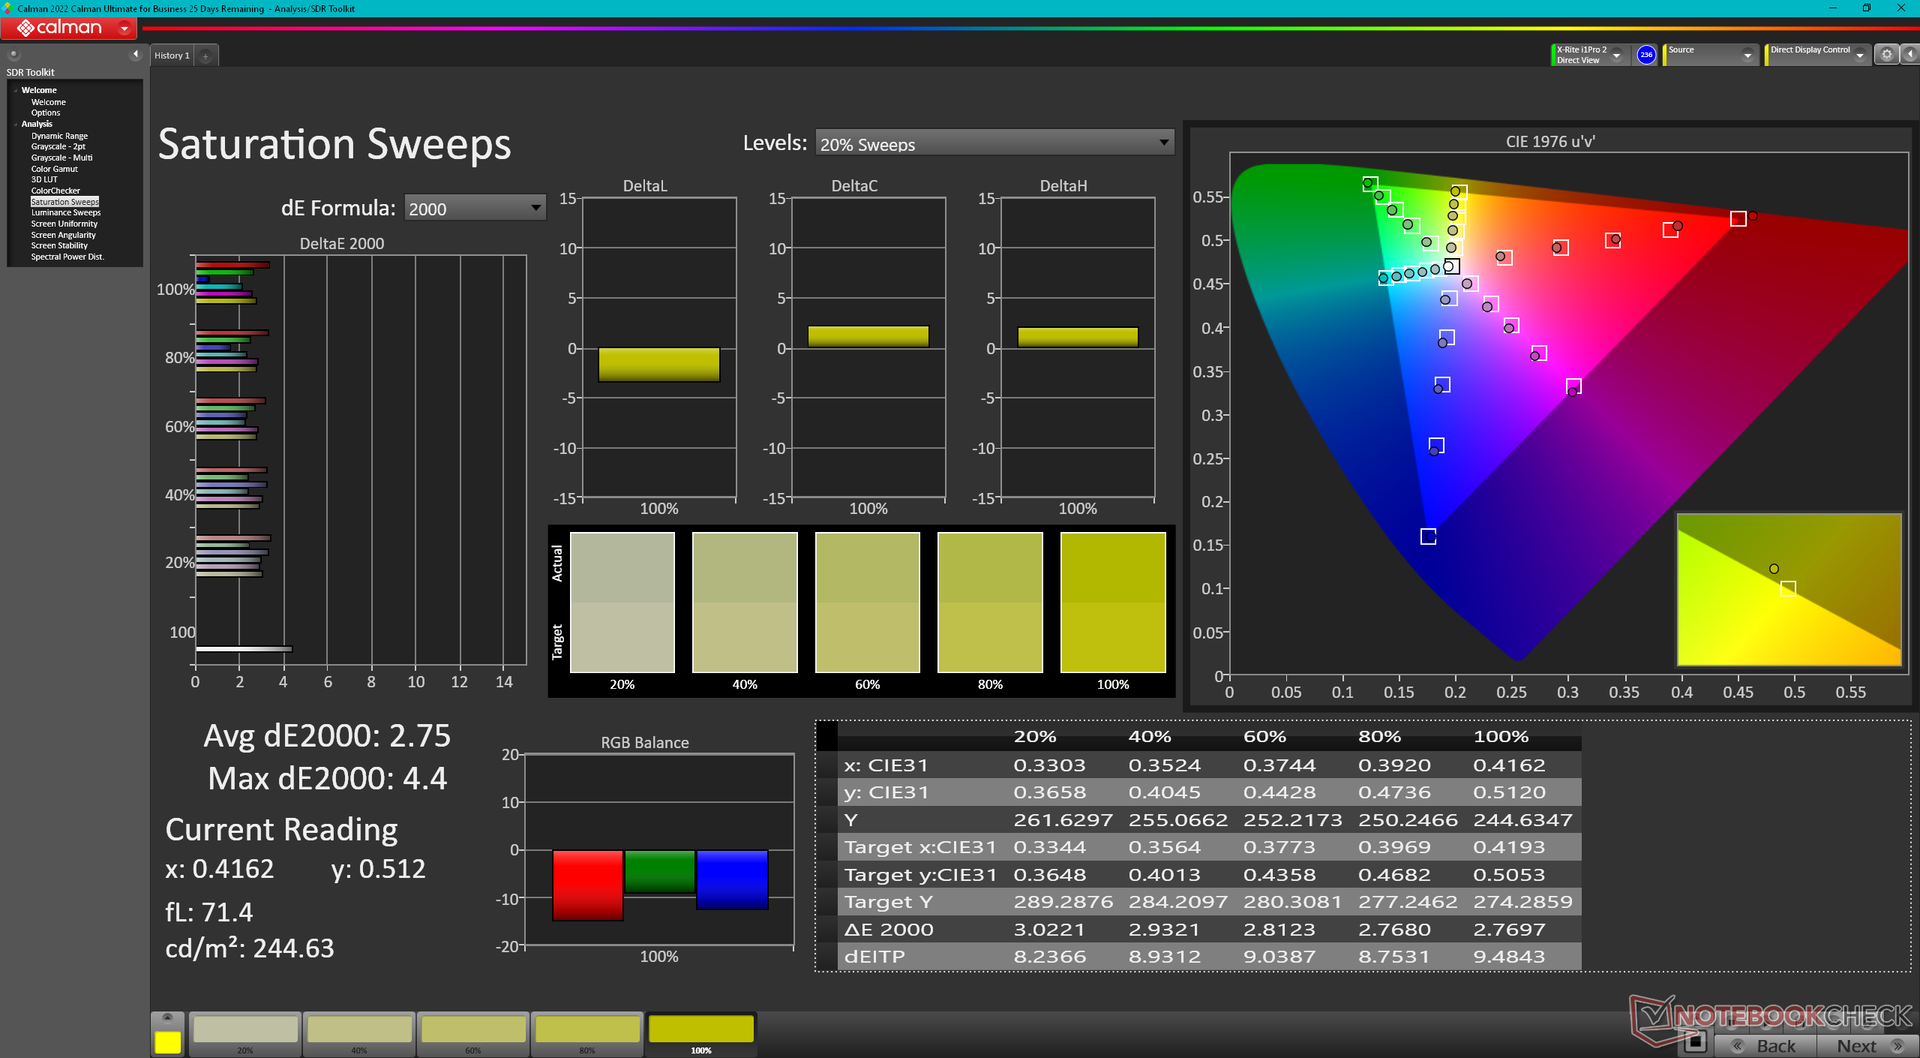
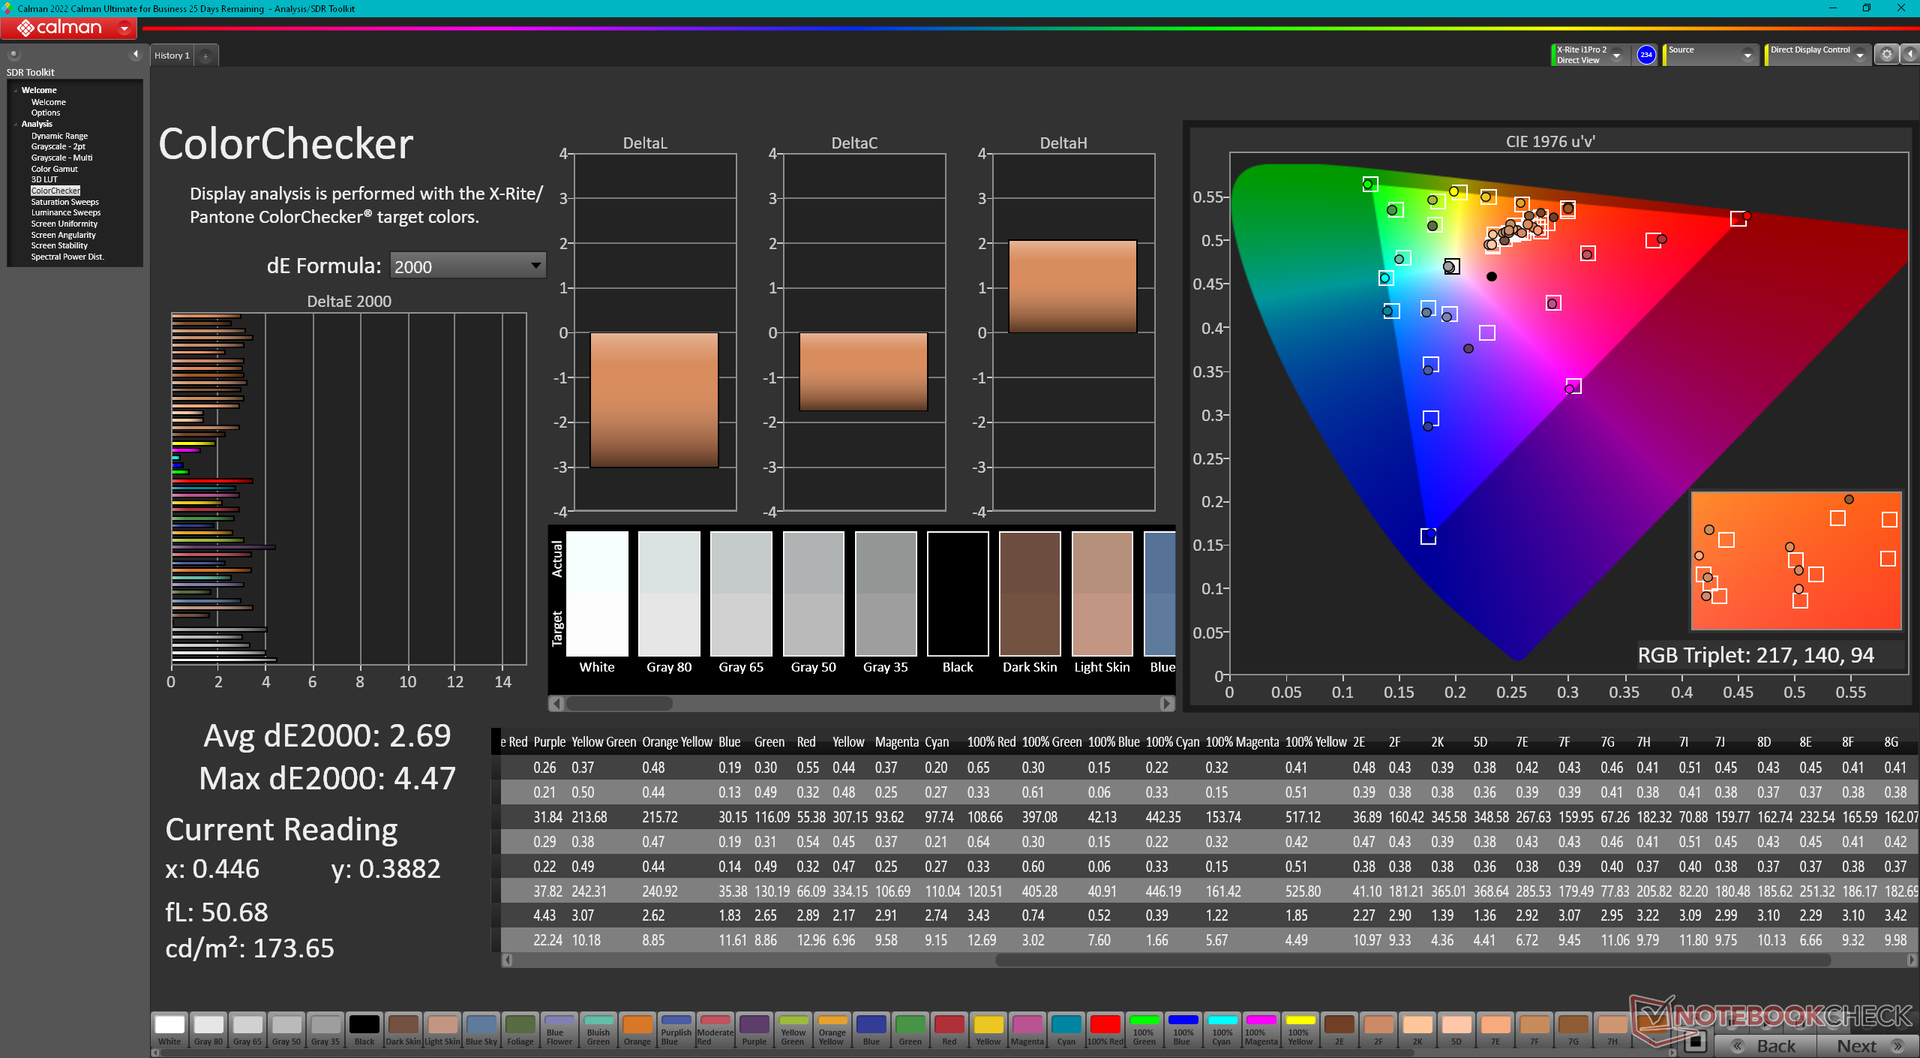
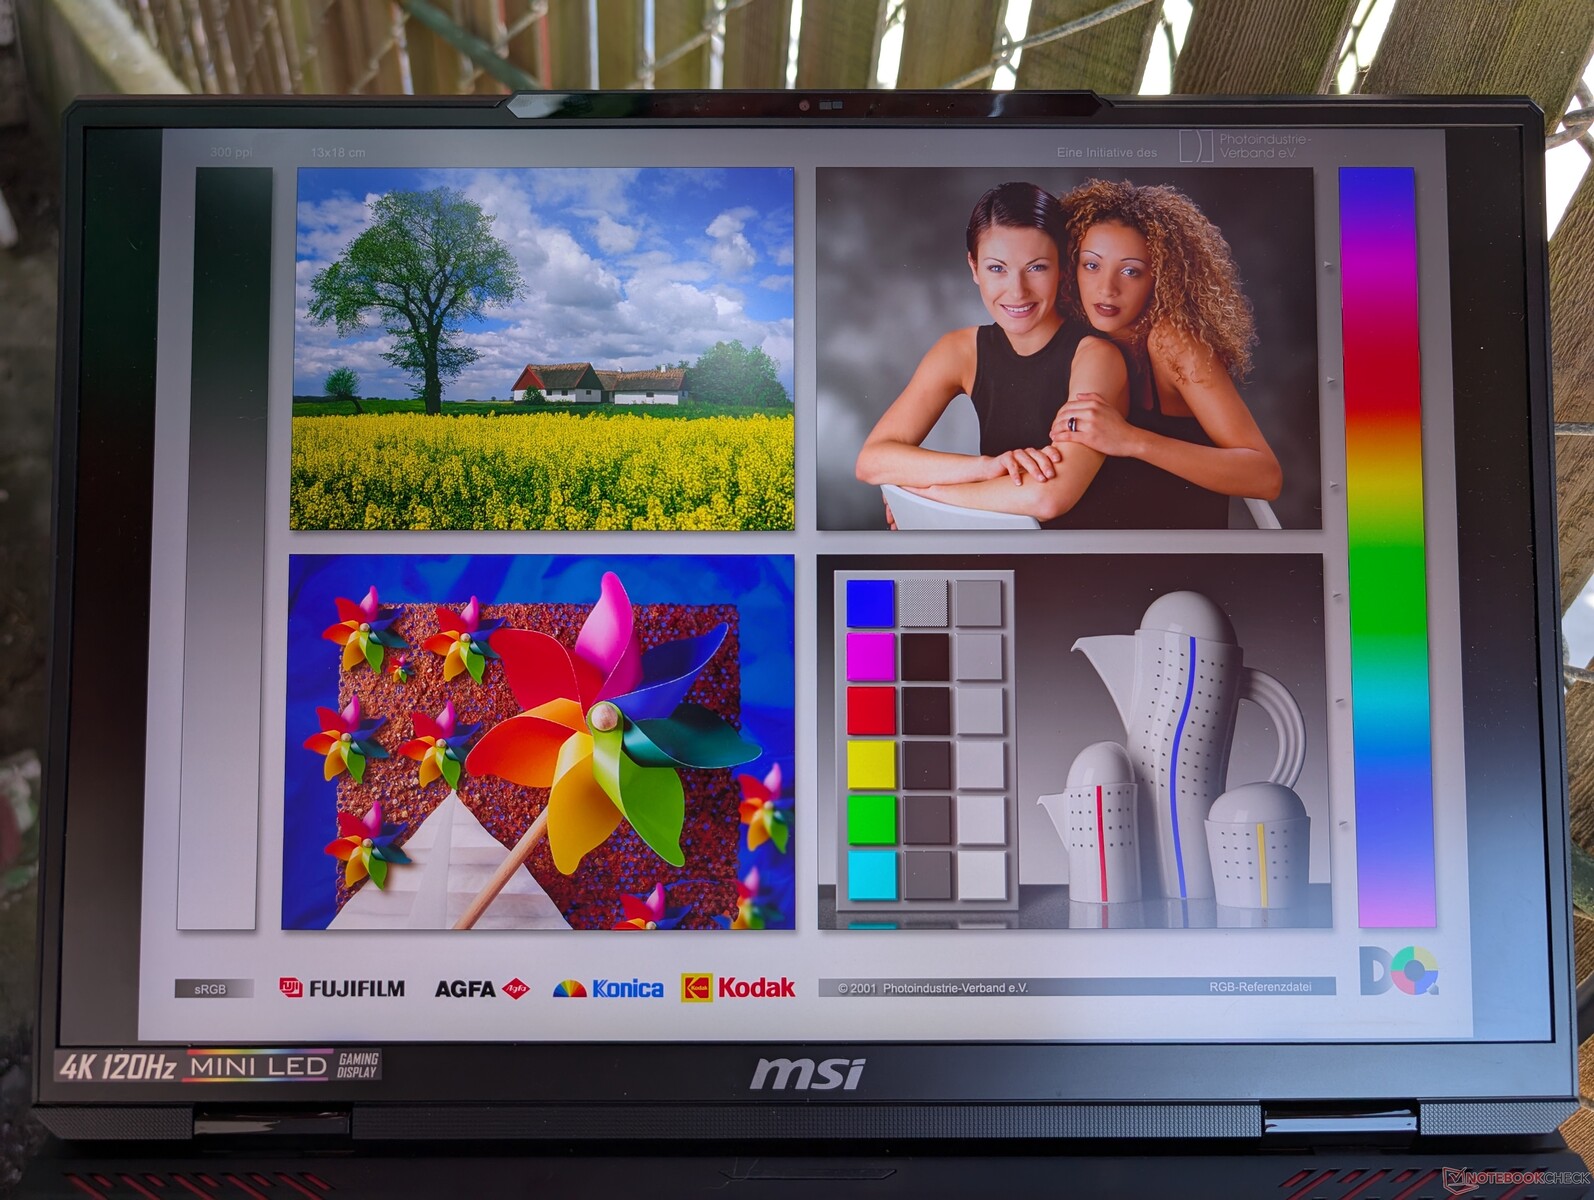
Display - Titan 18 HX Upplevelse för mindre pengar
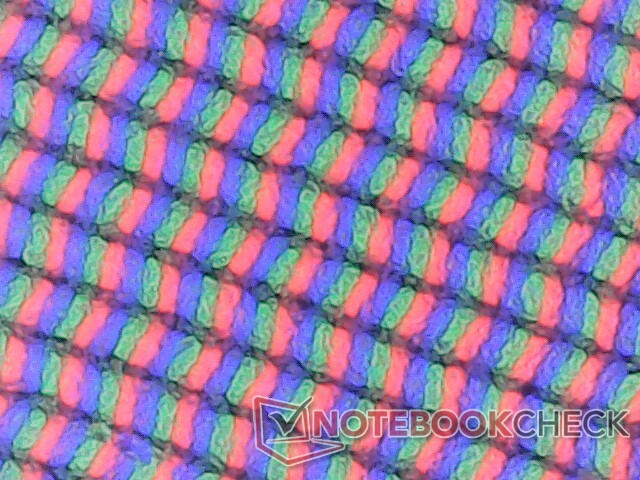
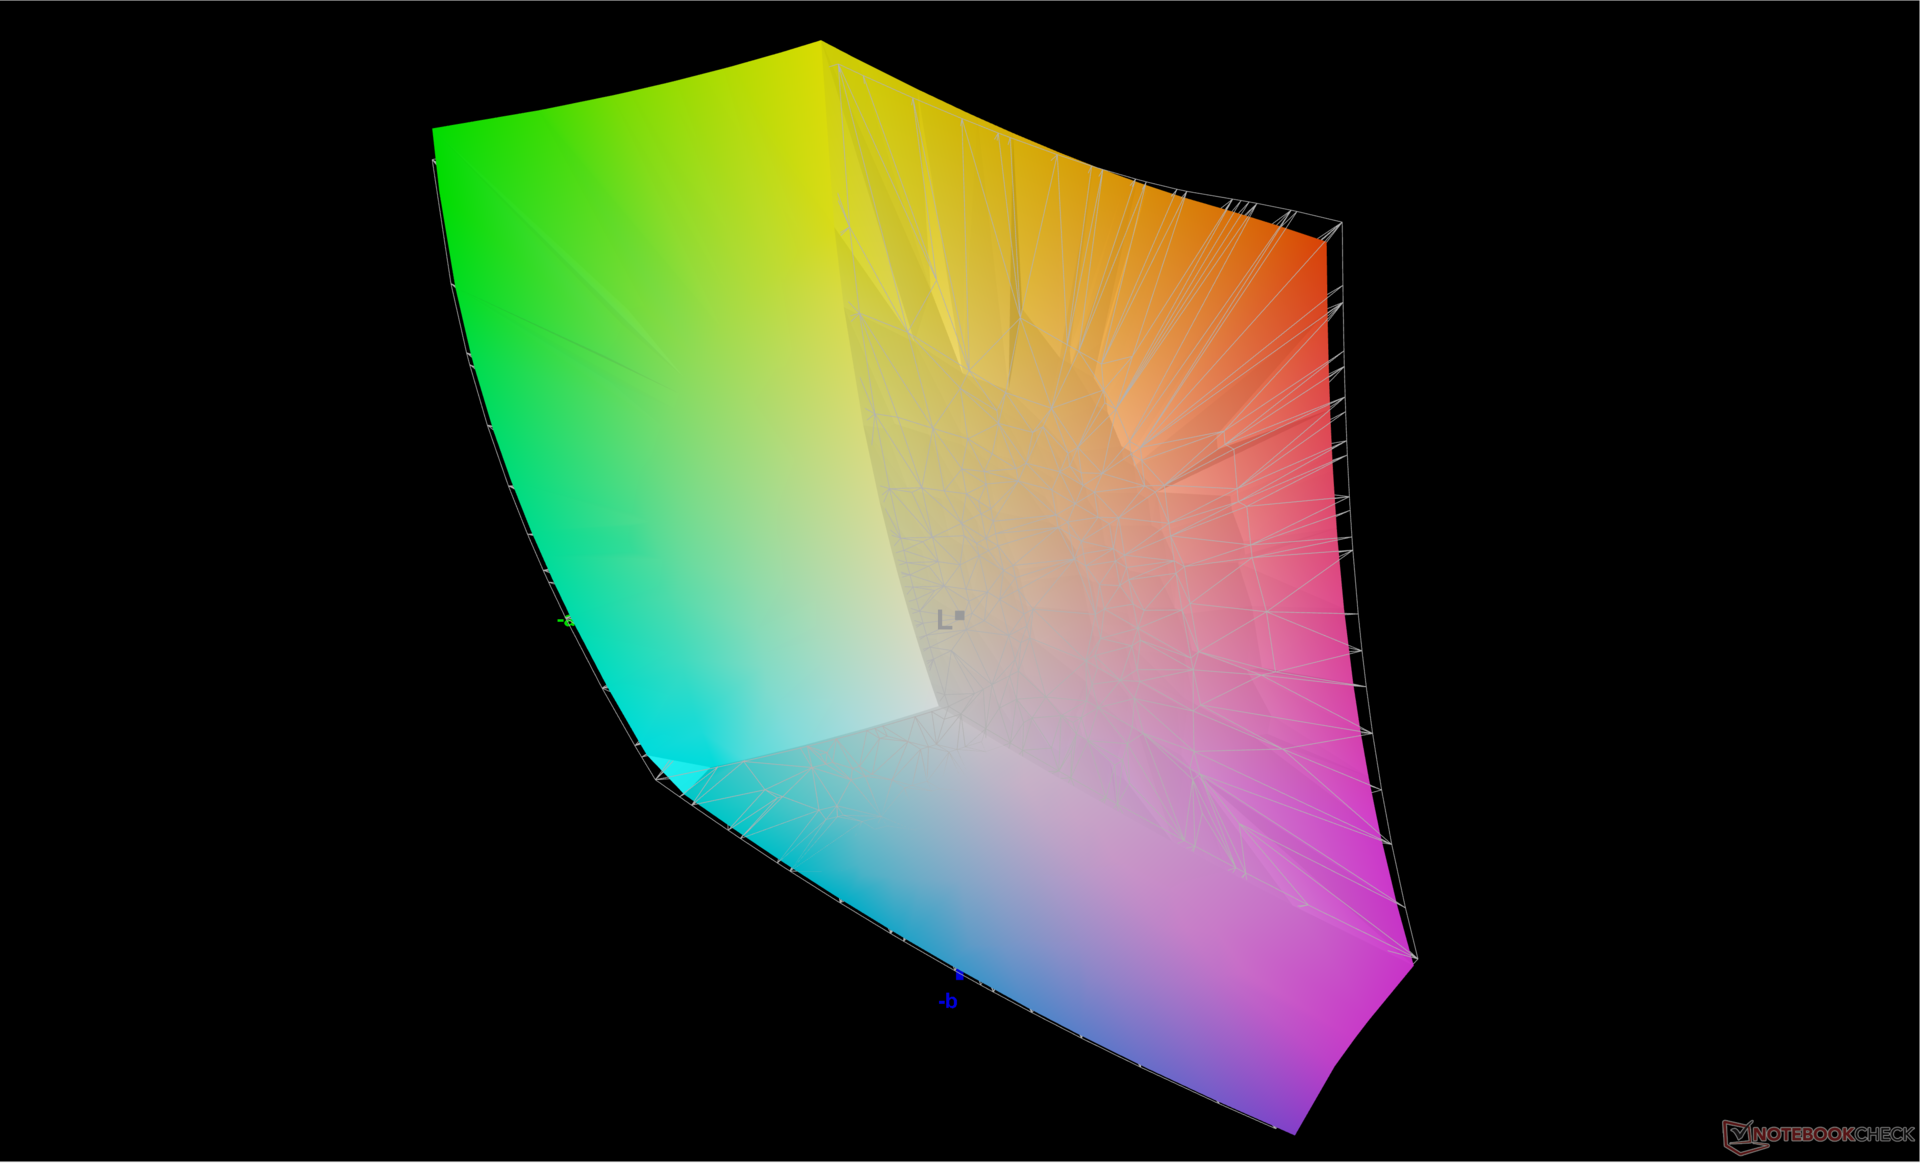
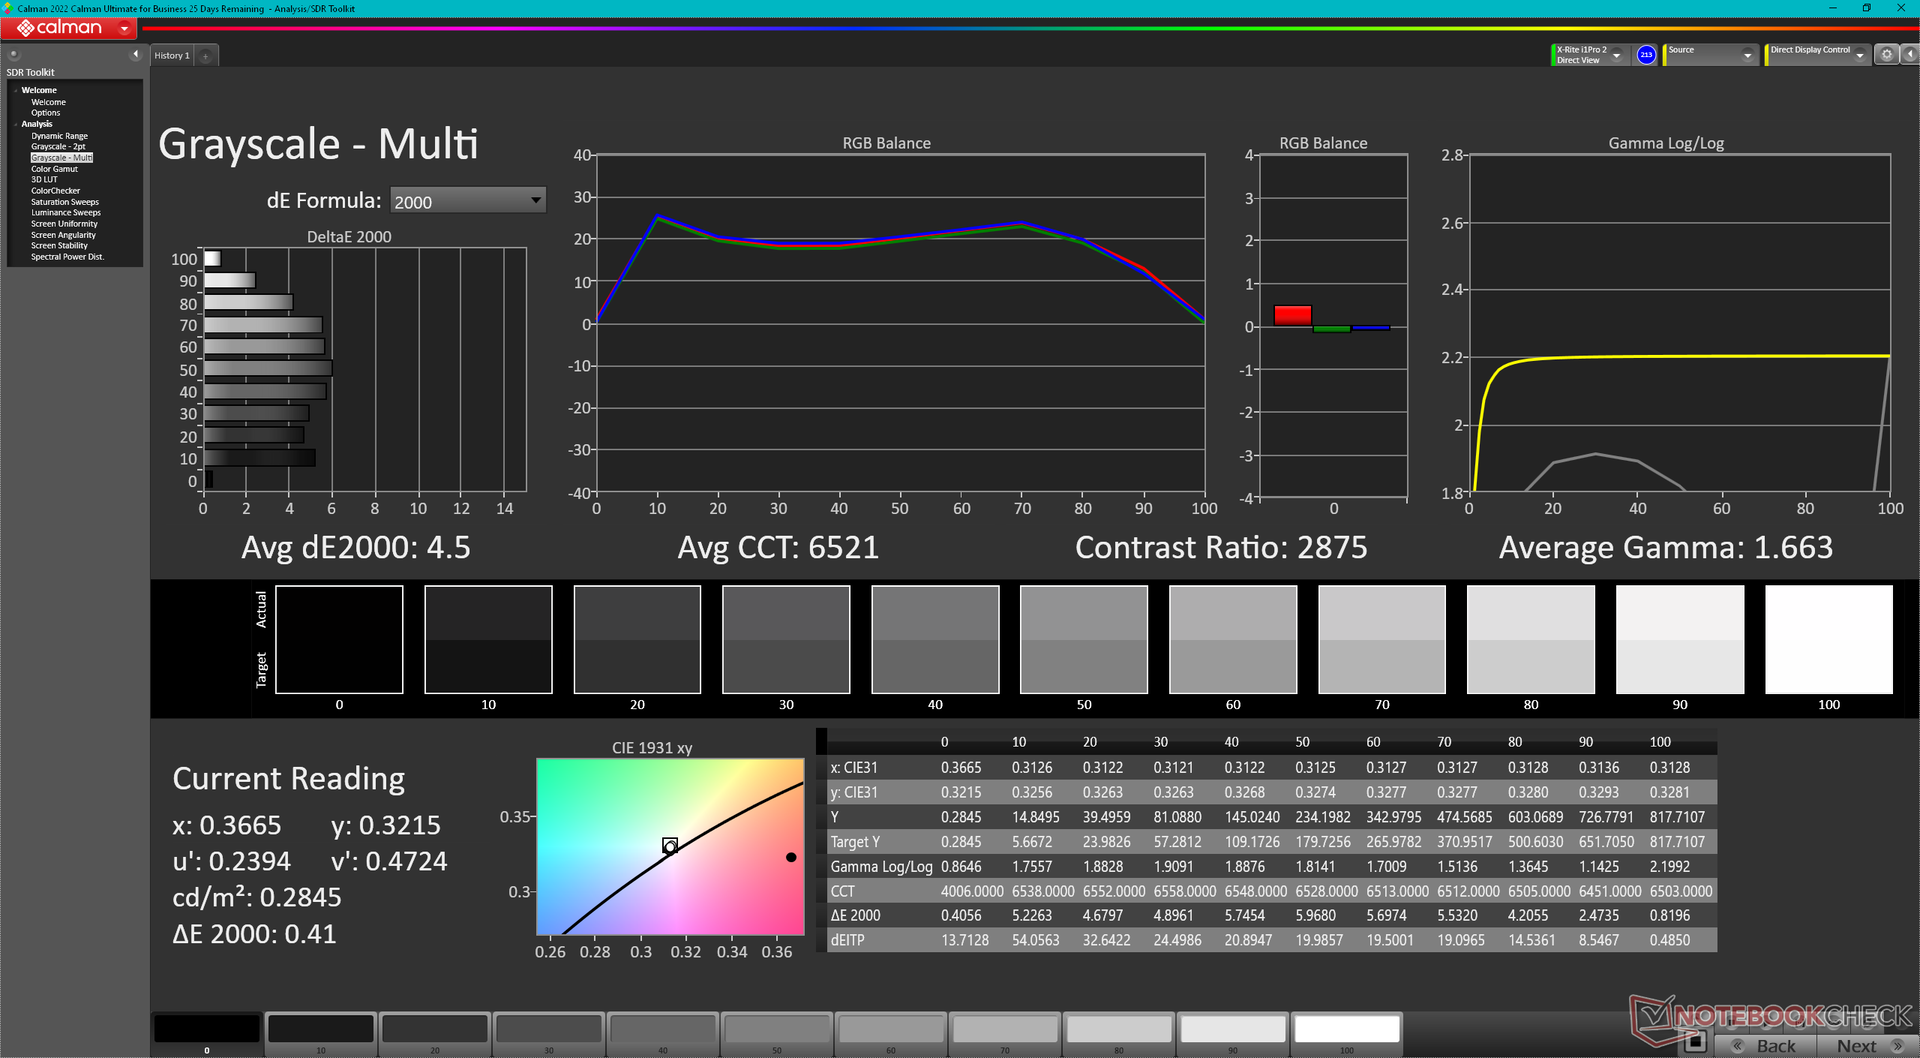
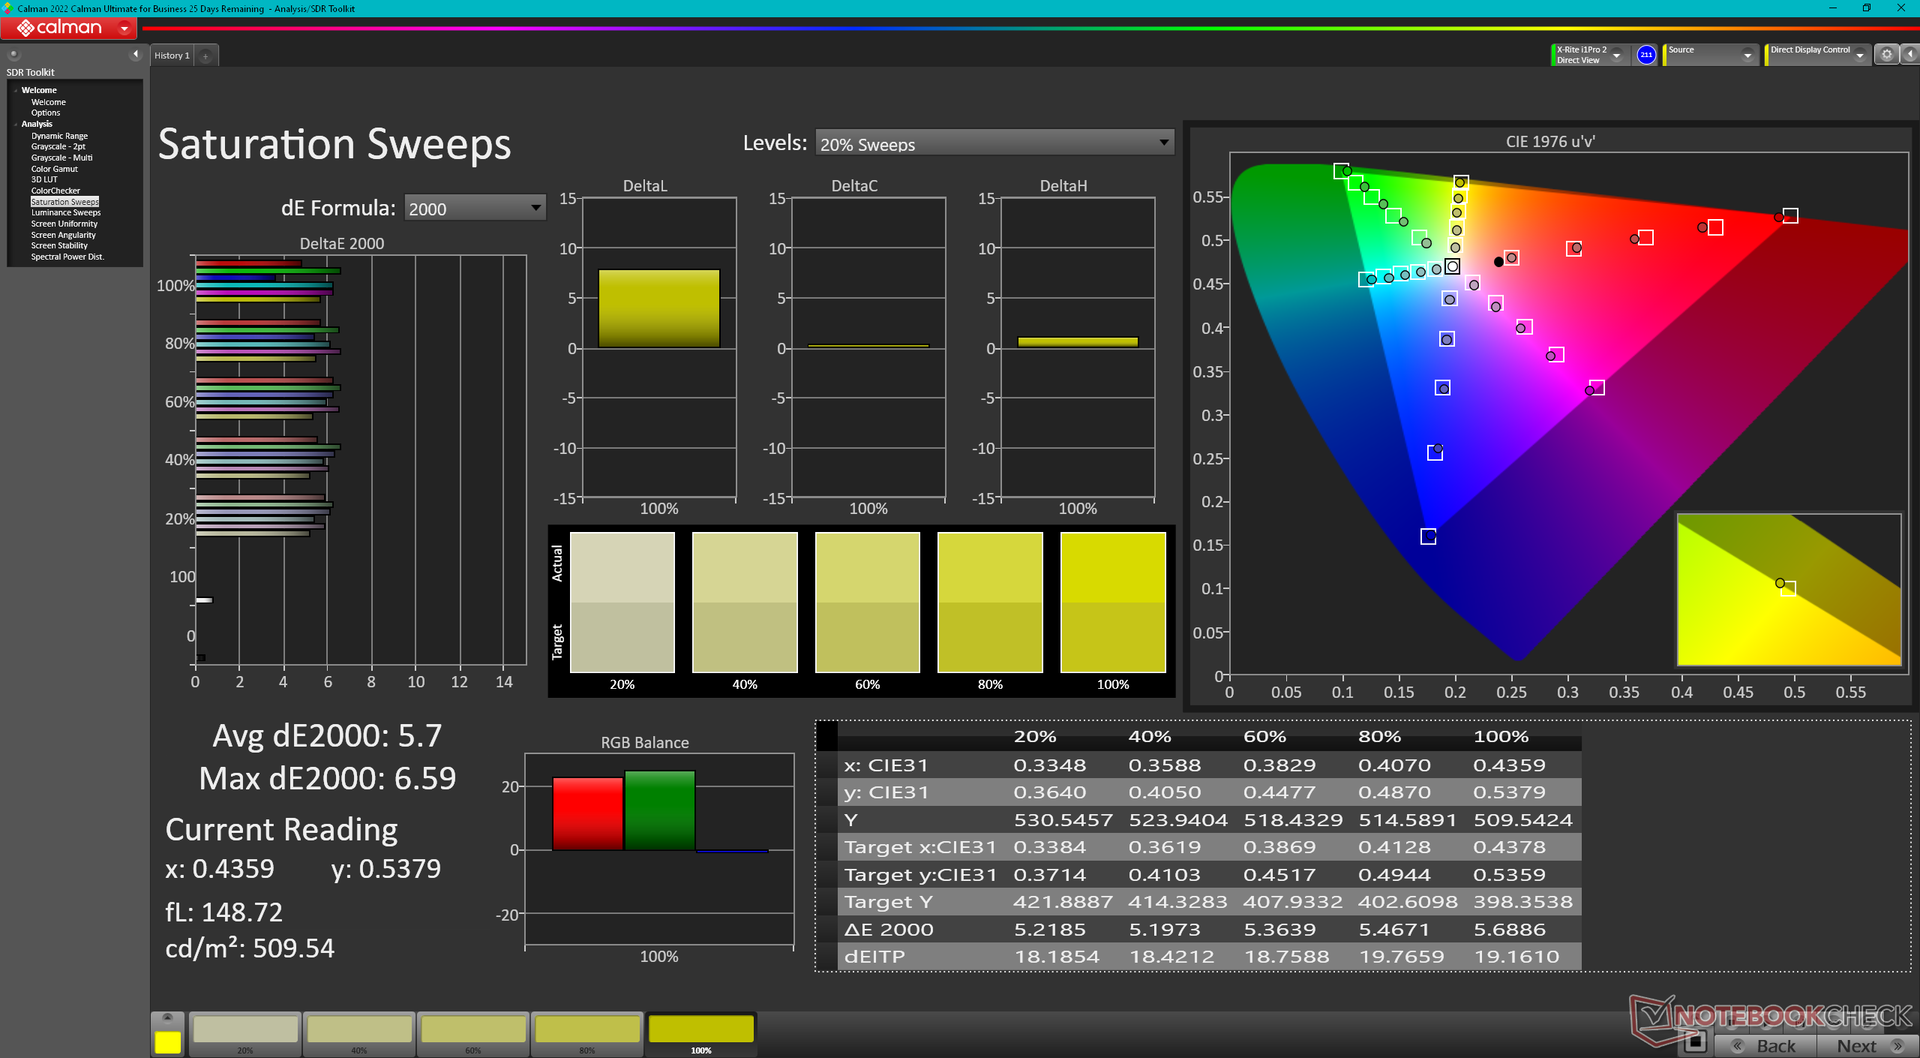
Raider 18 HX levereras med exakt samma AU Optronics B180ZAN01.0 120 Hz mini-LED-panel som finns på Titan 18 HX för en praktiskt taget identisk tittarupplevelse. Maximal ljusstyrka når nästan 600 nits när HDR är avstängd eller 935 nits när HDR är på. Jämfört med IPS eller OLED ger mini-LED en bättre HDR-tittarupplevelse eftersom den kan nå högre ljusstyrka än de båda, men till priset av högre strömförbrukning. Bärbara datorer med IPS eller OLED stöder vanligtvis HDR600 i bästa fall medan mini-LED-paneler ofta lovar HDR1000.

| |||||||||||||||||||||||||
Distribution av ljusstyrkan: 94 %
Mitt på batteriet: 392.2 cd/m²
Kontrast: ∞:1 (Svärta: 0 cd/m²)
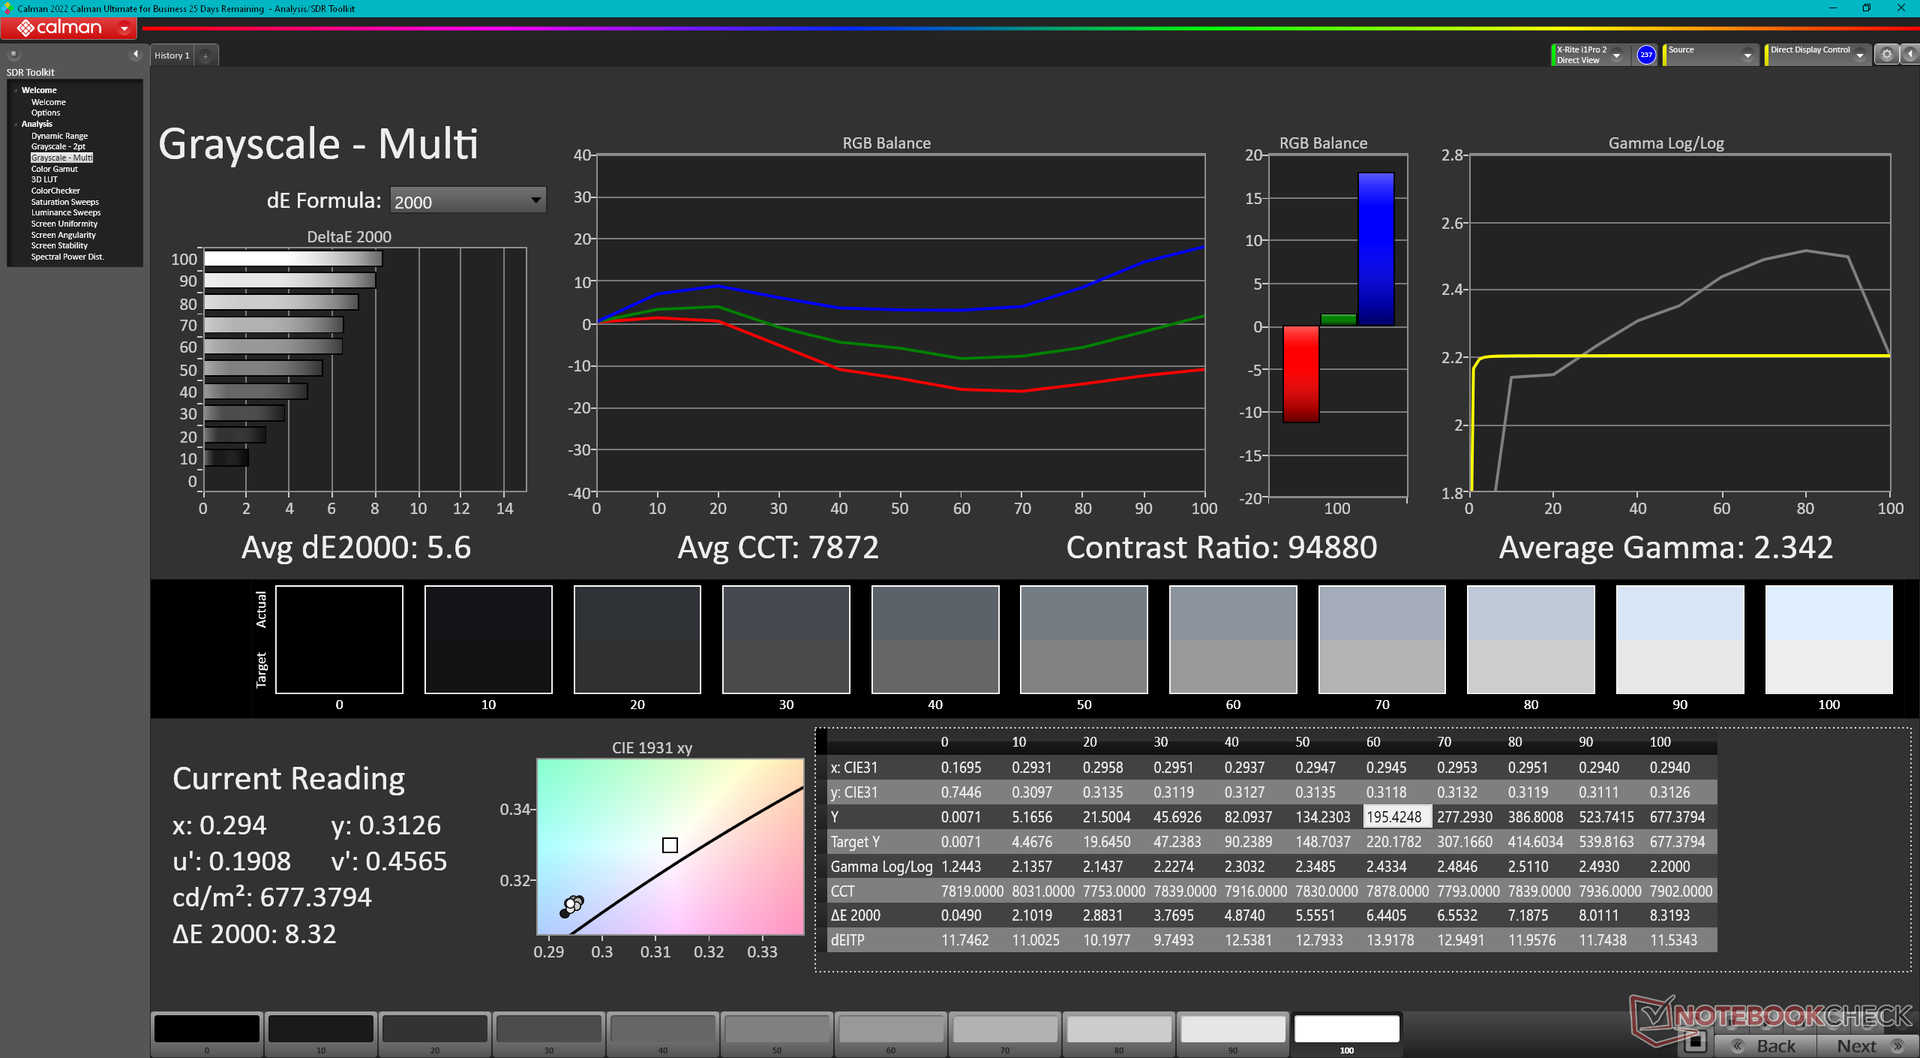
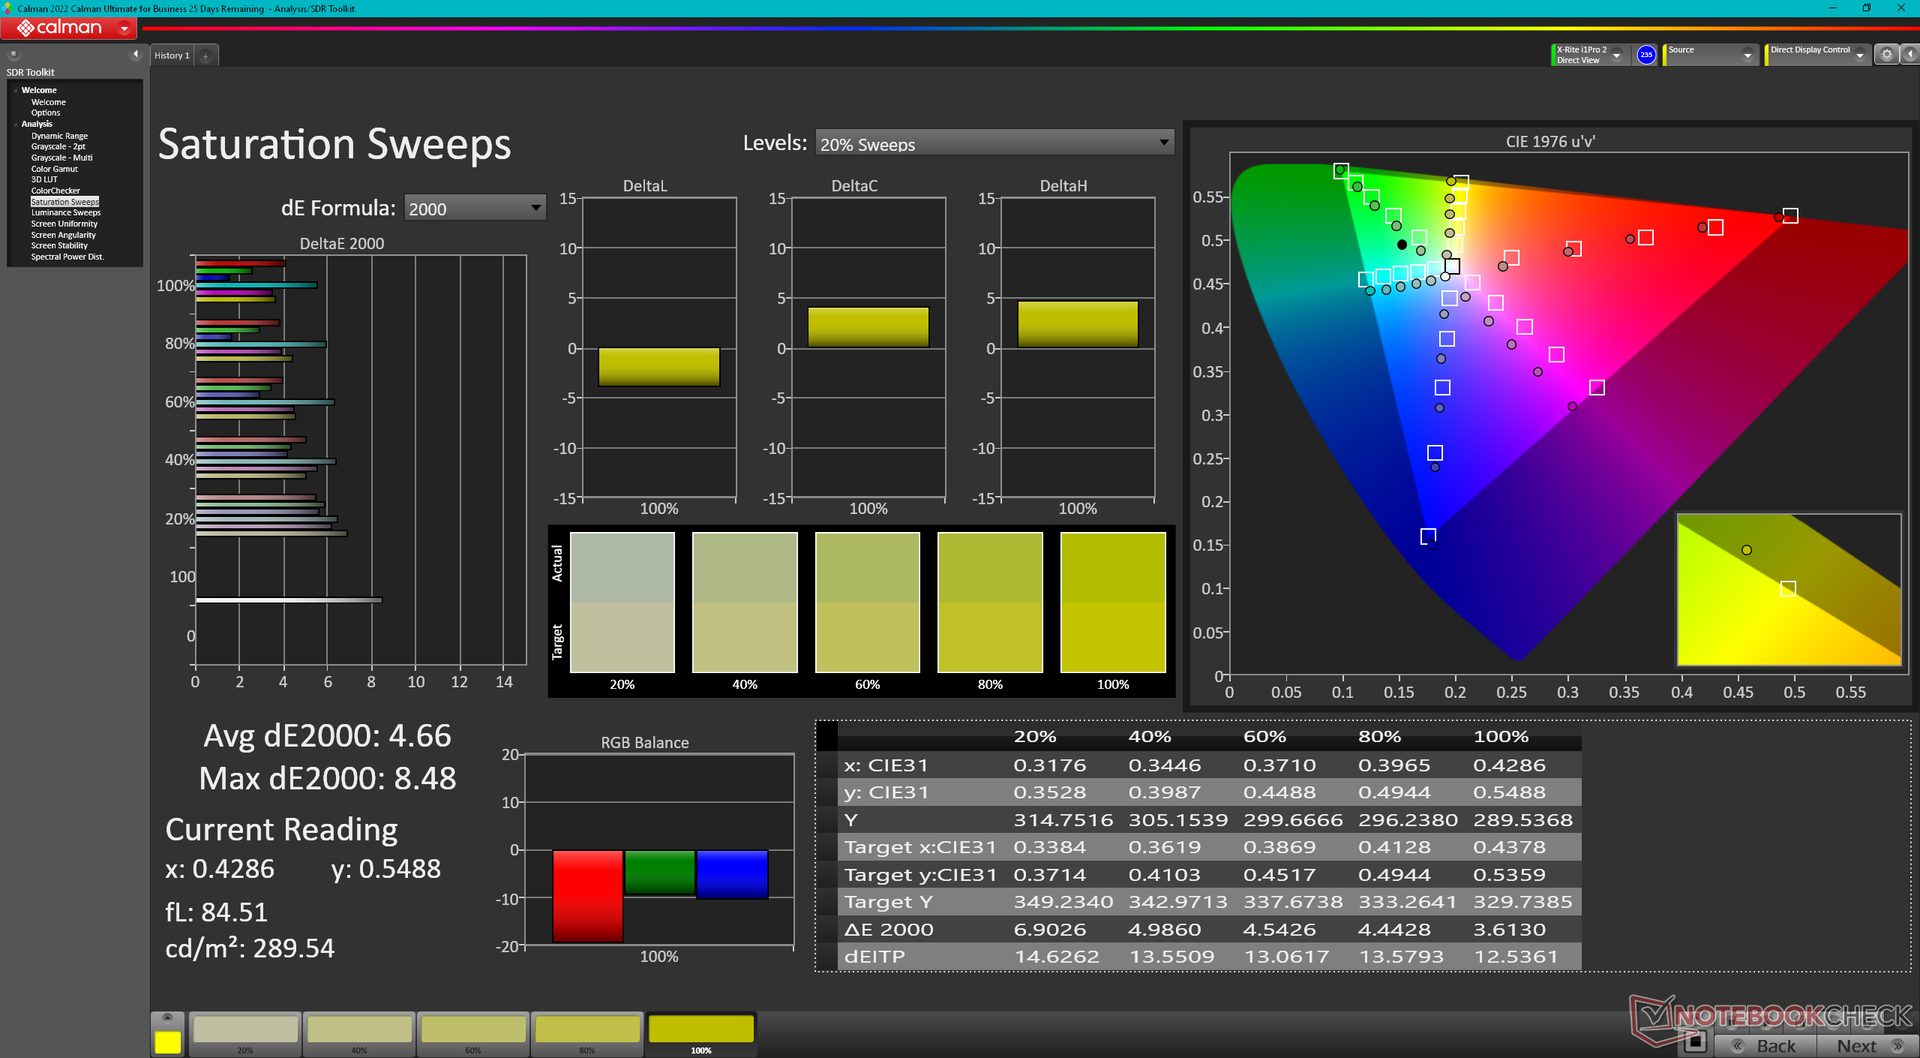
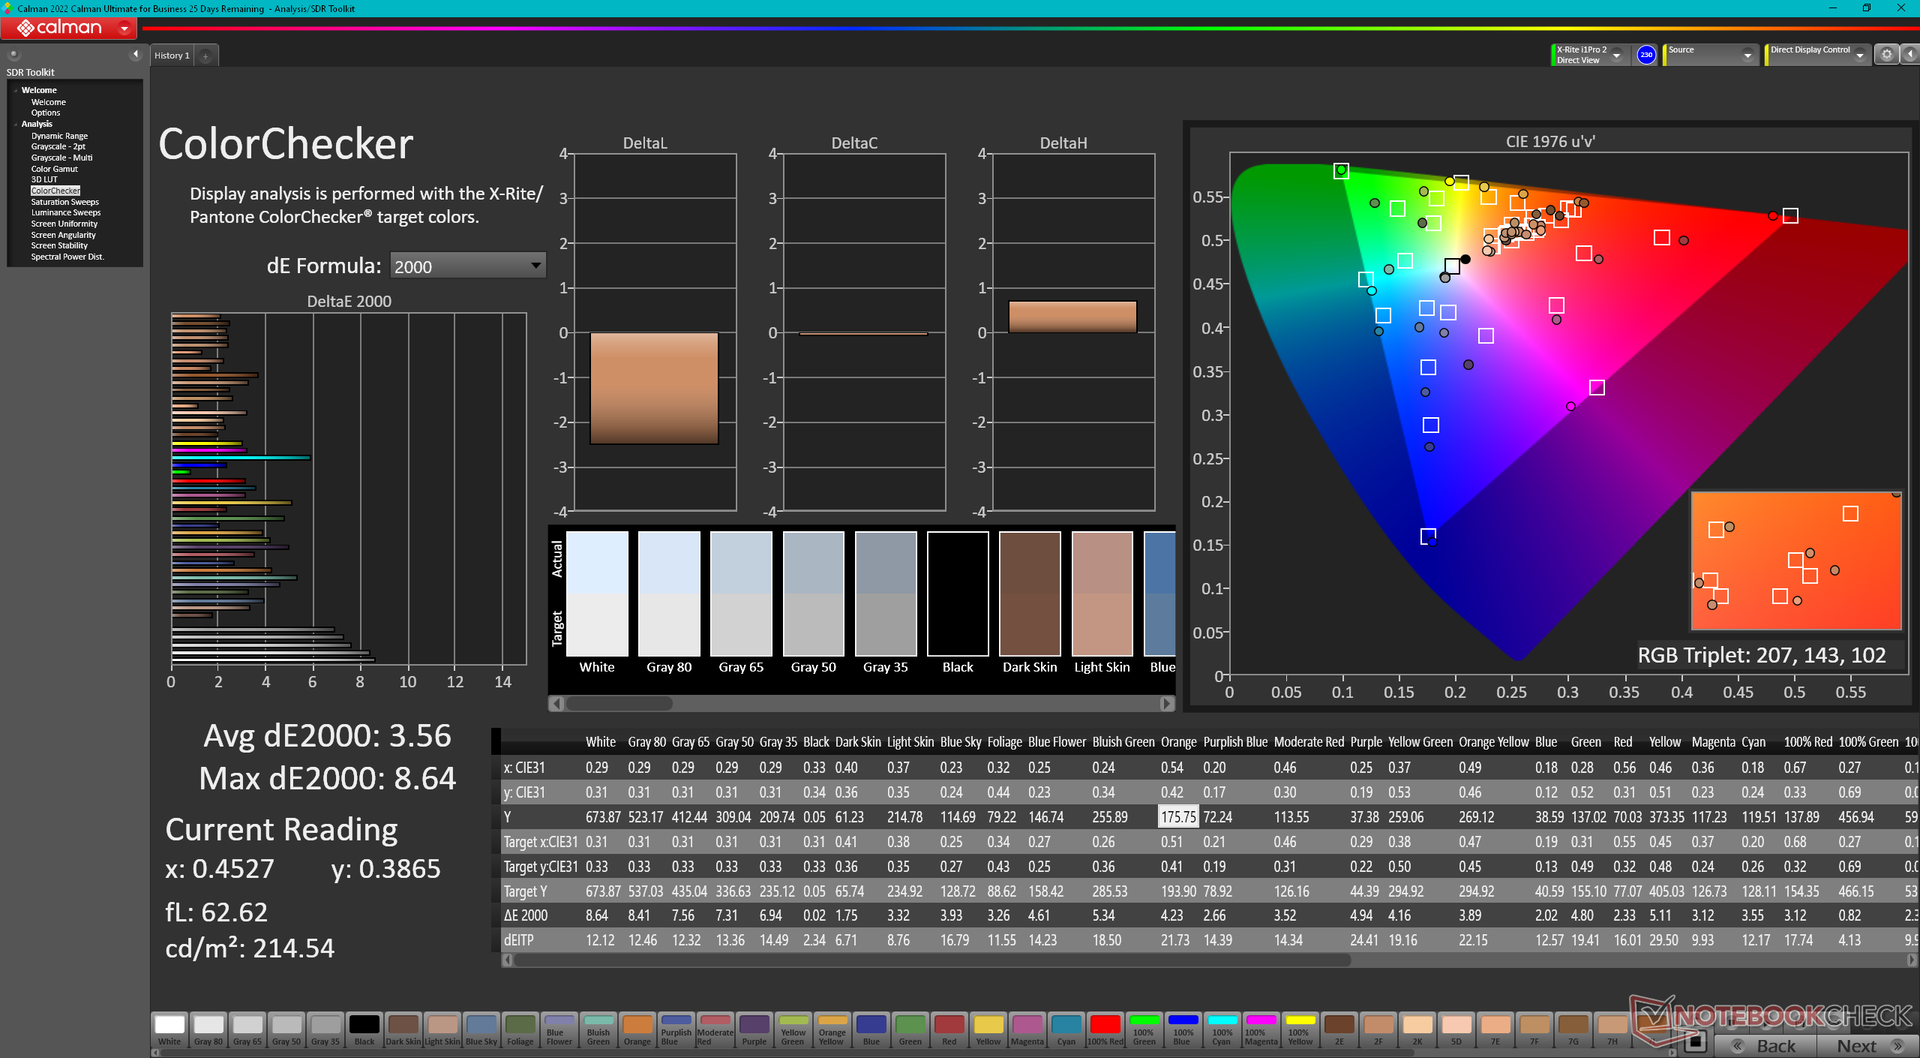
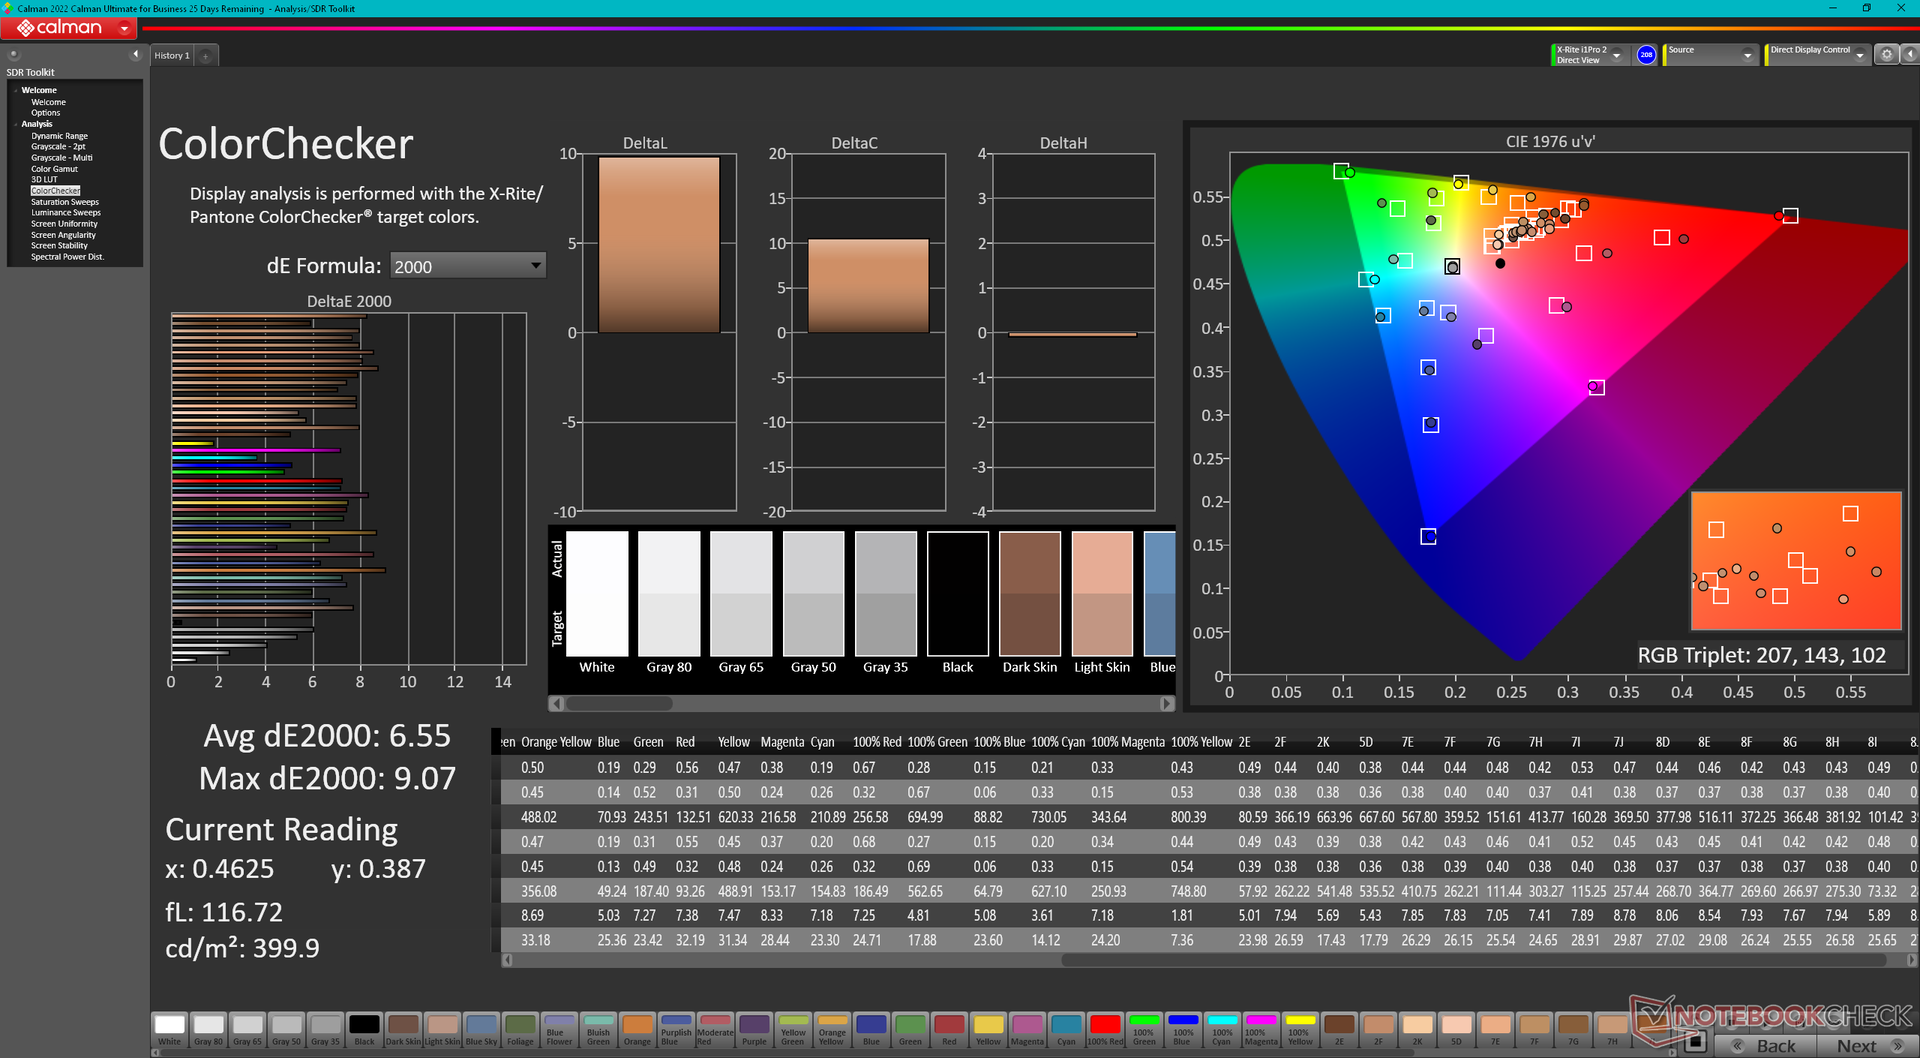
ΔE Color 3.56 | 0.5-29.43 Ø4.87, calibrated: 2.69
ΔE Greyscale 5.6 | 0.5-98 Ø5.1
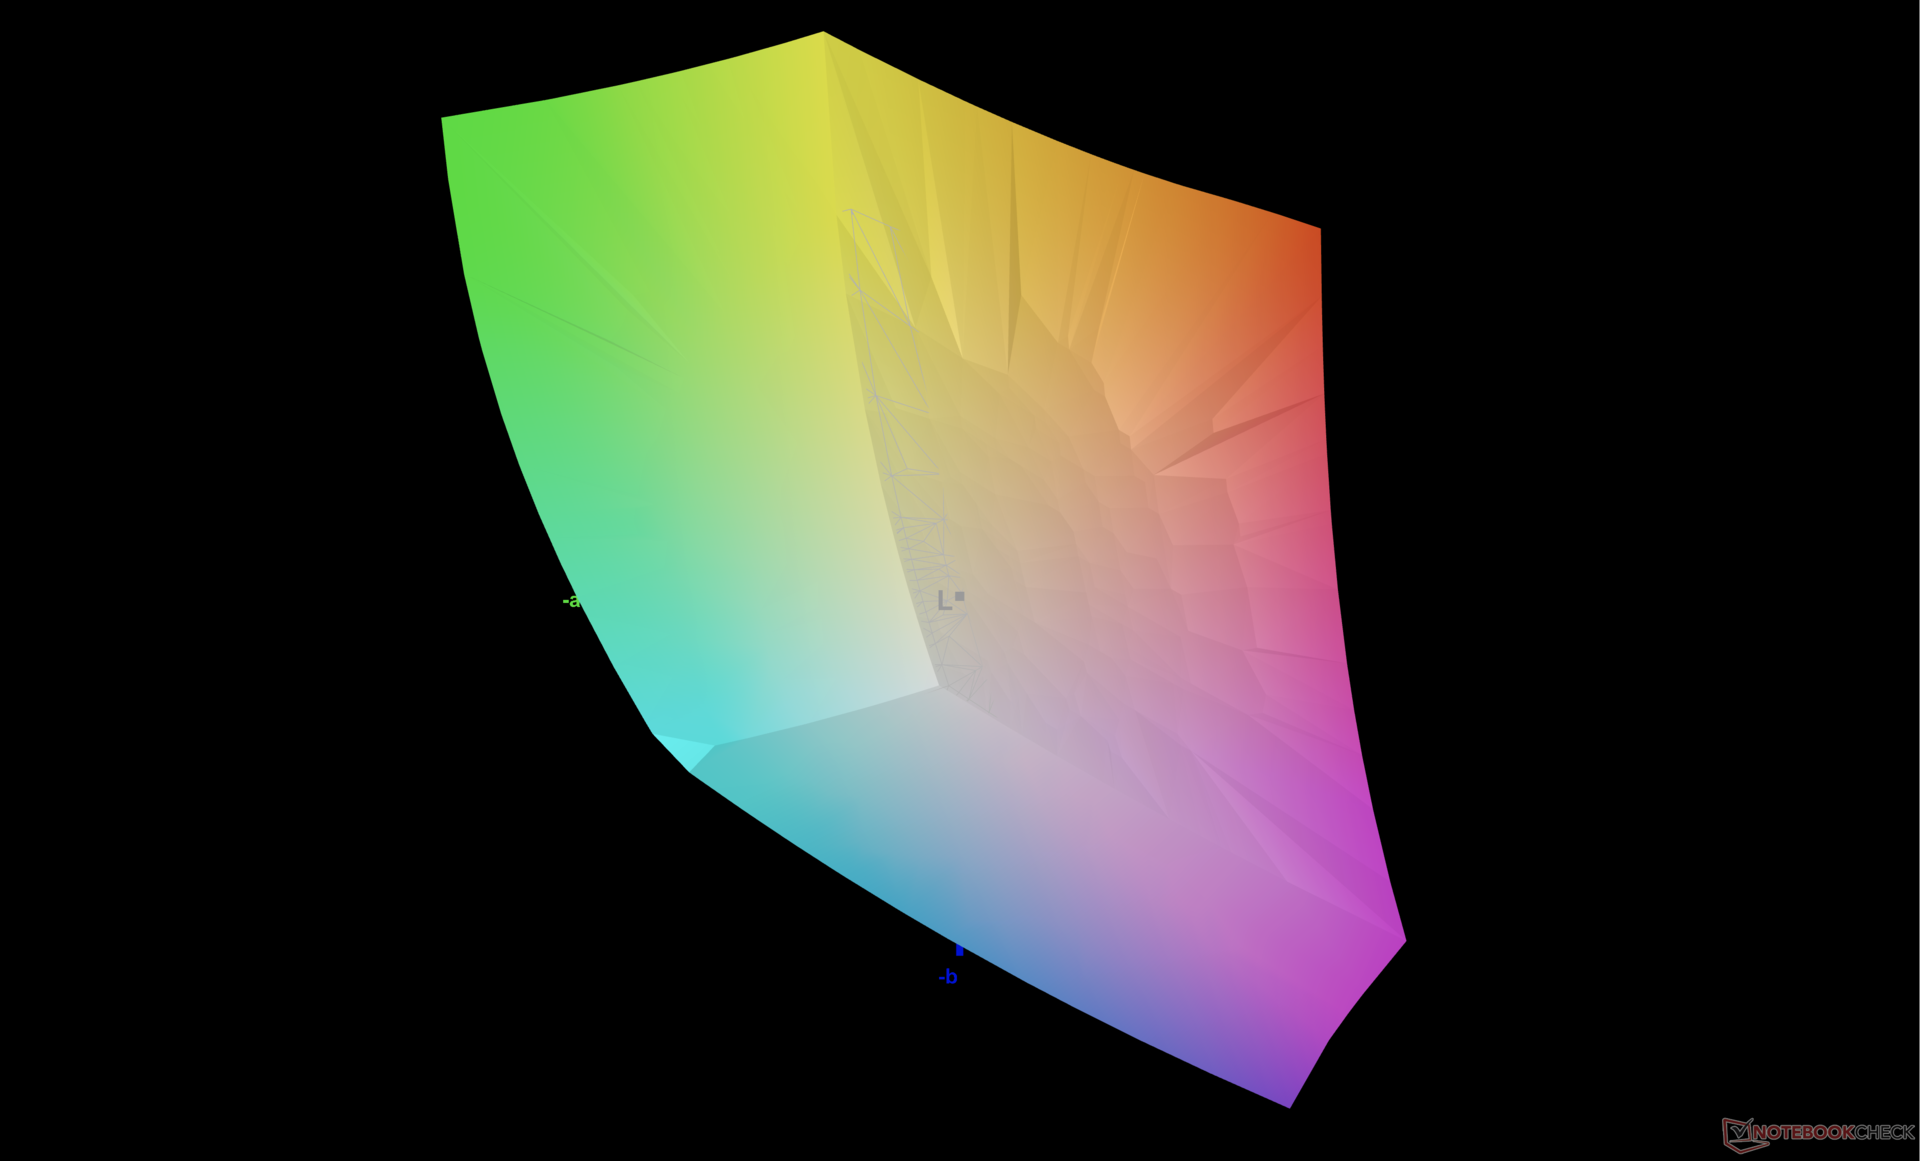
84.8% AdobeRGB 1998 (Argyll 2.2.0 3D)
99.9% sRGB (Argyll 2.2.0 3D)
96.6% Display P3 (Argyll 2.2.0 3D)
Gamma: 2.34
| MSI Raider 18 HX A14V AU Optronics B180ZAN1.0, Mini-LED, 3840x2400, 18", 120 Hz | Razer Blade 18 2024 RZ09-0509 BOE NE180QDM-NM1, Mini-LED, 2560x1600, 18", 300 Hz | Alienware m18 R2 BOE NE18NZ1, IPS, 2560x1600, 18", 165 Hz | MSI Titan 18 HX A14VIG AU Optronics B180ZAN01.0, Mini-LED, 3840x2400, 18", 120 Hz | Asus ROG Strix G18 G814JI NE180QDM-NZ2 (BOE0B35), IPS, 2560x1600, 18", 240 Hz | Acer Predator Helios 18 PH18-72-98MW B180QAN01.2 (AUO45A8), Mini-LED, 2560x1600, 18", 250 Hz | |
|---|---|---|---|---|---|---|
| Display | 1% | 2% | 1% | 1% | 4% | |
| Display P3 Coverage | 96.6 | 99 2% | 97.8 1% | 98.1 2% | 98.1 2% | 99.7 3% |
| sRGB Coverage | 99.9 | 100 0% | 99.5 0% | 99.8 0% | 99.9 0% | 100 0% |
| AdobeRGB 1998 Coverage | 84.8 | 86.9 2% | 88.9 5% | 86.2 2% | 85.6 1% | 91.6 8% |
| Response Times | 341% | 68% | 3% | 67% | 62% | |
| Response Time Grey 50% / Grey 80% * | 10.4 ? | 7.6 ? 27% | 5.3 ? 49% | 8.6 ? 17% | 5.6 ? 46% | 8 ? 23% |
| Response Time Black / White * | 75.8 ? | 14 ? 82% | 10.4 ? 86% | 81.8 ? -8% | 9 ? 88% | 17.6 ? 77% |
| PWM Frequency | 2606.2 ? | 26444 ? 915% | 2592 ? -1% | 4832 ? 85% | ||
| Screen | 29% | 8% | 2% | 23% | 24% | |
| Brightness middle | 575.7 | 605.4 5% | 271.8 -53% | 467.5 -19% | 471 -18% | 722 25% |
| Brightness | 574 | 600 5% | 275 -52% | 459 -20% | 422 -26% | 724 26% |
| Brightness Distribution | 94 | 97 3% | 78 -17% | 90 -4% | 83 -12% | 93 -1% |
| Black Level * | 0.62 | 0.27 | 0.47 | 0.04 | ||
| Colorchecker dE 2000 * | 3.56 | 1.53 57% | 2.48 30% | 3.77 -6% | 2.05 42% | 3.4 4% |
| Colorchecker dE 2000 max. * | 8.64 | 4.15 52% | 5.59 35% | 6.12 29% | 4.15 52% | 5.32 38% |
| Colorchecker dE 2000 calibrated * | 2.69 | 0.56 79% | 2.94 -9% | 0.8 70% | 1.6 41% | |
| Greyscale dE 2000 * | 5.6 | 2.6 54% | 3.7 34% | 3.2 43% | 2.8 50% | 3.8 32% |
| Gamma | 2.34 94% | 2.22 99% | 2.2 100% | 2.43 91% | 2.204 100% | 2.383 92% |
| CCT | 7872 83% | 6843 95% | 6355 102% | 6478 100% | 7122 91% | 7051 92% |
| Contrast | 976 | 1007 | 1002 | 18050 | ||
| Totalt genomsnitt (program/inställningar) | 124% /
100% | 26% /
16% | 2% /
2% | 30% /
25% | 30% /
28% |
* ... mindre är bättre
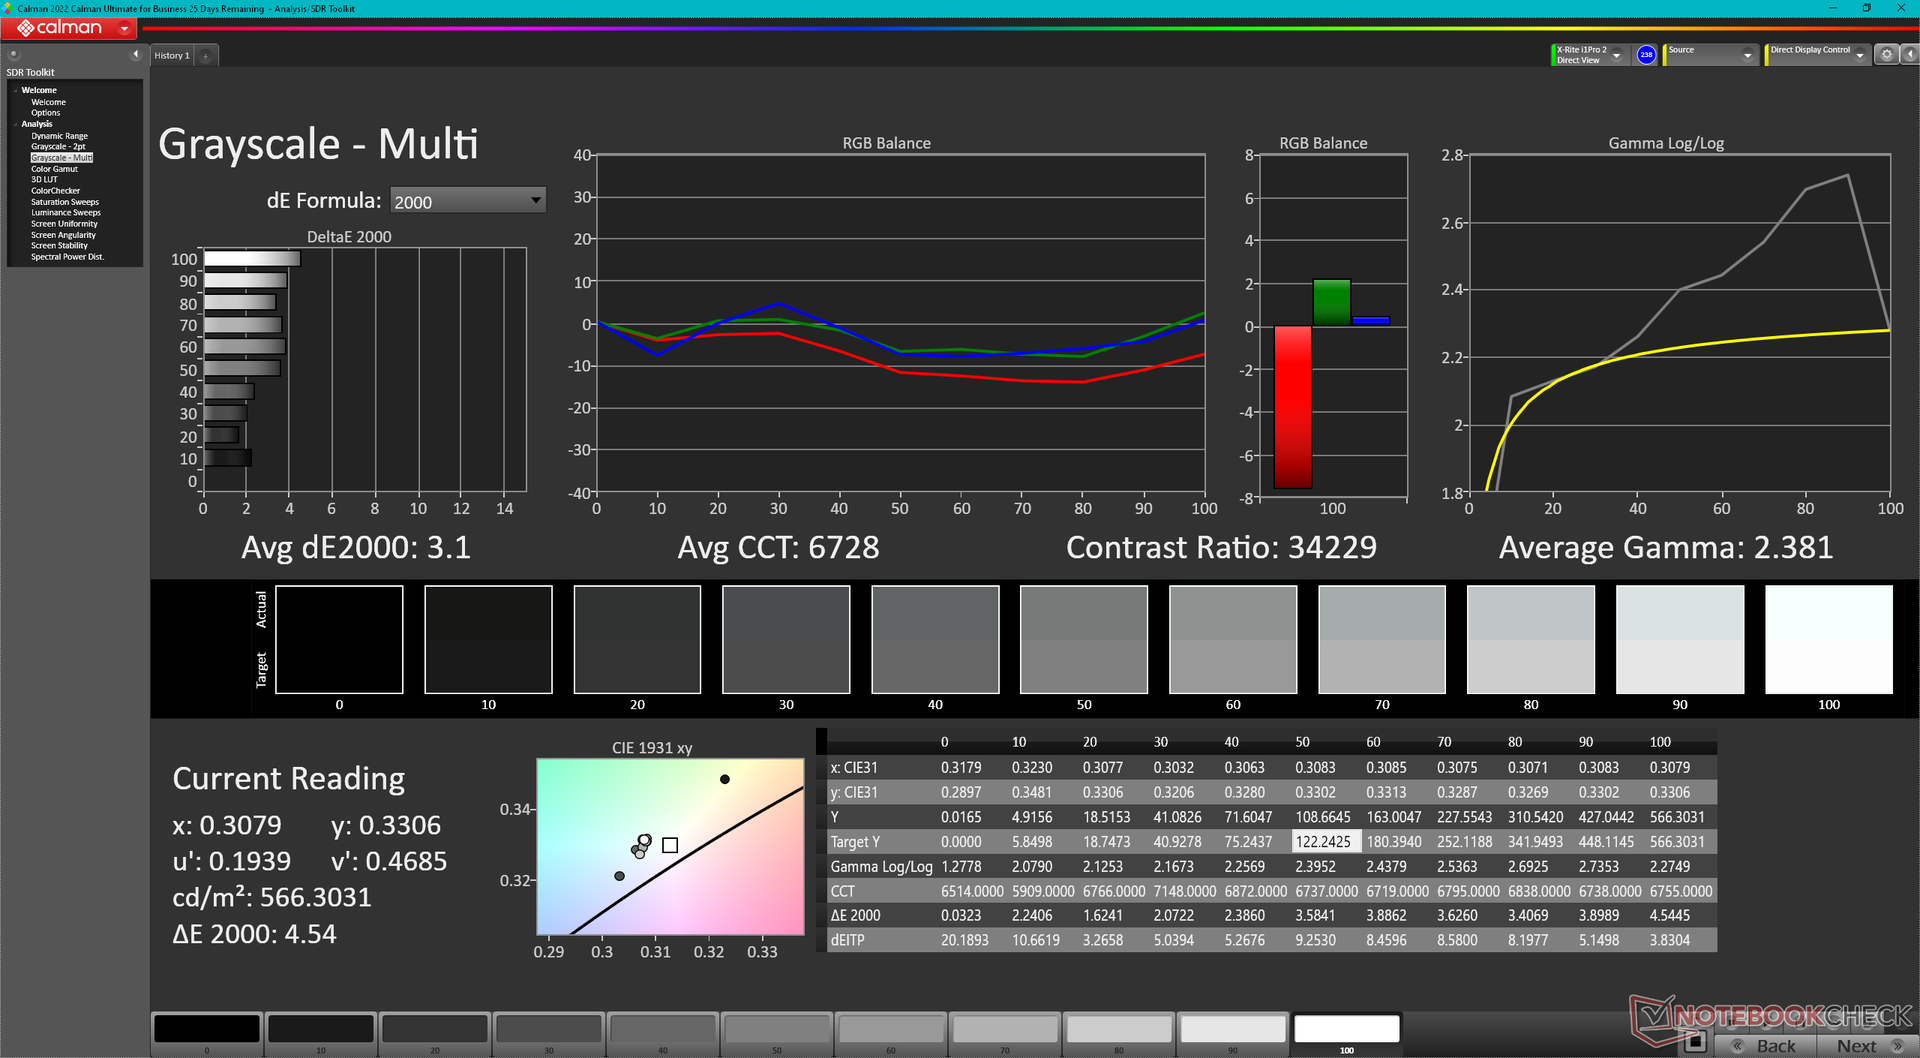
Färgtemperaturen när den är inställd på Display P3 och HDR av är ganska sval på 7872. Genom att aktivera HDR inaktiveras automatiskt alla MSI TrueColor-inställningar, men färgtemperaturen blir också automatiskt varmare vid 6521 för mer exakta färger. MSI annonserar inte fabrikskalibrering för den här Raider-modellen.
Visa svarstider
| ↔ Svarstid svart till vitt | ||
|---|---|---|
| 75.8 ms ... stiga ↗ och falla ↘ kombinerat | ↗ 71 ms stiga | 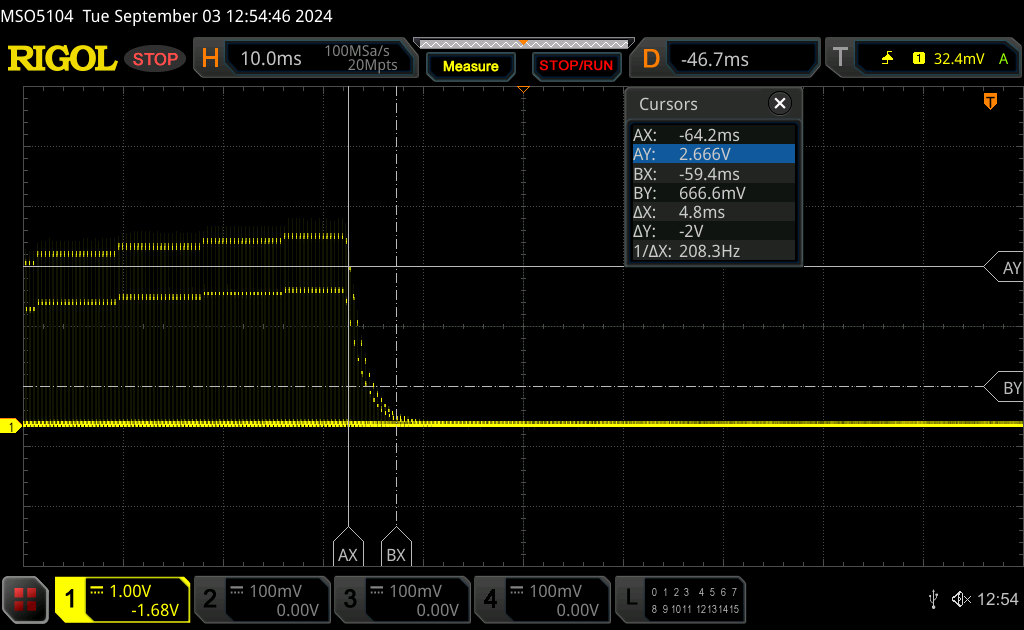 |
| ↘ 4.8 ms hösten | ||
| Skärmen visar långsamma svarsfrekvenser i våra tester och kommer att vara otillfredsställande för spelare. I jämförelse sträcker sig alla testade enheter från 0.1 (minst) till 240 (maximalt) ms. » 100 % av alla enheter är bättre. Detta innebär att den uppmätta svarstiden är sämre än genomsnittet av alla testade enheter (20.7 ms). | ||
| ↔ Svarstid 50 % grått till 80 % grått | ||
| 10.4 ms ... stiga ↗ och falla ↘ kombinerat | ↗ 4.8 ms stiga | 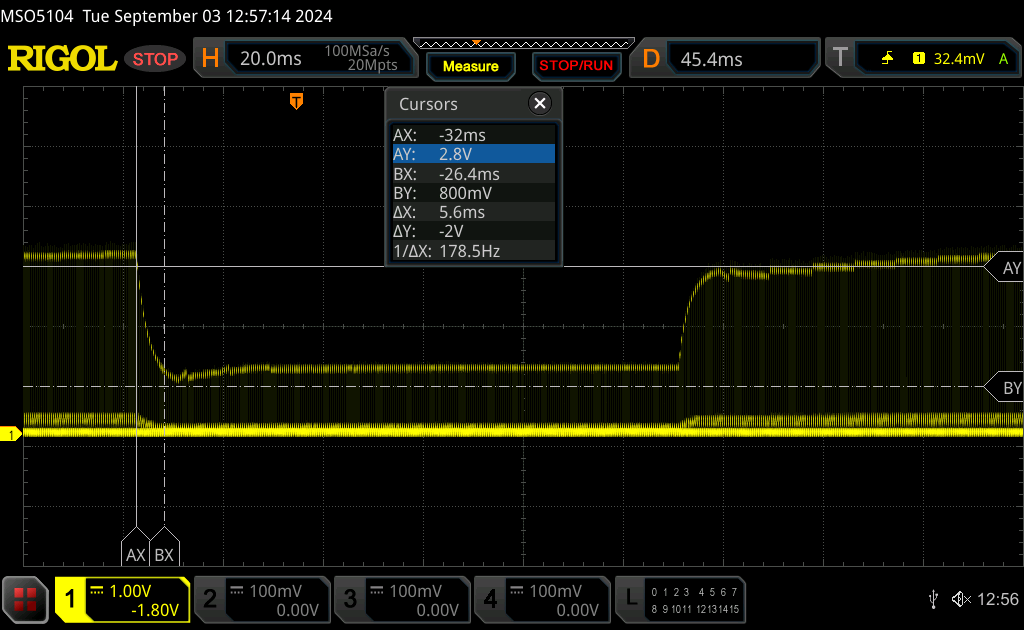 |
| ↘ 5.6 ms hösten | ||
| Skärmen visar bra svarsfrekvens i våra tester, men kan vara för långsam för konkurrenskraftiga spelare. I jämförelse sträcker sig alla testade enheter från 0.165 (minst) till 636 (maximalt) ms. » 21 % av alla enheter är bättre. Det betyder att den uppmätta svarstiden är bättre än genomsnittet av alla testade enheter (32.5 ms). | ||
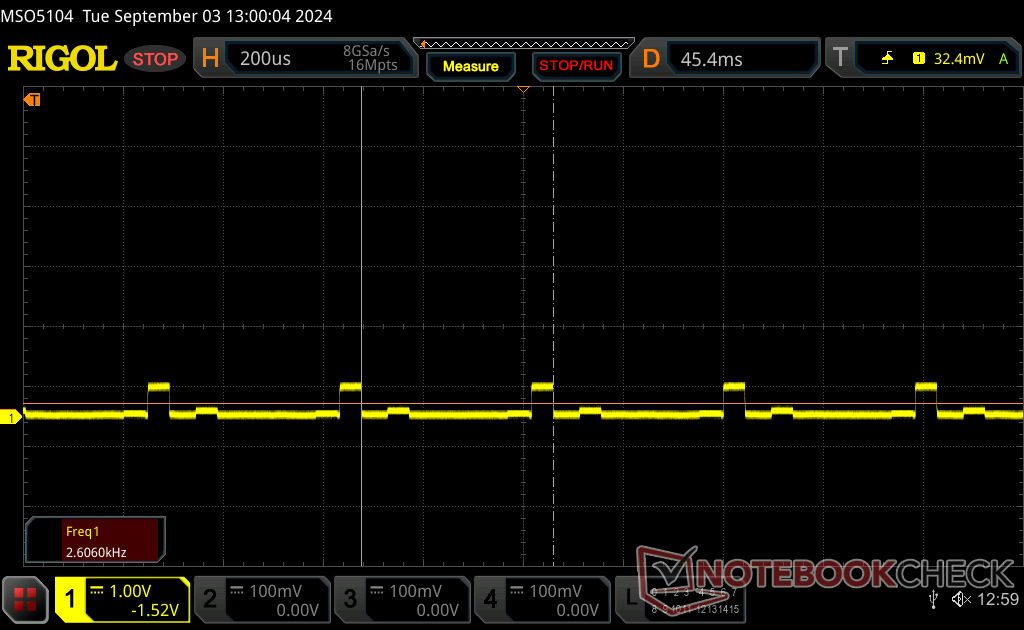
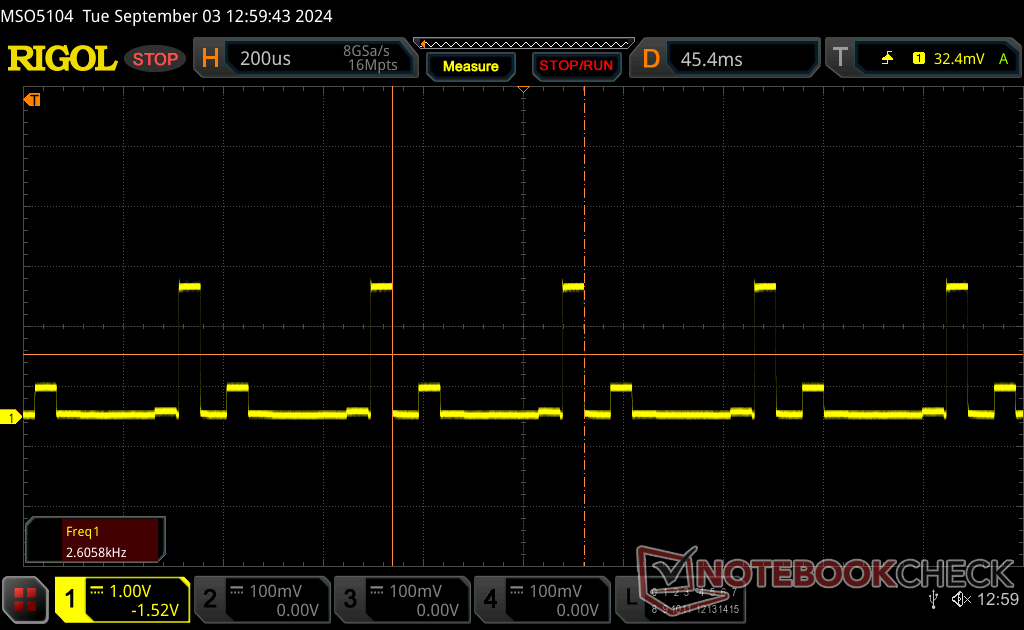
Skärmflimmer / PWM (Puls-Width Modulation)
| Skärmflimmer / PWM upptäckt | 2606.2 Hz Amplitude: 90 % | ≤ 100 % ljusstyrka inställning | 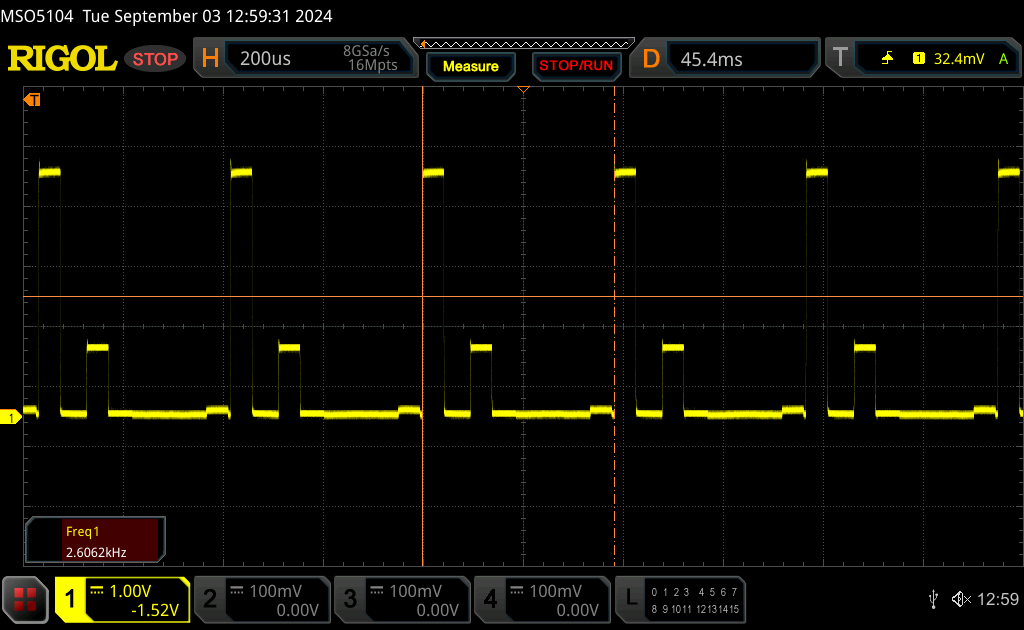 |
Displayens bakgrundsbelysning flimrar vid 2606.2 Hz (i värsta fall, t.ex. med PWM) Flimrande upptäckt vid en ljusstyrkeinställning på 100 % och lägre. Det ska inte finnas något flimmer eller PWM över denna ljusstyrkeinställning. Frekvensen för 2606.2 Hz är ganska hög, så de flesta användare som är känsliga för PWM bör inte märka något flimmer. Som jämförelse: 53 % av alla testade enheter använder inte PWM för att dämpa skärmen. Om PWM upptäcktes mättes ett medelvärde av 8508 (minst: 5 - maximum: 343500) Hz. | |||


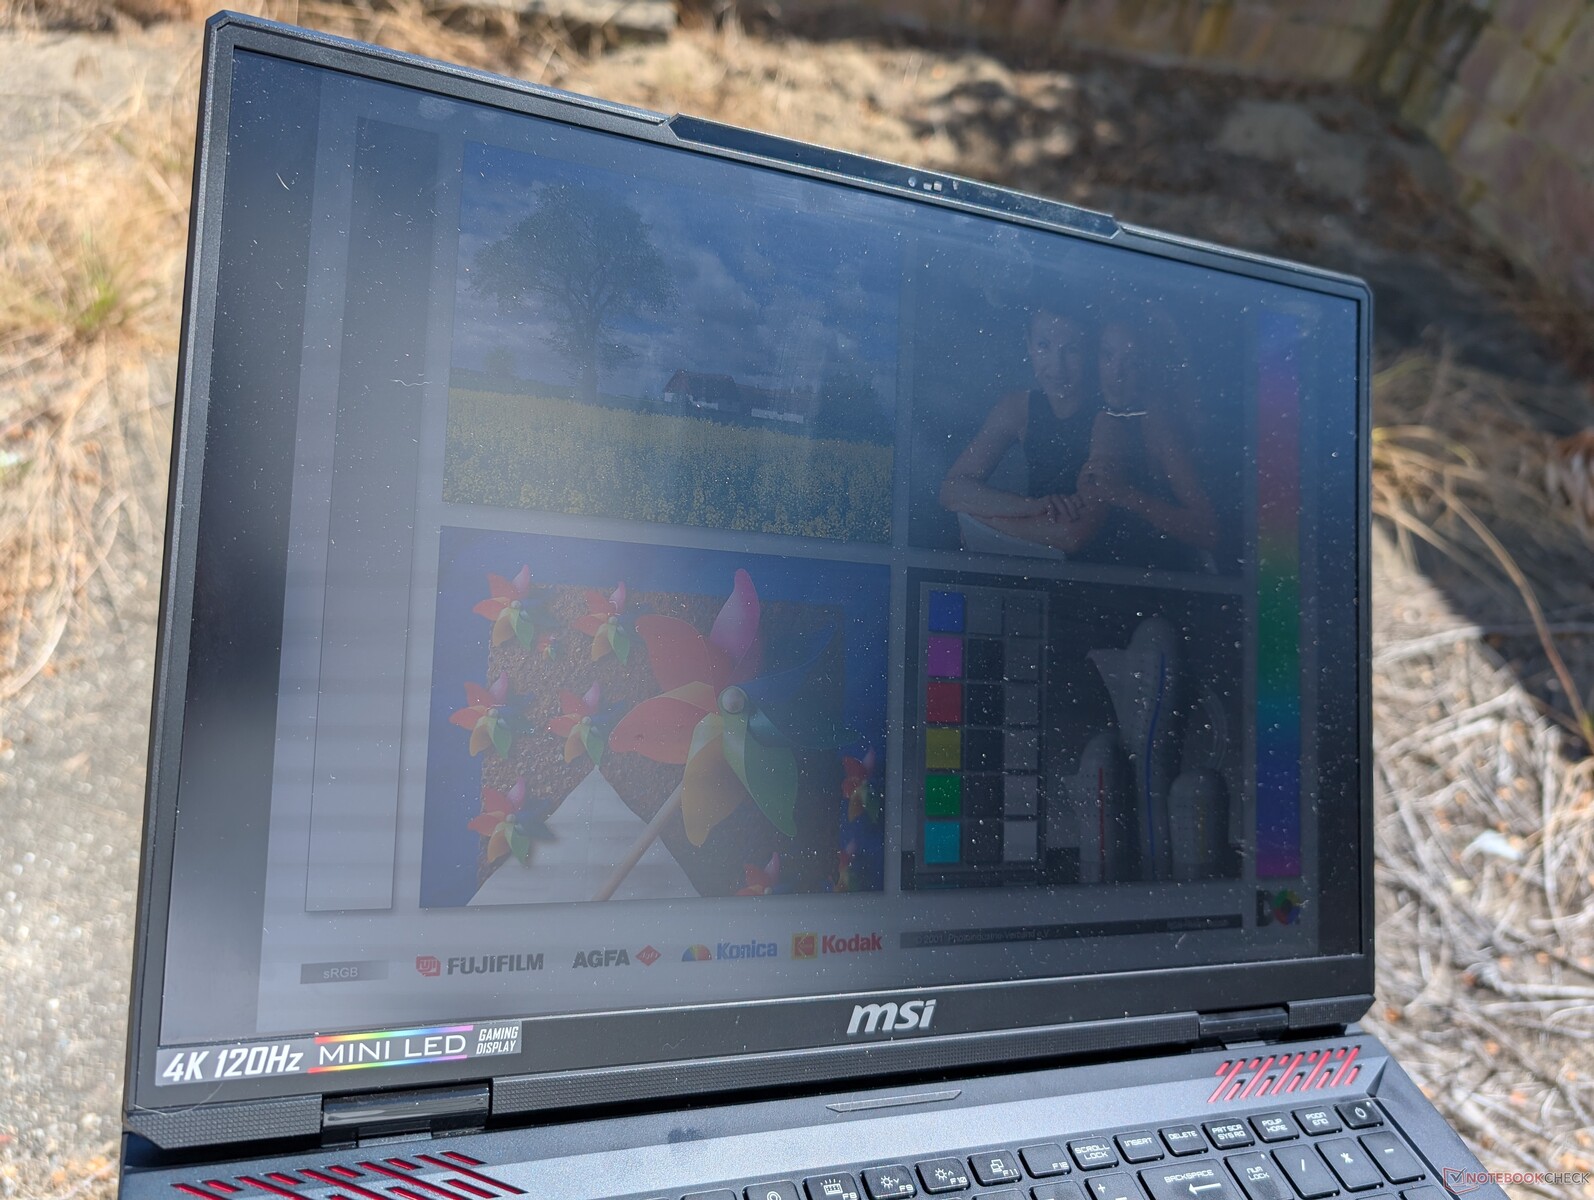
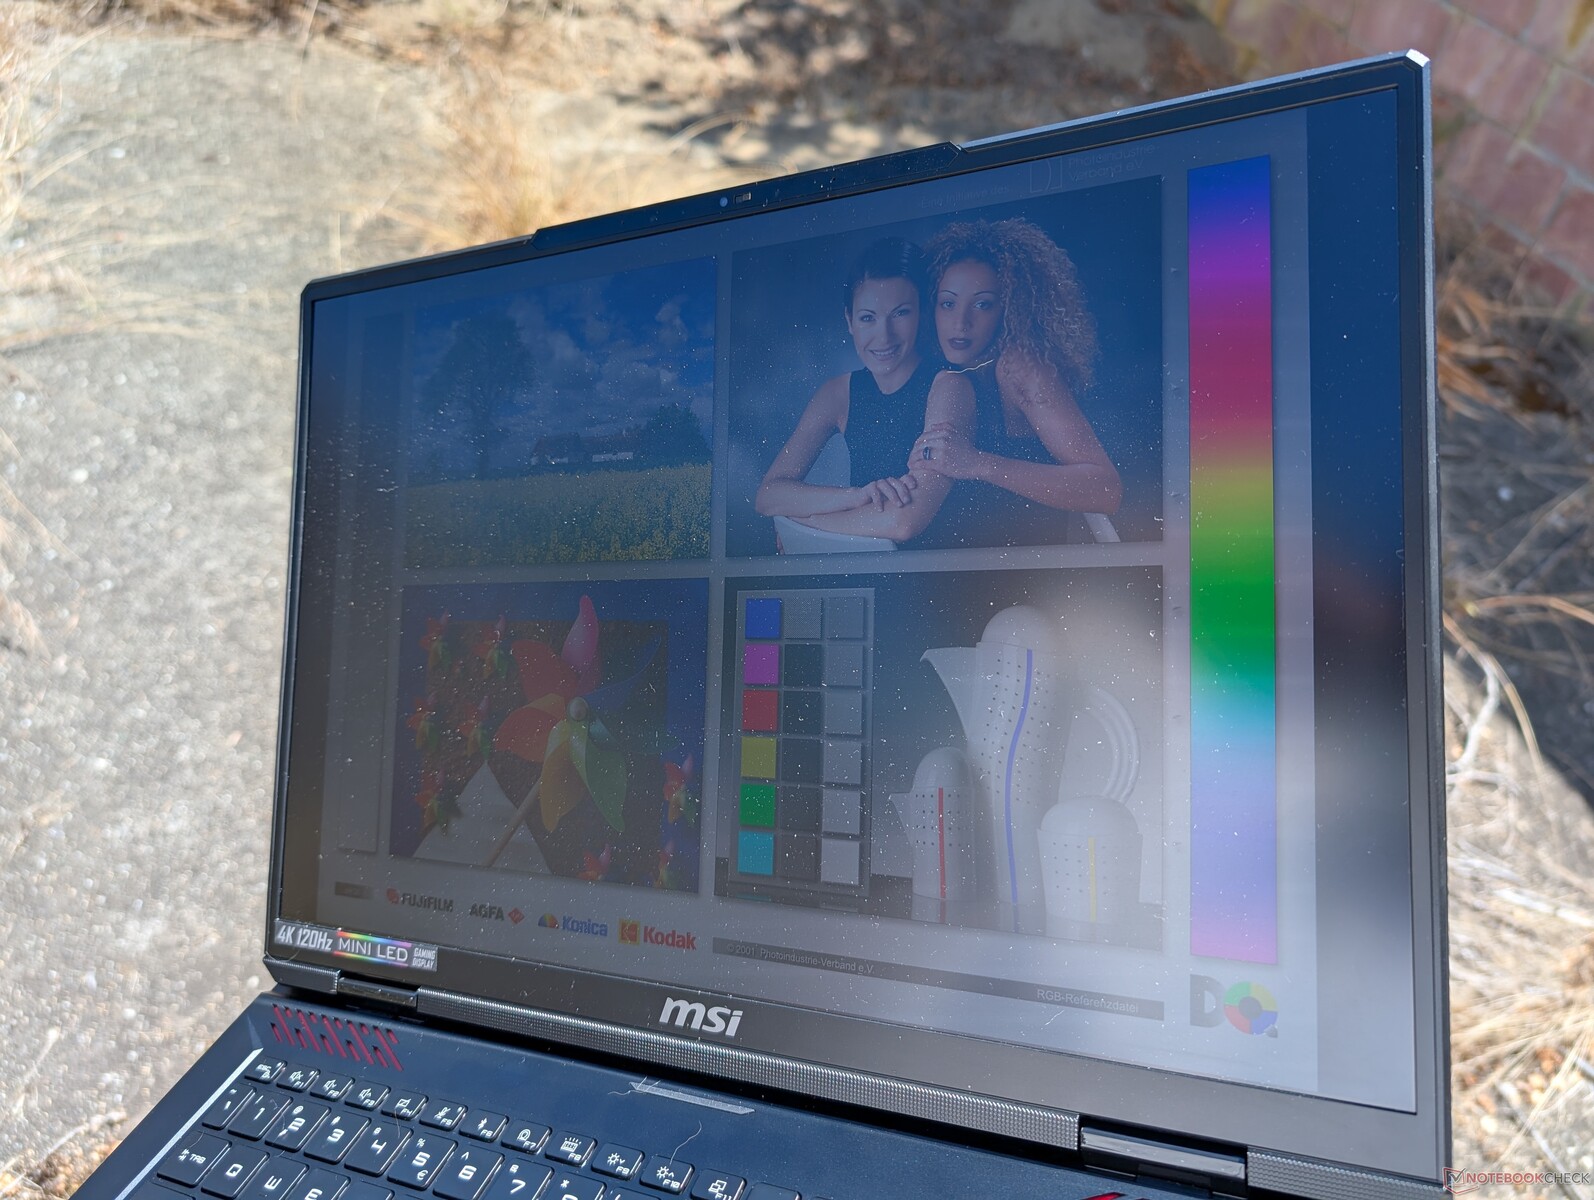
Sikten utomhus är bara hyfsad i skugga och inte så bra i solljus. Batteridrift minskar den maximala ljusstyrkan till endast 392 nits och Windows HDR inaktiveras automatiskt.
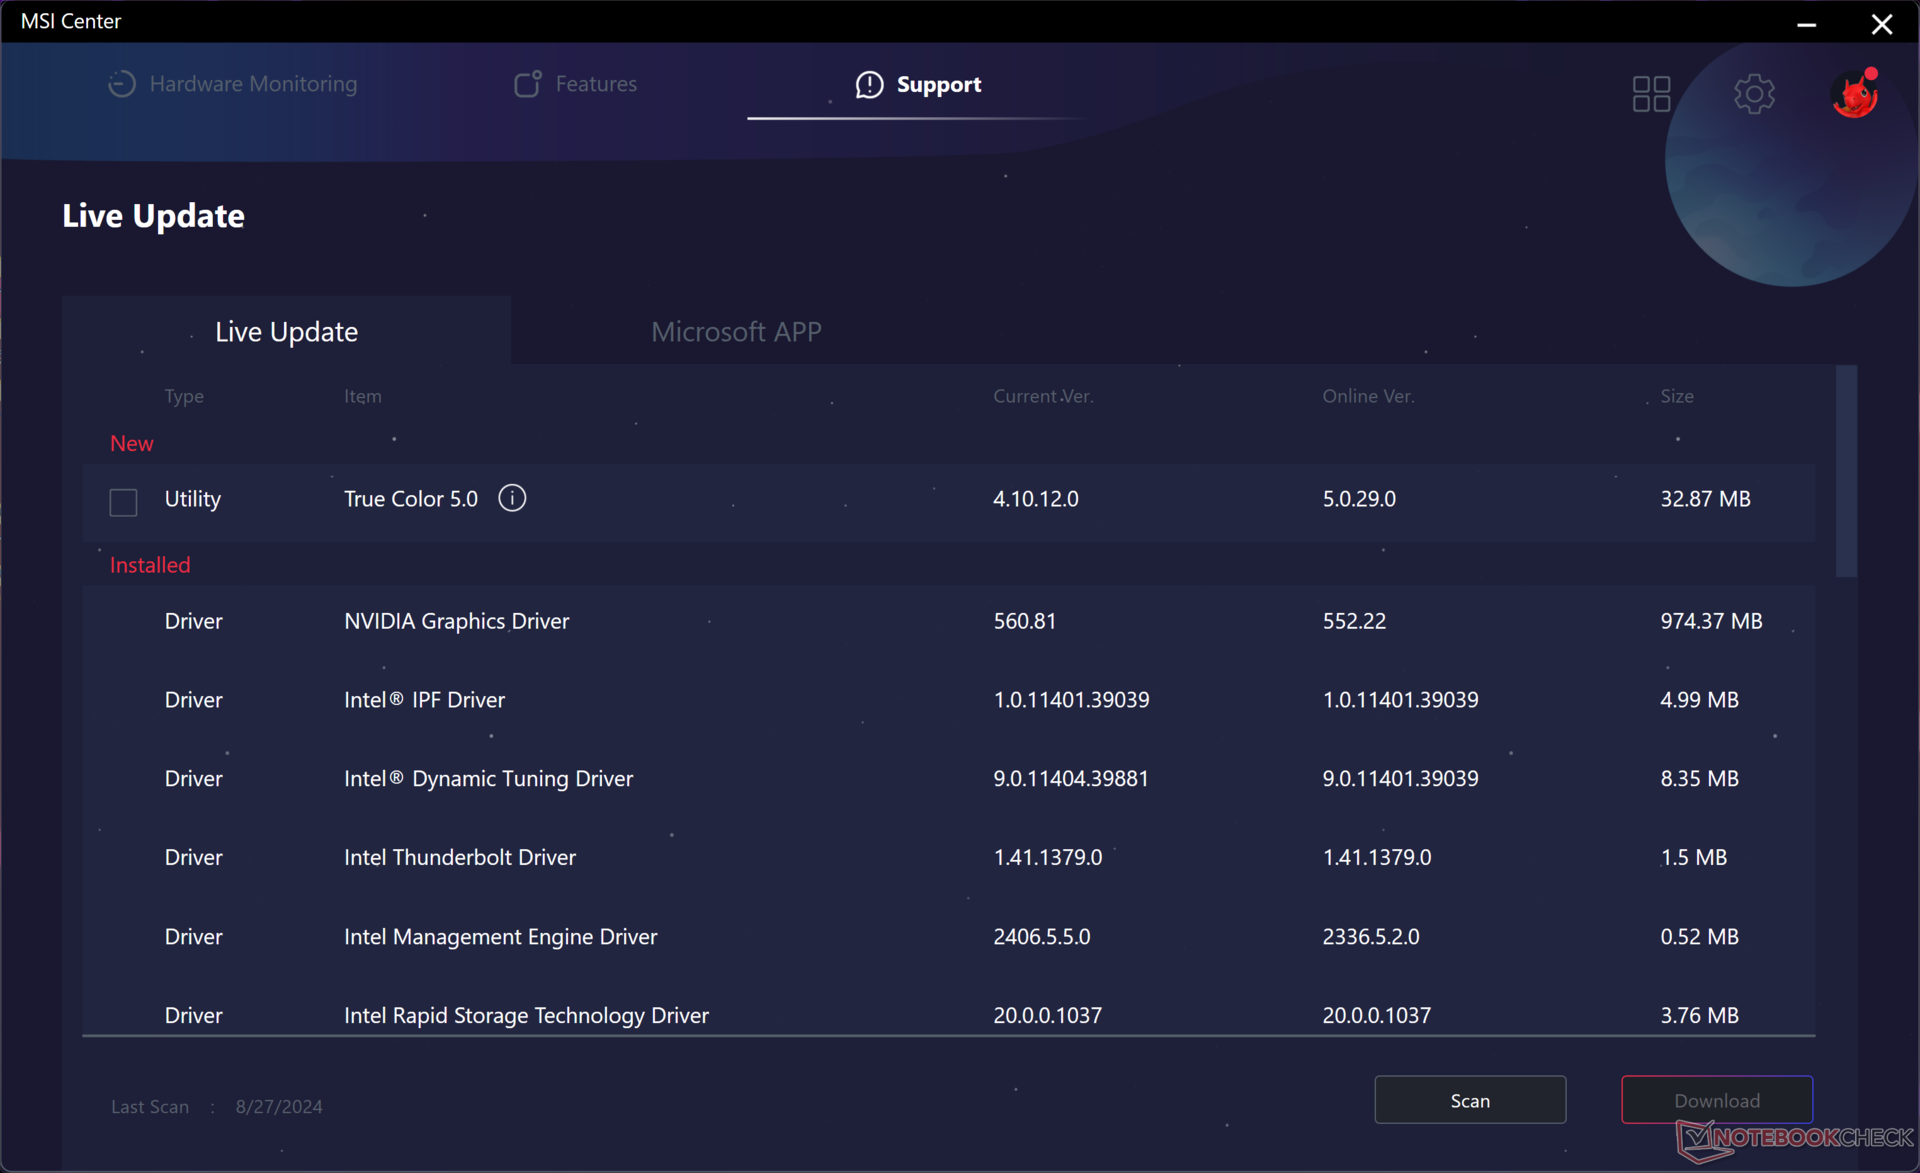
Prestanda - Nytt CPU-namn, samma CPU-prestanda
Testförhållanden
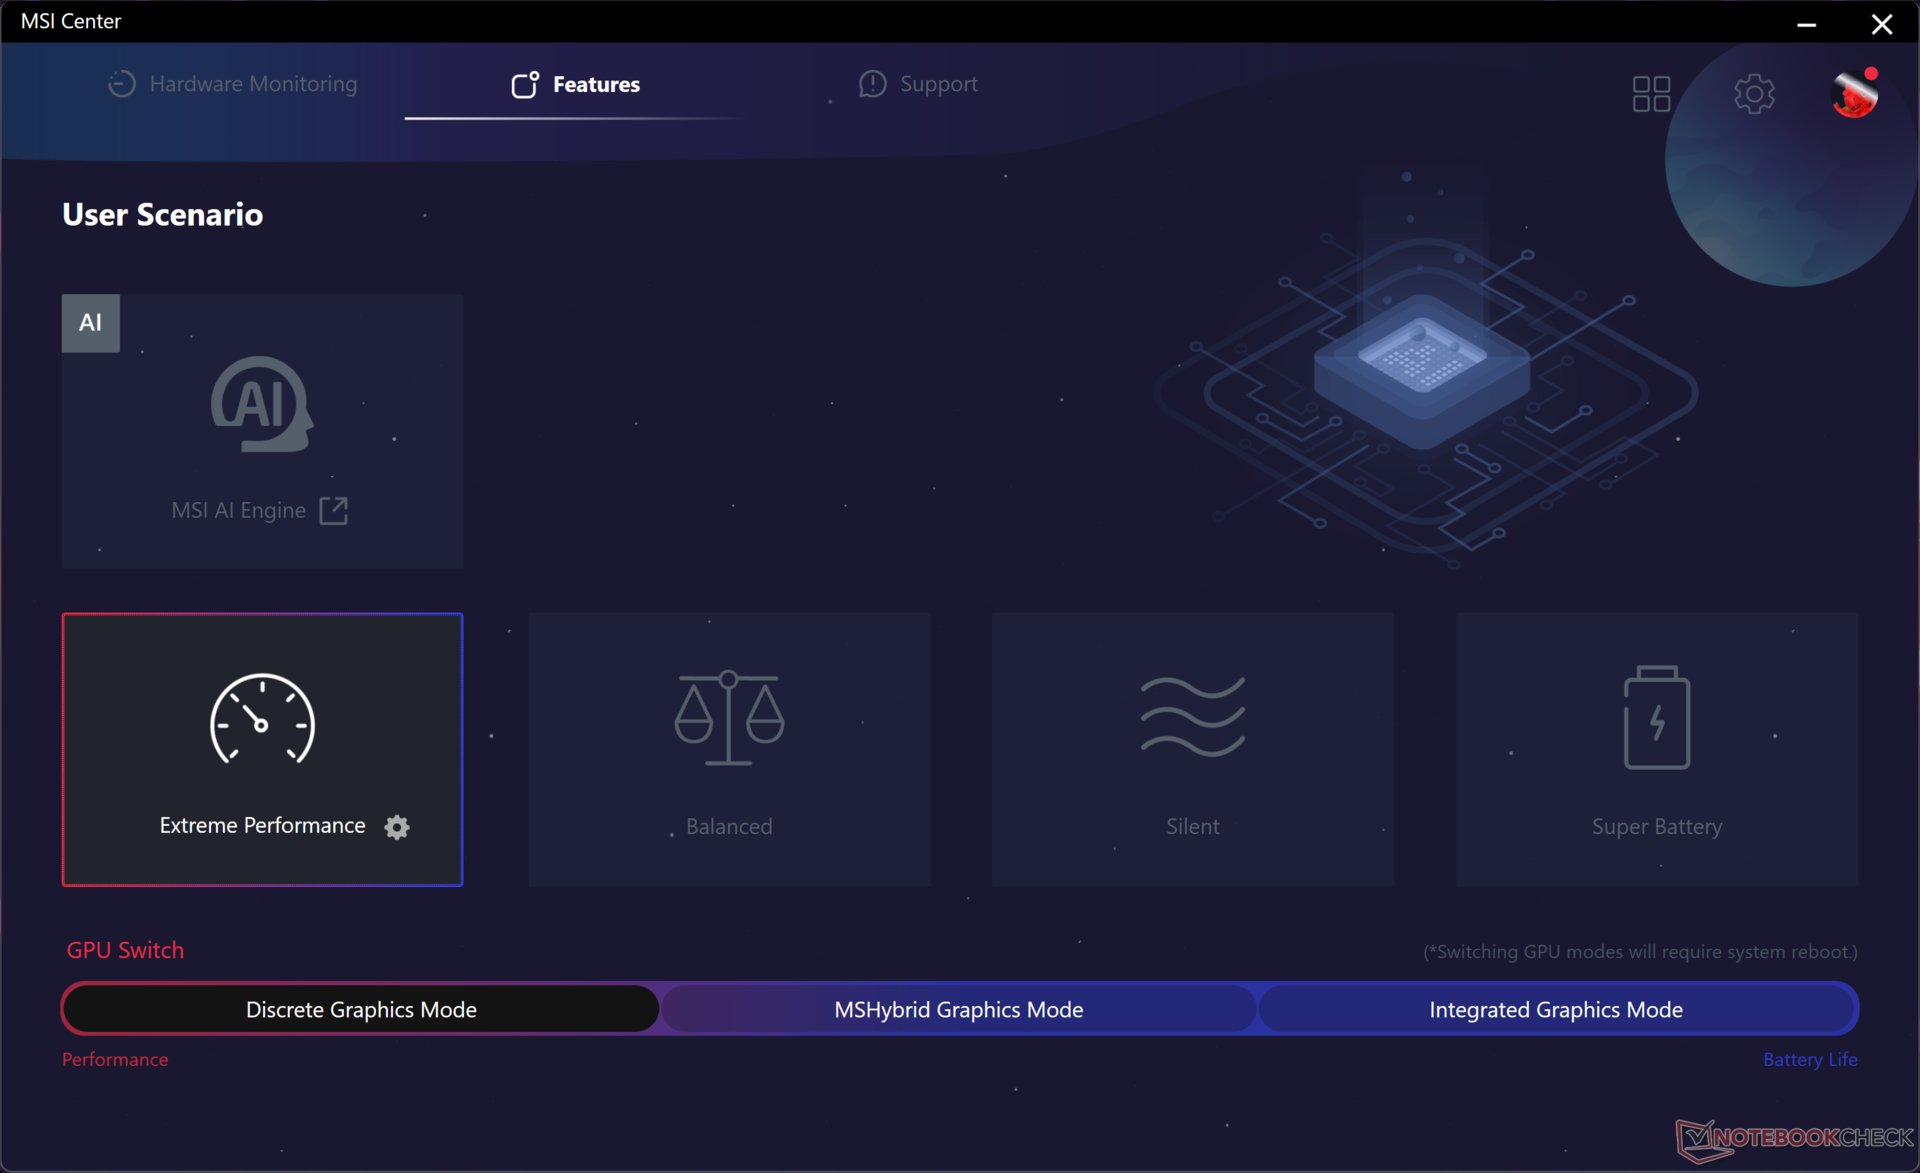
Vi ställde in GPU: n till diskret grafikläge, Windows till prestandaläge och MSI Center till Extreme Performance-läge innan vi körde riktmärkena nedan. Cooler Boost-läge (dvs. maximalt fläktläge) är en annan inställning inom Extreme Performance-läget, men det här alternativet behövs i allmänhet inte för maximal prestanda, vilket våra resultat kommer att visa. Detta stämmer överens med vår erfarenhet av andra bärbara MSI-datorer som har samma Cooler Boost-funktion.
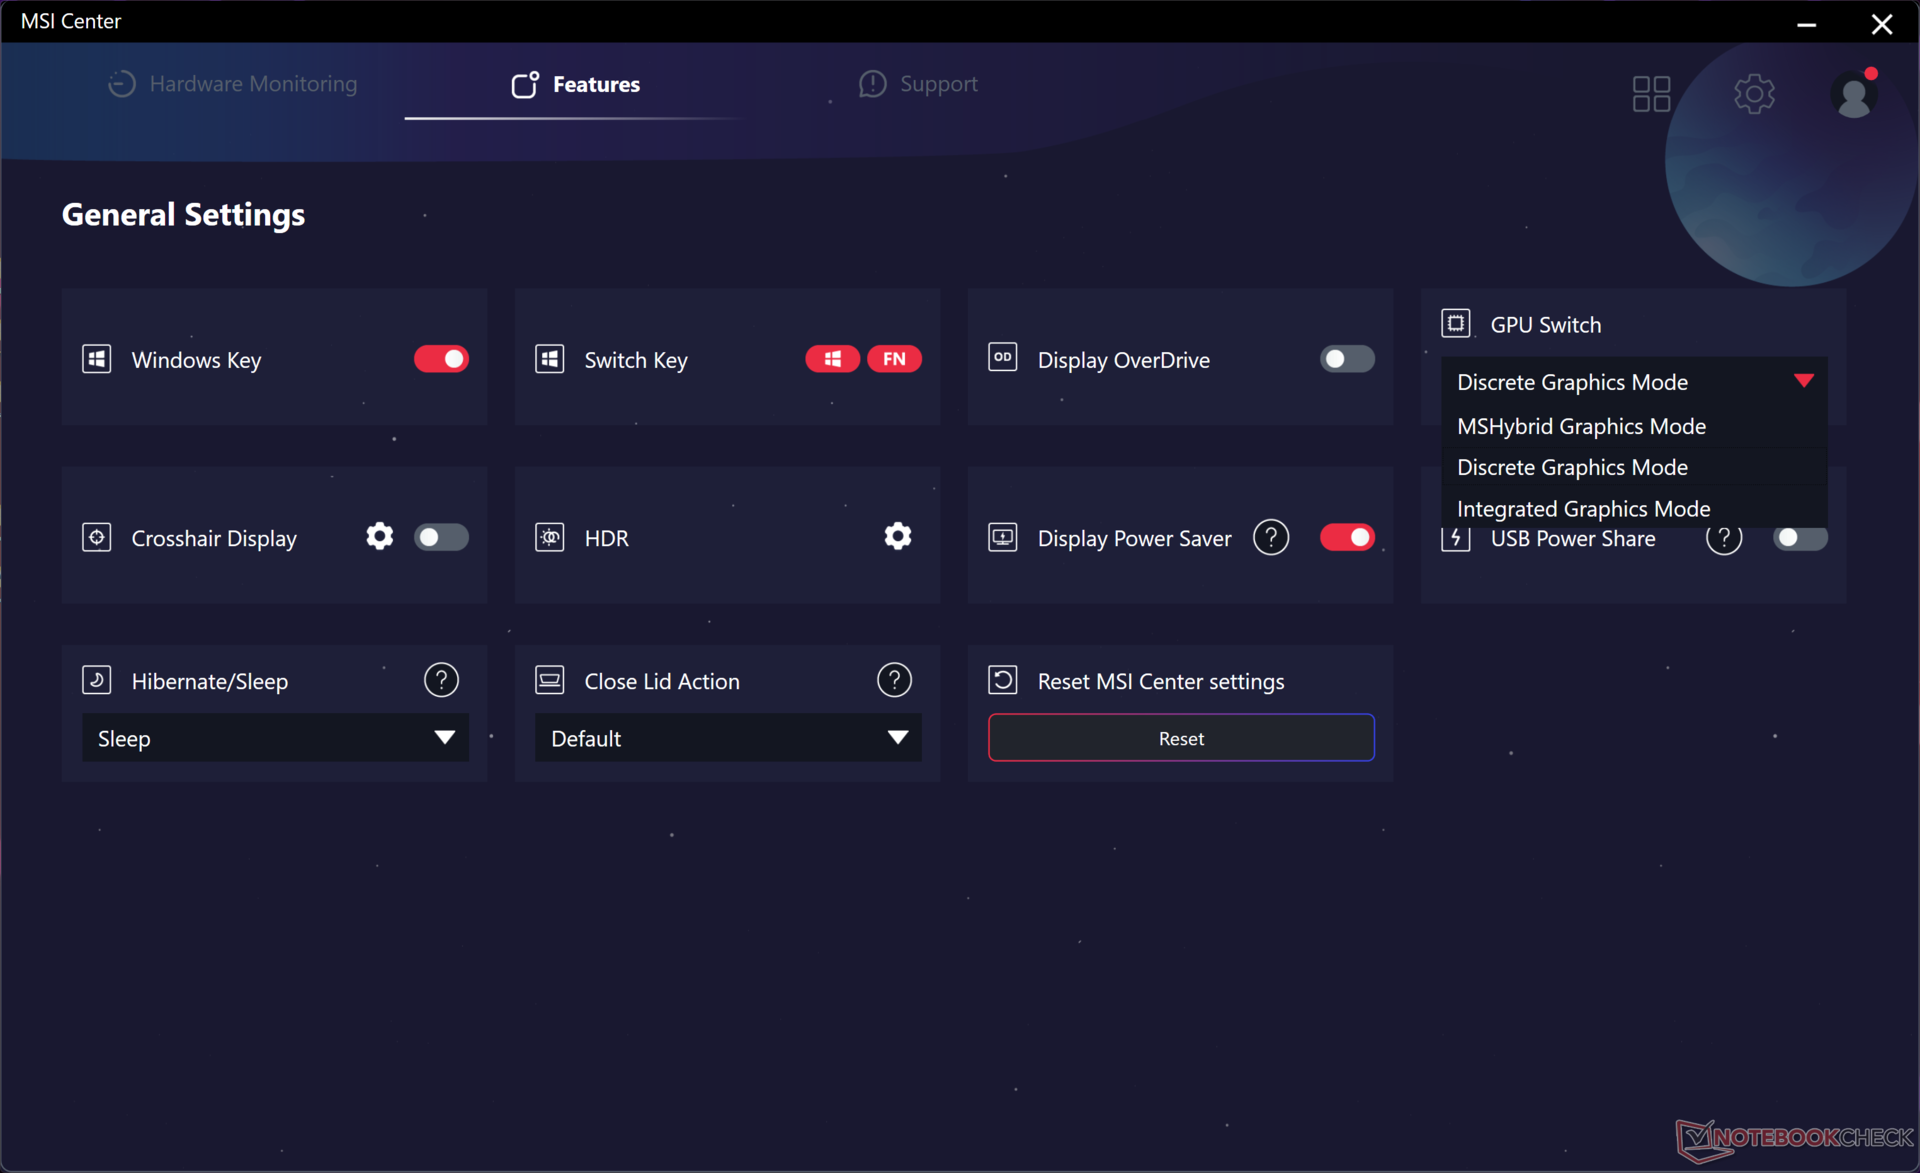
MUX stöds för att växla mellan dGPU-, iGPU- och MSHybrid-lägen, men Advanced Optimus finns inte på samma sätt som på Titan 18 HX. En viktig nackdel med 4K mini-LED-panelen är faktiskt dess brist på G-Sync-stöd.
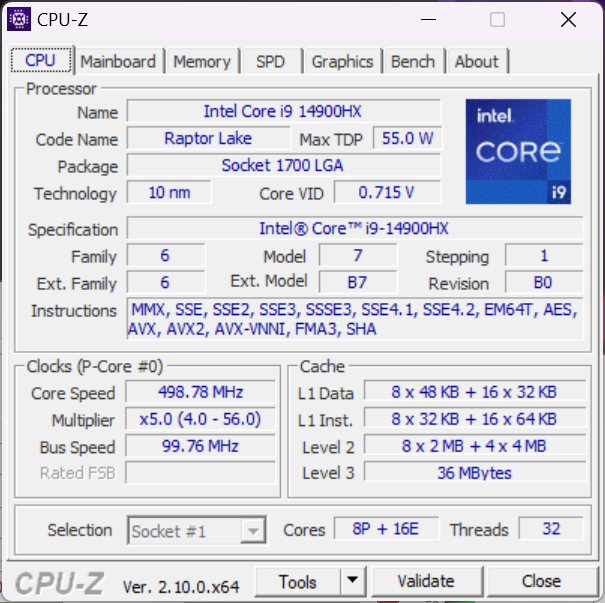
Processor
Core Core i9-14900HX är bara en rebrandad Core i9-13900HX och ger därför i bästa fall endast marginella fördelar. Trots det är det fortfarande en av de snabbaste processorerna som finns tillgängliga på bärbara datorer när det gäller traditionella prestandamätningar som CineBench eller Blender-rendering. CPU:n kompletterar Meteor Lake Core Ultra 9 185H som byter bort en del råprestanda mot en integrerad NPU för att accelerera AI-uppgifter.
Prestandahållbarheten är utmärkt utan några större dippar i klockfrekvensen när den stressas, till skillnad från vad vi observerade på Acer Predator Helios 18 utrustad med samma Core i9-14900HX CPU.
Om vi byter till den AMD-baserade Ryzen 9 7945HX konfigurationen förväntas öka prestandan för flera trådar med cirka 10 till 15 procent samtidigt som prestandan för enstaka trådar minskar med 10 till 15 procent.
Cinebench R15 Multi Loop
Cinebench R23: Multi Core | Single Core
Cinebench R20: CPU (Multi Core) | CPU (Single Core)
Cinebench R15: CPU Multi 64Bit | CPU Single 64Bit
Blender: v2.79 BMW27 CPU
7-Zip 18.03: 7z b 4 | 7z b 4 -mmt1
Geekbench 6.4: Multi-Core | Single-Core
Geekbench 5.5: Multi-Core | Single-Core
HWBOT x265 Benchmark v2.2: 4k Preset
LibreOffice : 20 Documents To PDF
R Benchmark 2.5: Overall mean
* ... mindre är bättre
AIDA64: FP32 Ray-Trace | FPU Julia | CPU SHA3 | CPU Queen | FPU SinJulia | FPU Mandel | CPU AES | CPU ZLib | FP64 Ray-Trace | CPU PhotoWorxx
| Performance Rating | |
| Alienware m18 R2 | |
| MSI Titan 18 HX A14VIG | |
| MSI Raider 18 HX A14V | |
| Genomsnitt Intel Core i9-14900HX | |
| Razer Blade 18 2024 RZ09-0509 | |
| Acer Predator Helios 18 PH18-72-98MW | |
| Asus ROG Strix G18 G814JI | |
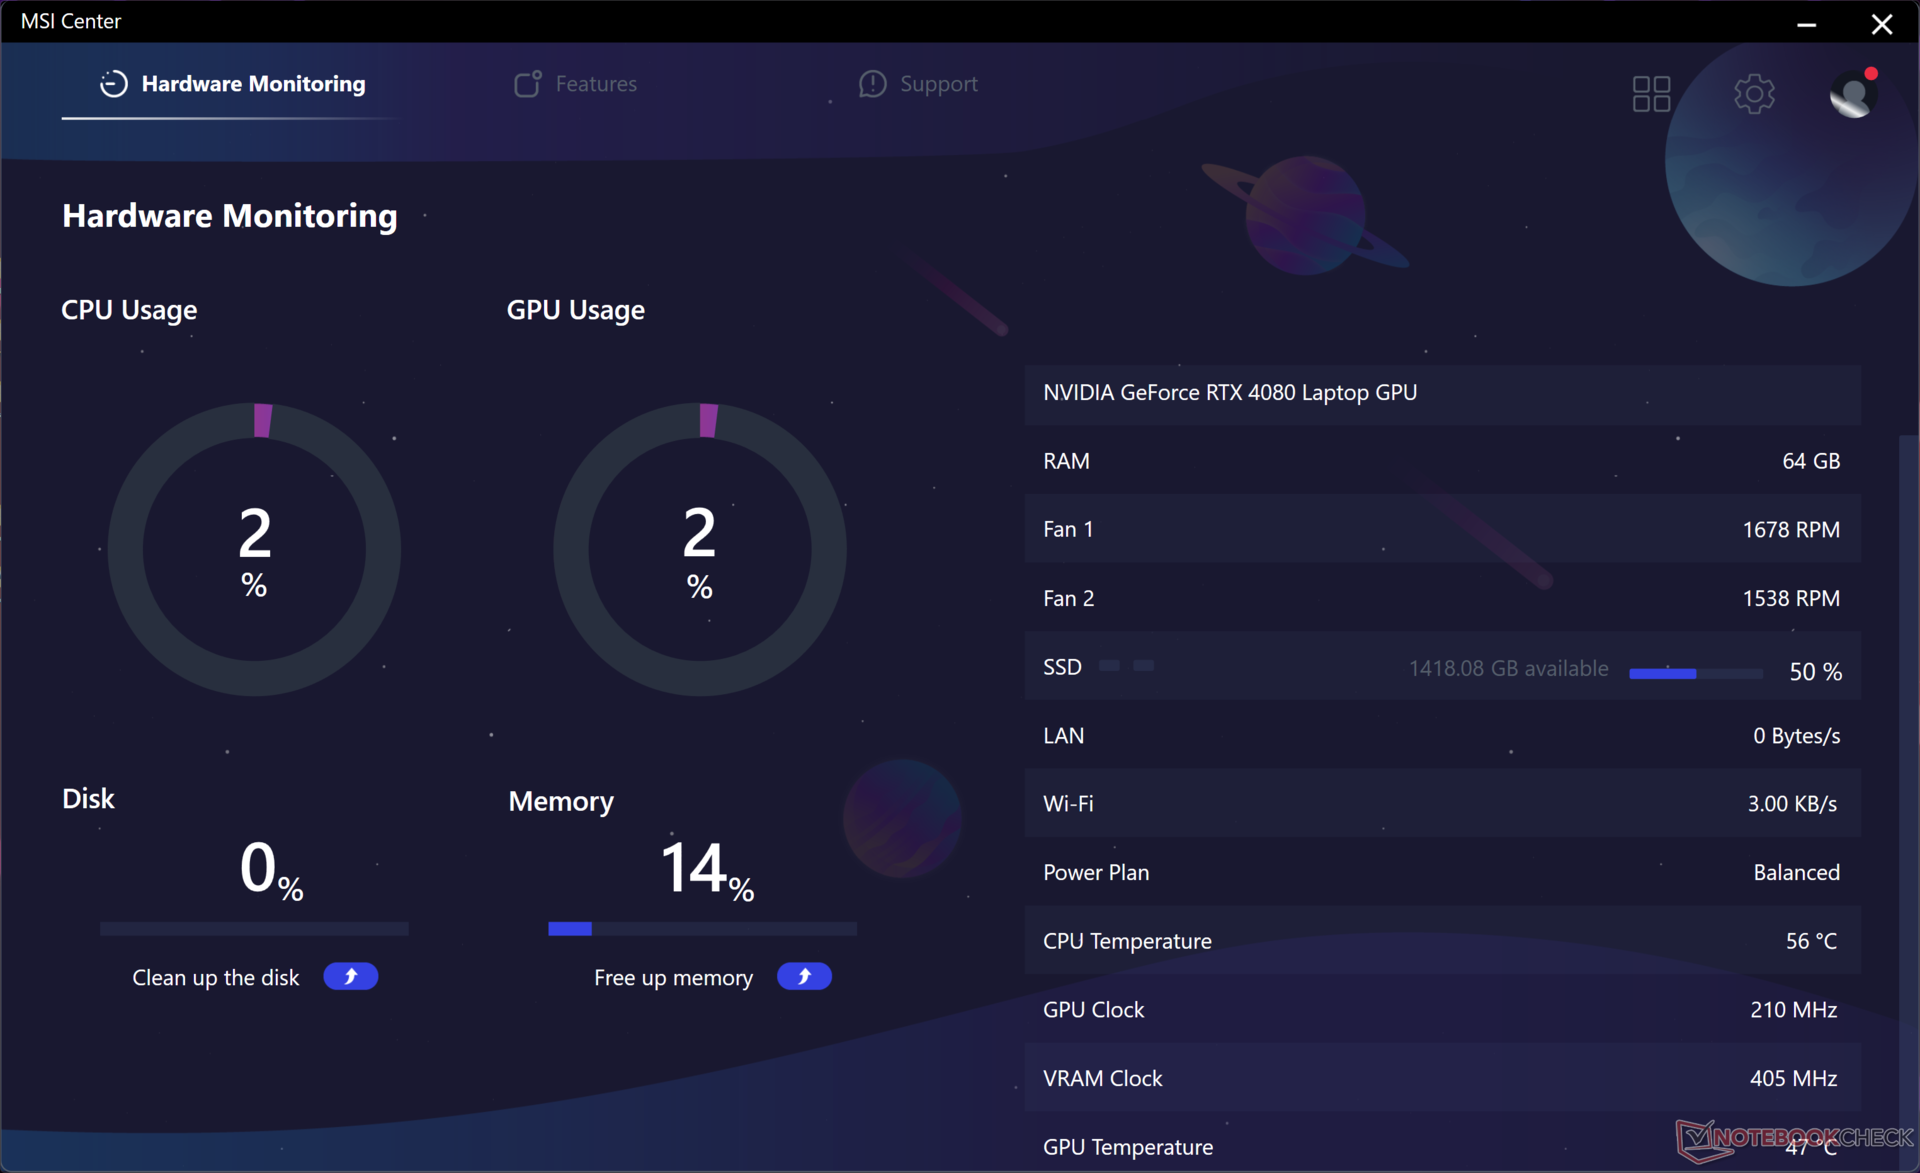
Stresstest
Processorn ökade till 4 GHz, 86 C och 145 W när Prime95-stress initierades utan några större nedgångar i klockfrekvens eller prestanda över tid. Det stora chassit och kyllösningen kan extrahera mer prestanda från Core i9-14900HX jämfört med mindre system med samma processor som t.ex RedMagic Titan 16 Pro som stryper ganska kraftigt.
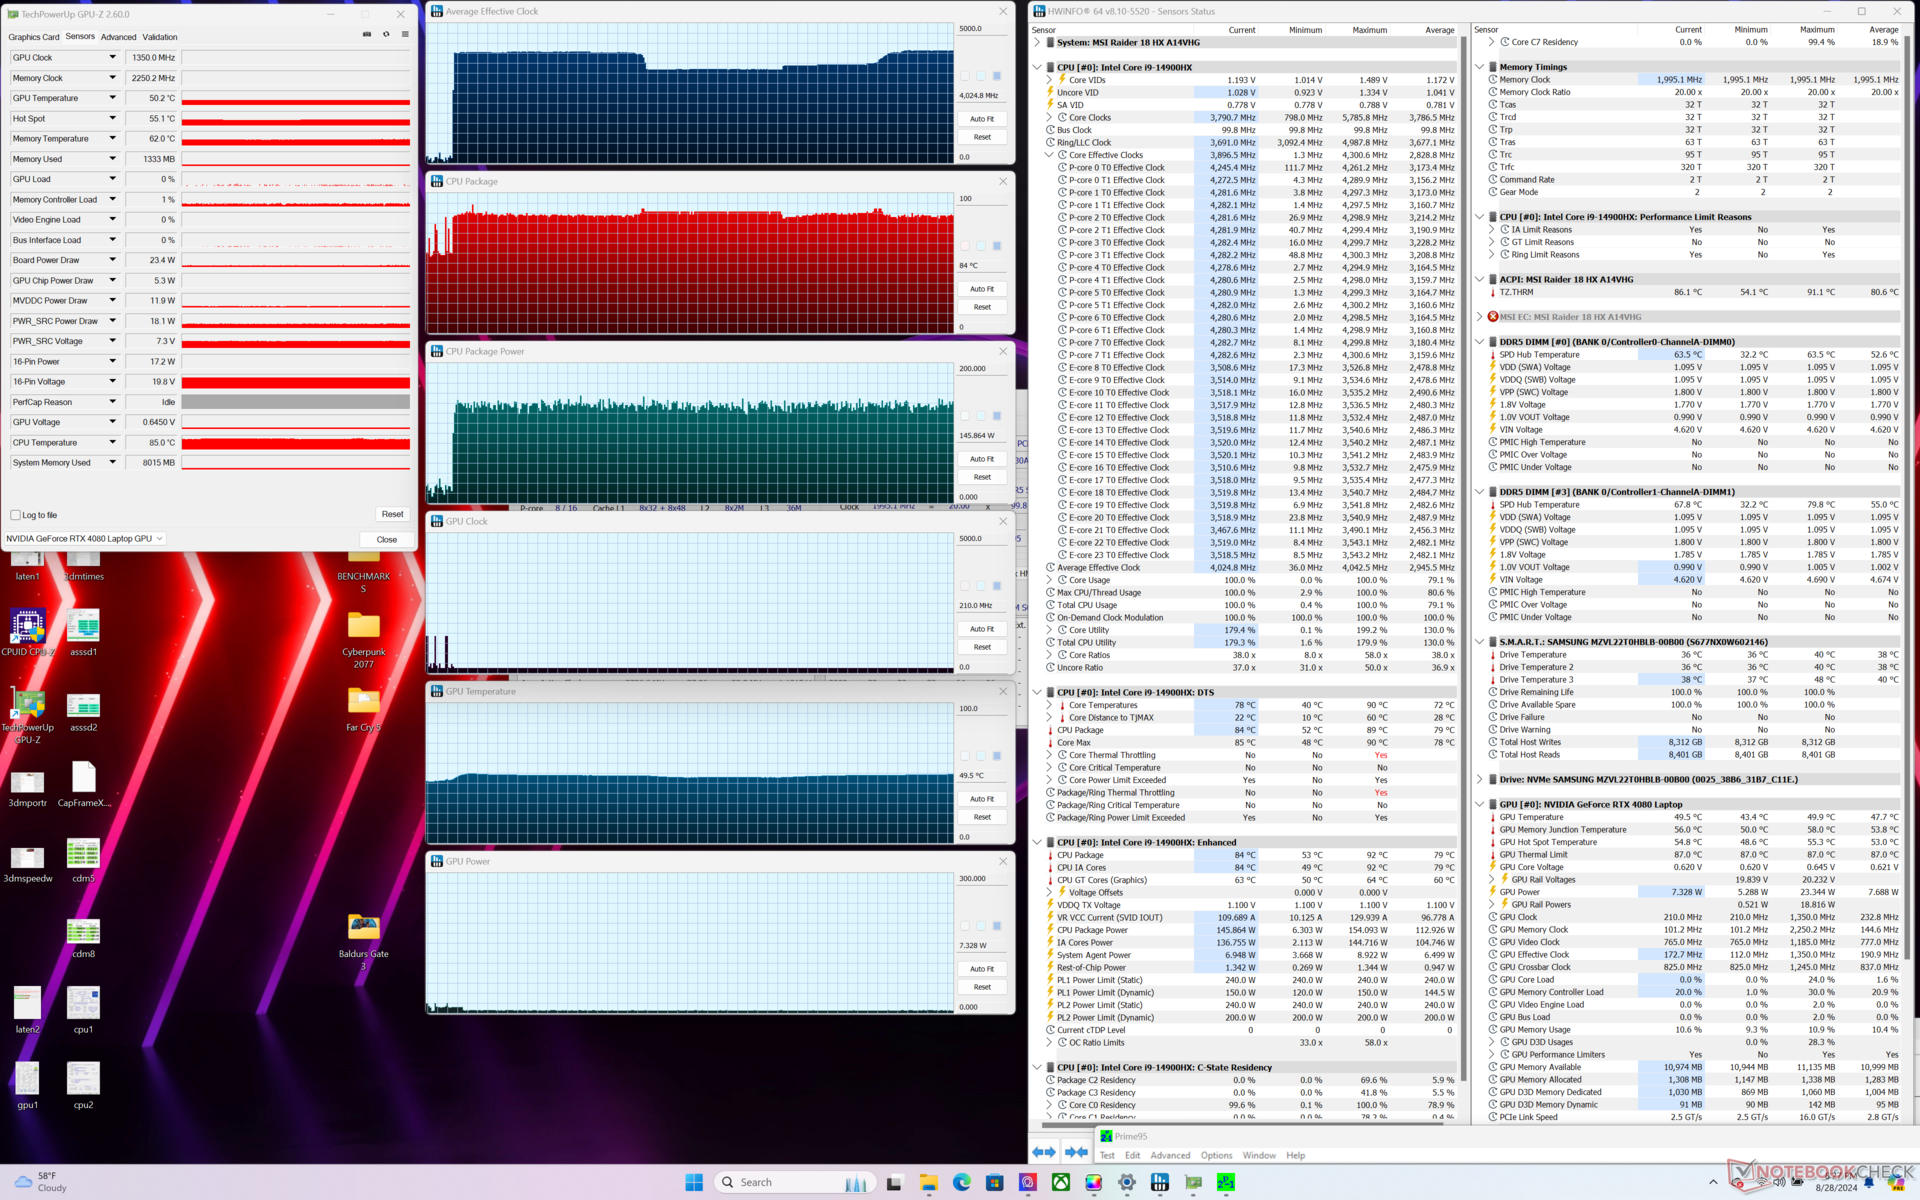
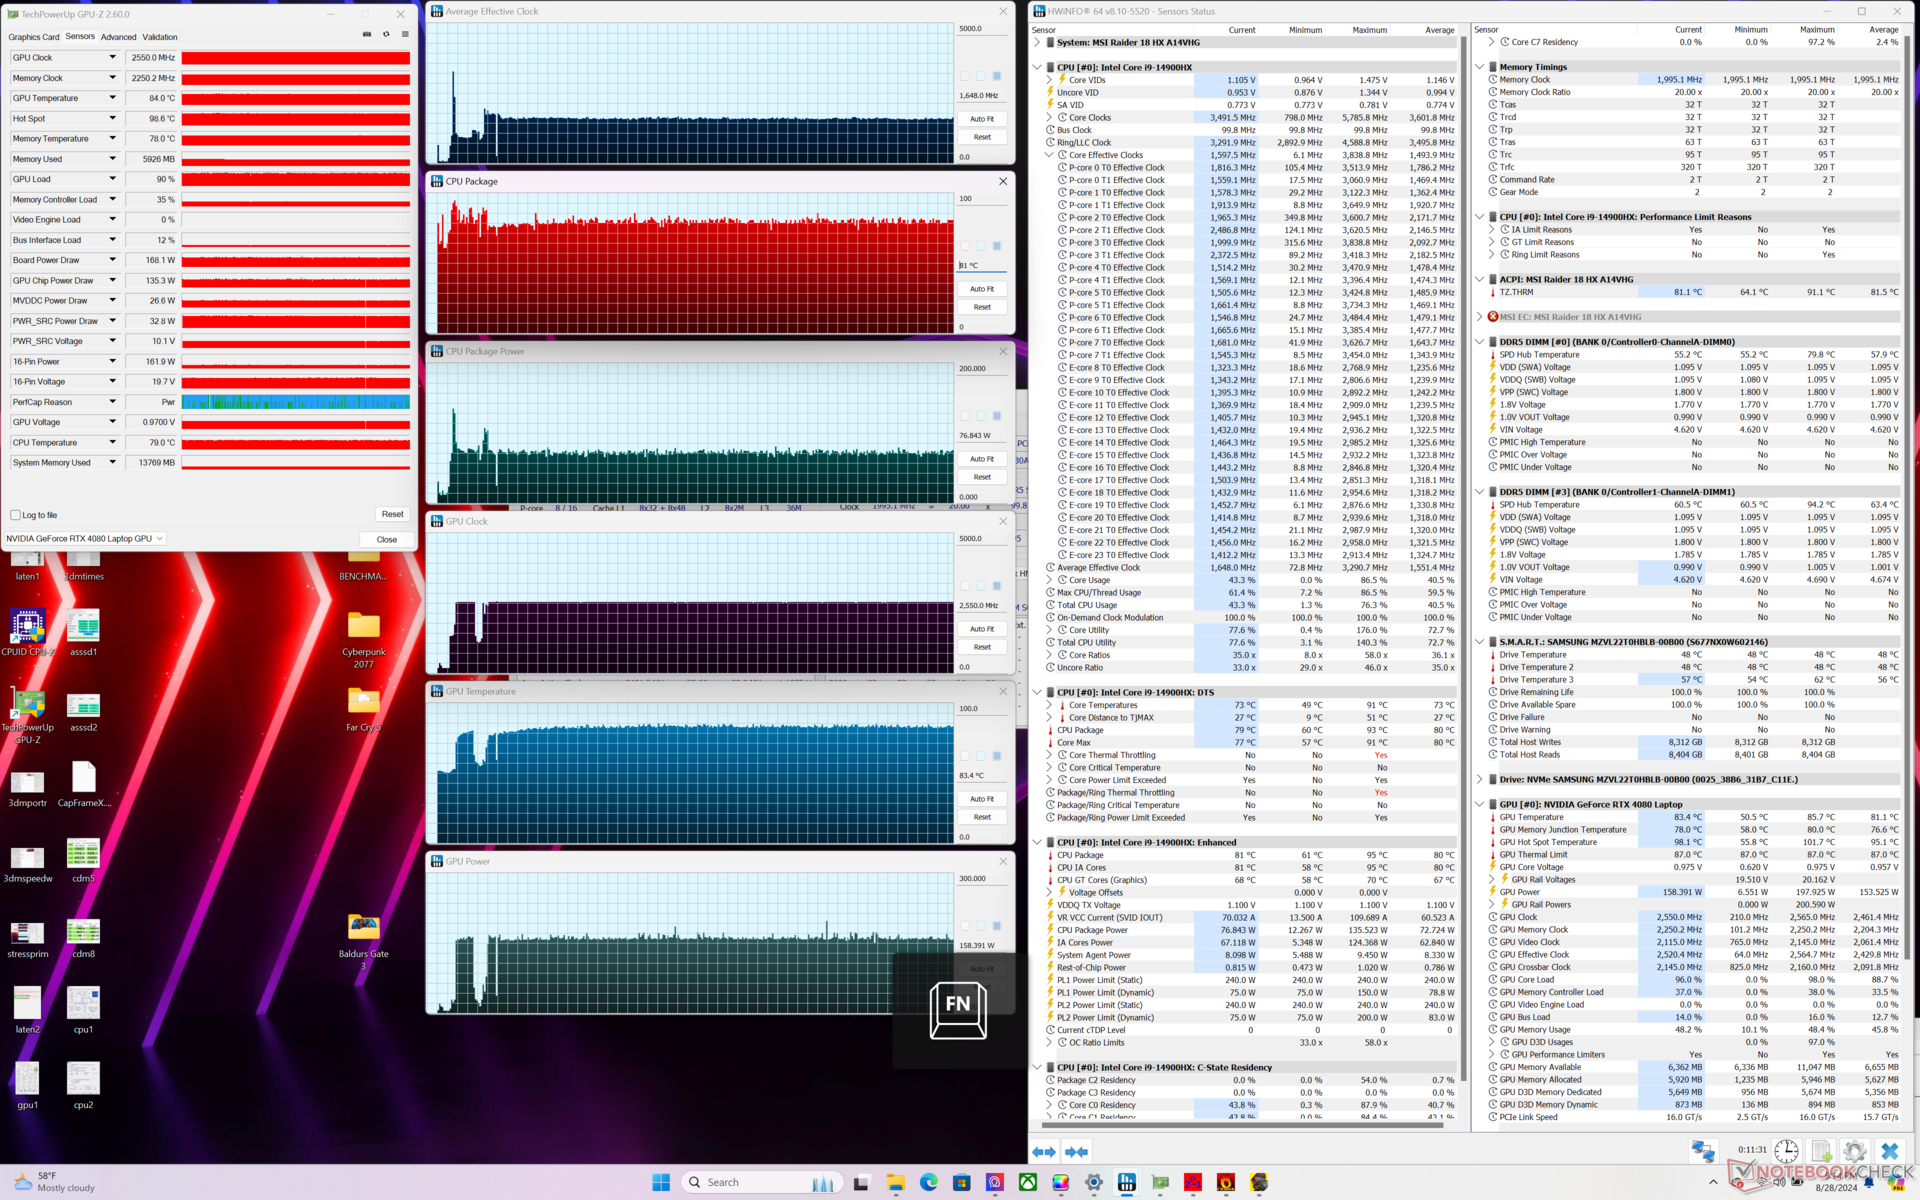
Att köra i Extreme Performance-läge med Cooler Boost på ger inga påtagliga prestandafördelar jämfört med Cooler Boost av när man spelar. GPU-klockfrekvenser, minnesklockfrekvenser och kortets strömförbrukning när Cyberpunk 2077 körs skulle stabiliseras på 2550 MHz, 2250 MHz respektive 159 W mellan de två inställningarna. Kärntemperaturen är något svalare med några grader C med Cooler Boost på eftersom fläktljudet är högre, men det är den enda noterbara fördelen.
När vi går ner till balanserat läge minskar GPU-klockfrekvenserna och kortets strömförbrukning till 2295 MHz respektive 150 W, vilket bara är marginellt långsammare än Extreme Performance-läget. Prestandadelta mellan balanserat och extremt prestandaläge är därför mindre än vad man kan förvänta sig.
GPU-temperaturerna är varmare än på Razer Blade 18 med upp till 9 C när du spelar, trots att vårt MSI är det tjockare och tyngre systemet.
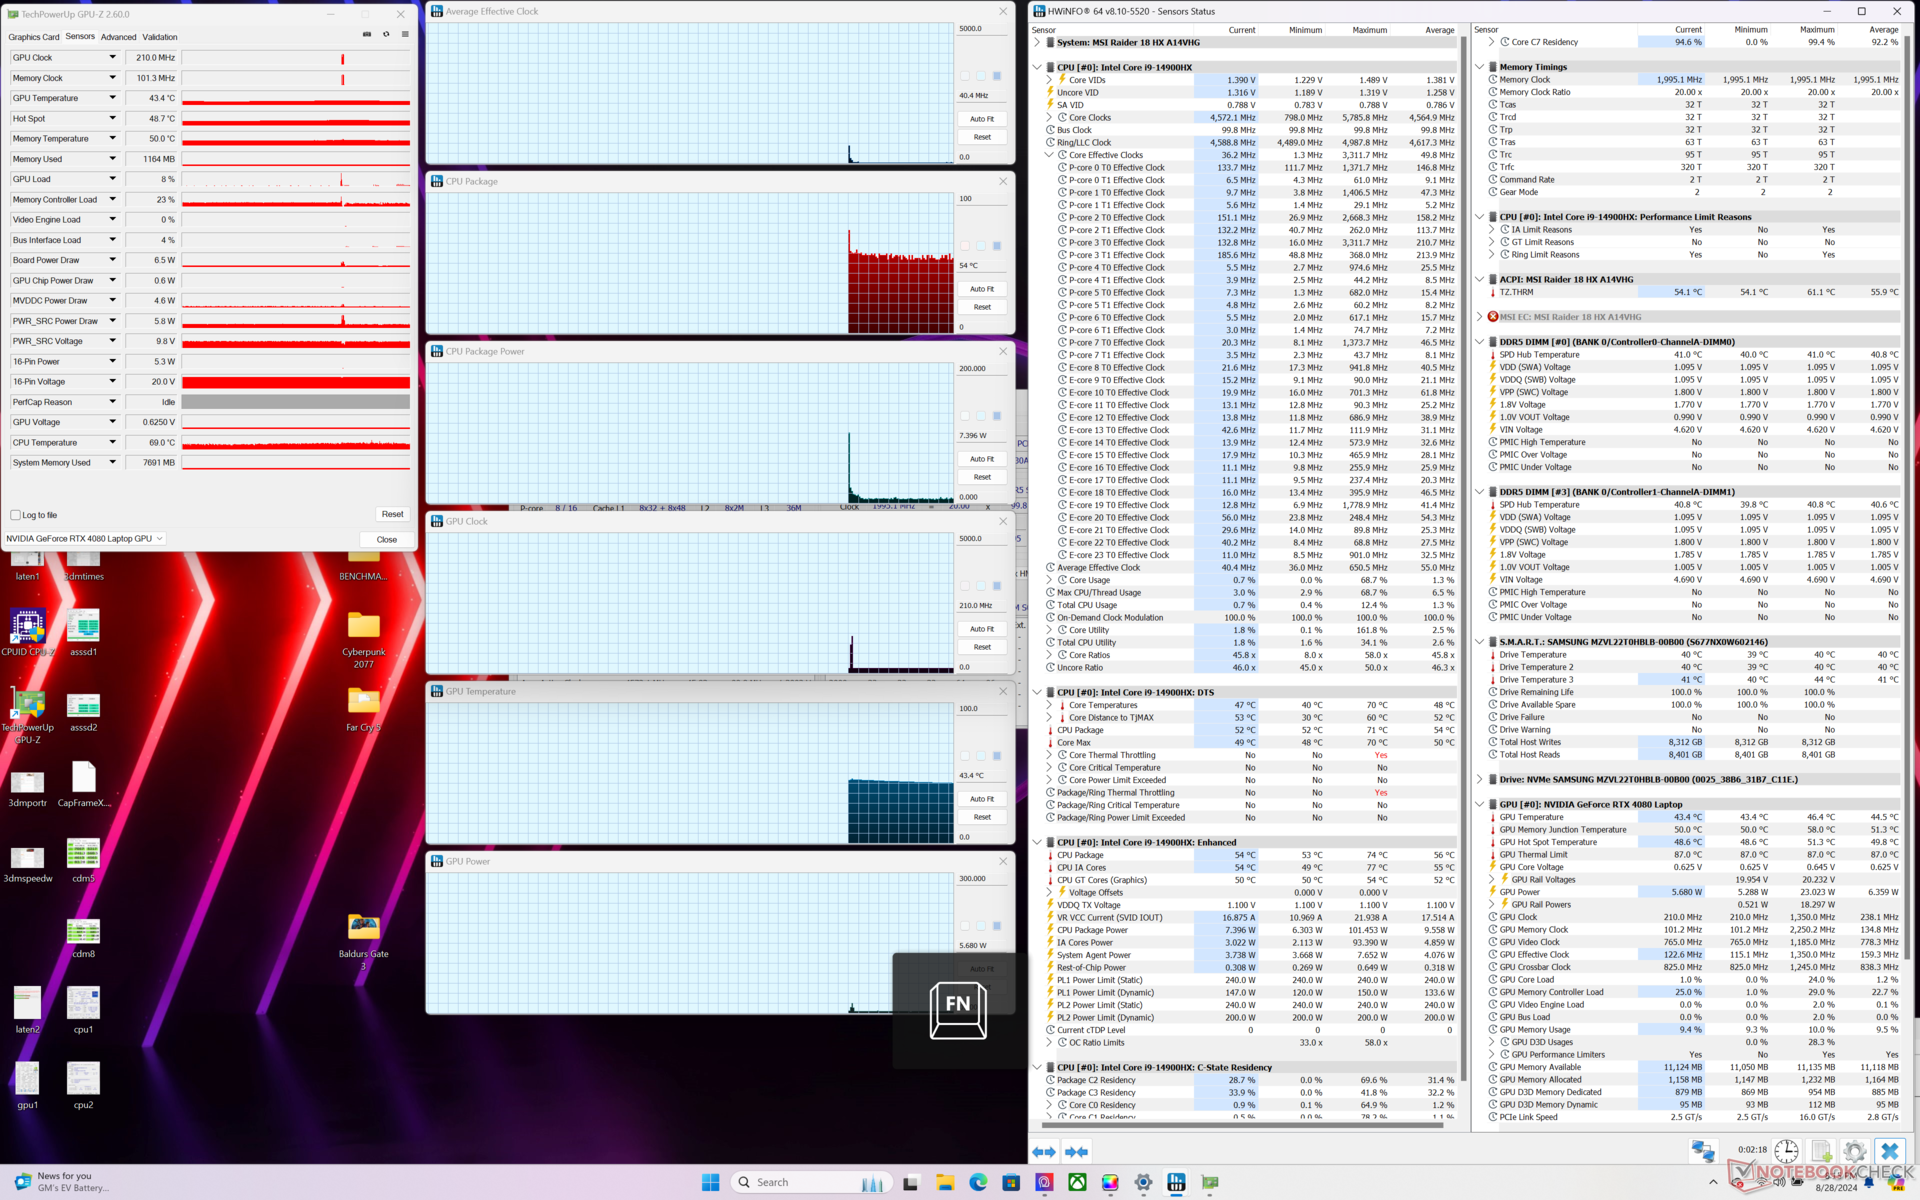

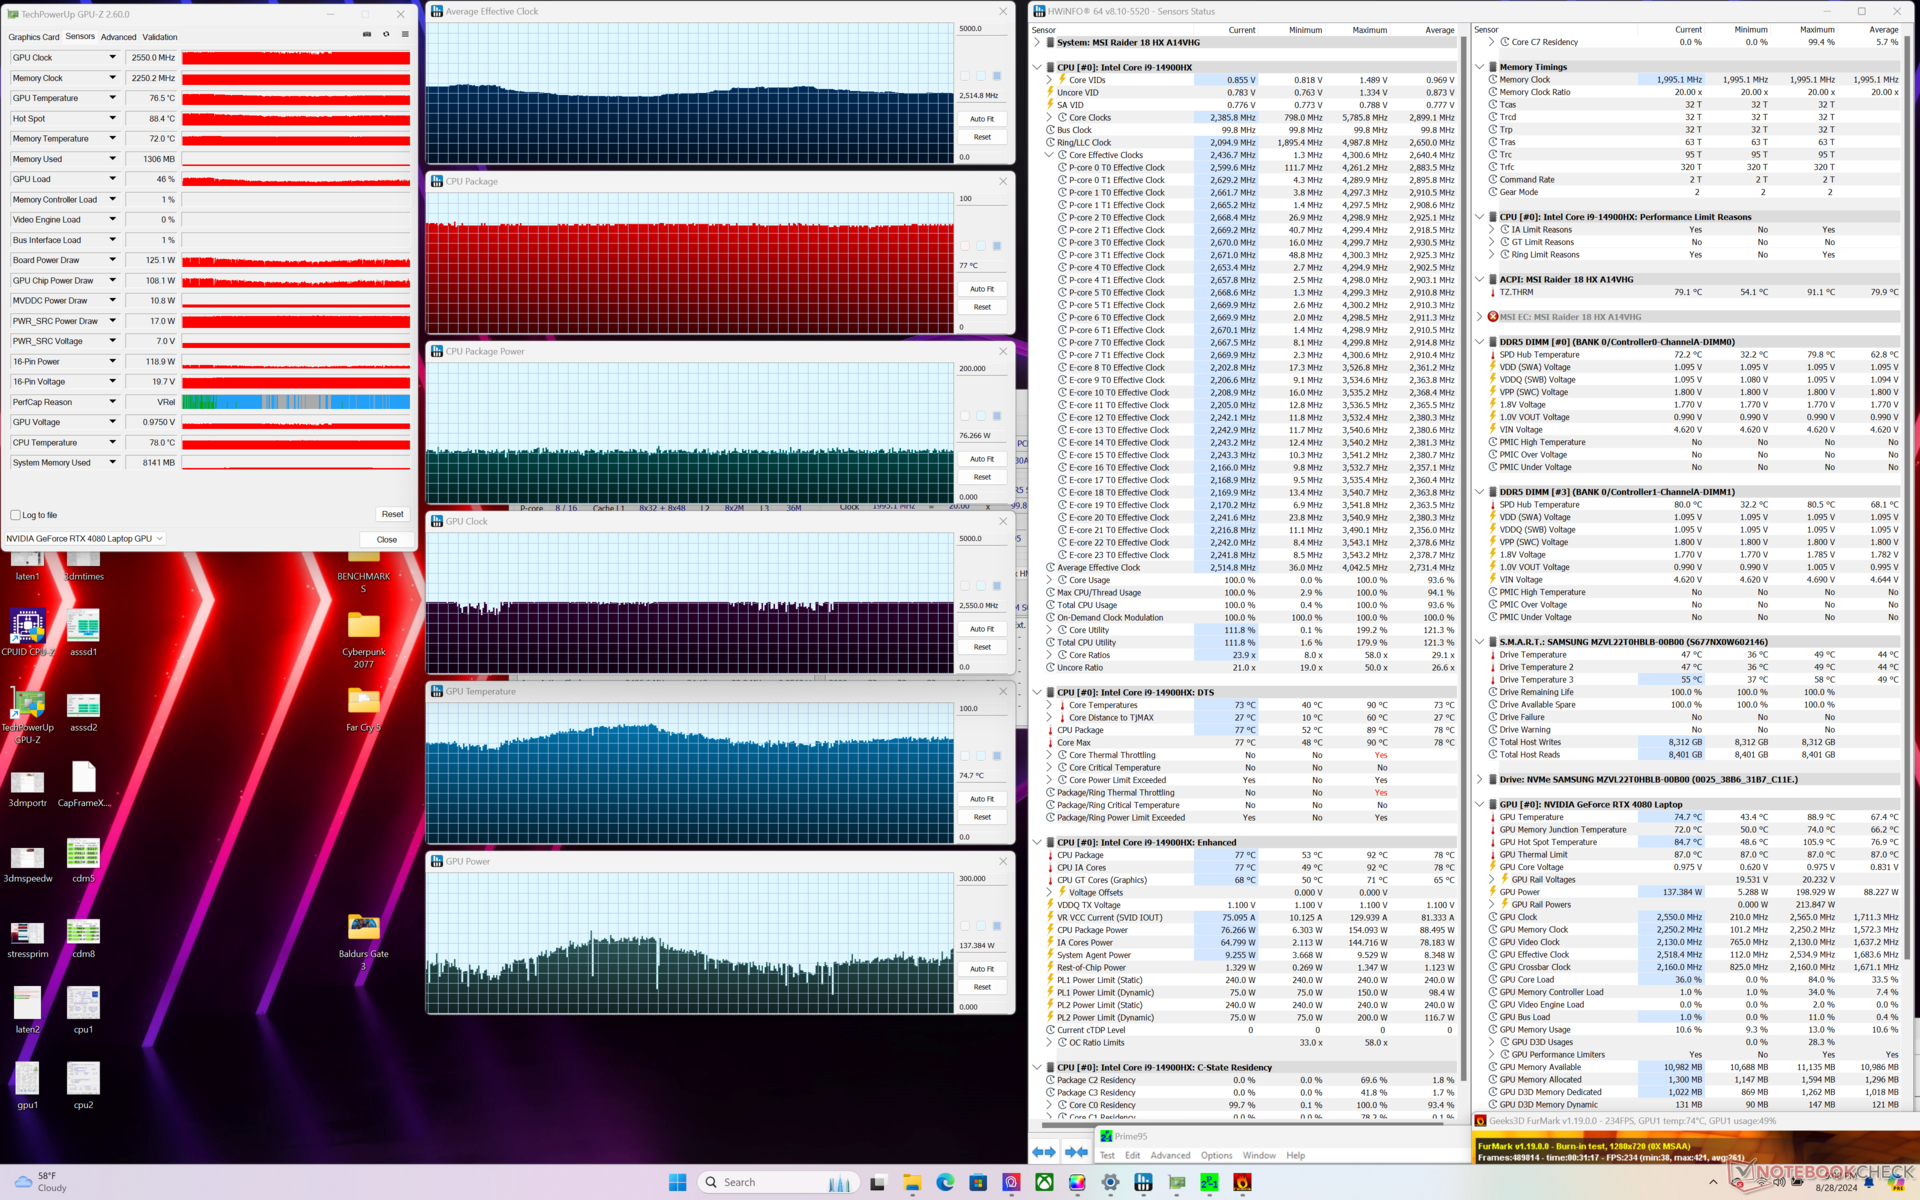
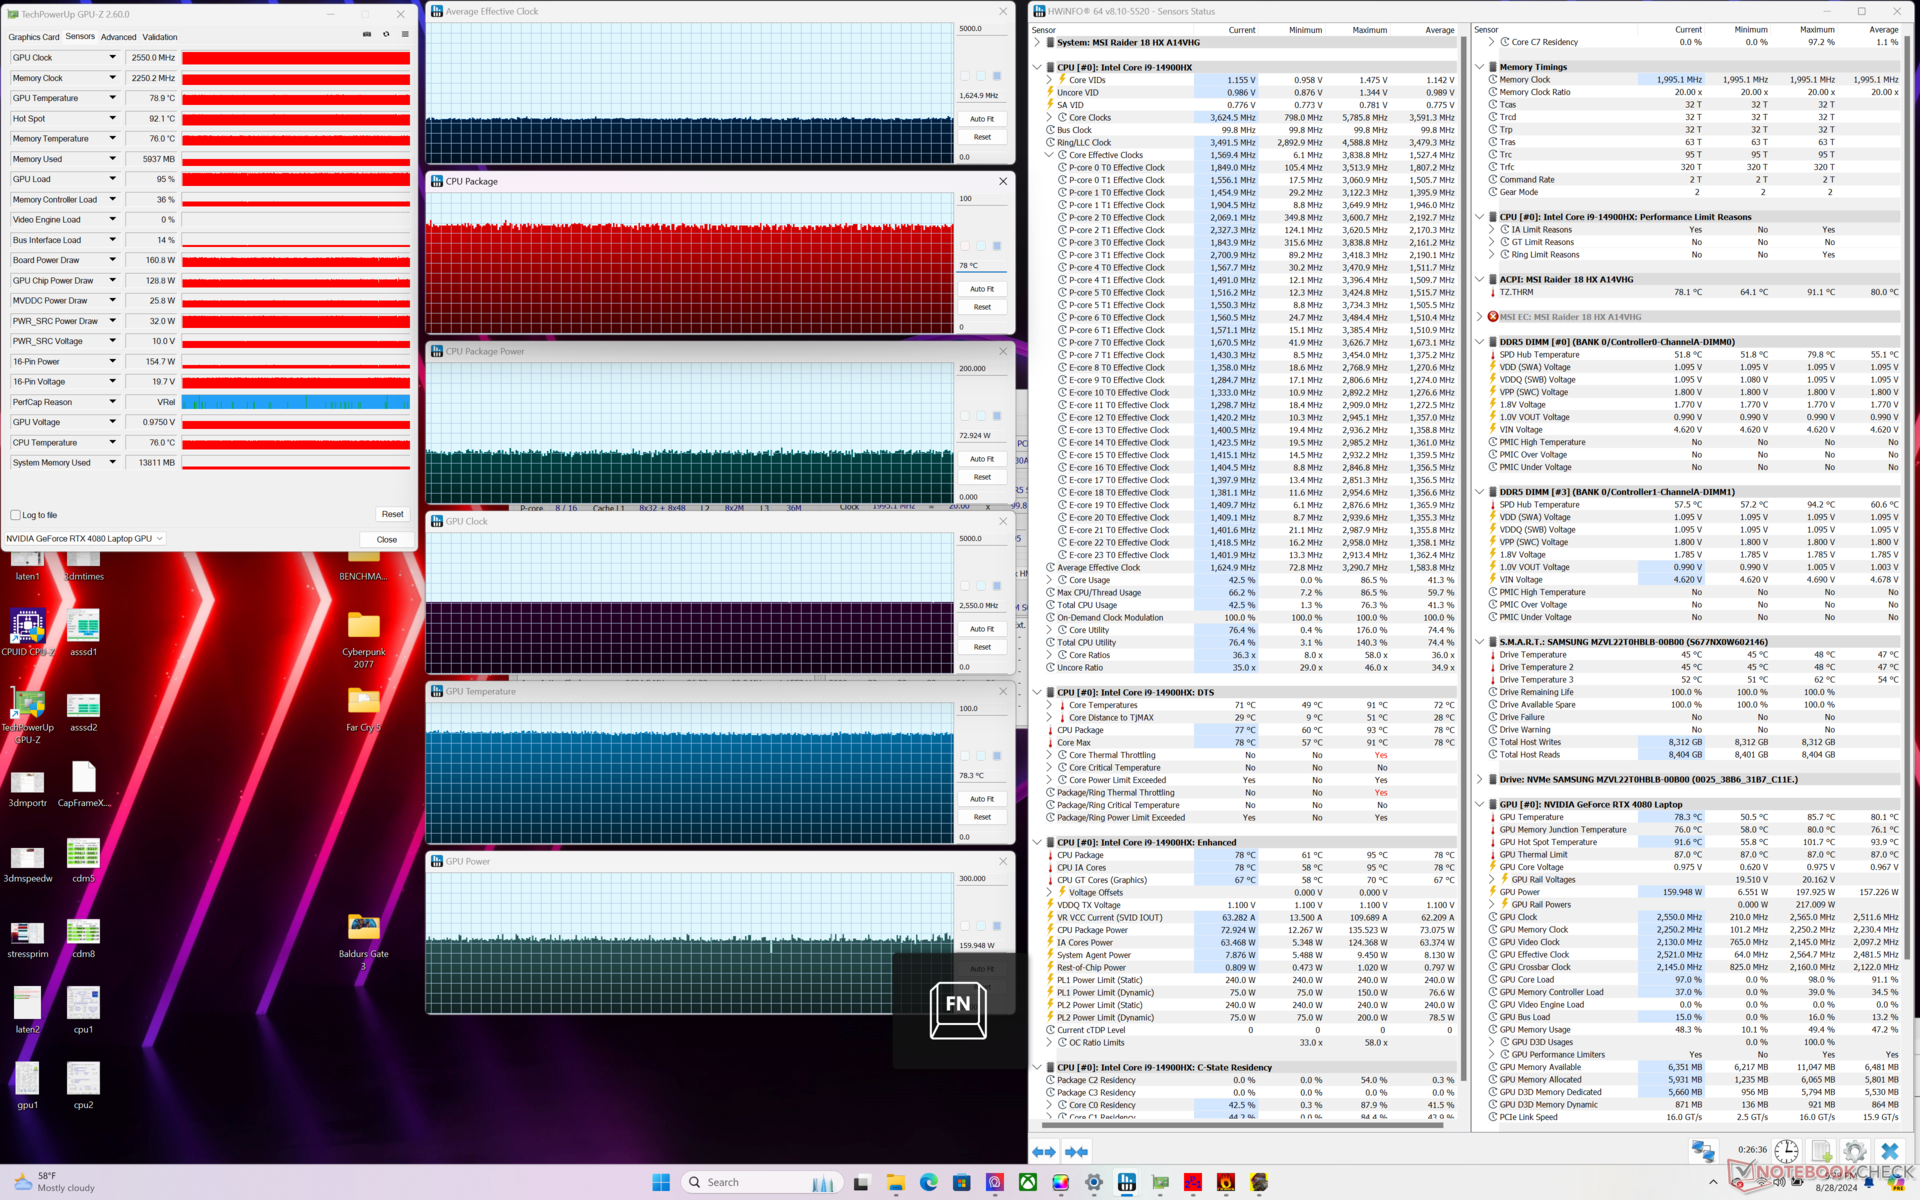
| Genomsnittlig CPU-klocka (GHz) | GPU-klocka (MHz) | Genomsnittlig CPU-temperatur (°C) | Genomsnittlig GPU-temperatur (°C) | |
| System i viloläge | -- | -- | 54 | 43 |
| Prime95 Stress | 4.0 | -- | 84 | 50 |
| Prime95 + FurMark Stress | 2.5 | 2550 | 77 | 75 |
| Cyberpunk 2077 Stress (Balanserat läge) | 1.5 | 2295 | 78 | 85 |
| Cyberpunk 2077 Stress (Extreme Performance w/ Cooler Boost off) | 1.7 | 2550 | 81 | 83 |
| Cyberpunk 2077 Stress (Extreme Performance w/ Cooler Boost on) | 1.6 | 2550 | 78 | 78 |
Systemets prestanda
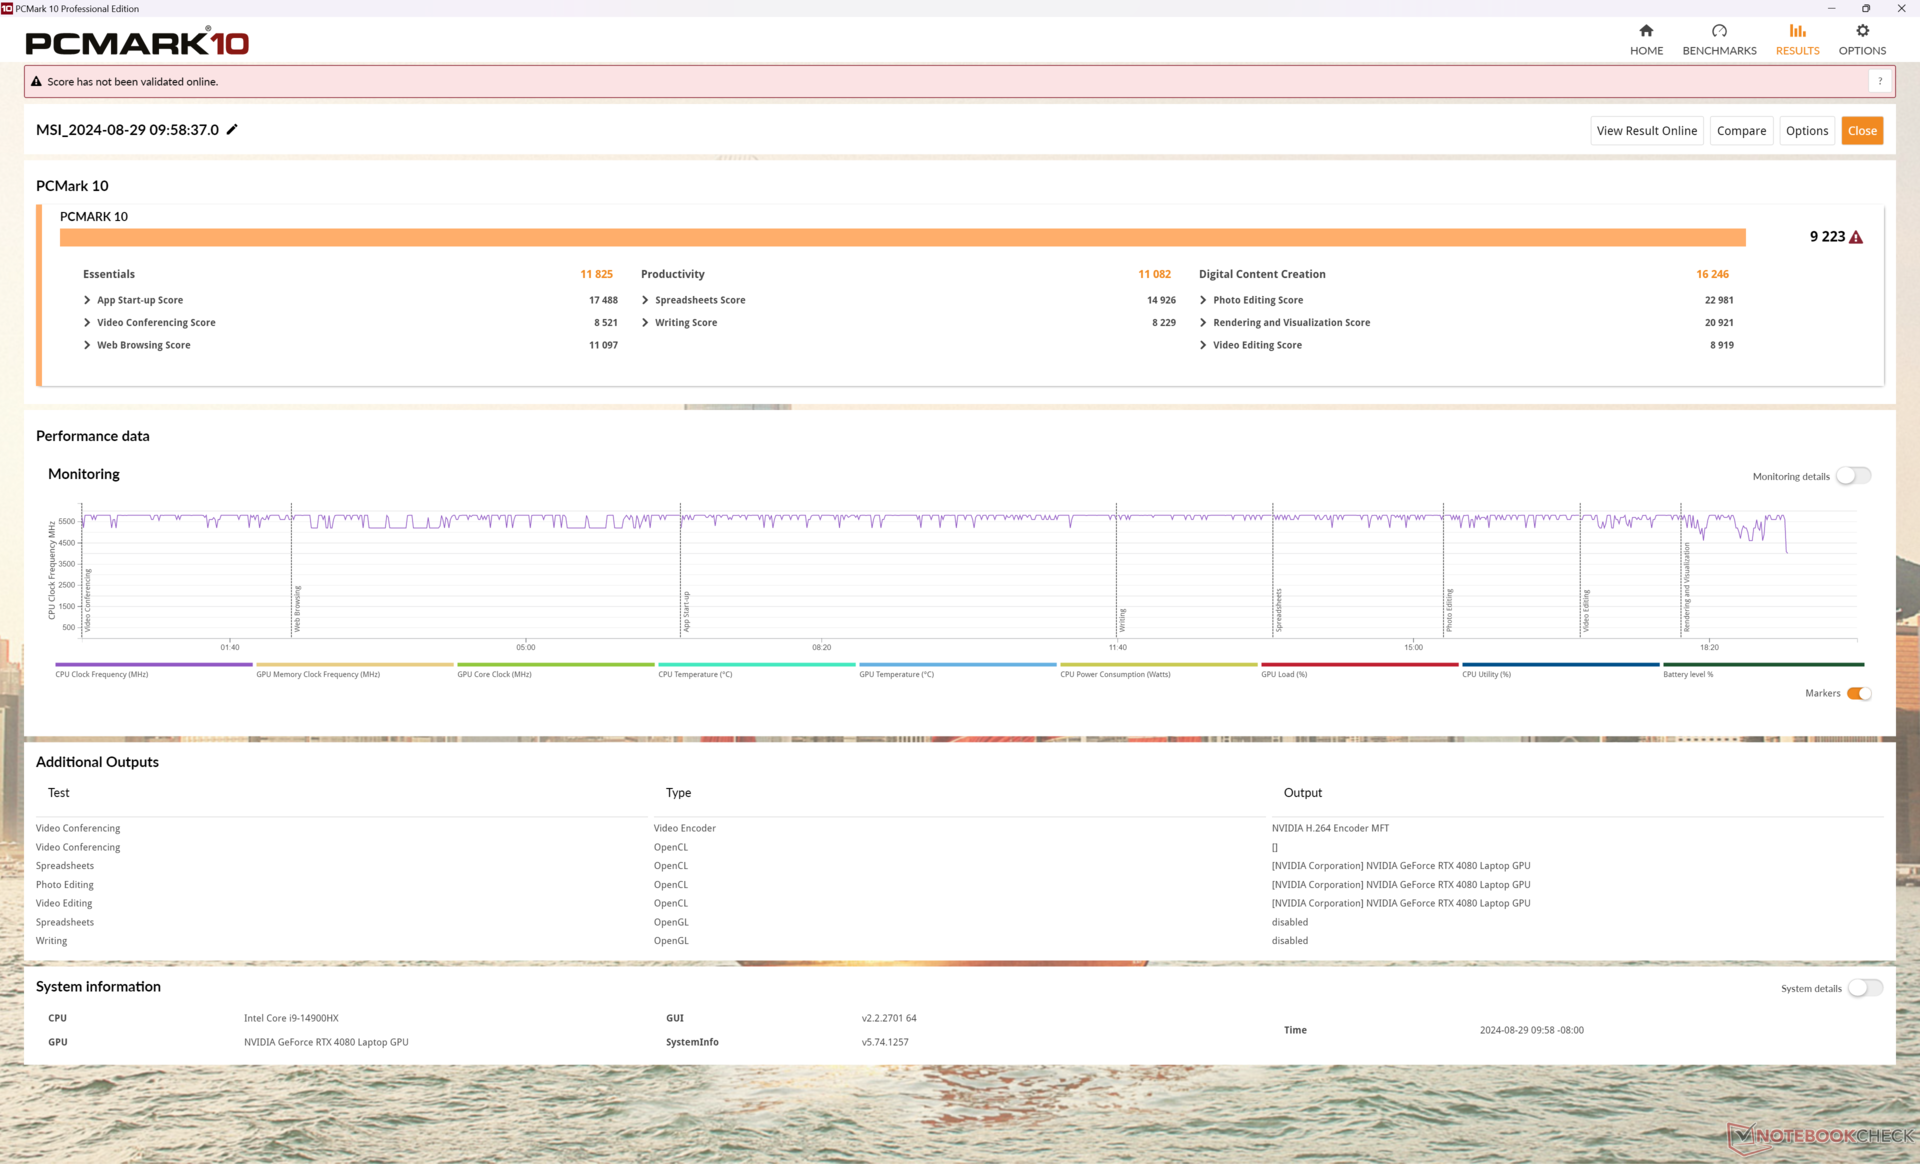
PCMark 10-poängen är jämförbara med MSI Titan 18 HX för att visa att de dagliga uppgifterna inte är långsammare på Raider 18 HX trots att det i grunden är en nedtonad Titan.
Vi upplevde konstiga inloggningsproblem med vår testenhet när vi växlade mellan dGPU- och iGPU-lägen som tvingade oss att återställa PIN-koden varje gång.
CrossMark: Overall | Productivity | Creativity | Responsiveness
WebXPRT 3: Overall
WebXPRT 4: Overall
Mozilla Kraken 1.1: Total
| PCMark 10 / Score | |
| Alienware m18 R2 | |
| MSI Raider 18 HX A14V | |
| MSI Titan 18 HX A14VIG | |
| Razer Blade 18 2024 RZ09-0509 | |
| Genomsnitt Intel Core i9-14900HX, NVIDIA GeForce RTX 4080 Laptop GPU (7703 - 9223, n=7) | |
| Acer Predator Helios 18 PH18-72-98MW | |
| Asus ROG Strix G18 G814JI | |
* ... mindre är bättre
| PCMark 10 Score | 9223 poäng | |
Hjälp | ||
| AIDA64 / Memory Copy | |
| Alienware m18 R2 | |
| Acer Predator Helios 18 PH18-72-98MW | |
| Razer Blade 18 2024 RZ09-0509 | |
| Genomsnitt Intel Core i9-14900HX (38028 - 83392, n=36) | |
| MSI Raider 18 HX A14V | |
| Asus ROG Strix G18 G814JI | |
| MSI Titan 18 HX A14VIG | |
* ... mindre är bättre
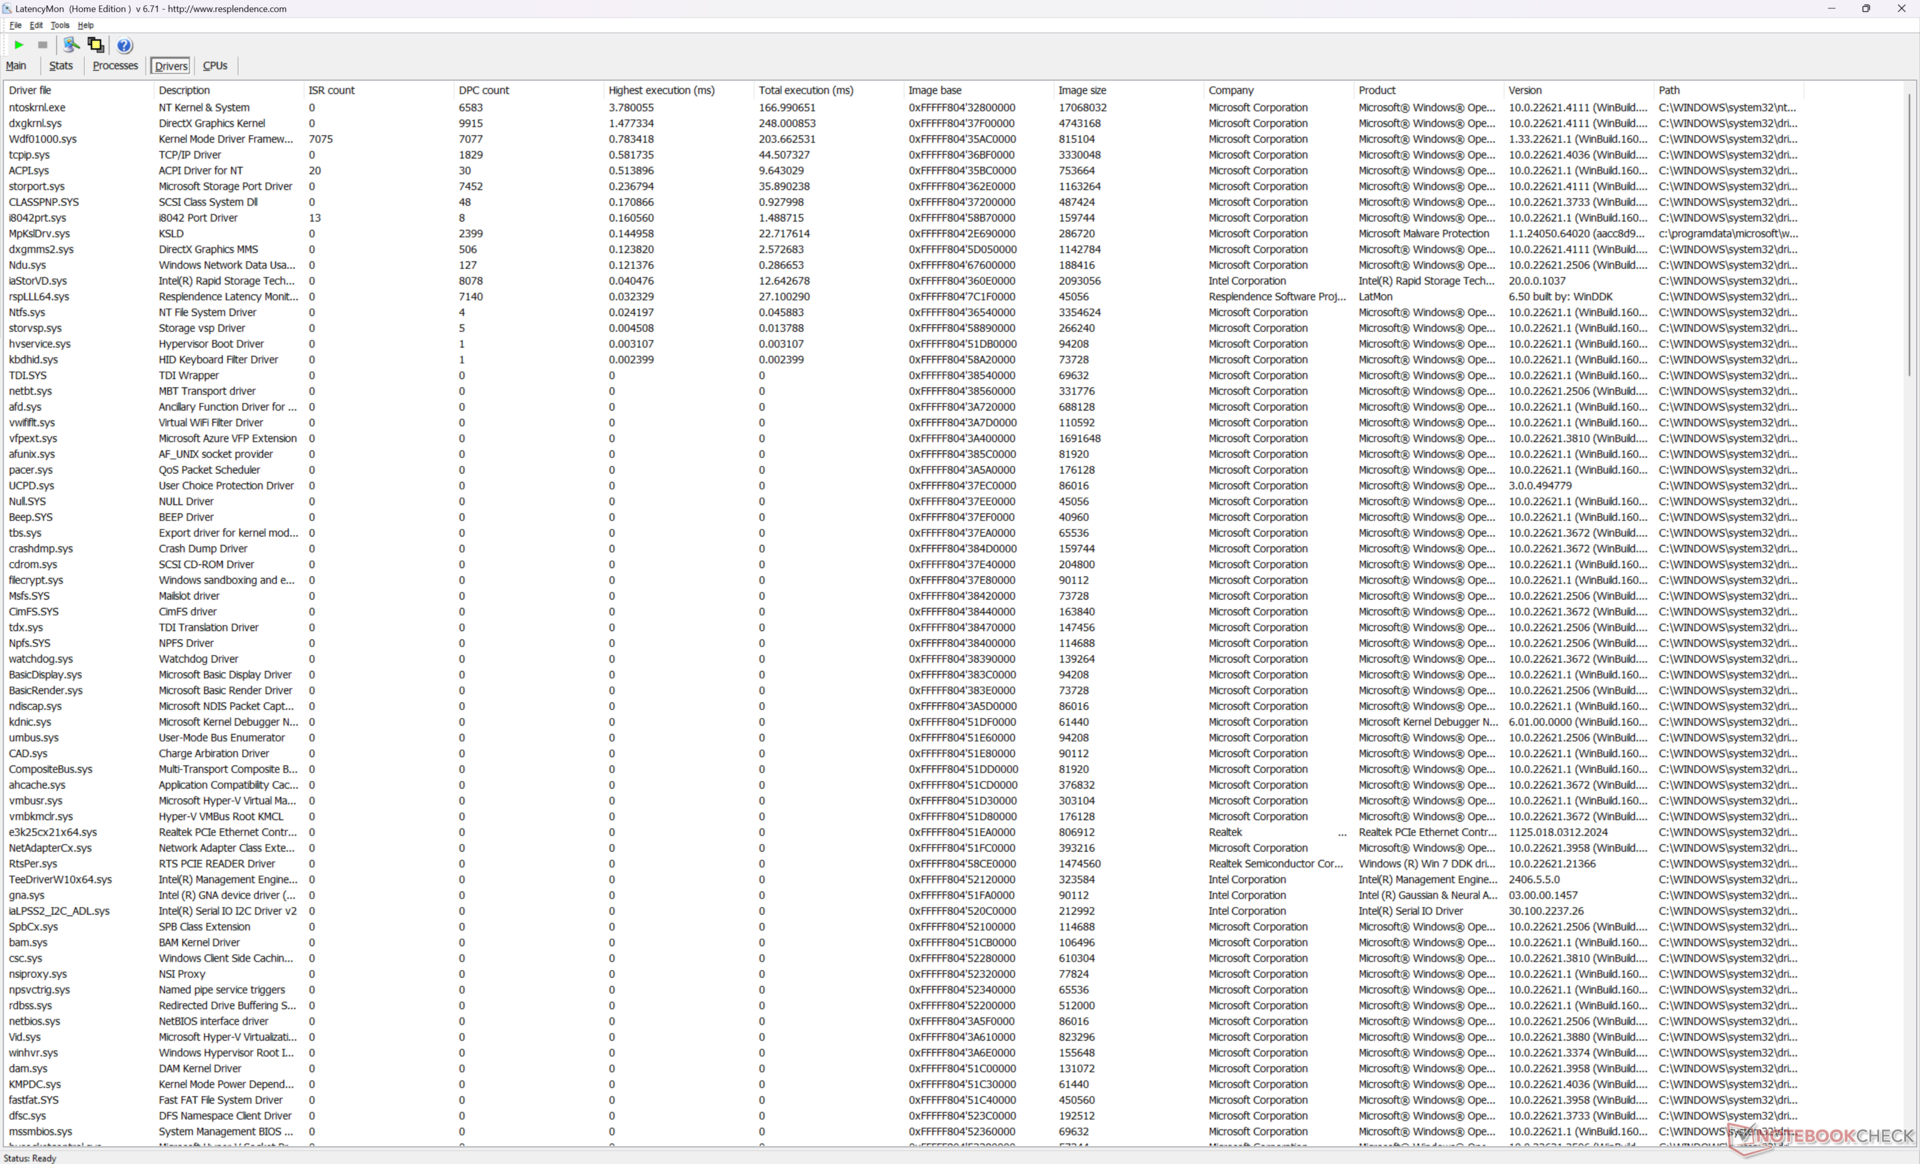
DPC-fördröjning
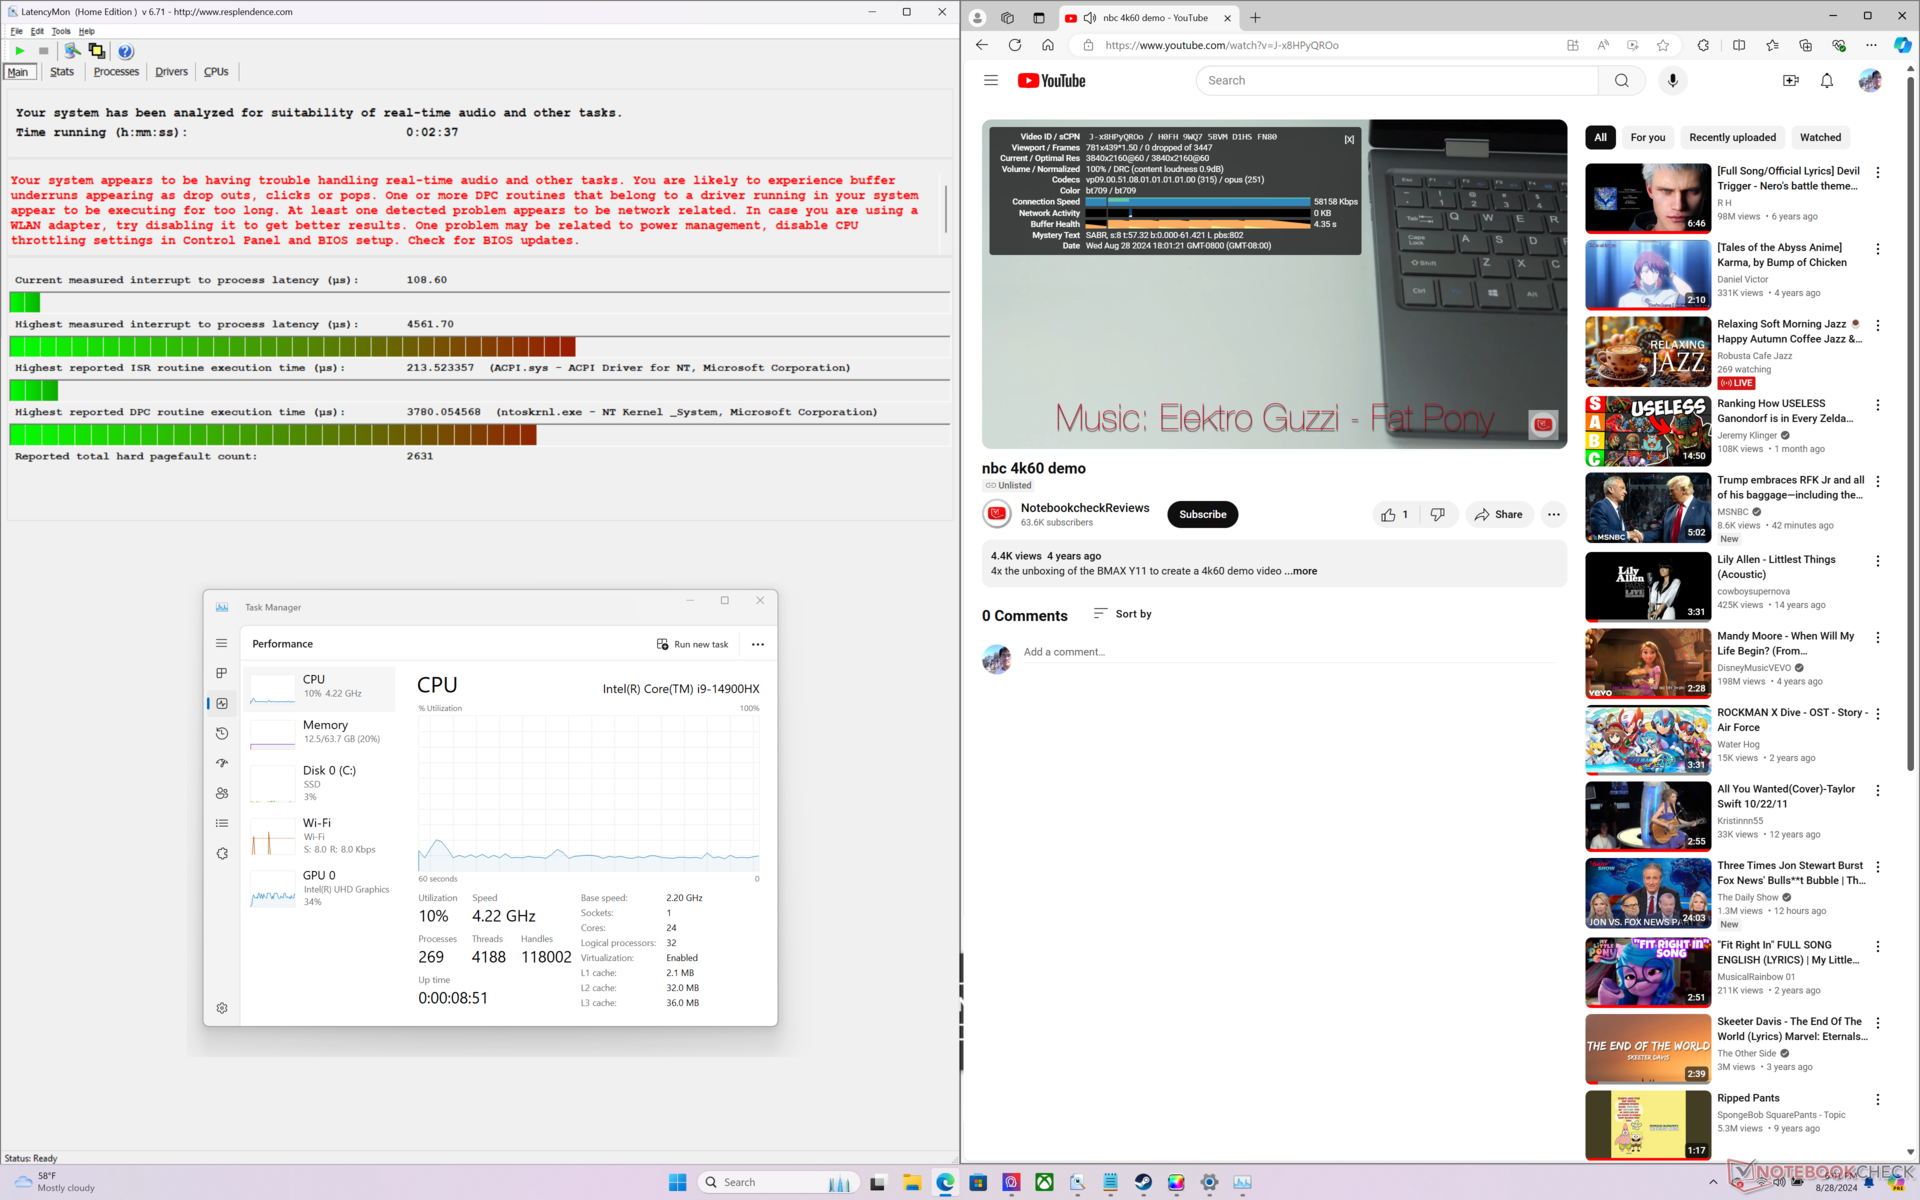
LatencyMon avslöjar DPC-problem när du öppnar flera flikar på vår hemsida även när den är inställd på iGPU-läge. uppspelning av 4K-video med 60 FPS är annars perfekt utan några tappade bildrutor.
| DPC Latencies / LatencyMon - interrupt to process latency (max), Web, Youtube, Prime95 | |
| MSI Raider 18 HX A14V | |
| Acer Predator Helios 18 PH18-72-98MW | |
| Alienware m18 R2 | |
| MSI Titan 18 HX A14VIG | |
| Razer Blade 18 2024 RZ09-0509 | |
| Asus ROG Strix G18 G814JI | |
* ... mindre är bättre
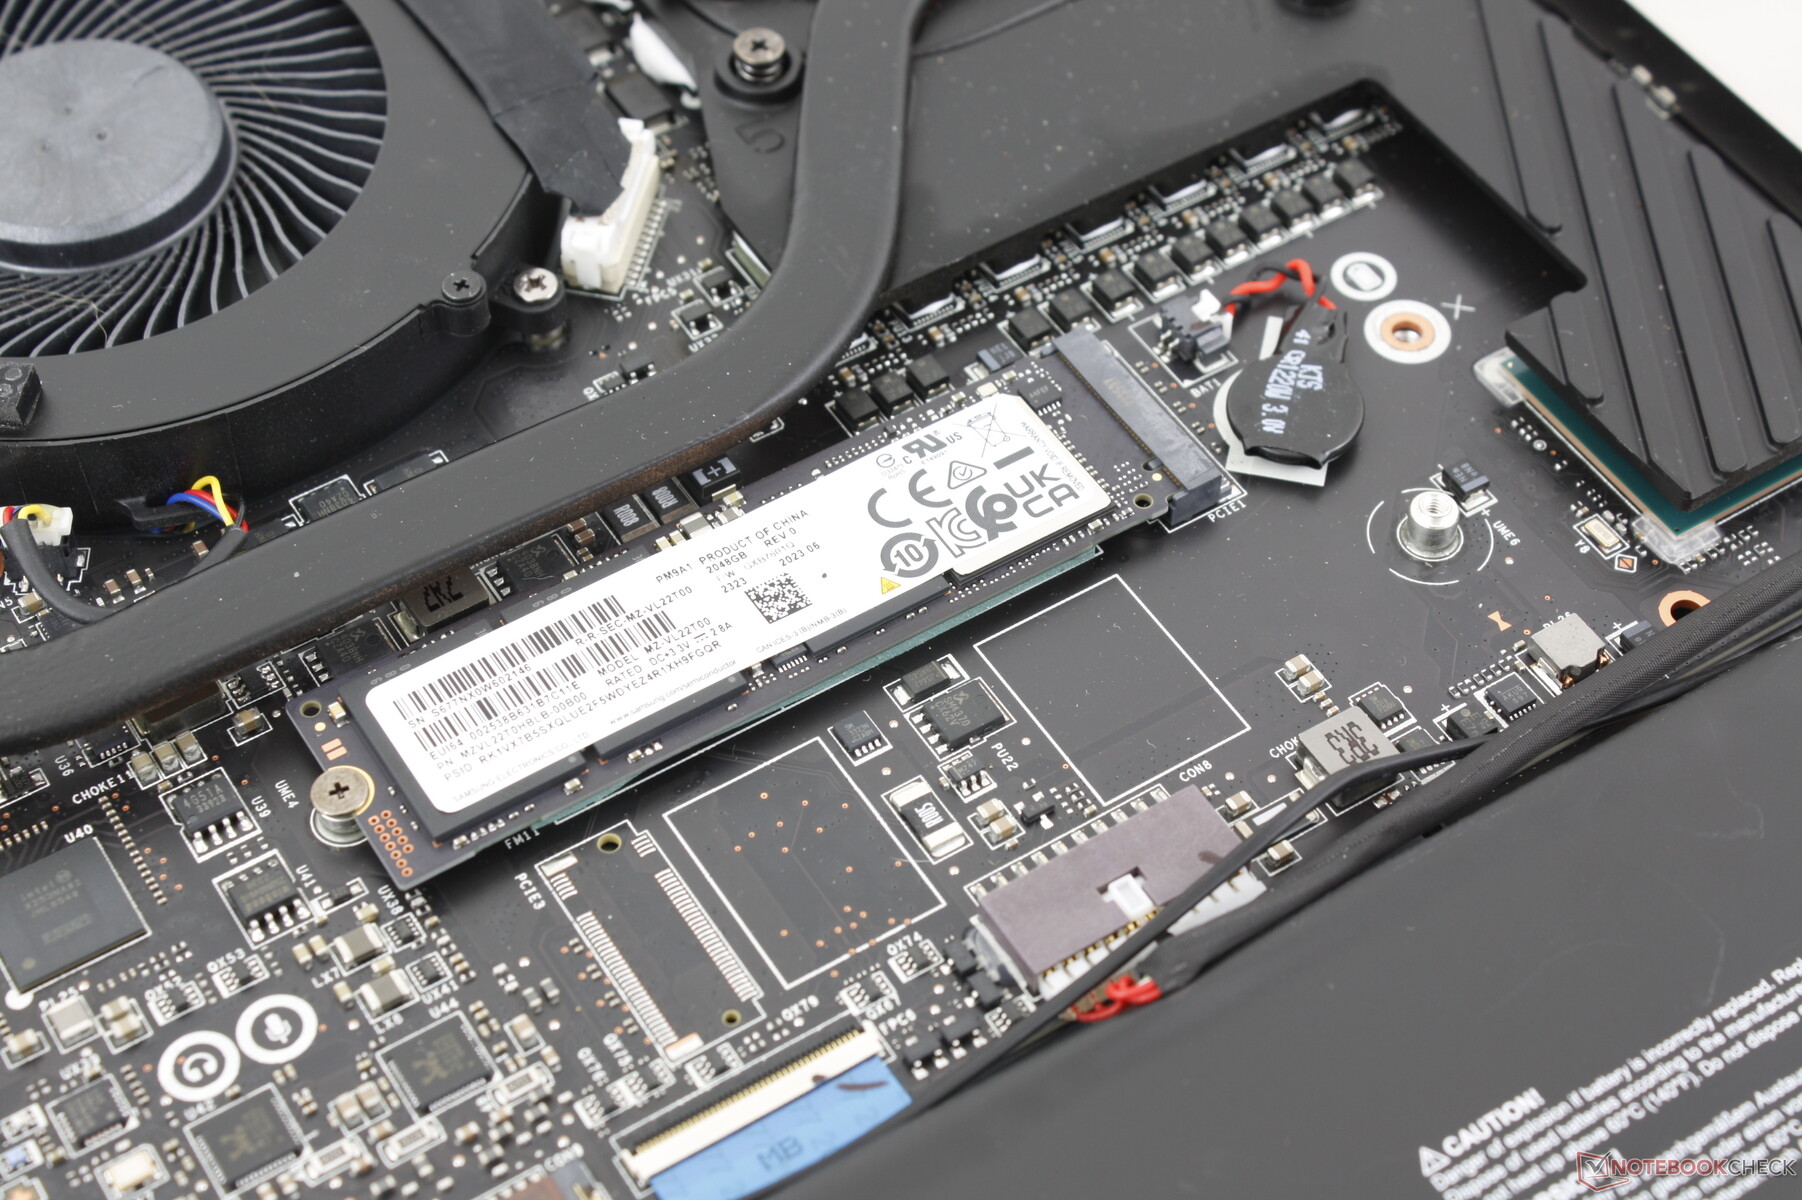
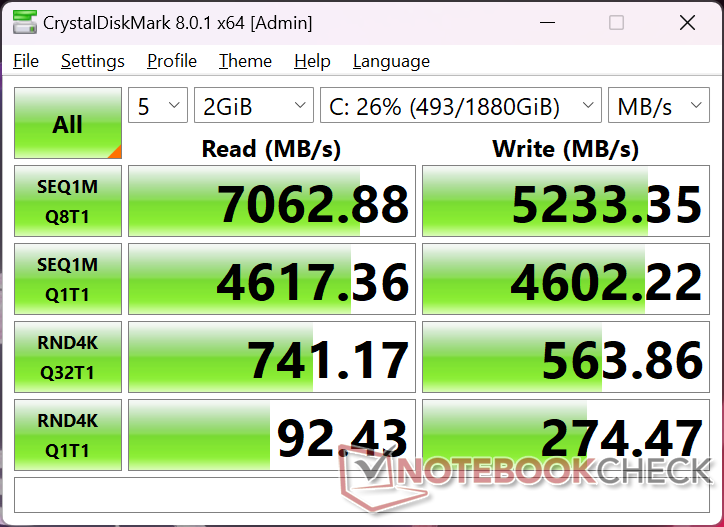
Lagringsenheter
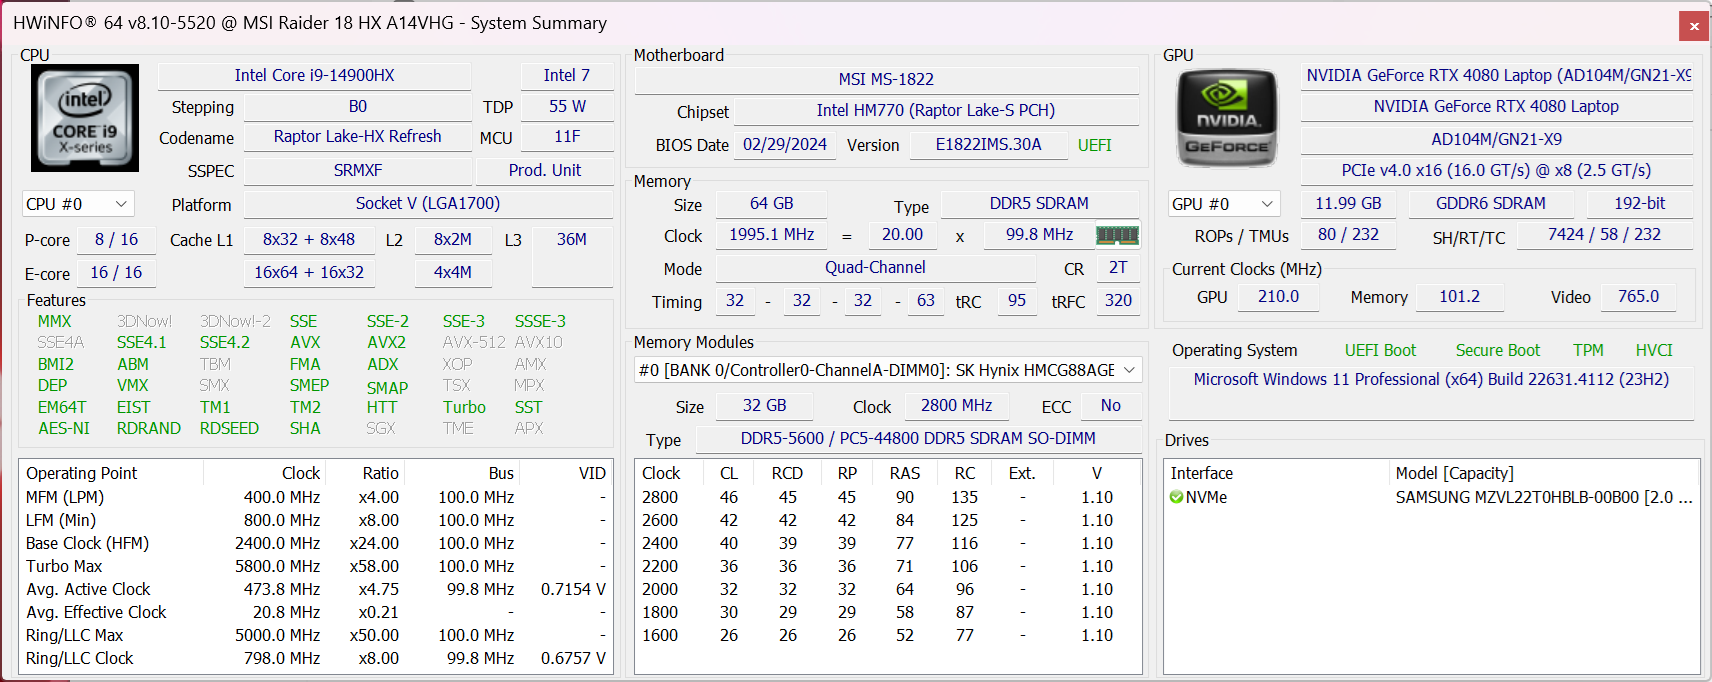
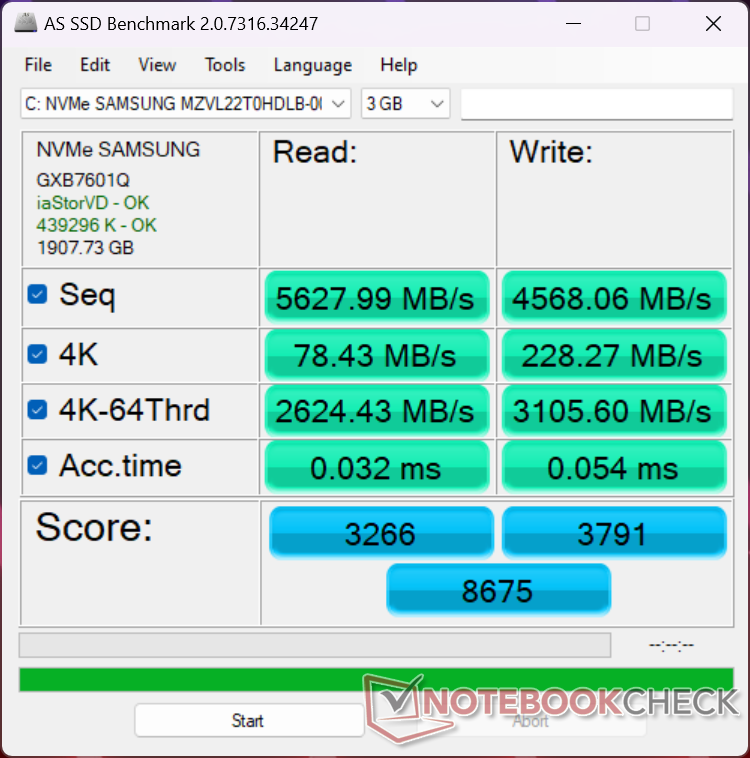
Vår enhet levereras med Samsung PM9A1a MZVL22T0HDLB PCIe4 SSD som ofta finns i avancerade bärbara datorer. Överföringshastigheterna är stabila på ~7000 MB/s även under stress och de kan bli ännu snabbare om de konfigureras med en PCIe5-enhet. Avsaknaden av en medföljande värmespridare kan dock innebära att PCIe5-enheter är mer benägna att strypas.

| Drive Performance Rating - Percent | |
| Alienware m18 R2 | |
| MSI Raider 18 HX A14V | |
| Acer Predator Helios 18 PH18-72-98MW | |
| MSI Titan 18 HX A14VIG | |
| Razer Blade 18 2024 RZ09-0509 | |
| Asus ROG Strix G18 G814JI | |
* ... mindre är bättre
Disk Throttling: DiskSpd Read Loop, Queue Depth 8
GPU-prestanda - 175 W TGP Graphics
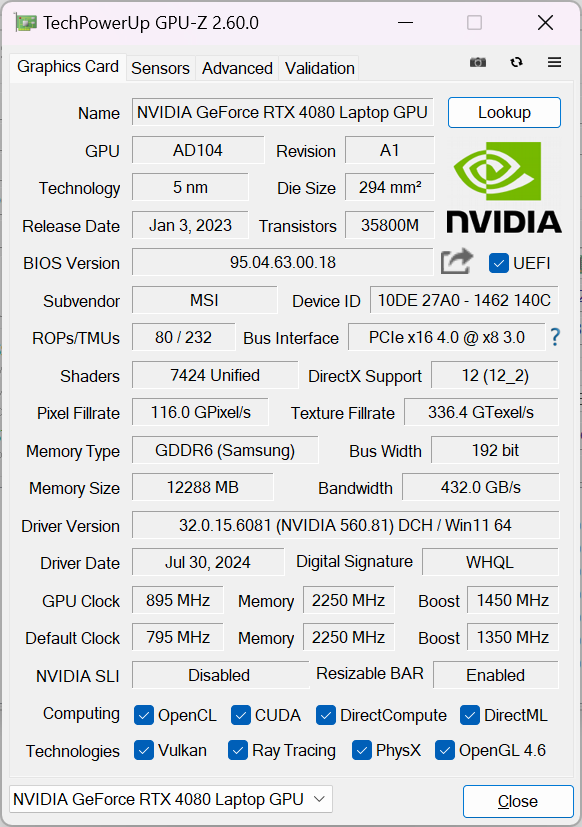
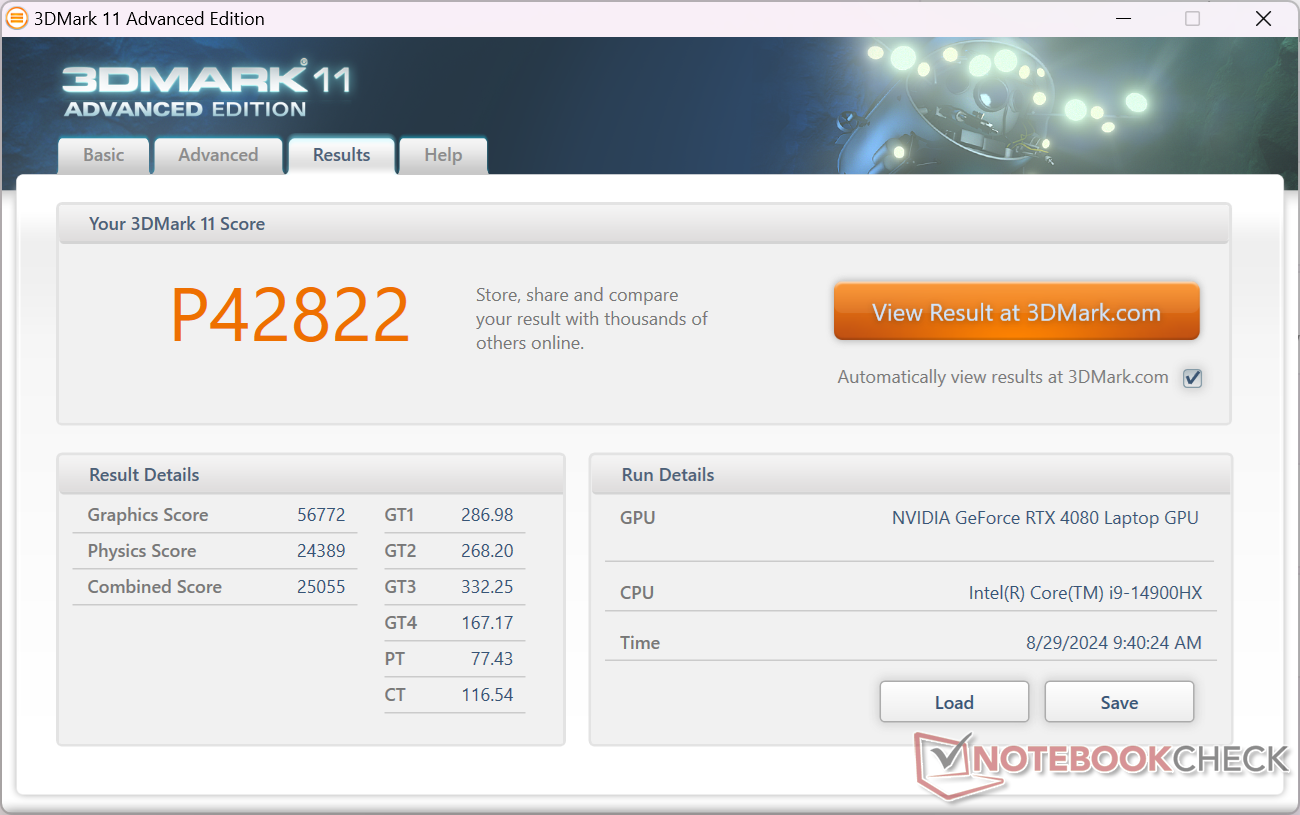
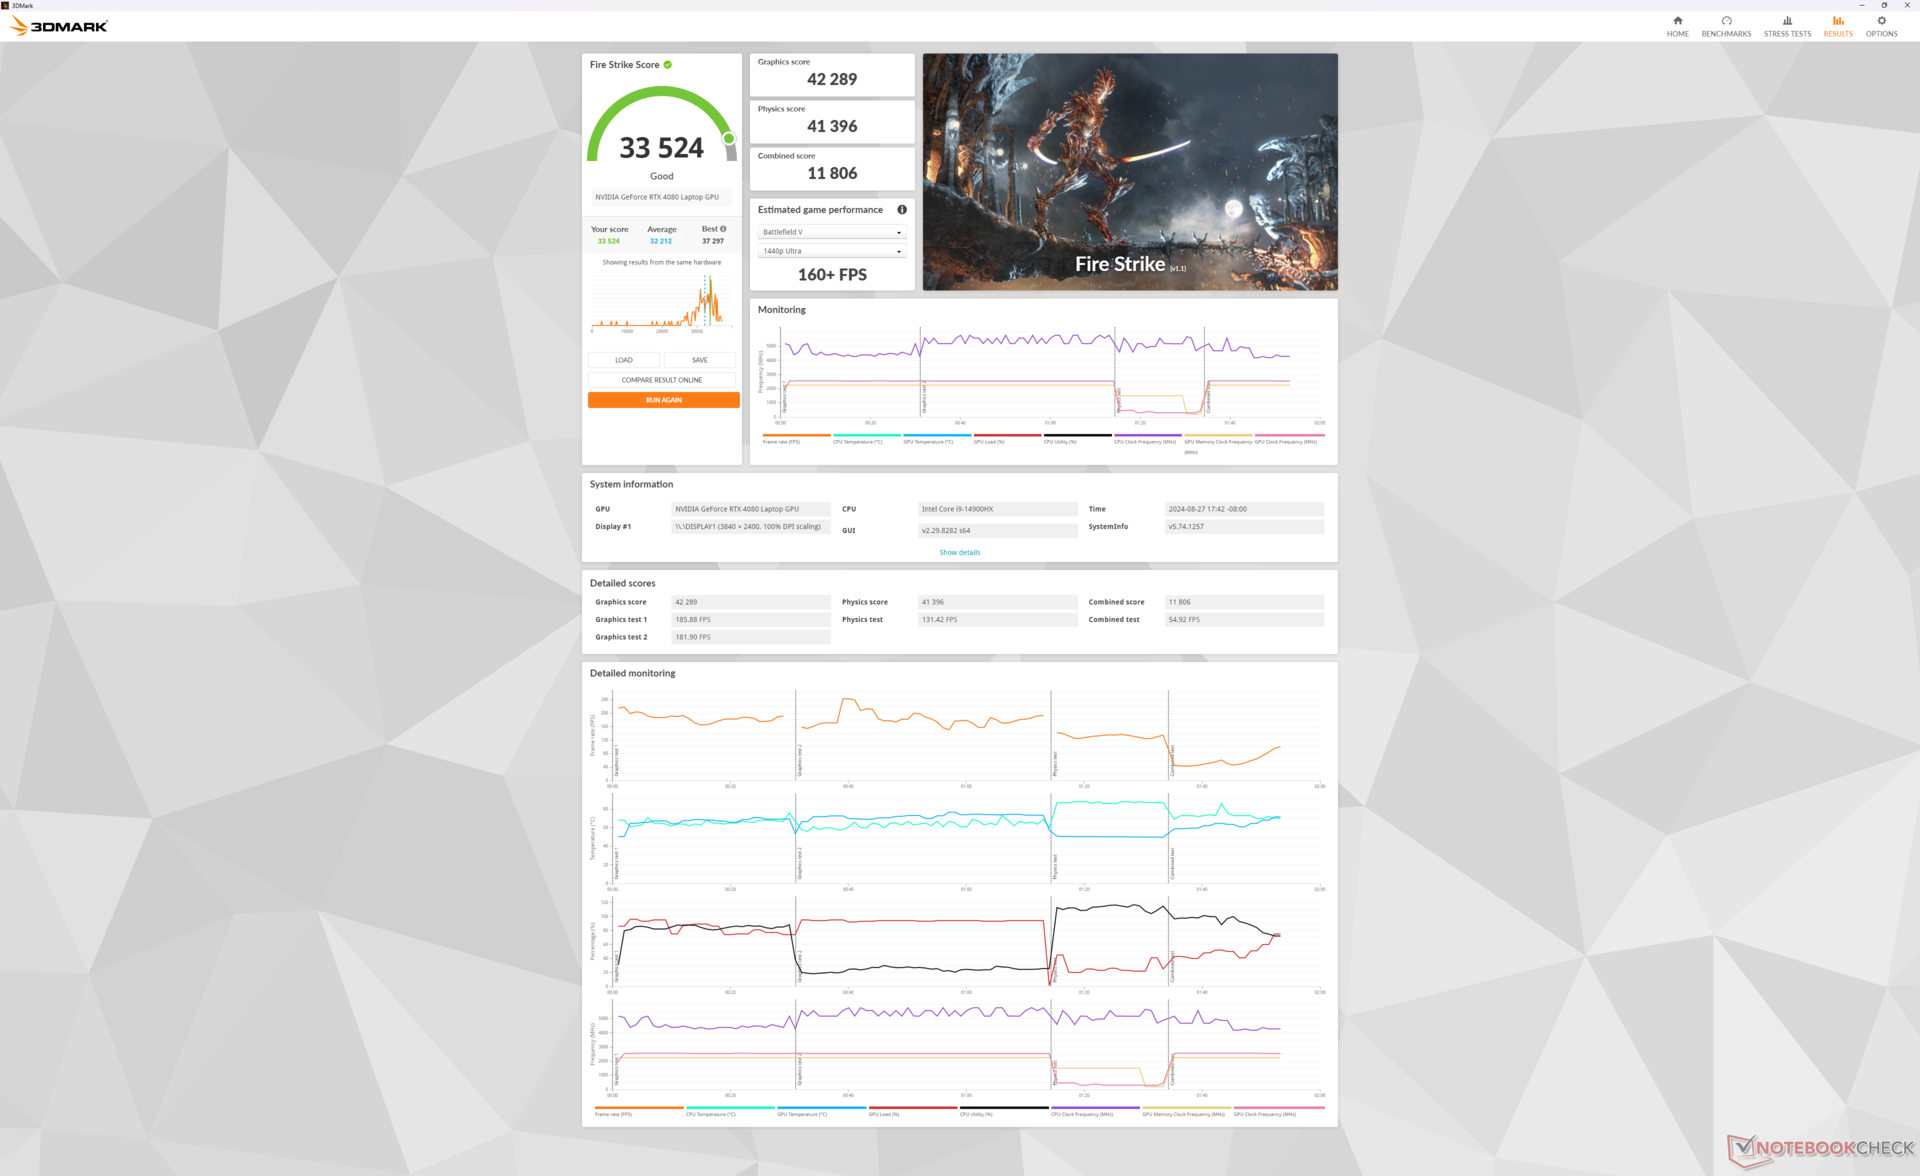
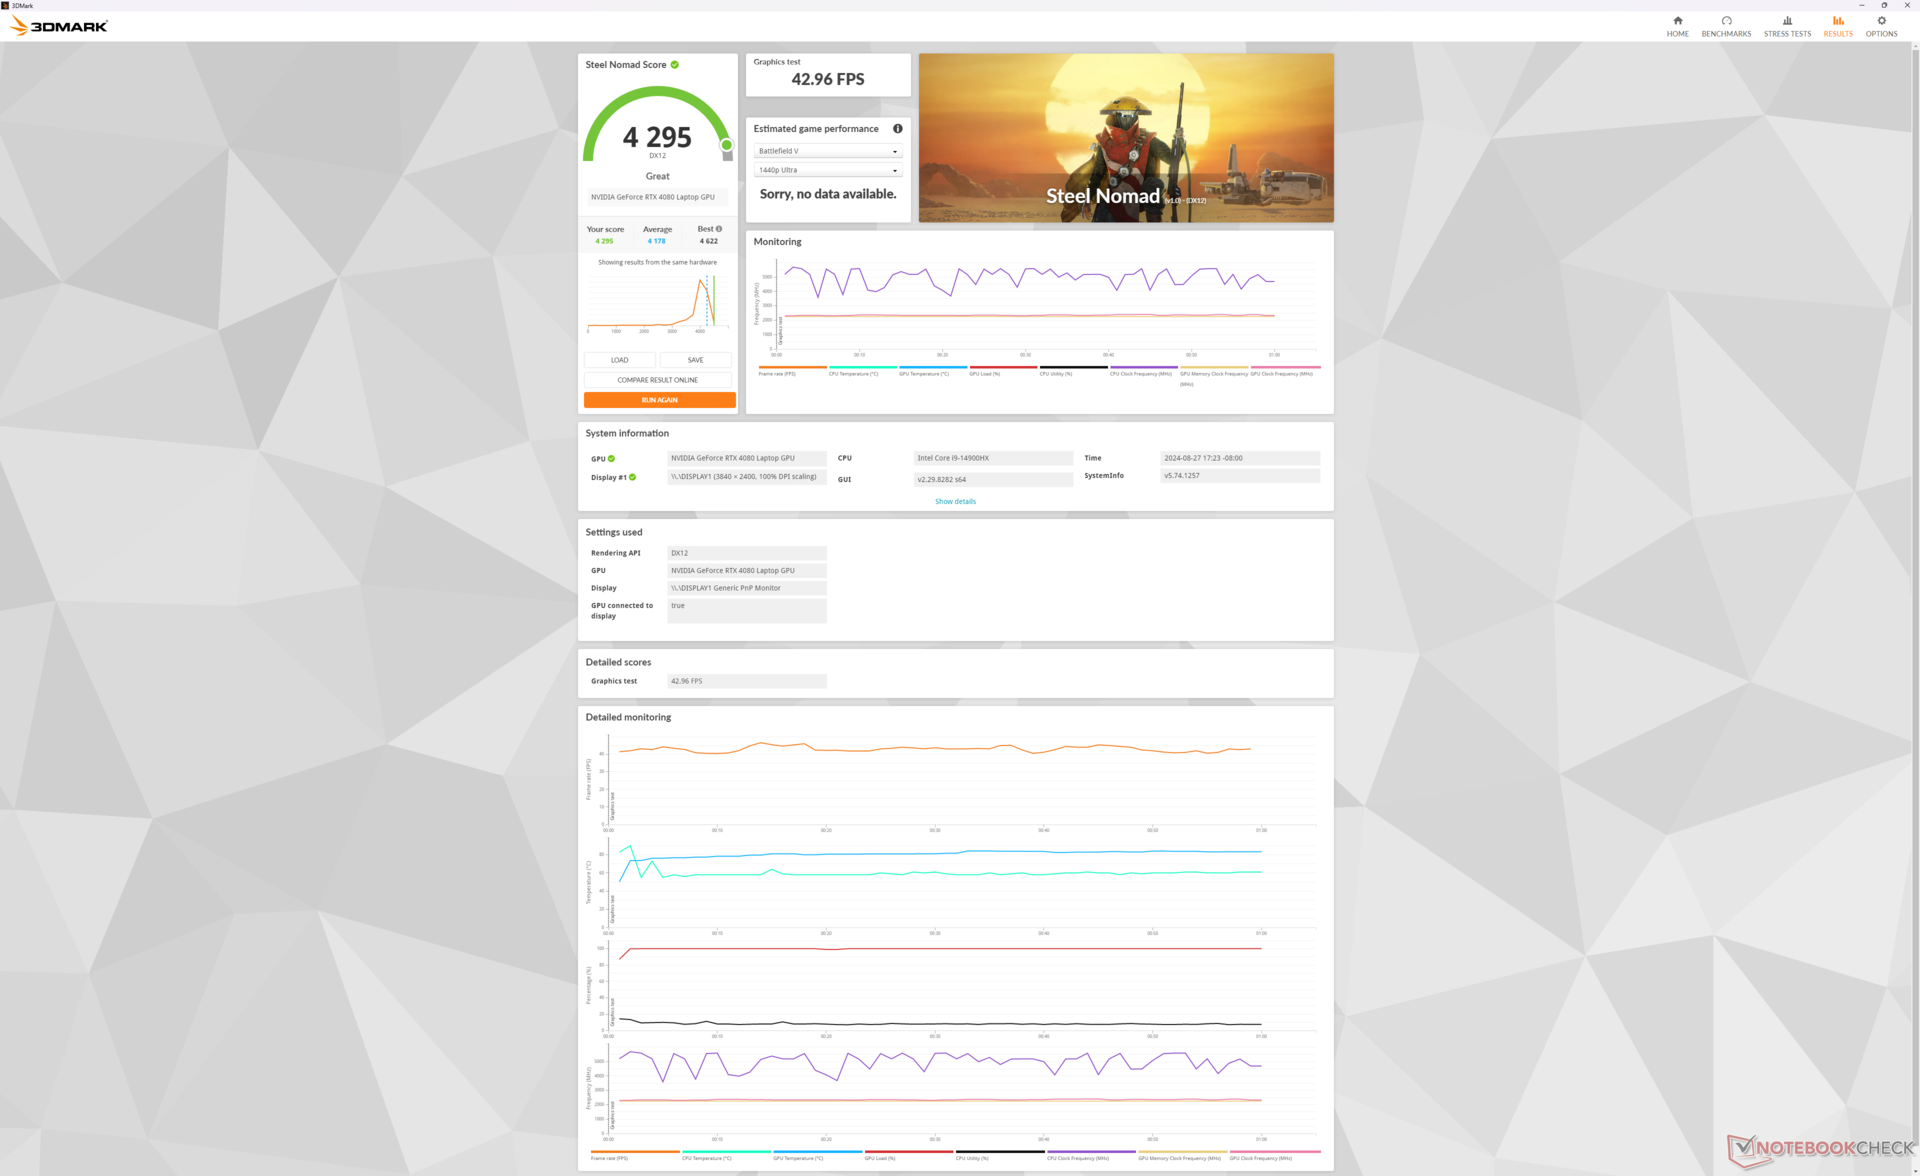
Till skillnad från tunnare bärbara datorer som kan levereras med svagare 80 W GeForce RTX 4080-grafiklevereras den större Raider 18 HX med en kraftfullare version på 175 W (150 W + 25 W dynamic boost). Prestandan är cirka 5 procent snabbare än den genomsnittliga bärbara datorn i vår databas med samma GPU medan en uppgradering till RTX 4090 ökar prestandan med ytterligare 10 procent.
Kom ihåg att den totala prestandan fortfarande är 30 till 35 procent långsammare än stationära versionen av GeForce RTX 4080 även om den mobila versionen har samma namn. Vår mobila RTX 4080 ligger därför närmare prestandan hos den stationära RTX 4070.
| Kraftprofil | Grafikpoäng | Fysikpoäng | Kombinerad poäng |
| Extrem prestanda (Cooler Boost på) | 42289 | 41396 | 11806 |
| Extrem prestanda (kylarförstärkning av) | 41778 (-1%) | 40723 (-2%) | 11968 (-1%) |
| Balanserat läge | 41673 (-2%) | 41013 (-1%) | 10404 (-12%) |
| Batteridrift | 21731 (-49%) | 17988 (-57%) | 5809 (-51%) |
Att gå från Extreme Performance-läge till Balanced-läge påverkar prestandan endast marginellt, vilket stämmer överens med våra stresstestobservationer ovan. Att aktivera Cooler Boost gör inte heller någon större skillnad förutom att det sänker kärntemperaturen genom att öka fläktljudet avsevärt.

| 3DMark Performance Rating - Percent | |
| NVIDIA GeForce RTX 4080 Founders Edition -1! | |
| Alienware m18 R2 -1! | |
| Razer Blade 18 2024 RZ09-0509 -1! | |
| MSI Raider 18 HX A14V | |
| Alienware m18 R1 AMD -2! | |
| Genomsnitt NVIDIA GeForce RTX 4080 Laptop GPU | |
| Zotac Gaming GeForce RTX 4070 AMP Airo -1! | |
| Asus ROG Strix Scar 17 SE G733CX-LL014W -1! | |
| Alienware x17 RTX 3080 P48E -2! | |
| Asus ROG Strix G18 G814JI -2! | |
| SCHENKER XMG Ultra 17 Comet Lake -2! | |
| MSI Pulse GL76 12UGK -1! | |
| 3DMark 11 Performance | 42822 poäng | |
| 3DMark Fire Strike Score | 33524 poäng | |
| 3DMark Time Spy Score | 18608 poäng | |
| 3DMark Steel Nomad Score | 4295 poäng | |
Hjälp | ||
* ... mindre är bättre
Prestanda för spel
Moderna titlar körs hyfsat bra i den inbyggda 4K UHD+-upplösningen. DLSS rekommenderas när du kör mer krävande titlar som Cyberpunk 2077 för att öka bildhastigheterna närmare 60 FPS.
Märkligt nog kunde Baldur's Gate 3 inte starta på vår enhet även efter flera systemåterställningar i DX11- eller DX12-lägen.
| Performance Rating - Percent | |
| Alienware m18 R2 | |
| MSI Titan 18 HX A14VIG | |
| MSI Raider 18 HX A14V | |
| Razer Blade 18 2024 RZ09-0509 -1! | |
| Acer Predator Helios 18 PH18-72-98MW | |
| Asus ROG Strix G18 G814JI | |
| Tiny Tina's Wonderlands | |
| 1920x1080 High Preset (DX12) | |
| Alienware m18 R2 | |
| MSI Raider 18 HX A14V | |
| Genomsnitt NVIDIA GeForce RTX 4080 Laptop GPU (166.7 - 213, n=6) | |
| 1920x1080 Badass Preset (DX12) | |
| Alienware m18 R2 | |
| MSI Raider 18 HX A14V | |
| Alienware m18 R1 AMD | |
| Genomsnitt NVIDIA GeForce RTX 4080 Laptop GPU (112.9 - 167.1, n=9) | |
| 2560x1440 Badass Preset (DX12) | |
| Alienware m18 R2 | |
| MSI Raider 18 HX A14V | |
| Alienware m18 R1 AMD | |
| Genomsnitt NVIDIA GeForce RTX 4080 Laptop GPU (85 - 114.8, n=9) | |
| 3840x2160 Badass Preset (DX12) | |
| Alienware m18 R2 | |
| MSI Raider 18 HX A14V | |
| Alienware m18 R1 AMD | |
| Genomsnitt NVIDIA GeForce RTX 4080 Laptop GPU (46.4 - 60.9, n=9) | |
Cyberpunk 2077 ultra FPS Chart
| låg | med. | hög | ultra | QHD | 4K | |
|---|---|---|---|---|---|---|
| GTA V (2015) | 185.1 | 183.8 | 181.6 | 143.4 | 134.6 | 158.3 |
| Dota 2 Reborn (2015) | 218 | 193.1 | 184.6 | 172.5 | 166.4 | |
| Final Fantasy XV Benchmark (2018) | 223 | 212 | 177 | 141.8 | 78.6 | |
| X-Plane 11.11 (2018) | 199 | 178.5 | 143.5 | 119.3 | ||
| Far Cry 5 (2018) | 173 | 163 | 151 | 149 | 96 | |
| Strange Brigade (2018) | 504 | 408 | 378 | 349 | 246 | 122.6 |
| Tiny Tina's Wonderlands (2022) | 352.5 | 292.6 | 203.3 | 159.4 | 111.2 | 60.9 |
| F1 22 (2022) | 305 | 299 | 271 | 121.2 | 77.8 | 39.8 |
| Cyberpunk 2077 2.2 Phantom Liberty (2023) | 150.6 | 150 | 140.7 | 125.5 | 82.5 | 35.1 |
Utsläpp - Tyst vid tomgångskörning, högt vid spel
Systembuller
Fläktljud och beteende liknar det hos Titan 18 HX trots deras skillnader i kyllösning. Fläktarna är benägna att pulsera även när du surfar på webben i balanserat läge eller tyst läge, precis som på Titan, men ljudökningen är tack och lov inte tillräckligt skarp för att vara distraherande.
MSI Center har en direkt inverkan på spelupplevelsen eftersom fläktljudet är nära knutet till din valda strömprofil. Att köra Cyberpunk 2077 i balanserat läge, Extreme Performance-läge med Cooler Boost av och Extreme Performance-läge med Cooler Boost på skulle resultera i ett stabilt fläktljud på 52,8 dB(A), 59,4 dB(A) respektive 62,7 dB(A). Ljudskillnaden mellan lägena Balanced och Extreme Performance är betydande trots att prestandaskillnaden mellan dem är liten, vilket innebär att läget Balanced rekommenderas för de flesta spelscenarier. Cooler Boost är därför mest användbart för manuell överklockning eftersom det annars inte ger några större spelfördelar med standardinställningarna.
Det låga till mellersta 50 dB(A)-intervallet vid spel liknar mest Blade 18 eller Alienware m18 R2. Hörlurar rekommenderas, särskilt om du spelar i Extreme Performance-läget.
Ljudnivå
| Låg belastning |
| 28.6 / 28.6 / 31.3 dB(A) |
| Hög belastning |
| 44.1 / 62.7 dB(A) |
 | ||
30 dB tyst 40 dB(A) hörbar 50 dB(A) högt ljud |
||
min: | ||
| MSI Raider 18 HX A14V NVIDIA GeForce RTX 4080 Laptop GPU, i9-14900HX, Samsung PM9A1 MZVL22T0HBLB | Razer Blade 18 2024 RZ09-0509 NVIDIA GeForce RTX 4090 Laptop GPU, i9-14900HX | Alienware m18 R2 NVIDIA GeForce RTX 4090 Laptop GPU, i9-14900HX, SK Hynix PC811 HFS002TEM9X152N | MSI Titan 18 HX A14VIG NVIDIA GeForce RTX 4090 Laptop GPU, i9-14900HX, 2x Samsung PM9A1a MZVL22T0HDLB (RAID 0) | Asus ROG Strix G18 G814JI NVIDIA GeForce RTX 4070 Laptop GPU, i7-13650HX, Micron 2400 MTFDKBA1T0QFM | Acer Predator Helios 18 PH18-72-98MW NVIDIA GeForce RTX 4090 Laptop GPU, i9-14900HX, 2x SK Hynix HFS001TEJ9X115N (RAID 0) | |
|---|---|---|---|---|---|---|
| Noise | 7% | 11% | 10% | 8% | -12% | |
| av / miljö * | 23.3 | 23.4 -0% | 23.6 -1% | 22.8 2% | 25 -7% | 25 -7% |
| Idle Minimum * | 28.6 | 23.9 16% | 23.8 17% | 23.8 17% | 26 9% | 30 -5% |
| Idle Average * | 28.6 | 28.2 1% | 26.1 9% | 23.8 17% | 28 2% | 36 -26% |
| Idle Maximum * | 31.3 | 29 7% | 31.5 -1% | 28 11% | 29 7% | 44 -41% |
| Load Average * | 44.1 | 36.8 17% | 31.5 29% | 38 14% | 41 7% | 48 -9% |
| Cyberpunk 2077 ultra * | 59.4 | |||||
| Load Maximum * | 62.7 | 61.1 3% | 56.6 10% | 62.8 -0% | 46 27% | 51 19% |
| Witcher 3 ultra * | 54.1 | 52.1 | 57.3 | 44 | 49 |
* ... mindre är bättre
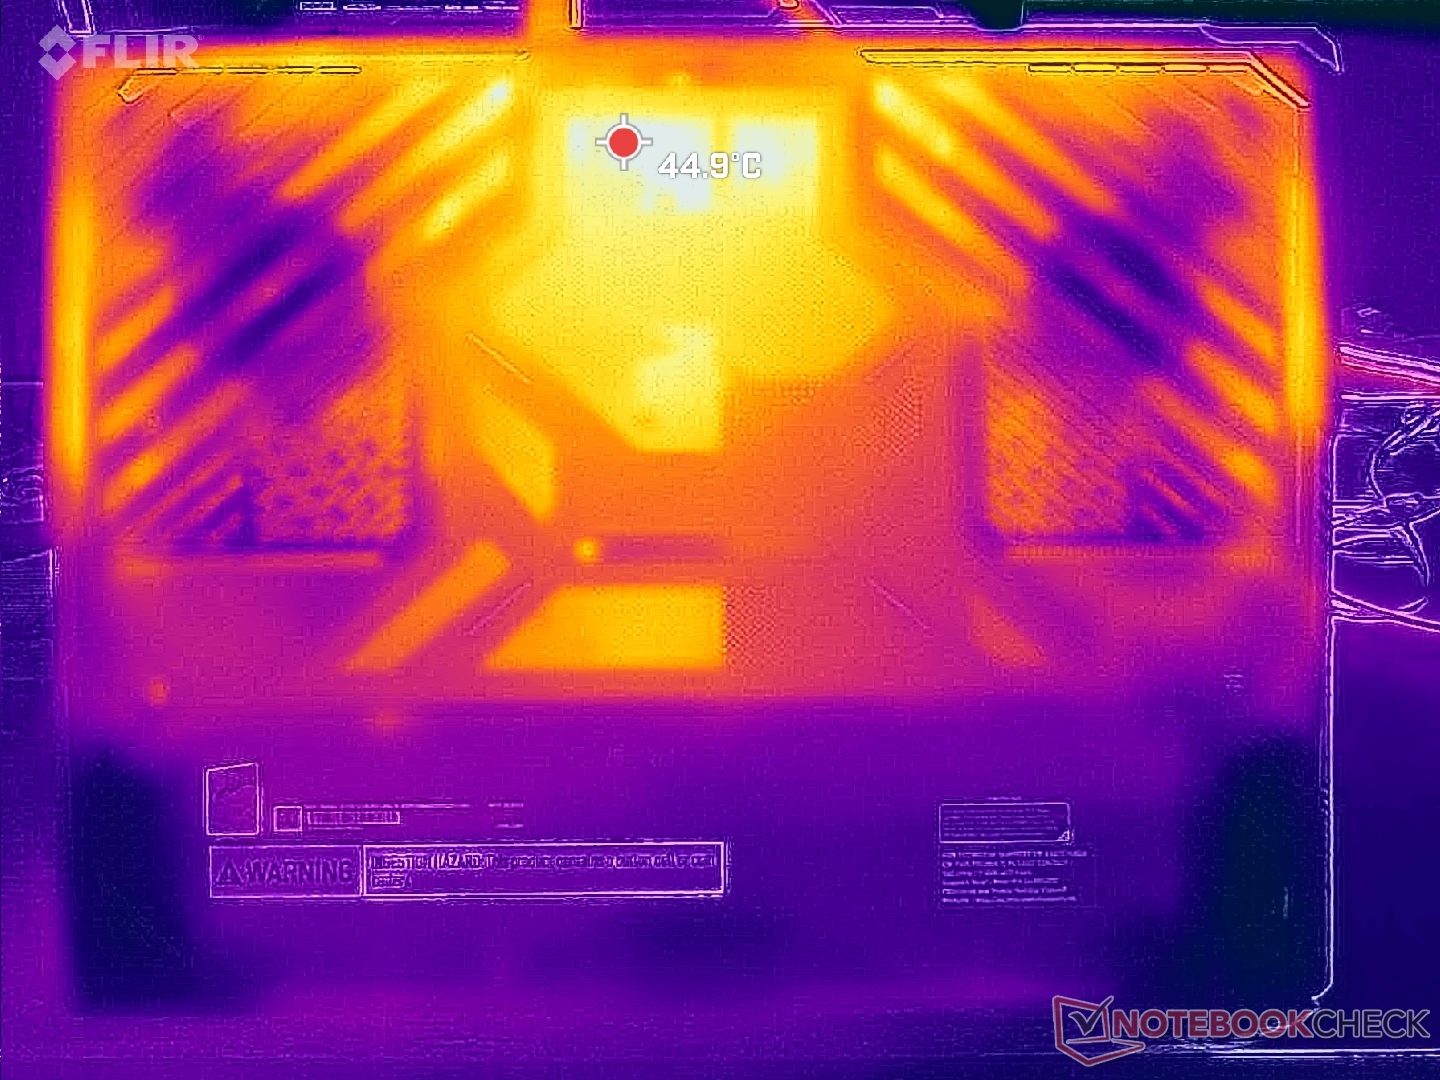
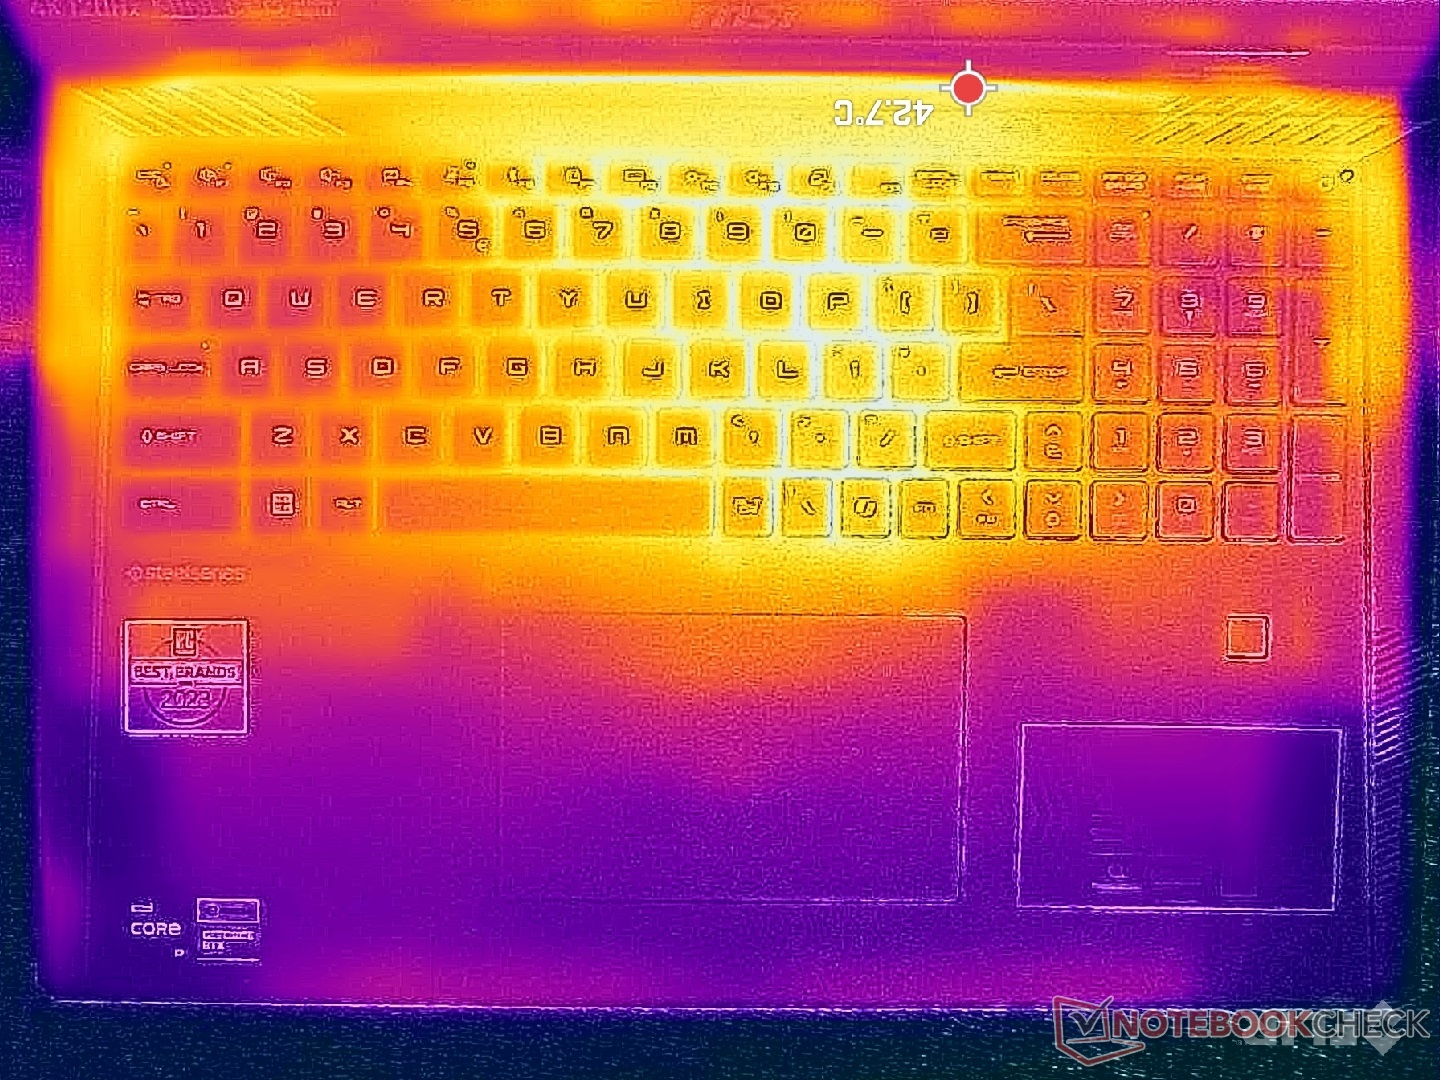
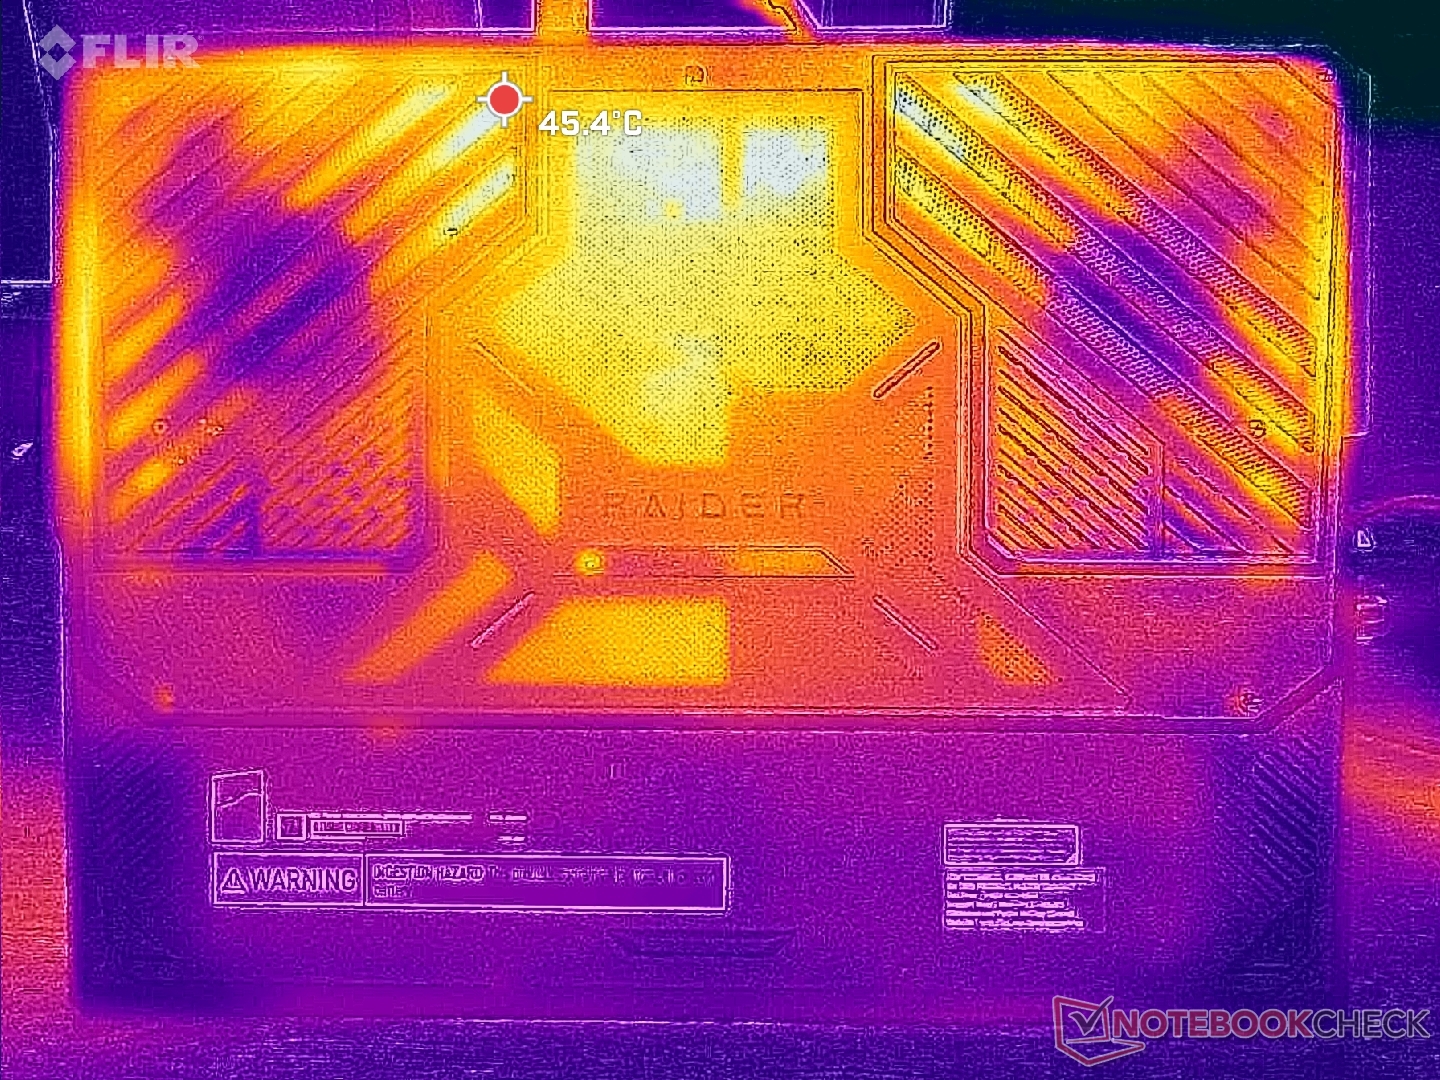
Temperatur
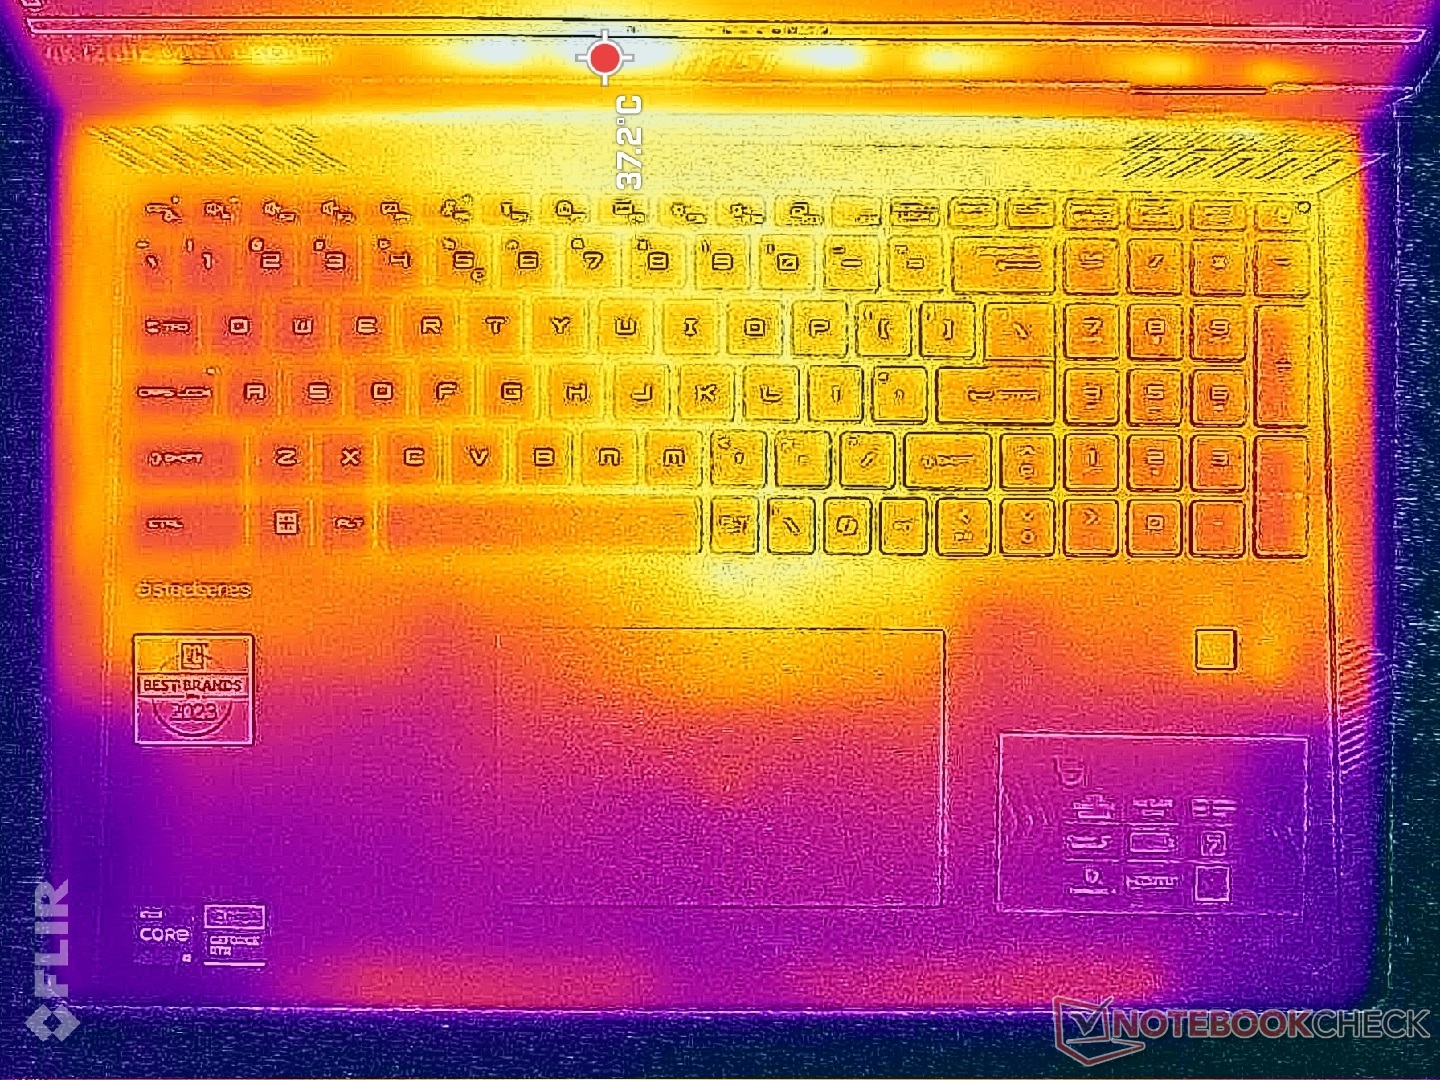
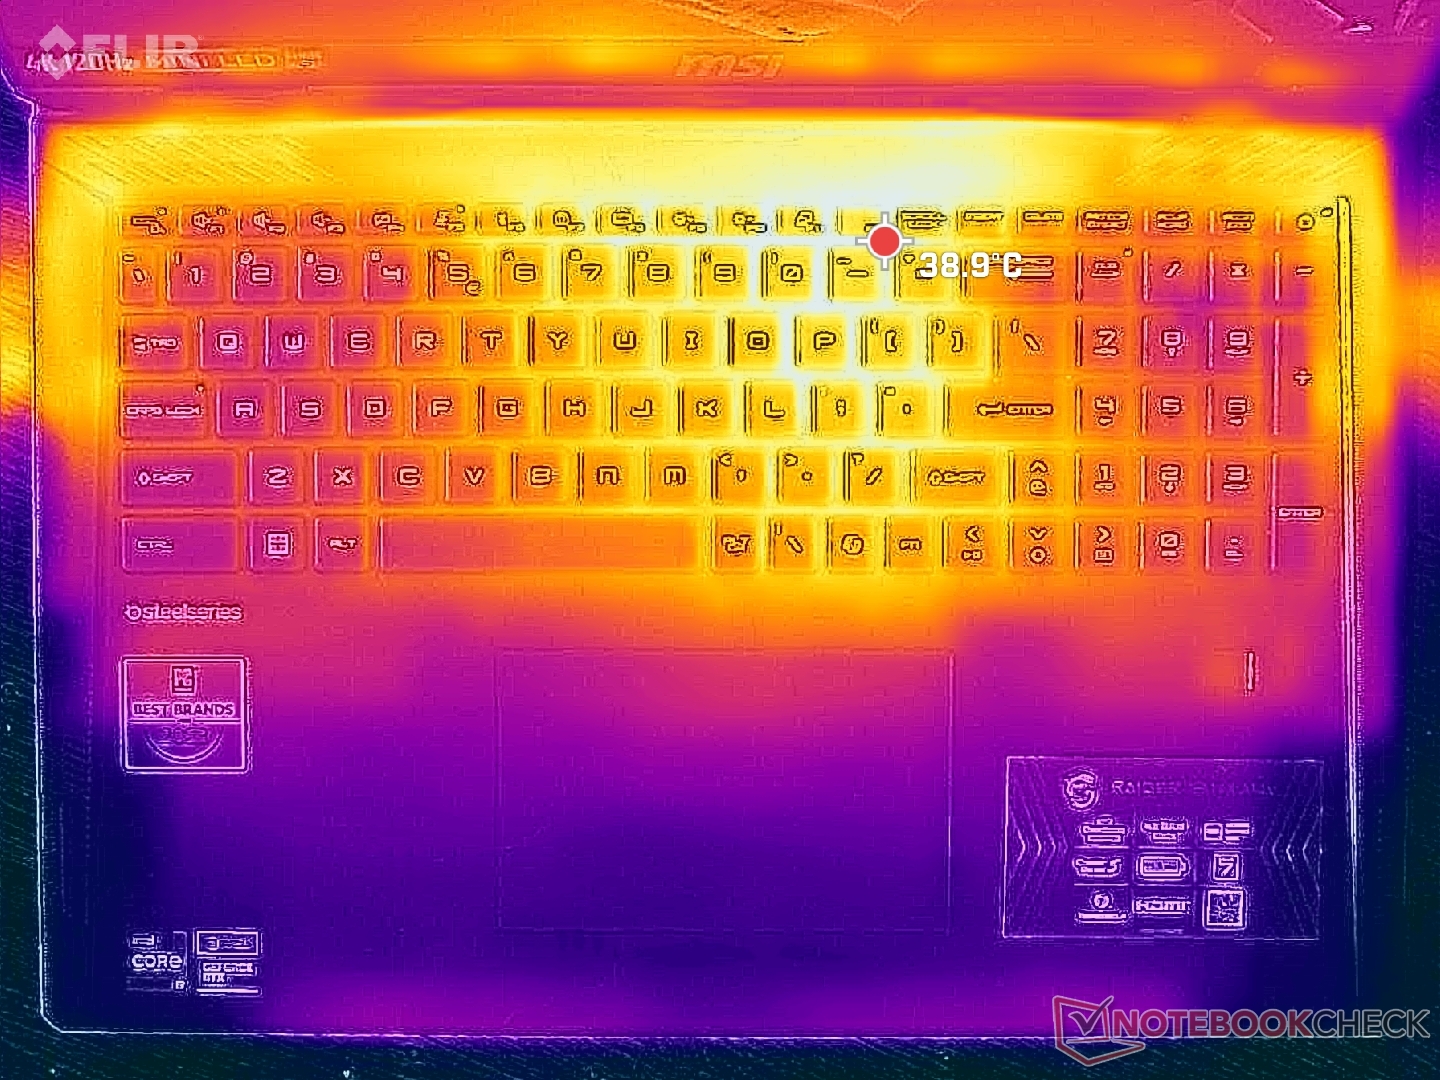
Hot spots kan nå strax över 40 C när du spelar, precis som på Titan 18 HX. De varmare områdena ligger mot tangentbordets mitt, vilket innebär att WASD-tangenterna, numpad och handledsstöden förblir mycket svalare och mer behagliga mot huden.
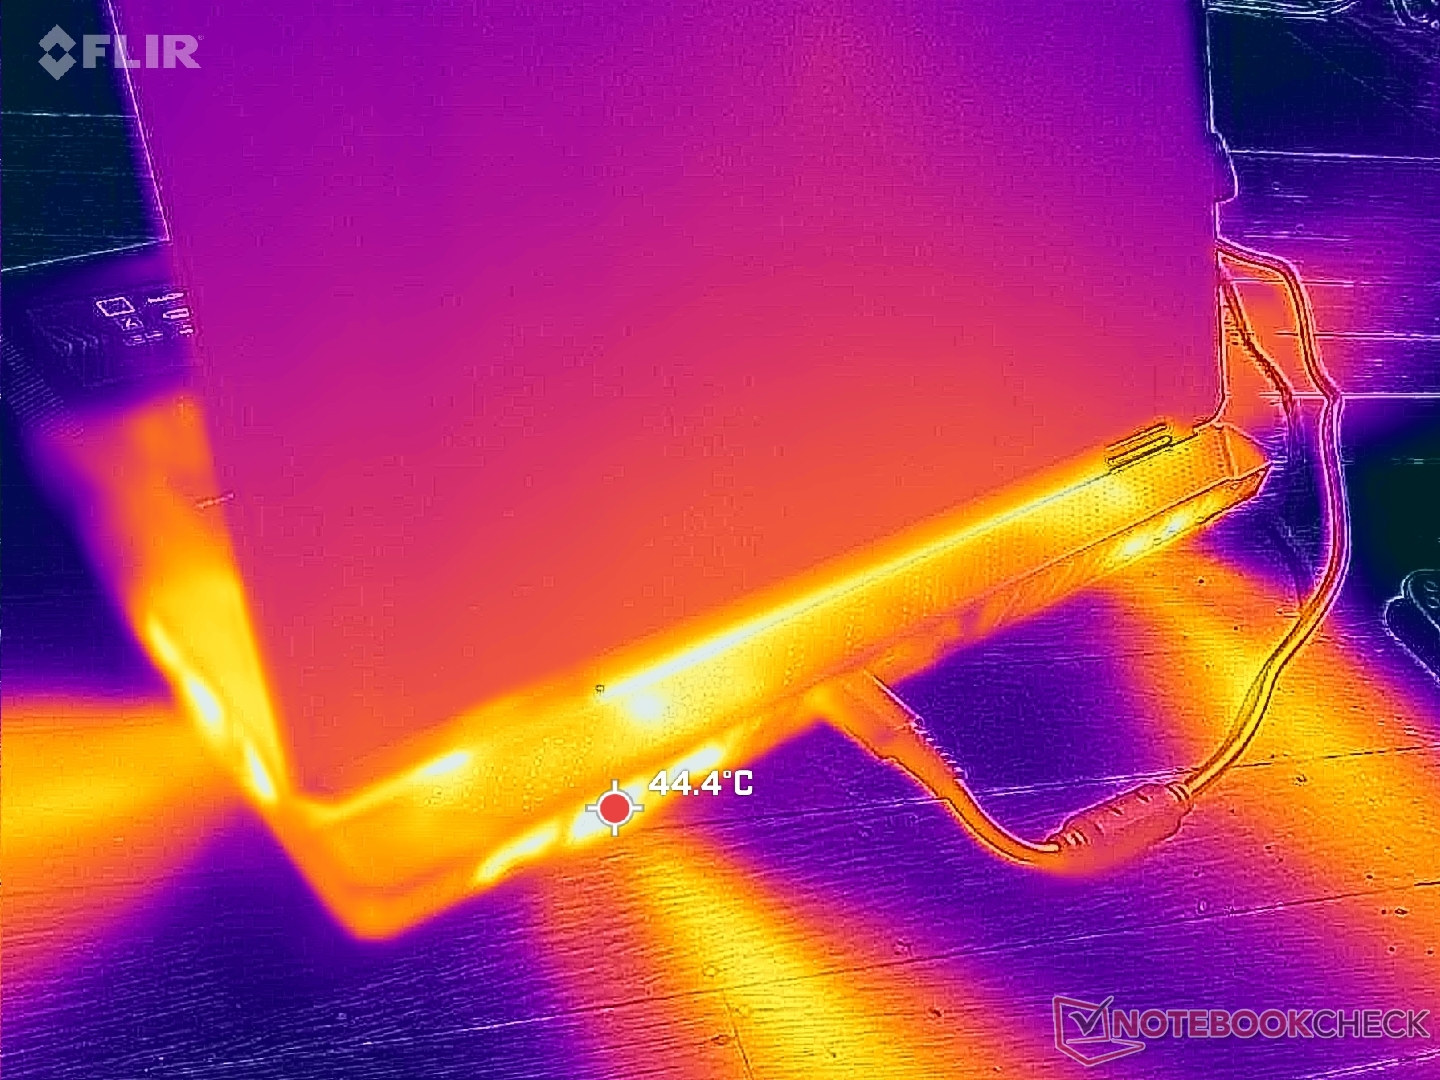
(±) Den maximala temperaturen på ovansidan är 40.8 °C / 105 F, jämfört med genomsnittet av 40.4 °C / 105 F , allt från 21.2 till 68.8 °C för klassen Gaming.
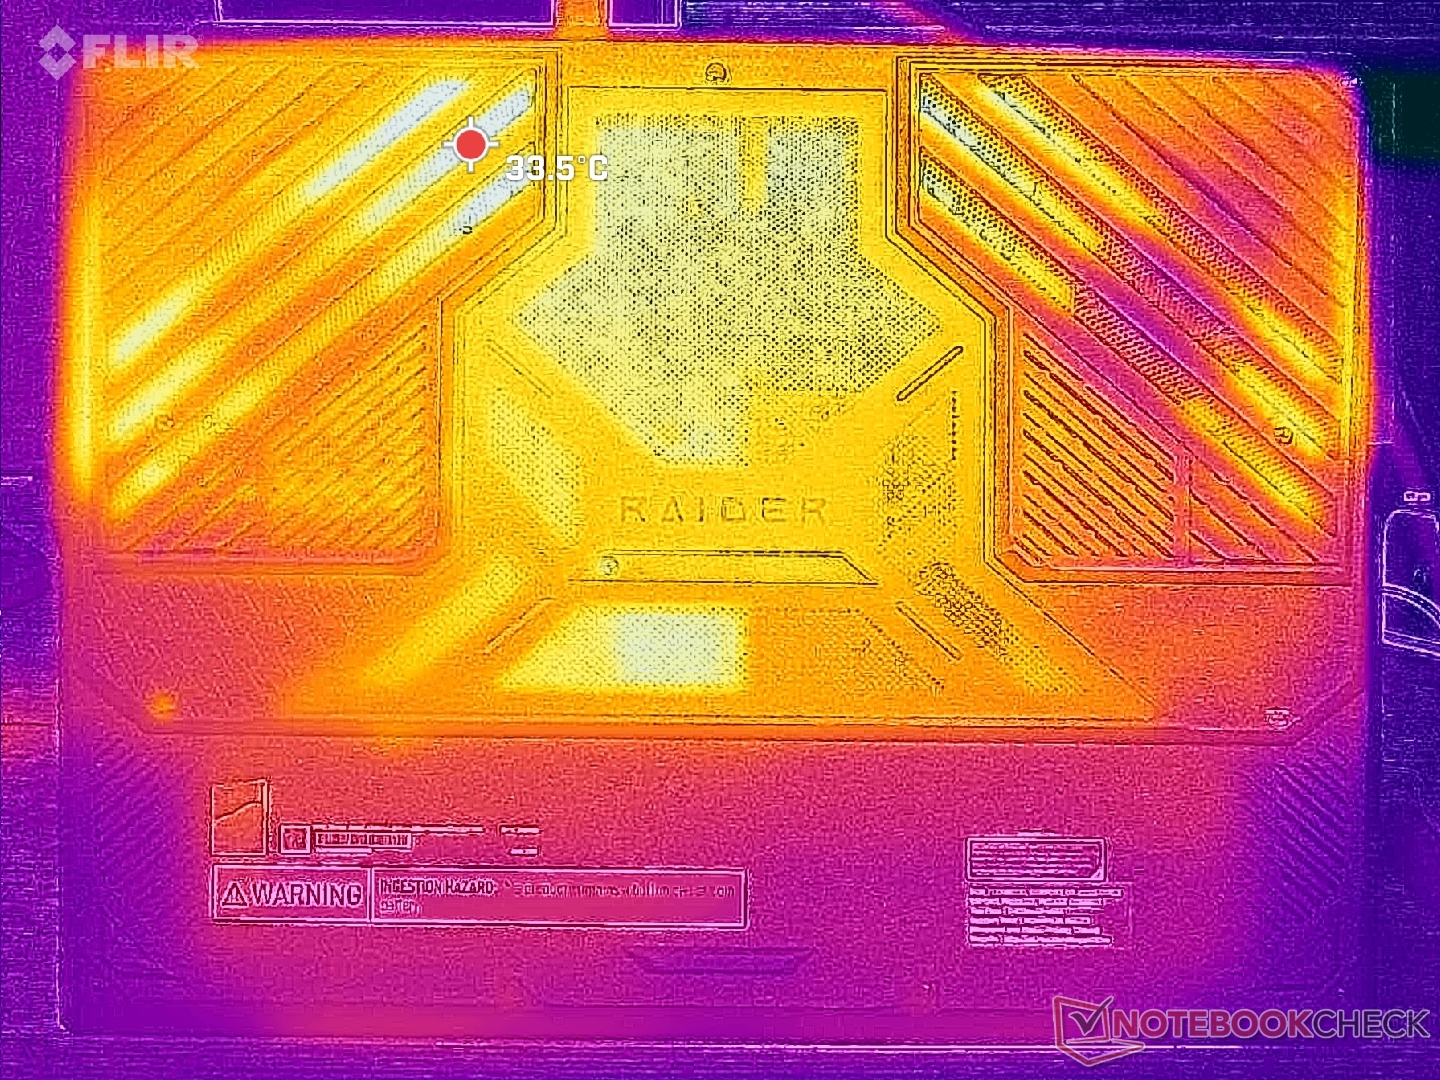
(±) Botten värms upp till maximalt 43.4 °C / 110 F, jämfört med genomsnittet av 43.2 °C / 110 F
(±) Vid tomgångsbruk är medeltemperaturen för ovansidan 33.7 °C / 93 F, jämfört med enhetsgenomsnittet på 33.9 °C / ### class_avg_f### F.
(±) 3: The average temperature for the upper side is 34.4 °C / 94 F, compared to the average of 33.9 °C / 93 F for the class Gaming.
(+) Handledsstöden och pekplattan når maximal hudtemperatur (32.6 °C / 90.7 F) och är därför inte varma.
(-) Medeltemperaturen för handledsstödsområdet på liknande enheter var 28.9 °C / 84 F (-3.7 °C / -6.7 F).
| MSI Raider 18 HX A14V Intel Core i9-14900HX, NVIDIA GeForce RTX 4080 Laptop GPU | Razer Blade 18 2024 RZ09-0509 Intel Core i9-14900HX, NVIDIA GeForce RTX 4090 Laptop GPU | Alienware m18 R2 Intel Core i9-14900HX, NVIDIA GeForce RTX 4090 Laptop GPU | MSI Titan 18 HX A14VIG Intel Core i9-14900HX, NVIDIA GeForce RTX 4090 Laptop GPU | Asus ROG Strix G18 G814JI Intel Core i7-13650HX, NVIDIA GeForce RTX 4070 Laptop GPU | Acer Predator Helios 18 PH18-72-98MW Intel Core i9-14900HX, NVIDIA GeForce RTX 4090 Laptop GPU | |
|---|---|---|---|---|---|---|
| Heat | -1% | -5% | 6% | 5% | -6% | |
| Maximum Upper Side * | 40.8 | 43.2 -6% | 41.2 -1% | 37.8 7% | 45 -10% | 43 -5% |
| Maximum Bottom * | 43.4 | 42.6 2% | 34.6 20% | 37.6 13% | 47 -8% | 59 -36% |
| Idle Upper Side * | 36.4 | 36 1% | 42.8 -18% | 34.8 4% | 28 23% | 32 12% |
| Idle Bottom * | 36.4 | 36.4 -0% | 43.6 -20% | 36 1% | 31 15% | 34 7% |
* ... mindre är bättre
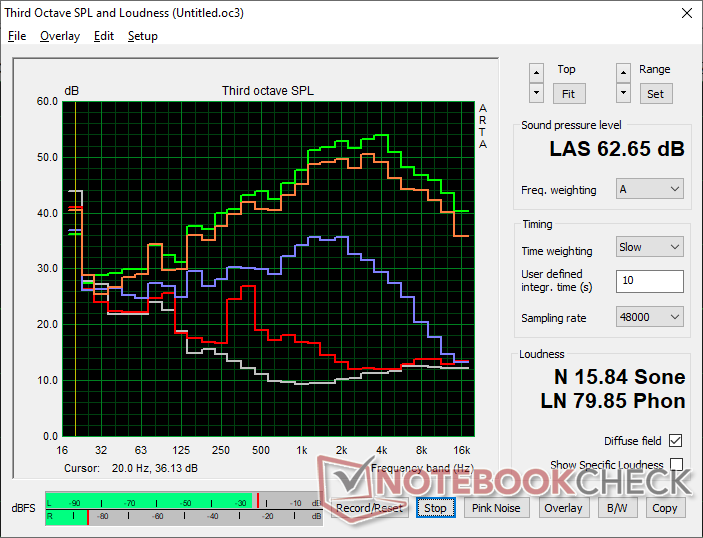
Högtalare
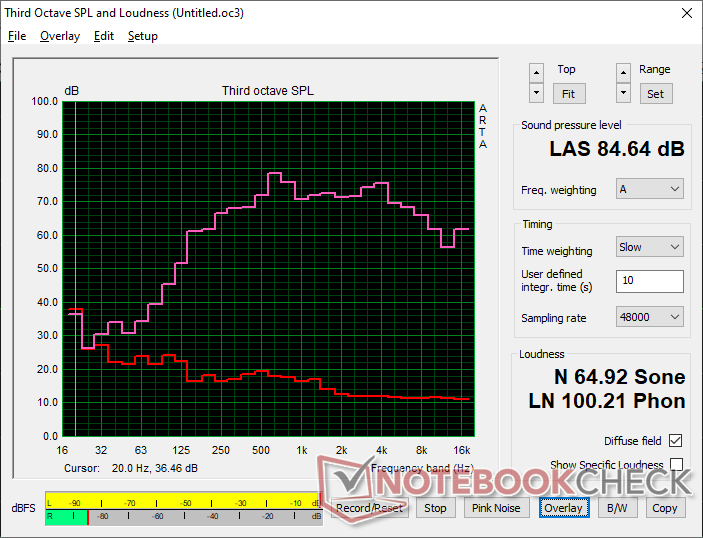
MSI Raider 18 HX A14V ljudanalys
(+) | högtalare kan spela relativt högt (84.6 dB)
Bas 100 - 315 Hz
(±) | reducerad bas - i genomsnitt 9.2% lägre än medianen
(±) | linjäriteten för basen är genomsnittlig (9.2% delta till föregående frekvens)
Mellan 400 - 2000 Hz
(+) | balanserad mellan - endast 4.3% från medianen
(+) | mids är linjära (5.1% delta till föregående frekvens)
Högsta 2 - 16 kHz
(+) | balanserade toppar - endast 3.8% från medianen
(+) | toppar är linjära (4.9% delta till föregående frekvens)
Totalt 100 - 16 000 Hz
(+) | det totala ljudet är linjärt (11.9% skillnad mot median)
Jämfört med samma klass
» 11% av alla testade enheter i den här klassen var bättre, 4% liknande, 85% sämre
» Den bästa hade ett delta på 6%, genomsnittet var 18%, sämst var 132%
Jämfört med alla testade enheter
» 8% av alla testade enheter var bättre, 2% liknande, 90% sämre
» Den bästa hade ett delta på 4%, genomsnittet var 24%, sämst var 134%
Apple MacBook Pro 16 2021 M1 Pro ljudanalys
(+) | högtalare kan spela relativt högt (84.7 dB)
Bas 100 - 315 Hz
(+) | bra bas - bara 3.8% från medianen
(+) | basen är linjär (5.2% delta till föregående frekvens)
Mellan 400 - 2000 Hz
(+) | balanserad mellan - endast 1.3% från medianen
(+) | mids är linjära (2.1% delta till föregående frekvens)
Högsta 2 - 16 kHz
(+) | balanserade toppar - endast 1.9% från medianen
(+) | toppar är linjära (2.7% delta till föregående frekvens)
Totalt 100 - 16 000 Hz
(+) | det totala ljudet är linjärt (4.6% skillnad mot median)
Jämfört med samma klass
» 0% av alla testade enheter i den här klassen var bättre, 0% liknande, 100% sämre
» Den bästa hade ett delta på 5%, genomsnittet var 18%, sämst var 45%
Jämfört med alla testade enheter
» 0% av alla testade enheter var bättre, 0% liknande, 100% sämre
» Den bästa hade ett delta på 4%, genomsnittet var 24%, sämst var 134%
Energiförvaltning
Strömförbrukning
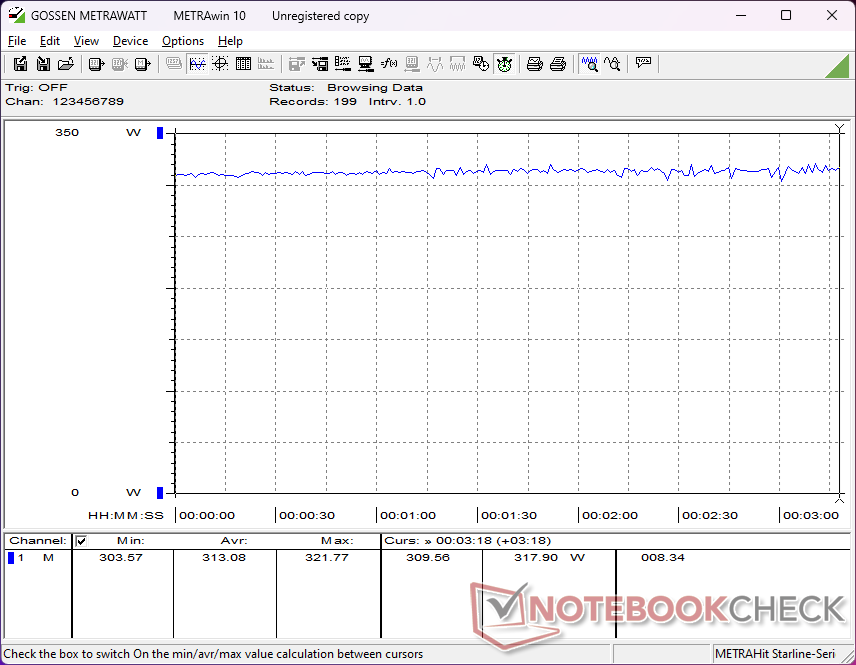
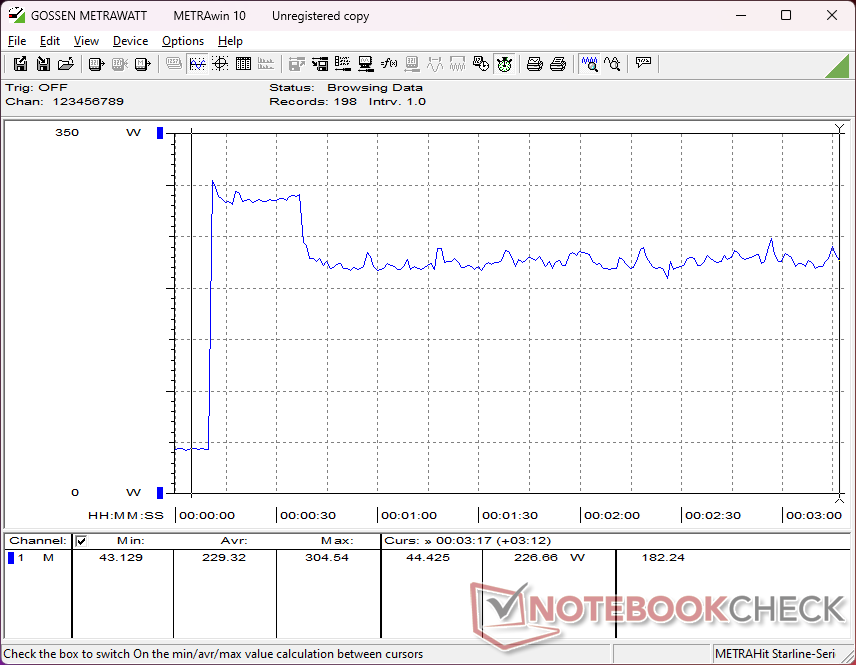
Den totala förbrukningen är mycket hög, vilket kan förväntas av en 18-tums DTR som är utrustad med en krävande 4K mini-LED-panel. Tomgångskörning på skrivbordet förbrukar mellan 27 W och 48 W beroende på ljusstyrkan, GPU-inställningen och inställningen för energiprofilen. Gaming skulle kräva drygt 300 W jämfört med endast 220 W på Acer Predator Helios 18.
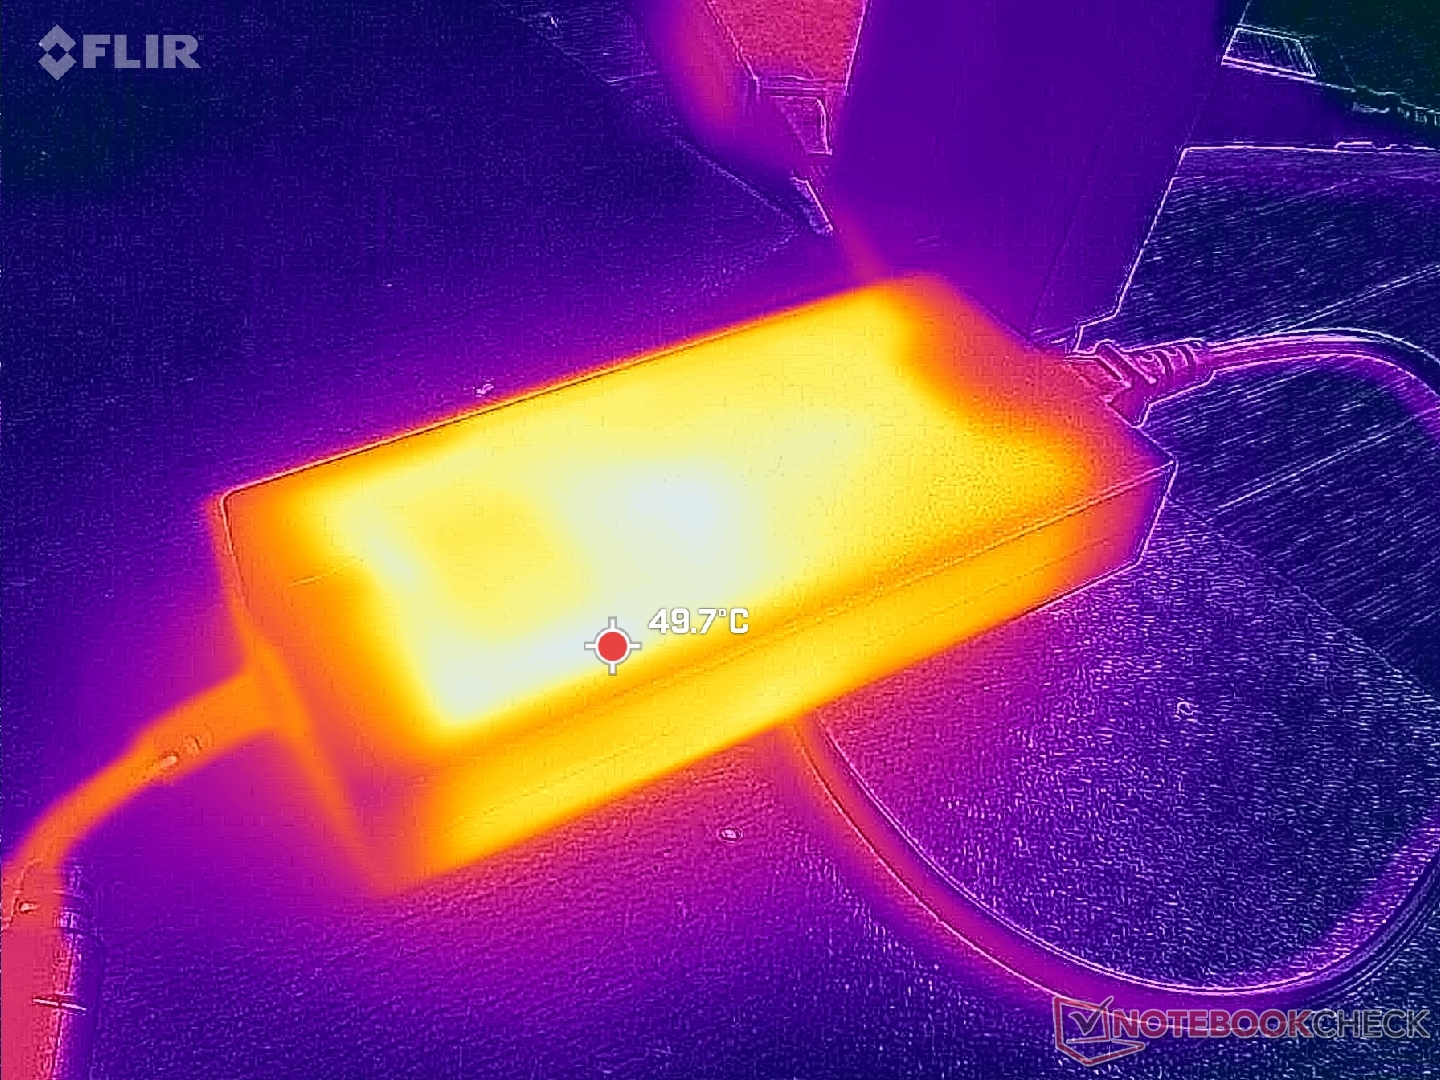
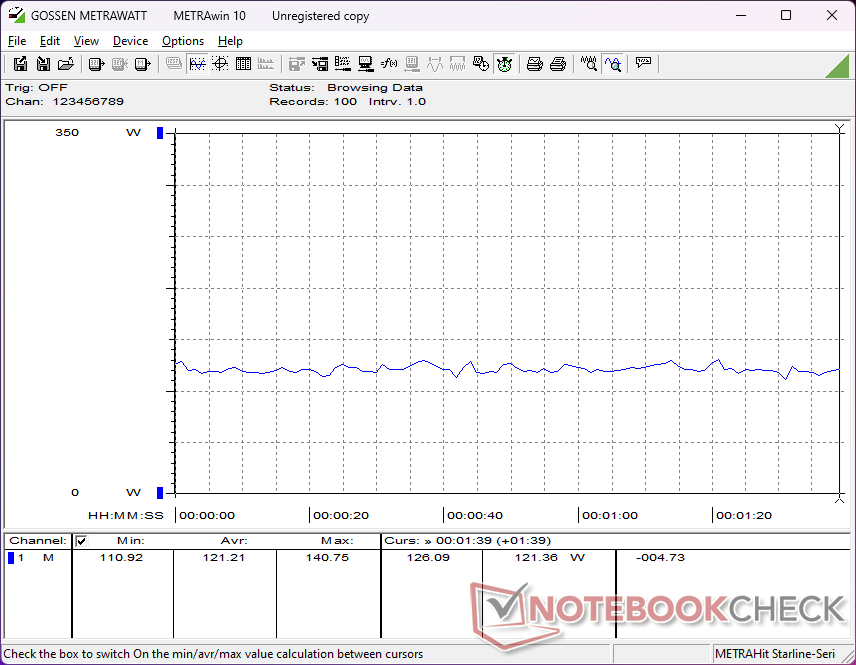
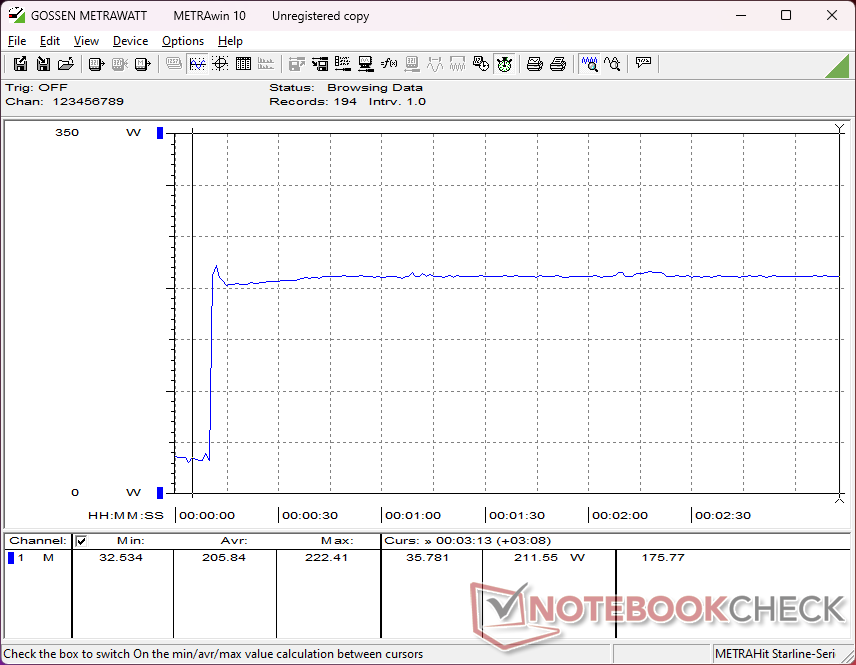
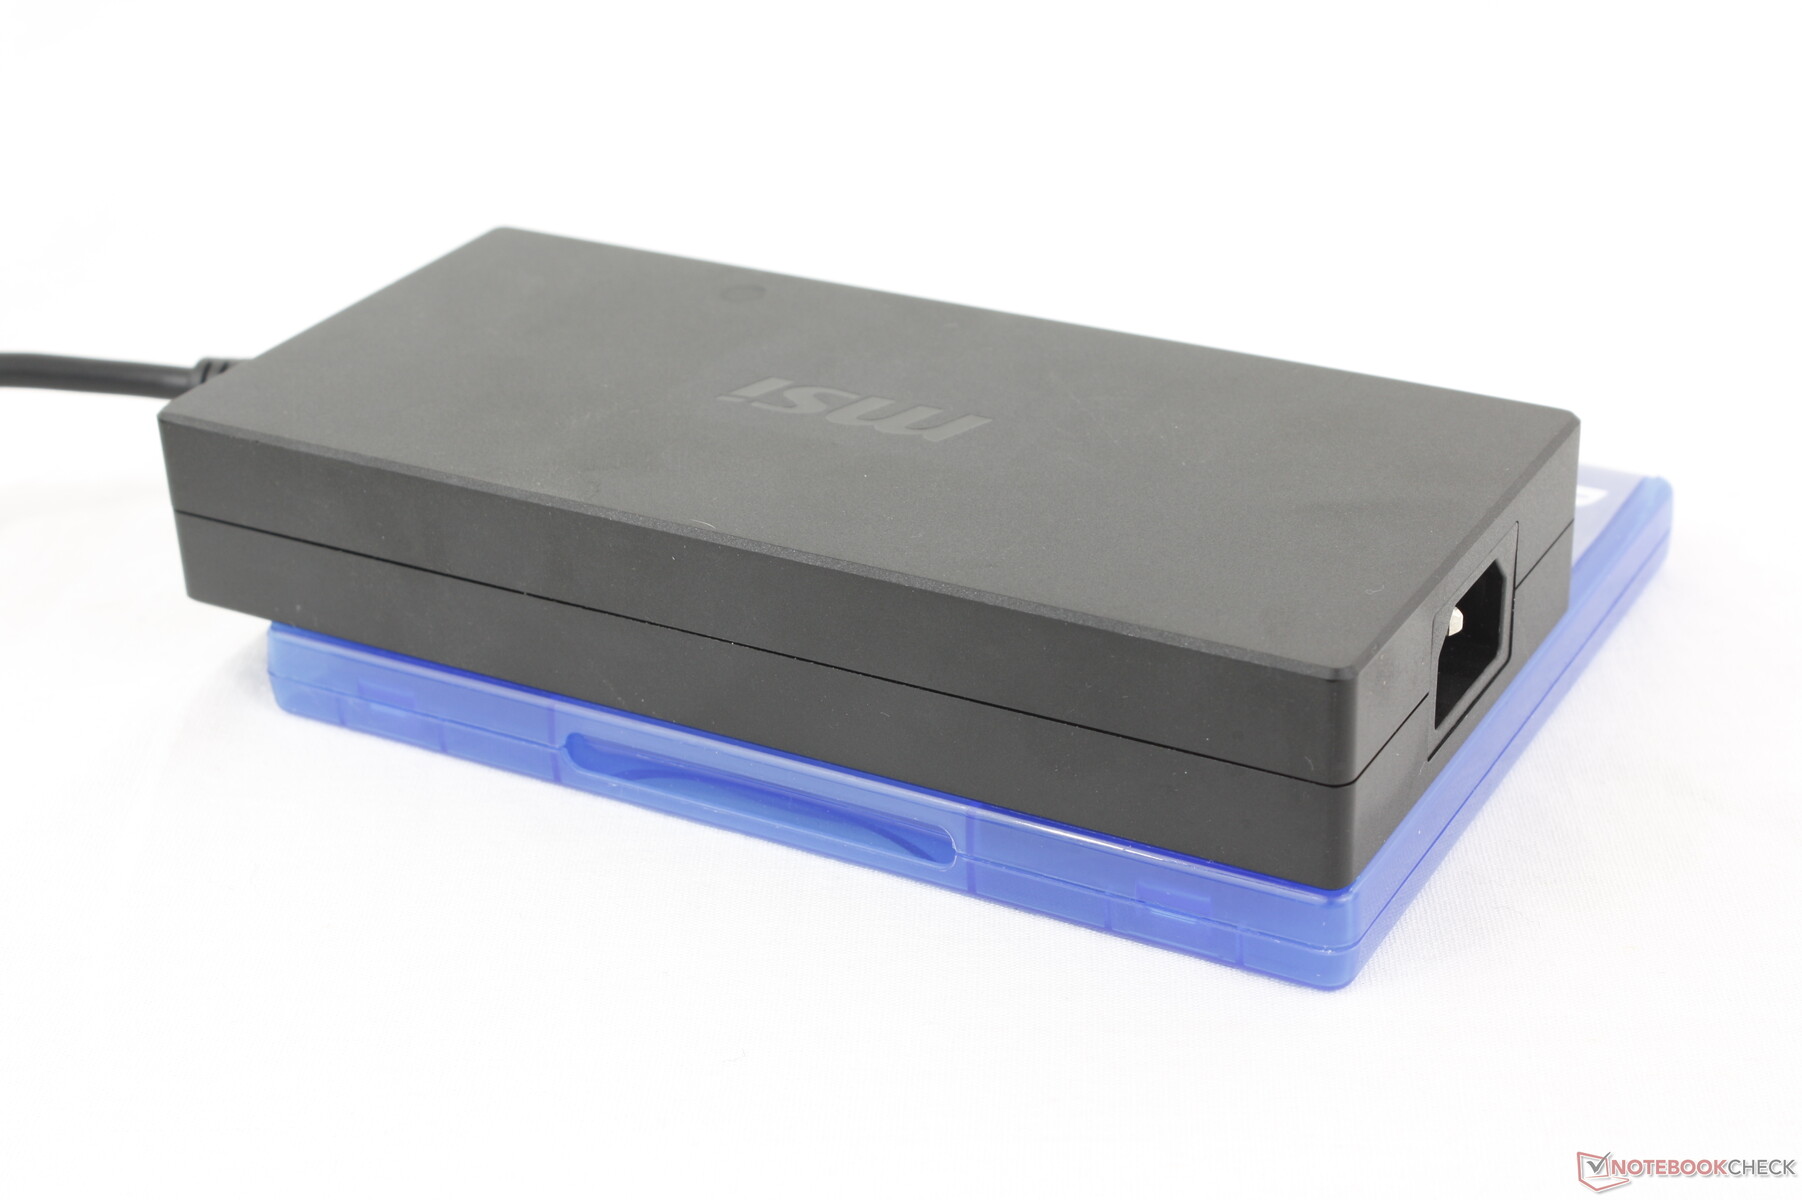
Vi kan registrera en förbrukning på upp till 322 W från den stora 330 W nätadaptern. Jämfört med 400 W-växelströmsadaptern för Titan 18 HX är 330 W-adaptern något mindre (~18,4 x 8,4 x 3,1 cm jämfört med ~18,8 x 8,8 x 3,2 cm). Förbrukningen vid CPU-intensiva uppgifter är generellt lägre på Raider 18 HX trots att den levereras med samma CPU som Titan 18 HX, vilket stämmer överens med den något långsammare CPU-prestanda som registrerades i vårt CineBench-avsnitt ovan.
| Av/Standby | |
| Låg belastning | |
| Hög belastning |
|
Förklaring:
min: | |
| MSI Raider 18 HX A14V i9-14900HX, NVIDIA GeForce RTX 4080 Laptop GPU, Samsung PM9A1 MZVL22T0HBLB, Mini-LED, 3840x2400, 18" | Razer Blade 18 2024 RZ09-0509 i9-14900HX, NVIDIA GeForce RTX 4090 Laptop GPU, , Mini-LED, 2560x1600, 18" | Alienware m18 R2 i9-14900HX, NVIDIA GeForce RTX 4090 Laptop GPU, SK Hynix PC811 HFS002TEM9X152N, IPS, 2560x1600, 18" | MSI Titan 18 HX A14VIG i9-14900HX, NVIDIA GeForce RTX 4090 Laptop GPU, 2x Samsung PM9A1a MZVL22T0HDLB (RAID 0), Mini-LED, 3840x2400, 18" | Asus ROG Strix G18 G814JI i7-13650HX, NVIDIA GeForce RTX 4070 Laptop GPU, Micron 2400 MTFDKBA1T0QFM, IPS, 2560x1600, 18" | Acer Predator Helios 18 PH18-72-98MW i9-14900HX, NVIDIA GeForce RTX 4090 Laptop GPU, 2x SK Hynix HFS001TEJ9X115N (RAID 0), Mini-LED, 2560x1600, 18" | |
|---|---|---|---|---|---|---|
| Power Consumption | -2% | 8% | 5% | 42% | -2% | |
| Idle Minimum * | 27.7 | 25.4 8% | 10.6 62% | 13.2 52% | 8 71% | 31 -12% |
| Idle Average * | 38.3 | 37.7 2% | 20.9 45% | 25.4 34% | 15 61% | 35 9% |
| Idle Maximum * | 47.1 | 57.9 -23% | 40 15% | 53.5 -14% | 26 45% | 43 9% |
| Load Average * | 121.2 | 128.4 -6% | 201.1 -66% | 151.4 -25% | 102 16% | 144 -19% |
| Cyberpunk 2077 ultra * | 313 | |||||
| Cyberpunk 2077 ultra external monitor * | 306 | |||||
| Load Maximum * | 321.8 | 297.9 7% | 378.9 -18% | 395.2 -23% | 267 17% | 318 1% |
| Witcher 3 ultra * | 273.1 | 358 | 336 | 178.6 | 228 |
* ... mindre är bättre
Power Consumption Cyberpunk / Stress Test
Power Consumption external Monitor
Batteritid
Drifttiderna är korta på grund av den krävande hårdvaran. Vi kan spela in drygt 3 timmars verklig WLAN-användning även när vi är inställda på batterisparläge och iGPU-läge, medan ROG Strix G18 kan hålla i mer än dubbelt så länge med sin IPS-skärm. Batterikapaciteten är redan uppe i det lagliga maxvärdet på 99,9 Wh.
Att ladda från tom till full kapacitet tar nästan 2,5 timmar, vilket är lite längre än på de flesta andra bärbara datorer. Laddning med USB-C AC-adaptrar från tredje part kommer att vara ännu långsammare.
| MSI Raider 18 HX A14V i9-14900HX, NVIDIA GeForce RTX 4080 Laptop GPU, 99.9 Wh | Razer Blade 18 2024 RZ09-0509 i9-14900HX, NVIDIA GeForce RTX 4090 Laptop GPU, 91.7 Wh | Alienware m18 R2 i9-14900HX, NVIDIA GeForce RTX 4090 Laptop GPU, 97 Wh | MSI Titan 18 HX A14VIG i9-14900HX, NVIDIA GeForce RTX 4090 Laptop GPU, 99.9 Wh | Asus ROG Strix G18 G814JI i7-13650HX, NVIDIA GeForce RTX 4070 Laptop GPU, 90 Wh | Acer Predator Helios 18 PH18-72-98MW i9-14900HX, NVIDIA GeForce RTX 4090 Laptop GPU, 90 Wh | |
|---|---|---|---|---|---|---|
| Batteridrifttid | 20% | 46% | 19% | 101% | -10% | |
| Reader / Idle | 264 | 395 50% | 353 34% | 702 166% | ||
| WiFi v1.3 | 198 | 263 33% | 290 46% | 252 27% | 484 144% | 192 -3% |
| Load | 76 | 58 -24% | 72 -5% | 71 -7% | 64 -16% |
För
Emot
Utlåtande - En Titan i hjärtat
När vi granskade Titan 18 HX tidigare i år lovordade vi dess prestanda, men blev chockade när vi fick reda på dess begärda pris på >5000 USD. Det faktum att CPU och GPU i praktiken inte var något nytt gjorde bara modellen så mycket mindre tilltalande. Raider 18 HX tar itu med det orimligt höga priset på Titan 18 HX genom att trimma fettet och samtidigt behålla samma CPU, GPU och bildskärmsalternativ. Raider-ägare går miste om den bakgrundsbelysta klickplattan, ångkammarkylning, mekaniska tangenter och tertiärt M.2 SSD-stöd, men sådana lyxfunktioner är lätta att avstå från när spelupplevelsen mellan Raider och Titan annars är exakt densamma. Faktum är att man kan hävda att Raider är bekvämare att använda eftersom dess traditionella klickplatta och membranbaserade tangentbord känns mer bekant än det atypiska tillvägagångssättet på Titan.
Raider 18 HX pressar ut varje uns av prestanda ur Core i9-processorn och 175 W GPU:n även om den måste vara större, tyngre och ofta mer högljudd än många av sina konkurrenter.
Jämfört med andra 18-tums bärbara speldatorer erbjuder Raider 18 HX en rymligare skrivupplevelse och fyra SODIMM-kortplatser medan alternativ som Blade 18 eller ROG Strix G18 inte har någon numpad alls eller bara kan stödja två SODIMM-moduler. MSI-systemet är dock fortfarande märkbart större och tyngre än de flesta konkurrenterna och det går inte nödvändigtvis tystare för att kompensera för det. CPU- och GPU-prestanda kan vara något snabbare, men många användare kanske inte märker det i praktiken. I det här fallet måste du värdesätta den enklare servicen och 4K mini-LED-alternativen i Raider för att motivera dess vikt.
Pris och tillgänglighet
MSI Raider 18 HX som konfigurerad i vår recension är nu tillgänglig på Amazon för $ 3190. Alternativt är IPS-versionen också tillgänglig för $ 3290.
Obs: Vi har nyligen uppdaterat vårt betygssystem och resultaten från version 8 är inte jämförbara med resultaten från version 7. Mer information finns tillgänglig här .
MSI Raider 18 HX A14V
- 09/03/2024 v8
Allen Ngo
 Total Sustainability Score:
 Genomskinlighet
Valet av enheter som ska granskas görs av vår redaktion. Testprovet gavs till författaren som ett lån av tillverkaren eller återförsäljaren för denna recension. Långivaren hade inget inflytande på denna recension och inte heller fick tillverkaren en kopia av denna recension innan publiceringen. Det fanns ingen skyldighet att publicera denna recension. Vi accepterar aldrig ersättning eller betalning i utbyte mot våra recensioner. Som ett oberoende medieföretag är Notebookcheck inte föremål för auktoritet från tillverkare, återförsäljare eller förlag.
This is how Notebookcheck is testingEvery year, Notebookcheck independently reviews hundreds of laptops and smartphones using standardized procedures to ensure that all results are comparable. We have continuously developed our test methods for around 20 years and set industry standards in the process. In our test labs, high-quality measuring equipment is utilized by experienced technicians and editors. These tests involve a multi-stage validation process. Our complex rating system is based on hundreds of well-founded measurements and benchmarks, which maintains objectivity.
Price comparison
MSI Raider 18 HX A14V
Screen: '' | | OS: Unfortunately there are no offers for reviewed device, but ...
Alternative specs